Article

Study on China’s Renewable Energy Policy Reform and Improved Design of Renewable Portfolio Standard

School of Economics and Management, North China Electric Power University, Beijing 102206, China
*
Author to whom correspondence should be addressed.
Energies 2019, 12(11), 2147; https://doi.org/10.3390/en12112147
Submission received: 22 April 2019 / Revised: 10 May 2019 / Accepted: 30 May 2019 / Published: 4 June 2019

Abstract

:
China officially implemented the renewable portfolio standard (RPS) on 1 January 2019, and it remains uncertain as to whether this can effectively solve the problem of renewable energy consumption in China and ease the pressure of government subsidies. In order to study the impact of this policy on China’s renewable energy power generation and explore RPS policy that is more suitable for the characteristics of China’s renewable energy, we first develop a revenue function model based on the just released RPS policy to explore the effectiveness of the policy, the feasibility conditions for successful implementation, and the problems that may be encountered during the implementation process. Then, we propose policy recommendations based on the possible problems of the current policy and design an “incremental electricity price” supplementary policy to improve the possibility of successful implementation of the RPS policy. Finally, an evolutionary game model is established to simulate and verify the possibility of successful implementation of the supplementary policy. The main research results are: (1) the essence of the current RPS policy is the comprehensive implementation policy of the RPS and feed-in-tariff (FiT); (2) because of the characteristics of China’s energy structure, the implementation of this policy reform is more resistant; (3) the quantitative research on the revenue function model shows that the current transaction price of the green certificate market is very low, which is not conducive to alleviating the state’s subsidy pressure on renewable energy power generation; and (4) analysis of empirical data shows that the successful implementation of the “incremental electricity price” policy relies on the initial strategies of grid companies and users.

Graphical Abstract

1. Introduction

1.1. Research Background

Renewable energy utilization is closely related to energy security and climate change issues, thus affecting human society [1]. The promotion of renewable energy power generation is conducive to emission reduction and environmental protection, and is an important way to achieve low-carbon energy transformation [2]. Many countries have already developed plans to use renewable energy to generate electricity for the large-scale utilization of renewable resources in the next few years [3]. However, due to the high cost and instability of renewable energy power generation, it is less competitive than traditional fossil energy power generation [4,5]. For this reason, countries around the world have implemented different renewable energy power generation support policies to solve the problem. Feed-in-tariff (FiT) and renewable portfolio standard (RPS) are the two most important renewable energy development support policies implemented in countries around the world at present [6,7,8]. However, from the current problems encountered in China’s renewable energy power generation, the FiT policy is no longer applicable to China [9,10]. As of the end of November 2018, according to the “Notice on Implementation of the Renewable Portfolio Standard” issued by the National Energy Administration, China will officially implement the RPS on 1 January 2019. Since the RPS policy has just been implemented in China, it is impossible to determine whether it can solve the problems encountered in the development of renewable energy power generation in China.
The purpose of this paper is to study the effectiveness of the policy, the feasibility of successful implementation, and the problems that may be encountered during implementation. Then, based on the above analysis, a policy more suitable for the development of China’s renewable energy power generation is designed to improve the possibility of successful implementation of the RPS mechanism in China.

1.2. Review of the Literatures

1.2.1. Research on Renewable Portfolio Standard Policy Application

The number of FiT adopters increased from 2 in 1990 to approximately 70 in 2018, while RPS adopters increased from 1 in 1999 to approximately 15 in 2018. Countries from every geographic region and income level have adopted these policies. Contrary to what rational self-interested actors would do based on costs, benefits, and utility maximization, some of the top oil exporters in the world have adopted RPS or FiT. These countries include Iran and the United Arab Emirates in the Middle East, Kazakhstan in Asia, Nigeria and Algeria in Africa, Norway and the United Kingdom in Europe, and Brazil in the Americas and so on [11,12,13].
The analysis of an effective support policy is the basis for promoting the development of renewable energy. Like China, several other countries have also experienced policy reforms from RPS to FiT or from FiT to RPS. According to the experience of Korea’s transition from the implementation of FiT to RPS in 2012, in addition to the temporary decline of the input-output efficiency of renewable energy development in 2012, its efficiency has consistently risen, and with the policy reform, various renewable energy utilization technologies have been improved to some extent [14,15]. In contrast, due to the difficulty in achieving the renewable energy quota target, Japan changed from implementing RPS to implementing FiT in 2009 [16]. RPS and FiT are the two most widely used renewable energy power generation support policies. Their role and influence in the development of renewable energy has always been the research focus of domestic and foreign experts, especially comparative analysis of the two policies. Yin and Powers [17] proposed a new way to measure the effectiveness of the RPS mechanism, and found that the implementation of the RPS mechanism can not only promote the development of renewable energy, but also affect the electricity market and even the entire economic market to a certain extent. Erdong and Liu [18] and Wang et al. [19], respectively, concluded that the use of both RPS and FiT policy increases the proportion of renewable energy power generation within the total energy consumption. However, Wang [18] believed that the RPS mechanism can bring more social benefits than the FiT mechanism. Qian [20] concluded that the RPS system is superior to the FiT system in the reduction of traditional energy power generation and carbon dioxide emissions, while the FiT system can promote the development of renewable energy power generation and increase the enthusiasm of power producers more than the RPS system. According to Choi et al. [21], from the perspective of government departments, RPS is more efficient in promoting the development of photovoltaic energy, while FiT was more effective in the development of non-photovoltaic renewable energy, and this conclusion was the opposite of that given from the perspective of energy producers. Sun and Nie [22] concluded that FiT is more effective than the RPS in increasing the installed capacity of renewable energy, promoting investment of research and development to reduce costs, while RPS policy reduces carbon emissions more effectively. From this we can infer that there is no perfect relationship between FiT and RPS mechanisms. The RPS mechanism should be based on the problems and characteristics of China’s renewable energy development [23].
In summary, the current application research on RPS and FiT in different countries has been relatively mature, but the application effects of the two policies in different countries are different. Therefore, based on the knowledge of RPS and the special needs of China’s renewable energy development, it is of great significance to explore the application effect and possible problems of RPS policy in China.

1.2.2. Research on China’s Renewable Portfolio Standard Policy Design

According to the international implementation experiences of FiT and RPS, relevant scholars have designed and made recommendations on the RPS policy suitable for China’s renewable energy development. Zhao et al. [24] combined with the specific national conditions from the system design, departmental coordination, quota target setting, and implementation plan, proposed countermeasures and suggestions for the implementation of RPS policy. Feng et al. [25] and Zhao et al. [26] respectively specifically proposed an RPS mechanism, quota indicators, green certificates, trading mechanisms, and fines on the electricity sales side (the quota obligation bearers are the power grid companies), and gave a theoretical basis. Related scholars have also designed the RPS mechanism from the power generation side (the quota obligation bearers are fossil energy power producers) [27,28,29]. Among them, Zhao et al. [28] and Zuo et al. [29] set green certificate trading parties as renewable energy producers and fossil energy power producers. Based on this, an evolutionary game model was established to analyze their strategic behaviors. Although it has a strong theoretical significance, this RPS policy will not be implemented in China. Since FiT can promote renewable energy investment in the primary stage of the renewable energy power generation industry, and RPS can effectively reduce the pressure of the national renewable energy fund subsidy, some scholars believe that in the current stage, China should implement FiT and RPS comprehensively, and gradually shift from the complete FiT scheme to the RPS [20,24,30]. Wang et al. [31] designed an RPS implementation mechanism in line with China’s renewable energy development. It mainly investigated how renewable energy quotas are distributed in different provinces, and provided very important recommendations for the implementation of China’s RPS policy. However, it did not provide a clear explanation for the subject of quota obligation bearers.
Although the above research on the design of RPS policy in China has important practical guiding significance, the various schemes that have been designed are different from the RPS policy implemented in China. In this paper, the design study of this policy is based on the problems that may be encountered in the RPS policy that has just been implemented. The purpose is to improve the possibility of successful implementation of the policy and to better solve the problem of renewable energy development in China.

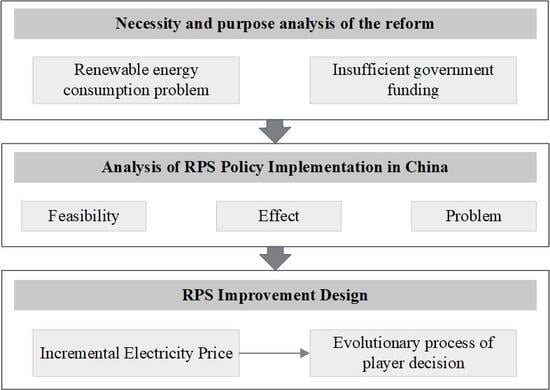
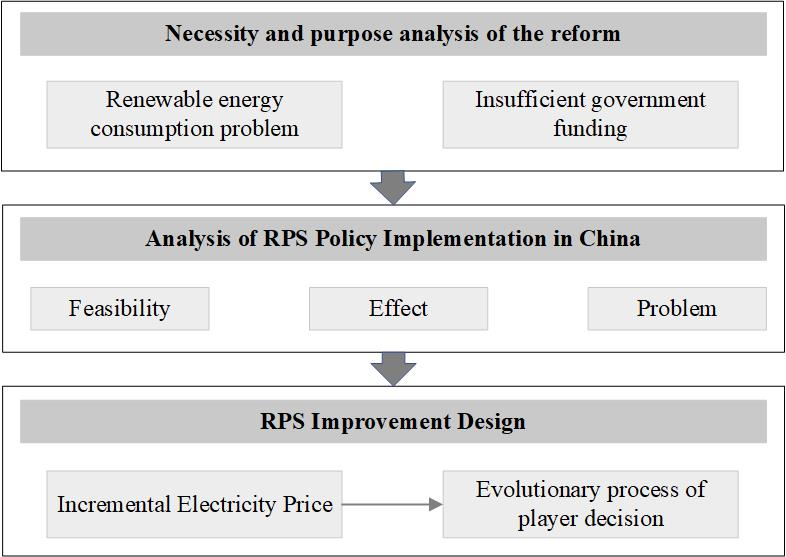
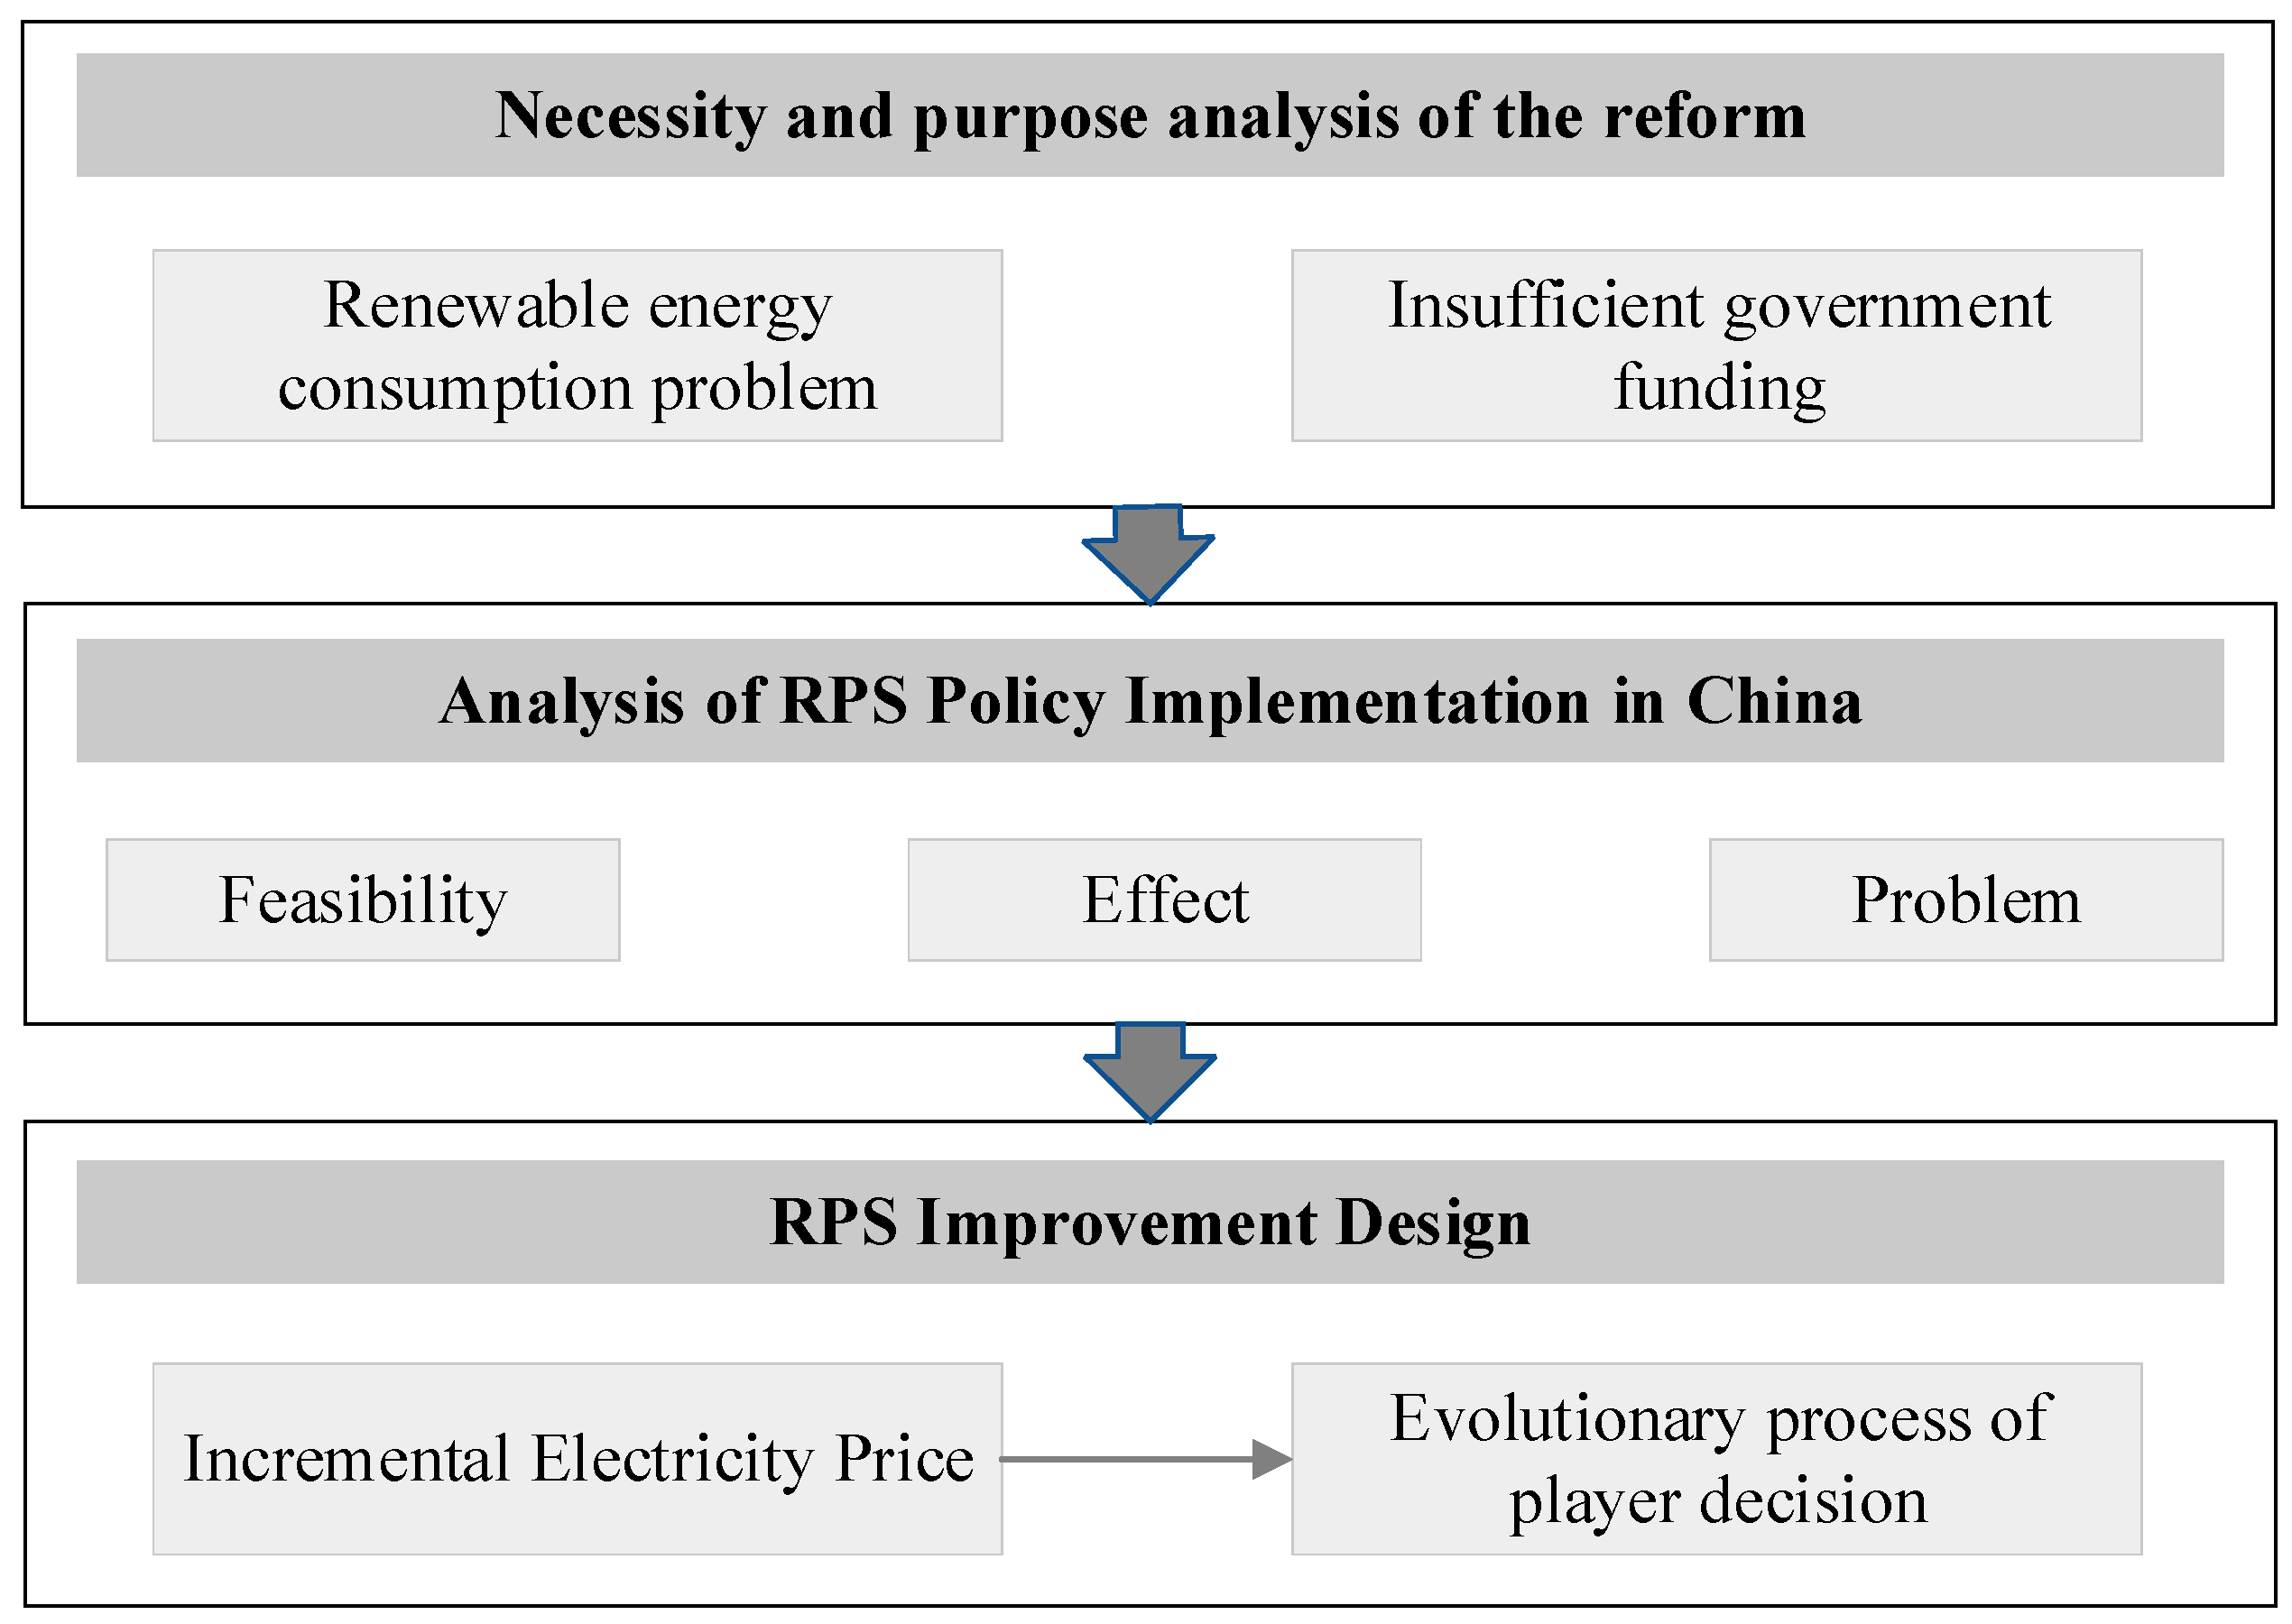
1.3. Structure of This Paper

The rest of the paper is structured as follows. In Section 2, first, we analyze the need for policy reform. Second, the revenue function model and evolutionary game model needed for the research of this paper are developed. In Section 3, we first analyze the validity, feasibility conditions, and possible problems of the RPS policy based on the results of the revenue function model. Then, based on this, the “incremental electricity price” policy is designed to improve the possibility of successful implementation of RPS policy in China. Finally, the evolutionary game model is used to analyze the evolution process of power grid enterprises and users under the auxiliary policy. In Section 4, we summarize the research process and conclusions of the article, and put forward the existing limitations and future research directions.

2. Materials and Methods

The research process of this paper is as follows: Firstly, the reasons and necessity of the implementation of renewable energy policy reform in China are analyzed. Secondly, this paper takes the new RPS policy as a research object, and explores the feasibility conditions of its successful implementation, predicts its effect on renewable energy development, and seeks possible problems in the process of implementation by building a revenue function model. Finally, based on the possible problems in the implementation of the RPS mechanism, this paper proposes a policy improvement plan and establishes an evolutionary game model to simulate the evolution of the decision-making behaviors of various stakeholders in different scenarios, so as to verify the feasibility of the improved RPS policy. A flowchart of the research is shown in Figure 1.

2.1. Necessity and Purpose Analysis of Policy Shift

In China, with the introduction of renewable energy power generation support policies, the installed capacity of renewable energy power generation has increased rapidly, while the ability to consume renewable energy has not met the speed at which renewable energy has developed, resulting in the problem of renewable energy consumption, which has become one of the main reasons for restricting the development of renewable energy in China at this stage. In addition, under the feed-in tariff system implemented in China, it is difficult for the additional tariff levy standard to meet the development speed of renewable energy, leading to a gradual expansion of the subsidy funding gap [32].

2.1.1. Renewable Energy Consumption Problem

One of the special characteristics regarding China’s energy utilization consists in the fact that it frequently uses renewable resources, mainly based on wind, light, and water. Moreover, in recent years, the installed capacity of renewable energy has increased rapidly. As of April 2018, the installed capacity of wind power, which over 6000 kW, reached 164.46 million kW, that is nearly 9.85% of the total energy consumption in the country. However, from January 2017 to April 2018, the monthly average ratio of wind power generation to total power generation was 5.28%, which means that nearly half of the wind power units were not functioning, and this phenomenon was found to be even more serious in some major wind power generation areas [33,34]. Table 1 shows the wind power generation in some provinces.
As can be seen from Table 1, in these provinces, the installed capacity of wind power accounts for about 20% of the total installed capacity, while the wind power generation accounts for only about 10% of the total local power generation. So, it can be concluded that the issue of renewable energy development in China, at this stage, is not an insufficient installed capacity for renewable energy power generation. On the contrary, for China, which has just begun to implement the RPS policy, the installed capacity of renewable energy power generation can basically meet the current quota target. Therefore, how to solve the problem of renewable energy consumption is the key issue to be considered by China in implementing RPS.

2.1.2. Insufficient Subsidies for Renewable Energy Power Generation

According to the renewable energy law, China’s FiT mechanism is composed of the local desulfurization coal-fired unit’s benchmark on-grid price and the subsidized electricity price (see Equation (1) for details). The subsidy fee corresponding to the renewable energy power generation subsidy price is derived from the electricity price additional charge levied by the governments to the power consumers. In order to adapt to the rapid development of renewable energy power generation in China, the additional price levy standard has been raised six times in 2006 from 0.001 RMB/kWh, and finally raised to 0.019 RMB/kWh in 2016. At the same time, in response to the continuous improvement of renewable energy power generation technology, the gradual reduction of power generation costs, and the increasing funding gap for renewable energy power generation subsidies, China has frequently reduced the feed-in tariff of renewable energy power generation, while Table 2 shows the specific feed-in tariff for wind power and photovoltaics in a different category. The upward adjustment of the additional price levy standard and the reduction of the renewable energy benchmark FiT have not slowed down the trend of the gradually increasing subsidy funding gap. By the end of 2017, the subsidy funding gap accumulated more than 110 billion RMB. The ever-expanding subsidy funding gap is the direct cause of implementing renewable energy policy reform.
p r = p b + p s , f
where pr represents the FiT of renewable energy power generation; pb represents the benchmark FiT of local desulfurized coal unit power generation; and ps,f represents the subsidized electricity price for renewable energy power generation under the FiT policy.
On the one hand, the implementation of the RPS policy can directly reduce the government’s subsidy pressure on renewable energy generation, while on the other hand, green certificate transactions based on market functioning can not only promote the development of renewable energy, but also avoid the problem of abandoned wind and light caused by power generation enterprises’ blind development of renewable resources in pursuit of the benefits. The implementation of China’s RPS policy should aim at promoting the consumption of renewable energy and alleviating the pressure on government subsidies.

2.2. Revenue Function Model

In order to study the feasibility conditions of the successful implementation of the RPS policy in China and to explore the problems that may be encountered in the implementation process, this paper proposes a research method based on the benefit function of stakeholders. Since the RPS policy has just been implemented in China, there is currently insufficient empirical data to support the research on the impact of RPS on the development of renewable energy. The revenue function model is proposed to study the interaction relationship between different stakeholders’ revenue functions under the RPS policy from the perspective of a game, and to determine the relationship between variables representing different practical meanings in the revenue function of each stakeholder under the successful implementation of the policy, thereby obtaining the feasibility conditions for the successful implementation of the policy. Then, by analyzing the current status of China’s renewable energy power generation to judge the possibility of the establishment of this condition, we can identify the problems that may be encountered in the implementation of China’s RPS policy. This method ensures that the research results are objective and scientific, and avoids the shortcoming of insufficient theoretical support of subjective research due to a lack of data. The specific research steps are described below.

2.2.1. China’s Renewable Portfolio Standard Policy

According to the “Renewable Energy Power Quota and Assessment Method” promulgated by the National Development and Reform Commission on 13 September 2018 and the “Notice on Implementing the Renewable Portfolio Standard System” issued on 15 November 2018, China’s RPS mechanism’s quota bearers are mainly power grid enterprises, whose annual quota should be the product of their electricity sales and quota proportion. The price of green certificates is determined by the green certificates market, but it shall not be higher than the original subsidy price of renewable energy power generation, pg < ps,f. Different from the RPS policy implemented in other countries, on the one hand, China’s power generation companies can compensate for the high cost of renewable energy power generation by selling green certificates. On the other hand, as shown in Equation (3), the loss due to the price of green certificates that are lower than the subsidized electricity price can still be compensated for by the national renewable energy development fund. The new renewable energy power generation price consists of three parts:
p r = p b + p s , r + p g
p s , r + p g = p s , f
where pg represents the average price of green certificates transactions; and ps,r is the average subsidized electricity price for renewable energy power generation under the RPS policy.
From this, it can be concluded that the essence of the RPS to be implemented in China is actually a comprehensive implementation plan of RPS and FiT, and the ratio of the support effect of RPS and FiT on renewable energy power generation is pg:ps,r. This policy reform is moderate, and we believe that it is caused by the following reasons:
(1) Under the FiT policy, China’s renewable energy installed capacity and generation capacity have increased rapidly in recent years. The FiT still has a significant effect on improving renewable energy power generation investment.
(2) At present, the cost of renewable energy power generation in China is still much higher than that of fossil energy power generation. If the high cost of renewable energy power generation can only be compensated for by selling green certificates, the profit of renewable energy power generation will inevitably be affected, thus restricting the development of renewable energy in China to a certain extent.
(3) Although the RPS policy has been successfully applied to many countries in the world, China’s renewable energy development has certain special characteristics, like renewable energy consumption problems, government funding subsidy pressure, and an energy structure with a very high proportion of fossil energy power generation. Whether the RPS policy can fully adapt to the characteristics of China’s renewable energy development remains uncertain.

2.2.2. Determination of Stakeholders and Revenue Functions

This paper divides stakeholders into power generation companies, power grid companies, and government departments. From the perspective of interests, it explores the role of the RPS policy in promoting the consumption of renewable energy and alleviating the government’s subsidy pressure on renewable energy power generation.
(1) In order to make the revenue function of power generation companies applicable to various power generation companies, this was set as follows:
π p = Q f p f + Q r p r Q f ( C f , g + C f , m ) Q r ( C r , g + C r , m )
where πp represents the total revenue of power generation companies; Qf represents the fossil energy power output, and for a pure renewable energy power generation company, its fossil energy power output is 0; pf represents the average feed-in tariff of fossil energy power; Qr represents the renewable energy power output, and for a pure fossil energy power generation company, its renewable energy power output is 0; pr is the average feed-in tariff of renewable energy power and p r = p b + p s , r + p g ; Cf,g and Cf,m represent the average unit power generation cost and average unit management cost of fossil energy; and Cr,g and Cr,m represent the average unit power generation cost and average unit management cost of renewable energy.
(2) Since this article explores the interest relationship between power generation companies, power grid companies, and government departments from a macro perspective, green certificate transactions between different grid companies are no longer considered. The power grid enterprises’ revenue function is:
π n = ( p s p b ) Q r + ( p s p f ) Q f C n , m , r Q r C n , m , f Q f Q r p g [ ( Q f + Q r ) A Q r ] p p
where π n represents the total revenue of the power grid enterprises; p s is the average selling price of the power grid enterprises to the consumers; C n , m , r and C n , m , f represent the average operation and maintenance cost of a unit of renewable energy power transmission and fossil energy power transmission; A is the renewable energy power generation quota target undertaken by the power grid enterprises ( 0 A 1 ); p p is the average unit penalty price, and the penalty expense is [ ( Q f + Q r ) A Q r ] p p ; and the expense of purchasing green certificates is Q r p g .
(3) The revenue function of government departments is:
π g = Q r p e + [ ( Q f + Q r ) A Q r ] p p Q r p s , r
where p e is the average environmental income obtained by the government for a unit of renewable energy power generation, and the environmental benefit is Q r p e ; the penalty income is [ ( Q f + Q r ) A Q r ] p p ; and the subsidy expenditure is Q r p s , r .

2.2.3. Determination of the Conditions for Successful Implementation of Renewable Portfolio Standard

Policy effectiveness means that under this policy, power generation companies, power grid enterprises, and government departments will jointly solve the problem of renewable energy consumption and insufficient government subsidy funds through mutual cooperation in the perspective of economic interests.
π p / Q r 0 , π n / Q r 0 , and π g / Q r 0 are the necessary conditions for promoting the consumption of renewable energy by power generation companies, power grid companies, and government departments, respectively, that is, the following conditions are established:
p b + p s , r + p g C r , g C r , m = p b + p s , f C r , g C r , m 0
p s p b C n , m , r p g p p ( A 1 ) 0
p e + p p ( A 1 ) p s , r 0
The role of promoting renewable energy is manifested in the simultaneous formulation of Equations (7)–(9), and the role of the RPS mechanism in mitigating the pressure on financial subsidies can be measured by the income generated by power generation companies selling green certificates (Qrpg). On the basis that Equations (7)–(9) are simultaneously established, the green certificate transaction price greater than 0, p g > 0 , can be used as a criterion for judging whether the mechanism can alleviate the pressure of government subsidies.

2.3. Policy Improvement Design

Through the discussion and analysis of the revenue function model results, the feasibility conditions for the successful implementation of the RPS policy and the problems that the policy may encounter in China can be identified. Next, we propose policy recommendations for these issues, and based on this policy, theoretically design an improved RPS policy that is more suitable for the development of renewable energy power generation in China.

2.4. Evolutionary Game Model

In order to explore the feasibility of the improved RPS policy proposed in this paper, an evolutionary game model is established to simulate and analyze the evolutionary process of trading behaviors between grid enterprises and users.
Evolutionary game theory is a research method that is very suitable for simulating the evolution process of players, which is based on the viewpoint of biological evolution theory. It is considered that the players are bounded and rational, and the decision-making behaviors of individuals are realized through dynamic processes, such as imitation, learning, and mutation. According to the idea of biological evolution, when the fitness of a certain strategy is better than the average fitness of the ethnic groups, the strategy is gradually adopted by more individuals, and eventually developed, or it will gradually decay. Finally, the system reaches an evolutionary stable state [37,38,39].

3. Research Process and Discussion

3.1. Discussion on Results Based on Revenue Function Model

3.1.1. Policy Feasibility and Effectiveness Analysis

In Equation (7), p b + p s , r + p g C r , g C r , m 0 is the necessary condition for power generation enterprises to promote renewable energy consumption under the RPS mechanism, while p b + p s , f C r , g C r , m 0 is the necessary condition for power generation enterprises to promote renewable energy consumption under the FiT mechanism. It can be concluded that a policy shift will not change the enthusiasm of power generation companies to promote renewable energy consumption. According to the implementation of FiT in China, although the problem of renewable energy consumption has become more and more serious in recent years, the amount of renewable energy power on-grid is also increasing rapidly, thus the condition, p b + p s , r + p g C r , g C r , m 0 , is constant under the RPS mechanism.
Through the further processing of Equations (8) and (9), the necessary conditions for the green certificate price, penalty price, and quota target to be feasible on the basis of the effectiveness of the mechanism are obtained as follows:
p p ( 1 A ) + p s , f p e p g p s p b C n , m , r + p p ( 1 A )
p g + C n , m , r ( p s p b ) 1 A p p p e p s , f + p g 1 A
1 p e p s , f + p g p p A 1 p g + C n , m , r ( p s p b ) p p
(1) In order to make the green certificate price, penalty price, and quota target exist, the value at the right end of the inequality must be greater than the value at the left end, which results in:
p s p b C n , m , r + p e p s , f 0
where p s p b C n , m , r represents the income of the power grid companies consuming a unit of renewable energy power, and p e p s , f is the government departments’ revenue from the consumption of per unit of renewable energy power. This formula represents the internal principle that government departments hope to promote power grid enterprises to actively absorb renewable energy through renewable energy support policies due to their environmental protection obligations. It is a necessary condition for the FiT policy to effectively promote the consumption of renewable energy, so the effectiveness of the RPS mechanism is based on the effectiveness of the FiT policy.
(2) If the RPS mechanism can alleviate the subsidy pressure of renewable energy power generation, there would be p g > 0 , and Equation (10) must have the right end value greater than or equal to 0.
p s p b C n , m , r + p p ( 1 A ) 0
where p s p b C n , m , r 0 is the necessary condition for a grid company to actively promote renewable energy consumption without renewable energy support policies. However, at the current level of China’s renewable energy power generation technology, compared to fossil energy generation, the instability of renewable energy generation will bring more safety risks to the power grid, resulting in high costs of operation and maintenance of the power transmission process. In addition, the average on-grid price of renewable energy is too high at present, and the consumption of renewable energy by the power grid is almost entirely dependent on the relevant renewable energy support policies, which makes this condition difficult to achieve. Therefore, in order to make Equation (14) exist, the penalty price and quota targets should be set according to the renewable energy resource endowment, the technical level of power generation, and the benchmark FiT of a local desulfurized coal unit of power generation in the region where power grid enterprises are located. For power grid companies with high operating and maintenance costs of renewable energy power transmission and high benchmark FiT values of a local desulfurized coal unit of power generation, they should appropriately use higher penalty prices or lower quota targets to restrain or motivate the behaviors of power grid companies to promote the consumption of renewable energy and ease the pressure of government subsidies.

3.1.2. Possible Problems with Renewable Portfolio Standard Policy Implementation

(1) Under the RPS policy, there is p s , r + p g = p s , f , and a loss due to the price of green certificates being lower than the subsidized electricity price can still be compensated by the national renewable energy development fund, so there is π p / p g = 0 , which means the green certificate price will not affect the revenue of the power generation enterprises, while for green certificate purchasers and power grid enterprises, the green certificate price growth would reduce their income that is, π n / p g < 0 . It is easy to conclude that under the market effect, the game equilibrium price of the green certificates is zero. On the one hand, this makes the RPS mechanism theoretically unable to alleviate the pressure on government funding subsidies. On the other hand, if the green certificates price is zero, the green certificates trading mechanism would lose its meaning of existence. Therefore, government departments should set a lower limit on the price of green certificates to ensure the effectiveness of the green certificates trading mechanism.
(2) The RPS policy is implemented to promote grid companies accepting more renewable energy power by setting renewable energy consumption targets for grid companies, which requires power plants giving up a certain amount of fossil energy power generation space to increase the proportion of renewable energy power generation. At this stage, China’s main power generation method is thermal power generation. Large-scale renewable energy power generation and connection to power gird will inevitably change the power market structure mainly based on thermal power generation, which would result in a large resistance of implementation. In this regard, the government should introduce more flexible policy mechanism to regulate and guide the active cooperation of stakeholders in the RPS mechanism, so as to realize the policy transformation from FiT to RPS.
(3) On one hand, under the current renewable energy power generation technology level, power grid enterprises are faced with the safe operation risk brought by the high proportion of renewable energy power access to the power grid. On the other hand, due to the obvious regional differences in China’s renewable energy resource endowment and renewable energy development, some power grid enterprises in China have reached a saturated state for absorbing renewable energy power, while some regional power grid enterprises still have a large renewable energy power consumption space. Therefore, under the current stage, the state should adjust and adopt a new strategic plan for renewable energy development with more regional characteristics to achieve coordinated development of renewable energy power generation in China.

3.2. Improvement Design of Renewable Portfolio Standard Policy

In view of the possible problems in the implementation of the RPS mechanism, the article proposes two specific improvements to its implementation: (1) set the minimum trading price of green certificates; and (2) adopt a more flexible way of selling electricity prices.

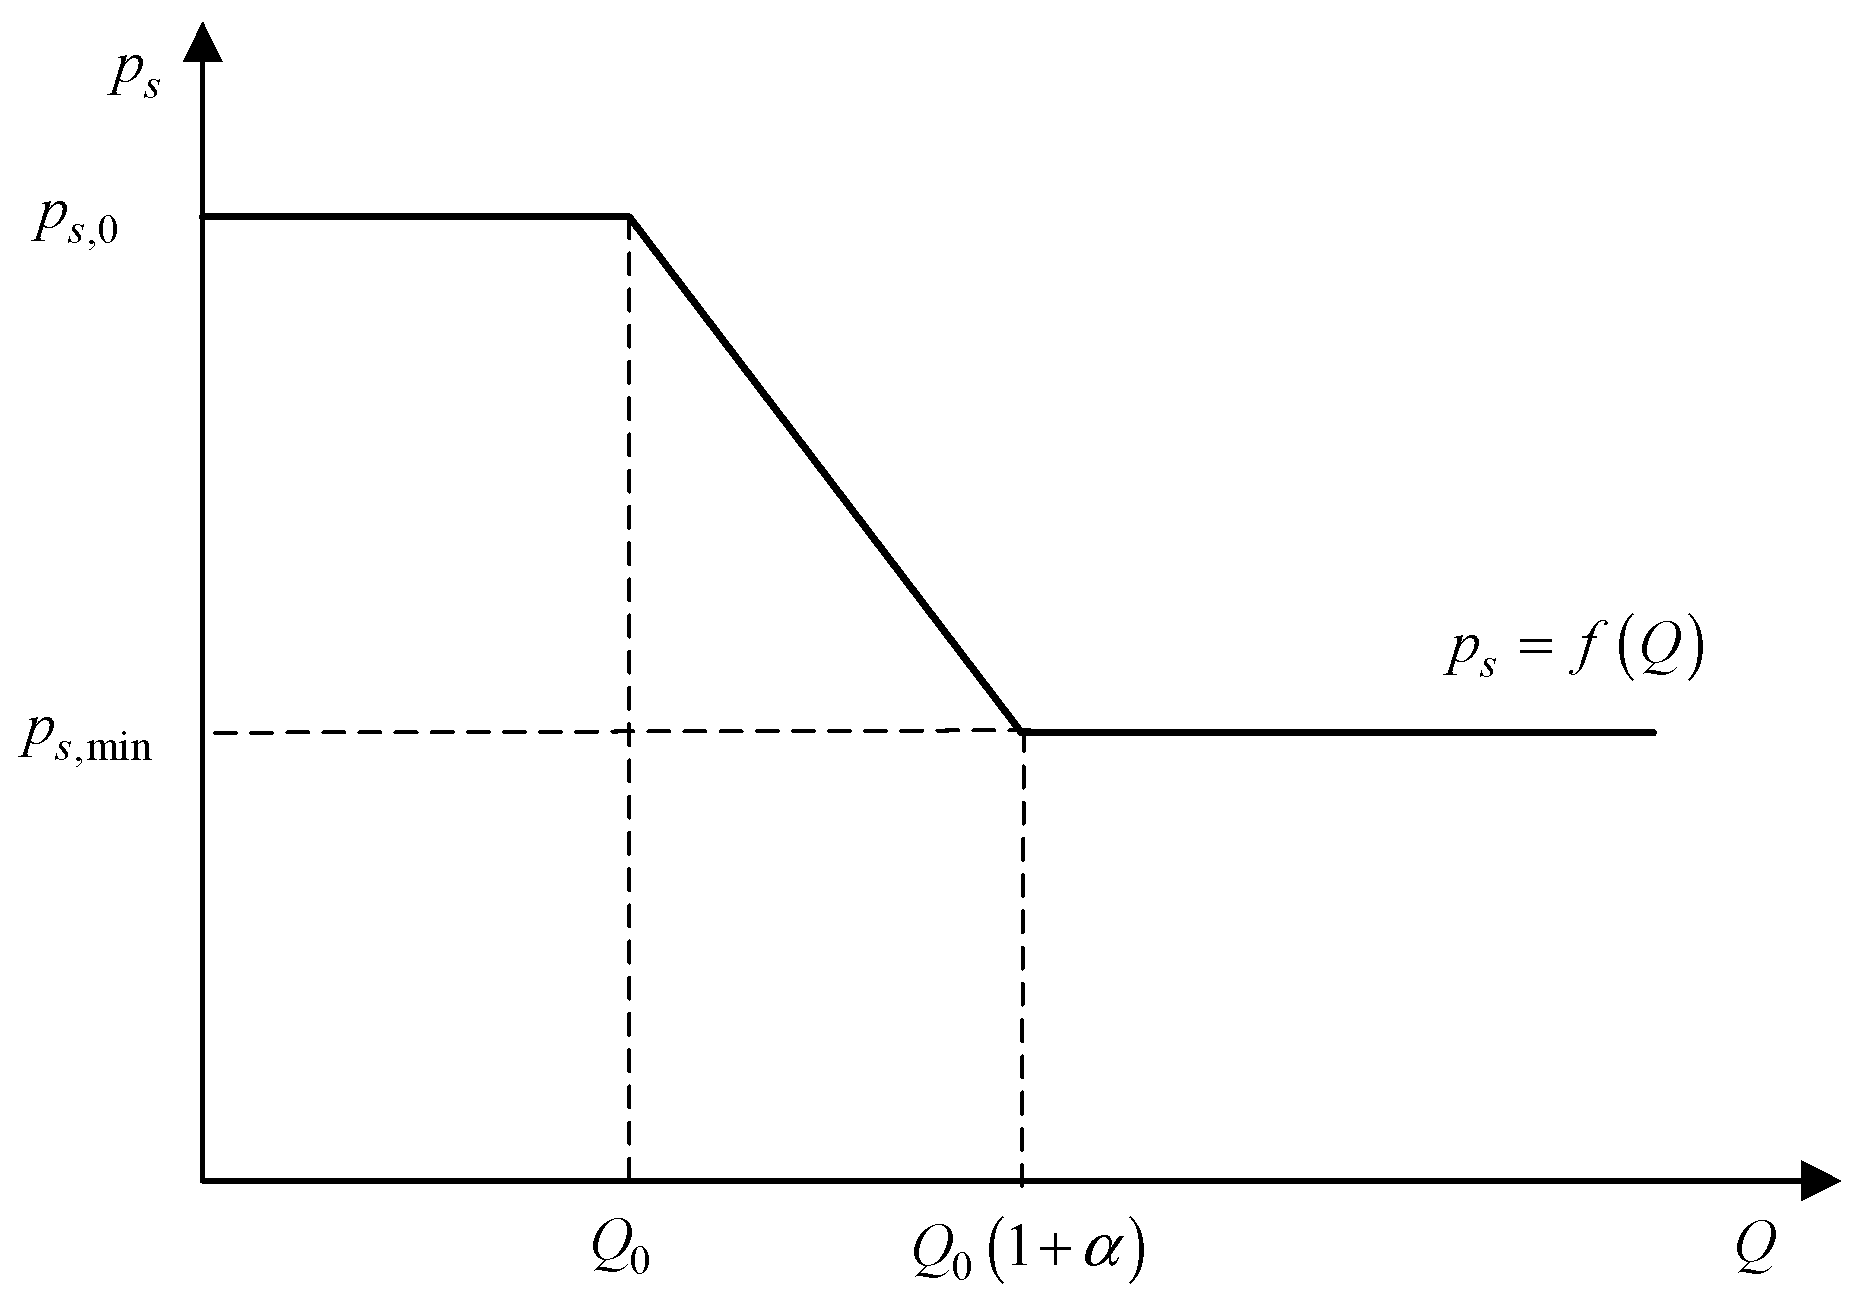
3.2.1. Minimum Trading Price of Green Certificates

The minimum trading price of green certificates ( p g , min ) is the minimum standard for RPS mechanism to relieve the pressure of renewable energy generation subsidy. The setting of this value should take into account the endowment of renewable energy resources, and dynamically adjust according to the renewable energy power generation subsidy funding gaps and the change of the technology of renewable energy power generation, which will be issued and implemented by the energy authorities at the beginning of each trading period.

3.2.2. “Incremental Electricity Price” Policy

Flexible sales price policy is an effective way to regulate users’ electricity consumption behaviors [40,41,42]. This paper proposes an “Incremental Electricity Price” policy on the power grids-users side, and designs a green certificates trading mechanism between the power grid companies and users to stimulate the growth of demand for renewable energy. On the one hand, it can promote the increase of demand for renewable energy while ensure the benefits of fossil energy power generation to a certain extent, so as to reduce the resistance of RPS policy implementation. On the other hand, it redistributes the renewable energy consumption obligations of power grid companies and users in a more effective way. The following is the specific design of the policy:
The green certificates obtained by power grid companies from renewable energy consumption in a trading cycle, on the one hand, which can be submitted to energy authorities to complete the renewable energy quota assessment at the end of the trading period, on the other hand, which can be sold to the power consumers to transfer a part of renewable energy consumption obligations, wherein the green certificates sold to the users can still be used for the grid companies to complete quota assessment, and a green certificate cannot be resold.
In order to encourage users to increase power consumption, power grid companies that decided to adopt this supplementary policy, set and release the “Incremental Electricity Price” standard at the beginning of a trading cycle, that is, compared with the previous trading cycle, consumers can enjoy the “Incremental Electricity Price” policy for increased power consumption in the current period, and on the premise of ensuring the profitability of power grid companies, the price concession is proportional to user’s power consumption increment, and the “Incremental Electricity Price” standard curve, p s = f ( Q ) , is shown as Figure 2.
p s , 0 and Q0 are respectively the average selling price of the last trading cycle and the electricity consumption of the user. p s , min is the average lowest selling price that the power grid companies can use to ensure profitability, which is calculated by the power grid companies according to their profitability and operating cost. For different customer groups, power grid companies can adopt a unified adjustment parameter, α , or adopt a different parameter, α , according to customer groups with different characteristics of electricity consumption behaviors. The standard of the “incremental electricity price” is shown in Equation (15):
p s = f ( Q ) = { p s , 0 0 Q < Q 0 p s , 0 p s , min α Q 0 Q + ( 1 + α ) p s , 0 p s , min α Q 0 Q < ( 1 + α ) Q 0 p s , min ( 1 + α ) Q 0 Q
At the beginning of the trading cycle, power users comprehensively consider their own electricity demand, the “incremental electricity price” standard, and the green certificate price (the market price of the green certificates sold by the power grid companies to users) to decide whether to participate in the “incremental electricity price” policy. If users decide to participate in the policy, they will negotiate with the power grid companies to determine the number of green certificates (Qg) and green certificate transaction price ( p g ), and sign a power contract. The number of green certificates, Qg, is the actual maximum incremental power that the user can enjoy to achieve the preferential electricity price. If the actual power consumption of users is greater than the number of green certificates, the excess power will not enjoy the preferential electricity price anymore, because it cannot reflect the effect of renewable energy consumption. If the actual power consumption of the users is less than the number of green certificates, the fee of purchasing green certificates will not be returned. The actual electricity fee, Ce, paid by the users under the “incremental electricity price” is:
C e = { 0 Q f ( Q ) d Q 0 Q < Q 0 + Q g 0 Q 0 + Q g f ( Q ) d Q + Q 0 + Q g Q p s , 0 d Q Q 0 + Q g Q

3.3. Evolution Analysis of Decision-Making Behaviors of Players under the “Incremental Electricity Price” Policy

3.3.1. Assumptions of the Evolutionary Game Model

H1: Transactions under this policy only occur between grid companies and users.
H2: Grid companies and users have the right to choose whether to adopt this policy or not.
H3: Users will predict their power needs as accurately as possible. Electricity demand is an important factor affecting its decision-making. Users should comprehensively consider their own development needs and the cost of electricity, and scientifically judge their own electricity demand in the future to achieve maximum benefits.
H4: According to the principles of microeconomics, we know that goods have elasticity due to price-demand. For the convenience of this research, we assume that when users participate in the “incremental electricity price” policy, the electricity demand increase is Qg, and when users do not participate in the “incremental electricity price” policy, the electricity demand increase is kQg, and 0 k 1 .

3.3.2. The Players’ Payoff Functions

In this paper, we believe that under the “incremental electricity price” policy, there are only two pure strategies for grid companies: Adopt or not adopt, and the proportion of grid enterprises adopting this policy is x, and the ratio of not adopting this policy is 1 − x. There are only two pure strategies for users: participating in or not participating in, and the proportion of users participating in this policy is y, and the proportion of users not participating in this policy is 1 − y. When the grid enterprises choose to adopt and the users choose to participate in the policy, the green certificate transaction between the grid enterprises and users is successfully completed, and the “incremental electricity price” policy is an effective policy. In other cases, the policy is an invalid policy. The following is a detailed description of the payoff functions under different strategies of grid companies and users.
(1) When grid enterprises choose to adopt and users choose to participate in this policy, the revenue of the grid enterprises is f1, and the revenue of the users is π1, as follows:
f 1 = 0 Q 0 + Q g f ( Q ) d Q + p g Q g C n ( Q 0 + Q g ) β 1 C T G C
π 1 = p 1 ( Q 0 + Q g ) 0 Q 0 + Q g f ( Q ) d Q p g Q g β 2 C T G C
where:
Cn is the average unit cost of the grid enterprises, including the cost of purchasing electricity, the cost of maintenance and management in the process of power transmission, and the cost of purchasing green certificates due to undertaking the quotas and the cost of fines due to uncompleted quotas.
CTGC is the fixed cost of the green certificate transaction between power grid companies and users due to information asymmetry, and it is jointly undertaken by the grid enterprises and the users, and its commitment ratio is β 1 : β 2 ( β 1 + β 2 = 1 ,   0 < β 1 , β 2 < 1 ) [28].
p1 is the average revenue from the user’s unit of electricity consumption.
(2) When grid enterprises choose to adopt and users choose not to participate in this policy, the revenue of the grid enterprises is f2, and the revenue of the users is π2, as follows:
f 2 = p s , 0 ( Q 0 + k Q g ) C n ( Q 0 + k Q g ) β 1 C T G C
π 2 = p 1 ( Q 0 + k Q g ) p s , 0 ( Q 0 + k Q g )
(3) When grid enterprises choose not to adopt and users choose to participate in this policy, the revenue of the grid enterprises is f3, and the revenue of the users is π3, as follows:
f 3 = p s , 0 ( Q 0 + k Q g ) C n ( Q 0 + k Q g )
π 3 = p 1 ( Q 0 + k Q g ) p s , 0 ( Q 0 + k Q g ) β 2 C T G C
(4) When grid enterprises choose not to adopt and users choose not to participate in this policy, the revenue of the grid enterprises is f4, and the revenue of the users is π4, as follows:
f 4 = p s , 0 ( Q 0 + k Q g ) C n ( Q 0 + k Q g )
π 4 = p 1 ( Q 0 + k Q g ) p s , 0 ( Q 0 + k Q g )
The payoff matrix of the power grid companies and the users under different strategy combinations is showed in Table 3.

3.3.3. Replicator Dynamic Equations

The theory of the replicator dynamic equation proposed by Taylor and Jonker is the first and most successful method to describe the dynamic mechanical behavior in an evolutionary game [43]. The replicator dynamic equation is defined as the growth rate of individuals using a strategy proportional to the difference between the fitness from using the strategy and the average fitness of the population.
The average fitness for grid companies to adopt and not adopt this policy are W1 and W2, respectively, and the average fitness of the population is W ¯ , as follows:
W 1 = y f 1 + ( 1 y ) f 2
W 2 = y f 3 + ( 1 y ) f 4
W ¯ = x W 1 + ( 1 x ) W 2
The average fitness for users to participate and not participate is U1 and U2, respectively, and the average fitness of the population is U ¯ , as follows:
U 1 = x π 1 + ( 1 x ) π 3
U 2 = x π 2 + ( 1 x ) π 4
U ¯ = y U 1 + ( 1 y ) U 2
Therefore, the replicator dynamic equation representing that the grid enterprises choose to adopt this policy is:
F ( x ) = d x d t = x ( W 1 W ¯ ) = x ( 1 x ) [ y ( f 1 f 2 f 3 + f 4 ) + ( f 2 f 4 ) ]
Similarly, the replicator dynamic equation that the users choose to participate in the policy can be obtained as follows:
G ( y ) = d y d t = y ( U 1 U ¯ ) = y ( 1 y ) [ x ( π 1 π 2 π 3 + π 4 ) + ( π 3 π 4 ) ]
When the growth rate of individuals using a certain strategy is 0, F ( x 0 ) = 0 , G ( y 0 ) = 0 , the state is likely to become stable. Here, we can obtain four solutions: x 1 = 0 , x 2 = 1 , y 1 = 0 , y 2 = 1 . There are four points, (0,0), (0,1), (1,0), (1,1), that may become an evolutionary stable strategy (ESS).

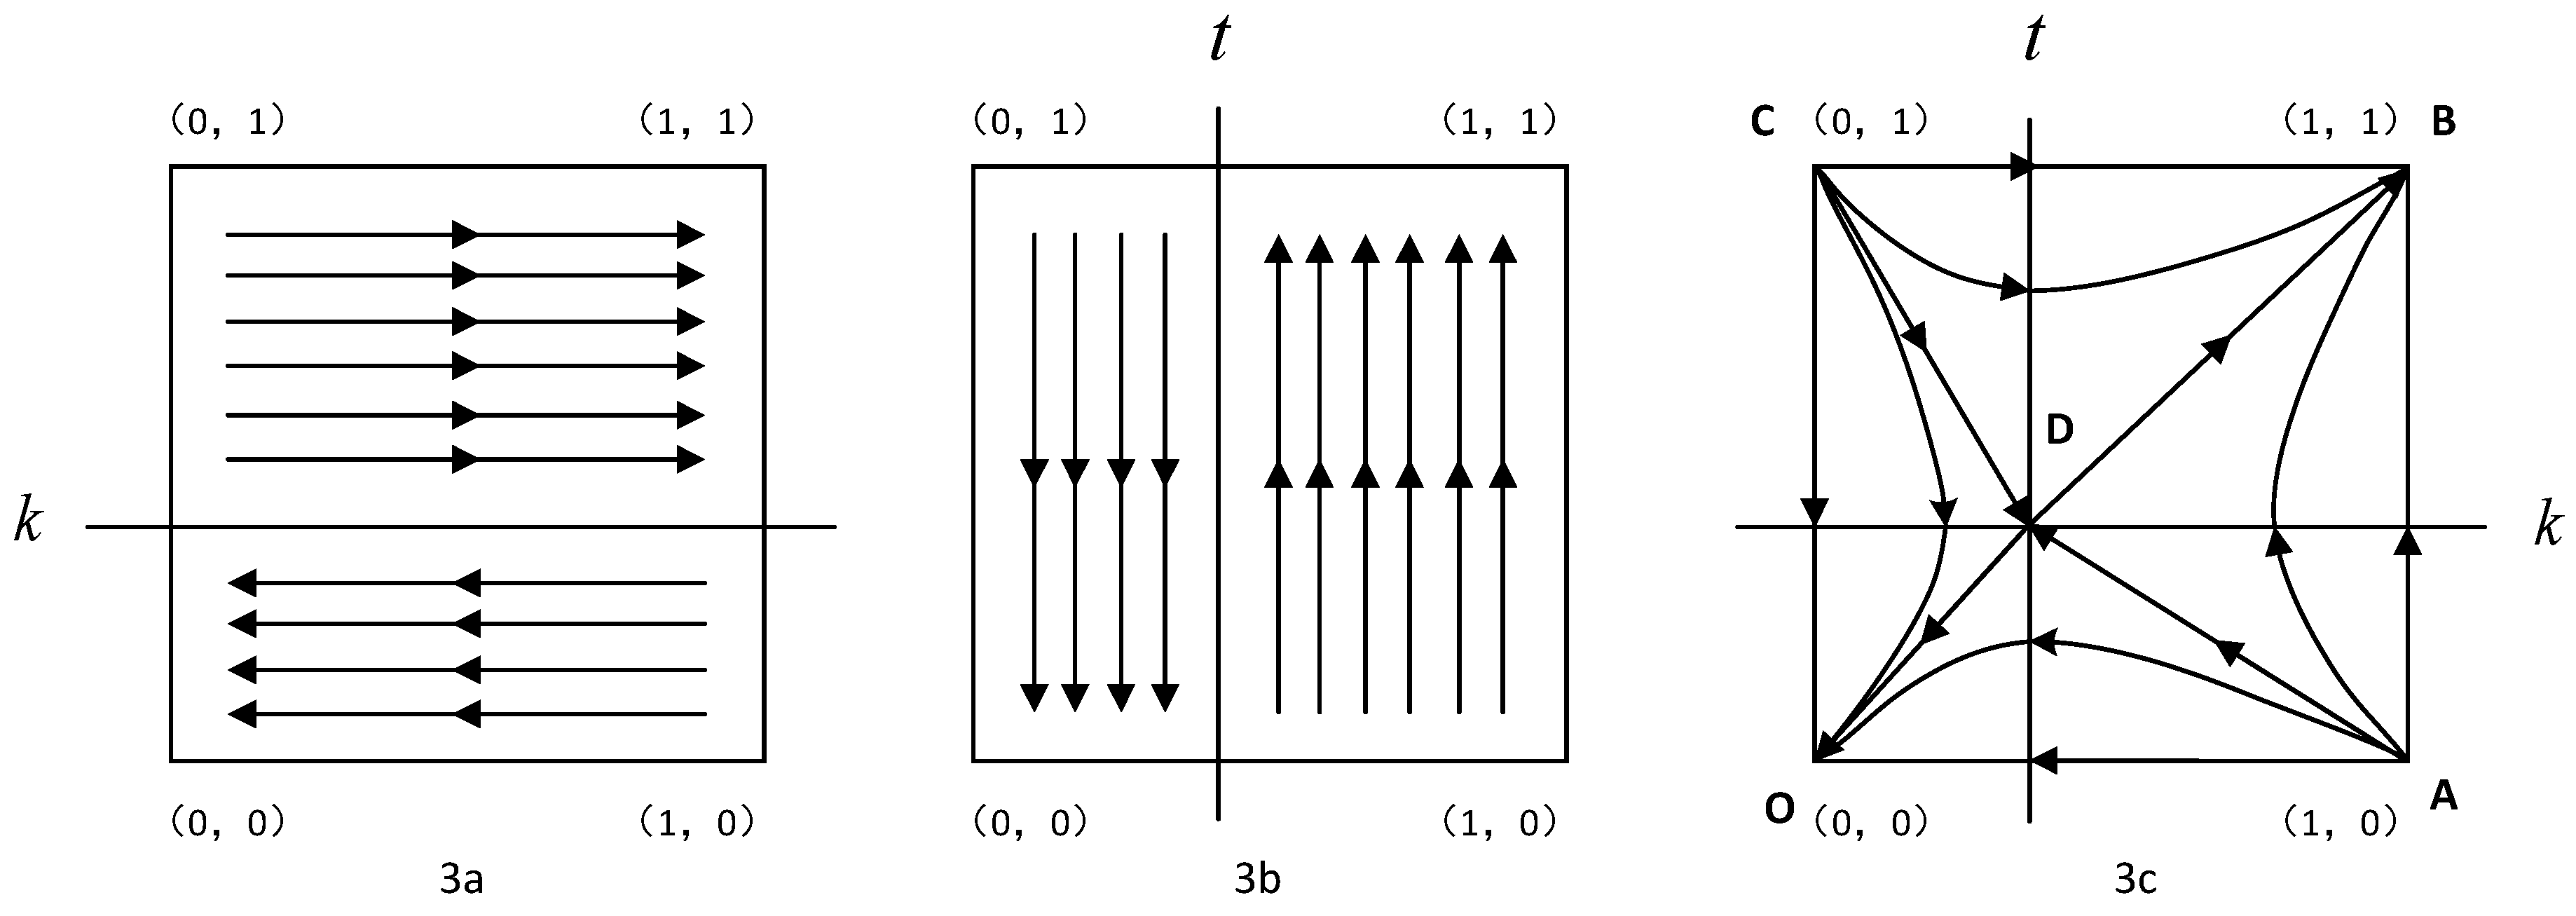
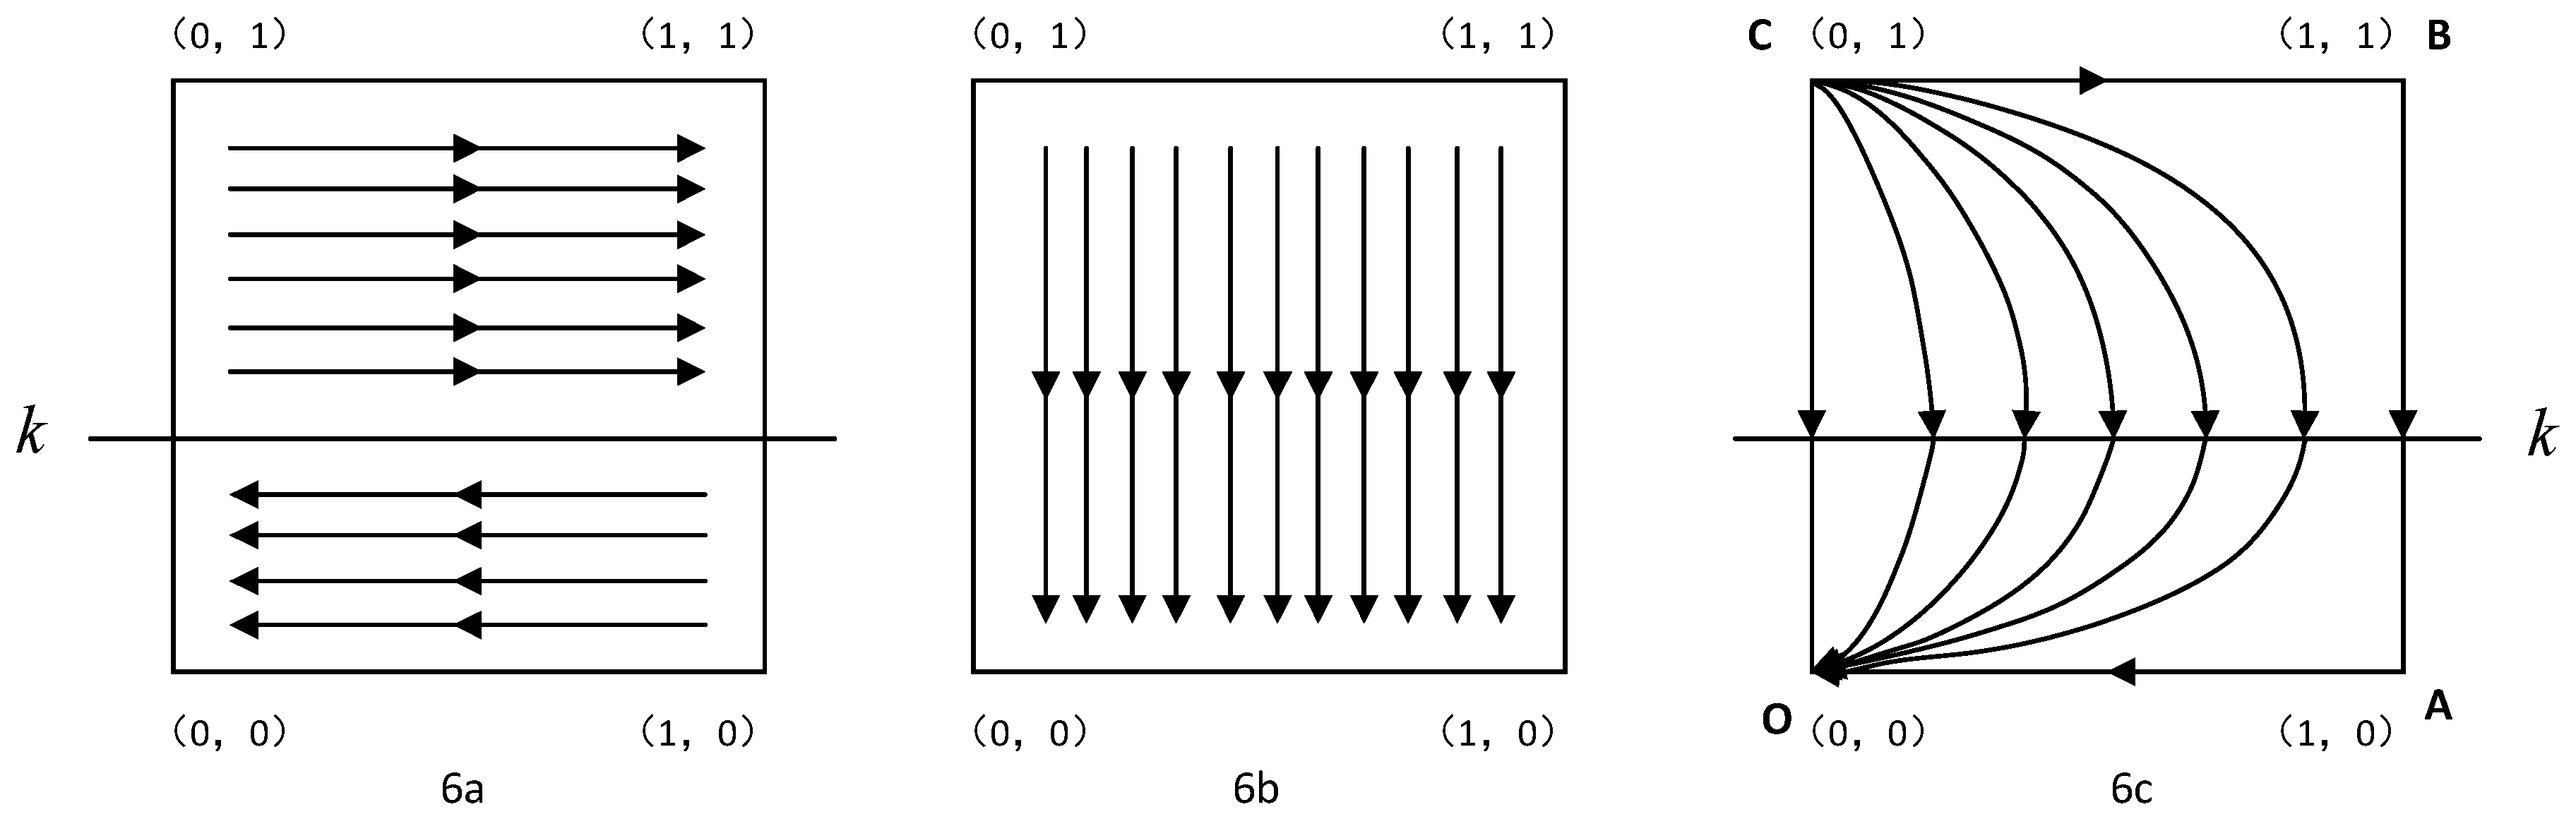
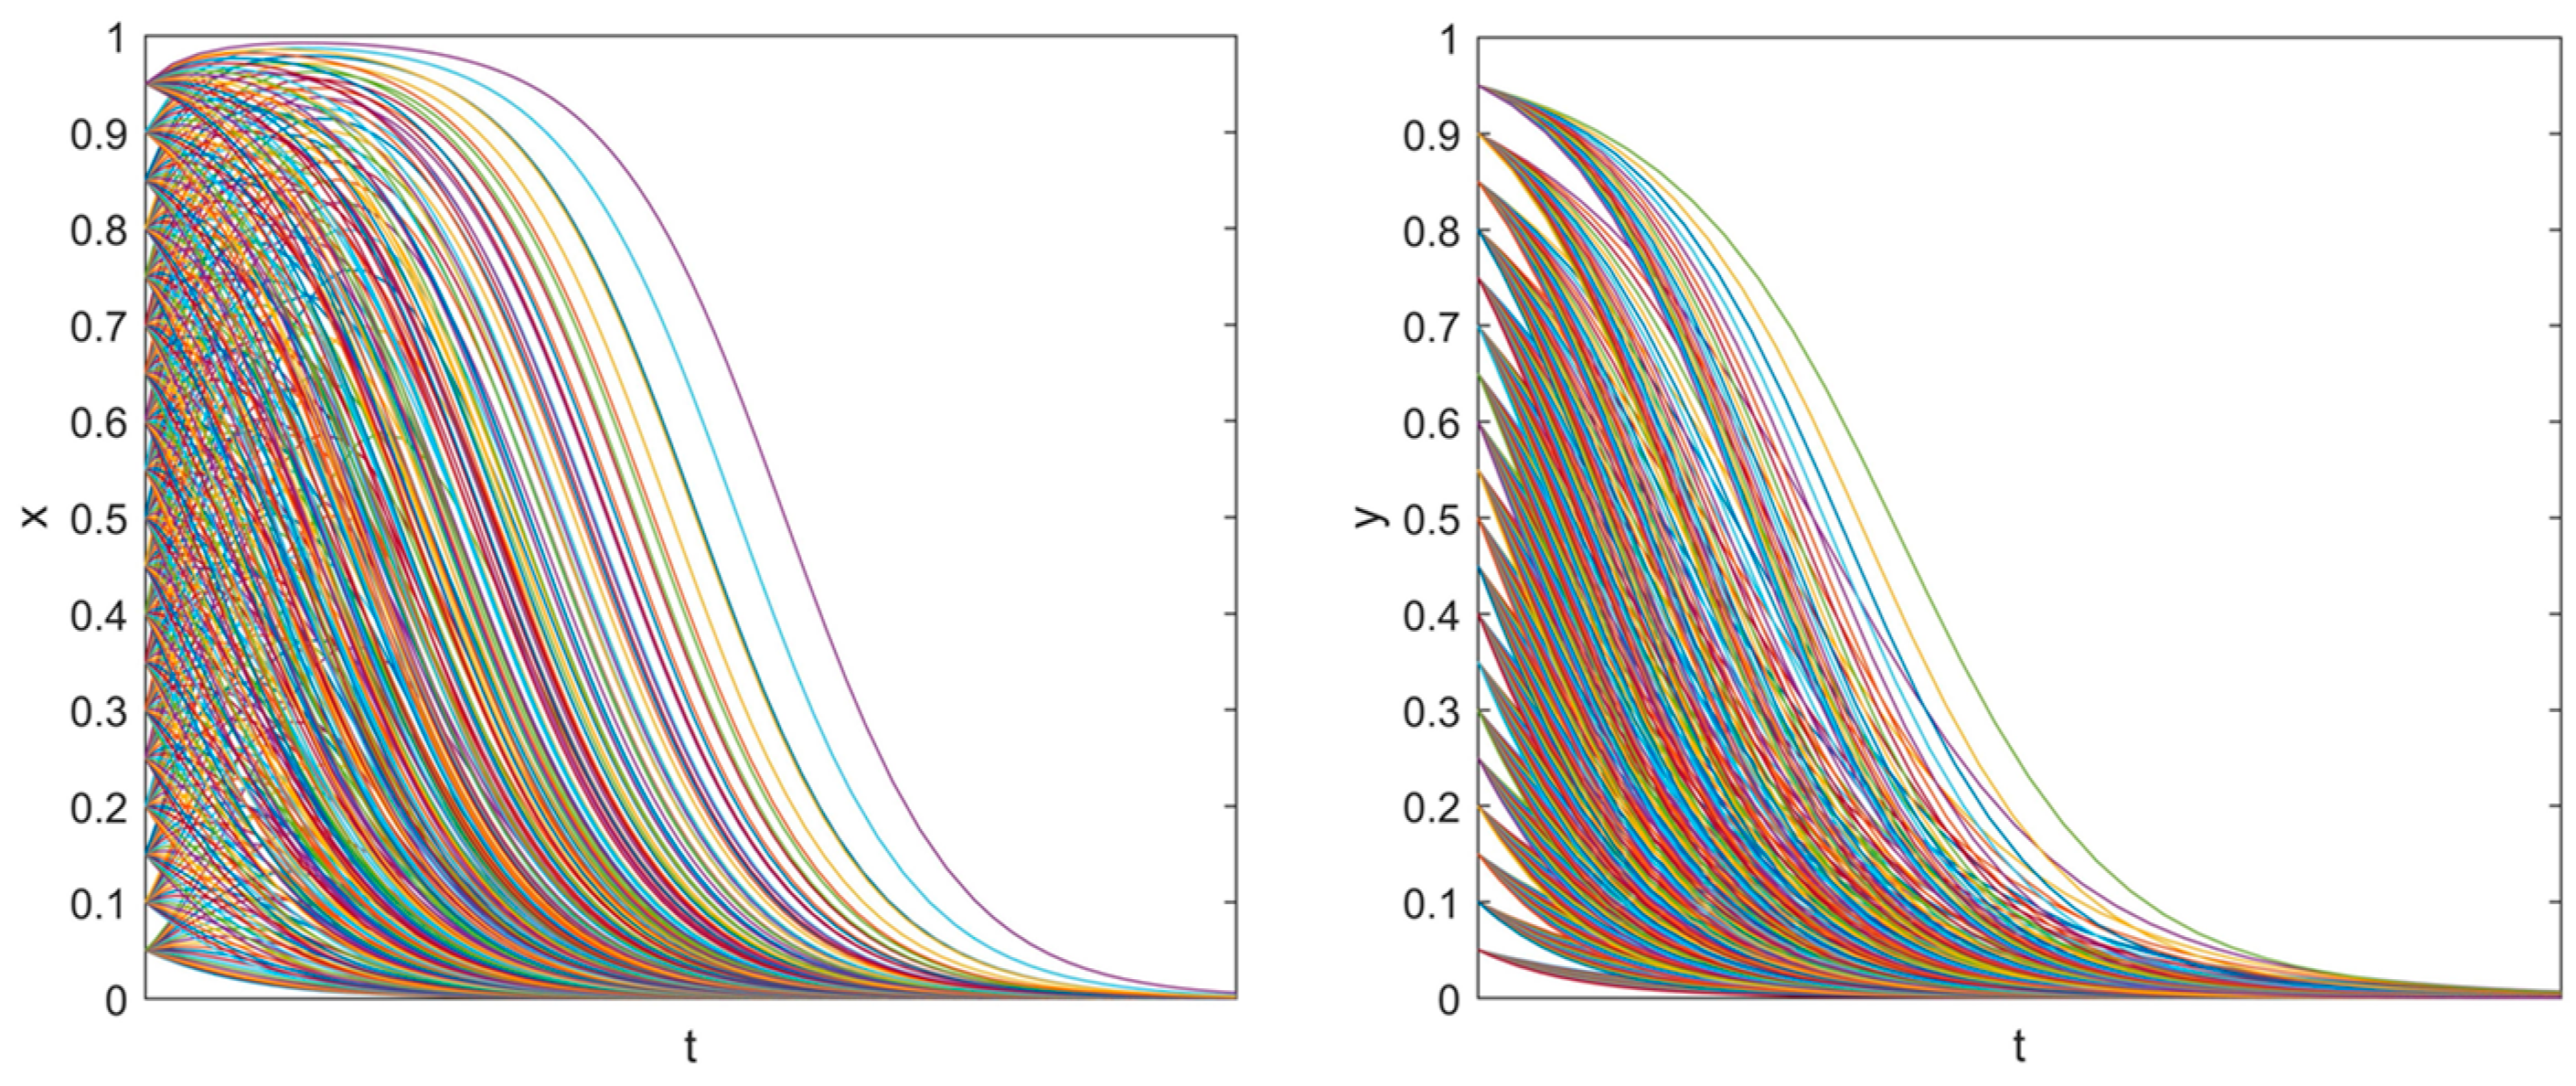
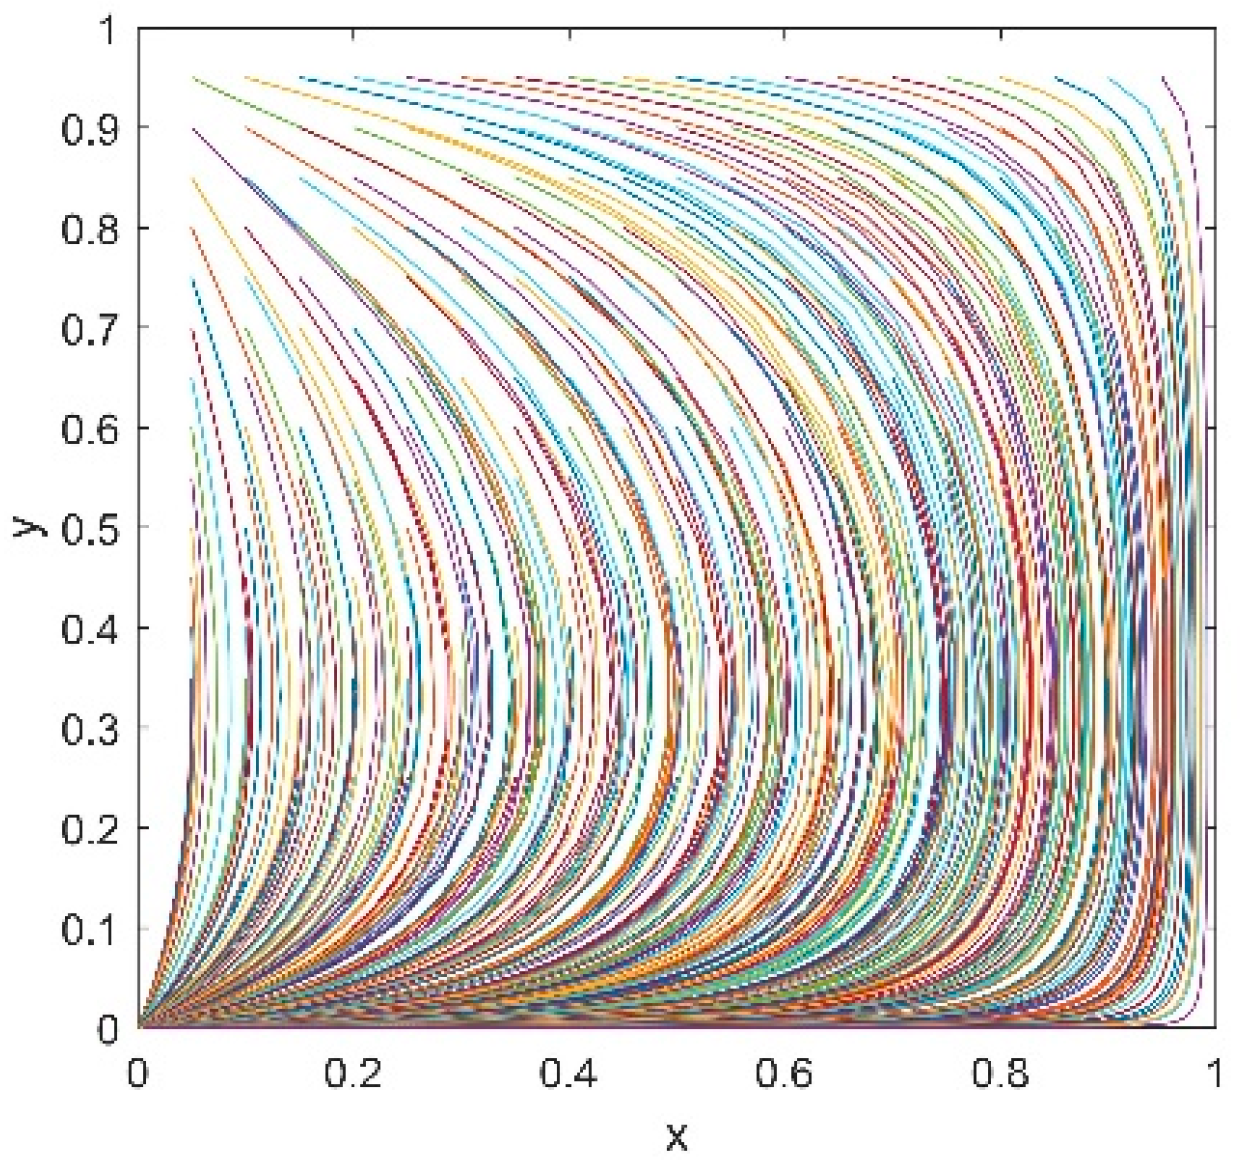
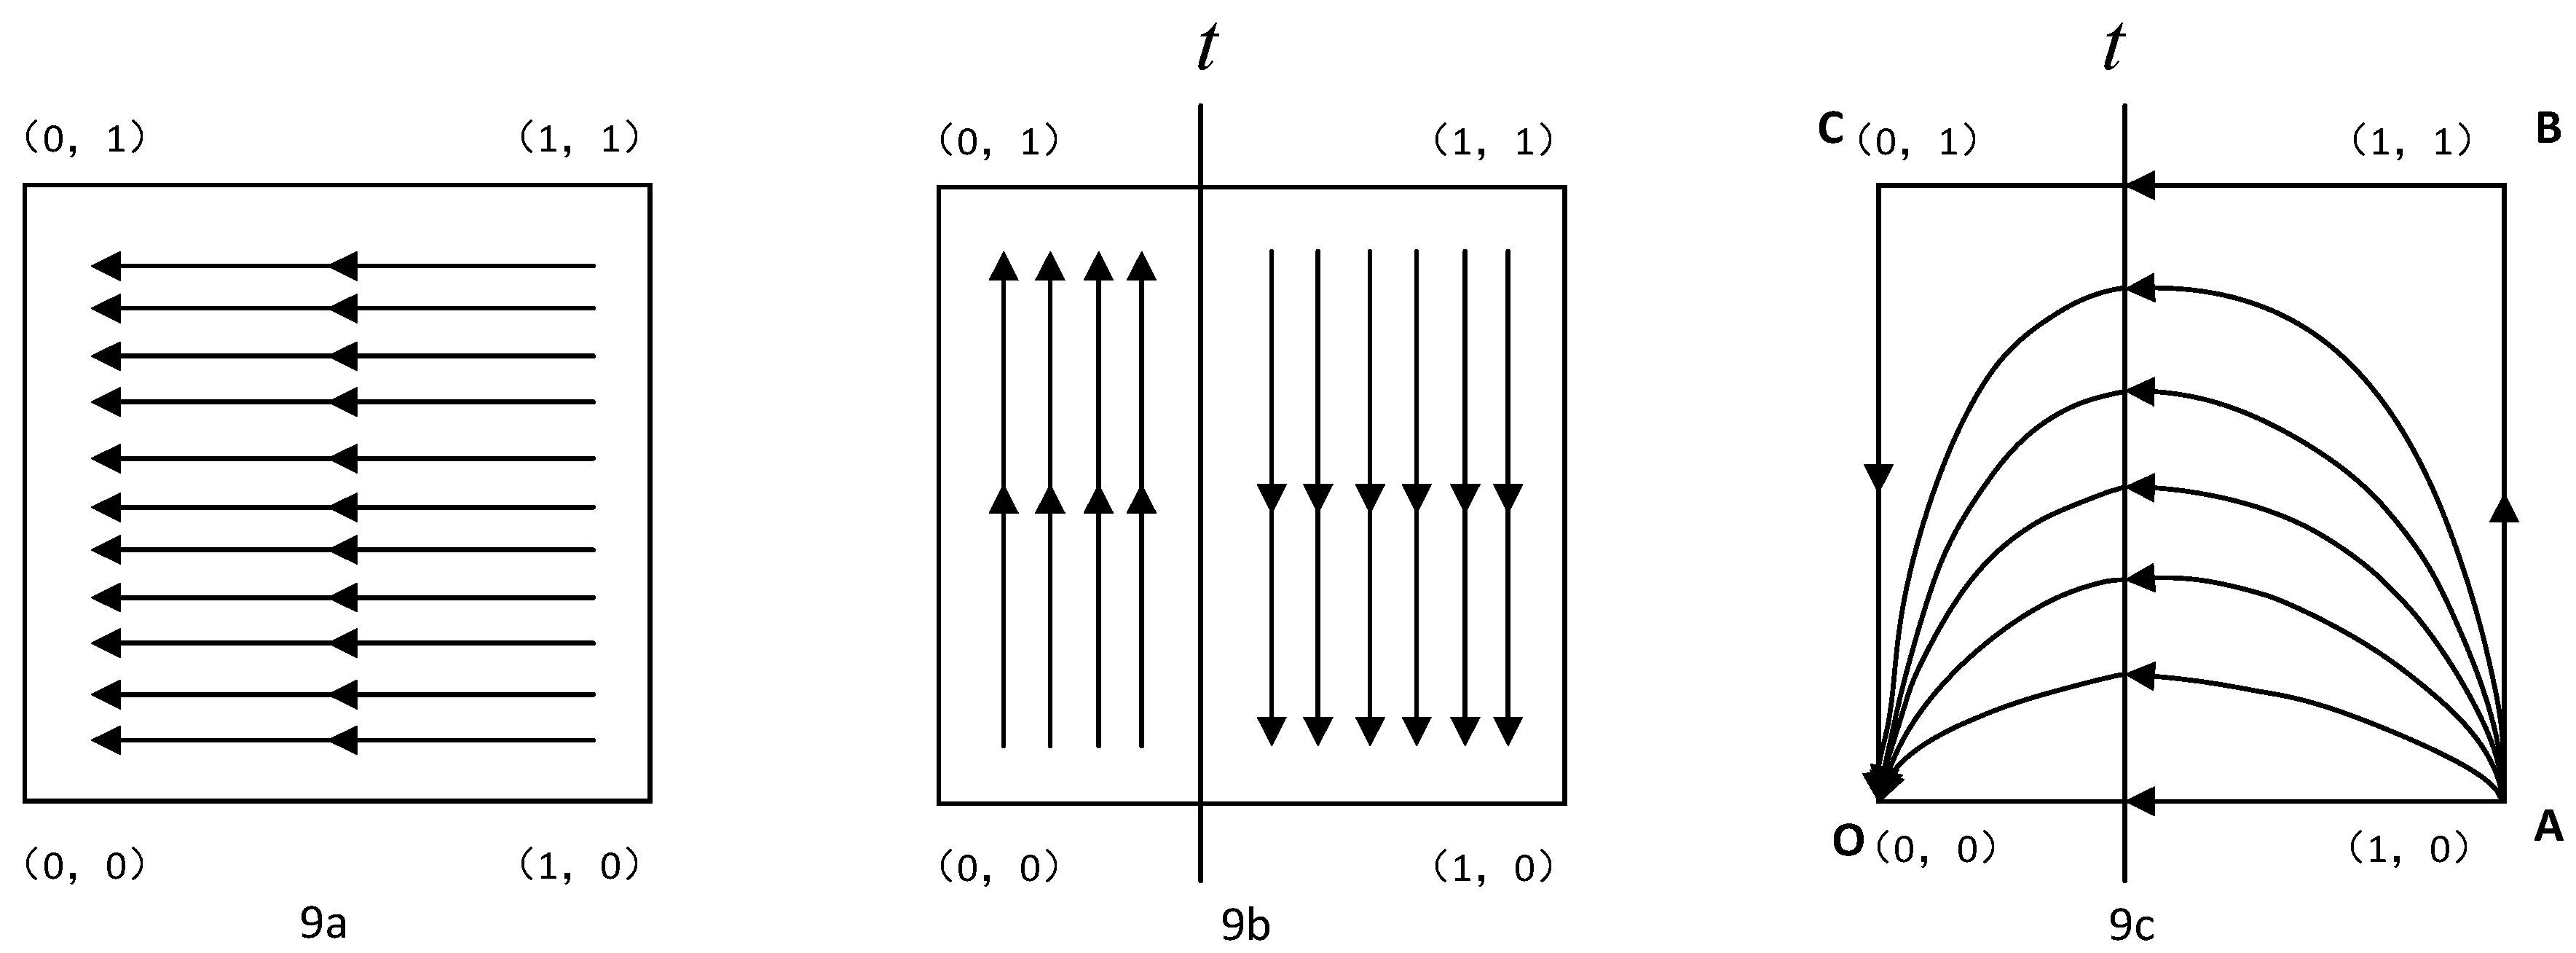
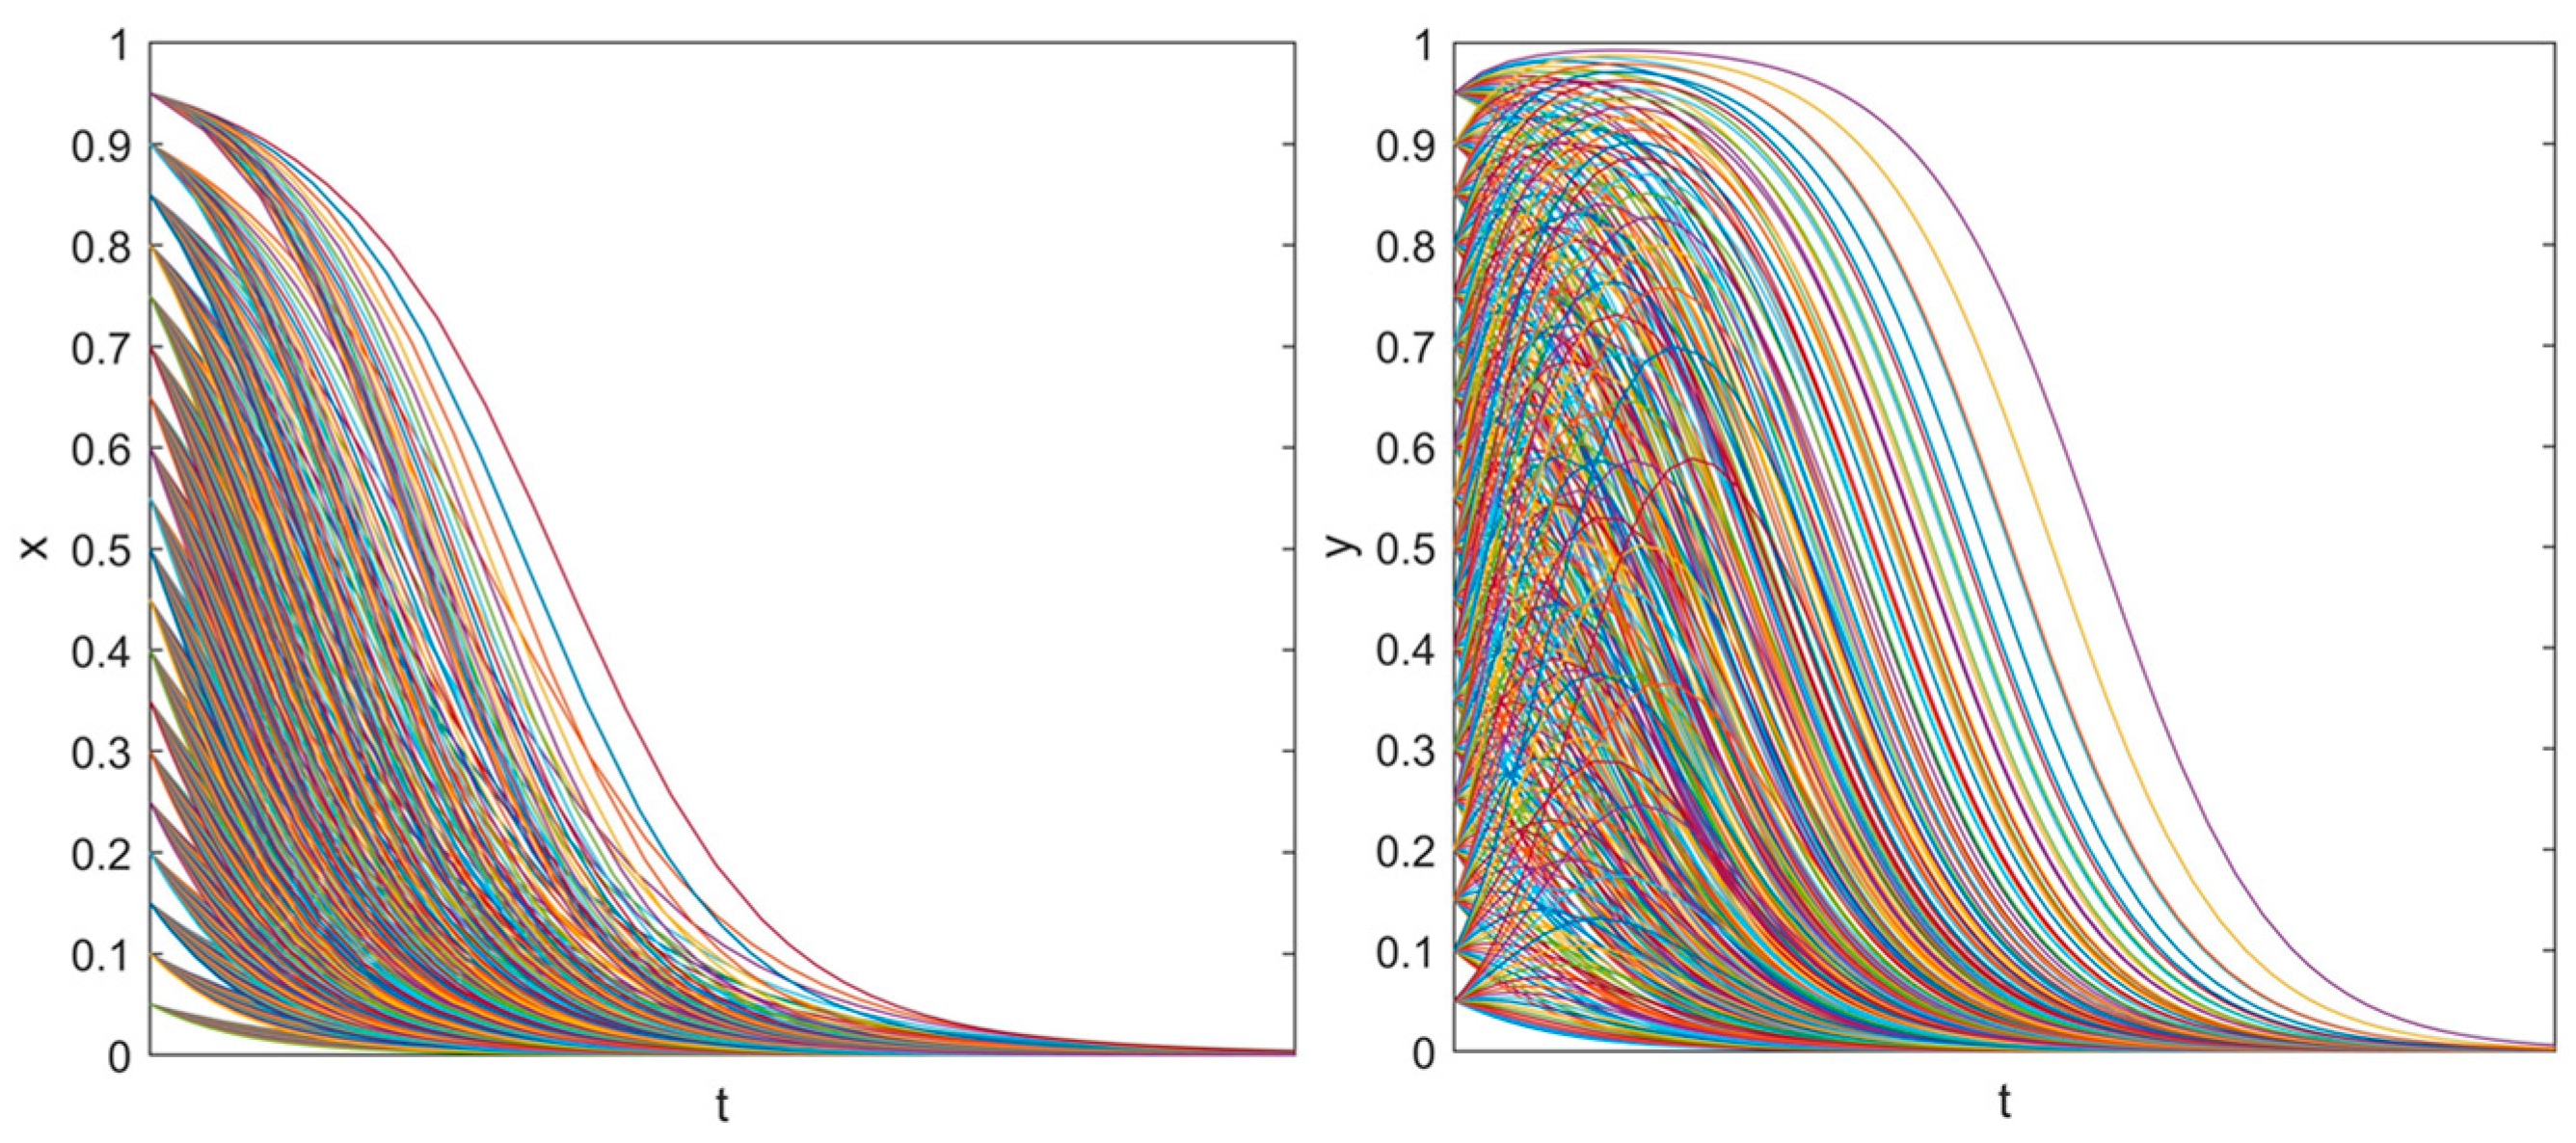
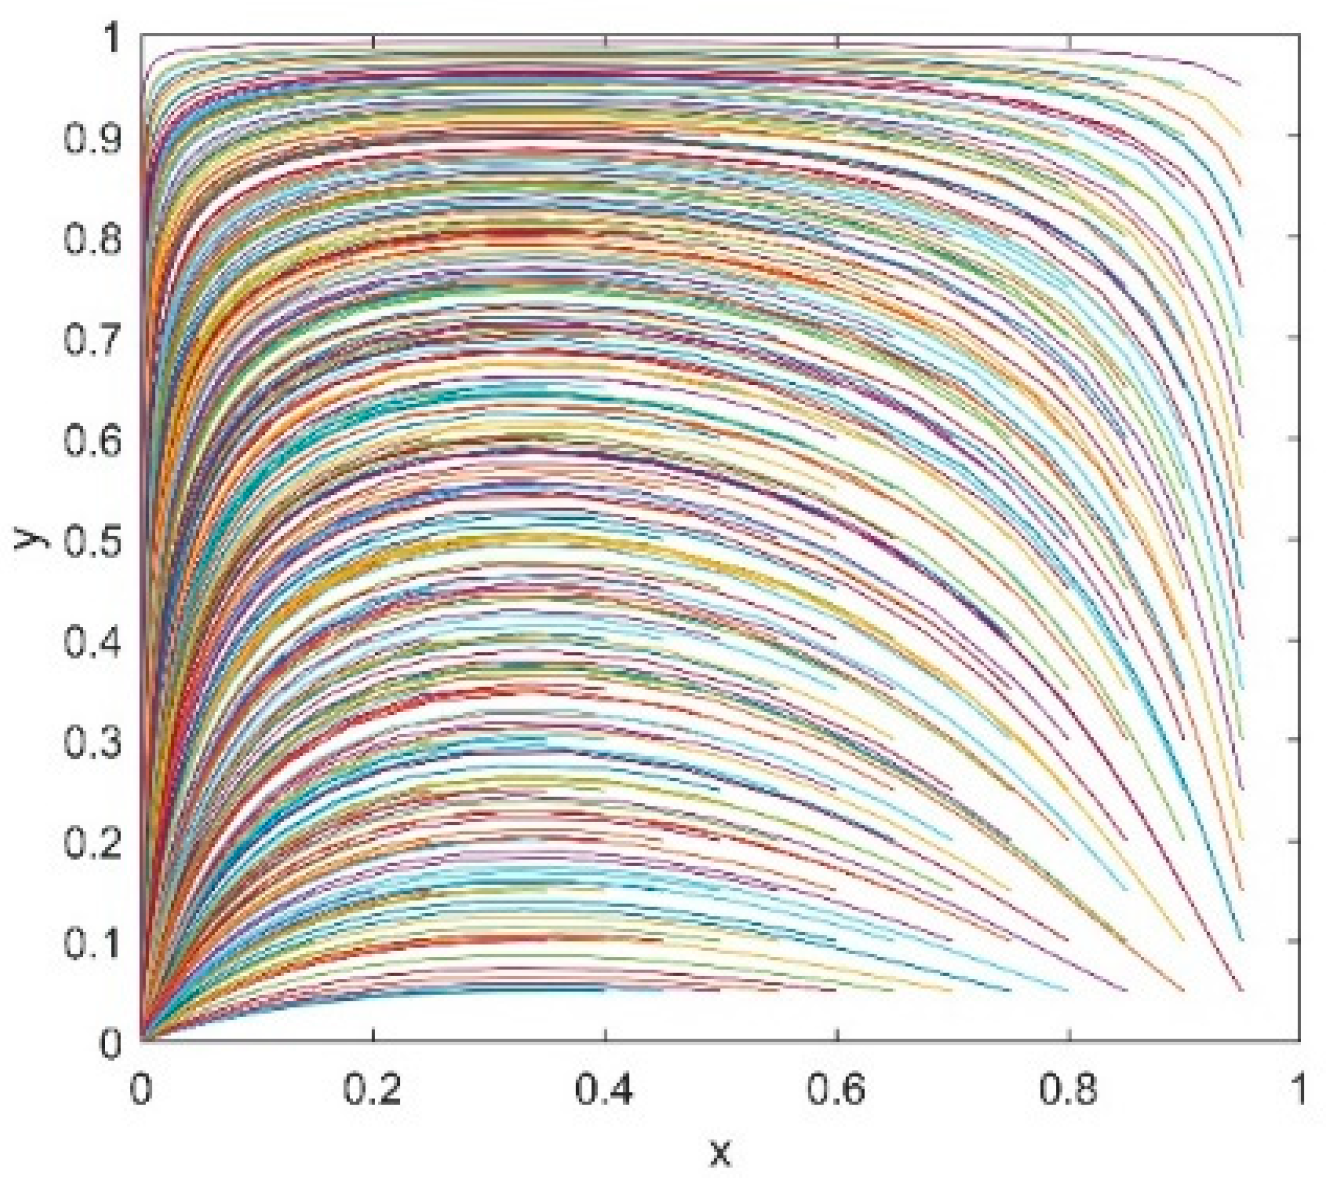
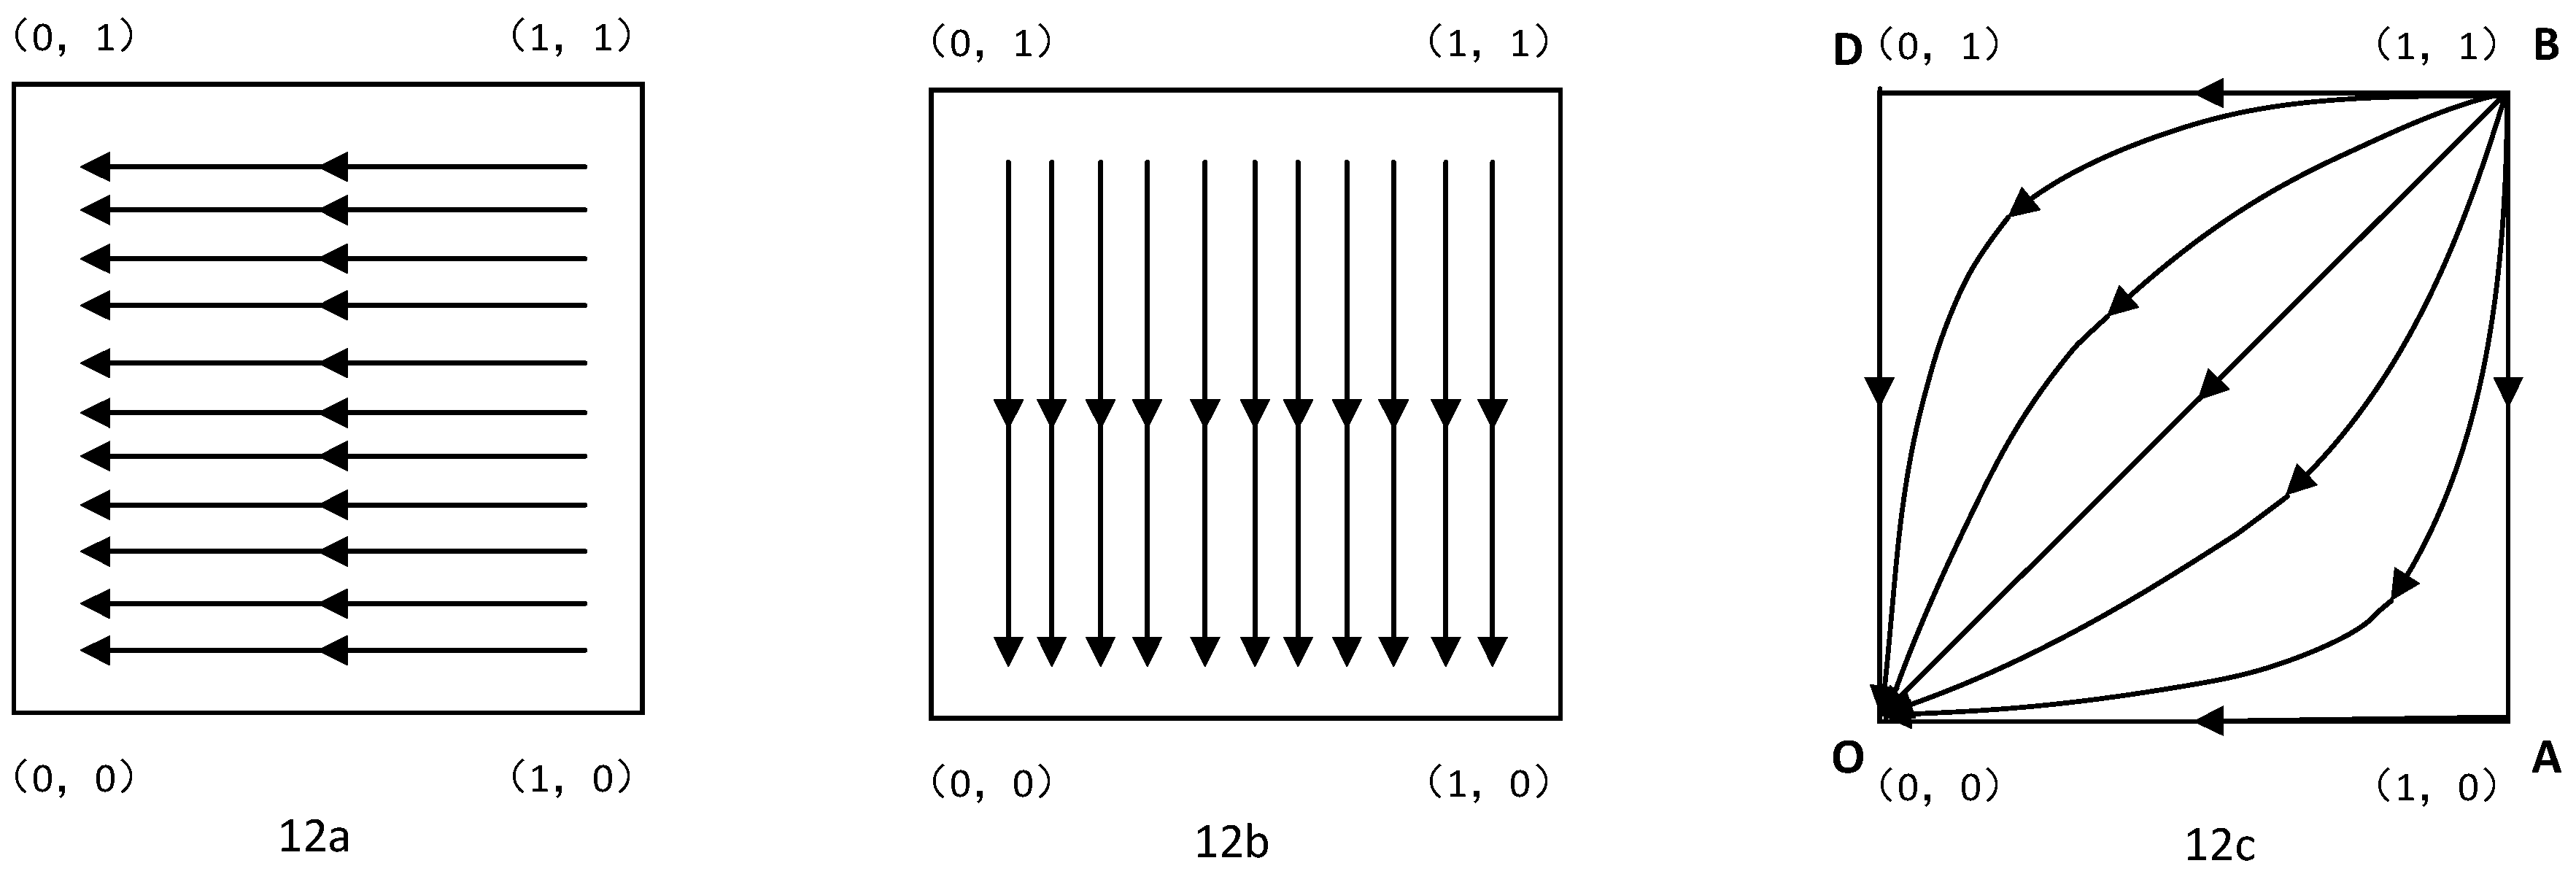
3.3.4. Evolutionary Stable Strategy Analysis

According to the theory of the replicator dynamic equation, on the basis of F ( x 0 ) = 0 and G ( y 0 ) = 0 , when F ( x 0 ) < 0 and G ( y 0 ) < 0 , the system reaches the evolutionary stable state; that is, any change in the system state during the current time period will cause the system state to change in the opposite direction in the next time period, thereby achieving a steady state.
By calculation, we can get the following equations as shown:
F ( 0 ) = y ( f 1 f 2 ) + ( f 2 f 4 ) F ( 1 ) = y ( f 1 f 2 ) ( f 2 f 4 ) G ( 0 ) = x ( π 1 π 3 ) + ( π 3 π 4 ) G ( 1 ) = x ( π 1 π 3 ) ( π 3 π 4 )
By analyzing the players’ payoff functions, it is easy to get the following relationship:
f 3 = f 4 > f 2 ,   π 2 = π 4 > π 3
In order to comprehensively explore the stability of the above four points and the evolution of the system state in different situations, we analyzed it in four cases: (1) f 1 > f 3 ,   π 1 > π 4 ; (2) f 1 > f 3 ,   π 1 < π 4 ; (3) f 1 < f 3 ,   π 1 > π 4 ; and (4) f 1 < f 3 ,   π 1 < π 4 .
Case 1: f 1 > f 3 ,   π 1 > π 4 , that is, f 1 > f 3 = f 4 > f 2 and π 1 > π 2 = π 4 > π 3 .
Evolution process analysis of power grid enterprises’ strategy: Let k = f 4 f 2 f 1 f 2 , then 0 < k < 1 is established. When y > k , F ( 0 ) > 0 and F ( 1 ) < 0 , so x 1 = 0 is not ESS, and x 2 = 1 is ESS. The power grid enterprises will gradually evolve from choosing not to adopt this policy to adopting it. When y < k , F ( 0 ) < 0 and F ( 1 ) > 0 , so x 1 = 0 is ESS, and x 2 = 1 is not ESS. The power grid enterprises will gradually evolve from choosing to adopt this policy to not. The evolution process is shown in Figure 3a.
Evolution process analysis of users’ strategy: let t = π 4 π 3 π 1 π 3 , then 0 < t < 1 is established. When x > t , there are G ( 0 ) > 0 and G ( 1 ) < 0 , so y 1 = 0 is not ESS, and y 2 = 1 is ESS. The users will gradually evolve from choosing not to participate in this policy to participating in it. When x < t , there are G ( 0 ) < 0 and G ( 1 ) > 0 , so y 1 = 0 is ESS, and y 2 = 1 is not ESS. The users will gradually evolve from choosing to participate in this policy to not choosing. The evolution process is shown in Figure 3b.
Then, the final evolution process of the power grid enterprises and users in this case can be obtained, as shown in Figure 3c.
The empirical data is introduced below to verify the evolution of this process. Let X = f 1 f 3 = 100 ; Y = π 1 π 4 = 100 ; Z = f 4 f 2 = 50 ; and W = π 4 π 3 = 50 . Then, the replicator dynamic equations can be expressed as follows:
F ( x ) = d x d t = x ( W 1 W ¯ ) = x ( 1 x ) [ y ( X + Z ) Z ]
G ( y ) = d y d t = y ( U 1 U ¯ ) = y ( 1 y ) [ x ( B + D ) D ]
In the two-dimensional plane formed by the point set, {(x, y)|0 < x < 1, 0 < y < 1}, 19 × 19 points are uniformly selected as the initial strategies in the system, and the numerical solution of the differential equations is obtained by using the ode45 function in MATLAB2016 software (MathWorks, Natick, MA, USA). Finally, the different strategies are obtained. The strategies’ evolutions of the grid company and user over time are shown in Figure 4.
The evolution of the integrated strategies of the grid company and the user can be obtained, as shown in Figure 5.
As shown in Figure 3 and Figure 5, in this case, points (0,0) and (1,1) are both ESS. The final evolutionary stable state of the system depends on the initial strategies of the players. When the initial strategy of the players is in regional OADCO, see Figure 3, with the evolution process, the power grid enterprises choosing not to adopt and the users choosing not to participate in the policy will become the final evolution result. When the initial strategy of the player is in the regional ADCBA, see Figure 3, with the evolution process, the grid enterprises choosing to adopt and the users choosing to participate in the policy will become the final evolution result.
Case 2: f 1 > f 3 ,   π 1 < π 4 , that is, f 1 > f 3 = f 4 > f 2 and π 2 = π 4 > π 1 > π 3 or π 2 = π 4 > π 3 > π 1 .
The evolution process of the power grid enterprises’ strategy is the same as in case 1, so no further discussion is repeated here. The evolution process is shown in Figure 6a.
Analysis of the evolution process of users’ strategy: Let t = π 4 π 3 π 1 π 3 .
(1) When π 2 = π 4 > π 1 > π 3 , t = π 4 π 3 π 1 π 3 > 1 does not exist. G ( 0 ) < 0 and G ( 1 ) > 0 , so y 1 = 0 is ESS, and y 2 = 1 is not ESS;
(2) When π 2 = π 4 > π 3 > π 1 , t = π 4 π 3 π 1 π 3 < 0 does not exist. G ( 0 ) < 0 and G ( 1 ) > 0 , so y 1 = 0 is ESS, and y 2 = 1 is not ESS.
Thus, the users will gradually evolve from choosing to participate in this policy to not choosing. The evolution process is shown in Figure 6b.
Then, the final evolution process of the power grid enterprises and users in this case can be obtained, as shown in Figure 6c.
The empirical data is introduced below to verify the evolution of this process. Let X = f 1 f 3 = 100 ; Y = π 1 π 4 = 100 ; Z = f 4 f 2 = 50 ; and W = π 4 π 3 = 50 . Then, same sampling and calculation method as in case 1 is used to solve the evolution process of the strategies of the grid company and user with time under different initial strategies, as shown in Figure 7.
The evolution of the integrated strategies of the grid company and the user can be obtained, as shown in Figure 8.
As shown in Figure 6 and Figure 8, in this case, point (0, 0) is ESS. With the evolution process, the power grid enterprises choosing not to adopt and the users choosing not to participate in the policy will become the final evolution result.
Case 3: f1 < f3, π1 > π4, that is, π1 > π2 = π4 > π3 and f 3 = f 4 > f 1 > f 2 or f 3 = f 4 > f 2 > f 1 .
Analysis of the evolution process of power grid enterprises’ strategy: Let k = f 4 f 2 f 1 f 2 .
(1) When f 3 = f 4 > f 1 > f 2 , k = f 4 f 2 f 1 f 2 > 1 does not exist. F ( 0 ) < 0 and F ( 1 ) > 0 , so x 1 = 0 is ESS, and x 2 = 1 is not ESS.
(2) When f 3 = f 4 > f 2 > f 1 , k = f 4 f 2 f 1 f 2 < 0 does not exist. F ( 0 ) < 0 and F ( 1 ) > 0 , so x 1 = 0 is ESS, and x 2 = 1 is not ESS.
Thus, the power grid enterprises will gradually evolve from choosing to adopt this policy to not choosing. The evolution process is shown in Figure 9a.
The evolution process of the users’ strategy is the same as in Case 1, so no further discussion is repeated here. The evolution process is shown in Figure 9b.
Then, the final evolution process of the power grid enterprises and users in this case can be obtained, as shown in Figure 9c.
The empirical data is introduced below to verify the evolution of this process. Let X = f 1 f 3 = 100 ; Y = π 1 π 4 = 100 ; Z = f 4 f 2 = 50 ; and W = π 4 π 3 = 50 . Then, the same sampling and calculation method as in Case 1 is used to solve the evolution process of the strategies of the grid company and user with time under different initial strategies, as shown in Figure 10.
The evolution of the integrated strategies of the grid company and the user can be obtained, as shown in Figure 11.
As shown in Figure 9 and Figure 11, in this case, point (0,0) is ESS. With the evolution process, the power grid enterprises choosing not to adopt and the users choosing not to participate in the policy will become the final evolution result.
Case 4: f 1 < f 3 ,   π 1 < π 4 , that is, f 3 = f 4 > f 1 > f 2 or f 3 = f 4 > f 2 > f 1 and π 2 = π 4 > π 1 > π 3 or π 2 = π 4 > π 3 > π 1 .
The evolution process of the power grid enterprises’ strategy is the same as in Case 3, and the evolution process is shown in Figure 12a. The evolution process of the users’ strategy is the same as that of Case 2, and the evolution process is shown in Figure 12b. Then, the final evolution process of the power grid enterprises and users in this case can be obtained, as shown in Figure 12c.
The empirical data is introduced below to verify the evolution of this process. Let X = f 1 f 3 = 100 ; Y = π 1 π 4 = 100 ; Z = f 4 f 2 = 50 ; and W = π 4 π 3 = 50 . Then, the same sampling and calculation method as in case 1 is used to solve the evolution process of the strategies of the grid company and user with time under different initial strategies, as shown in Figure 13.
The evolution of the integrated strategies of the grid company and the user can be obtained, as shown in Figure 14.
As shown in Figure 12 and Figure 14, in this case, point (0,0) is ESS. With the evolution process, the power grid enterprises choosing not to adopt and the users choosing not to participate in the policy will become the final evolution result.

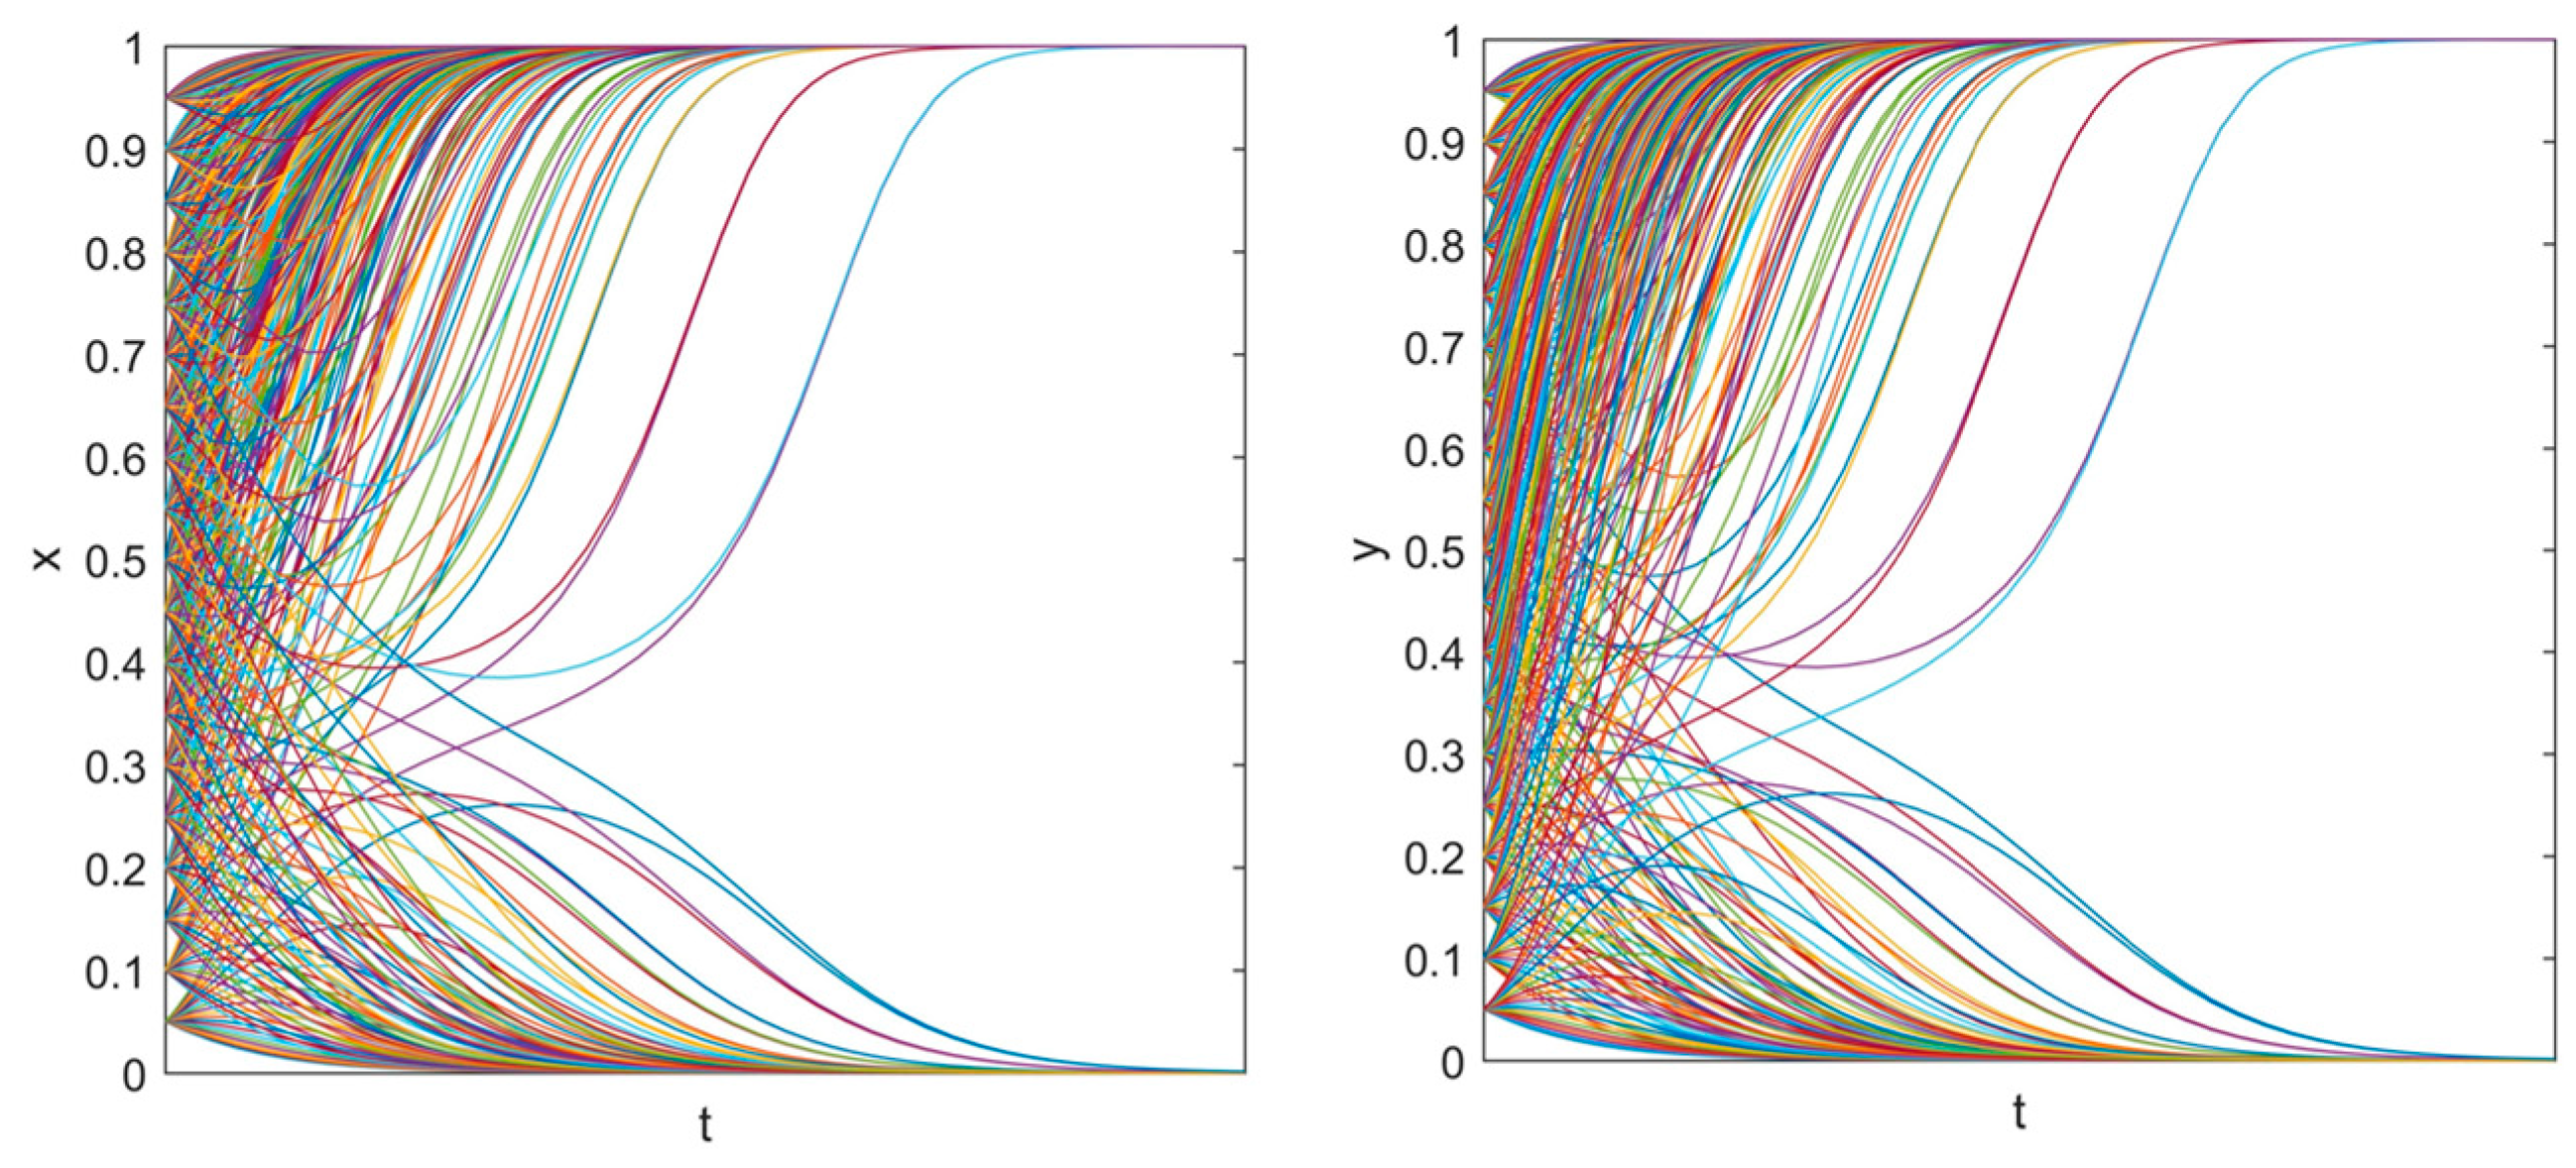
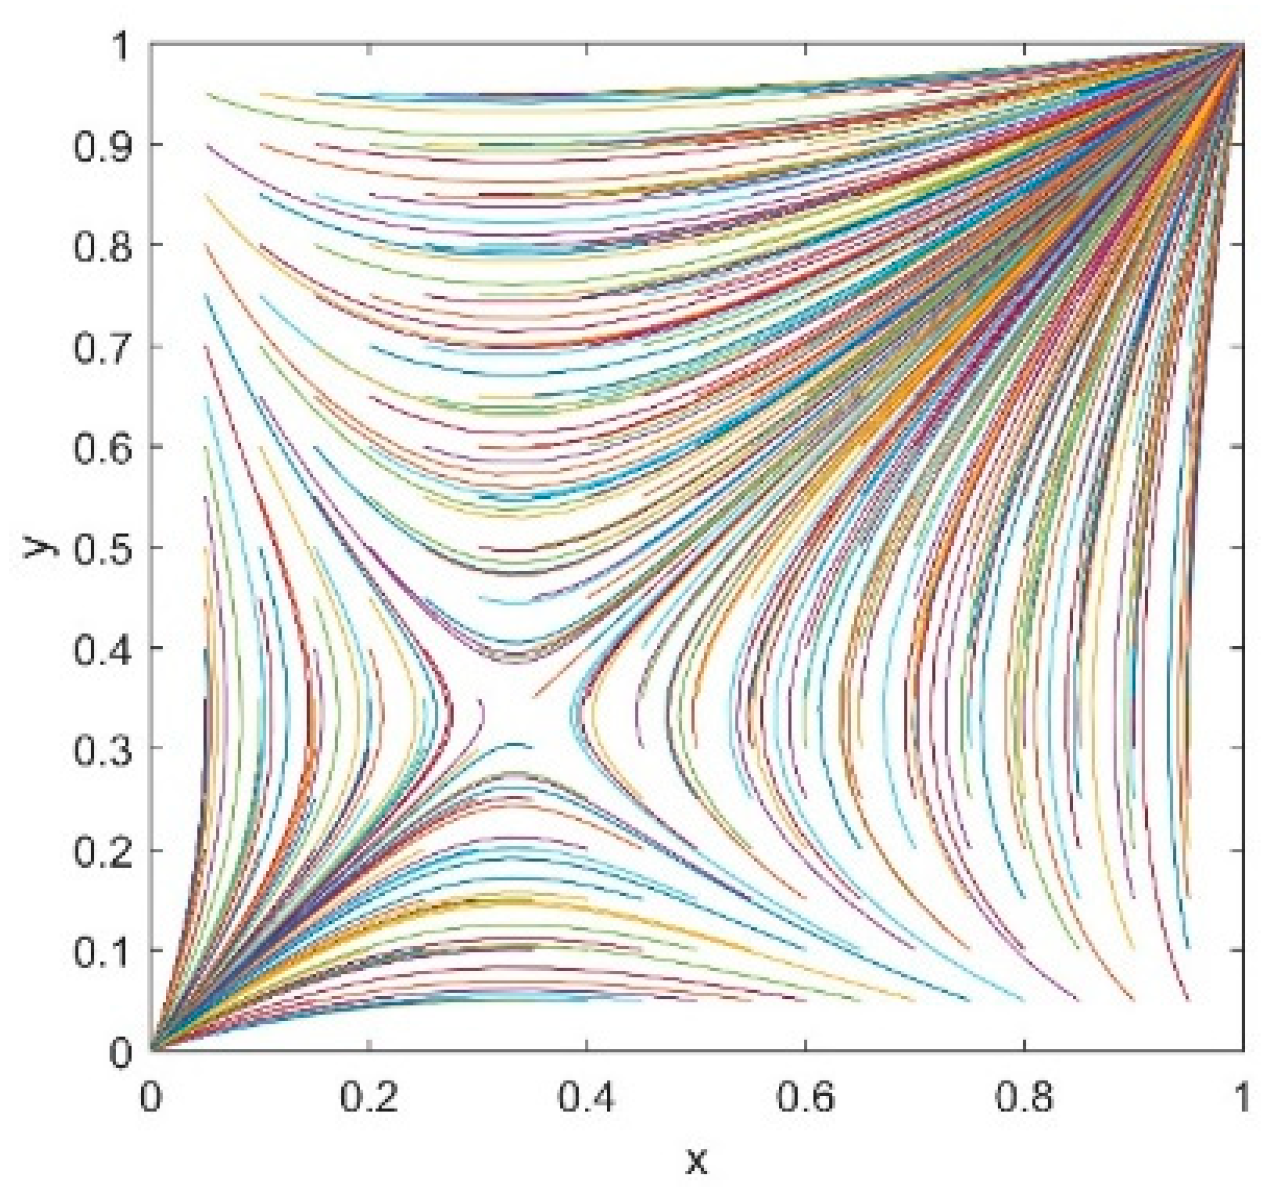
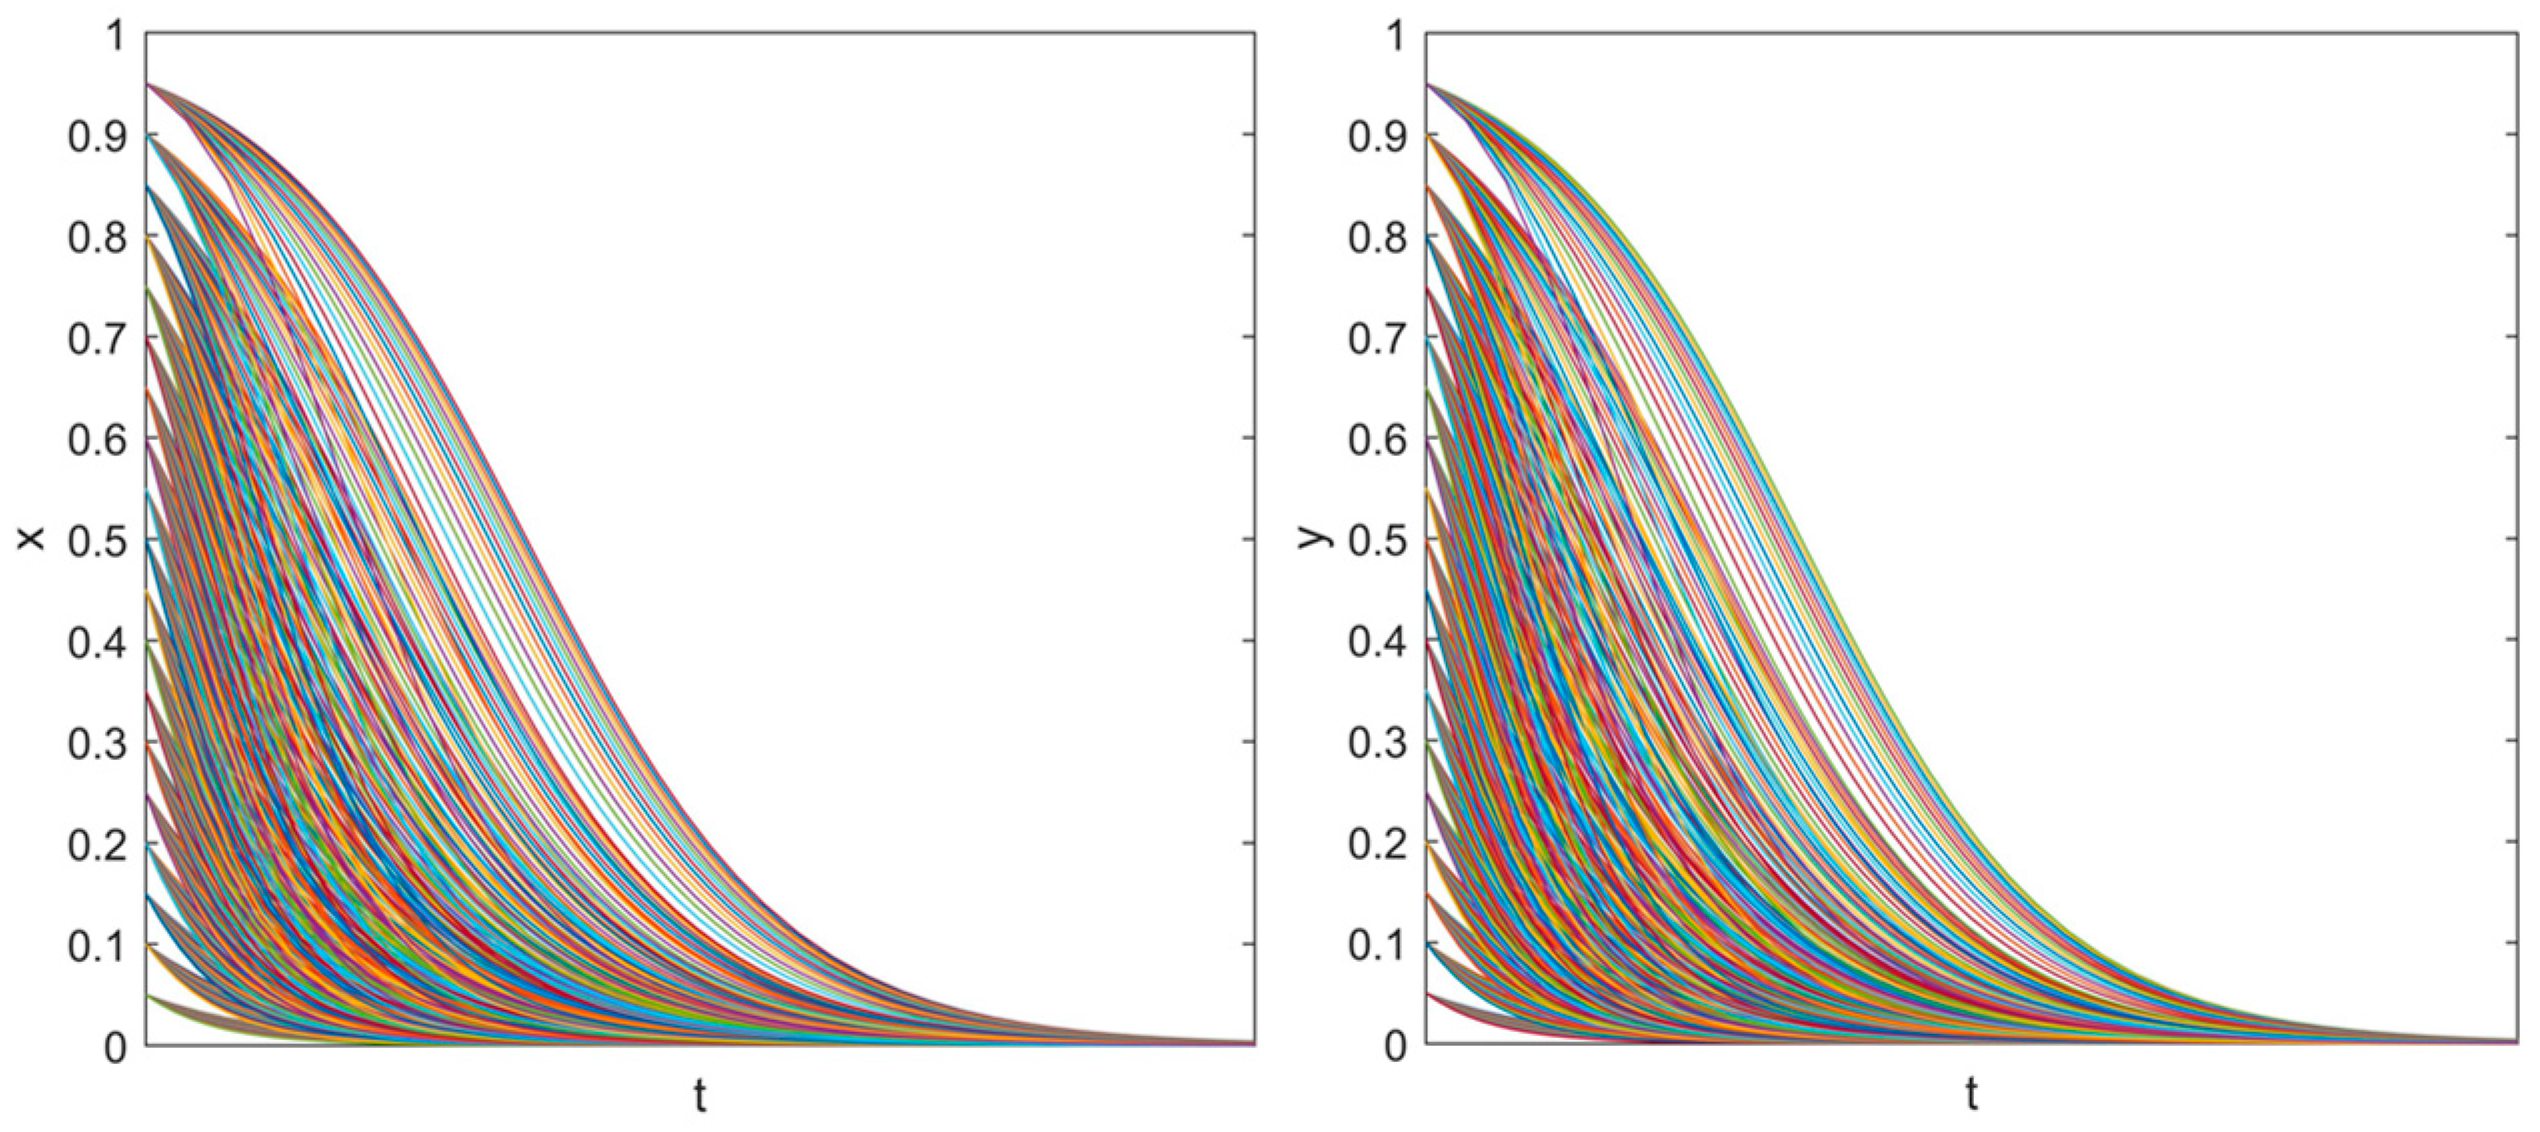
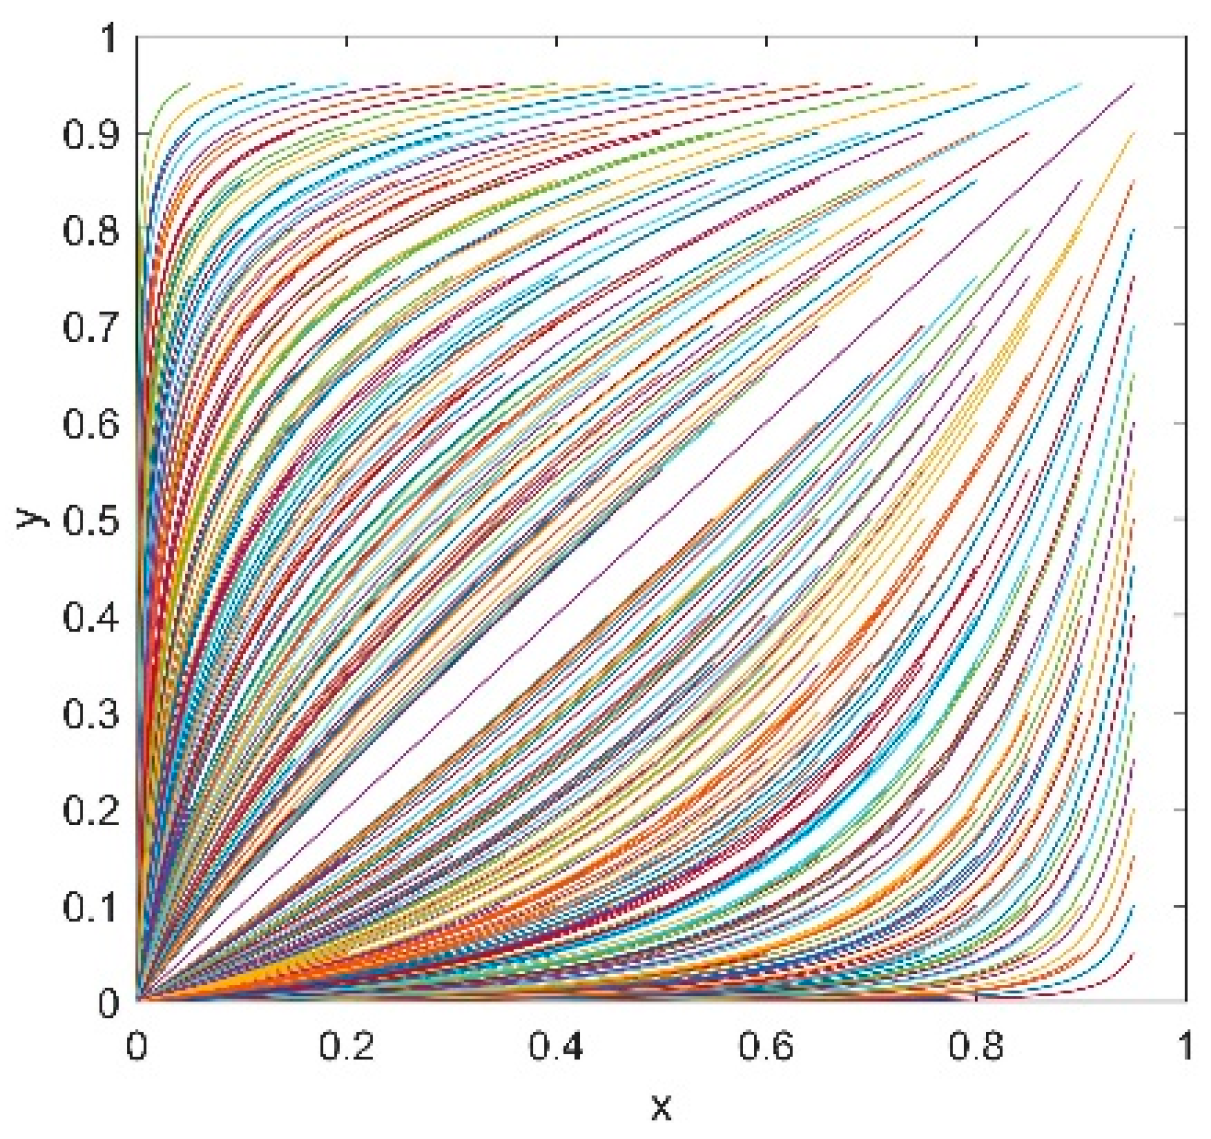
3.3.5. Application Analysis of the “Incremental Electricity Price” Policy

Through the above analysis, we can obtain the following conclusions: (1) the “incremental electricity price” policy is feasible under certain conditions; (2) whether the policy is feasible depends on the inherent attributes of the power grid enterprises and users ( f 1 f 3 > 0 ,   π 1 π 4 > 0 ); and (3) whether the policy is feasible depends on the initial strategies of power grid enterprises and users.
From the results of the empirical data analysis of Case 1, a very important factor for the successful implementation of this policy is the initial strategies of grid companies and users. When the policy is implemented, if more grid companies are willing to adopt the policy and more users choose to participate in the policy, the initial strategies of the player is in the ADCBA area, and the possibility of successful implementation of the policy will become greater. To this end, before the formal implementation of the policy, government departments need to strengthen the promotion of the policy, understand the electricity demand of users in the area under their jurisdiction, and grasp in advance the intention of the grid enterprises and users to adopt the policy. When a sufficient number of users and grid companies in the area under their jurisdiction are willing to adopt this policy, the implementation of this policy can effectively improve the possibility of successful implementation of the policy.
The “incremental electricity price” policy proposed in this paper is a supplementary policy mechanism aiming to resolve the problems the RPS policy may face at the present stage. On the one hand, its successful implementation (the evolutionary stability strategy is (1.1)) can further improve the RPS policy, so that RPS can fully play its role in solving the problems faced by China’s renewable energy development. On the other hand, if the policy fails, the evolutionary stability strategy is (0.0), which will not affect the implementation of the original RPS policy. In general, the introduction of “incremental electricity price” policy can effectively increase the possibility of successfully implementation of the RPS mechanism in China.

4. Conclusions

Taking the RPS policy as the research object, this paper explored the effectiveness, feasibility conditions, and possible problems of the RPS policy in promoting renewable energy consumption and alleviating the government’s pressure on renewable energy power generation subsidies by establishing a revenue function model. Then, aiming at resolving the possible problems in the implementation of the RPS policy, specific suggestions and an improvement scheme were proposed, and the possibility of implementing the improved scheme was verified by establishing an evolutionary game model. The specific research findings are as follows:
(1) The RPS mechanism in China is essentially a comprehensive implementation policy of FiT and RPS, and whether the new RPS mechanism is effective depends on whether the original FiT can effectively promote the development of renewable energy; that is, the original FiT policy can effectively promote the development of renewable energy and is the basic condition for the effectiveness of the RPS policy.
(2) Under the current RPS policy, there will be a phenomenon that the price of green certificates is too low, which may result in the RPS mechanism being ineffective in alleviating the pressure on government funding subsidies. Therefore, energy authorities should set a lower limit on the price of a green certificate transaction.
(3) Due to the characteristics of China’s energy structure, the implementation of the reform plan from FiT to RPS is facing great resistance. Based on this, the “incremental electricity price” policy proposed by this article from the demand side can improve the possibility of successful implementation of the RPS mechanism in China.
Although this paper has obtained some very meaningful conclusions through the study of China’s RPS policy, there are still limits.
(1) Use of the income function model to explore the validity, feasibility conditions, and possible problems of the RPS policy avoids the shortcomings of insufficient theoretical support of subjective research due to a lack of data. However, the best way to study the impact of policy reforms on renewable energy development is through the use of empirical data. After the RPS policy has been implemented in China for a period of time, our future study will focus on quantifying the impact of policy changes on the development of renewable energy power generation.
(2) We put forward policy recommendations for the problems that may be encountered in the RPS policy and designed the “incremental electricity price” supplementary policy to increase the possibility of successful implementation of RPS in China. However, as mentioned in the article, the setting of the green certificate lower limit price needs to consider many factors, which makes it difficult to set an appropriate value. In addition, in recent years, with the rapid development of the energy internet in China, implementation of the “incremental electricity price” policy based on the characteristics of users’ electricity usage has become possible. However, as stated in the article, the successful implementation of this policy can only occur under certain conditions, relying on the government’s early promotion of the policy and the intention of grid companies and users to adopt the policy.

Author Contributions

Methodology, L.S. and F.D.; validation, F.D. and L.S.; writing—original draft preparation, F.D., L.S., X.D., Y.L., and Y.S.

Funding

This research was funded by the Fundamental Research Funds for the Central Universities (No. 2019FR003) and the Social Science Foundation of Ministry of Education of China (No. 15YJA630011).

Acknowledgments

The authors would like to thank editors and reviewers for critically reviewing the manuscript.

Conflicts of Interest

The authors declare no conflict of interest.

Nomenclature

p r Feed-in-tariff of renewable energy power generation
p b Benchmark feed-in-tariff of local desulfurized coal unit power generation
p s , f Subsidized electricity price for renewable energy power generation under the FiT policy
p g Average price of green certificates transactions between power generation companies and grid companies
p s , r Average subsidized electricity price for renewable energy power generation under the RPS policy
π p Revenue of power generation company
p f Average feed-in tariff of fossil energy power
p r Average feed-in tariff of renewable energy power and p r = p b + p s , r + p g
C f , g Average unit power generation cost of fossil energy
C r , m Average unit management cost of renewable energy
C r , g Average unit power generation cost of renewable energy
C r , m Average unit management cost of renewable energy
π n Revenue of the power grid companies
p s Average selling price of the power grid enterprises to the consumers
C n , m , r Average operation and maintenance cost of unit renewable energy power transmission
C n , m , f Average operation and maintenance cost of unit fossil energy power transmission
ARenewable energy power generation quota target undertaken by the power grid enterprises ( 0 A 1 )
p p Average unit penalty price
p e Average environmental income obtained by the governments for unit renewable energy power generation
p g Average price of green certificate transactions between grid companies and users

References

  1. Tvaronavičienė, M.; Prakapienė, D.; Garškaitė-Milvydienė, K.; Prakapas, R.; Nawrot, Ł. Energy efficiency in the long run in the selected European countries. Econ. Sociol. 2018, 11, 245–254. [Google Scholar] [CrossRef] [PubMed]
  2. Kharlamova, G.; Nate, S.; Chernyak, O. Renewable energy and security for Ukraine: Challenge or smart way. J. Int. Stud. 2016, 9, 88–115. [Google Scholar] [CrossRef] [PubMed]
  3. Kasperowicz, R.; Pinczyński, M.; Khabdullin, A. Modeling the power of renewable energy sources in the context of classical electricity system transformation. J. Int. Stud. 2017, 10, 264–272. [Google Scholar] [CrossRef]
  4. Dong, F.; Shi, L. Design and Simulation of Renewable Portfolio Standard and Tradable Green Certification Mechanism. Autom. Electr. Power Syst 2019, 1–9. [Google Scholar] [CrossRef]
  5. Fang, D.B.; Zhao, C.Y.; Yu, Q. Government regulation of renewable energy generation and transmission in China’s electricity market. Renew. Sustain. Energy Rev. 2018, 93, 775–793. [Google Scholar] [CrossRef]
  6. Yu, L.; Zhu, S.; Lianyong, F.; Hao, Y. Comparison and Enlightenment of FIT and RPS for Renewable Energy. Sino-Glob. Energy 2018, 23, 13–20. [Google Scholar]
  7. Upton, G.B.; Snyder, B.F. Renewable energy potential and adoption of renewable portfolio standards. Util. Policy 2015, 36, 67–70. [Google Scholar] [CrossRef]
  8. Zhao, W.H.; Bao, X.J.T.; Yuan, G.H.; Wang, X.M.; Bao, H.B. The Equilibrium Model for the Coexistence of Renewable Portfolio Standards and Emissions Trading: The Supply Chain Analysis. Energies 2019, 12, 439. [Google Scholar] [CrossRef]
  9. Li, W.; Lu, C.; Zhang, Y.W. Prospective exploration of future renewable portfolio standard schemes in China via a multi-sector CGE model. Energy Policy 2019, 128, 45–56. [Google Scholar] [CrossRef]
  10. Bao, X.J.T.; Zhao, W.H.; Wang, X.M.; Tan, Z.F. Impact of policy mix concerning renewable portfolio standards and emissions trading on electricity market. Renew. Energy 2019, 135, 761–774. [Google Scholar] [CrossRef]
  11. Alizada, K. Rethinking the diffusion of renewable energy policies: A global assessment of feed-in tariffs and renewable portfolio standards. Energy Res. Soc. Sci. 2018, 44, 346–361. [Google Scholar] [CrossRef]
  12. Anguelov, N.; Dooley, W.F. Renewable Portfolio Standards and Policy Stringency: An Assessment of Implementation and Outcomes. Rev. Policy Res. 2019, 36, 195–216. [Google Scholar] [CrossRef]
  13. Carley, S.; Davies, L.L.; Spence, D.B.; Zirogiannis, N. Empirical evaluation of the stringency and design of renewable portfolio standards. Nat. Energy 2018, 3, 754–763. [Google Scholar] [CrossRef]
  14. Park, H.; Kim, C. Do Shifts in Renewable Energy Operation Policy Affect Efficiency: Korea’s Shift from FIT to RPS and Its Results. Sustainability 2018, 10, 1723. [Google Scholar] [CrossRef]
  15. Kwon, T.H. Policy synergy or conflict for renewable energy support: Case of RPS and auction in South Korea. Energy Policy 2018, 123, 443–449. [Google Scholar] [CrossRef]
  16. Dong, Y.L.; Shimada, K. Evolution from the renewable portfolio standards to feed-in tariff for the deployment of renewable energy in Japan. Renew. Energy 2017, 107, 590–596. [Google Scholar] [CrossRef]
  17. Yin, H.T.; Powers, N. Do state renewable portfolio standards promote in-state renewable generation? Energy Policy 2010, 38, 1140–1149. [Google Scholar] [CrossRef]
  18. Zhao, E.; Liu, P. Policy Effects of Feed-in Tariff and Tradable Green Certificate—Based on the Development of Biomass Power Industry in China. Ind. Technol. Econ. 2013, 9, 125–137. [Google Scholar] [CrossRef]
  19. Wang, T.; Gong, Y.; Jiang, C.W. A review on promoting share of renewable energy by green-trading mechanisms in power system. Renew. Sustain. Energy Rev. 2014, 40, 923–929. [Google Scholar] [CrossRef]
  20. Qian, Z. Research on Optimization Model of Generation Expansion Planning in Low-Carbon Economy with the Complementary Mode of RFS and FIT; North China Electric Power University: Beijing, China, 2017. [Google Scholar]
  21. Choi, G.; Huh, S.Y.; Heo, E.; Lee, C.Y. Prices versus quantities: Comparing economic efficiency of feed-in tariff and renewable portfolio standard in promoting renewable electricity generation. Energy Policy 2018, 113, 239–248. [Google Scholar] [CrossRef]
  22. Sun, P.; Nie, P.Y. A comparative study of feed-in tariff and renewable portfolio standard policy in renewable energy industry. Renew. Energy 2015, 74, 255–262. [Google Scholar] [CrossRef]
  23. Dongming, R. China’s Renewable Portfolio Standards and Implementing Countermeasures. Autom. Electr. Power Syst. 2011, 35, 25–28. [Google Scholar]
  24. Zhao, X.G.; Liang, J.; Ren, L.Z.; Zhang, Y.Z.; Xu, J. Top-level Institutional Design for the Energy Low-carbon Transition: Renewable Portfolio Standards. Power Syst. Technol. 2018, 42, 1164–1169. [Google Scholar]
  25. Feng, Y.; Liu, Q.; Liu, Y.; Wang, S. Touching Fault Analysis and Clearing Action Strategy for AC/DC Crossed Transmission Lines. Autom. Electr. Power Syst. 2017, 41, 137–141. [Google Scholar]
  26. Zhao, W.; Gao, J.; Yu, J.; Song, Y. Generation rights trade model with carbon trading and green certificate trading mechanisms. Renew. Energy Resour. 2016, 34, 1129–1137. [Google Scholar]
  27. Jiacai, L.; Gong, C. International Experience and China Renewable Portfolio Standard (RPS) Design. Pac. J. 2008, 10, 44–51. [Google Scholar] [CrossRef]
  28. Zhao, X.G.; Ren, L.Z.; Zhang, Y.Z.; Wan, G. Evolutionary game analysis on the behavior strategies of power producers in renewable portfolio standard. Energy 2018, 162, 505–516. [Google Scholar] [CrossRef]
  29. Zuo, Y.; Zhao, X.G.; Zhang, Y.Z.; Zhou, Y. From feed-in tariff to renewable portfolio standards: An evolutionary game theory perspective. J. Clean. Prod. 2019, 213, 1274–1289. [Google Scholar] [CrossRef]
  30. Zhang, Q.; Wang, G.; Li, Y.; Li, H.L.; McLellan, B.; Chen, S.Y. Substitution effect of renewable portfolio standards and renewable energy certificate trading for feed-in tariff. Appl. Energy 2018, 227, 426–435. [Google Scholar] [CrossRef]
  31. Wang, B.; Wei, Y.M.; Yuan, X.C. Possible design with equity and responsibility in China’s renewable portfolio standards. Appl. Energy 2018, 232, 685–694. [Google Scholar] [CrossRef]
  32. Ye, W. Analysis and Suggestion on Electricity Pricing Mechanism of Renewable Energy in China. Water Power 2018, 44, 81–84. [Google Scholar]
  33. Liu, S.Y.; Bie, Z.H.; Lin, J.; Wang, X.F. Curtailment of renewable energy in Northwest China and market-based solutions. Energy Policy 2018, 123, 494–502. [Google Scholar] [CrossRef]
  34. Li, W.; Liu, L.G.; Zhang, S.; Zhang, H.Z. Will the tradable green certifications and renewable portfolio standard policy work well in China: A recursive CGE analysis. J. Renew. Sustain. Energy 2018, 10, 055904. [Google Scholar] [CrossRef]
  35. Wind. Available online: http://www.wind.com.cn/ (accessed on 3 May 2018).
  36. China’s Current Renewable Energy Subsidy Policy and Benchmarking Feed-in Tariff. Available online: http://www.china-nengyuan.com/news/120495.html (accessed on 20 May 2018).
  37. Huang, S.; Yu, K.; Jia, J. Evolutionary Game Analysis of IPO Pricing in Book-Building. Chin. J. Manag. Sci. 2018, 26, 78–89. [Google Scholar] [CrossRef]
  38. Wang, L.; Zheng, J. Research on low-carbon diffusion considering the game among enterprises in the complex network context. J. Clean. Prod. 2019, 210, 1–11. [Google Scholar] [CrossRef]
  39. Cui, H.; Zhao, T.; Wu, R. CO2 emissions from China’s power industry: Policy implications from both macro and micro perspectives. J. Clean. Prod. 2018, 200, 746–755. [Google Scholar] [CrossRef]
  40. Ye, Z.; Wu, Y.; Li, C.; You, P. The Design and Implementation of Electricity Universal Service Tariffs Policy in China. Price Theory Pract. 2017, 9, 20–25. [Google Scholar]
  41. Liu, Z.; Zhu, P.; Li, X. Optimization and Effect Evaluation of Increasing Block Pricing—Based on the Perspective of Personal Carbon Trading. Res. Econ. Manag. 2018, 39, 108–122. [Google Scholar] [CrossRef]
  42. Liu, S.; Ye, Z. China’s Sales Side Time-of-Use Electricity Price Policy Implementation Experience and Enlightenment. Price Theory Pract. 2014, 6, 40–41, 64. [Google Scholar]
  43. Hofbauer, J.; Schuster, P.; Sigmund, K. A note on evolutionary stable strategies and game dynamics. J. Biol. 1979, 81, 609–612. [Google Scholar] [CrossRef] [Green Version]
Figure 1. Flowchart of the research. RPS: renewable portfolio standard.
Energies 12 02147 g001
Figure 2. The “incremental electricity price” standard.
Energies 12 02147 g002
Figure 3. Analysis of the evolution process in Case 1. (a) Power grid companies; (b) users; and (c) power grid companies and users.
Energies 12 02147 g003
Figure 4. Strategies’ evolutions of the grid company and user over time in Case 1.
Energies 12 02147 g004
Figure 5. Evolution of the integrated strategy in Case 1.
Energies 12 02147 g005
Figure 6. Analysis of the evolution process in Case 2. (a) Power grid companies; (b) users; and (c) power grid companies and users.
Energies 12 02147 g006
Figure 7. Strategies’ evolutions of the grid company and user over time in Case 2.
Energies 12 02147 g007
Figure 8. Evolution of the integrated strategy in Case 2.
Energies 12 02147 g008
Figure 9. Analysis of the evolution process in Case 3. (a) Power grid companies; (b) users; and (c) power grid companies and users.
Energies 12 02147 g009
Figure 10. Strategies’ evolutions of the grid company and user over time in Case 3.
Energies 12 02147 g010
Figure 11. Evolution of the integrated strategy in Case 3.
Energies 12 02147 g011
Figure 12. Analysis of the evolution process in Case 4. (a) Power grid companies; (b) users; and (c) power grid companies and users.
Energies 12 02147 g012
Figure 13. Strategies’ evolutions of the grid company and user over time in Case 4.
Energies 12 02147 g013
Figure 14. Evolution of the integrated strategy in Case 4.
Energies 12 02147 g014
Table 1. Application of wind power in some provinces, data sourced from [35].
ProvinceInstalled Capacity (GW)Generation Ratio (%)Ratio of Installed Capacity (%)Abandoned Wind Rate (in the First Quarter of 2018) (%)
Hebei12.169.318.22.6
Inner Mongolia27.3711.623.021.3
Heilongjiang5.7011.219.38.5
Gansu12.8216.026.319.5
Ningxia9.7611.222.82.5
Xinjiang18.0610.121.321.6
Table 2. The feed-in tariff of wind power and photovoltaic, data sourced from [36].
Power Generation CategoriesResource Area Categories2014 (RMB/kWh)2015 (RMB/kWh)2016 (RMB/kWh)2017 (RMB/kWh)2018 (RMB/kWh)
WindCategory I0.510.490.470.470.44
Category II0.540.520.500.500.47
Category III0.580.560.540.540.51
Category IV0.610.610.600.600.58
PhotoelectricCategory I0.900.900.800.650.55
Category II0.950.950.880.750.65
Category III1.001.000.980.850.75
Table 3. Payoff matrix.
Payoff of PlayersUsers
Participating in (y)Not Participating in (1 − y)
Power grid companiesAdopting (x)f1, π1f2, π2
Not adopting (1 − x)f3, π3f4, π4

