Article

A New Model to Simulate Local Market Power in a Multi-Area Electricity Market: Application to the European Case †

Institute for Research in Technology (IIT), ICAI School of Engineering, Comillas Pontifical University, 28015 Madrid, Spain
*
Author to whom correspondence should be addressed.
This paper is an extended version of our paper published in 2017 14th International Conference on the European Energy Market (EEM) on 6–9 June 2017 in Dresden, Germany.
Energies 2019, 12(11), 2068; https://doi.org/10.3390/en12112068
Submission received: 11 April 2019 / Revised: 13 May 2019 / Accepted: 28 May 2019 / Published: 30 May 2019
(This article belongs to the Special Issue Development and Implementation of Models of Electricity Market 2019)

Abstract

:
The work presented in this article proposes an original method that models the medium-term market equilibrium under imperfect competition circumstances in multi-area electricity systems. It provides a system analysis considering multiple market splitting possibilities, where local market power may appear according to the status of the interconnections. As a result of new policies and regulations, power systems are increasingly integrating the existing electricity markets in unified frameworks. The integration of electricity markets poses highly challenging tasks due to the uncertainty that comes from the agents’ strategic behaviors which depend on multiple factors, for instance, the state of the interconnections. When it comes to modeling these effects, the purpose is to identify each strategy by using conjectured-price responses that depend on the different states of the system. Consequently, the problem becomes highly combinatorial, which heightens its size as well as its complexity. Therefore, the purpose of this work’s methodology is the reduction of the possible network configurations so as to ensure a computational tractability in the problem. In order to validate this methodology, it has been put to the test in a realistic and full-scale two-year operation planning model of the European electricity market that consists of a group of nine countries.

1. Introduction

Throughout the previous decades, the energy sector has been through a profound liberalization. As a result, power exchanges have progressively become more popular in several studies and research works. Moreover, in light of new policies and regulations, power systems worldwide are evolving towards an integration of the existing electricity markets under a unified framework. Consequently, economic inefficiencies and the market concentration are expected to decrease. Furthermore, other aspects of high interest include the improvement of security of supply and the resulting reserve capacity reduction [1,2,3,4]. However, all of these advantages require the coordination of all the involved market regulators and agents, with an adequate interconnection along with a robust and effective method to clear congestion.
In this regard, cross-border exchanges play a significant role when it comes to market integration. Furthermore, the system operation is further limited by network constraints. Transmission capacity restrictions may cause market segregation, which in turn may allow market participants to exercise local market power. Consequently, the competition is reduced while electricity prices rise [5,6].
In these circumstances, models that faithfully simulate electricity market outcomes are of vital importance for market regulators and participants. Traditionally, one of the well-recognized methods that analyze generator competition in power exchanges is based on ascertaining the market equilibrium. This equilibrium is defined as a set of prices, power outputs, transmission line power flows, and cleared demand that optimizes each participant’s profits while clearing the market [7,8]. Market equilibrium methods model the market behavior, considering all relevant participants, which makes them the most adequate procedure for a market power analysis, at least in the medium- to long-term time scopes.
Focusing on the strategic interactions between market agents, there are different approaches according to the type of game they represent. Within the Cournot-based equilibria, each company tries to maximize its profits assuming that its production does not affect the decisions of the competitors [9,10,11,12,13]. Meanwhile, a Stackelberg game represents interactions between large and small companies over quantities of products [14]. It is usually used with oligopolies with one or two large dominant companies [15]. Moreover, the Supply Function Equilibrium (SFE) represents companies that compete in supply functions with different prices for different quantities. It is formulated with a set of differential equations instead of the usual algebraic ones for Cournot. This approach has the drawback of being complex and time consuming, which makes it difficult to apply in large power systems. Finally, under the Conjectural Variations-based approach (CV), companies form a conjecture about the reaction of their competitors at their own changes of quantities or price. In this way, the conjectures measure the interdependence among companies.
The results obtained from the classical concepts such as perfect or Cournot competition lack accuracy for the purposes of decision-making in the medium term. Instead, in the last decade, the conjectural variation approach has gained prominence and wide acceptance in the literature, as it allows for analyzing different degrees of competition. The problem of this approach remains in the difficulty of estimating the behavior of market agents (or the conjectures that characterize it).
The literature has proven that a considerable effort has been made by researchers in studying market equilibrium models and their application to real power systems. An extensive classification of market equilibrium models and their applications can be found in References [16,17].
With regard to power system models that comprise several areas, the literature is not that wide. Among the references found, both References [18] and [19] proposed a conjectured supply function (CSF) equilibrium model in an electricity market including network constraints. The authors in Reference [18] compare two different congestion mechanisms for clearing the market in cross-border transactions: market splitting and explicit auctions, analyzing the market power that market participants can exercise in each situation. In Reference [19], the analysis states that the conjectures of price response depend on the status of the networks, following a function of the congestion. Although the models are applied for the medium term, they only cover systems with two areas. Furthermore, the iterative algorithm they propose may result in convergence difficulties under certain circumstances in which reaching the equilibrium is not guaranteed. The same areas are also considered in Reference [20]: The work proposed a conjectural variation-based (CV) equilibrium model using Mixed Integer Programming (MIP) and applied to a two-area electricity system using a nodal-pricing mechanism for congestion. Another noteworthy work in this category is Reference [21]. The authors of this paper implemented a conjectured supply function equilibrium model (CSF) with network constraints in which they developed an endogenous approach to estimate the behavior of generators. This approach is applied to the Iberian electricity market in Reference [22] and to the system of the Electric Reliability Council of Texas (ERCOT) in Reference [23].
In the scarce literature on market models applied to several areas, other examples include References [24,25,26,27,28,29]. While most of the studies have created equilibrium market models, they are often restricted to few areas with simplified features.
To the best knowledge of the authors, none of the found references proposed a comprehensive, far-reaching framework that allows the strategic behavior of the market agents in a system with multiple areas for the medium term to be modeled efficiently and can be integrated in the normal operations of market agents and regulators.
Hence, this paper aims at providing a conjectural-variation-based market equilibrium model to simulate the local market power in a multi-area electricity system for a medium-term horizon. In particular, this model is applied to the European Internal Electricity Market (IEM) and integrates the electricity markets already existing in the European countries, incorporating an accurate representation of the technical and economical characteristics of the system.
The main contributions are outlined below:
  • The article proposes a model that allows the market equilibrium in a multi-area electricity system under non-perfect competition to be computed efficiently.
  • An original methodology is implemented. It makes use of an original clustering algorithm, developed to extract the representative network configurations using hourly prices for each area in the system.
  • The proposed model is applied into a real-size European case, which consists of the Central Western European (CWE) and Iberian electricity markets.
These contributions represent an extension of a previous work of the authors [30], presented in the 2017 14th International Conference on the European Energy Market (EEM) in Dreden, Germany. With respect to the conference paper, the proposed methodology in this article introduces methodological improvements, particularly in dealing with the representation of the network configurations. The most noteworthy of these improvements is the addition of new intelligent data analysis techniques: A novel clustering and classification methods are implemented. Furthermore, the proposed methodology also incorporates changes in the formulation of the optimization problem to take into account that market power can be represented simultaneously by a price spread increment and a conjectured-price response. Lastly, a more detailed analysis of the case study has been carried out to illustrate the effectiveness of this new approach.
The remainder of the paper is structured as follows: Section 2 describes the proposed market equilibrium model and the methodology for tackling this problem. Meanwhile, Section 3 analyzes the application of the presented methodology to the case study presented as well as the results obtained. Finally, a summary of the conclusions and future work planning is provided in Section 4.

2. Methodology

2.1. Market Equilibrium Model

In this paper, a comprehensive fundamental electricity market model based on conjectural variations is developed. This model represents the core around which the proposed methodology is built. According to CV-based models, companies form a conjecture about the reaction of their competitors at their own changes of quantities or price. In this way, the interrelationships between companies are determined by the conjectures [31]. There has been numerous studies in the literature that investigate this approach, such as References [9,19,32,33]. They are characterized for the flexibility when analyzing different degrees of competition, from perfect competition to Cournot oligopoly. This is an important feature of CV-based models. Depending on the type of competition present in our systems, different values of conjectures can be calculated to reflect the reality in a reasonable way.
Guided by this approach and considering a multi-area electricity market to be non-perfect, different agents’ strategic behaviors could be observed depending on the state of interconnections. Congestion, for instance, can allow some market participants to gain market power in certain regions. In addition, the agents’ strategies may also be influenced by forecasts on renewable generation. Hence, the objective is to model the local market power from any market agent and their strategies under different situations with regard to the state of the interconnections. When modeling this effect, the intention is to characterize each strategy by means of a conjectured-price response or price spread increment as a function of the state of the network [34]. In this context, a conjectured-price response is defined as the variation of the price in an area’s electricity market relative to the production of a market agent in its area of influence, whereas a spread increment refers to a price increase applied to the market agent’s marginal cost function. Accordingly, a major effort must be devoted to estimating reasonable values of conjectures to reach realistic outcomes.
The remainder of this subsection focuses on a detailed description of the market equilibrium model. Hereafter, a is used to denote the different areas considered in the problem, p represents the set of periods of time comprising several system states, e denotes the market agents that participate in the system. and l is used to define the interconnections of the system. System states are groups of hours with similar characteristics within a period of time (e.g., weeks or months). They are further described in Section 2.2.
Parameters:
D a , p demand in area a in period p
C e , a , p cost function for agent e in area a in period p
S e , a , p price spread for agent e in area a in period p
θ e , a , a , p conjectured-price response for agent e in area a in period p, depending on agent e’s production in area a
H a , l matrix where a correspondence between areas and interconnections is defined as follows:
  • 1 if interconnection l starts in area a
  • −1 if interconnection l ends in area a
  • 0 if interconnection l does not correspond with area a
F l ¯ maximum power flow in interconnection l
P e , a ¯ maximum power produced by agent e in area a
F l ̲ minimum power flow in interconnection l
P e , a ̲ minimum power produced by agent e in area a
Decision variables:
P e , a , p power for agent e in area a in period p
f l , p power flow in interconnection l in period p
The reaction of the competitor’s strategies is modeled either by a conjectured-price response defined as a function of the supply or by assigning different price spread increments to each agent depending on the state of the interconnections. Both approaches can be used indistinctly for each market agent. Following this reasoning and generalizing the formulation to work under both perfect and non-perfect competition conditions, the market equilibrium problem can be written as the following equivalent quadratic optimization problem:
min P e , a , p , f l , p e , a , p C e , a , p ( P e , a , p ) + a θ e , a , a , p 2 P e , a , p P e , a , p + S e , a , p P e , a , p
subject to
e P e , a , p l H a , l f l , p = D a , p : λ a , p a , p
F l ̲ f l , p F l ¯ l , p
H ( P e , a , p ) 0 e , a , p
The price λ a , p is the dual variable of the demand balance in Equation (2) and can be stated as Equation (5) (if the duration of p is 1 h; otherwise, it should be divided by the duration of the system states).
λ a , p = C e , a , p P e , a , p P e , a , p + a θ e , a , a , p P e , a , p + S e , a , p e , a , p
The conjectured-price response θ e , a , a , p measures the market power of agent e in area a in period p. It represents the change in the electricity price λ a , p in area a with respect to the agent’s production P e , a , p in area a . It is defined as follows:
θ e , a , a , p = λ a , p P e , a , p e , a , a , p
Thus, if the interconnection between areas a and a is congested, these areas will be separated in terms of zonal electricity price, and in turn, the value of the conjecture θ e , a , a , p will be zero. It is also worth noting that the assumption of symmetry in the conjectures has been made in this formulation. Hence, θ e , a , a , p = θ e , a , a , p , e , a , a , p .
Equation (4) represents all the technical characteristics of the considered systems, such as the technical constraints of the operation of all thermal and hydro units (variable costs, emission limits, maximum and minimum power, efficiency, etc.). A short version of the main constraints formulated is shown in Reference [9,35,36].

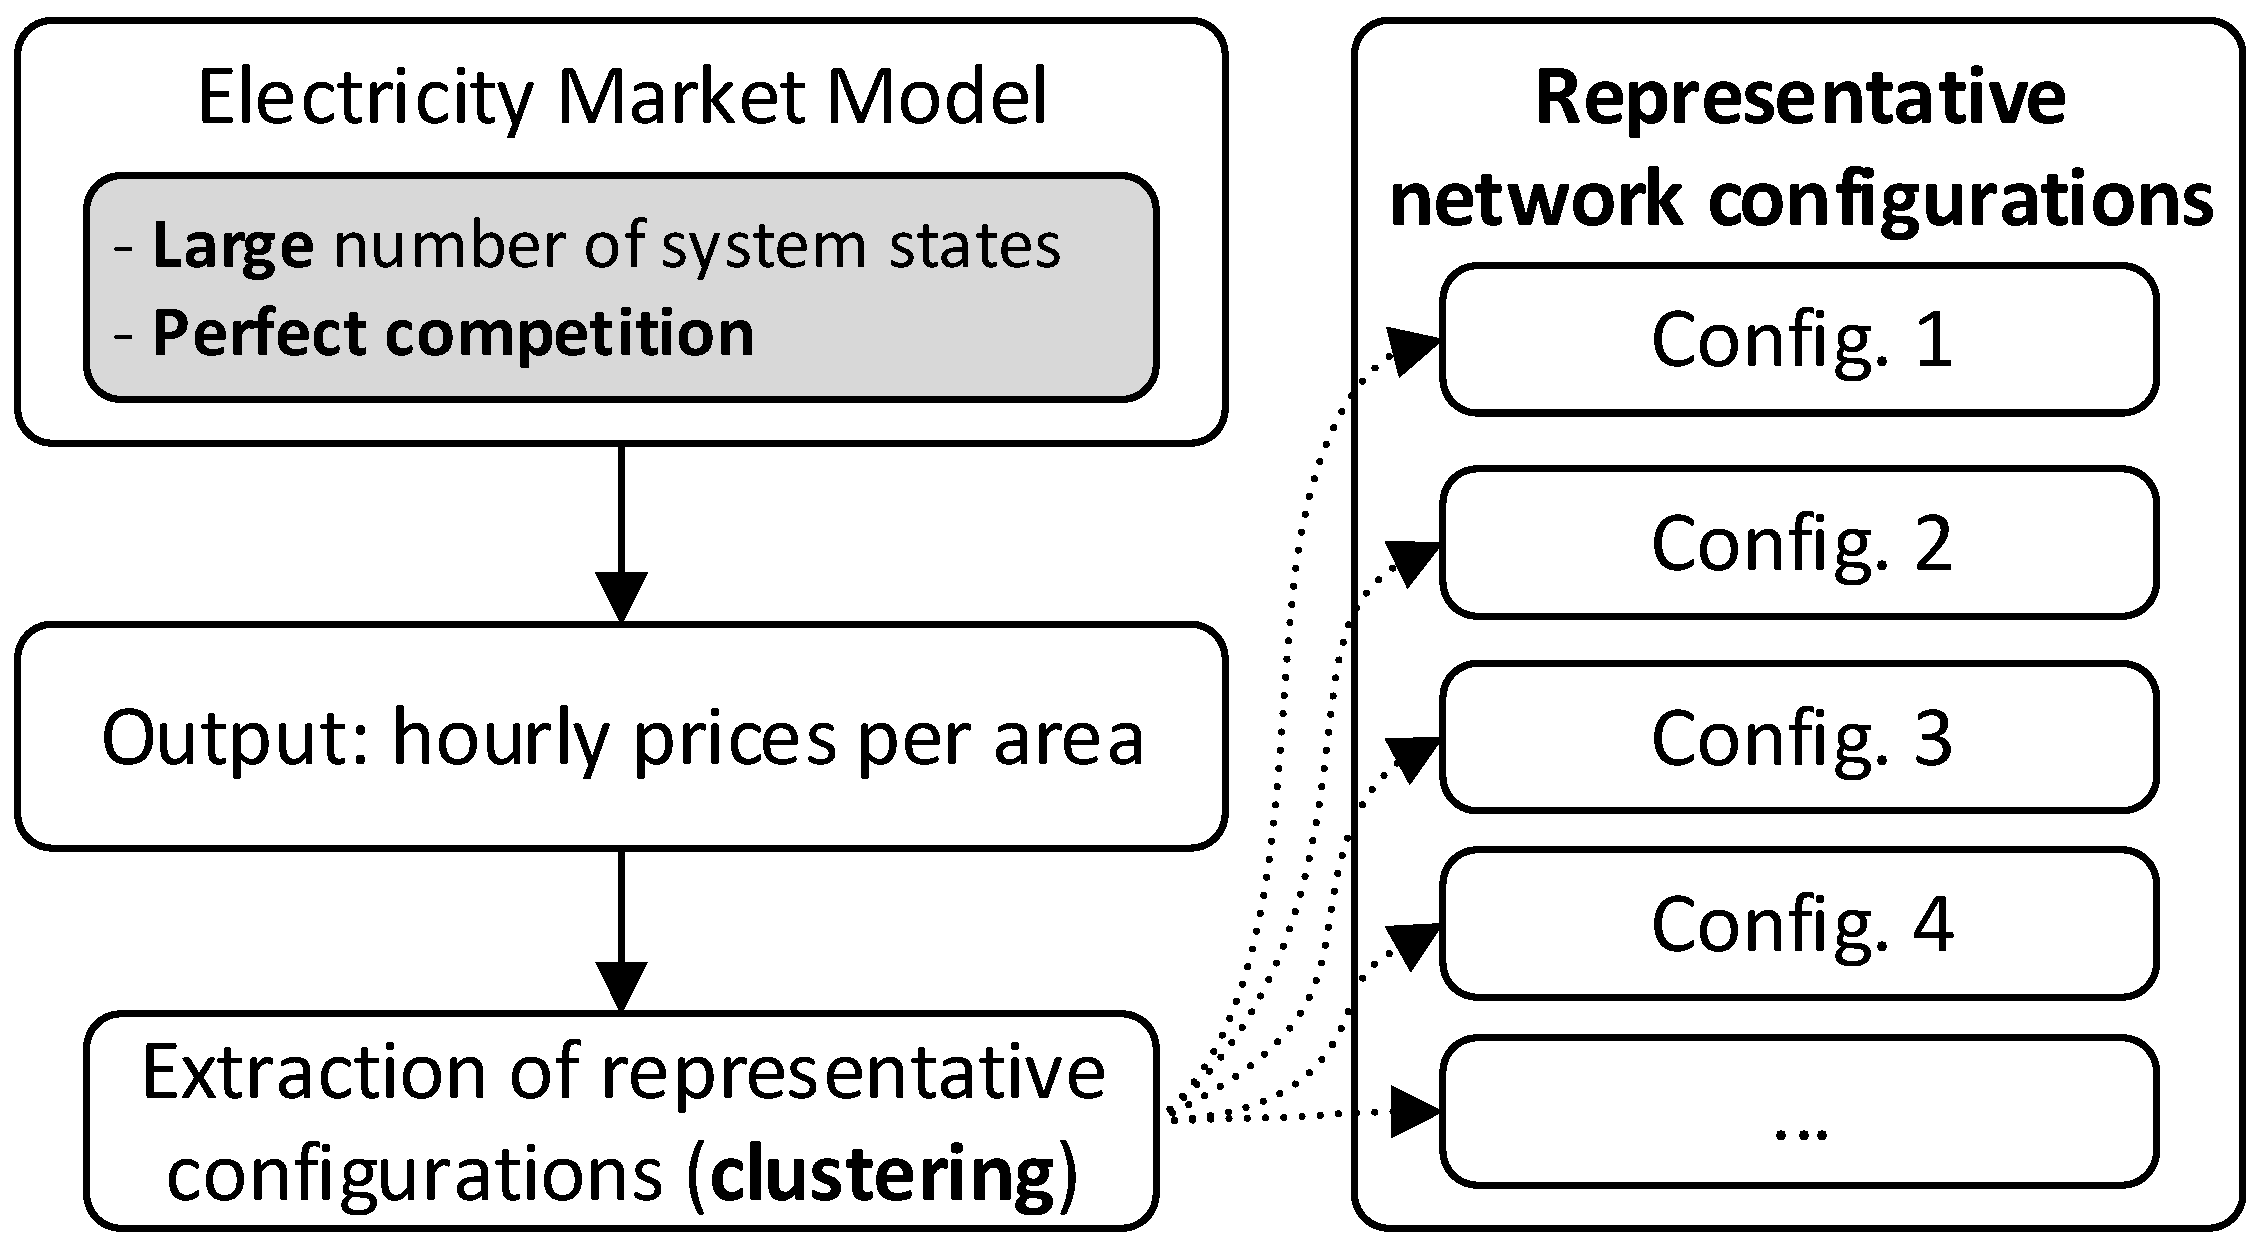
2.2. Network Configuration Reduction

In the region of Europe considered in this paper (details in Section 3), there are 13 interconnections between countries. In this situation, the possible number of states of the interconnections in terms of congestion (hereinafter referred to as network configurations) is 1060 cases (computed as the number of feasible partitions of the countries considered in terms of the existence of interconnections). Therefore, to make the proposed optimization model viable in the decision-making process for a multi-area market, it is decisive to implement an efficient methodology that reduces the huge number of possible network configurations and obtains the most usual states of the interconnections without a major loss of accuracy. For this matter, this study extends and improves significantly the methodology introduced in Reference [30].
As aforementioned, the procedure implemented in this paper relies on the medium-term equilibrium model developed in Section 2.1. Moreover, due to the large amount of data present in models of this size, problem reduction techniques are normally applied. In this case, a reduced number of system states is used, computed by grouping hours with similar characteristics within a period of time, to replace the traditional load levels. This framework, introduced in Reference [37], allows for faster execution times without an important accuracy loss and incorporates the chronological information between time slots. Hereafter, in order to make the methodology clearer and to avoid confusion, we will use the term “hourly prices” to refer to the prices per group of hours or prices per system state and period indistinctly.
The proposed methodology can be summarized in the following steps:
Step 1
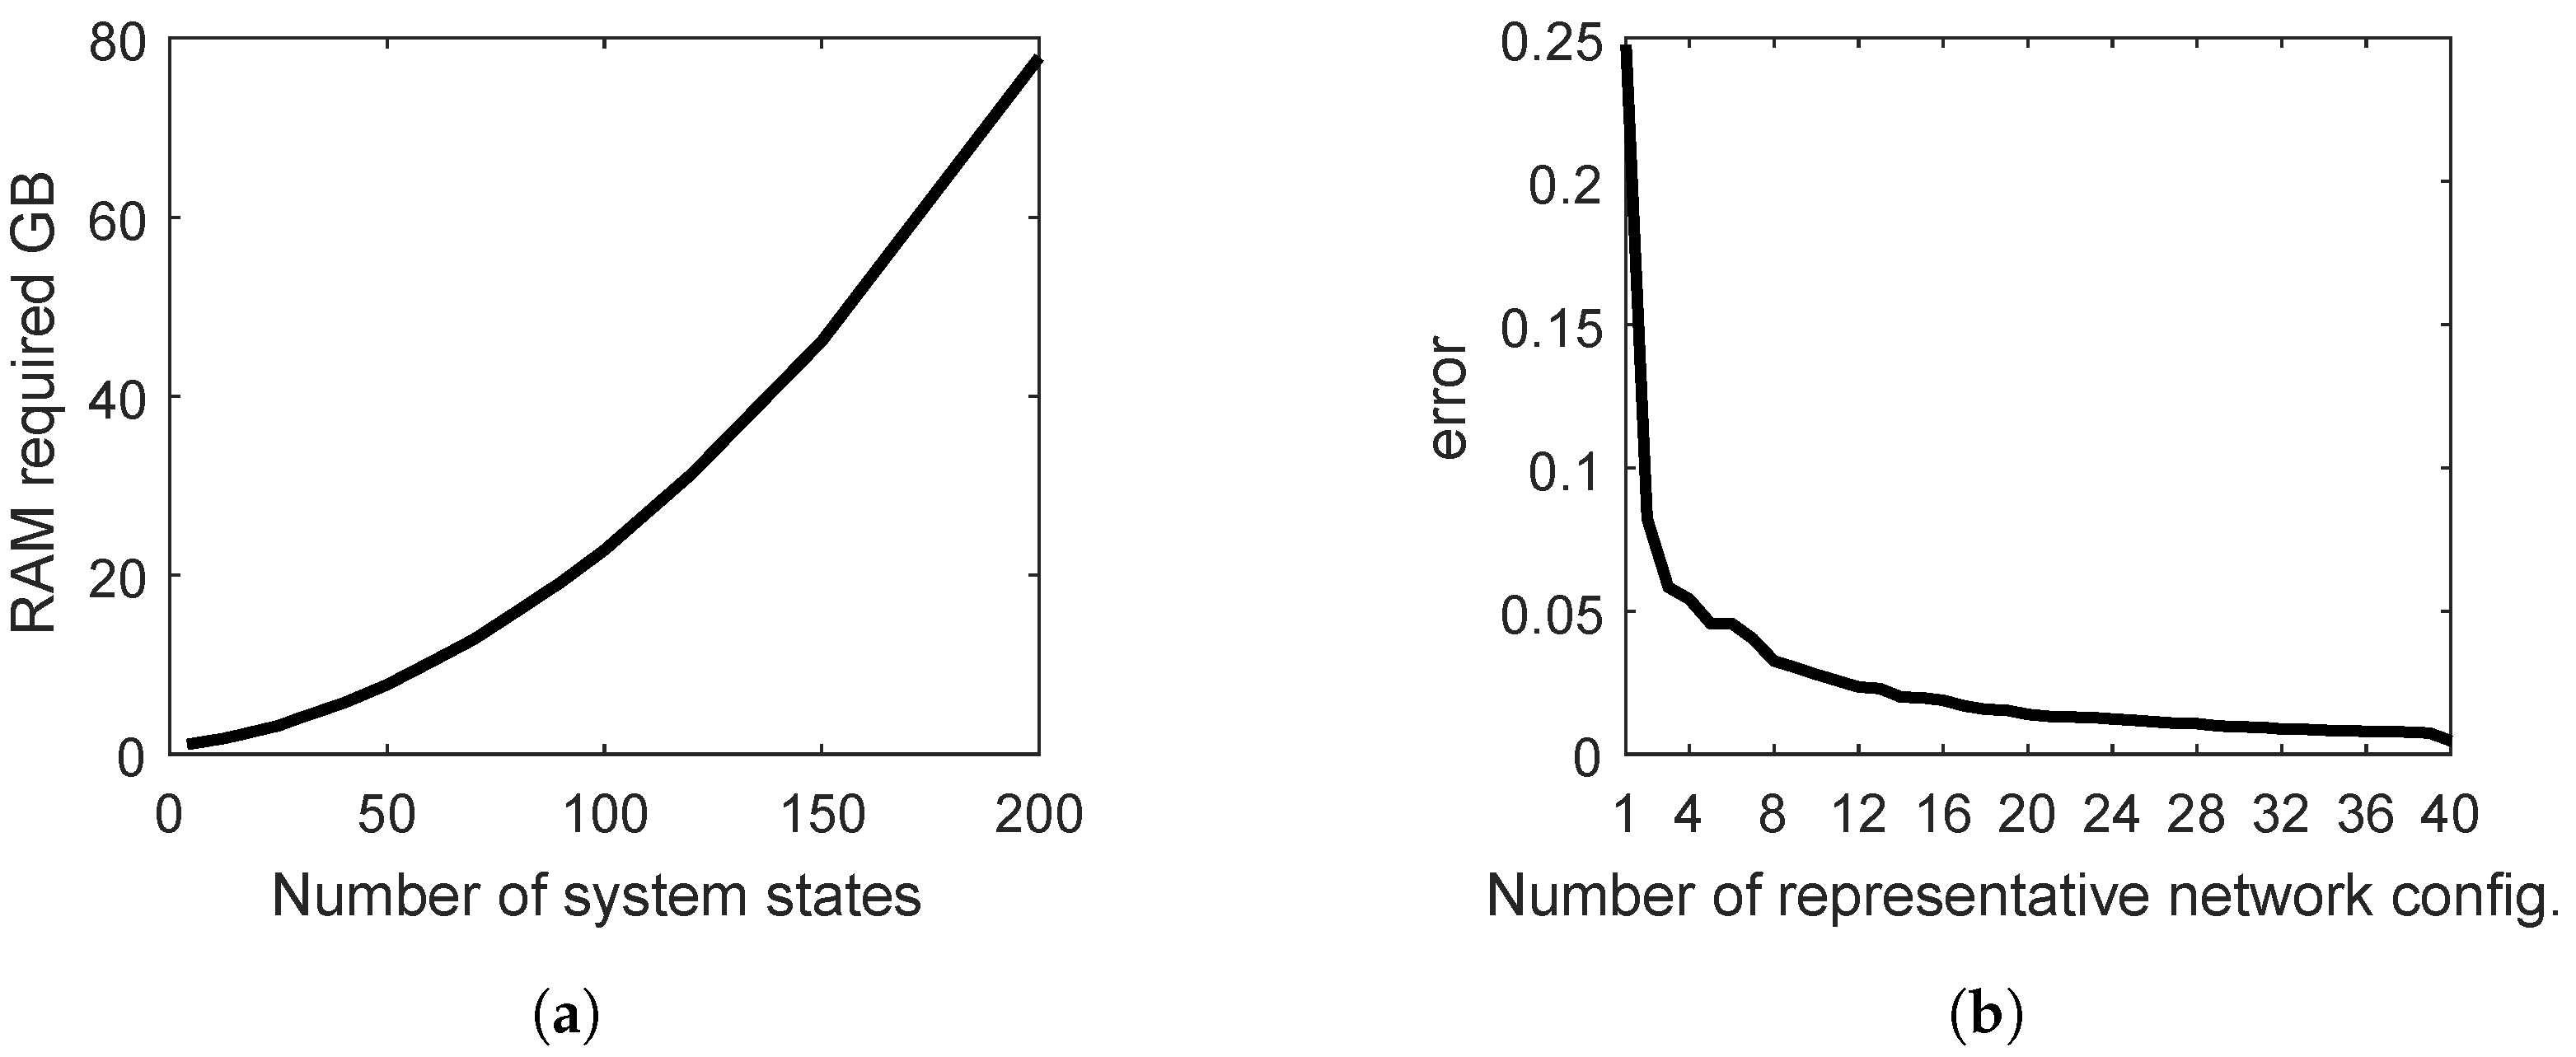
An electricity market equilibrium model, under perfect competition, is run to compute hourly prices per area. For this execution, a compromised number of system states is used that satisfies both the accuracy of the solution and the computational power necessary to run the model.
Step 2
A clustering method is applied to the prices obtained in Step 1 to extract the representative network configurations.
Step 3
With the information of the representatives in Step 2, the user can input a spread per agent and configuration for each hour throughout the horizon of the problem. These spreads are defined based on the agents’ expected market behavior.
Step 4
The model under perfect competition in Step 1 is run again, this time under normal conditions in terms of the number of system states (significantly less than the number used in the initial computation in Step 1), which yield a solution notably quicker. For each hour, the resulting prices’ configuration is classified into one of the main representatives.
Step 5
Given the relationships spread-configuration (in Step 3) and configuration-hour (in Step 4), it is now possible to run the model in Step 4 under non-perfect competition.
Diagrams of the different steps of the methodology can be observed in Figure 1 and Figure 2.

2.2.1. Clustering Algorithm

Initially, as noted in Step 1, the equilibrium is found under perfect competition. The outputs provide hourly prices per area for the entire horizon. These prices will determine the state of the interconnections for each hour that corresponds to a specific configuration of the network.
In this sense, a network configuration is defined by the state of the interconnections in terms of congestion, as exemplified in Figure 3. It can be represented as a symmetric matrix N R n × n , where n equals the number of countries studied and each element N a a corresponds to the interconnection between country a and a and can be defined as Equation (7).
N a a = 0 if a = a or the interc . a a is congested 1 otherwise .
Throughout the horizon of the problem, there will be multiple configurations and some of them will probably be repeated for different hours. The objective of this section is to determine which are the most representative (Figure 1) for the purpose of reducing the dimension of the problem under non-perfect competition conditions. To this end, a clustering algorithm was developed. In the literature, a broad range of clustering techniques are available. However, many of these methods result in clusters of which the centroid does not necessarily equal a configuration present in the sample. Thus, due to the particular features of this problem, an original algorithm was developed. This procedure groups the configurations based on their frequency and the similarity between them in the following way:
Let G define the set of m unique configurations extracted, G = X 1 , X 2 , , X m , and f ( X i ) , i = 1 , 2 , , m be the frequency of configuration X i , that is, the number of hours configuration X i is repeated over the horizon of the problem.
Given the two configurations X and Y, it is possible to determine the similarity between them by means of Equation (8), also known as the weighted hamming distance (when the configurations are viewed as categorical variables of which the descriptors correspond to the elements of the matrices). In this way, a weight ω a a characterizes each interconnection, assumed as a function of the aggregated demand of the adjoining countries a and a .
s i m X , Y = 1 a = 1 n 1 a = a + 1 n ω a a X a a Y a a
In Equation (8), ⊗ stands for a XOR operation and can be used because all the attributes are binary (either congested or not).
According to Equation (8), the similarity matrix S M R m × m can be formed, defining the similarity relationship between all the configurations in G:
S M = s i m ( X 1 , X 1 ) s i m ( X 1 , X 2 ) s i m ( X 1 , X m ) s i m ( X 2 , X 2 ) s i m ( X 2 , X m ) s i m ( X m , X m )
where S M i i = 1 , i = 1 , 2 , , m
When measuring the similarity between network configurations, a gap of 0.5 €/MWh will be used. This ensures that interconnections are defined as saturated when the price is bigger than the mentioned gap. This gap should be high enough to avoid considering small differences resulting from precision issues as significant.
Considering the similarity matrix S M and the number of main configurations R, predefined by the user according to the desired accuracy level, the clustering algorithm works as defined in Algorithm 1.
Algorithm 1 Clustering algorithm.
1:
while G > R do                   ▹ G refers to the cardinality of G
2:
    Choose configuration X A with lowest frequency, that is:
     X A G | f ( X A ) = min f X i , i = 1 , 2 , , m
3:
    Choose the most similar configuration to X A , that is:
     X B G | S A B = max S A j , j = 1 , 2 , , m , a b
4:
    Group X A into X B increasing frequency of X B such that f X B = f X A + f X B
5:
    Remove X A from G and update S M removing the row and column that applies to X A .
6:
end while
7:
returnG (The remaining objects in G correspond to the clusters or representative configurations).
The analysis of the main network configurations will give an outlook of the possible congestion that may arise between areas and more information about the resulting prices in the different zones. Thus, for each of the found representative network configurations, it is now possible to assign a price spread increment for each agent based on conjectured price responses. For instance, in a situation when an area becomes isolated from the others due to congestion in its interconnections, the strategic decisions of an agent participating in such area (understood as the local market power) could influence more significantly the resulting market price.
In contrast to Reference [30], this article presents an original clustering algorithm to select the representative network configurations. This procedure has a direct impact on the results since very similar low frequency network configurations can displace the ones with more frequency when building the clusters. This effect is, however, missing in the conference paper [30].

2.2.2. Classification Procedure

Building on the methodology, according to Step 4, the model is executed under perfect competition conditions. Subsequently, the network configurations derived from the electricity prices in every area resulting from this execution are classified into the representative configurations calculated in Step 2, as represented in Figure 2. In a real situation, this process would be part of the regular activity of the agents or regulators for decision-making.
The classification procedure initially seeks direct connections between every state of the network with one of the representative network configurations. By doing so, each set of hourly prices per area gets identified with one of the main configurations in Step 2. When no direct identification is found, each state of the network is assigned to the most similar representative; this step is computed with the similarity measures previously described. Ultimately, when all the assignments have been made, each hour has an unequivocal match with a representative state of the network.
On the other hand, price spread increments or conjectures have been estimated for every agent in each area according to the main representative configurations. The previous association hour-configuration combined with information of the estimated conjectures provide all the information to assign a conjectured-price response to all the market agents in every area and for all the periods considered in the problem.
At this point, all the necessary information is gathered to be able to execute the model considering market power at a later stage.
It is worth pointing out that the information of the main network configurations is not part of the optimization model itself but of the whole methodology. Therefore, the size of the problem, that is the number of variables and equations, remains constant when increasing the number of representative network configurations. In turn, the execution time is not directly related with the number of representative configurations extracted through the clustering algorithm.
Rather than dealing with the execution time, the problem raised by increasing the number of representative configurations is related to the estimation of the conjectures. The more representative configurations, the more conjectures need to be estimated. The process of estimating reasonable values of these conjectures constitutes a difficult task.
Otherwise, the efficiency in terms of execution time is achieved through the resolution approach proposed in the methodology.
All in all, this methodology allows for a model of a multi-area power system considering imperfect competition to be computed. Furthermore, it makes simulations of the local market power in such large systems viable.

3. Case Study and Results

This section presents a case study where the proposed methodology is implemented. In Section 3.1, the electric power system used in this case study is described. Moreover, the implementation of the methodology is explained in Section 3.2. Finally, Section 3.3 gives the results after executing the model under non-perfect competition. Note that the data and assumptions in this section should not be construed as a real representation of the system. They are used as an illustrative example of the application of the methodology.

3.1. System Description

For this case study, the countries which belong to the Iberian and CWE electricity markets were considered. Those include Portugal, Spain, France, Switzerland, Austria, Luxembourg, Belgium, Germany, and the Netherlands, as shown in Figure 4.
If taken individually, each separate country is typically represented as a single-price market model, characterized by not considering network constraints initially and, consequently, the market price being the same country-wide. In these systems, congestion is managed through additional mechanisms aimed at resolving technical requirements. The main assumption in single-price models is that they do not internalize the effects of network congestion on generators’ strategic behavior [38]. This behavior, but taken among countries, is precisely the objective of study when integrating each separate area into the complete system. The resulting system constitutes a zonal pricing market in which should congestion be ignored, the price will be the same in the whole system.
The selected horizon ranges from February 2016 to December 2017, since the model is geared to the planning and analysis of operations for decision making in the medium term. This scope is adequate to represent the medium-term evolution of the market in the considered European countries. Moreover, the model incorporates all the information regarding the technical and economical characteristics of each of the electricity markets considered in the system.

3.2. Network Configurations Methodology Implementation

After the model inputs are set up and following the methodology explained in Section 2.2, a perfect competitive model was computed using 80 system states of net demand by month. Consecutively, the resulting electricity prices for the horizon considered were gathered. The larger the number of system states chosen, the closer the temporal framework to hourly resolution and, as a consequence, the higher the accuracy of the results. The selection of 80 system states was found to be a good trade-off in terms of the accuracy of representation of the data and the computational requirements for the computer used: Intel® Xeon® CPU E5-2660 v3 @2.60 GHz with 40 logical processors and 144 GB of installed RAM memory running 64-bit Windows Server 2012 R2 (Figure 5a). As a result, it allows for the capture of a wider range of prices while not ensuing in a very time-consuming process. Under such conditions, the execution led to an optimization problem with 15.3 million variables and 7.6 million equations, which required a maximum memory of 16 GB and a total execution time of 1169 s.
On the collected prices, an analysis of the network configurations present in each hour was carried out. As the model is run for a medium-term horizon, it is quite frequent that the same network configurations are repeated for different periods. In fact, there are configurations more representative than others. The previous instruction led to 87 unique states of the interconnections. Consecutively, a secondary analysis based on the clustering algorithm in Section 2.2.1 was performed. After the evaluation, eight main representatives were chosen as a good compromise between the error (computed as the aggregated dissimilarity in the clustering process) against the number of clusters used (Figure 5b).
From the original sample of 1060 possible network configurations, the clustering process has been able to reduce it to just eight. In this situation, the estimated conjectured-price response will be input for each extracted representative network status. This will favor a trustworthy and accurate representation of the outcome of the system.
Withal, the strategic behavior of market agents is clearly influenced by the demand or wind conditions and forecasts. Therefore, the number of main network configurations will depend to a great extent on the data contemplated as well as on the values of the inputs subject to uncertainty, such as demand and wind. In this paper, however, only a deterministic version of the model was developed to better communicate the core of the model and the importance of the methodology proposed.
In Figure 6, the eight representative network configurations are shown, accompanied with the percentage of hours following this pattern. Many factors, either in terms of regulatory changes, technical modifications of the system, or others, can make prices change significantly over time. That is why a calculation of the representatives must be made not only once but also from time to time as markets evolve.
As part of the procedure, the next step consisted of computing the model in perfect competition with 10 system states per month. The selection of 10 system states meets the desired level of precision intended for this case study. However, the optimal number of states that meet the requirements set in commercial applications for decision-making is usually bigger for a better accuracy of the results. On these bases, the resulting model consisted of a problem with 2 million variables and 1 million equations that consumed 1.6 GB of memory and took 218 s to complete, considerably lower than the first part of the methodology and thereby more suitable for a more frequent execution of the model. This time may be extended significantly when, instead of a single execution, we are dealing with Monte Carlo simulations. This situation is precisely where the efficiency of the methodology gains much more importance.
Continuing with the methodology, the network status corresponding to the output electricity prices per hour are classified into one of the eight main representatives. For this matter, the classification procedure developed in Section 2.2.2 will be used. After the classification was established, about 80% of the resulted configurations were directly matched to one of the eight representatives. Meanwhile, the rest were assigned using the similarity measure defined in Section 2.2.1. This assignment will allow for the execution of the model under non-perfect competition with the estimated conjectures per market agent in every state of the network defined by the representative configurations.

3.3. Model under Non-Perfect Competition

In pursuit of simplicity and comprehensiveness, the following analysis is focused on one area (Belgium) and one month within the horizon of the problem (March 2016). Only one company for each area has been modeled. In addition, the reaction of the competitors’ strategies is modeled just by assigning different price spreads to each agent depending on the state of the interconnection. As a consequence, the resulting model’s objective function is modified, becoming a linear problem rather than a quadratic one. It would be equivalent to using a conjectured-price response as a function of the supply. Both approaches could even be included simultaneously and, depending on the market agent and area, one way or another would be applied. The approach taken in this section may help to perceive the price response in a more intuitive way.
To put the analysis in context, Belgium is linked to its neighbor countries by three interconnections: with France, the Netherlands, and Luxembourg, with descending cross-border capacities respectively. It is worth noting that, as its neighbors are greatly interconnected with Germany, the electricity prices in this country have a great impact in Belgium too.
Looking at the main network configurations obtained in Figure 6, the only ones where none of the mentioned interconnections are congested are configurations 1 and 8 (Figure 6a,h respectively). Additionally, in configuration 7 (Figure 6g) only the interconnection with Luxembourg is congested. In these cases, it is assumed that the configurations of the network do not enable the market agent of Belgium to exercise any sort of market power, and consequently, the spread increment will be zero.
With regard to the remaining configurations, the interconnection with Germany (indirectly through the Netherlands) is congested in every case. This situation will facilitate the agents in Belgium to increase the market power in their area, which in turn, will raise Belgium’s electricity price. Furthermore, in configuration 6 (Figure 6f), the interconnection with France is congested too. In this case, the Belgium–The Netherlands system finds itself completely isolated, since the interconnection between the Netherlands and Germany is congested too. In such a case, the price in Belgium deviates from the others and the market power increases, thus giving rise to a greater spread increment.
Empirically observing the electricity market in Europe, reasonable values of spread increments per day and configuration have been adjusted and introduced in the model for the Belgium agent in March 2016 (Table 1). If the objective was to represent a real situation accurately, the estimation of the spread increments is of great relevance. There are complex ways to estimate these values: by means of historical values [32,39,40] or fundamental variables as wind, nuclear, etc. [21]. In Reference [41], an overview of the main methods to calculate these conjectures was presented. However, this case study is meant to serve as an example to illustrate the power of the proposed methodology to simulate the local market power and its impact on the outputs of the system.
Once the model has been executed for non-perfect competition, Table 2 provides the average electricity price in Belgium for March 2016 under non-perfect competition compared with the results in perfect competition. As can be drawn from Table 2, the results differ significantly from one execution to another. Furthermore, the model has been correctly calibrated, since the monthly baseload price is similar to the real spot price for that month (27.13 €/MWh).
To further describe this effect, the net income of the studied agent has also been calculated for the considered month. As reasonably expected, this market agent, represented in Table 3, increases its return when market power is exercised. Consequently, this methodology allows us to capture a more realistic impact that strategies of market agents have in their economic position in each area.

4. Conclusions

The methodology presented in this work is novel since it proposes an innovative and efficient approach to represent a market that is run under non-perfect competition conditions and is comprised of large individual markets that are grouped within a unified framework, considering several market splitting possibilities.
This methodology has been put to the test on a real, full-scale case study of the European electricity market, and it has proved useful, significantly reducing the possible conditions of the interconnections and thus reducing computational burden and ensuring tractability as well as maintaining accuracy. In the light of the recent development of the Internal Electricity Market in Europe, this research field may provide a much needed insight for generator companies and system operator entities as a result of the full representation of the whole European market provided by this work’s proposed methodology. Furthermore, this allows them to emulate local market power in such a large and complex system.
Although the focus of this research involves a case study in Europe, the proposed methodology can be adapted to other systems with multiple areas, such as some parts of the United States, Latin-American countries, and even Italy, all of which are characterized by the presence of nodal-price regions. Therefore, this interesting research field features a significant potential.
As for the next future steps, it would be appealing to analyze the application of this work’s proposed methodology within the traditional operation of a market agent in their decision-making process, for instance, a Monte Carlo simulation that reflects the uncertainty of the risk variables pertaining to the medium term framework. Among the possible outcomes, more realistic results may be provided in significantly less time, assuming the estimation of the conjectures that truly reflect the market participants’ behavior is adequately performed. Furthermore, this methodology would yield an efficient and robust means to analyze the consequences of regulation foresight as well as changes in the operation of the power exchange at a European level.

Author Contributions

Conceptualization, A.O., A.B. and J.R.; methodology, A.O., A.B. and J.R.; software, A.O.; validation, A.O. and A.B.; formal analysis, A.O.; investigation, A.O.; resources, A.O.; data curation, A.O.; writing—original draft preparation, A.O.; writing—review and editing, A.O., A.B. and J.R.; visualization, A.O.; supervision, A.B. and J.R.

Funding

This research received no external funding.

Conflicts of Interest

The authors declare no conflict of interest.

References

  1. Creti, A.; Fumagalli, E.; Fumagalli, E. Integration of electricity markets in Europe: Relevant issues for Italy. Energy Policy 2010, 38, 6966–6976. [Google Scholar] [CrossRef]
  2. Domanico, F. Concentration in the European electricity industry: The internal market as solution? Energy Policy 2007, 35, 5064–5076. [Google Scholar] [CrossRef]
  3. Turvey, R. Interconnector economics. Energy Policy 2006, 34, 1457–1472. [Google Scholar] [CrossRef]
  4. Beus, M.; Pavić, I.; Štritof, I.; Capuder, T.; Pandžić, H. Electricity Market Design in Croatia within the European Electricity Market—Recommendations for Further Development. Energies 2018, 11, 346. [Google Scholar] [CrossRef]
  5. Borenstein, S.; Bushnell, J.; Stoft, S. The competitive effects of transmission capacity in a deregulated electricity industry. RAND J. Econ. 2000, 31, 294. [Google Scholar] [CrossRef]
  6. Cardell, J.B.; Hitt, C.C.; Hogan, W.W. Market power and strategic interaction in electricity networks. Resour. Energy Econ. 1997, 19, 109–137. [Google Scholar] [CrossRef]
  7. Hobbs, B.F. Linear complementarity models of Nash-Cournot competition in bilateral and POOLCO power markets. IEEE Trans. Power Syst. 2001, 16, 194–202. [Google Scholar] [CrossRef]
  8. Neuhoff, K.; Barquín, J.; Boots, M.G.; Ehrenmann, A.; Hobbs, B.F.; Rijkers, F.A.; Vázquez, M. Network-constrained Cournot models of liberalized electricity markets: The devil is in the details. Energy Econ. 2005, 27, 495–525. [Google Scholar] [CrossRef]
  9. Barquín, J.; Centeno, E.; Reneses, J. Medium-term generation programming in competitive environments: A new optimisation approach for market equilibrium computing. IEE Proc. Gener. Transm. Distrib. 2004, 151, 119. [Google Scholar] [CrossRef]
  10. Campos, F.A.; Villar, J.; Barquín, J. Solving Cournot equilibriums with variational inequalities algorithms. IET Gener. Transm. Distrib. 2010, 4, 268. [Google Scholar] [CrossRef]
  11. Gountis, V.P.; Bakirtzis, A.G. Efficient determination of Cournot equilibria in electricity markets. IEEE Trans. Power Syst. 2004, 19, 1837–1844. [Google Scholar] [CrossRef]
  12. Nguyen, D.; Wong, K.P. Analysis of competitive power market with constant elasticity function. IEE Proc. Gener. Transm. Distrib. 2003, 150, 595. [Google Scholar] [CrossRef]
  13. Barquín, J.; Vázquez, M. Cournot equilibrium calculation in power networks: An optimization approach with price response computation. IEEE Trans. Power Syst. 2008, 23, 317–326. [Google Scholar] [CrossRef]
  14. Von Stackelberg, H. Theory of the Market Economy; Oxford University Press: Oxford, UK, 1952. [Google Scholar]
  15. Quick, D.M.; Carey, J.M. An analysis of market power mitigation strategies in Colorado’s electricity industry. Energy J. 2001, 22, 55–77. [Google Scholar] [CrossRef]
  16. Baldick, R. Computing the electricity market equilibrium: Uses of market equilibrium models. In Proceedings of the 2006 IEEEPES Power Systems Conference and Exposition, Atlanta, GA, USA, 29 October–1 November 2006; pp. 66–73. [Google Scholar] [CrossRef]
  17. Ventosa, M.; Baíllo, Á.; Ramos, A.; Rivier, M. Electricity market modeling trends. Energy Policy 2005, 33, 897–913. [Google Scholar] [CrossRef]
  18. Fernández-Menéndez, F.; Vitoriano, B.; Barquín, J. Cross-border electricity trading modelling: A market equilibrium approach. Jornadas Hispano-lusas de Ingeniería Eléctrica 2005, 30, 1–7. [Google Scholar]
  19. Barquín, J.; Vitoriano, B.; Centeno, E.; Fernández-Menéndez, F. An optimization-based conjectured supply function equilibrium model for network constrained electricity markets. J. Oper. Res. Soc. 2009, 60, 1719–1729. [Google Scholar] [CrossRef]
  20. Campos, F.A.; Roman, A.; Villar, J.; Díaz, C.A. Two-zone electricity equilibrium computation with Mixed Integer Programming. In Proceedings of the 2014 11th International Conference on the European Energy Market (EEM), Krakow, Poland, 28–30 May 2014; pp. 1–6. [Google Scholar] [CrossRef]
  21. Díaz, C.A.; Campos, F.A.; Villar, J.; Rodríguez, M.Á. Endogenous computation of conjectured supply functions with network constraints. Electr. Power Syst. Res. 2012, 90, 117–125. [Google Scholar] [CrossRef]
  22. Díaz, C.A.; Campos, F.A.; Villar, J.; Rodríguez, M.Á. Fundamental conjectured supply function equilibrium: Application to the iberian system. In Proceedings of the 2011 8th International Conference on the European Energy Market (EEM), Zagreb, Croatia, 25–27 May 2011; pp. 232–237. [Google Scholar] [CrossRef]
  23. Díaz, C.A.; Webster, M.D.; Villar, J.; Campos, F.A. Dynamics of market power in ERCOT system: A Fundamental CSFE With Network Constraints. IEEE Trans. Power Syst. 2016, 31, 861–871. [Google Scholar] [CrossRef]
  24. Ahmadi-Khatir, A.; Conejo, A.J.; Cherkaoui, R. Multi-area unit scheduling and reserve allocation under wind power uncertainty. IEEE Trans. Power Syst. 2014, 29, 1701–1710. [Google Scholar] [CrossRef]
  25. Biskas, P.N.; Chatzigiannis, D.I.; Bakirtzis, A.G. European electricity market integration with mixed market designs—Part II: Solution Algorithm and Case Studies. IEEE Trans. Power Syst. 2014, 29, 466–475. [Google Scholar] [CrossRef]
  26. Kurzidem, M. Analysis of Flow-Based Market Coupling in Oligopolistic Power Markets. Ph.D. Thesis, ETH Zurich, Zurich, Switzerland, 2010. [Google Scholar] [CrossRef]
  27. Oggioni, G.; Smeers, Y.; Allevi, E.; Schaible, S. A generalized Nash equilibrium model of market coupling in the European power system. Netw. Spat. Econ. 2012, 12, 503–560. [Google Scholar] [CrossRef]
  28. Savelli, I.; Giannitrapani, A.; Paoletti, S.; Vicino, A. An optimization model for the electricity market clearing problem with uniform purchase price and zonal selling prices. IEEE Trans. Power Syst. 2017, 33, 2864–2873. [Google Scholar] [CrossRef]
  29. Vlachos, A.G.; Biskas, P.N. Simultaneous clearing of energy and reserves in multi-area markets under mixed pricing rules. IEEE Trans. Power Syst. 2011, 26, 2460–2471. [Google Scholar] [CrossRef]
  30. Orgaz, A.; Bello, A.; Reneses, J. Multi-area electricity market equilibrium model and its application to the European case. In Proceedings of the 2017 14th International Conference on the European Energy Market (EEM), Dresden, Germany, 6–9 June 2017; pp. 1–6. [Google Scholar] [CrossRef]
  31. García-Alcalde, A.; Ventosa, M.; Rivier, M.; Ramos, A.; Relano, G. Fitting electricity market models: A conjectural variations approach. In Proceedings of the 14th Power Systems Computation Conference 2002, Seville, Spain, 24–28 June 2002. [Google Scholar]
  32. Song, Y.; Ni, Y.; Wen, F.; Wu, F.F. Conjectural variation based learning model of strategic bidding in spot market. Int. J. Electr. Power Energy Syst. 2004, 26, 797–804. [Google Scholar] [CrossRef]
  33. Linares, P.; Santos, F.J.; Ventosa, M.; Lapiedra, L. Impacts of the European emissions trading scheme directive and permit assignment methods on the Spanish electricity sector. Energy J. 2006, 27, 79–98. [Google Scholar] [CrossRef]
  34. Fernández-Menéndez, F. Análisis de Mercados Eléctricos Interconectados con Restricciones de Red. Ph.D. Thesis, Universidad Pontificia Comillas, Instituto de Investigación Tecnológica (IIT), Madrid, Spain, 2015. [Google Scholar]
  35. Barquín, J.; Centeno, E.; Reneses, J. Stochastic market equilibrium model for generation planning. Probab. Eng. Inform. Sci. 2005, 19, 533–546. [Google Scholar] [CrossRef]
  36. Centeno, E.; Reneses, J.; Barquin, J. Strategic Analysis of Electricity Markets Under Uncertainty: A Conjectured-Price-Response Approach. IEEE Trans. Power Syst. 2007, 22, 423–432. [Google Scholar] [CrossRef]
  37. Wogrin, S.; Dueñas, P.; Delgadillo, A.; Reneses, J. A new approach to model load levels in electric power systems with high renewable penetration. IEEE Trans. Power Syst. 2014, 29, 2210–2218. [Google Scholar] [CrossRef]
  38. Bompard, E.; Zalzar, S.; Huang, T.; Purvins, A.; Masera, M. Baltic Power Systems’ Integration into the EU Market Coupling under Different Desynchronization Schemes: A Comparative Market Analysis. Energies 2018, 11, 1945. [Google Scholar] [CrossRef]
  39. López de Haro, S.; Sánchez Martín, P.; de La Hoz Ardiz, J.E.; Fernández Caro, J. Estimating conjectural variations for electricity market models. Eur. J. Oper. Res. 2007, 181, 1322–1338. [Google Scholar] [CrossRef] [Green Version]
  40. Liu, J.D.; Lie, T.T. Empirical dynamic oligopoly behavior analysis in electricity markets. In Proceedings of the 2004 International Conference on Power System Technology, POWERCON, Singapore, 21–24 November 2004; pp. 1768–1773. [Google Scholar] [CrossRef]
  41. Díaz, C.A.; Villar, J.; Campos, F.A.; Reneses, J. Electricity market equilibrium based on conjectural variations. Electr. Power Syst. Res. 2010, 80, 1572–1579. [Google Scholar] [CrossRef]
Figure 1. A diagram of Step 1 and Step 2 of the methodology.
Energies 12 02068 g001
Figure 2. A diagram of Step 4 and Step 5 of the methodology.
Energies 12 02068 g002
Figure 3. An example of a network configuration: The state of the interconnections corresponding to the representative network configuration 4 in Section 3.
Energies 12 02068 g003
Figure 4. The European countries considered in the case study in Section 3.
Energies 12 02068 g004
Figure 5. (a) The trade-off curve between the number of system states used in the model against the RAM required for execution. (b) The trade-off curve between the number of main network configurations against the accumulated error.
Energies 12 02068 g005
Figure 6. Eight representative network configurations (The different patterns show different prices in the corresponding areas.).
Energies 12 02068 g006
Table 1. The distribution of hours in March 2016 across the main configurations.
Network ConfigurationNumber of HoursMean Spread Increment (c€/kWh)
Config. 12970
Config. 20-
Config. 3580.23
Config. 4790.35
Config. 50-
Config. 63101.14
Config. 70-
Config. 80-
Table 2. The average Belgium electricity price in March 2016 for perfect and non-perfect competition executions.
Perfect CompetitionNon-Perfect Competition
24.5227.05
Table 3. The net income for the Belgium agent in March 2016 for perfect and non-perfect competition executions.
Perfect CompetitionNon-Perfect Competition
133.40147.57

