Integrated Measuring and Control System for Thermal Analysis of Buildings Components in Hot Box Experiments
Abstract
1. Introduction
2. Common Systems and Literature Background
- what types of hot boxes are commonly used?
- what types of probes are commonly employed to measure temperatures on the specimen and inside the chambers?
- what types of measuring and control systems are commonly used?
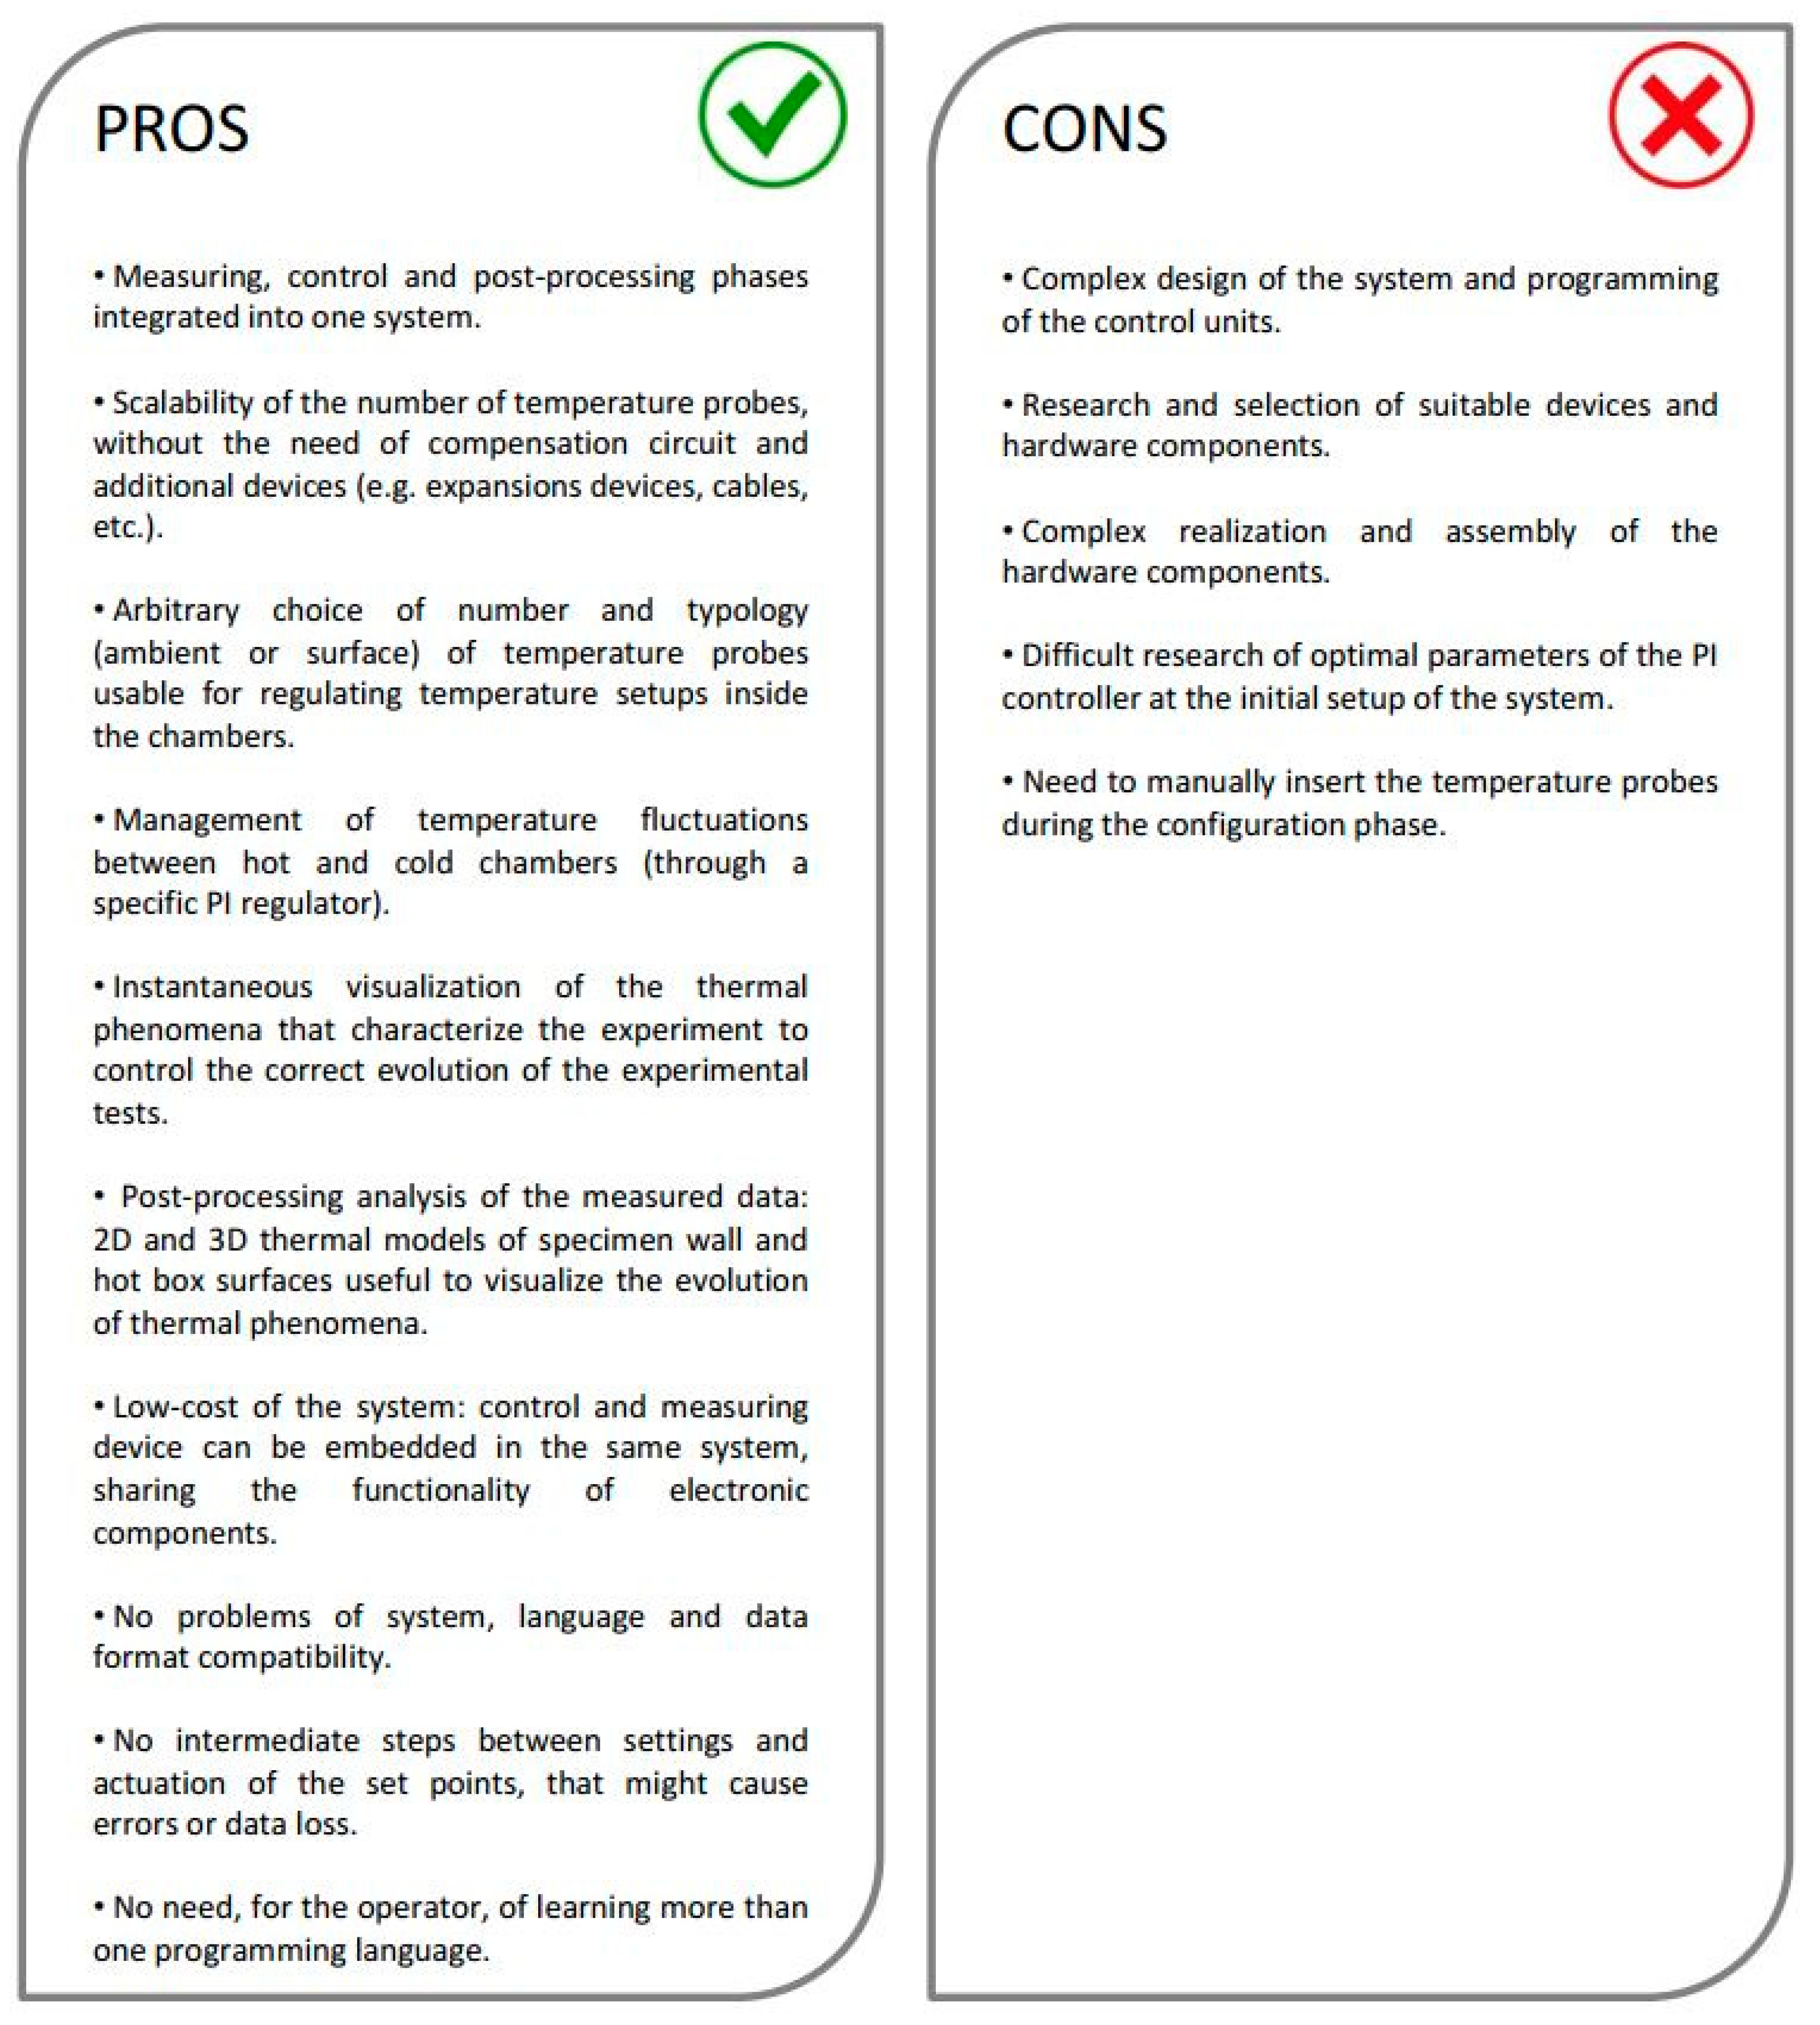
- measuring, control and post-processing phases integrated into one system;
- scalability of the number of temperature probes usable, without the need of compensation circuit and additional devices;
- arbitrary choice of number and typology (ambient or surface) of temperature probes usable for regulating temperature setups inside the chambers;
- management of temperature fluctuations between hot and cold chambers (through a specific PI regulator);
- instantaneous visualization of the thermal phenomena that characterize the experiment and control of the correct evolution of the experimental tests;
- low-cost of the system.
3. Proposal of a New Integrated System
4. Application on a Real Case
4.1. Sample Wall Description
4.2. Sensors Arrangement
4.3. Results of the Measuring and Control System Application
4.4. Experimental Analysis of the Specimen Wall Thermal Properties
4.5. Uncertainty Analysis
4.6. 2D and 3D Thermal Model Visualization
4.7. Pros and Cons of the System
5. Conclusions
Supplementary Materials
Author Contributions
Funding
Acknowledgments
Conflicts of Interest
References
- International Energy Agency (IEA). World Energy Outlook; IEA: Paris, France, 2016. [Google Scholar]
- Pargana, N.; Pinheiro, M.D.; Silvestre, J.D.; de Brito, J. Comparative environmental life cycle assessment of thermal insulation materials of buildings. Energy Build. 2014, 82, 466–481. [Google Scholar] [CrossRef]
- Woltman, G.; Noel, M.; Fam, A. Experimental and numerical investigations of thermal properties of insulated concrete sandwich panels with fiberglass shear connectors. Energy Build. 2017, 145, 22–31. [Google Scholar] [CrossRef]
- Caruana, C.; Yousif, C.; Bacher, P.; Buhagiar, S.; Grima, C. Determination of thermal characteristics of standard and improved hollow concrete blocks using different measurement techniques. J. Build. Eng. 2017, 13, 336–346. [Google Scholar] [CrossRef]
- Gullbrekken, L.; Uvsløkk, S.; Kvande, T.; Time, B. Hot-box measurements of highly insulated wall, roof and floor structures. J. Build. Phys. 2017, 41, 58–77. [Google Scholar] [CrossRef]
- Prata, J.; Simões, N.; Tadeu, A. Heat transfer measurements of a Linear Thermal Bridge in a wooden building corner. Energy Build. 2017, 158, 194–208. [Google Scholar] [CrossRef]
- Lechowska, A.A.; Schnotale, J.A.; Baldinelli, G. Window frame thermal transmittance improvements without frame geometry variations: An experimentally validated CFD analysis. Energy Build. 2017, 145, 188–199. [Google Scholar] [CrossRef]
- Trgala, K.; Pavelek, M.; Wimmer, R. Energy performance of five different building envelope structures using a modified Guarded Hot Box apparatus—Comparative analysis. Energy Build. 2019, 195, 116–125. [Google Scholar] [CrossRef]
- De Rubeis, T.; Nardi, I.; Muttillo, M. Development of a low-cost temperature data monitoring. An upgrade for hot box apparatus. J. Phys. Conf. Ser. 2017, 923, 012039. [Google Scholar] [CrossRef]
- Nardi, I.; Paoletti, D.; Ambrosini, D.; de Rubeis, T.; Sfarra, S. U-value assessment by infrared thermography: A comparison of different calculation methods in a Guarded Hot Box. Energy Build. 2016, 122, 211–221. [Google Scholar] [CrossRef]
- Nardi, I.; Paoletti, D.; Ambrosini, D.; de Rubeis, T.; Sfarra, S. Validation of quantitative IR thermography for estimating the U-value by a hot box apparatus. J. Phys. Conf. Ser. 2015, 655, 012006. [Google Scholar] [CrossRef]
- UNI EN ISO 8990. Thermal Insulation—Determination of Steady-State Thermal Transmission Properties—Calibrated and Guarded Hot Box; International Standard Organization: Geneva, Switzerland, 1999. [Google Scholar]
- Koo, S.Y.; Park, S.; Song, J.-H.; Song, S.-Y. Effect of Surface Thermal Resistance on the Simulation Accuracy of the Condensation Risk Assessment for a High-Performance Window. Energies 2018, 11, 382. [Google Scholar] [CrossRef]
- Biswas, K. Development and Validation of Numerical Models for Evaluation of Foam-Vacuum Insulation Panel Composite Boards, Including Edge Effects. Energies 2018, 11, 2228–2244. [Google Scholar] [CrossRef]
- Biswas, K.; Desjarlais, A.; Smith, D.; Letts, J.; Yao, J.; Jiang, T. Development and thermal performance verification of composite insulation boards containing foam-encapsulated vacuum insulation panels. Appl. Energy 2018, 228, 1159–1172. [Google Scholar] [CrossRef]
- Sassine, E.; Younsi, Z.; Cherif, Y.; Chauchois, A.; Antczak, E. Experimental determination of thermal properties of brick wall for existing construction in the north of France. J. Build. Eng. 2017, 14, 15–23. [Google Scholar] [CrossRef]
- Peters, B.; Sharag-Eldin, A.; Callaghan, B. Development of a simple Hot Box to determine the thermal characteristics of a three-dimensional printed bricks. In Proceedings of the ARCC 2017 Conference—Architecture of Complexity, Salt Lake City, UT, USA, 14–17 June 2017. [Google Scholar]
- Douzane, O.; Promis, G.; Roucoult, J.M.; Tran Le, A.D.; Langlet, T. Hygrothermal performance of a straw bale building: In situ and laboratory investigations. J. Build. Eng. 2016, 8, 91–98. [Google Scholar] [CrossRef]
- Buratti, C.; Belloni, E.; Lunghi, L.; Borri, A.; Castori, G.; Corradi, M. Mechanical characterization and thermal conductivity measurements using of a new “small hot-box” apparatus: Innovative insulating reinforced coatings analysis. J. Build. Eng. 2016, 7, 63–70. [Google Scholar] [CrossRef]
- Buratti, C.; Belloni, E.; Lunghi, L.; Barbanera, M. Thermal Conductivity Measurements by Means of a New “Small Hot-Box” Apparatus: Manufacturing, Calibration and Preliminary Experimental Tests on Different Materials. Int. J. Thermophys. 2016, 37, 47. [Google Scholar] [CrossRef]
- Basak, C.K.; Mitra, D.; Ghosh, A.; Sarkar, G.; Neogi, S. Performance Evaluation of a Guarded Hot Box Test Facility Using Fuzzy Logic Controller for Different Building Material Samples. Energy Procedia 2016, 90, 185–190. [Google Scholar] [CrossRef]
- Grynning, S.; Misiopecki, C.; Uvsløkk, S.; Time, B.; Gustavsen, A. Thermal performance of in-between shading systems in multilayer glazing units: Hot-box measurements and numerical simulations. J. Build. Phys. 2015, 39, 147–169. [Google Scholar] [CrossRef]
- Seitz, S.; MacDougall, C. Design of an Affordable Hot Box Testing Apparatus. In Proceedings of the 16th NOCMAT Non-Conventional Materials and Technologies, Winnipeg, MB, Canada, 10–13 August 2015. [Google Scholar]
- Pernigotto, G.; Prada, A.; Patuzzi, F.; Baratieri, M.; Gasparella, A. Characterization of the dynamic thermal properties of the opaque elements through experimental and numerical tests. Energy Procedia 2015, 78, 3234–3239. [Google Scholar] [CrossRef]
- Pernigotto, G.; Prada, A.; Patuzzi, F.; Baratieri, M.; Gasparella, A. Experimental characterization of the dynamic thermal properties of opaque elements under dynamic periodic solicitation. In Proceedings of the Building Simulation Applications BSA 2015—2nd IBPSA Italy Conference, Bozen, Italy, 4–6 February 2015; pp. 547–555. [Google Scholar]
- Faye, M.; Lartigue, B.; Sambou, V. A new procedure for the experimental measurement of the effective heat capacity of wall elements. Energy Build. 2015, 103, 62–69. [Google Scholar] [CrossRef]
- Meng, X.; Gao, Y.; Wang, Y.; Yan, B.; Zhang, W.; Long, E. Feasibility experiment on the simple hot box-heat flow meter method and the optimization based on simulation reproduction. Appl. Eng. 2015, 83, 48–56. [Google Scholar] [CrossRef]
- Manzan, M.; Zandegiacomo De Zorzi, E.; Lorenzi, W. Experimental and numerical comparison of internal insulation systems for building refurbishment. Energy Procedia 2015, 82, 493–498. [Google Scholar] [CrossRef][Green Version]
- Seitz, A.; Biswas, K.; Childs, K.; Carbary, L.; Serino, R. High-Performance External Insulation and Finish System Incorporating Vacuum Insulation Panels—Foam Panel Composite and Hot Box Testing. Next-Gener. Therm. Insul. Chall. Oppor. 2014, 81–100. [Google Scholar] [CrossRef]
- Vereecken, E.; Roels, S. A comparison of the hygric performance of interior insulation systems: A hot box–cold box experiment. Energy Build. 2014, 80, 37–44. [Google Scholar] [CrossRef]
- Ghosh, A.; Ghosh, S.; Neogi, S. Performance evaluation of a guarded hot box U-value measurement facility under different software based temperature control strategies. Energy Procedia 2014, 54, 448–454. [Google Scholar] [CrossRef]
- Sousa, H.; de Sousa, R.M. Sensibility analysis of the thermal resistance of masonry through numerical simulations of laboratory tests. In Proceedings of the 9th International Masonry Conference, Guimaraes, Portugal, 7–9 July 2014. [Google Scholar]
- Kus, H.; Özkan, E.; Göcer, Ö.; Edis, E. Hot box measurements of pumice aggregate concrete hollow block walls. Constr. Build. Mater. 2013, 38, 837–845. [Google Scholar] [CrossRef]
- Chen, F.; Wittkopf, S.K. Summer condition thermal transmittance measurement of fenestration systems using calorimetric hot box. Energy Build. 2012, 53, 47–56. [Google Scholar] [CrossRef]
- Martin, K.; Campos-Celador, A.; Escudero, C.; Gómez, I.; Sala, J.M. Analysis of a thermal bridge in a guarded hot box testing facility. Energy Build. 2012, 50, 139–149. [Google Scholar] [CrossRef]
- Grynning, S.; Jelle, B.P.; Uvsløkk, S.; Gustavsen, A.; Baetens, R.; Caps, R.; Meløysund, V. Hot box investigations and theoretical assessments of miscellaneous vacuum insulation panel configurations in building envelopes. J. Build. Phys. 2011, 34, 297–324. [Google Scholar] [CrossRef]
- Asdrubali, F.; Baldinelli, G. Thermal transmittance measurements with the hot box method: Calibration, experimental procedures, and uncertainty analyses of three different approaches. Energy Build. 2011, 43, 1618–1626. [Google Scholar] [CrossRef]
- Qin, M.; Belarbi, R.; Aït-Mokhtar, A.; Nilsson, L.O. Coupled heat and moisture transfer in multi-layer building materials. Constr. Build. Mater. 2009, 23, 967–975. [Google Scholar] [CrossRef]
- ASTM C1363-11. Standard Test Method for Thermal Performance of Building Materials and Envelope Assemblies by Means of a Hot Box Apparatus; ASTM: West Conshohocken, PA, USA, 2011. [Google Scholar]
- Smith, I.B. Applications and limitations of thermocouples for measuring temperatures. J. Am. Inst. Electr. Eng. 1923, 42, 171–178. [Google Scholar] [CrossRef]
- Depari, A.; Sisinni, E.; Flammini, A.; Ferri, G.; Stornelli, V.; Barile, G.; Parente, F.R. Autobalancing Analog Front End for Full-Range Differential Capacitive Sensing. IEEE Trans. Instrum. Meas. 2018, 67, 885–893. [Google Scholar] [CrossRef]
- Barile, G.; Ferri, G.; Parente, F.R.; Stornelli, V.; Sisinni, E.; Depari, A.; Flammini, A. A CMOS full-range linear integrated interface for differential capacitive sensor readout. Sens. Actuators A-Phys. 2018, 281, 130–140. [Google Scholar] [CrossRef]
- Ferri, G.; Stornelli, V.; Parente, F.R.; Barile, G. Full range analog Wheatstone bridge-based automatic circuit for differential capacitance sensor evaluation. Int. J. Circ. Appl. 2016, 45, 2149–2156. [Google Scholar] [CrossRef]
- Hambali, N.; Rahim Ang, A.A.; Ishak, A.A.; Janin, Z. Various PID Controller Tuning for Air Temperature Oven System. In Proceedings of the IEEE International Conference on Smart Instrumentation, Measurement and Applications (ICSIMA), Kuala Lumpur, Malaysia, 26–27 November 2013. [Google Scholar] [CrossRef]
- DS18B20, Digital Thermometer Datasheet. Available online: https://datasheets.maximintegrated.com (accessed on 12 February 2019).
- Cid, N.; Ogando, A.; Gomez, M.A. Acquisition system verification for energy efficiency analysis of building materials. Energies 2017, 10, 1254–1266. [Google Scholar] [CrossRef]
- Nardi, I.; de Rubeis, T.; Buzzi, E.; Sfarra, S.; Ambrosini, D.; Paoletti, D. Modeling and optimization of the thermal performance of a wood-cement block in a low-energy house construction. Energies 2016, 9, 677. [Google Scholar] [CrossRef]
- UNI EN ISO 6946. Building Components and Building Elements—Thermal Resistance and Thermal Transmittance—Calculation Method; International Standard Organization: Geneva, Switzerland, 2018. [Google Scholar]
- UNI ISO 9869. Thermal Insulation. Building Elements. In-Situ Measurement of Thermal Resistance and Thermal Transmittance; International Standard Organization: Geneva, Switzerland, 2015. [Google Scholar]
- Holman, J.P. Experimental Methods for Engineers, 8th ed.; McGraw-Hill series in mechanical engineering; McGraw-Hill: New York, NY, USA, 2001; ISBN-13 978-0-07-352930-1. [Google Scholar]
- De Rubeis, T.; Nardi, I.; Ambrosini, D.; Paoletti, D. Is a self-sufficient building energy efficient? Lesson learned from a case study in Mediterranean climate. Appl. Energy 2018, 218, 131–145. [Google Scholar] [CrossRef]
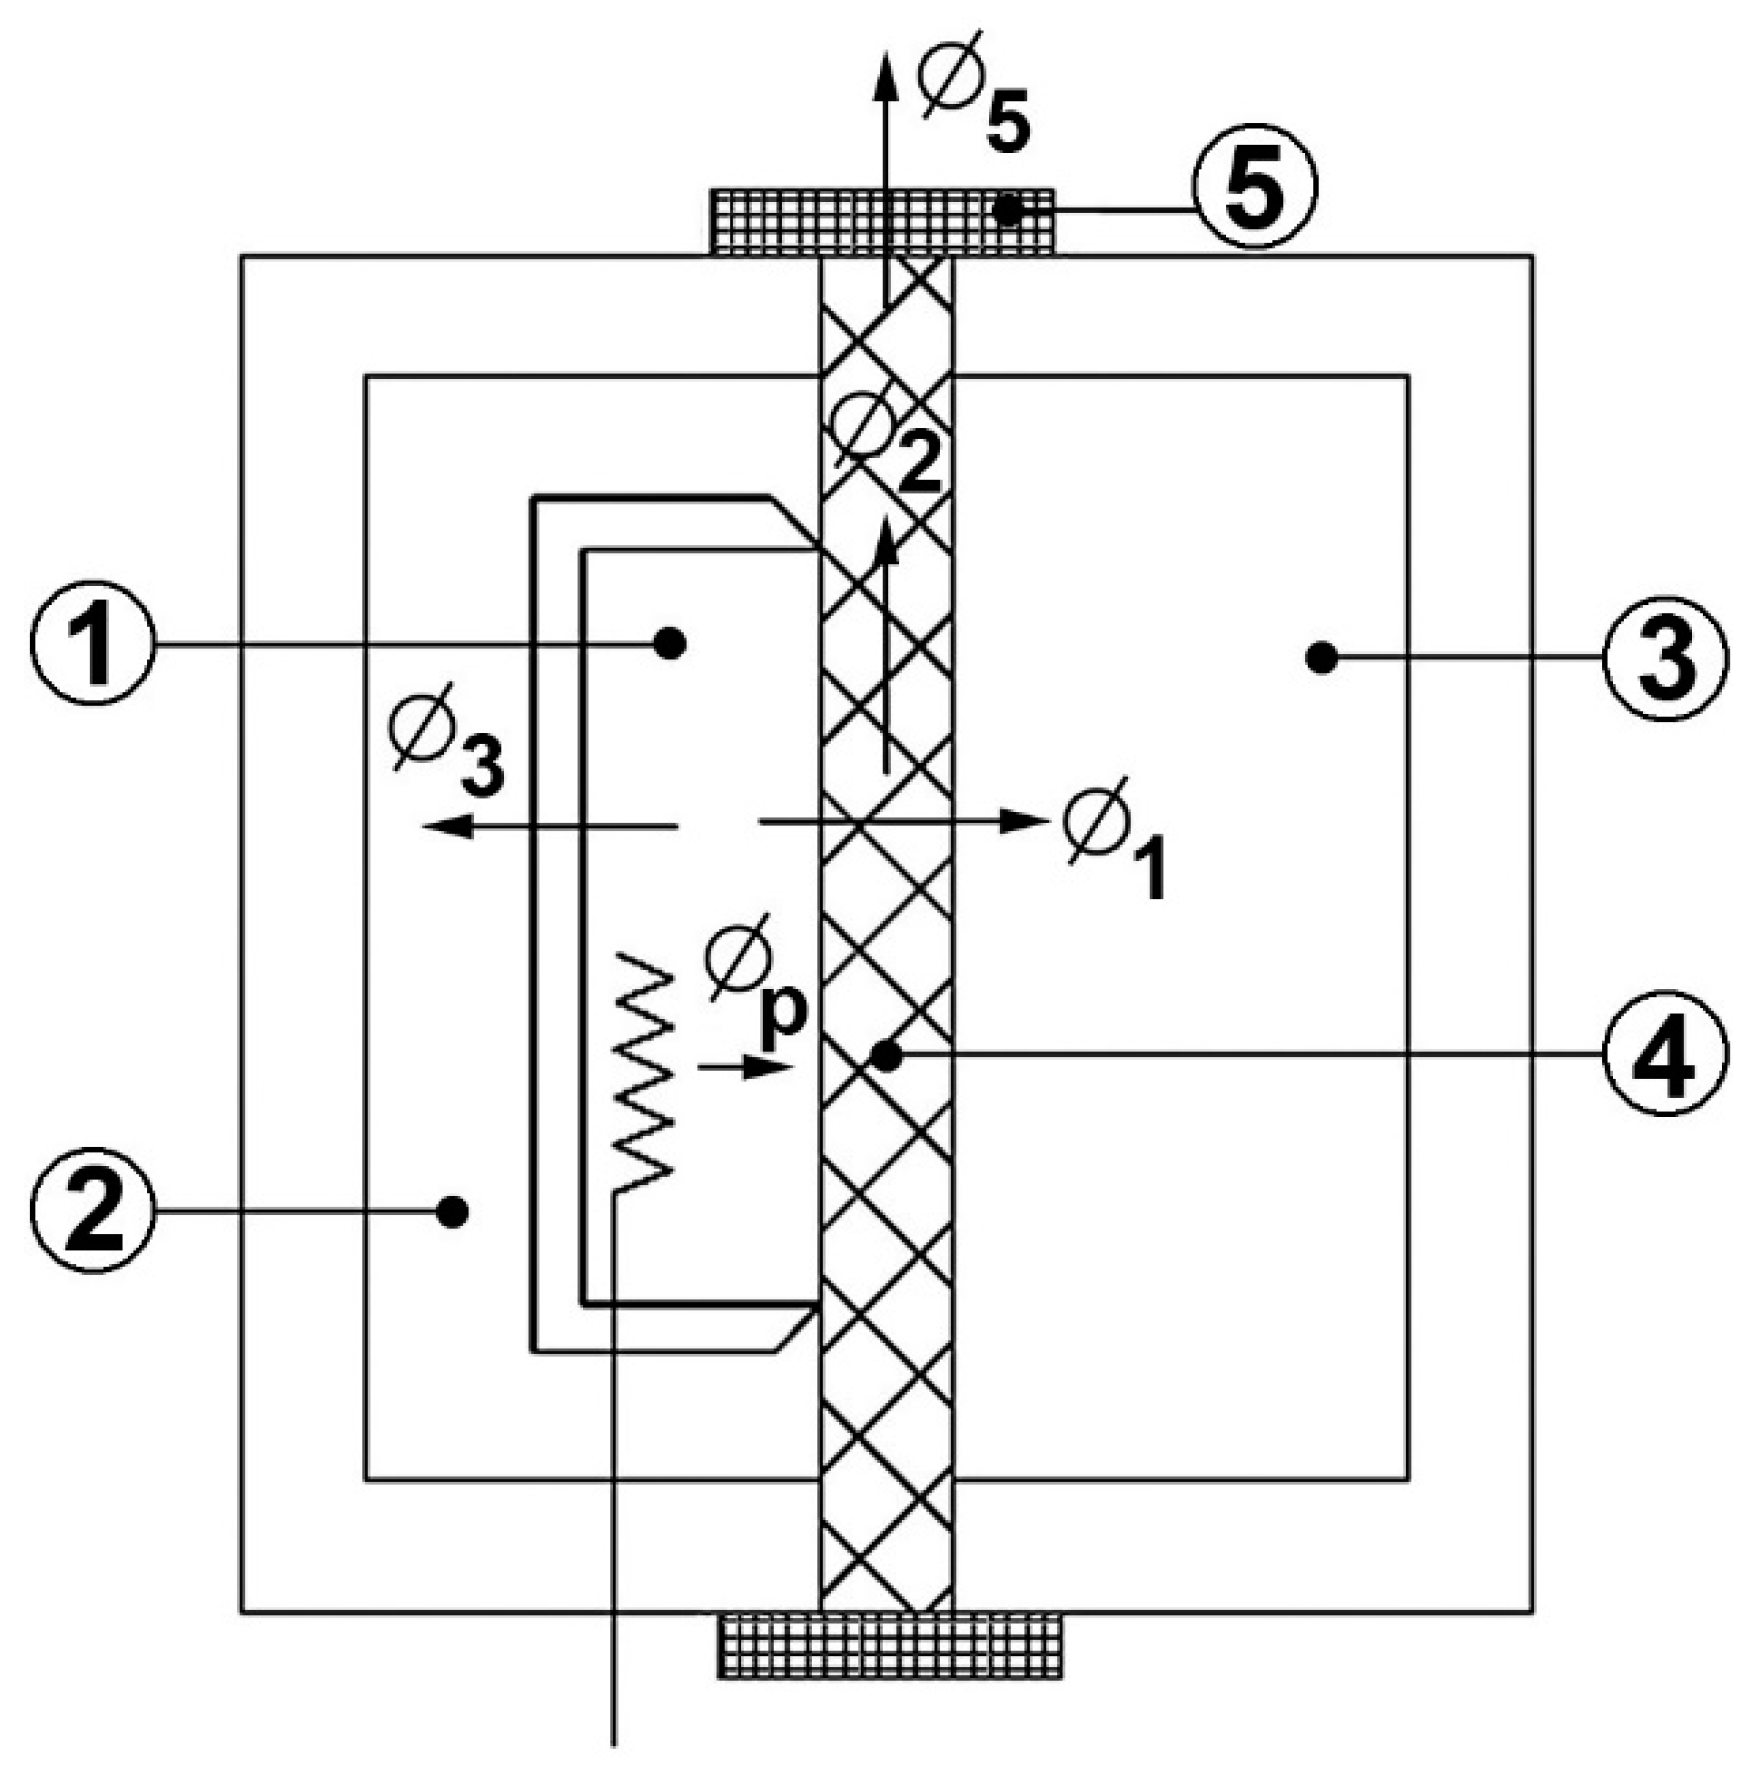
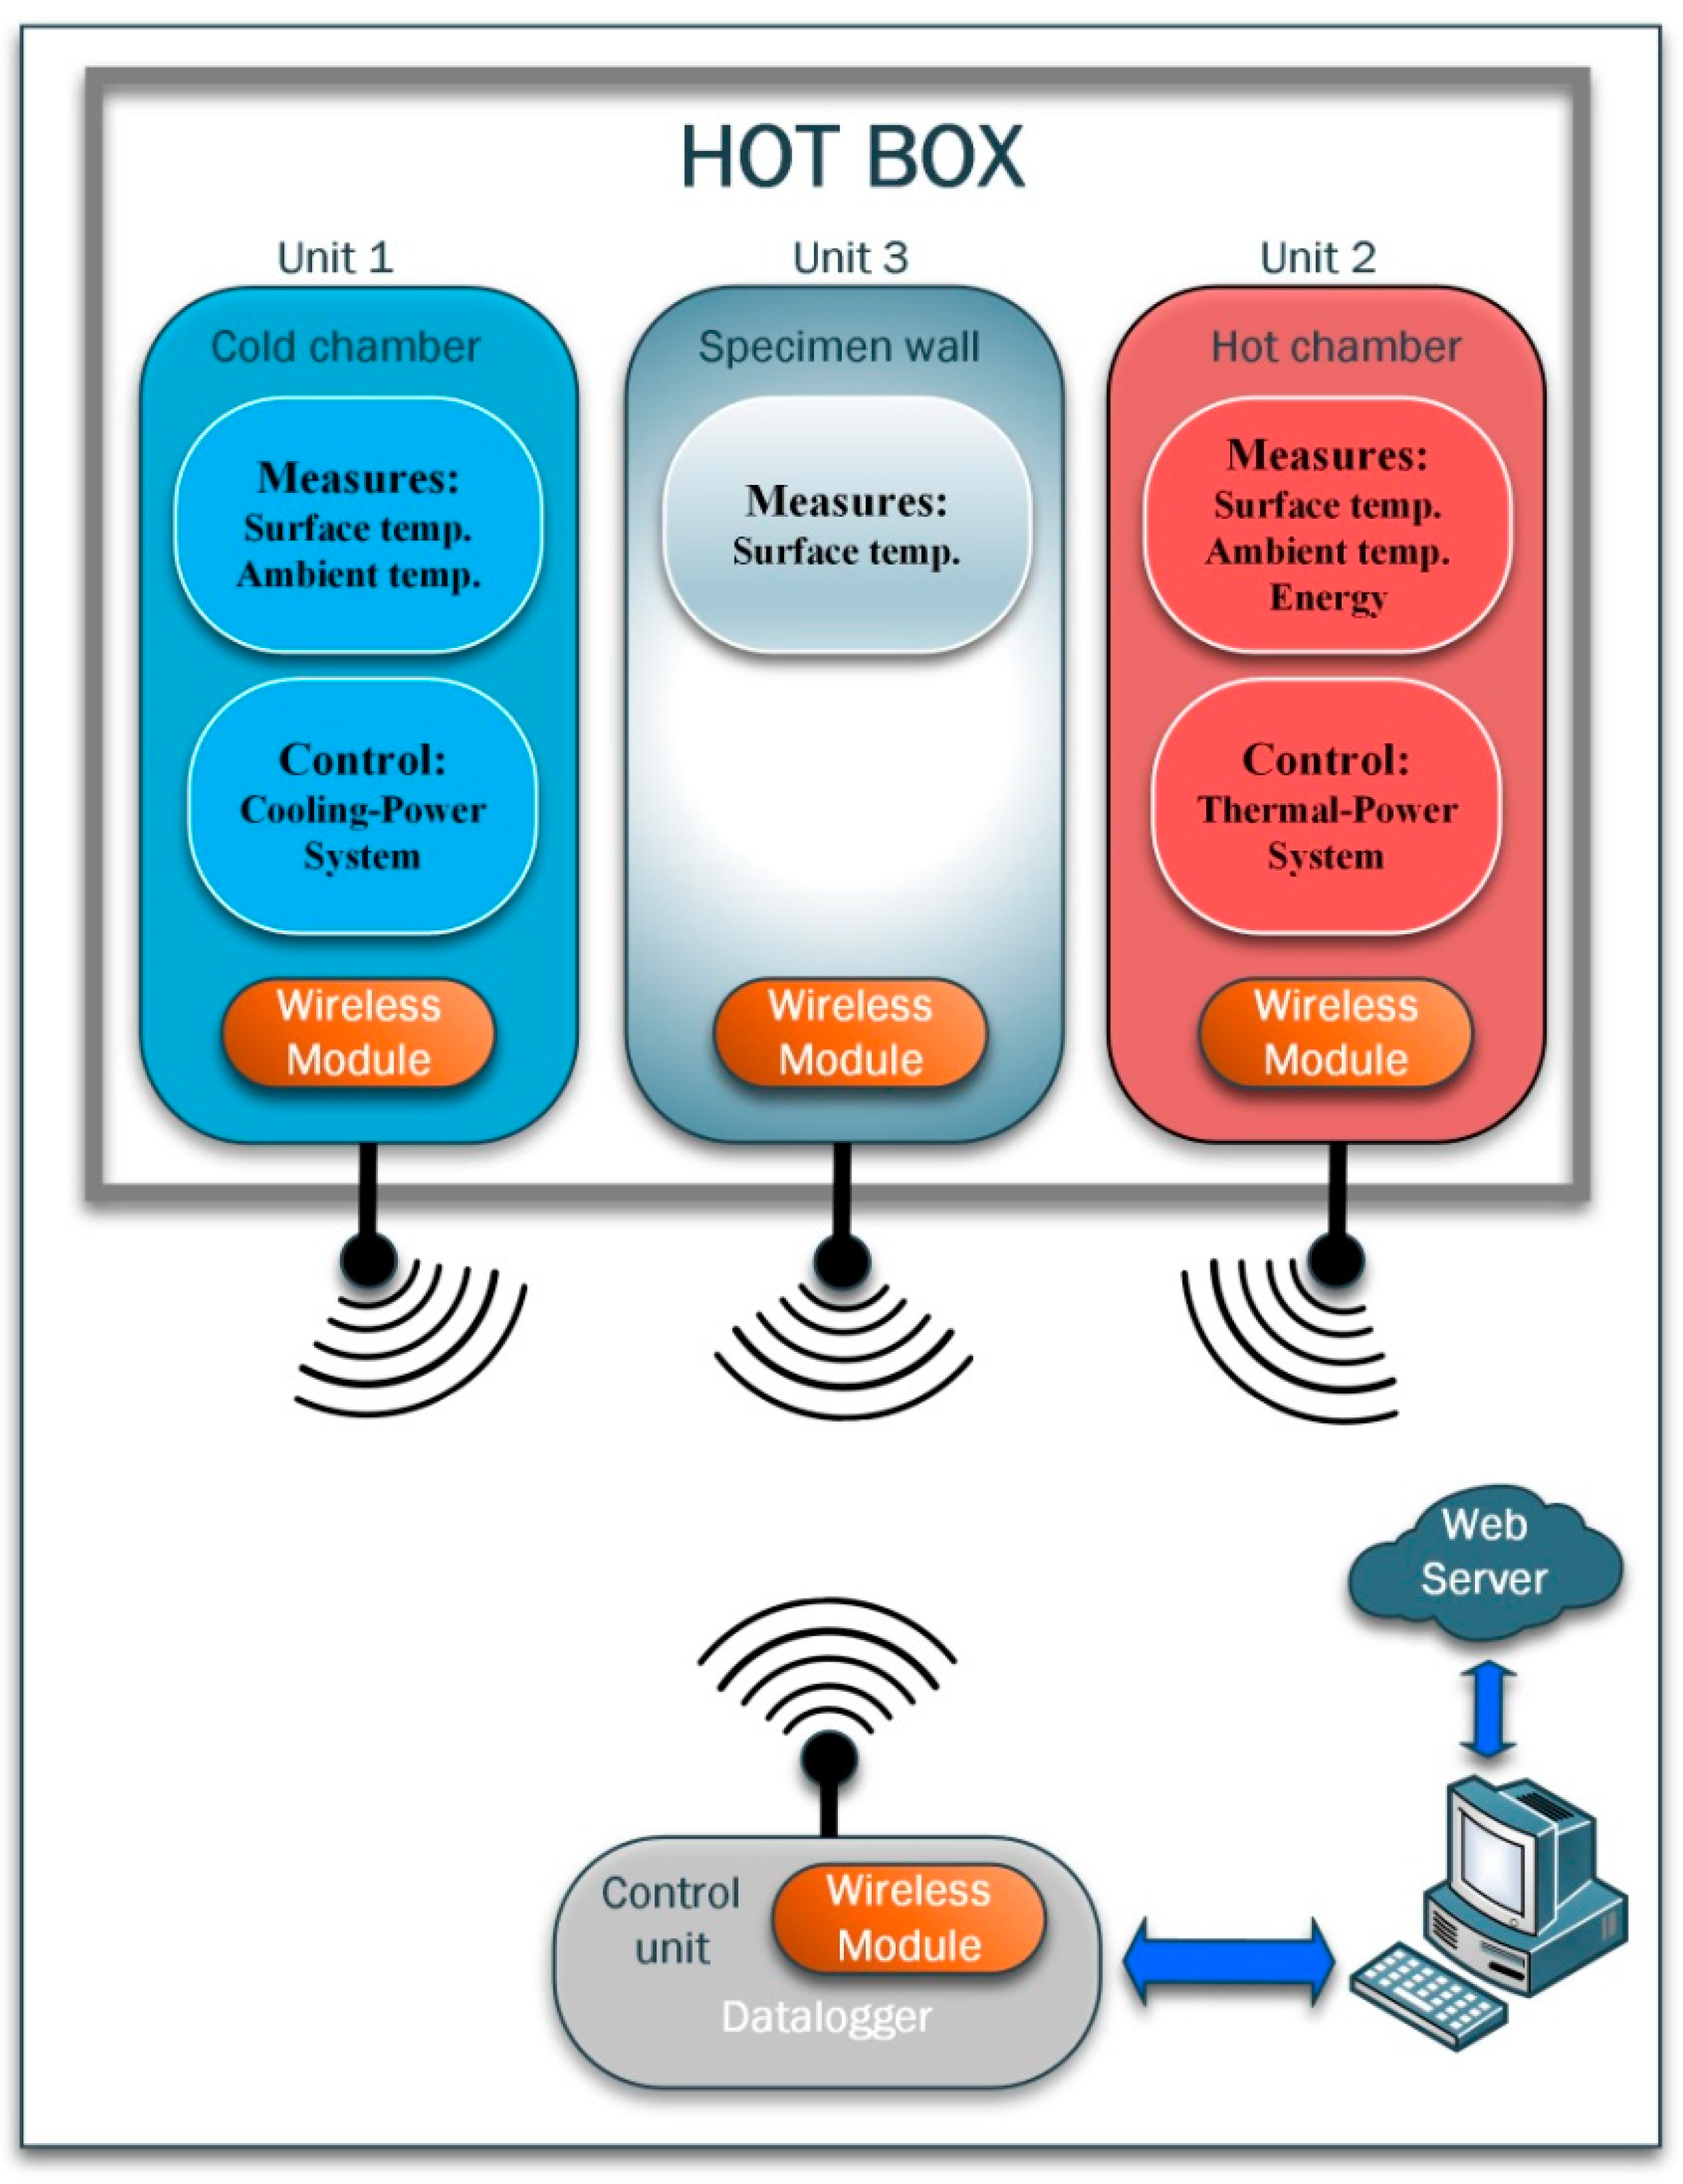
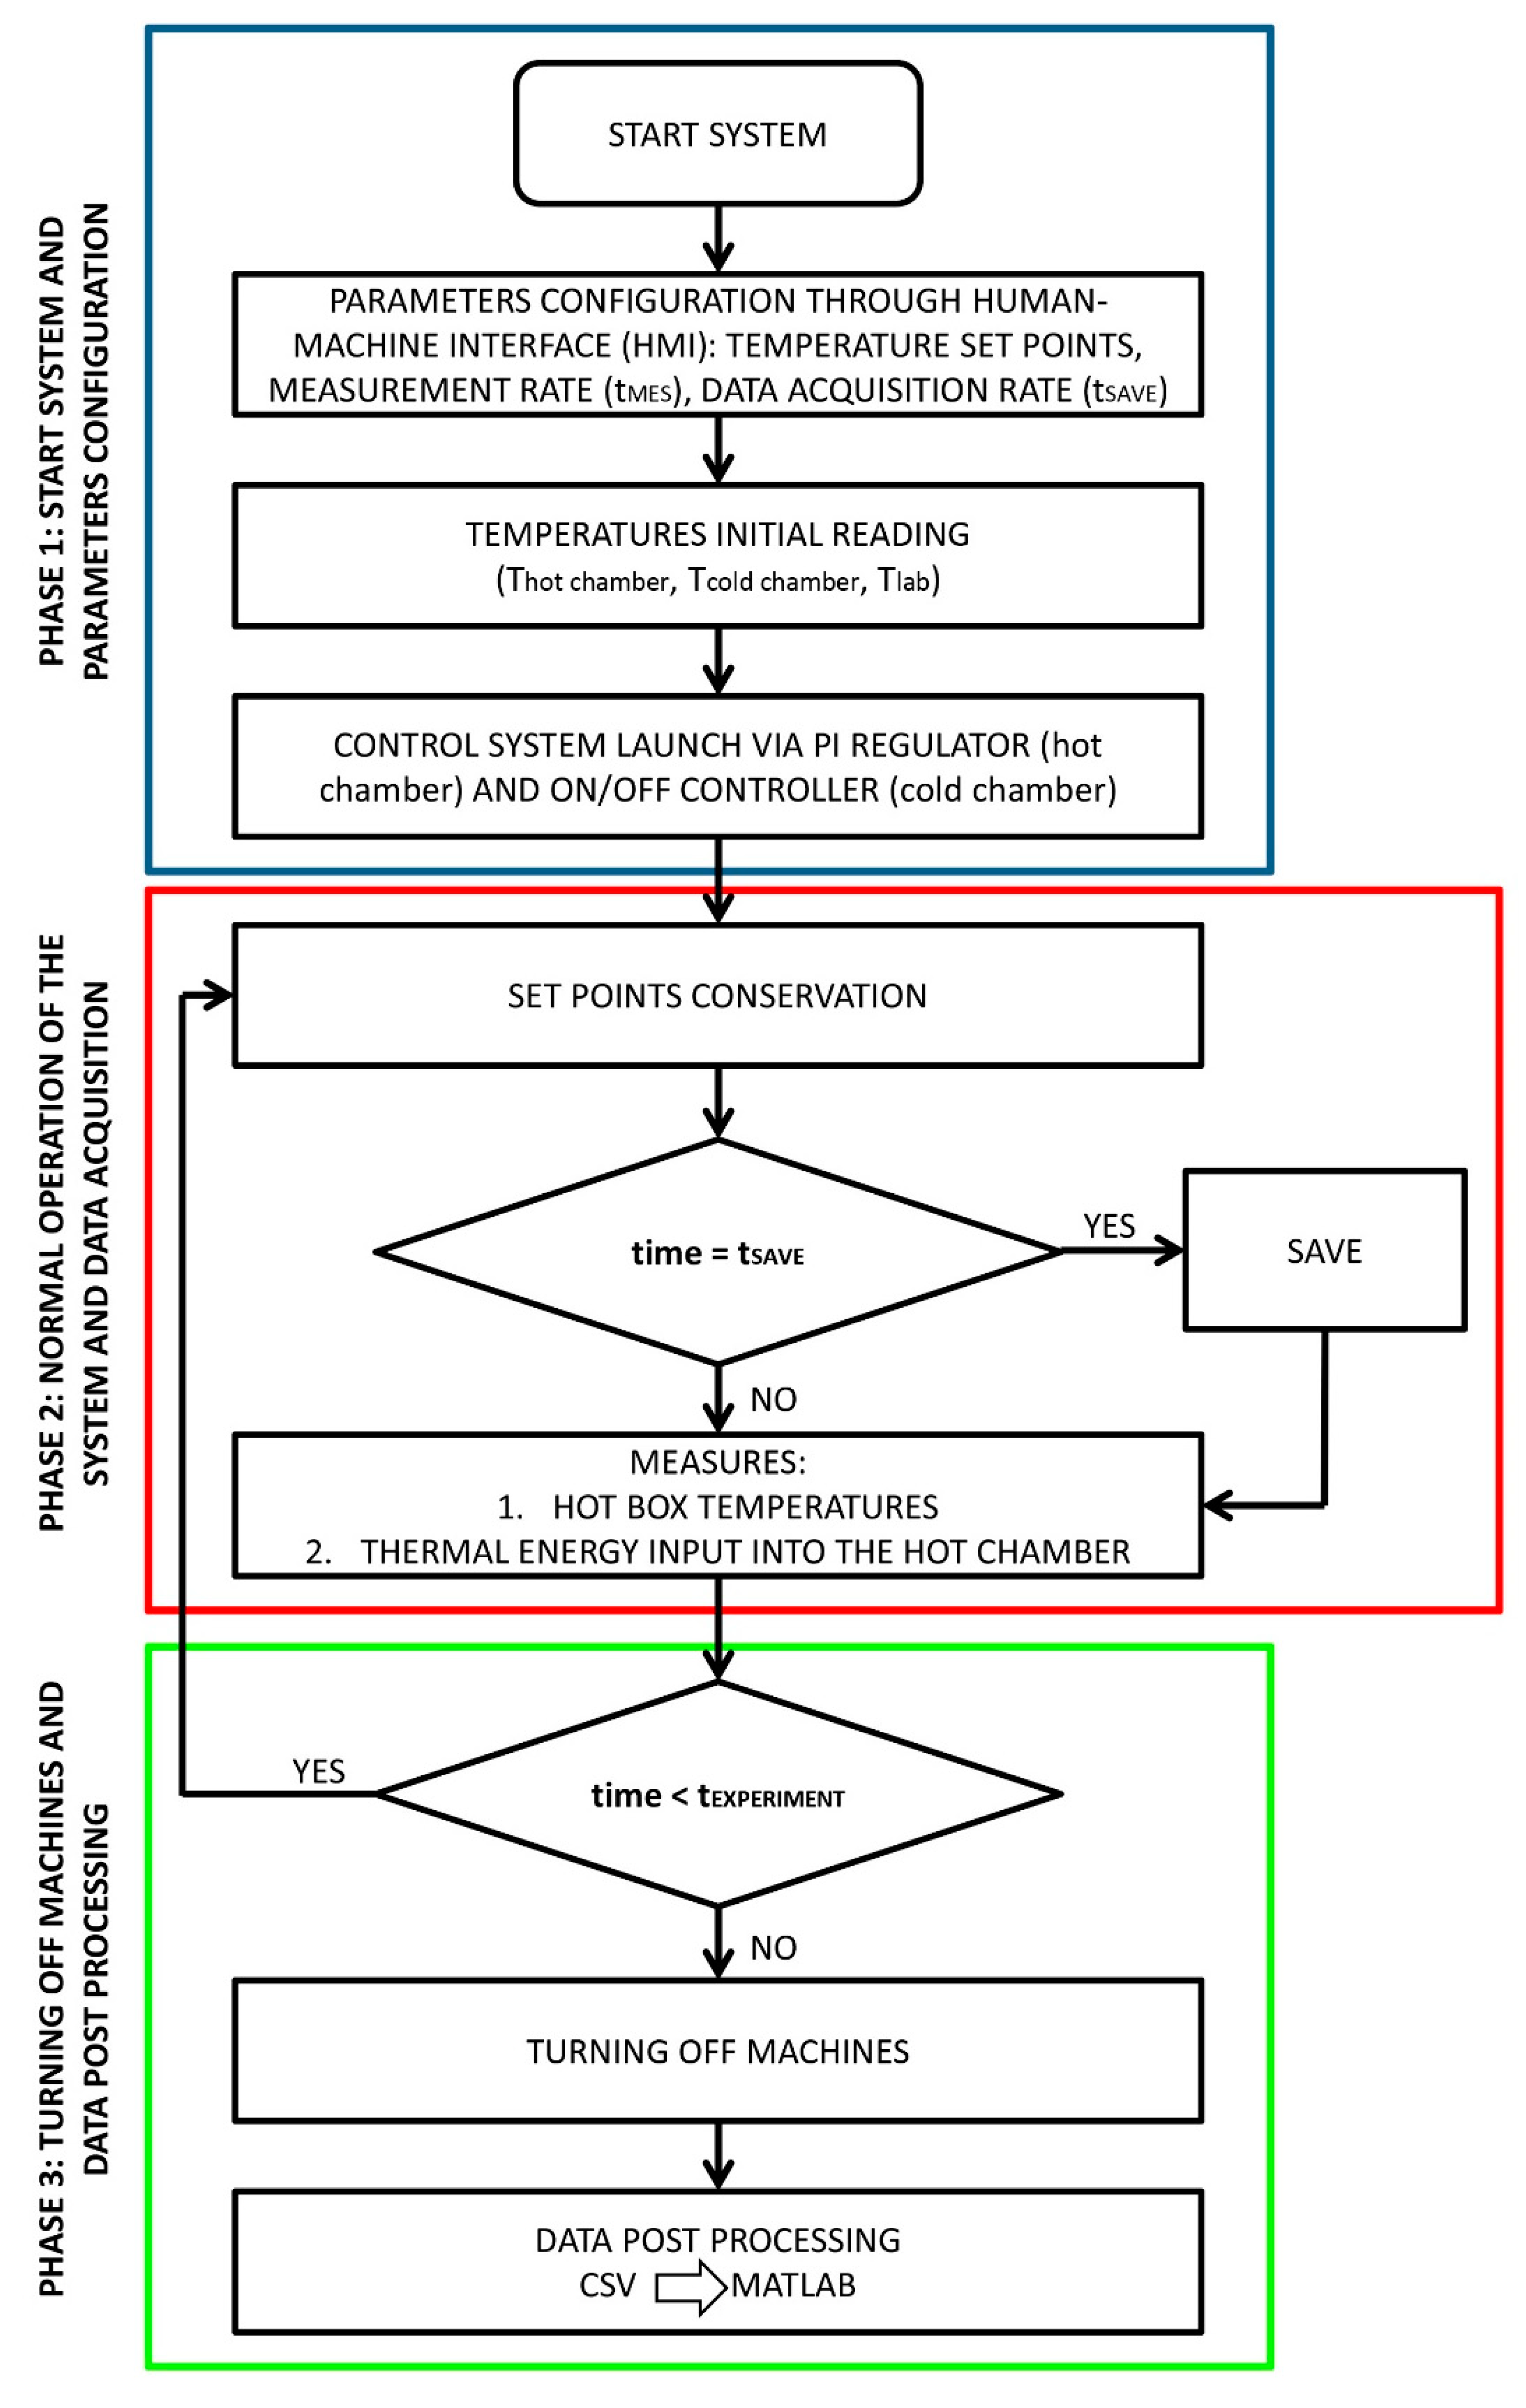
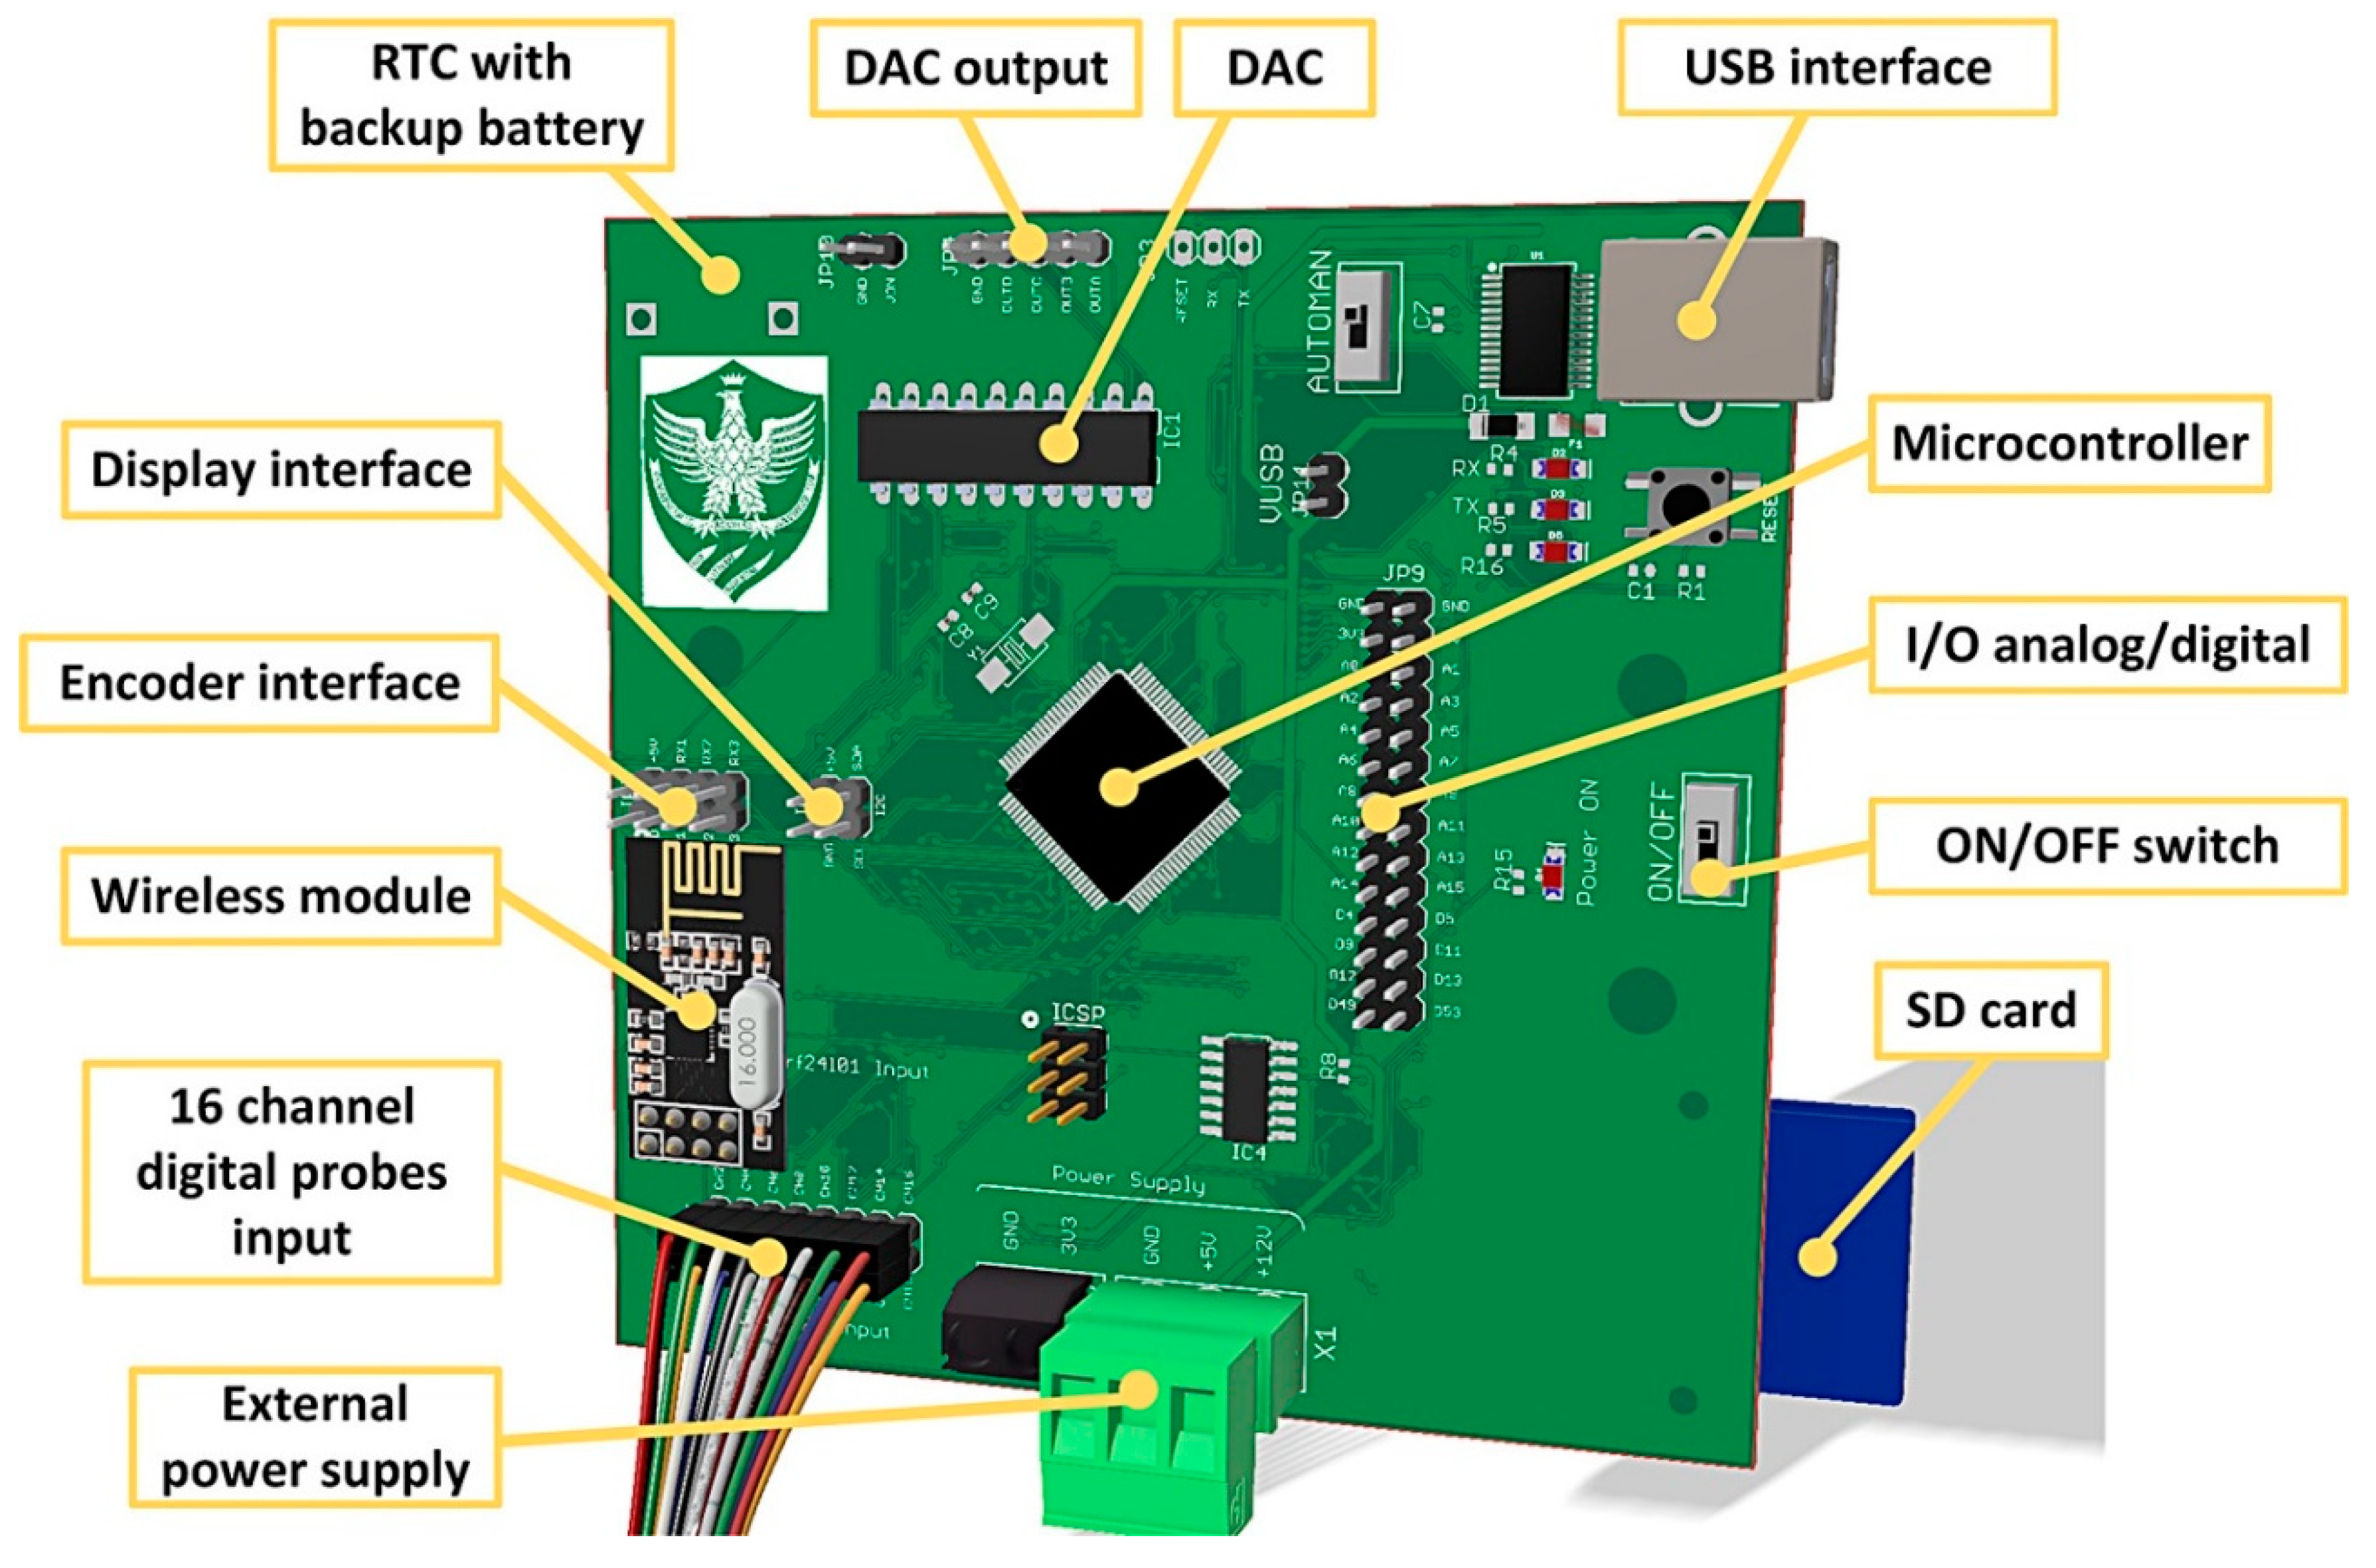


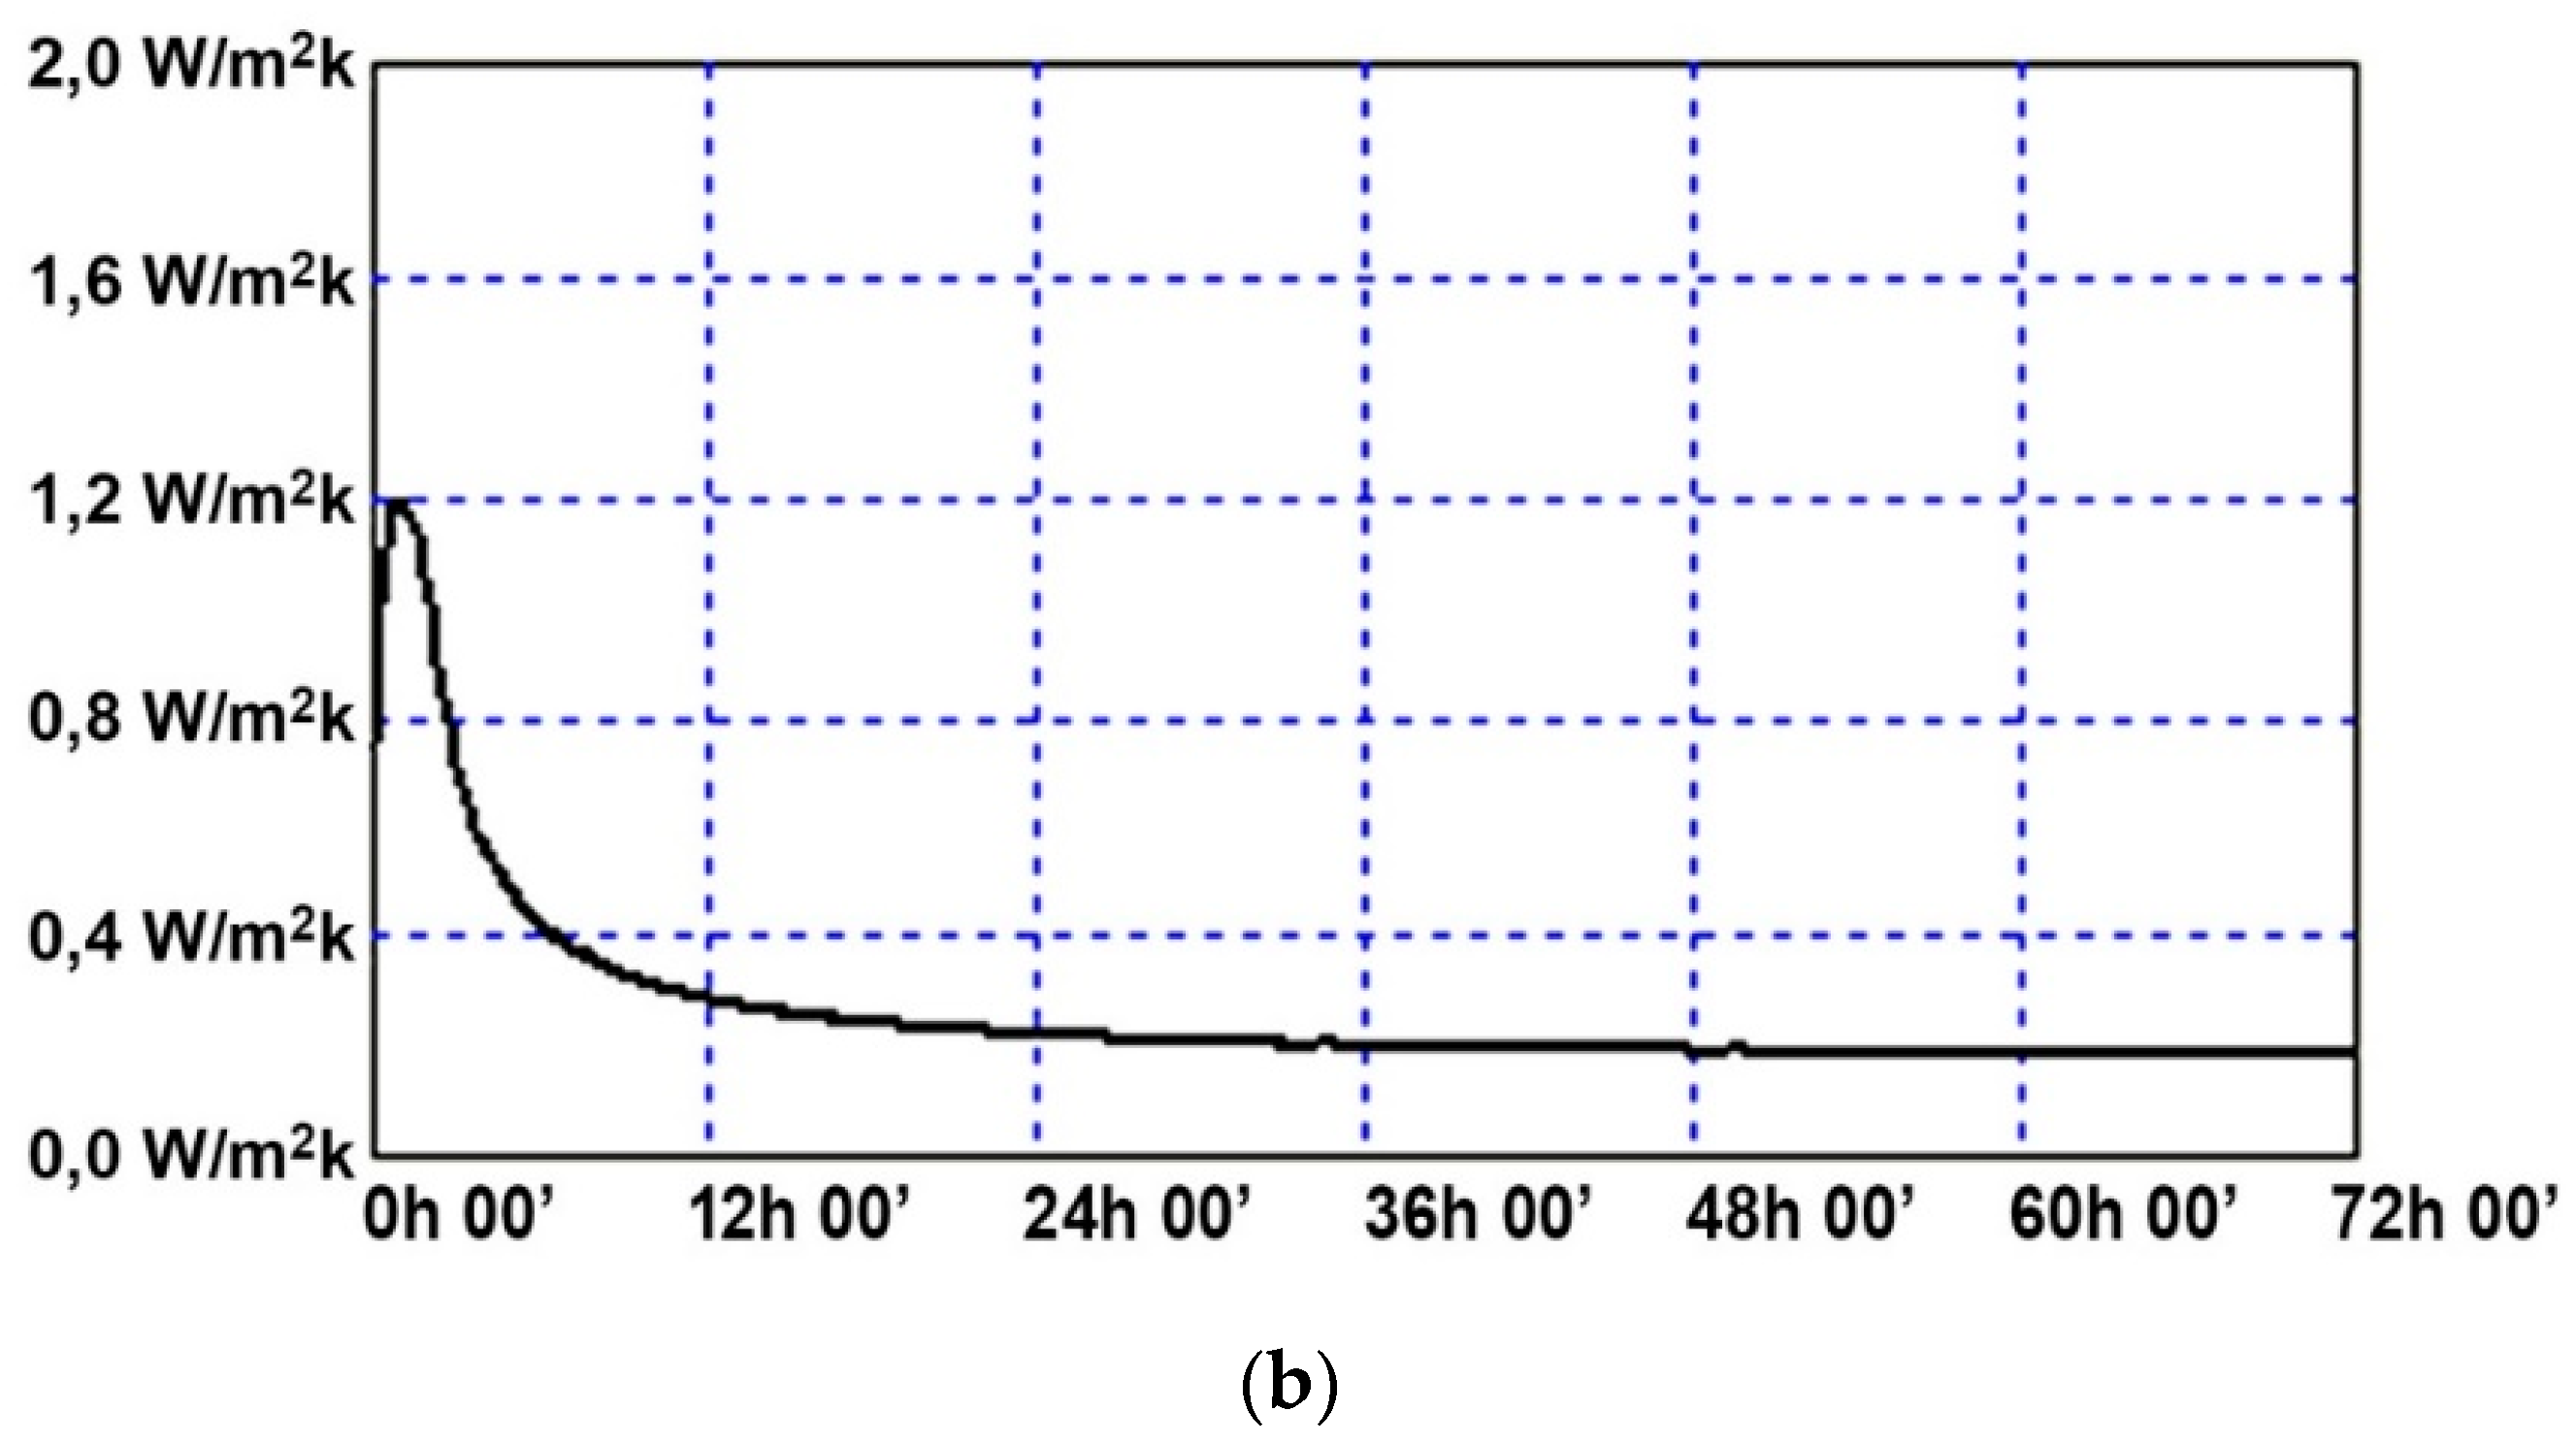
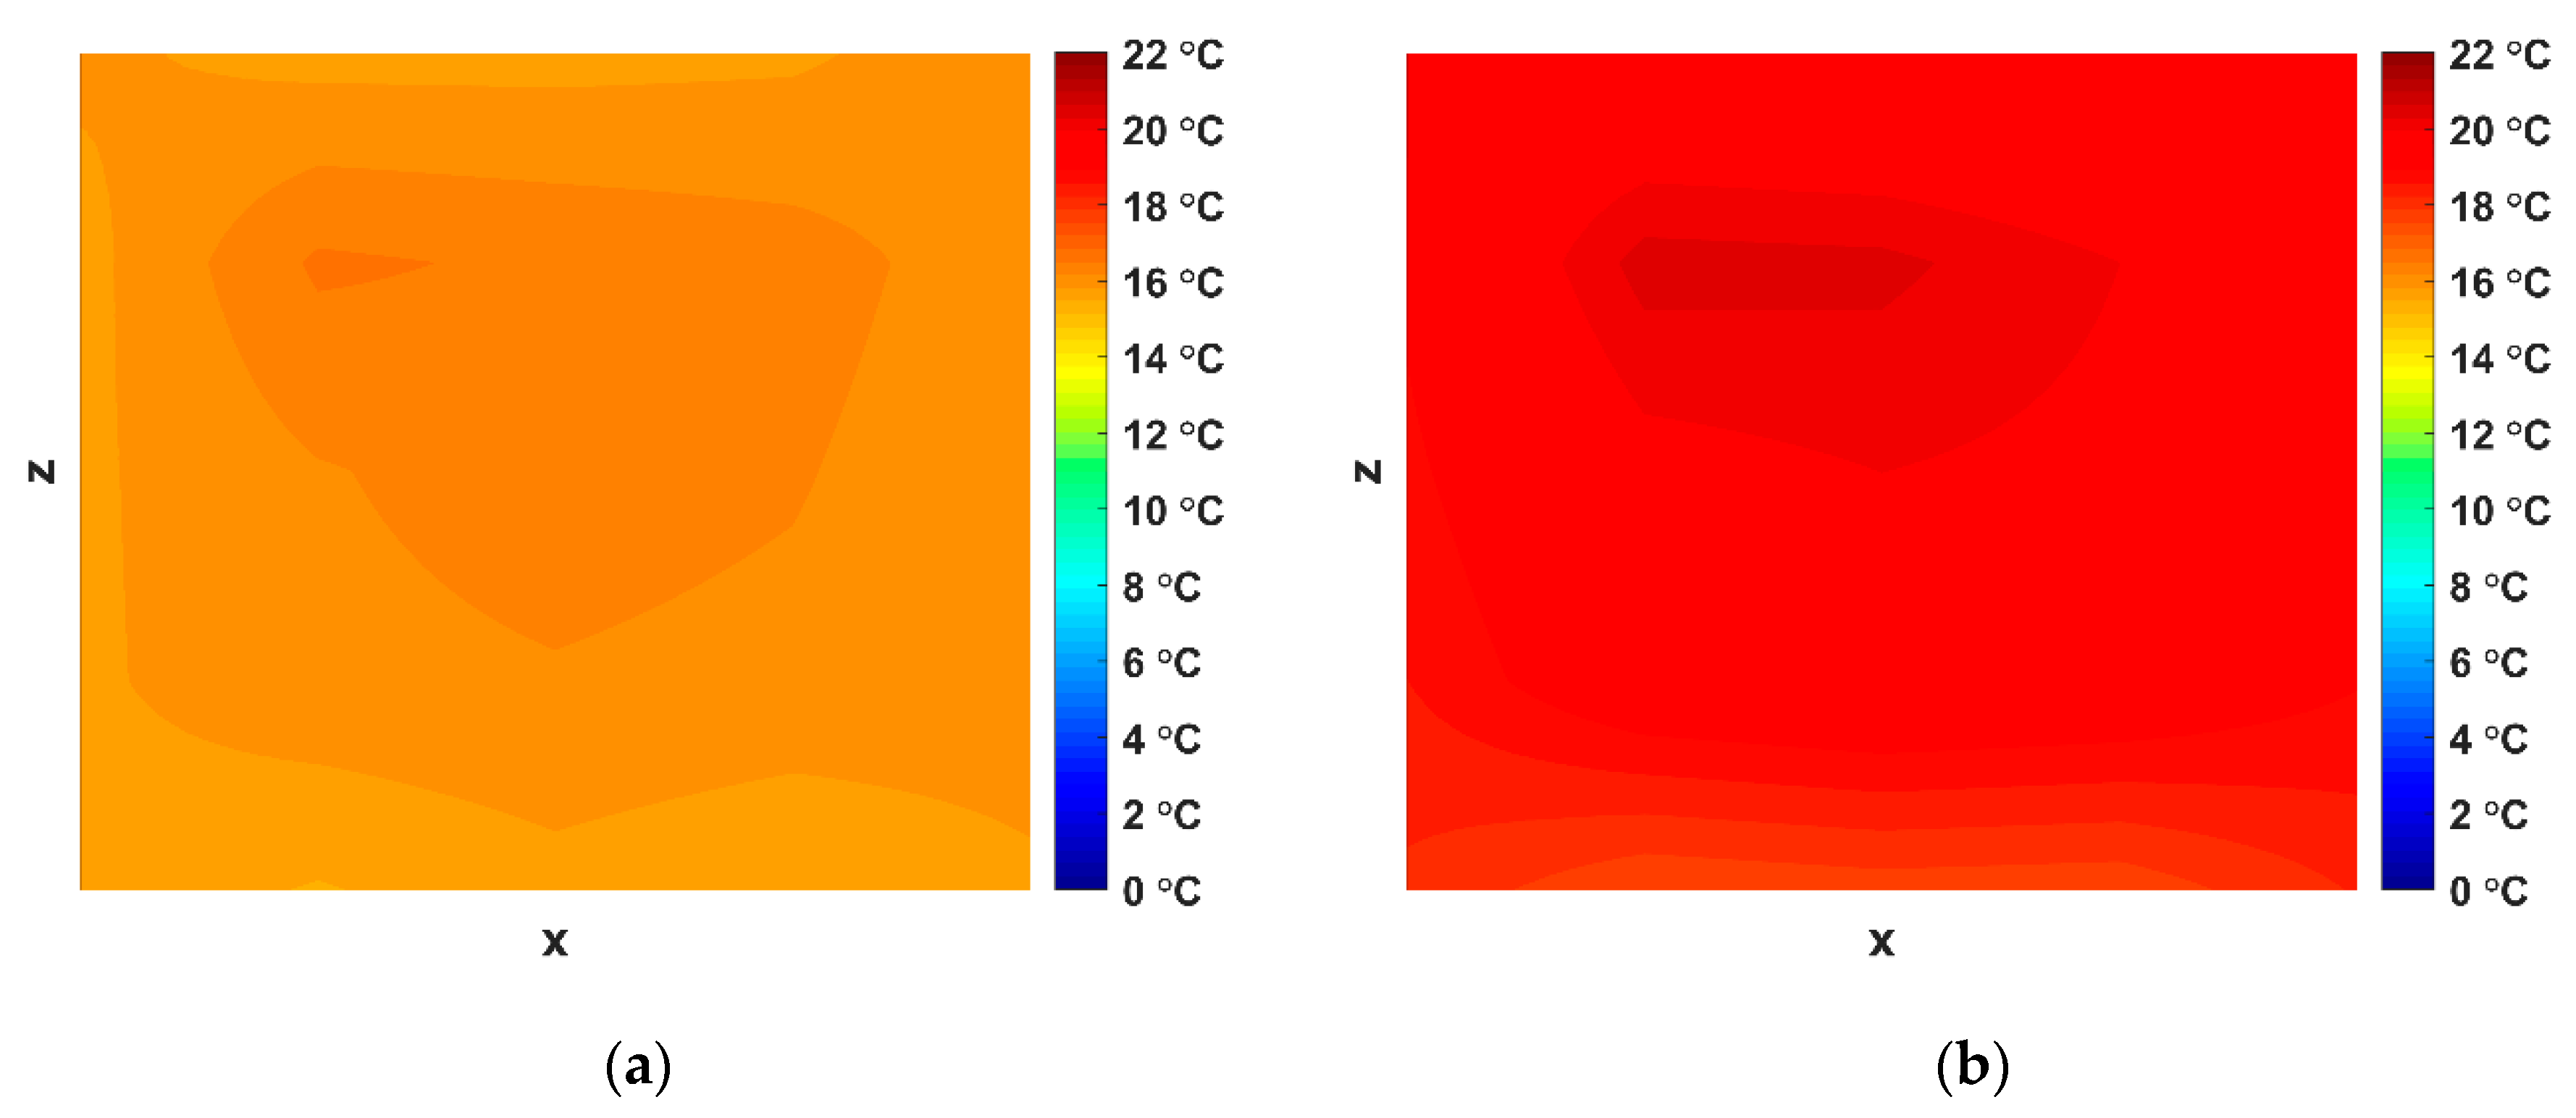
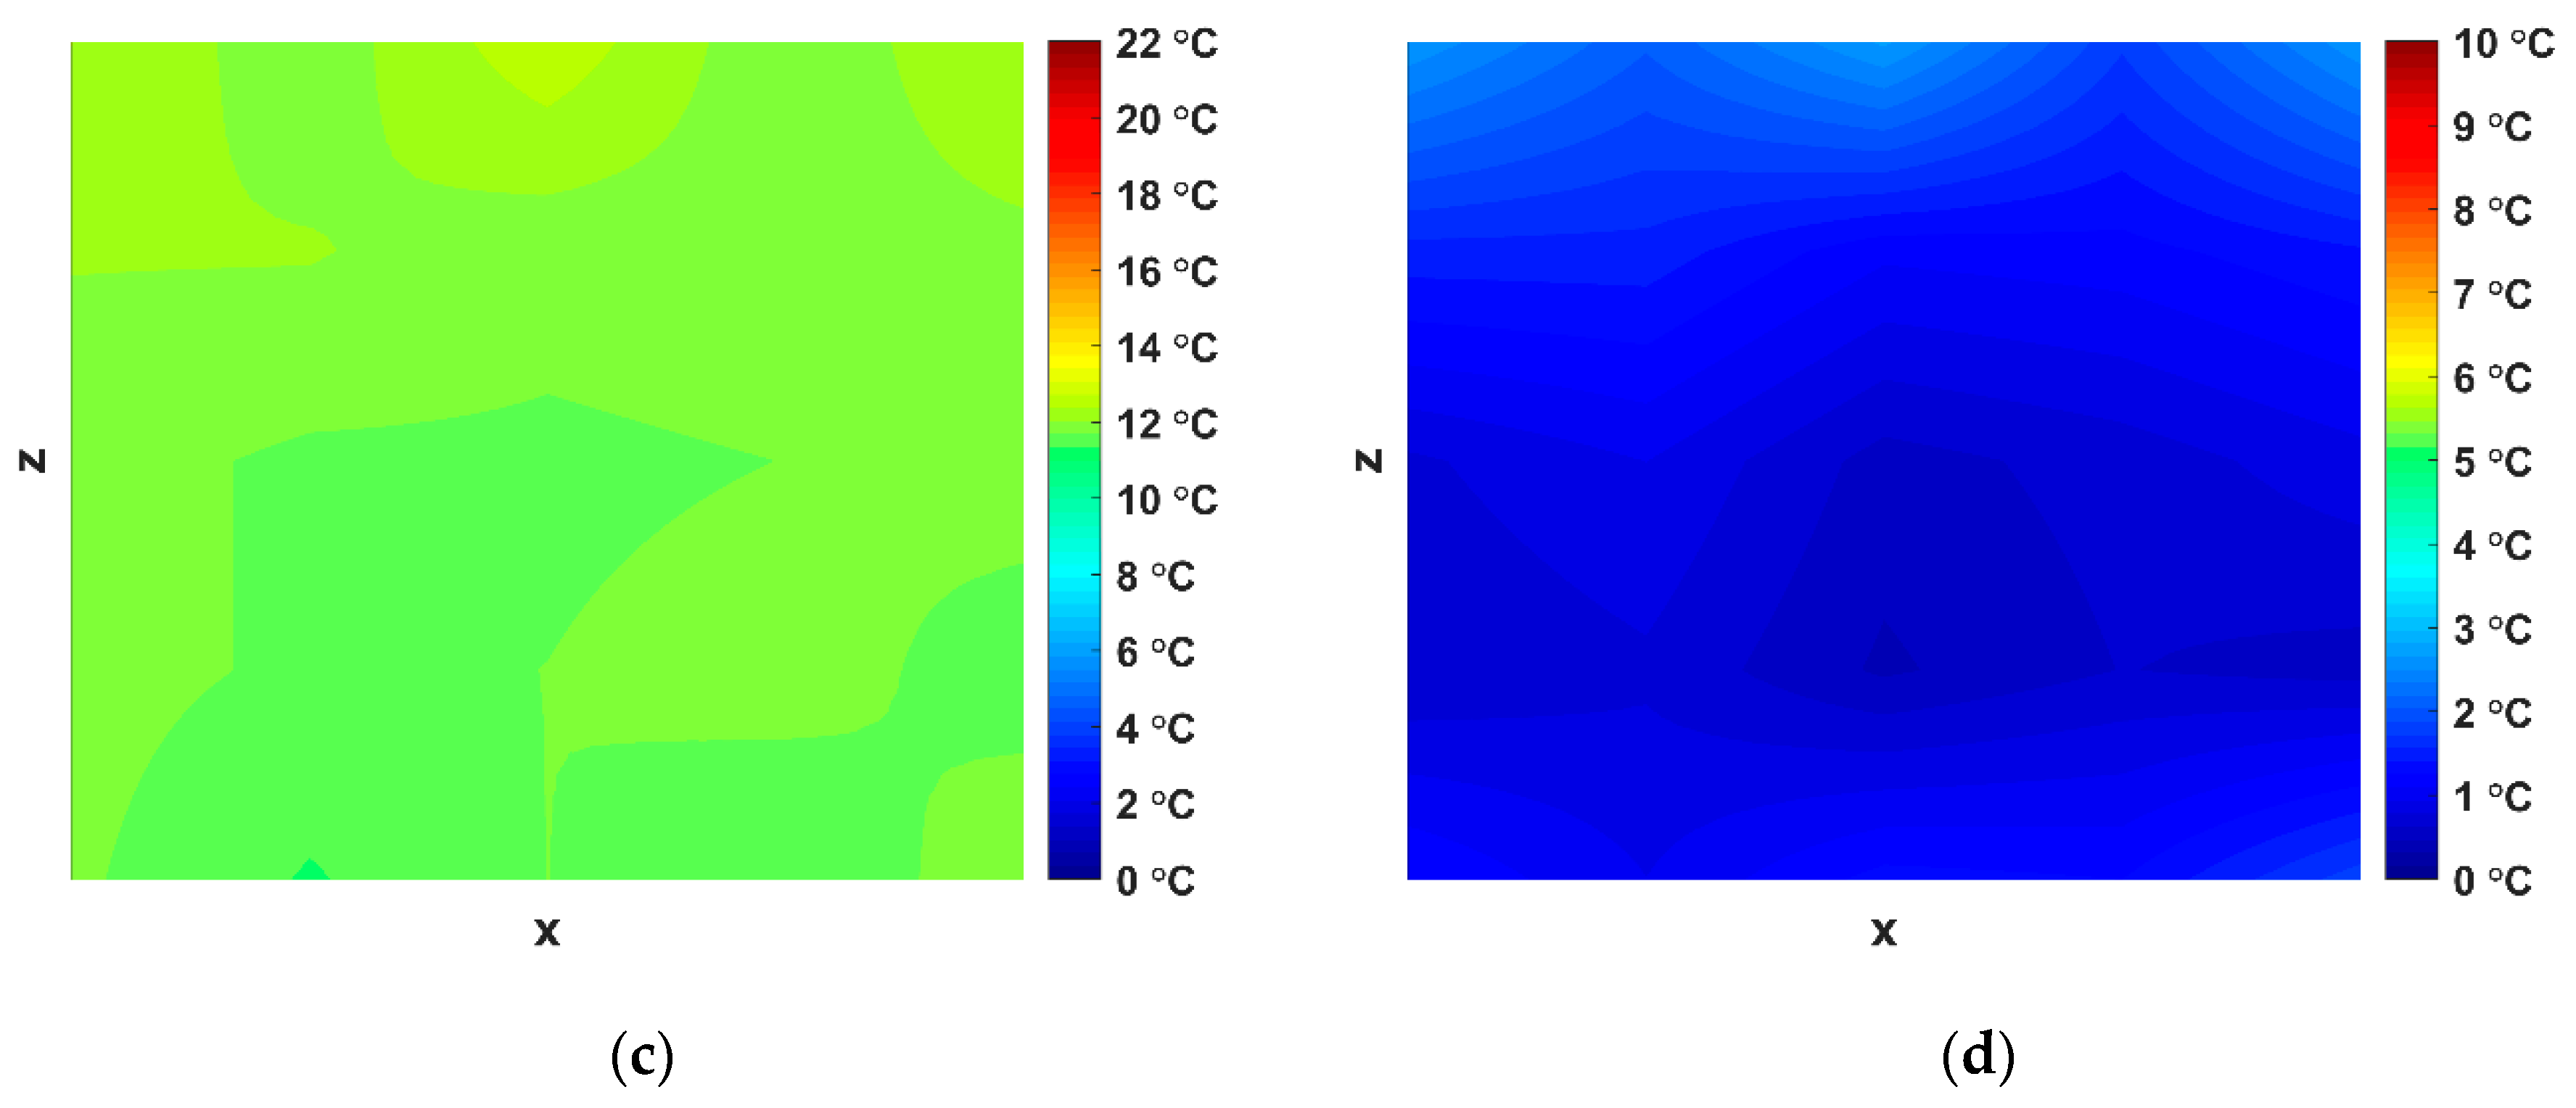
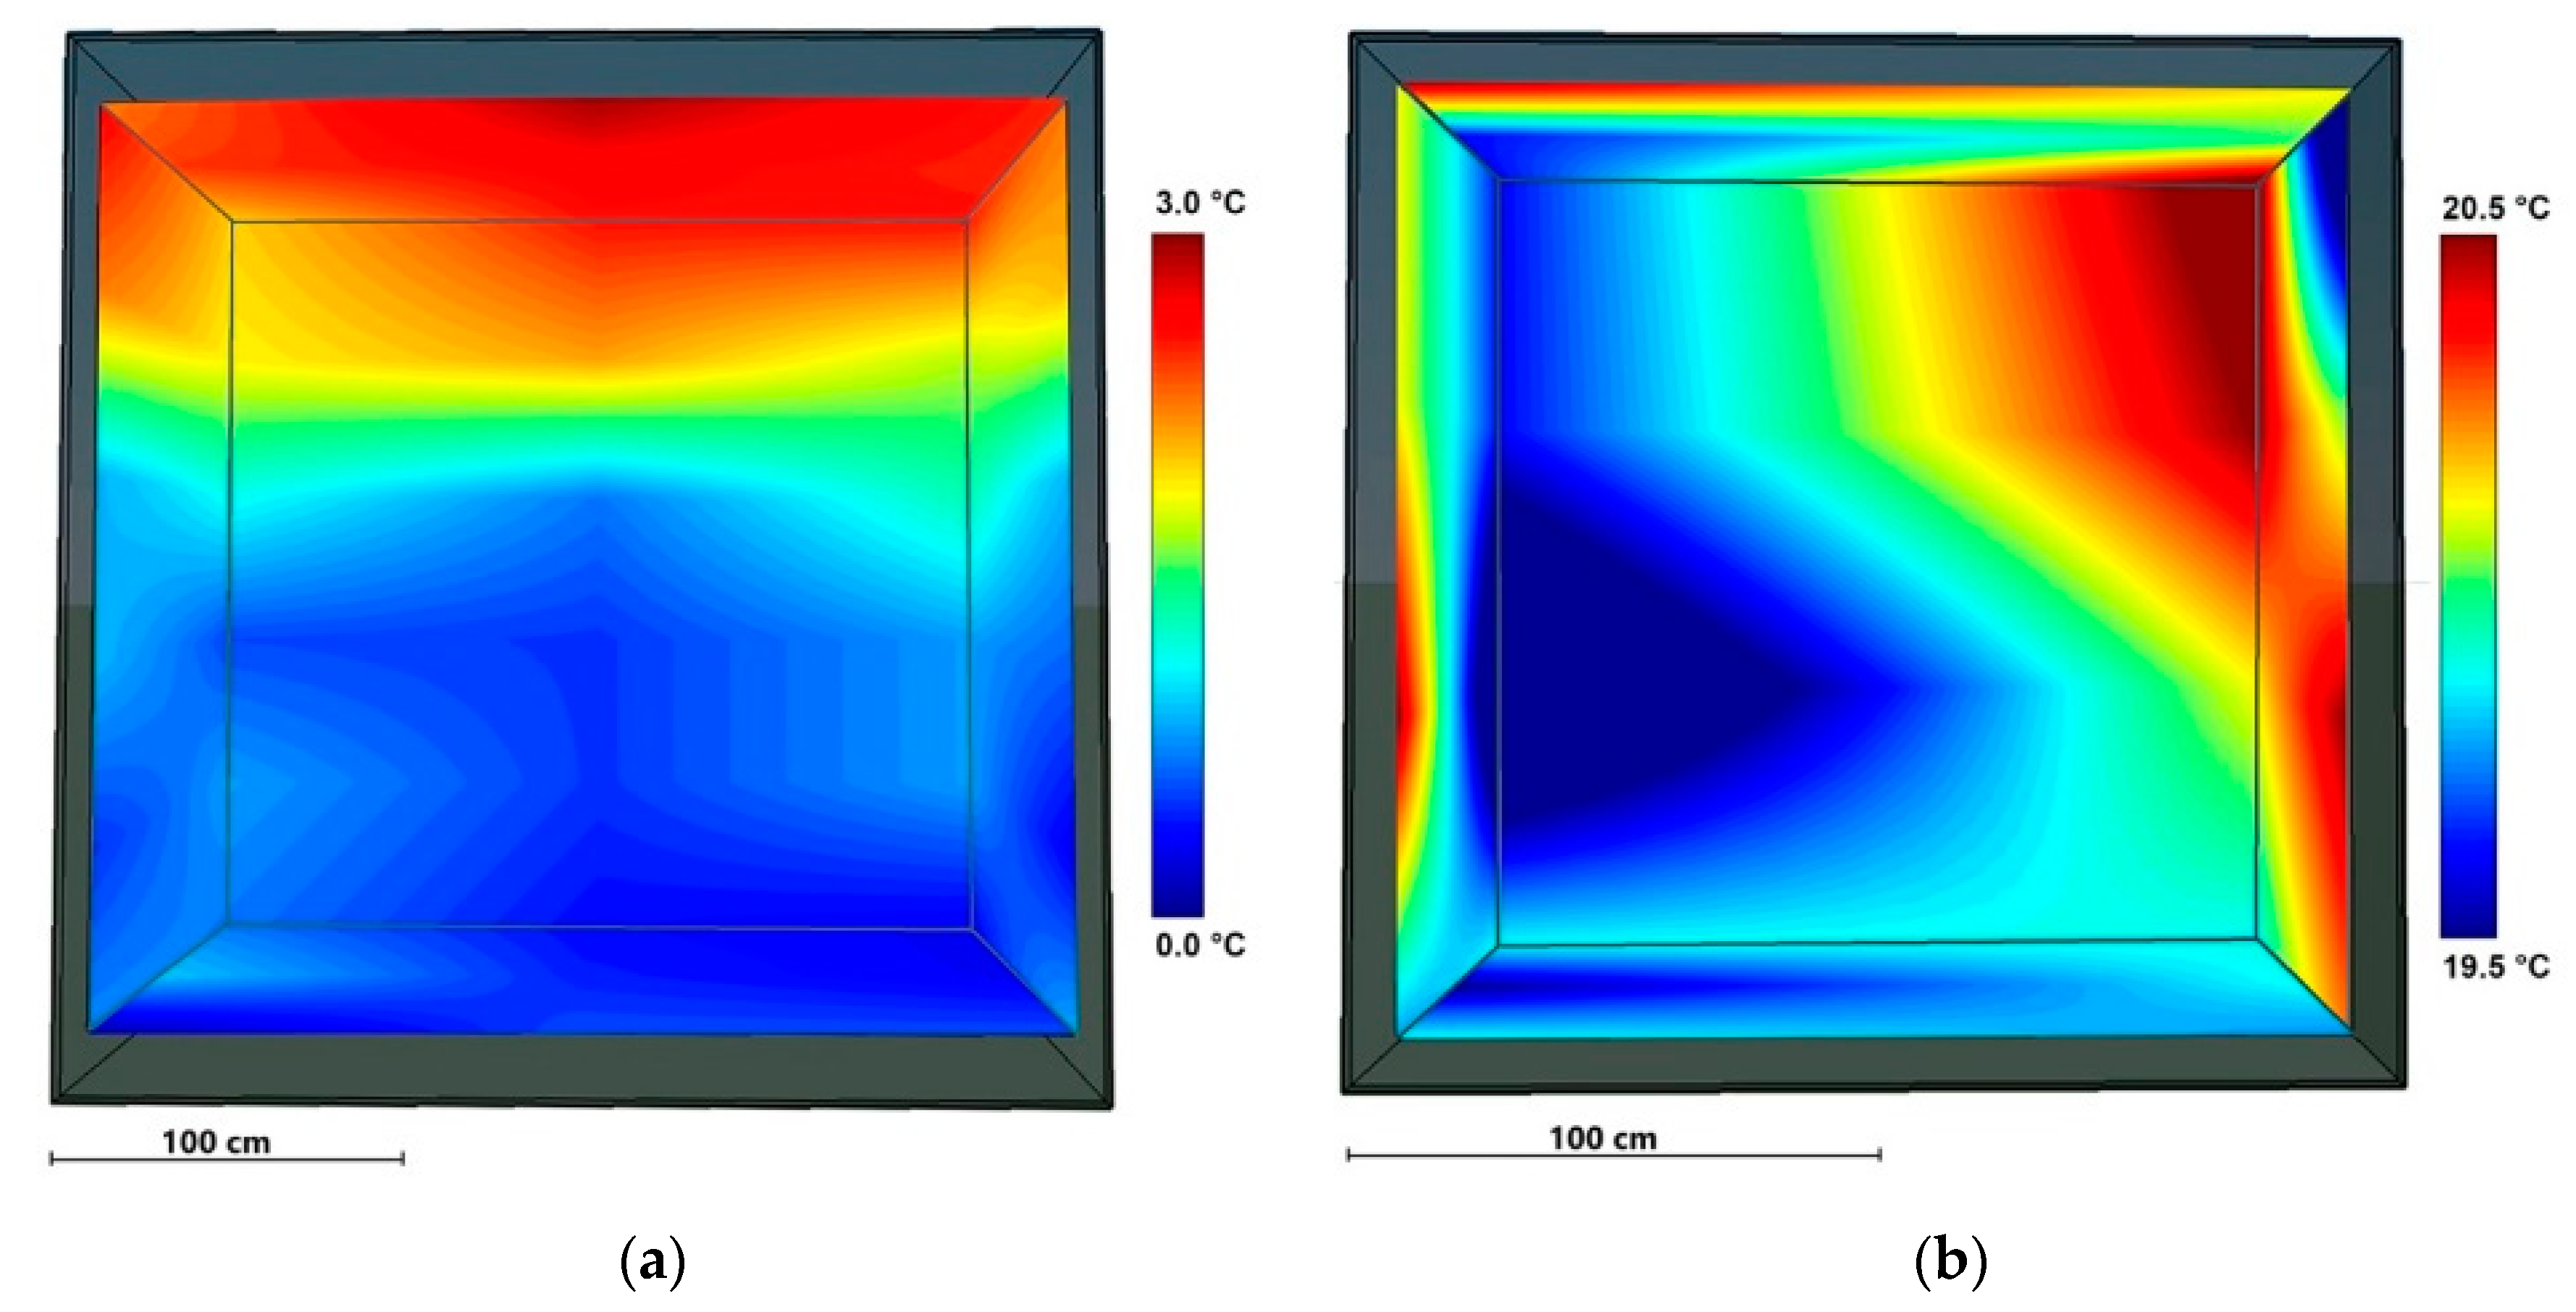
| Authors | Year | Hot Box Typology | Temperature Probe Typology (and Number) | Measuring System | Control System |
|---|---|---|---|---|---|
| Koo et al. [13] | 2018 | C | T-type TC (5 a) | n.a. | n.a. |
| Biswas et al. [14,15] | 2018 | G | TC (25 a) | n.a. | n.a. |
| Woltman et al. [3] | 2017 | C | T-type TC | OM-320 Data Acquisition System | OMRON E5CK digital controller |
| Caruana et al. [4] | 2017 | C | TC (18 a + 20 b) | n.a. | n.a. |
| Gullbrekken et al. [5] | 2017 | G | T-type TC (39 a) | n.a. | n.a. |
| Prata et al. [6] | 2017 | C | T-type TC (48 a) | GL820 Midi DataLogger | n.a. |
| Lechowska et al. [7] | 2017 | G | n.a. | Ahlborn Almemo (Ahlborn Mess—und Regelungstechnik GmbH, Deutschland) | AMR Ahlborn WinControl system |
| Sassine et al. [16] | 2017 | S | TC (6 a + 2 b) | Digital multimeter | Microcomputer |
| Peters et al. [17] | 2017 | C | TR | Arduino data logger + HOBO loggers | n.a. |
| Douzane et al. [18] | 2016 | G | T-type TC | n.a. | n.a. |
| Buratti et al. [19,20] | 2016 | C | TR (8 a + 9 b) | PC | PID control system |
| Basak et al. [21] | 2016 | G | K-type TC | Agilent Data Acquisition Systems 34970A | MATLAB fuzzy scripts |
| Grynning et al. [22] | 2015 | G | TC | n.a. | n.a. |
| Seitz et al. [23] | 2015 | C | T-type TC (64 a, b) | Four 16-channel data acquisition cards (two MCCDAQ USB-2416 with AI-EXP32 | Omega 2110J |
| Pernigotto et al. [24,25] | 2015 | C | T-type TC (24 a) | Digital multimeter | PID control system |
| Faye et al. [26] | 2015 | C | K-type TC | n.a. | n.a. |
| Meng et al. [27] | 2015 | S | T-type TC (10 a) | JTRG-II automatic tester | Voltage regulator |
| Manzan et al. [28] | 2015 | C | TR (4 a + 2 b) | Babuc A by LSI | On/off thermostat |
| Seitz et al. [29] | 2014 | G | TC | n.a. | n.a. |
| Vereecken et al. [30] | 2014 | C | n.a. | n.a. | n.a. |
| Ghosh et al. [31] | 2014 | G | K-type TC | Agilent Data Acquisition Systems 34970A | PID logic P logic P logic with duty cycle control |
| Sousa et al. [32] | 2014 | C | n.a. | n.a. | n.a. |
| Kus et al. [33] | 2013 | C | K-type YC (34 a, b Test 1 - 52 a, b Test 2) | Ahlborn Almemo | AMR Ahlborn WinControl system |
| Chen et al. [34] | 2012 | G | T-type TC (372 b) and TR (33 b) | n.a. | PID control system |
| Martin et al. [35] | 2012 | G | T-type TC (172 a, b) | n.a. | Indirect system |
| Grynning et al. [36] | 2011 | C | TC (38 a) | n.a. | n.a. |
| Asdrubali et al. [37] | 2011 | C | T-type TC (142 b) | PC | PID control system |
| Qin et al. [38] | 2009 | S | TC (6 a) | n.a. | n.a. |
| Description | Thickness (cm) | Density (kg/m3) | Conductivity (W/mK) | Resistance (m2K/W) | |
|---|---|---|---|---|---|
| External surface resistance | - | - | - | 0.04 | |
| 1 | Plasterboard | 1.25 | 900 | 0.210 | 0.06 |
| 2 | Plasterboard | 1.25 | 900 | 0.210 | 0.06 |
| 3 | EPS and graphite | 10.00 | 32 | 0.031 | 3.23 |
| 4 | X-lam panel | 10.00 | 470 | 0.130 | 0.77 |
| 5 | Mineral wool | 5.00 | 135 | 0.039 | 1.28 |
| 6 | Plasterboard | 1.25 | 900 | 0.210 | 0.06 |
| 7 | Plasterboard | 1.25 | 900 | 0.210 | 0.06 |
| Internal surface resistance | 0.13 | ||||
| Overall thermal resistance | 5.69 | ||||
| Parameter | Value | U.M. |
|---|---|---|
| Set point temperature—hot chamber | 20.0 | °C |
| Set point temperature—cold chamber | 0.0 | °C |
| Data acquisition rate | 10 | min |
| Instrument | Type | Measuring Range | Resolution |
|---|---|---|---|
| Fluxmeter | Hukseflux HFP01 | −2000 to 2000 W/m2 | 50 µV/W/m−2 |
| Temperature probes | LSI Lastem EST124-Pt100 | −40 to 80 °C | 0.01 °C |
| Datalogger | LSI Lastem M-Log ELO008 | −300 to 1200 mV | ±100 µV |
| Approach | U-Value [W/m2K] | Percentage Variation [%] a |
|---|---|---|
| Theoretical calculation | 0.176 ± 0.03 | - |
| Heat flow meter | 0.177 ± 0.01 | 0.57 |
| Guarded hot box | 0.216 ± 0.01 | 18.37 |
© 2019 by the authors. Licensee MDPI, Basel, Switzerland. This article is an open access article distributed under the terms and conditions of the Creative Commons Attribution (CC BY) license (http://creativecommons.org/licenses/by/4.0/).
Share and Cite
de Rubeis, T.; Muttillo, M.; Nardi, I.; Pantoli, L.; Stornelli, V.; Ambrosini, D. Integrated Measuring and Control System for Thermal Analysis of Buildings Components in Hot Box Experiments. Energies 2019, 12, 2053. https://doi.org/10.3390/en12112053
de Rubeis T, Muttillo M, Nardi I, Pantoli L, Stornelli V, Ambrosini D. Integrated Measuring and Control System for Thermal Analysis of Buildings Components in Hot Box Experiments. Energies. 2019; 12(11):2053. https://doi.org/10.3390/en12112053
Chicago/Turabian Stylede Rubeis, Tullio, Mirco Muttillo, Iole Nardi, Leonardo Pantoli, Vincenzo Stornelli, and Dario Ambrosini. 2019. "Integrated Measuring and Control System for Thermal Analysis of Buildings Components in Hot Box Experiments" Energies 12, no. 11: 2053. https://doi.org/10.3390/en12112053
APA Stylede Rubeis, T., Muttillo, M., Nardi, I., Pantoli, L., Stornelli, V., & Ambrosini, D. (2019). Integrated Measuring and Control System for Thermal Analysis of Buildings Components in Hot Box Experiments. Energies, 12(11), 2053. https://doi.org/10.3390/en12112053


