Article

Aggregation Strategy for Reactive Power Compensation Techniques—Validation

1
MEAN4SG & DITEN—University of Genoa, via all’Opera Pia 11a, 16145 Genova, Italy
2
DITEN—University of Genova, via all’Opera Pia 11a, 16145 Genova, Italy
*
Author to whom correspondence should be addressed.
Energies 2019, 12(11), 2047; https://doi.org/10.3390/en12112047
Submission received: 15 April 2019 / Revised: 9 May 2019 / Accepted: 24 May 2019 / Published: 28 May 2019

Abstract

:
Reactive power provision is a vital ancillary service, which provides opportunities to service market and power generators. The net reactive power in a balanced power grid needs to be zero, and the imbalance occurs due to the capacitive and inductive behavior of the extensive transmission lines, and because of the intermittent behavior of load-demand. This mismanagement in reactive power causes voltage instability, and hence the paper compares the most common reactive power compensation techniques, which are prevalent in both literature and commercial levels. The paper perceives the trade-off between the compared techniques, and realizes to use the aggregation of different techniques to present a coordinated control mechanism that complies with the Italian regulations. The parameters for the proposed aggregation include the amount of reactive power, real power losses during reactive power provision, and response time. The paper then implements IEEE 9 bus transmission-generation system in DIgSILENT to set up the platform for validation of the proposed strategy. Finally, it simulates Transmission System Operator (TSO) test cases on the implemented test system.

1. Introduction

Wind and solar resources are ponderously integrated in the distribution grid due to the high possibility of incentives, which causes the dynamic changes in the distribution system [1,2,3,4]. System operators do not have direct influence on these changes, as the addition is not fully visible to them with a reduction in hosting capacity [5], as calculated in [6]. As a result, the power system faces many complexities, like changes in over-current protection schemes due to the facts that are discussed in [7,8]. The effects on system reliability are discussed in detail in [9,10].
System stability, their limitations, and challenges that are associated with penetration of renewable resources are available in [11,12]. Voltage stability and, in particular, voltage loading, is affected, as in [13], which used storage system for the voltage management. The concepts of voltage stability, its importance, and implications on power system are inferred from [14]. References [15,16] discuss the voltage fluctuations and the violations of over voltage and under-voltage limits due to these intermittent renewable resources. These voltage quality issues and their effects are further supported by [17,18], with an emphasis on problems for TSO. Amongst all of the issues, voltage deviations at the power system buses are the points of focus in this paper. These voltage deviations are due to the reactive power mismatches at transmission networks and loads. The basic principle of equality in reactive power generation and its consumption is violated, which leads to voltage profiling issues.
Reactive power balance is a vital ancillary service [19,20], as the integration of renewables make the voltage loading issue more dynamic. Reactive power management is the key towards ensuring voltage stability, as demonstrated in [21]. In other words, reactive power imbalances at the power grid cause voltage instability and loading violations. The power system can even suffer catastrophes, such as blackouts and contingencies that are due to these imbalances, as described in [22]. The two main mismatch creators are the transmission networks and the load side varying demand, as in [23,24,25]. In Italy, Transmission System Operator (TSO) controls this mismanagement under ancillary services provision. TSO takes this provision from conventional generators as mandatory provision [26]. The paper follows Italian conventions, and later performs validation for reactive power mismatches only at the transmission level.
In current practices, synchronous Generators (SG) that are operated under conventional power plants are used for overcoming these mismatches. However, there are other reactive power management techniques as both market and research solutions. However, the policies vary for the TSO of each country, and thus the nature of their use varies accordingly. Their use is further dependent on the parameters of cost (installation and operational), efficiency, they quantity of support, and the ease of adaption. The application area of power system further limits the use [27,28].
Some literature discussions are on Voltage Regulation Distribution Transformer using On Load Tap Changer [29], Automatic Voltage Regulator (AVR) at generation side [30], and fuzzy logic based coordinated Power System Stabilizer (PSS), together with AVR at the generation side [31]. Others include synchronous Condensers (SC) with techno-economic analysis in [32,33], mechanically switched capacitors [34], and coordinated control between the switched capacitors and Static Synchronous Compensator (STATCOM) to avoid square voltage fluctuations [35].
Other techniques involve inverters for improving static voltage stability [36], storage system [37], and wind and solar converters that are already installed in the wind and photovoltaic farms, as in [38]. The requirements for their functionality, the trade-offs, and the amount that they can provide are discussed in [39]. A better comparison that involves different techniques and criterion is provided in [40,41]. Reference [42] shows how well designed reactive power sources can be efficiently used for voltage control within and advanced control scheme. It also shows how the effective use of reactive power sources could decrease expensive emergency control actions, such as load shedding (though multi-step control and different weights assigned to different controls). This fact is the motivation towards aggregation approach, as there is aim for the better control of the system in terms of avoidance of expensive controls [42]. Table 1 summarizes the comparison in terms of costs, efficiency, and reactive power capability. Synchronous generators are the most efficient (with very low active power loss due to reactive power provision), and they can provide a high amount of reactive power. However, the associated capital and operating costs are very high. Synchronous condensers can further reduce the capital costs, with the fact that use is from the available synchronous generators, which only requires the conversion costs. With capacitors, it requires many shunt combinations to satisfy the TSO requirements, and the efficiency is degraded with increase in voltage levels (reactive power following square voltage dependency). Thus, FACTS (Flexible AC Transmission Systems) and inverter-based technologies are compared, as in [43,44], to explore their tendencies. The concept of the paper is to utilize these techniques on top of conventional technique of SG, and to aggregate them in the best possible way [1,45,46,47,48,49].
The paper is divided into five sections. Section 2 proposes the aggregation technique, with better steady state response, transient response, costs, and amount of provision, in order to facilitate power plants on TSO requests. The next step is to endorse feasibility of the proposed technique, for which Section 3 describes the simulation model, test case, and the platform for validation. Section 4 covers validation of the strategy, and elaboration and analysis of results. Section 5 concludes the paper, with indications of potential future work.

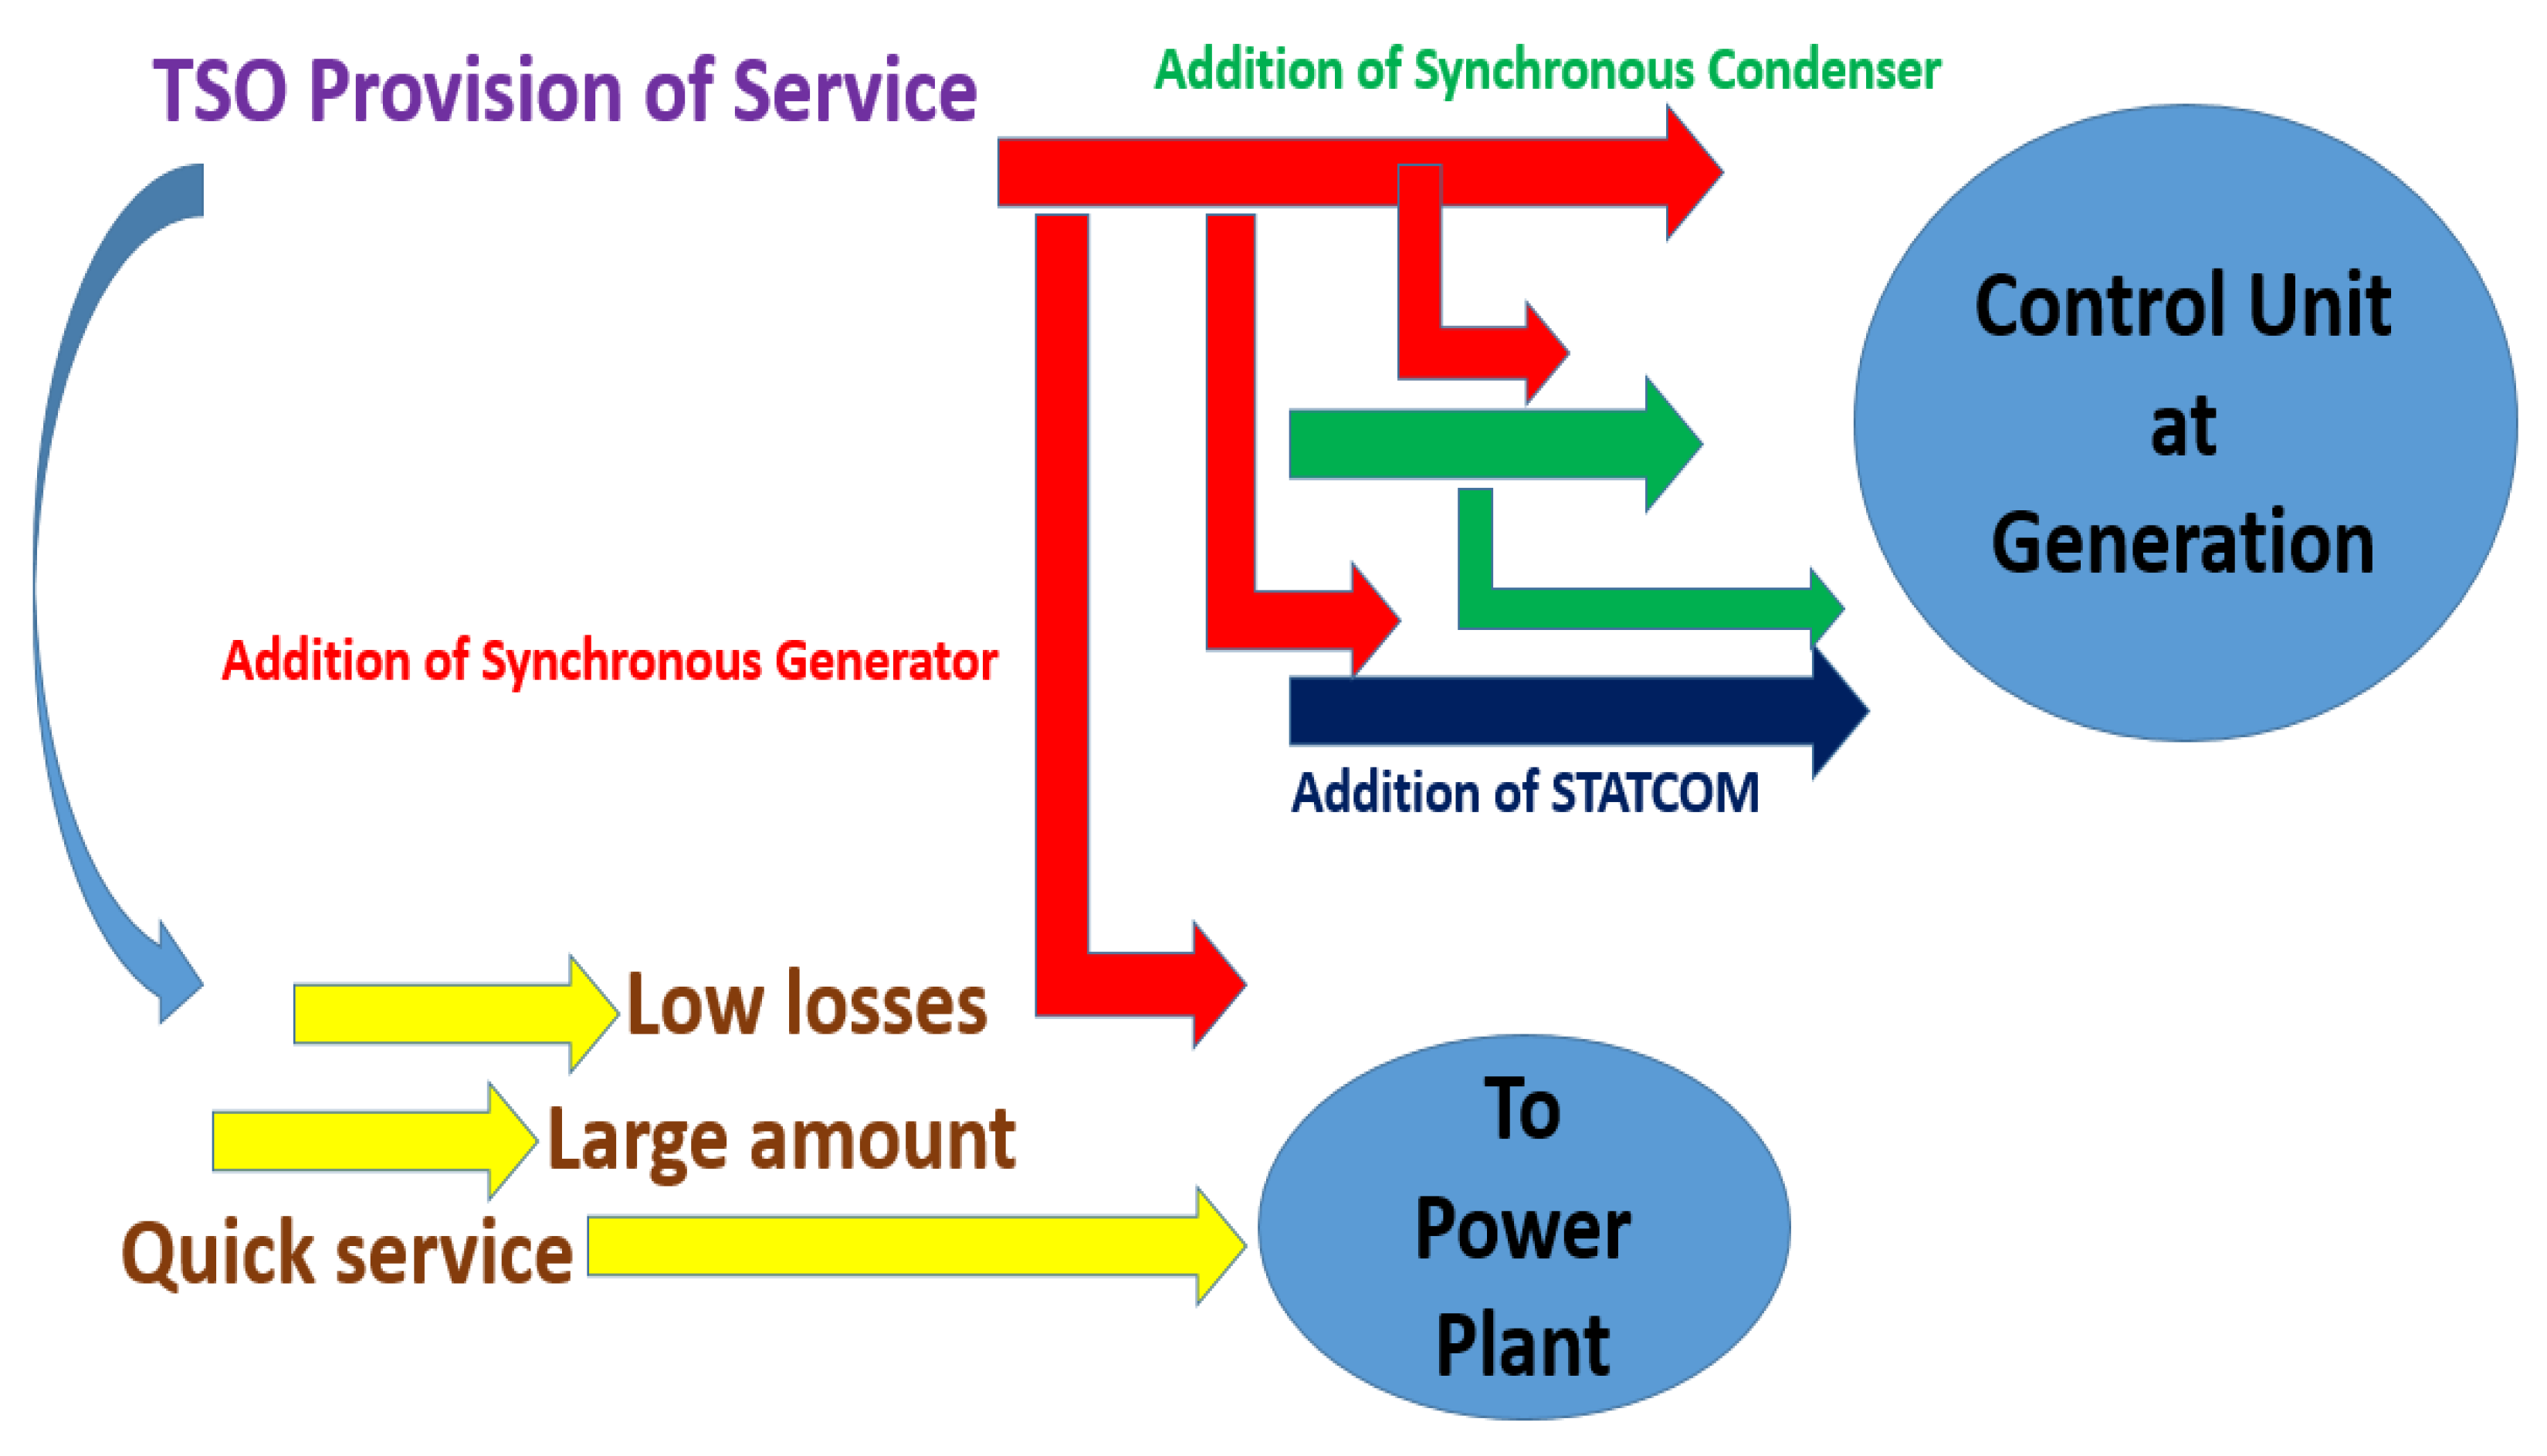
2. Proposed Coordinated Strategy

Since each technique for reactive power has trade-off in its performance, the section is devoted to propose a coordinated strategy. The strategy should follow the requests of TSO in the best possible way. TSO procures the service of reactive power from conventional generation units for the following reasons:
  • Quick service is required in the case of contingencies and urgencies.
  • Huge amount is required in the case of huge deviations.
  • More efficiency is required to justify the better use of resources.
Therefore, TSO requires a strategy that meets the VAR (unit of reactive power) requirements in the best possible way. The strategy initiates with these two points to support the service with low losses, high amounts, and quick restoration:
  • Use of SG for normal conditions, with the addition of synchronous condensers for high steady state reactive power requirements.
  • Addition of STATCOMs for more fast provision.
This initialization leads to four different cases: Normal conditions with SG, the use of additional SG only for any reactive power needs, the addition of synchronous condensers for more provision, and the addition of STATCOM for better transient response. Figure 1 explains the initialization of the strategy, with an elaboration of TSO requirements. The arrows with yellow indicate the type of service from power plants, as requested by TSO. In response to these requests, the control center at power plants can take service from red arrow (SG as mandatory provision for low losses), green arrow (Synchronous Condenser for huge amounts), and blue arrow (STATCOM for fast response).
TSO decides for this provision through the flexibility curve generated at their controllers. The plot in Figure 2 characterizes the strategy-curve, which comes from the following aspects:
  • The use of capacitor banks is eliminated, because reactive power depends on square of voltage, and hence it is not suitable for high and medium voltage applications.
  • SVC is also eliminated due to the voltage non-linear dependency and the associated high costs for the investment.
  • Inverters are skipped too due to the very low provision.
  • Synchronous generators and synchronous condensers are the best in terms of steady state response.
  • STATCOM performs best for the transient cases.
The strategy is mapped with four regions of operation. Region 1 is to guarantee fast response in transient conditions with STATCOM. Region 2 incorporates more use of synchronous generators in order to reduce the operating losses. Region 3 incorporates more use of synchronous condenser in order to reduce the capital costs and to give more flexibility to power plants. Region 4 is the use of all these techniques to satisfy the TSO requirements in an optimal manner.
Region 4 is the prospective one that is to be used in the future. It allocates the added flexibility with regard to advantages of high service provision in both the transient and steady states, with most favorable costs and efficiency. Each one of these regions are visible to both generators and TSO (with a controller-based interface at power plant). Figure 3 describes the benefits of the proposed strategy in terms of speed of response (time taken to arrive maximum provision of SG, named as P1, vs time taken by STATCOM only for the same provision), flexibility (reactive power demand by TSO vs provision by SG only at P1), and the associated capital and operating costs (taken from [1]). All of the comparisons are based on base value of 1. All of these regions need to be validated in order to endorse the feasibility of the presented mechanism. The proceeding section describes the test cases and the platform for validation.

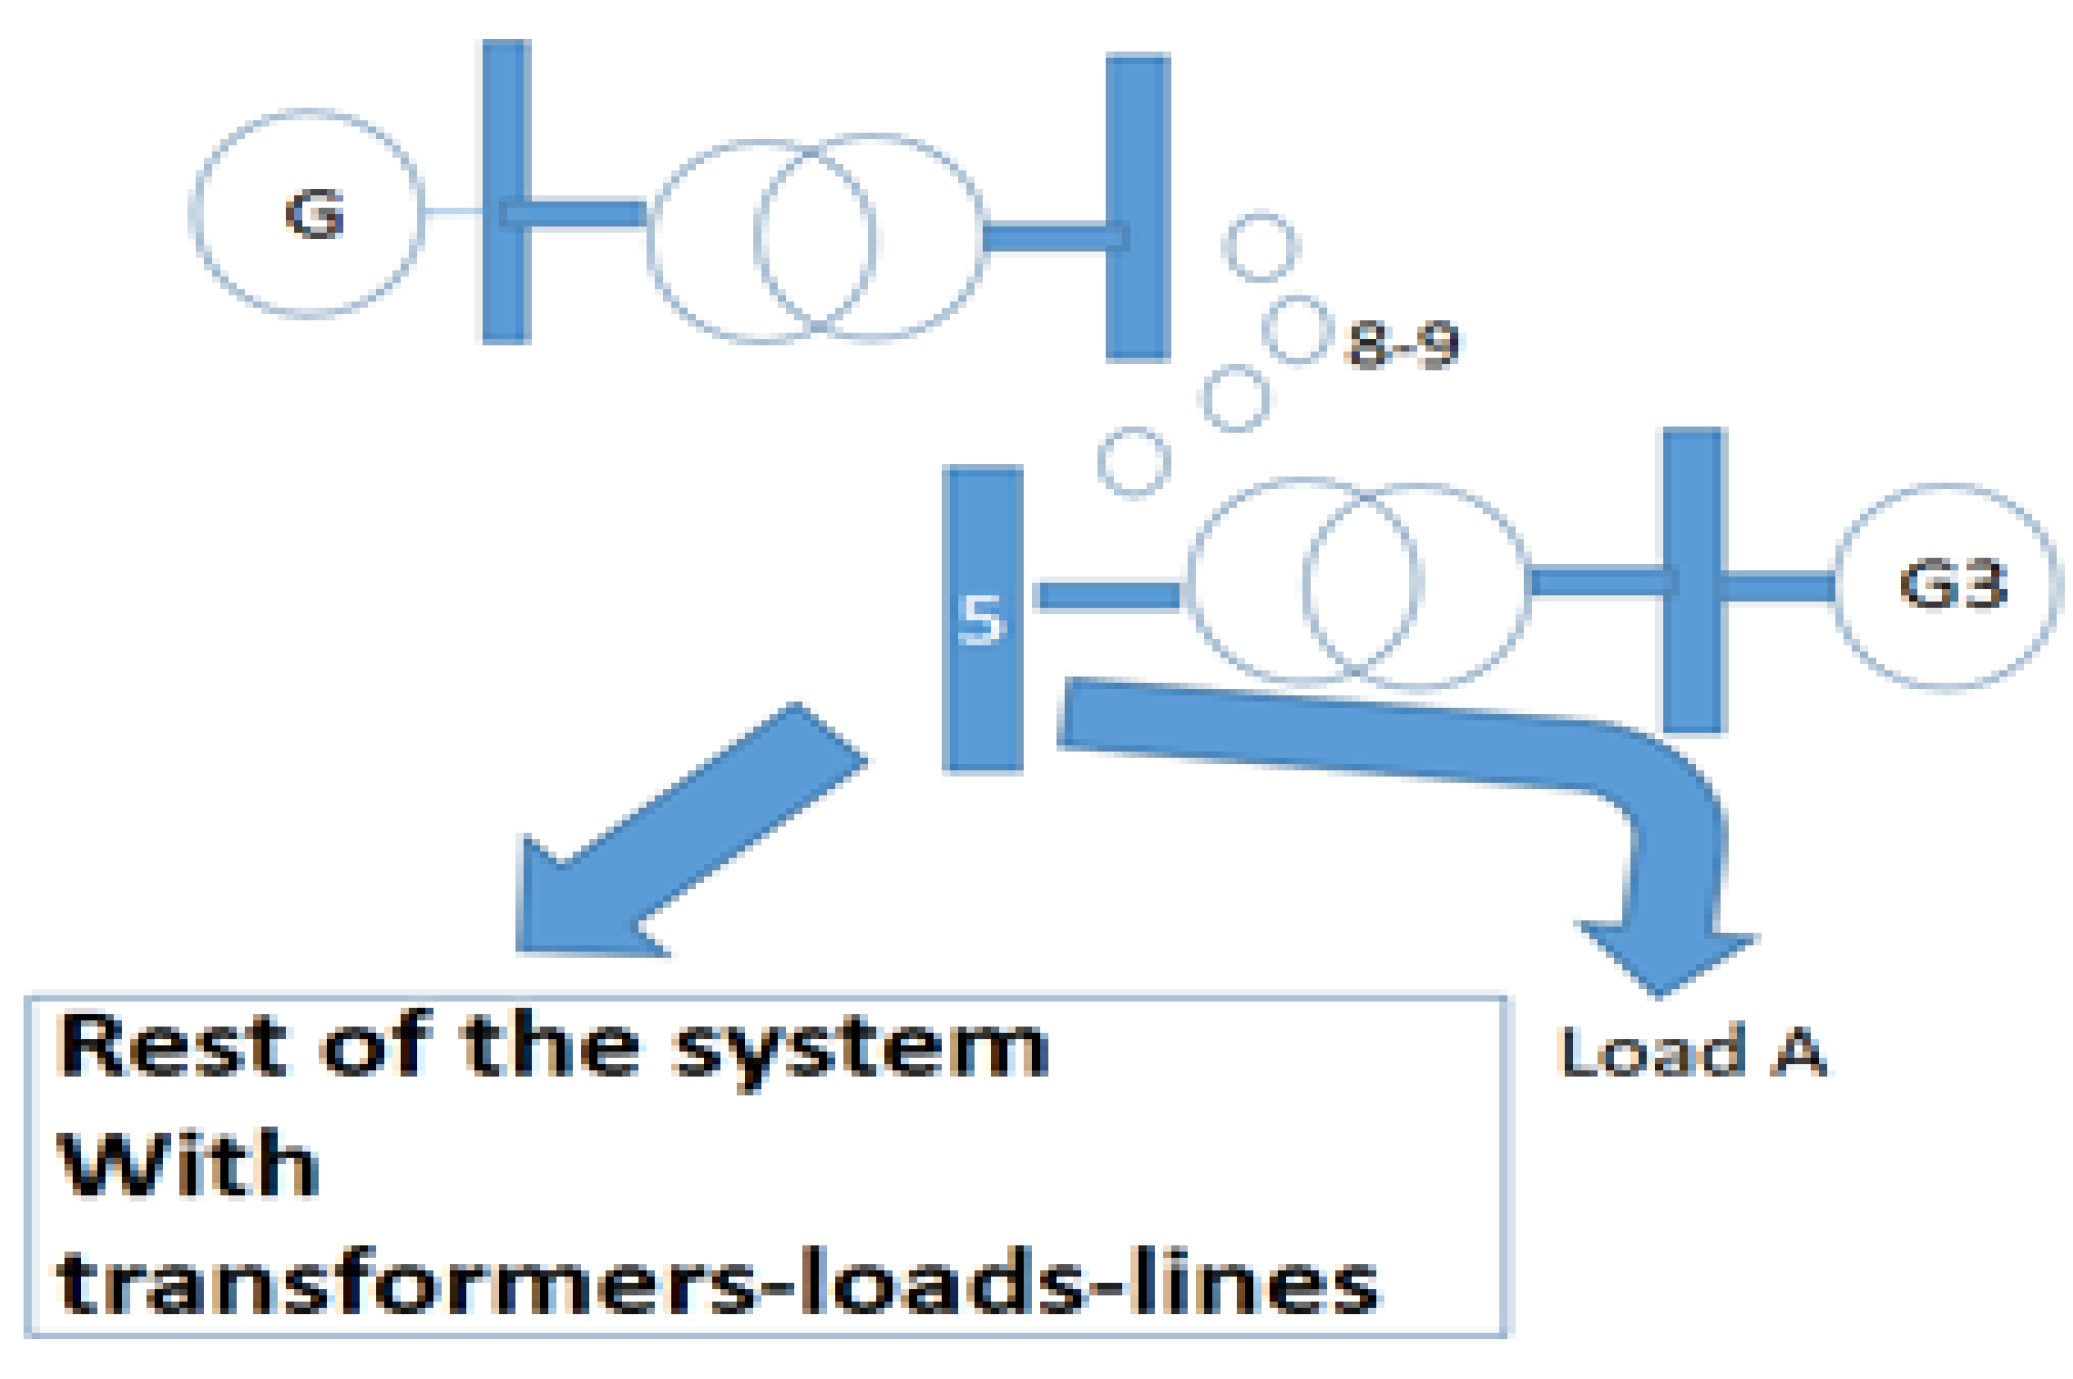
3. Test System Modeling

The test system includes the electrical interface of a power plant, under the supervision of TSO at the Point of Interconnection (POI) with conventional generators and representative transmission network. At the electrical output end of power plant, a step-down transformer is used at POI. The compensation devices are added at the lower voltage end of transformer to comply with their operational ratings. The IEEE 9 bus conceptual system displayed in Figure 4 is used as the reference transmission network, which is used to demonstrate the reactive power mismatches with reference to the demand and transmission lines. The reference IEEE model is studied from [50,51], and the DIgSILENT implementation is taken from [52]. Load A is selected as the source of load variations, and line 8–9 as the representative transmission line. Generator 3 is selected as the representative coal-fired power plant, where the reactive power compensation devices are installed.
The coal-fired power plant generates electrical output, with input mechanical energy as coal. In the context of this paper, the electrical output is the only point of interest, which is assumed to have an operating real power up to 200 MW, reactive power, and voltage value. However, the model is used from the DIgSILENT database, as in [52]. For the ease of analysis, the AVR and the primary frequency control libraries are directly used from [52]. However, secondary frequency control is not used and PSS is used for that purpose.
The DIgSIENT model in [52] used the reference data from [51]; however, the data set is changed in the context of this paper. The changes, with implementation, are indicated in the proceeding section. The next point is the definition of test cases for TSO services on this platform. Table 2 elaborates on the test cases, which complies with the following TSO actions at POI:
  • Increase/decrease in reactive power for fast provision.
  • Increase/decrease in reactive power for high provision.
  • Increase/decrease in reactive power for distant provision. As reactive power is a local ancillary service, and for geographically distant (far) locations, the control has to be changed.
Table 2 is used as a look-up for the mismatches at TSO and the reactive power mismatch use cases. The point of variation is the point, which is the source of reactive power mismatch and can both be in incremental and detrimental ways. This effect is explained under “TSO visibility for the variation” from the perspective of TSO. In this paper, an increase in reactive power means the capacitive effect of reactive power and a decrease in reactive power means the inductive effect of reactive power (in principle the generator convention).

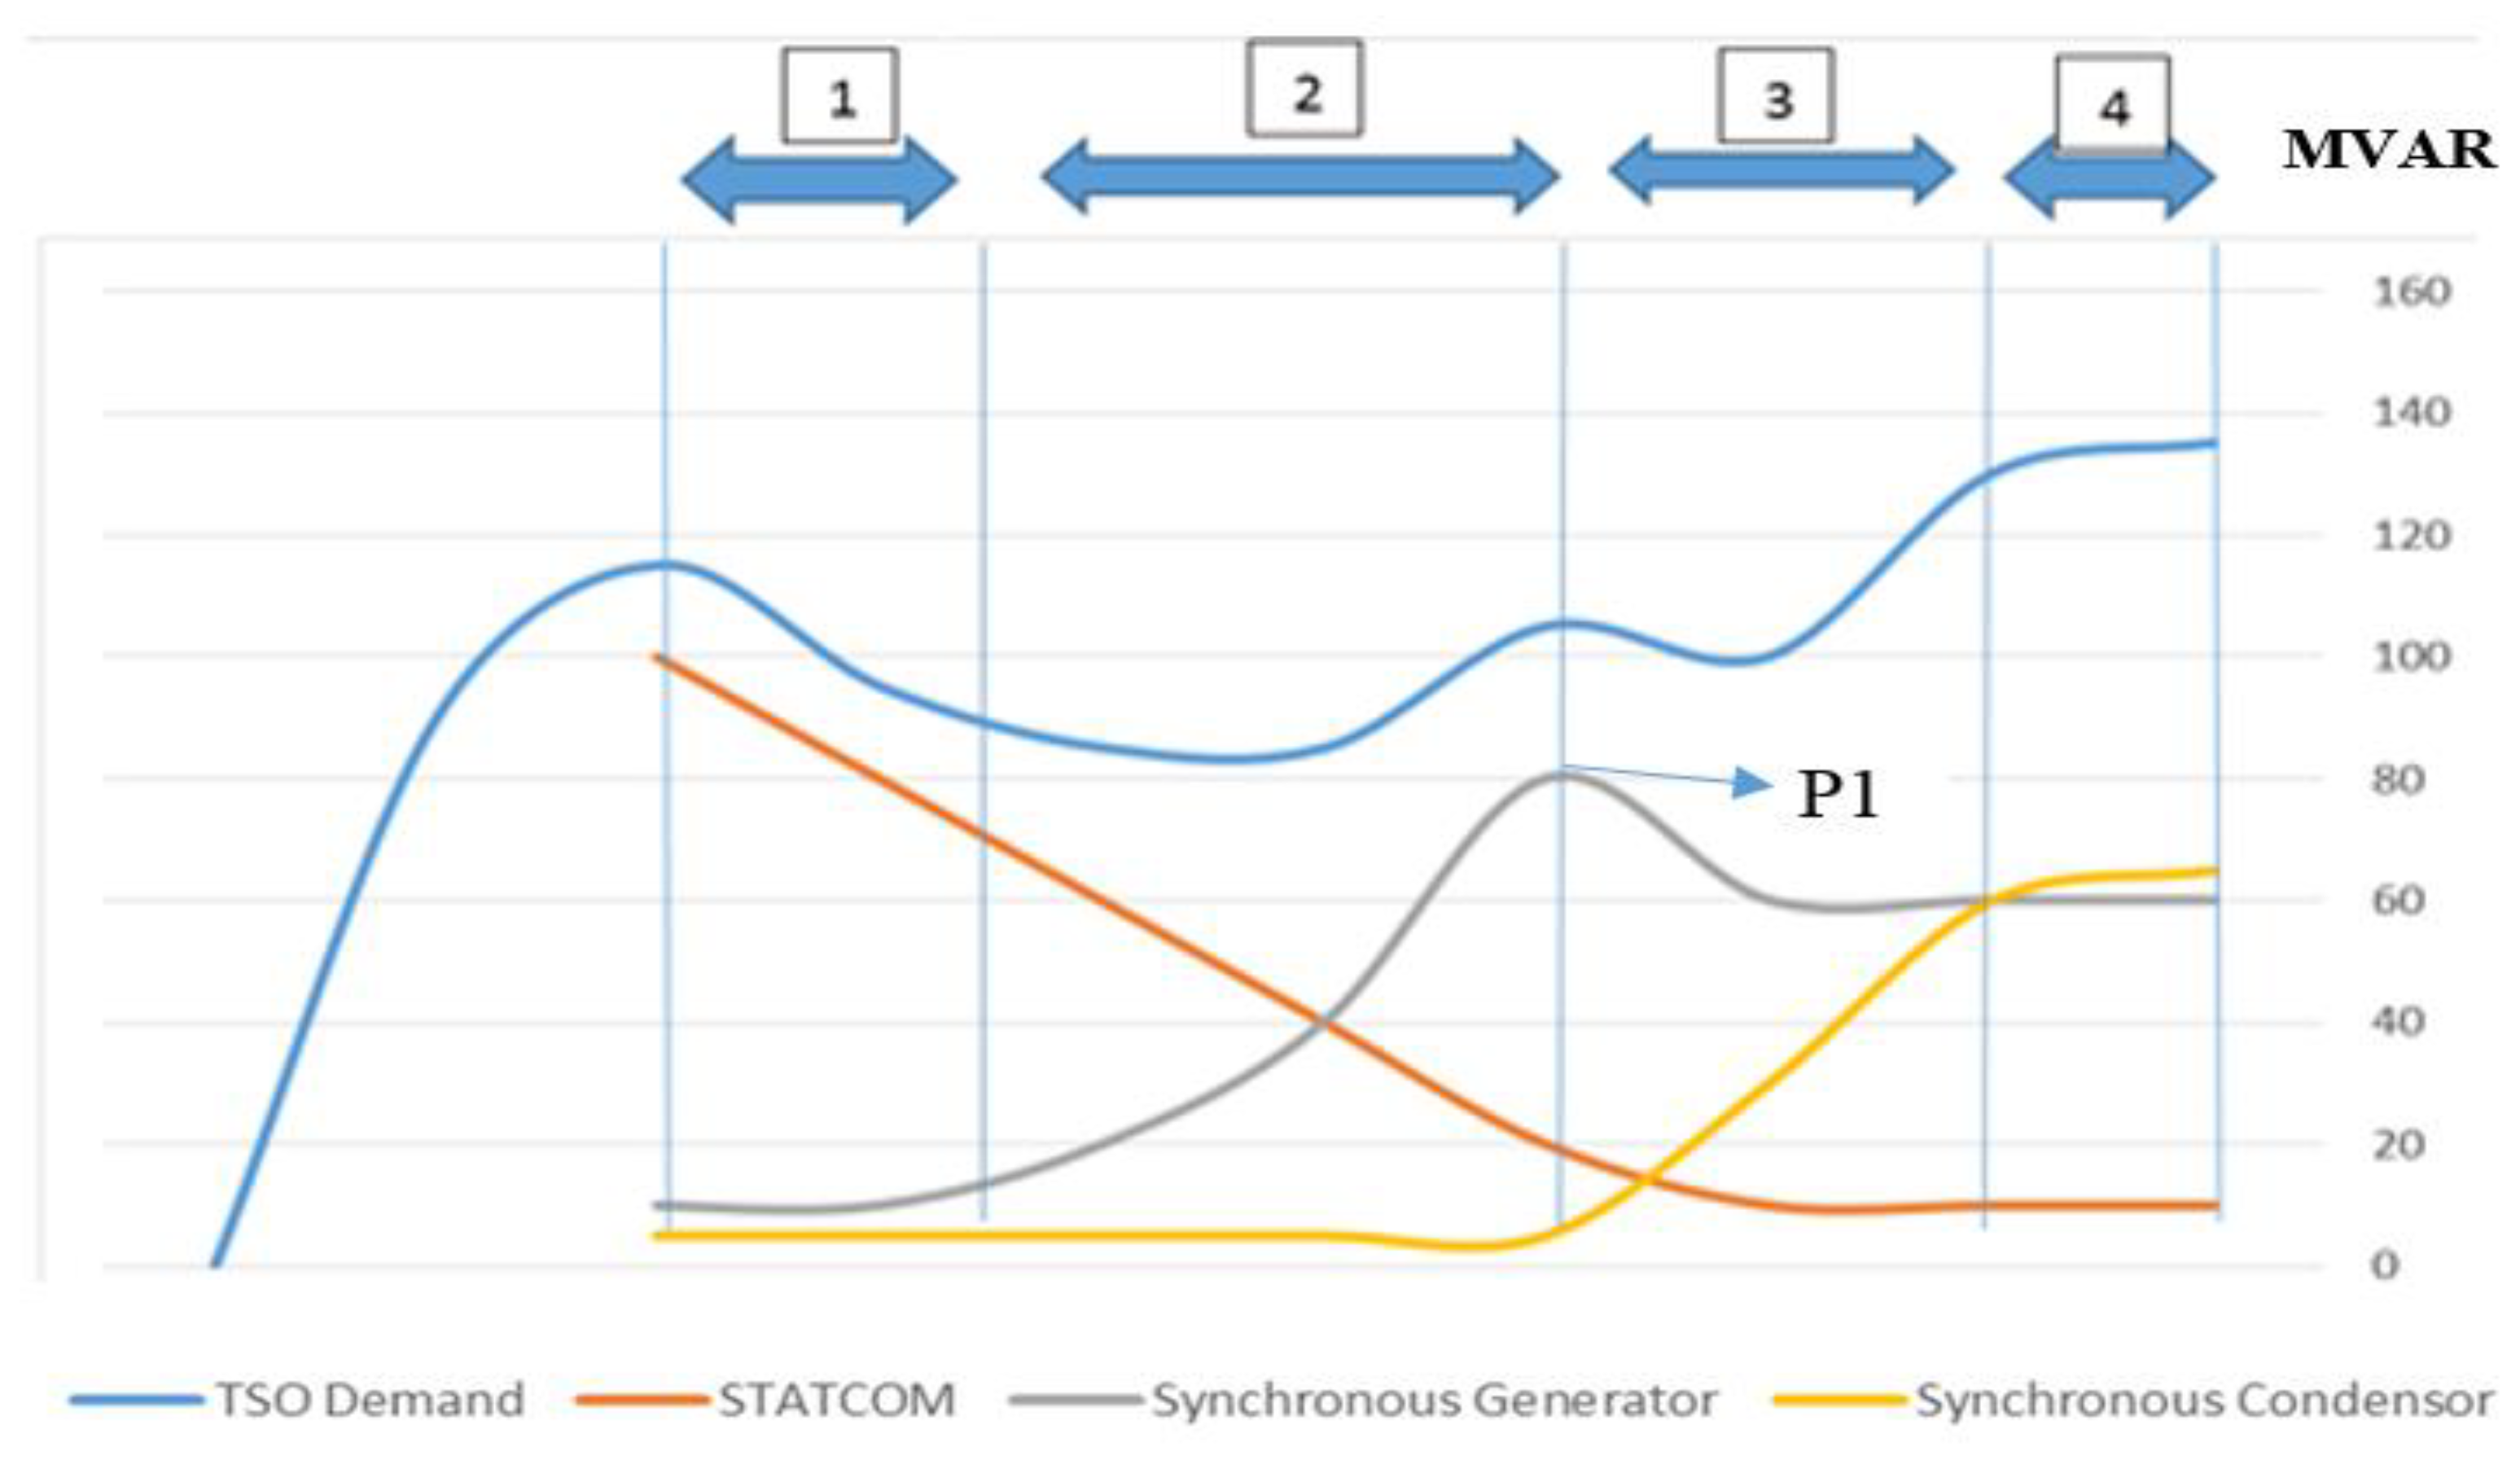
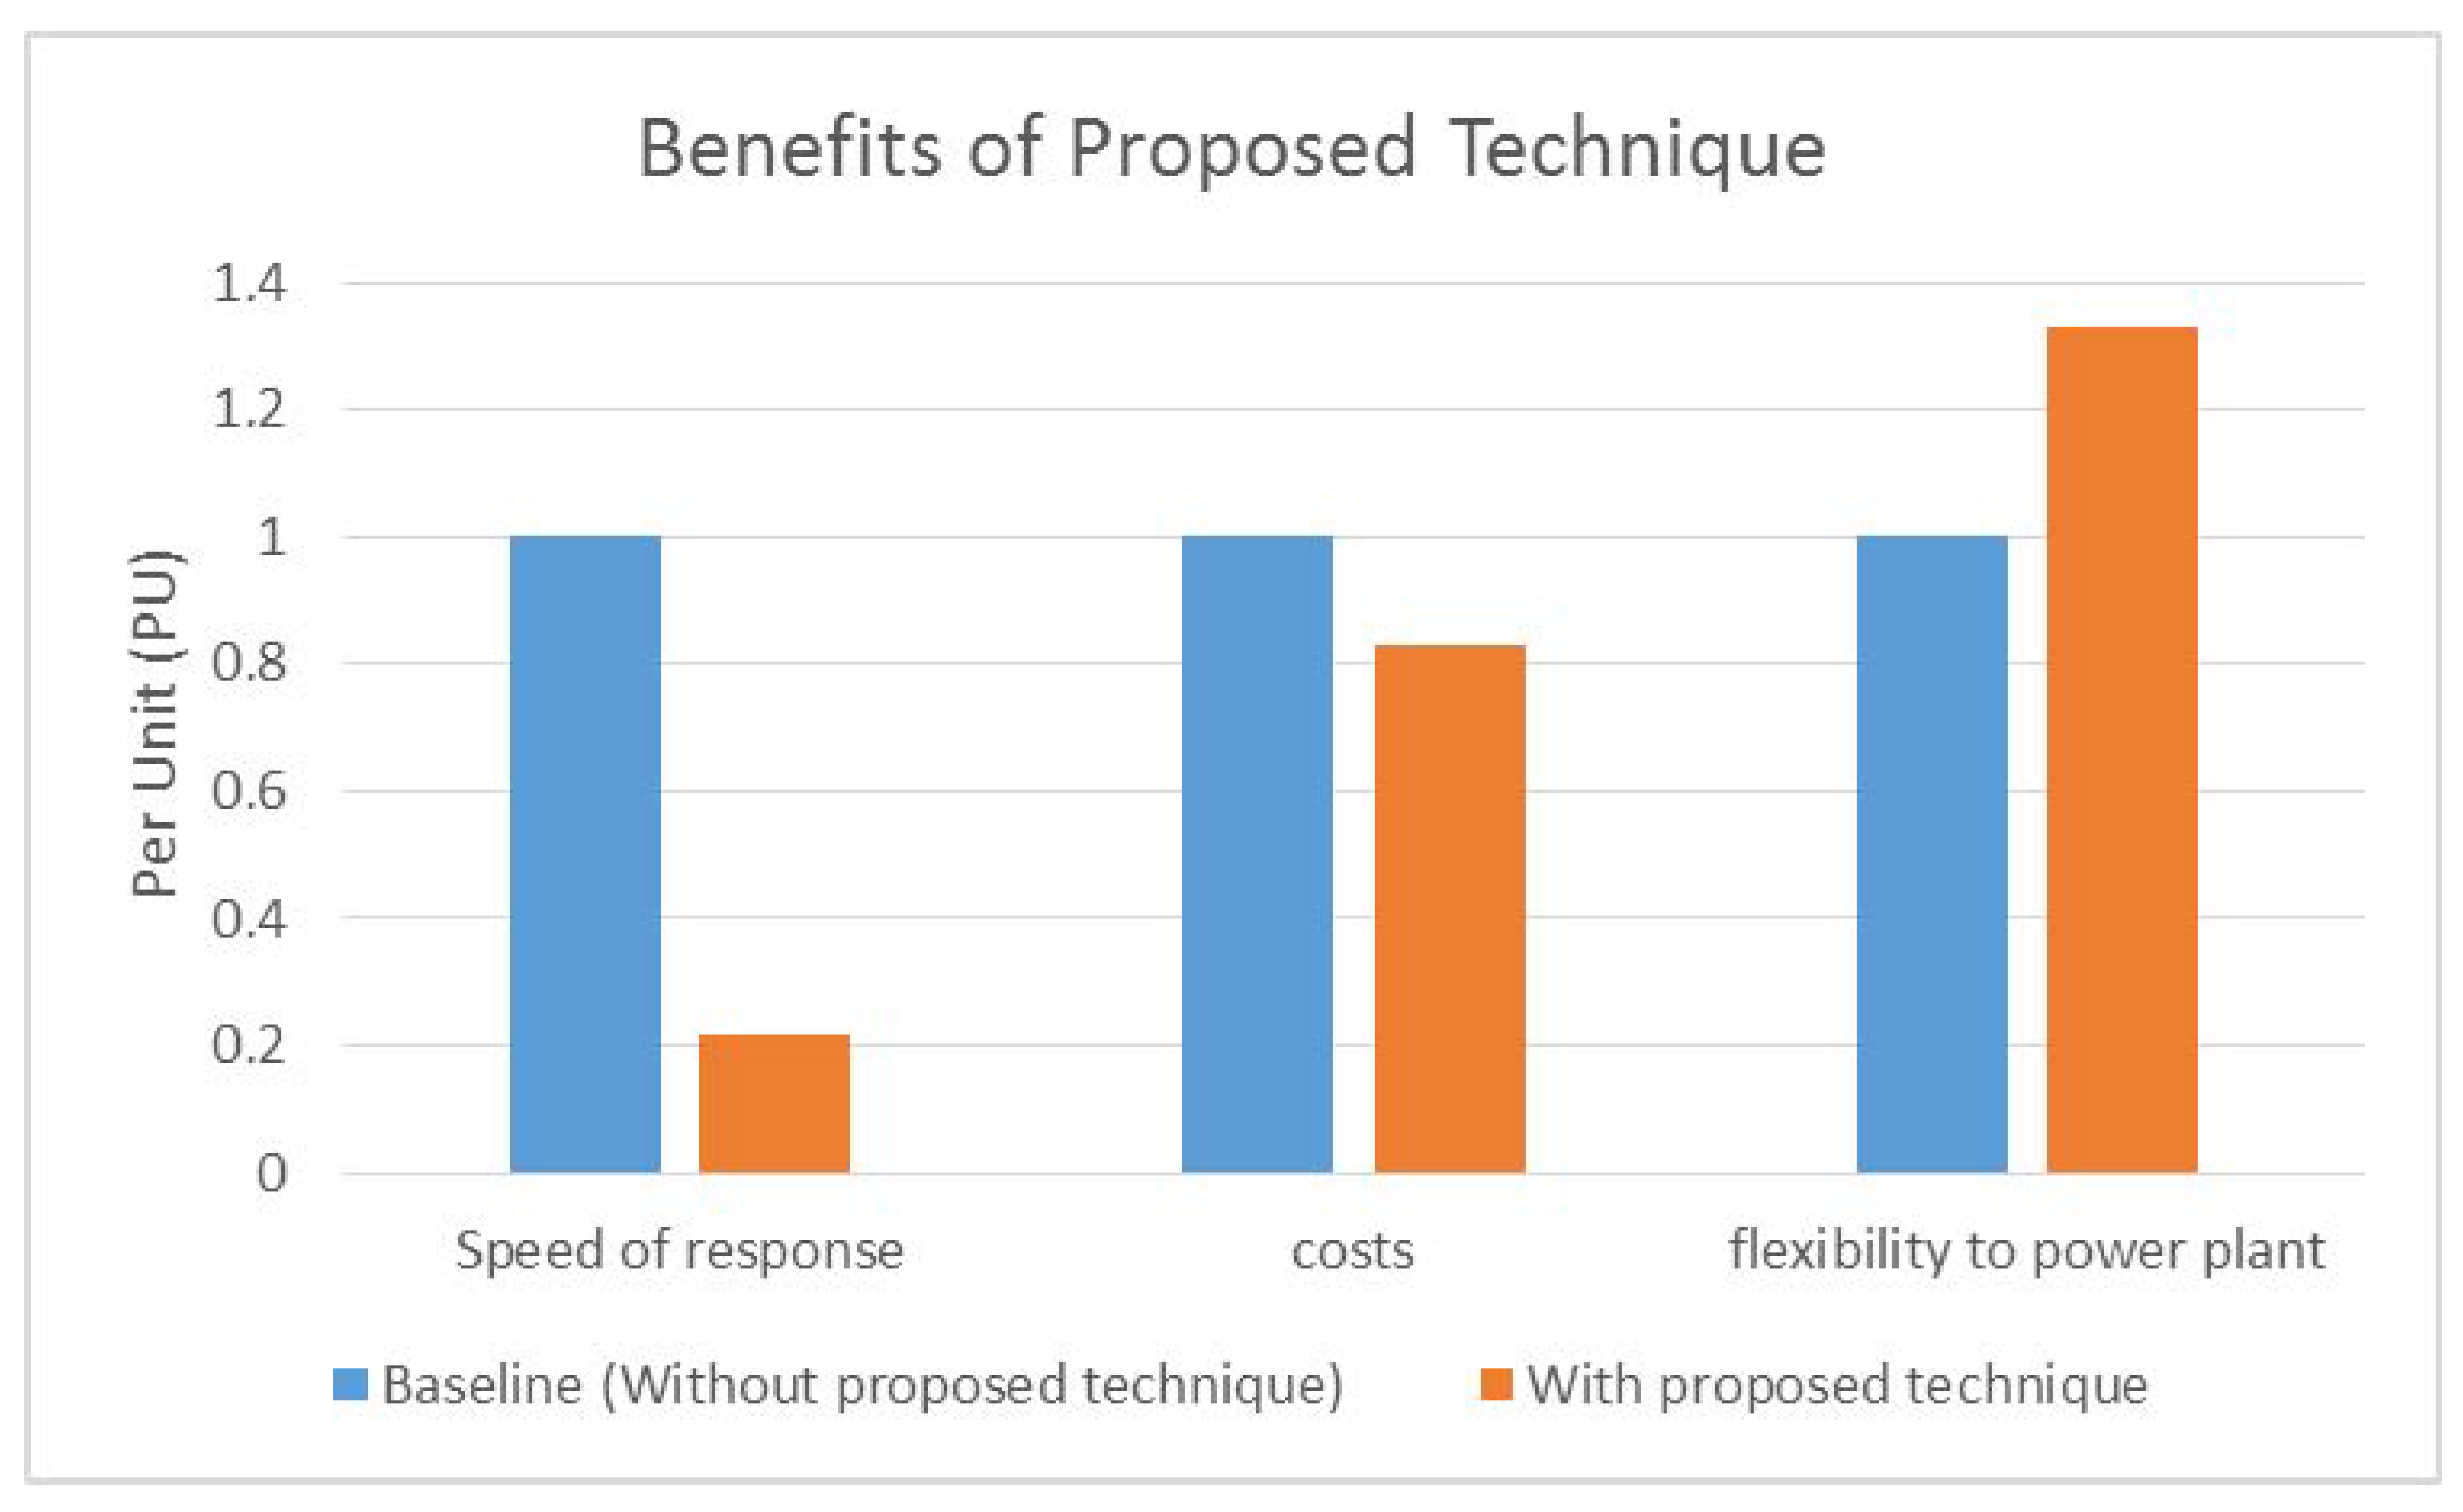
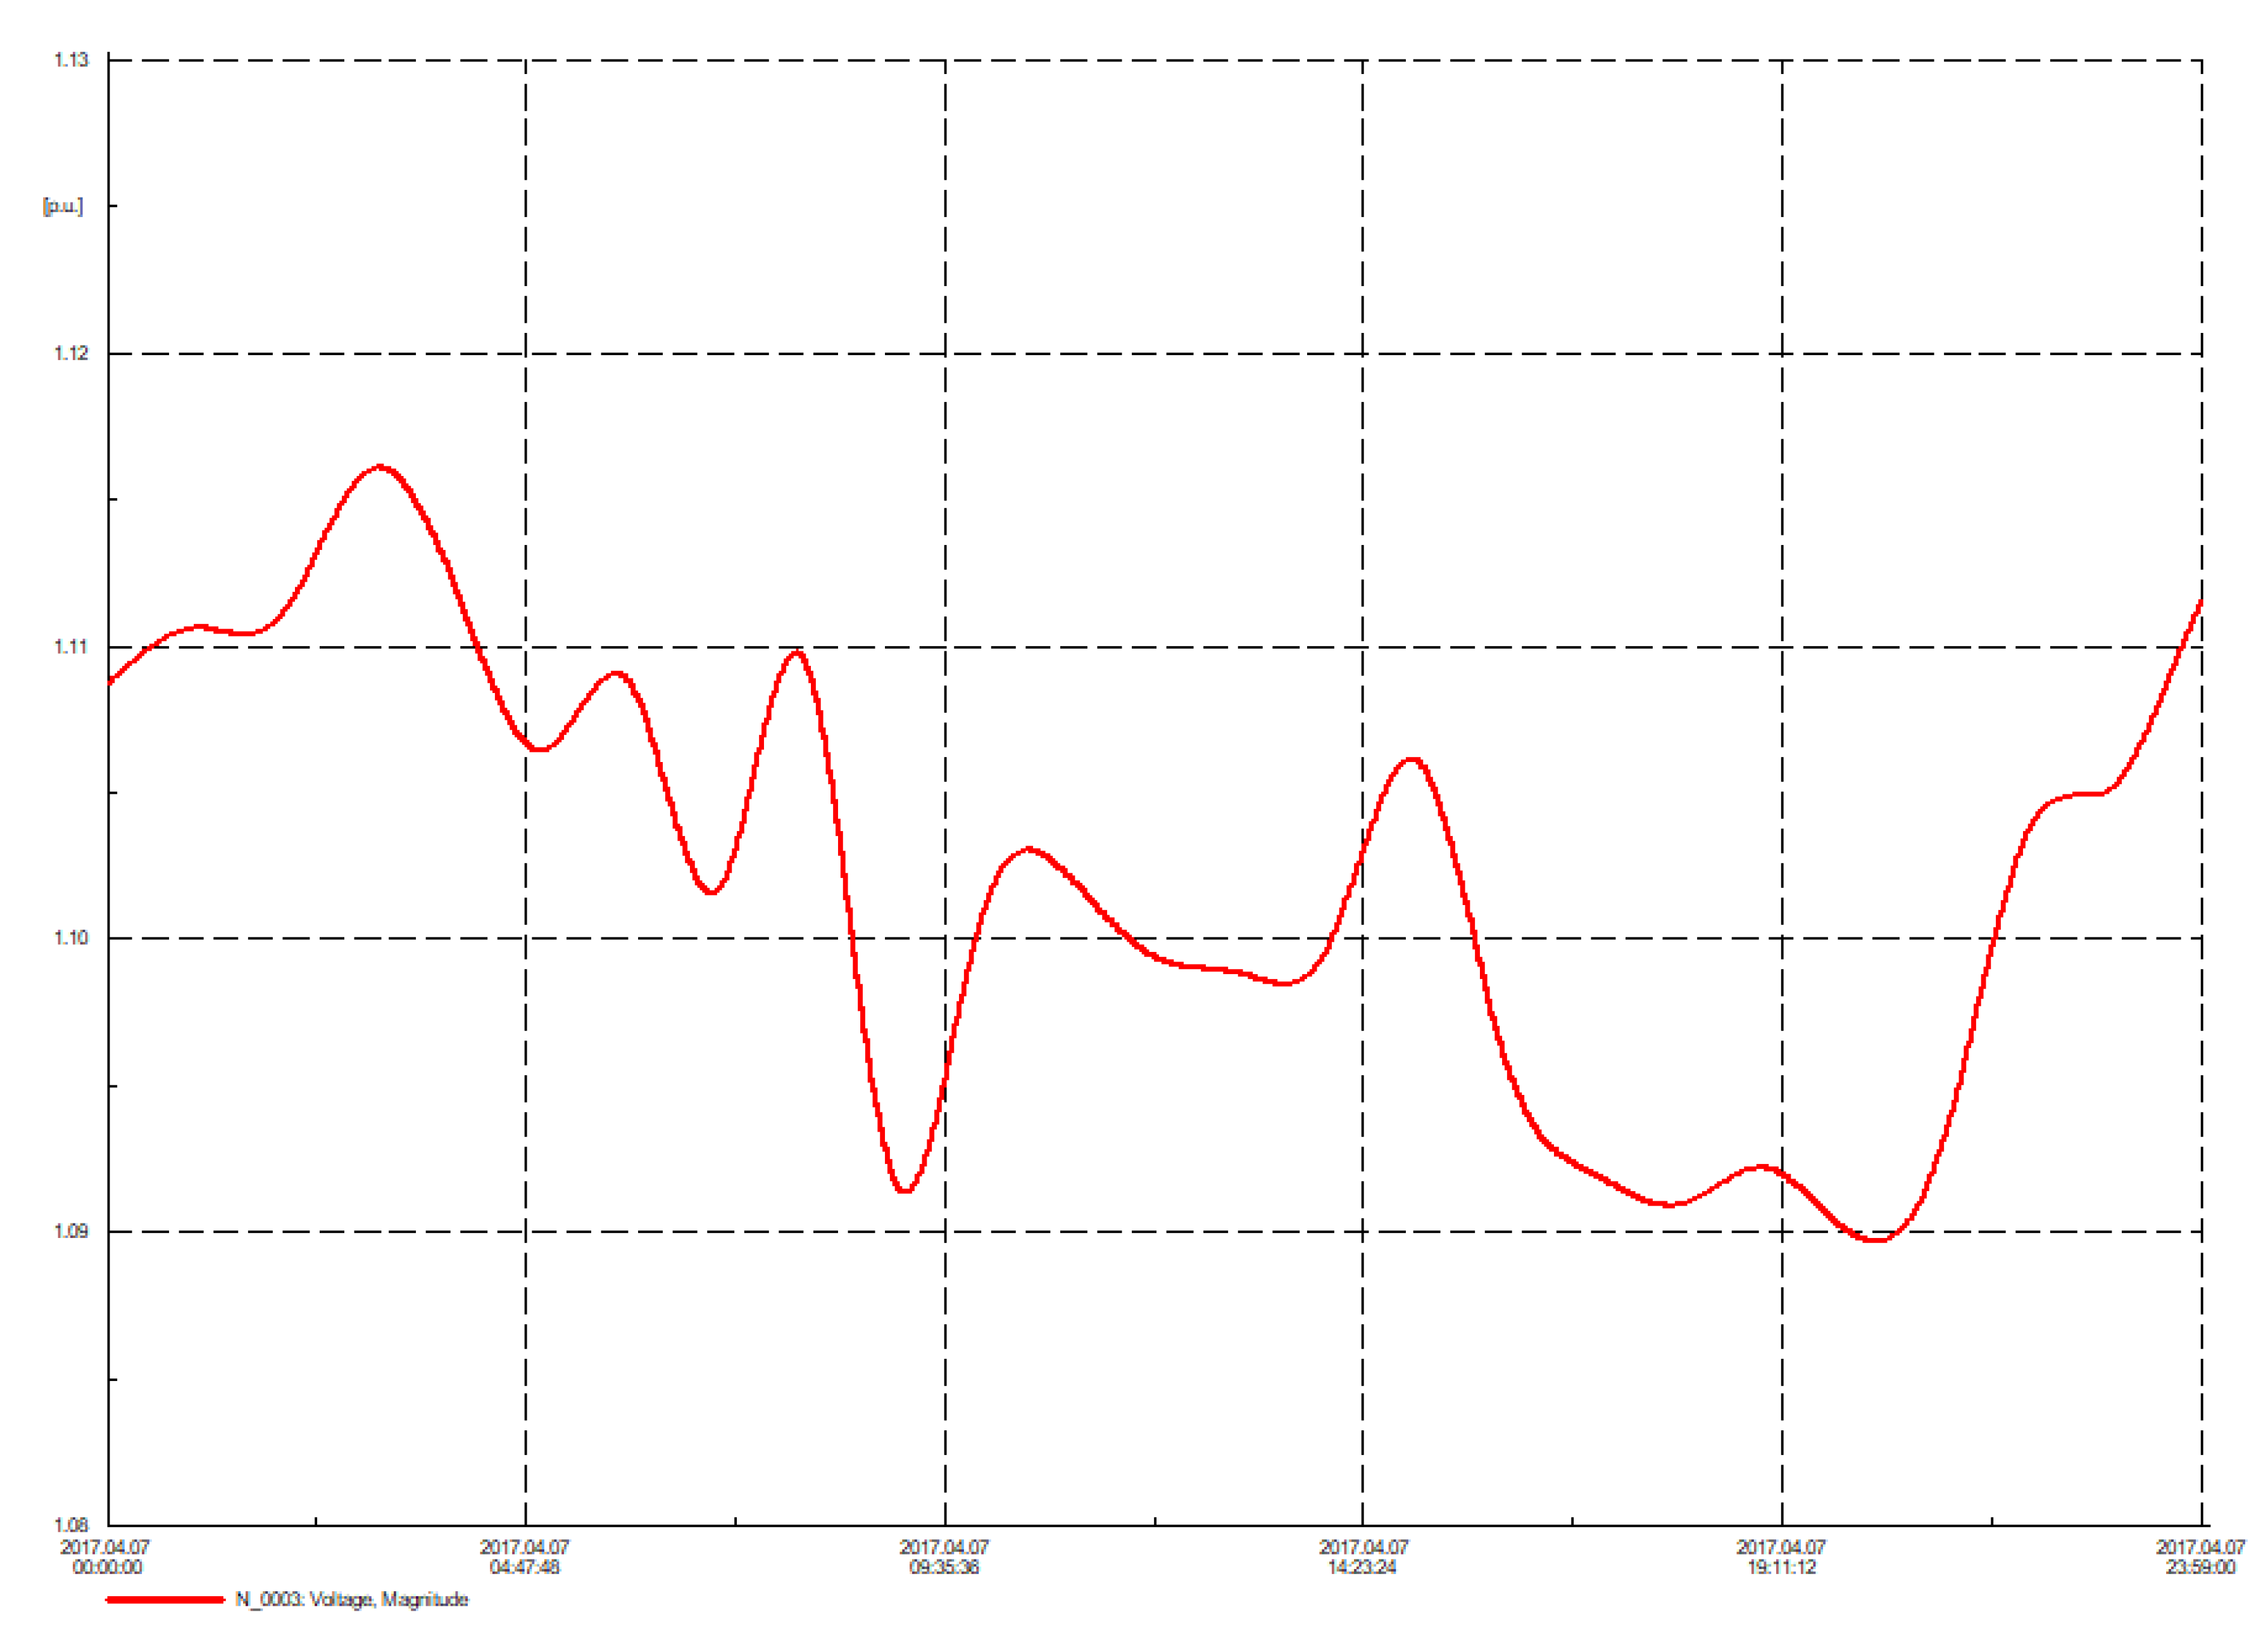
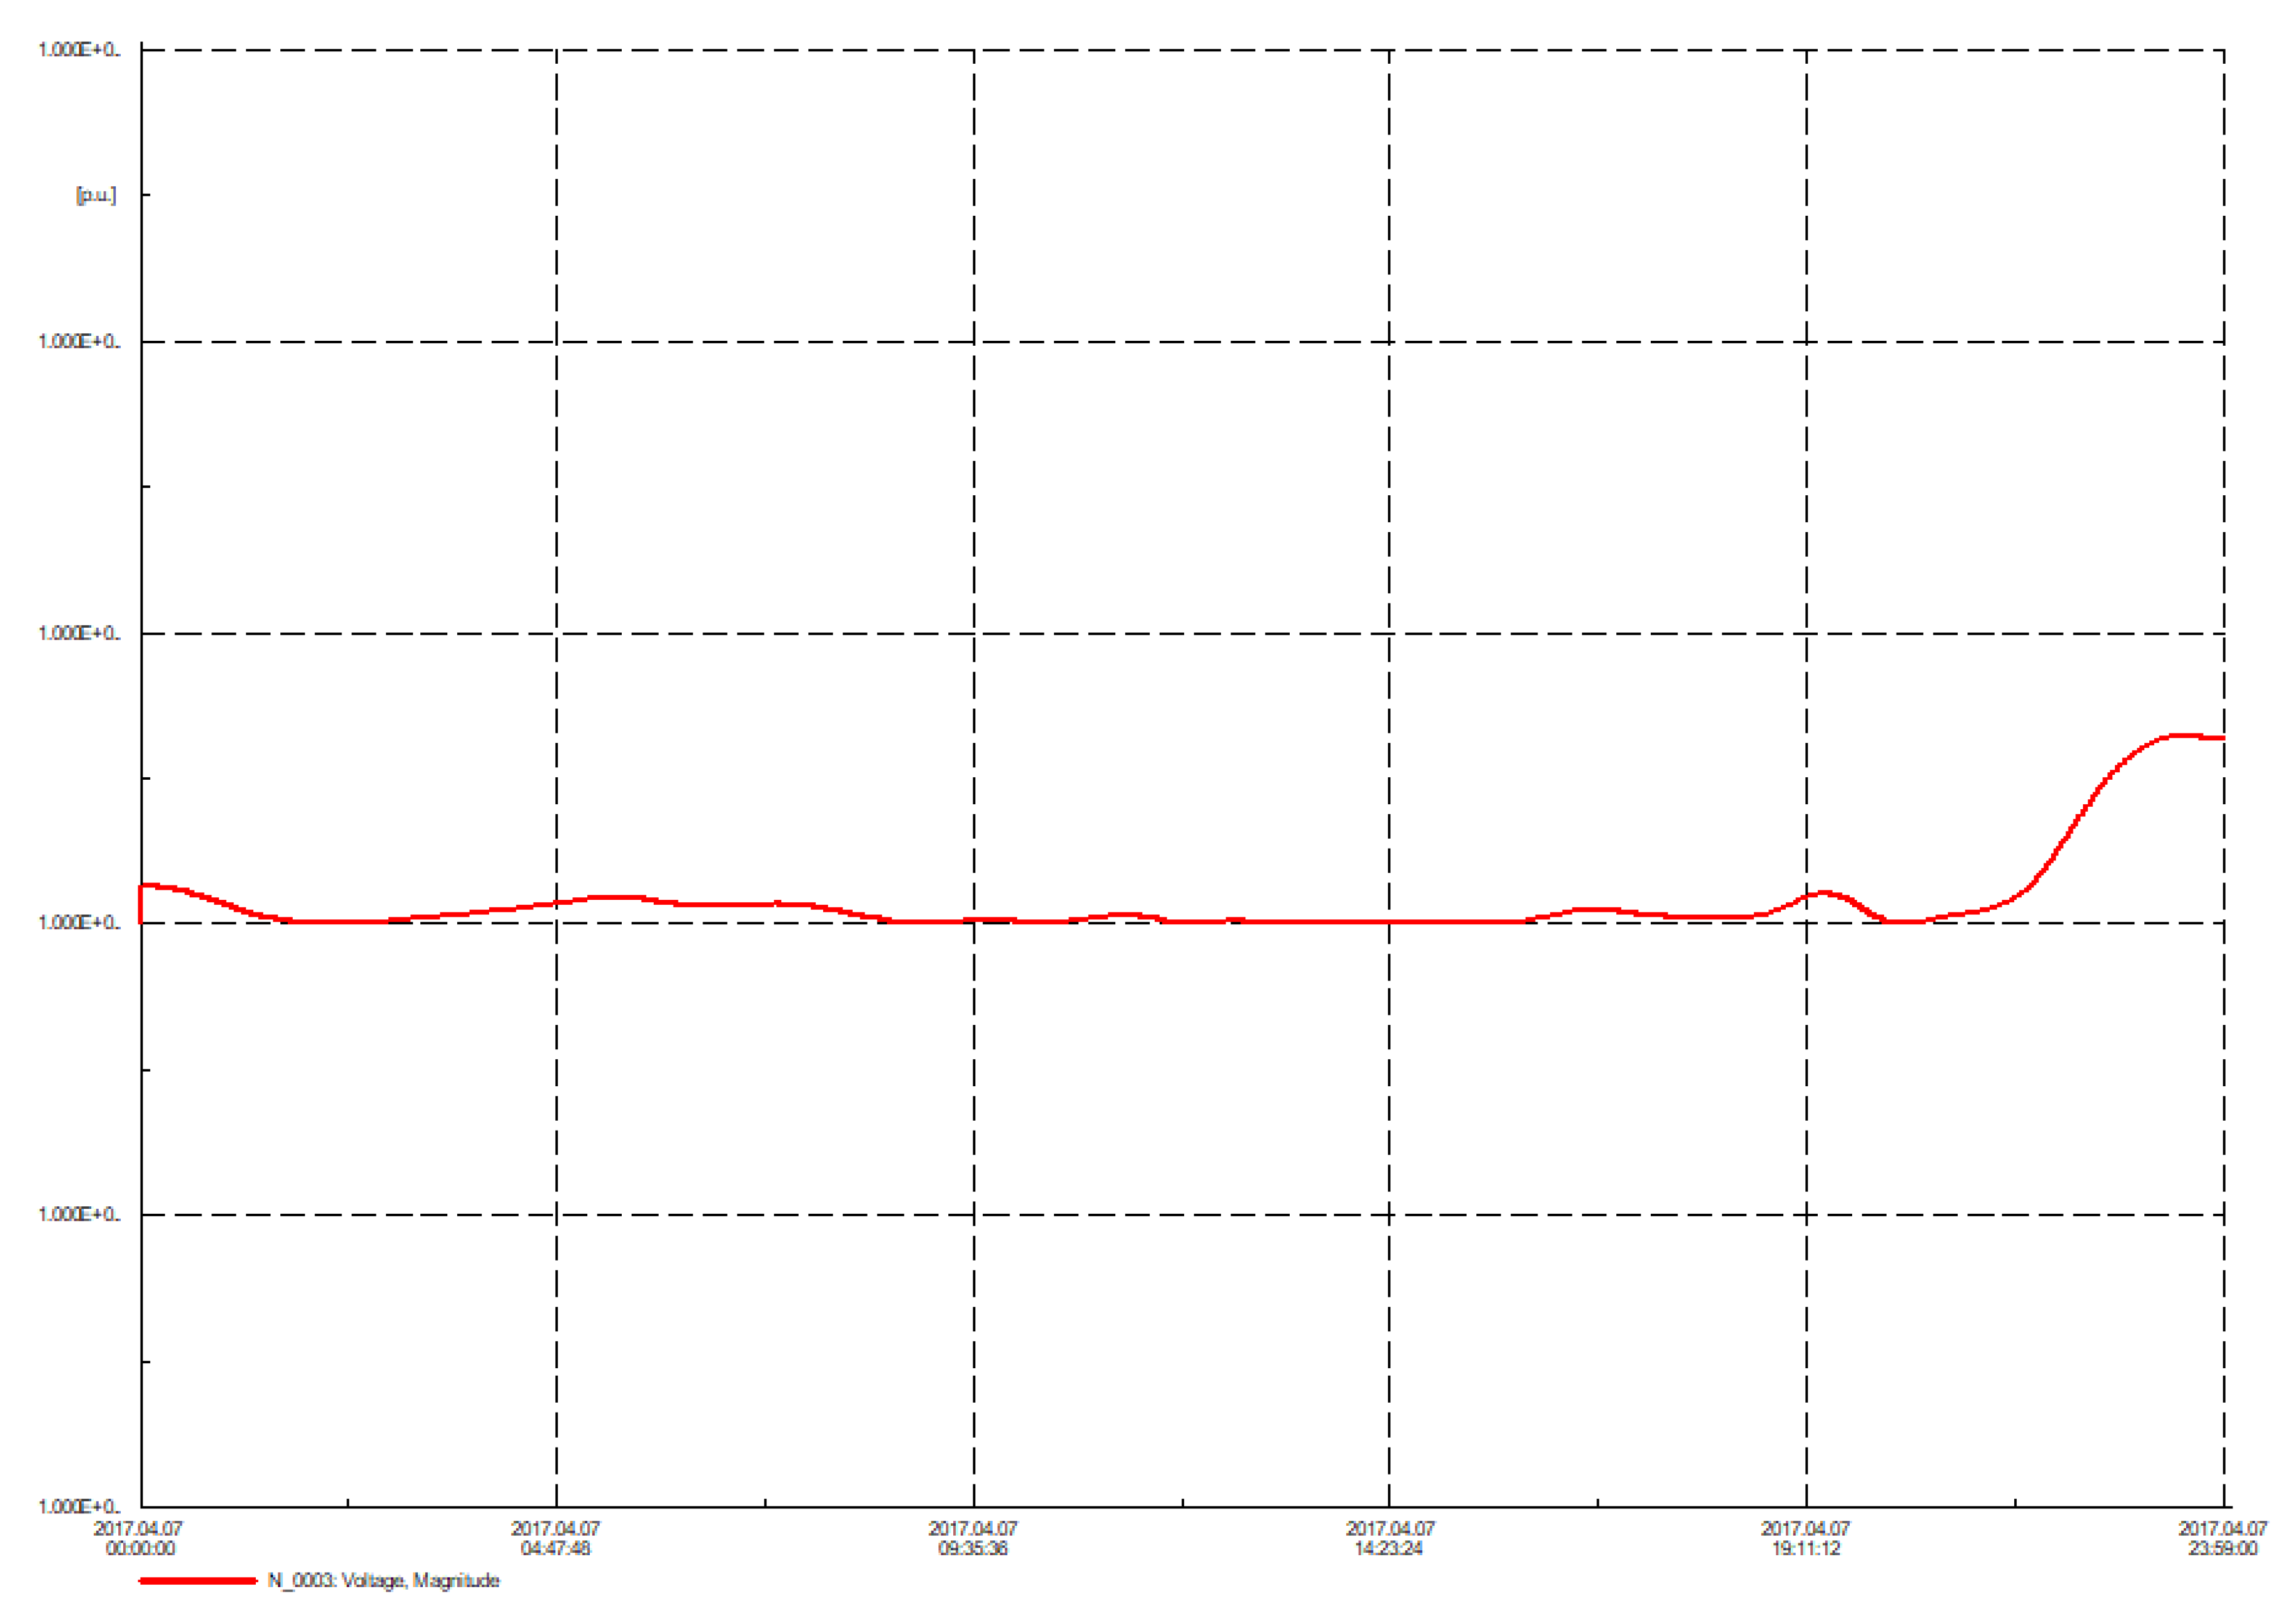
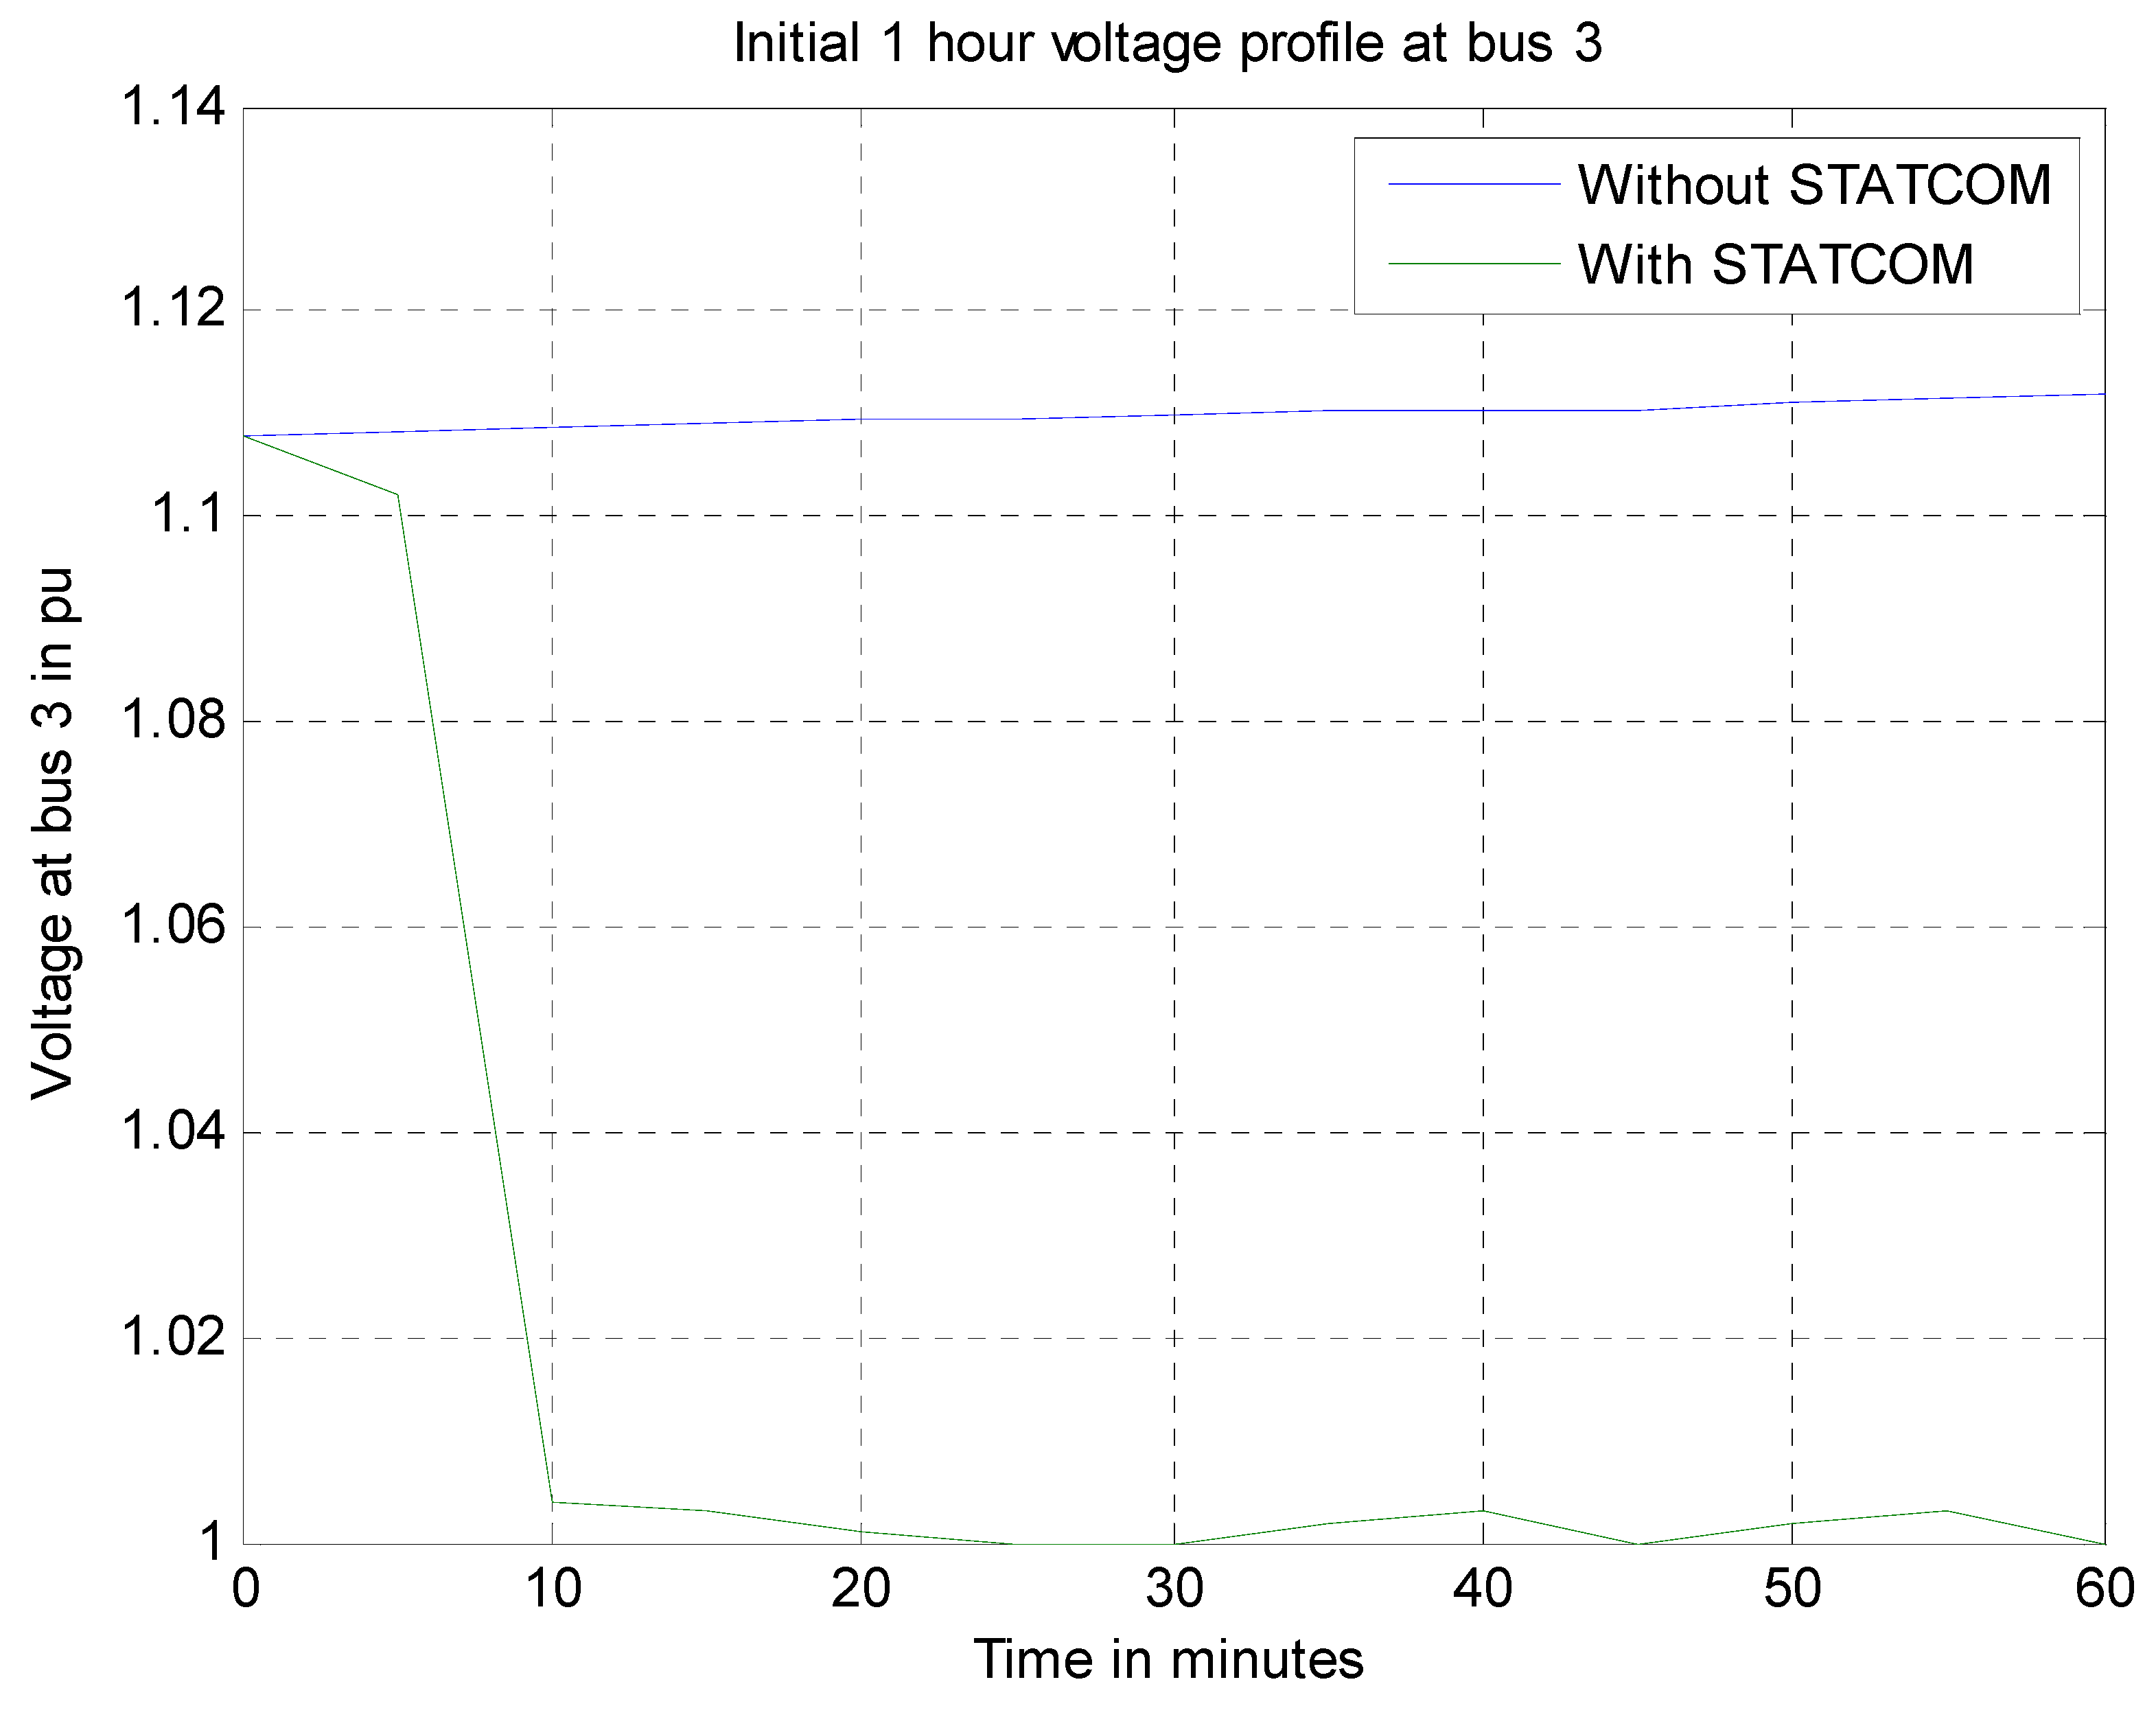
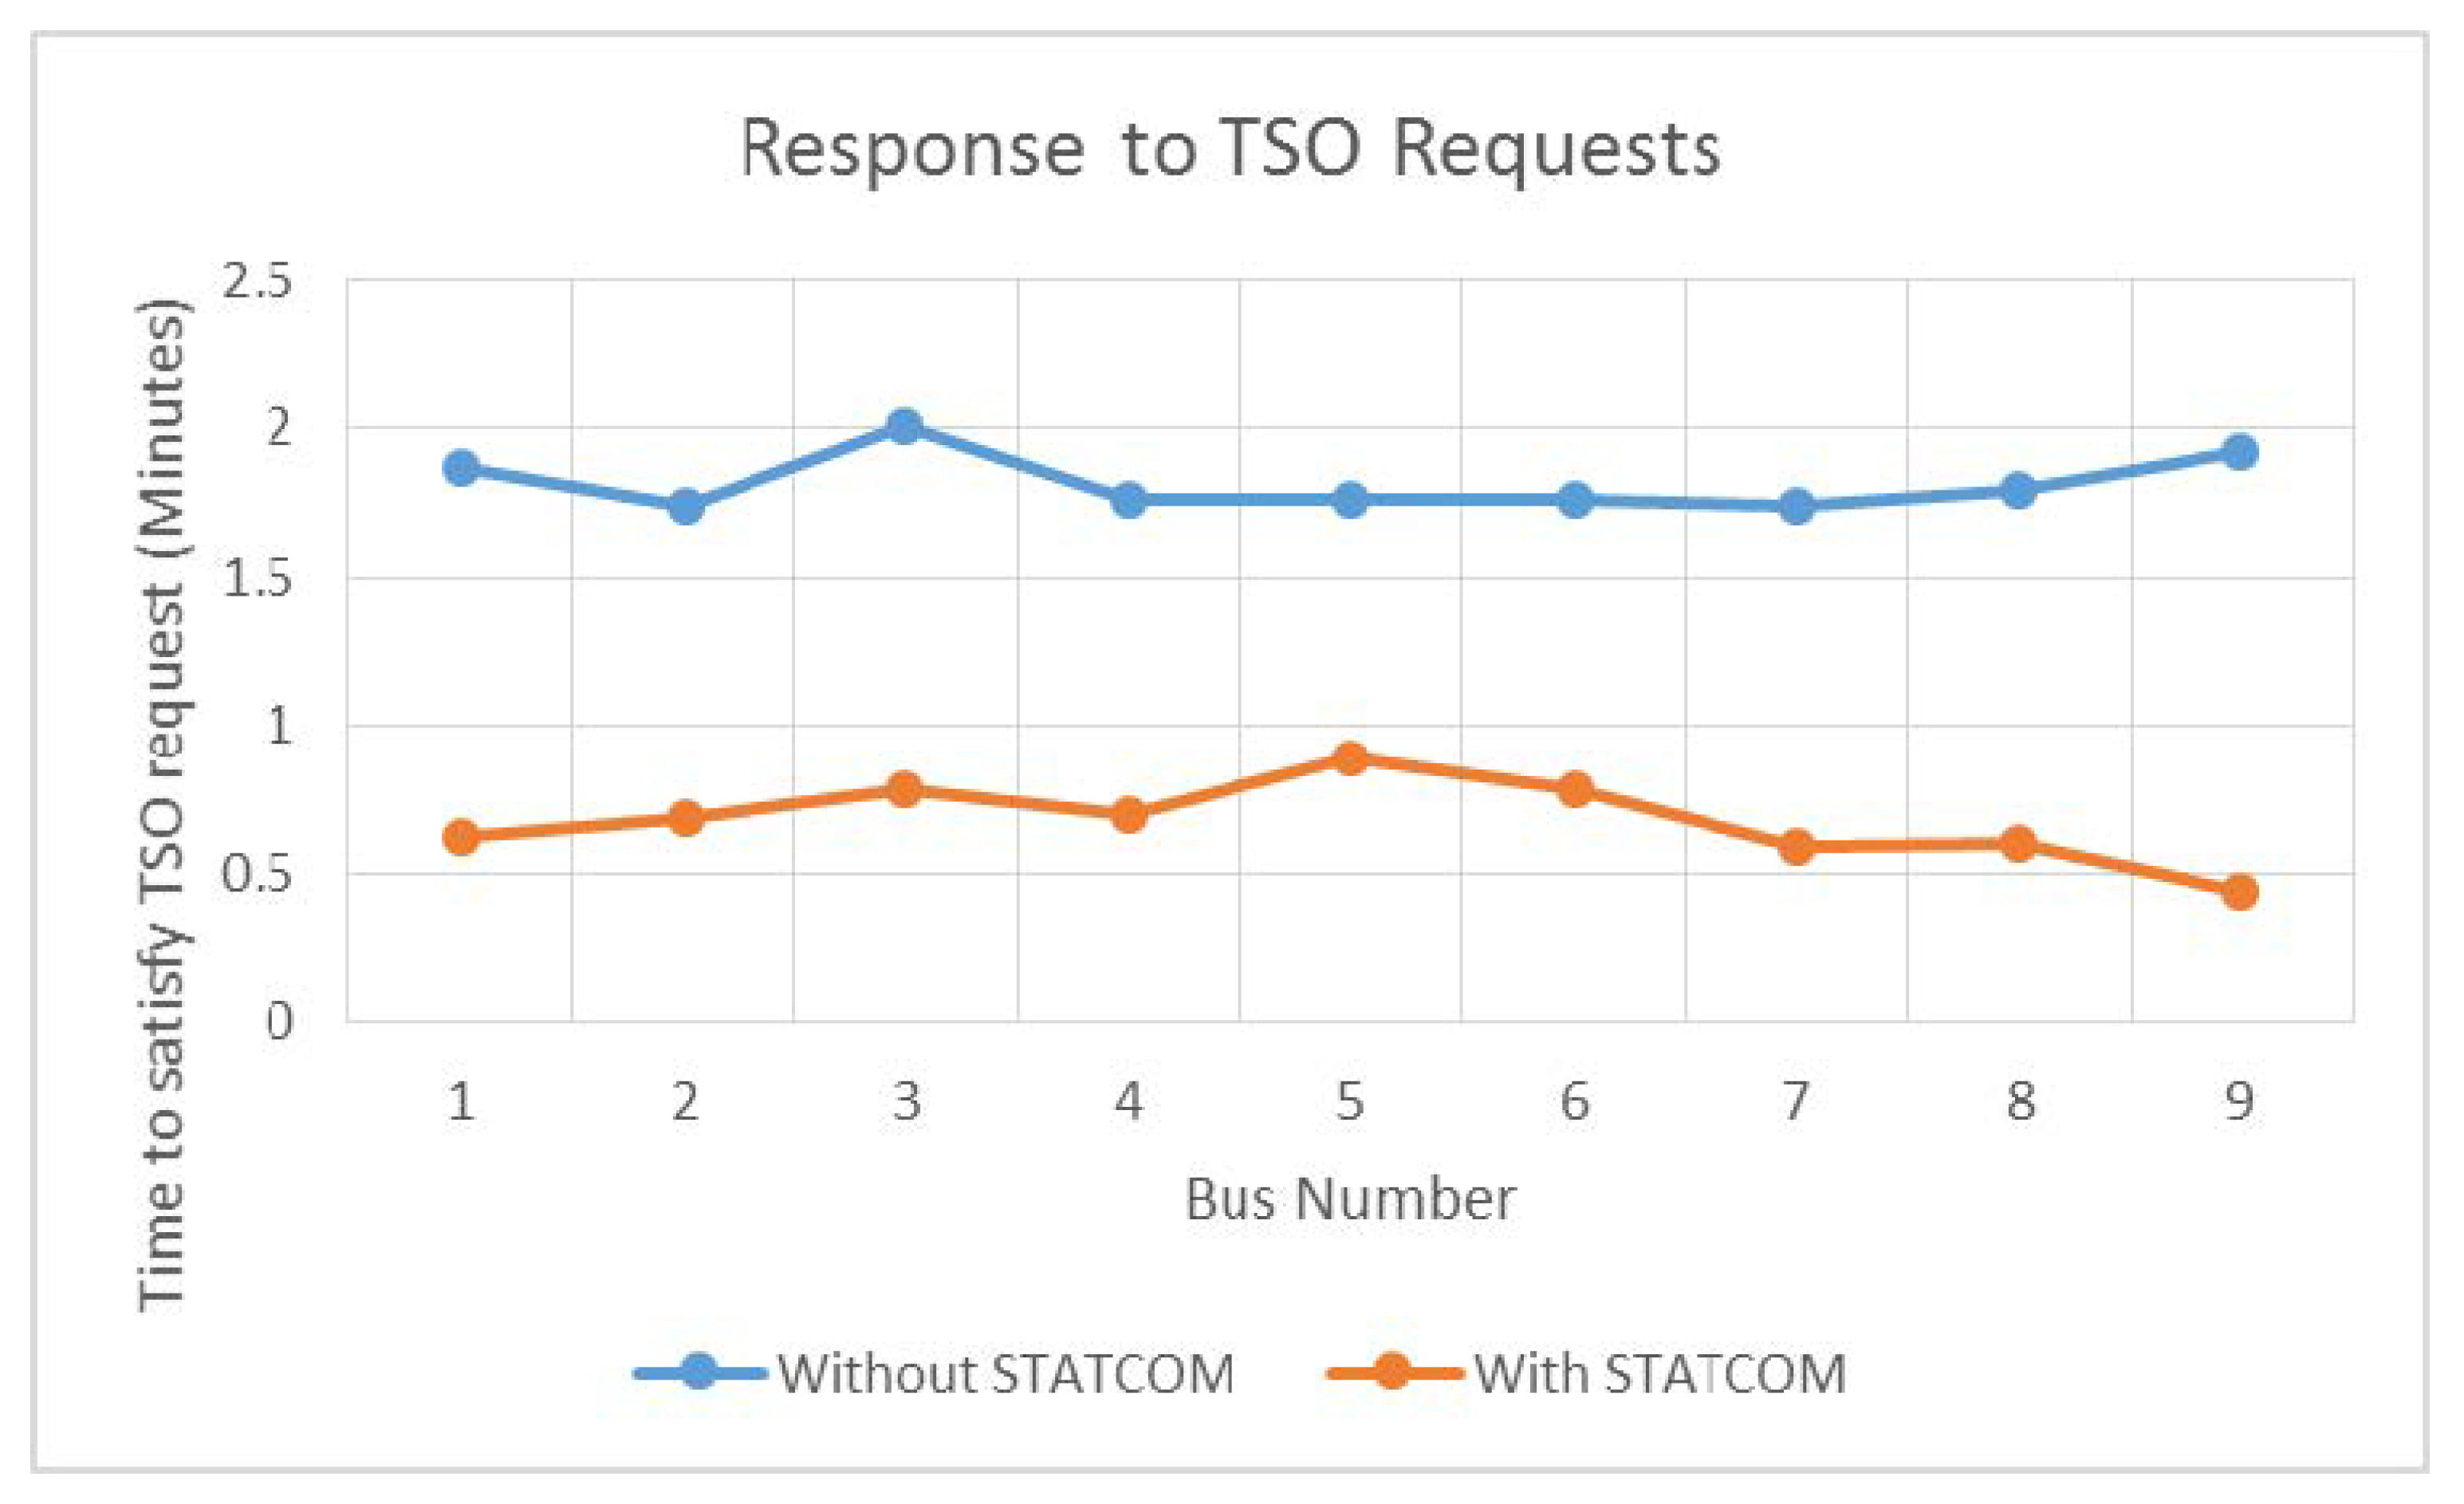
4. Validation of the Proposed Strategy

Following the data-set description, for the system in Figure 4, in the previous section, the changes are indicated here. The loads at bus 5 can consume up to 100 MVAR, and they can generate up to 100 MVAR too. In other words, the loads are representatives of their inductive reactive power nature, but also include the transmission level co-generators with capacitive effects. This is seen as the equivalent demand change, as represented with this load set. The real power has a rated value of 250 MW. For the Line 8–9, the base values of X and B are assumed 30 Ohms and 300 micro-Siemens. The line can endure the test sets up to 50 Ohms and 450 micro-Siemens to represent variations in reactive power w.r.t inductive (X) and capacitive (B) variations. Generator 3 has a rated real power of 140 MW and a rated reactive power of 50 MVAR.
Four simulation cases are simulated in DIgSILENT, as described in the previous section. The results are elaborated one after another. Table 3 mentions the inputs for all four cases. Table 4 provides line and transformer loading, which verifies that there is no issue of over-loading of lines and transformers. Table 5 provides the node voltages for all the cases in Per-Unit (PU).
No additional compensation device is used in the first case. The results in Table 5 clearly reflect over-voltage violations at most of the buses (i.e., bus 2, 3, 7, 8, and 9), with reference to the fact that transmission system operators are bound to ensure upper voltage variations up to 10%. The next case aims to involve synchronous generator as additional compensation device. The results in Table 5 clearly reflect over-voltage violations again at most of the buses (i.e., bus 2, 3, 7, 8, and 9), with reference to the fact that transmission system operators are bound to ensure voltage variations up to +10% and −15%. However, the maximum voltage variation at bus 3 is reduced by around 1.8% by the addition of a synchronous generator. The percentage of over-voltage is reduced at most of the buses, and hence it complies with the “Reactive power provider” mode of synchronous generator. For the minimum voltage, most of the buses get a boost in voltage to increase the margin for under voltage violation, with a maximum margin of 10% at bus 2. However, there is a contradictory effect at two buses 3 and 7, where the minimum voltage is further reduced and this can be alarming for system operators to ensure the under-voltage limits. The worst effect is at bus 3, where the under-voltage violation takes place. However, this issue can be resolved by the use of further compensation (either by SG or by aggregation). In addition, reactive power is better as a local control, and TSO can easily manage the changes at bus 3 (point of compensation). This is later shown in the case with STATCOM.
The further addition of reactive power capacity through conventional power plants can avoid these over-voltage violations; however, this puts a lot of burden and responsibility on these power plants (normally coal and combined-cycle). The next case is used to analyze the same plant with an additional synchronous condenser in order to give flexibility to these power plants. Thus, synchronous generator and synchronous condenser are employed as compensation devices. It is clear from the results in Table 5 that the addition of synchronous condenser overcomes the over-voltage issue at almost all pf the buses, except for bus 3. The problem of under-voltage violation is also overcome at bus 3. The over-voltage violations are reduced up to 14% w.r.t base case, and up to 13% w.r.t SG compensation. At low voltage levels, most of the buses decrease their voltages and pose risk to the under-voltage limits. However, the variation is up to 9% maximum and there still remains around 6% margin for under-voltage limits. The existing issue is the 1.116 PU maximum voltage at bus 3, and the idea is to use flexibility of STATCOM to the bus 3 violations, by operating the STATCOM at POI. The problem can also be resolved by installing a shunt capacitor bank at bus 3. This gives three advantages:
  • There is no need to operate the STATCOM at POI, in order to avoid the operational and maintenance costs.
  • The capital cost for STACOM installation at POI is very high.
  • Capacitor bank gives a fast response, and almost linear response when compared to STATCOM.
However, the solution is not feasible in the case of violations at most of the buses, at POI, or the violations are huge in magnitude. Therefore, a trade-off is there in terms of costs and reliability. The next case is to install STATCOM at POI to ensure further flexibility and a better transient response. This involves STATCOM on the top of the previously employed compensation techniques. The graphs reflect the improvements with STATCOM: Figure 5 shows the response before the addition of STATCOM, whereas Figure 6 displays the STATCOM added behavior.
It is clear that the voltage loading at node 3 is improved with the addition of STATCOM. Without the use of STATCOM, the voltage goes above 1.1 PU for 57% of time that is the violation of over-voltage limits. The addition of STATCOM eliminates this over-voltage violation for 100% time scale. The static simulations for initial one hour is shown in Figure 7 in order to better visualize the effects of STATCOM on node 3 voltage, where the voltage shifting is clearly visible.
The next step is to test the transient behavior of voltage at buses for the achieved setup, with introducing another load at bus 5 with the similar characteristics of previous load. The changes to reactive power are compared with two cases: (1) With the use of additional SG and SC, (2) With the use of additional SG, SC, and STATCOM. The time to reach voltage limits, after the over-voltage violation, is noted for each bus; the results are plotted in Figure 8. From the figure, it is clear that STATCOM improves the transient performance, which is effective for a faster response to TSO requests.
The results demonstrate that reactive power is essential for voltage stability, and the coordinated mechanism for the use of STATCOM, synchronous generators, and synchronous condensers is validated. The applications depend on the specific TSO applications for a specific region. Applications may involve a typical current solution with a trade-off amongst reactive power provision and capital/operating costs. It may be the least cost-effective option, but with high availability. Another one can be the low-cost solution, but with reduced applicability to the power plants. The reason is the insufficient amount for participation in the ancillary service market. The application may cover potential future solution with the best possible reactive power reserves.

5. Conclusions

The paper presents a coordinated strategy that can utilize the aggregation of different reactive power compensation techniques to fulfill the TSO demands in the best possible way. The strategy is developed according to Italian TSO requirements, and the paper validates the strategy, with the implementation of IEEE based transmission model in DIgSILENT, on TSO test cases.
The proposed strategy in the paper is designed for conventional power plants, as the Italian regulatory barriers do not allow for distributed energy resources, DSO, and inter-aggregated zones to contribute towards the provision of ancillary services. Moreover, Italian TSOs do not remunerate power plants for this service of reactive power, so the main business strategy for these conventional units is to ensure flexibility. The results ensure that, in order to make the power plants and TSO more flexible for the provision of reactive power, it is useful to integrate different technologies to coordinate the provision. Future work includes the extension of the strategy to other ancillary services.

Author Contributions

Conceptualization, J.A. (Jibran Ali); Formal analysis, J.A. and S.M.; Investigation, J.A. and F.S.; Methodology, J.A.; Resources, S.M. and F.S.; Supervision, S.M. and F.S.; Validation, J.A.; Writing—original draft, J.A.; Writing—review & editing, S.M. and F.S.

Funding

This project has received funding from the European Union’s Horizon 2020 research and innovation programme under the Marie Sklodowska-Curie grant agreement No 676042.
Energies 12 02047 i001Open-access publication charges has also received funding from the European Union’s Horizon 2020 research and innovation programme under the Marie Sklodowska-Curie grant agreement No 676042.

Conflicts of Interest

The authors declare no conflict of interest.

References

  1. Ali, J. Coordinated Control Mechanism for Voltage Stability Utilizing Aggregation of Reactive Power Compensation Techniques. In Proceedings of the IEEE International Conference on Environment and Electrical Engineering, Palermo, Italy, 12–15 June 2018; IEEE: Piscataway, NJ, USA. [Google Scholar] [CrossRef]
  2. Hossain, M.J.; Saha, T.K.; Mithulananthan, N. Impacts of wind and solar integrations on the dynamic operations of distribution systems. In Proceedings of the AUPEC Australasian Universities Power Engineering Conference, Brisbane, Australia, 25–28 September 2011. [Google Scholar]
  3. Wang, Y.; Yu, Y.; Zhang, J. Analysis for distribution network on hosting capacity of distributed wind turbines considering additional income under procedure conditions. J. Eng. 2017, 2017, 1373–1377. [Google Scholar] [CrossRef]
  4. Torquato, R.; Salles, D.; Pereira, C.O.; Meira, P.C.M.; Freitas, W. A Comprehensive Assessment of PV Hosting Capacity on Low-Voltage Distribution Systems. IEEE Trans. Power Deliv. 2018, 33, 1002–1012. [Google Scholar] [CrossRef]
  5. Arshad, A.; Lindner, M.; Lehtonen, M. An Analysis of Photo-Voltaic Hosting Capacity in Finnish Low Voltage Distribution Networks. Energies 2017, 10, 1702. [Google Scholar] [CrossRef]
  6. Bertini, D.; Moneta, D.; Carneiro, J.S.D.A.; Falabretti, D.; Merlo, M.; Silvestri, A. Hosting Capacity of Italian LV Distribution Networks. In Proceedings of the CIRED Conference, Frankfurt, Germany, 6–9 June 2011. [Google Scholar]
  7. Nassif, A. An Analytical Assessment of Feeder Overcurrent Protection with Large Penetration of Distributed Energy Resources. IEEE Trans. Ind. Appl. 2018, 54, 5400–5407. [Google Scholar] [CrossRef]
  8. Khademlahashy, A.; Li, L.; Every, N.; Zhu, J. A review on protection issues in micro-grids embedded with distribution generations. In Proceedings of the IEEE Conference on Industrial Electronics and Applications, Siem Reap, Cambodia, 18–20 June 2017; IEEE: Piscataway, NJ, USA. [Google Scholar] [CrossRef]
  9. Lew, D.; Asano, M.; Boemer, J.; Ching, C.; Focken, U.; Hydzik, R.; Lange, M.; Motley, A. The Power of Small: The Effects of Distributed Energy Resources on System Reliability. IEEE Power Energy Mag. 2017, 6, 50–60. [Google Scholar] [CrossRef]
  10. Baboli, P.T. Flexible and overall reliability analysis of hybrid AC-DC microgrid among various distributed energy resource expansion scenarios. IET Gener. Transm. Distrib. 2016, 10, 3978–3984. [Google Scholar] [CrossRef]
  11. Yang, J.; Wang, Y. A review of the effects of distributed energy resources and power-electronic controlled loading on distribution network stability. In Proceedings of the IEEE Conference on Industrial Electronics and Applications, Hangzhou, China, 9–11 June 2014; IEEE: Piscataway, NJ, USA. [Google Scholar] [CrossRef]
  12. Shi, L.; Sun, S.; Yao, L.; Ni, Y.; Bazargan, M. Effects of wind generation intermittency and volatility on power system transient stability. IET Renew. Power Gener. 2014, 8, 509–521. [Google Scholar] [CrossRef]
  13. Kanchanaharuthai, A.; Chankong, V.; Loparo, K. Transient stability and voltage regulation in power systems with renewable distributed energy resources. In Proceedings of the EnergyTech Conference, Cleveland, OH, USA, 25–26 May 2011; IEEE: Piscataway, NJ, USA. [Google Scholar] [CrossRef]
  14. Cutsem, T.V.; Vournas, C. Voltage Stability of Electric Power Systems; Springer: New York, NY, USA, 1998. [Google Scholar] [CrossRef]
  15. Chanhome, A.; Phichaisawat, S.; Chaitusaney, S. Minimization of voltage fluctuation by considering uncertainty from Renewable Energy Resources. In Proceedings of the ECTICon Conference, Krabi, Thailand, 15–17 May 2013; IEEE: Piscataway, NJ, USA. [Google Scholar] [CrossRef]
  16. Aziz, T.; Ketjoy, N. PV Penetration Limits in Low Voltage Networks and Voltage Variations. IEEE Access 2017, 5, 16784–16792. [Google Scholar] [CrossRef]
  17. Vilman, A.; Jerele, M. Voltage quality provision in low-voltage networks with high penetration of renewable production. CIRED—Open Access Proc. J. 2017, 2017, 2053–2056. [Google Scholar] [CrossRef]
  18. Liang, X. Emerging Power Quality Challenges Due to Integration of Renewable Energy Sources. IEEE Trans. Ind. Appl. 2017, 53, 855–866. [Google Scholar] [CrossRef]
  19. Zotti, G.D.; Pourmousavi, S.A.; Madsen, H.; Poulsen, N.K. Ancillary services 4.0: A top-to-bottom control-based approach for solving ancillary services problems in smart grids. IEEE Access 2018, 6, 11694–11706. [Google Scholar] [CrossRef]
  20. Rebours, Y.G.; Kirschen, D.S.; Trotignon, M.; Rossignol, S. A survey of frequency and voltage control ancillary services—Part II: Economic features. IEEE Trans. Power Syst. 2007, 22, 358–366. [Google Scholar] [CrossRef]
  21. Renedo, J.; Garcia-Cerrada, A.; Rouco, L. Reactive Power Coordination in VSC-HVDC Multi-Terminal Systems for Transient Stability Improvement. IEEE Trans. Power Syst. 2017, 32, 3758–3767. [Google Scholar] [CrossRef]
  22. Mei, S.; Ni, Y.; Wang, G.; Wu, S. A Study of Self-Organized Criticality of Power System Under Cascading Failures Based on AC-OPF With Voltage Stability Margin. IEEE Trans. Power Syst. 2008, 23, 1719–1726. [Google Scholar] [CrossRef]
  23. Saadat, H. Power System Analysis, 3rd ed.McGraw Hill: New York, NY, USA, 1999. [Google Scholar]
  24. Kaloudas, C.G.; Ochoa, L.F.; Marshall, B.; Majithia, S.; Fletcher, I. Assessing the Future Trends of Reactive power Demand of Distribution Networks. IEEE Trans. Power Syst. 2017, 32, 4278–4288. [Google Scholar] [CrossRef]
  25. Chen, Y.C.; Dhople, S.V. Power Divider. IEEE Trans. Power Syst. 2016, 31, 5135–5143. [Google Scholar] [CrossRef]
  26. Corsi, S.; Pozzi, M.; Sabelli, C.; Serrani, A. The coordinated automated voltage control of the Italian transmission grid-part I: Reasons of the choice and overview of the consolidated hierarchical system. IEEE Trans. Power Syst. 2004, 19, 1723–1732. [Google Scholar] [CrossRef]
  27. Grid Code, Italian TSO. Available online: https://www.terna.it/en-gb/sistemaelettrico/codicedirete.aspx (accessed on 28 March 2019).
  28. Haberg, M.; Bood, H.; Doorman, G. Preventing internal congestion in an integrated European balancing activation optimization. Energies 2019, 12, 490. [Google Scholar] [CrossRef]
  29. Mokkapaty, S.; Weiss, J.; Schalow, F.; Declercq, J. New generation voltage regulation distribution transformer with an on load tap changer for power quality improvement in the electrical distribution systems. CIRED—Open Access Proc. J. 2017, 2017, 784–787. [Google Scholar] [CrossRef] [Green Version]
  30. Zimmer, H.; Niersbach, B.; Hanson, J. Optimization of power plant AVR parameters to improve transient voltage stability. In Proceedings of the CPE-POWERENG Conference, Cadiz, Spain, 4–6 April 2017; IEEE: Piscataway, NJ, USA. [Google Scholar] [CrossRef]
  31. Mohanty, A.; Behera, R.; Panigrahi, B. Fuzzified Philip_Heffron model power system stabilizer for improvisation of Voltage stability. In Proceedings of the ICEEOT Conference, Chennai, India, 3–5 March 2016; IEEE: Piscataway, NJ, USA. [Google Scholar] [CrossRef]
  32. Igbinovia, F.O.; Fandi, G.; Ahmad, I.; Muller, Z.; Tlusty, J. Modeling and Simulation of the Anticipated Effects of the Synchronous Condenser on an Electric-Power Network with Participating Wind Plants. Sustainability 2018, 10, 4834. [Google Scholar] [CrossRef]
  33. Igbinovia, F.O.; Fandi, G.; Mller, Z.; Svec, J.; Tlusty, J. Cost implication and reactive power generating potential of the synchronous condenser. In Proceedings of the IGBSG Conference, Prague, Czech Republic, 27–29 June 2016; IEEE: Piscataway, NJ, USA. [Google Scholar] [CrossRef]
  34. Wenzel, T.; Leibfried, T. Voltage stability with mechanically switched capacitors using Vacuum Circuit Breakers in the High-Voltage Grid. In Proceedings of the International Conference on Optimization of Electrical and Electronic Equipment, Basov, Romania, 20–22 May 2010; IEEE: Piscataway, NJ, USA. [Google Scholar] [CrossRef]
  35. Wang, K.; Ye, M.; Xiong, W.; Wang, F.; Hou, J. Coordinated control of STATCOM and mechanically switched capacitors to improve short-term voltage stability. In Proceedings of the POWERCON Conference, Wollongong, Australia, 28 September–1 October 2016; IEEE: Piscataway, NJ, USA. [Google Scholar] [CrossRef]
  36. Xie, J.; Zhang, W.; Yang, H.; Zhang, Y. A coordinate strategy of inverter and transformer control modes to improve static voltage stability in AC/DC power systems. In Proceedings of the IEEE Power & Energy Society General Meeting, Chicago, IL, USA, 16–20 July 2017; IEEE: Piscataway, NJ, USA. [Google Scholar] [CrossRef]
  37. Nadeem, F.; Hussain, S.M.S.; Tiwari, P.K.; Goswami, A.K.; Ustun, T.S. Comparative Review of Energy Storage Systems, Their Roles, and Impacts on Future Power Systems. IEEE Access 2018, 7, 4555–4585. [Google Scholar] [CrossRef]
  38. Federal Energy Regulatory Commission. Payment for Reactive Power; Technical Report, AD14-7; Federal Energy Regulatory Commission: Washington, DC, USA, 2014.
  39. Ellis, A.; Nelson, R.; Engeln, E.V.; Walling, R.; MacDowell, J.; Casey, L.; Seymour, E.; Peter, W.; Barker, C.; Kirby, B.; et al. Reactive power performance requirements for wind and solar plants. In Proceedings of the IEEE Power & Energy Society General Meeting, San Diego, CA, USA, 22–26 July 2012; IEEE: Piscataway, NJ, USA. [Google Scholar] [CrossRef]
  40. Ali, J.; Massucco, S.; Petretto, G. Reactive power provision to TSO/DSO by aggregators and conventional generators. In Proceedings of the SmartGridComm Conference, Dresden, Germany, 23–27 October 2017; IEEE: Piscataway, NJ, USA. [Google Scholar] [CrossRef]
  41. Glavic, M.; Novosel, D.; Heredia, E.; Kosterev, D.; Habibi-Ashrafi, F.; Salazar, A.; Donnelly, M. See it fast to keep calm: Real-time voltage control under stressed conditions. IEEE Power Energy Mag. 2012, 10, 43–55. [Google Scholar] [CrossRef]
  42. Glavic, M.; Cutsem, T.V. Some Reflections on Model Predictive Control of Transmission Voltages. In Proceedings of the 38th North American Power Symposium NAPS, Carbondale, IL, USA, 17–19 September 2006; IEEE: Piscataway, NJ, USA. [Google Scholar] [CrossRef]
  43. Pereira, R.M.M.; Ferreira, C.M.M.; Barbosa, F.M. Comparative study of STATCOM and SVC performance on Dynamic Voltage Collapse of an Electric Power System with Wind Generation. IEEE Lat. Am. Trans. 2014, 12, 138–145. [Google Scholar] [CrossRef] [Green Version]
  44. Thukaram, D.; Yesuratnam, G. Optimal Reactive power dispatch in a large power system with AC-DC and FACTS controllers. IET Gener. Transm. Distrib. 2008, 2, 71–81. [Google Scholar] [CrossRef]
  45. Liu, W.; Zheng, T.; Liu, Z.; Fan, Z.; Kang, Y.; Wang, D.; Zhang, M.; Miao, S. Active and reactive power compensation control strategy for vsc-hvdc systems under unbalanced grid conditions. Energies 2018, 11, 490. [Google Scholar] [CrossRef]
  46. Cimino, M.; Pagilla, P.R. Reactive power control for multiple synchronous generators connected in parallel. IEEE Trans. Power Syst. 2016, 31, 4371–4378. [Google Scholar] [CrossRef]
  47. Li, H.; Wen, C.; Chao, K.-H.; Li, L.-L. Research on inverter integrated reactive power control strategy in the grid-connected pv systems. Energies 2017, 10, 912. [Google Scholar] [CrossRef]
  48. Ara, A.L.; Kazemi, A.; Niaki, S.A.N. Multiobjective optimal location of facts shunt-series controllers for power system operation planning. IEEE Trans. Power Deliv. 2012, 27, 481–490. [Google Scholar] [CrossRef]
  49. Lee, Y.; Song, H. A reactive power compensation strategy for voltage stability challenges in the Korean power system with dynamic loads. Sustainability 2019, 11, 326. [Google Scholar] [CrossRef]
  50. P.M. Anderson Test Case. Available online: http://www.fglongatt.org/Test_Systems/PM_Anderson.html (accessed on 28 December 2017).
  51. Sauer, P.M.; Pai, M.A. Power System Dynamics and Stability; Prentice Hall: Upper Saddle River, NJ, USA, 1998. [Google Scholar]
  52. DIgSILENT 2017 Examples. Available online: https://www.digsilent.de/en/powerfactory.html (accessed on 28 December 2017).
Figure 1. Transmission System Operator (TSO) needs vs. Approach of controller.
Energies 12 02047 g001
Figure 2. Proposal for Aggregation strategy.
Energies 12 02047 g002
Figure 3. Benefits of Aggregation strategy.
Energies 12 02047 g003
Figure 4. IEEE 9-bus conceptual system.
Energies 12 02047 g004
Figure 5. Voltage at bus 3 before addition of Static Synchronous Compensator (STATCOM).
Energies 12 02047 g005
Figure 6. Voltage at bus 3 after addition of STATCOM.
Energies 12 02047 g006
Figure 7. Node 3 voltage with/without STATCOM (one hour profile).
Energies 12 02047 g007
Figure 8. Response time to TSO with/without STATCOM.
Energies 12 02047 g008
Table 1. Reactive Power Compensation Techniques.
Reactive Power Compensation MechanismCosts (Overall)EfficiencyReactive Power Capability
Synchronous GeneratorVery high (specially the capital costs)Very highHigh
Synchronous CondenserHigh (both capital and operating costs)Very highHigh
CapacitorsLowVery highLow
Static VAR Compensator (SVC)Average (but the capital costs are high)HighLow
STATCOMAverage (but the capital costs are high)LowAverage
Inverters within Wind-PV FarmsLow (specially the operating costs)HighLower than SVC
Table 2. Look-up table for TSO mismatches.
Serial No.Point(s) of VariationIncrease or Decrease of Reactive Power?TSO Visibility for the Variation
1Bus/Node 5 (Load A)IncreaseDecrease in demand, i.e., the distribution system requires inductive reactive power
2Bus/Node 5 (Load A)DecreaseIncrease in demand, i.e., the distribution system requires capacitive reactive power
3Line from node 8 to node 9IncreaseCapacitive effect dominates on transmission network
4Line from node 8 to node 9DecreaseInductive effect dominates on transmission network
5Bus/Node 5 (Load A) and Line from node 8 to node 9IncreaseOverall reactive power mismatches, requires inductive reactive power
6Bus/Node 5 (Load A) and Line from node 8 to node 9DecreaseOverall reactive power mismatches, requires capacitive reactive power
Table 3. Definition of Input.
Serial No.ElementValues of Dataset
1Load A at Bus 5Real power = 250 MW, Reactive power = 50 MVAR
2Line 8–9X = 30 Ohm, B = 300 Micro-Siemens
3Generator at Node 3Real power = 140 MW, Reactive power = 50 MVAR
4Additional Synchronous Generator at node 3Real power = 140 MW, Reactive power = 70 MVAR
5Synchronous Condenser at node 3Real power = 140 MW, Reactive power = 70 MVAR
6STATCOM at node 3Reactive power = 70 MVAR (inductive/capacitive)
Table 4. Quasi-dynamic simulation report (loading range).
Serial No.ElementMaximum Loading in %
1Transformer 383.725
2Transformer 273.273
3Transformer 156.647
4Line 4 to 532.089
5Line 5 to 730.225
6Line 6 to 921.639
7Line 8 to 921.334
8Line 7 to 811.114
9Line 4 to 69.911
Table 5. Quasi-dynamic simulation report (voltage range).
BusVoltage Min. [PU] without CompensationVoltage Max. [PU] without CompensationVoltage Min. [PU] with SG OnlyVoltage Max. [PU] with SG OnlyVoltage Min. [PU] with SG & SCVoltage Max. [PU] with SG & SC
30.9101.2060.7121.1841.0921.116
90.9271.1800.9771.1610.9671.068
80.9681.1400.9911.1230.9750.995
20.9051.1270.9961.1130.9010.966
70.9951.1270.9131.1130.9010.967
60.9211.0880.9761.0780.9110.976
40.9111.0580.9881.0540.9750.977
10.9811.0401.0111.040.9681.040
50.9161.0390.9561.0310.9150.977

