1. Introduction
The electrification of road transport is one of the main policies discussed by local and national authorities to limit climate change and air pollution issues. Accounting for 15% of the CO
2 emissions in Europe [
1], light vehicles are one of the primary target of environmental policies. Accompanying measures often include tax exemptions and ecological rebates for vehicle purchase, but also incentives for the development of a charging network. Nowadays, battery electric vehicles (EVs) are limited to a market share of a few percent, and fast charging power capability is in the range of 50 to 120 kW. New projections and standards aim for a 20–40% market share by 2030 [
2] and 12–30 min charging sessions at 150 kW and up to 350 kW [
3].
Recently, we have observed the deployment of large, multi-stall, fast charging stations (Ionity™, Tesla™, Ultra-E™, VW Electrify™, Fastned™…) along transnational or transcontinental corridors. Even if slow charging modes, at home or at work, will likely represent the major share of charging events, fast charging is a necessity along long transit axes. The current supercharger network from Tesla™ has an average of 8 charging points per station, and new installations with up to 40 stalls were recently reported [
4]. However, the availability of large power connections is a constraint for the deployment of multi-stall charging stations. Indeed, access to the medium voltage grid is typically required for stations with more than two fast charging points. In addition, because many electricity providers charge separately for the energy and the power delivered, the economic impact of demand charge schemes can weaken the business case for stations with low utilization rates [
5]. For example, with half of the utilities in the US having a demand charge above
$15/kW [
6],
$27,000 per ultrafast charging point would be spent annually by a charging station operator (CSO).
Nowadays, in most cases, installing multiple charging points without the associated power connection is not an issue. According to the data collected by Fastned™ [
7], it appears that fast charging stations are largely underused, with an average of 7.12 charging sessions per station per day reported in June 2018. Under these conditions, a limited number of users will be affected during peak hours if the contracted power does not cover the demand, and power share between stalls is implemented by several CSOs. On the other hand, for stations used at full capacity, several studies have pointed out the issues triggered on the electrical grid. Managing the impacts of EVs on the power system is a growing concern [
8], and several studies have been conducted to evaluate mitigation techniques via demand side management and power electronics topologies.
Vehicle-to-grid and bidirectional chargers can simultaneously help to support local consumption and contribute to grid regulation, and thus represent particularly relevant solutions for locations with long parking durations. However, they are not considered as appropriate for quick stops at ultra-fast charging stations along transit axes. Indeed, a key condition to implement such schemes is the idle time a vehicle remains attached to a plug, which makes sense at office buildings [
9] or at home. A typical example was proposed by Quddus et al. [
10] with a sector coupling scheme between vehicles, charging stations, and commercial buildings, with hourly operational decisions for energy flows, but it does not address the minute-scale power peak issues of ultra-fast charging stations. From a CSO perspective, the first issues to solve are grid connection requirements and demand charges, rather than grid services such as frequency regulation, which can be implemented in a later stage.
Thus, two major questions are emerging regarding ultra-fast charging stations: how many charging points are required to satisfy a given charging demand appropriately, and how to size an energy buffer to reduce grid connection requirements. Because the answer of the first question determines the power demand curve, the questions must be answered sequentially.
The prediction of power demand curves at fast charging stations is a prerequisite for ESS implementation studies. Richard and Petit [
11] covered this statistical aspect by running a simulation for 10 years, with three daily peaks (morning, noon, evening) and a normal distribution of state-of-charge (SoC) for a fleet of five different EV types. They claim that waiting times were always below 2 min. Regarding ESS implementation, they limited their investigation to one station configuration (three 120 kW chargers), and two ESS sizes (250 and 650 kWh). Consequently, they decided to modulate the charging power delivered to EVs in order to avoid a complete depletion of the ESS. Gjelaj et al. [
12] used a log normal distribution of daily travel distance to derive the charging needs of EVs with a 50 kWh battery pack. A distinction between workday and holiday was used for the hourly distribution of charging events and stations with up to five charging points at 150 kW were investigated. Queue management details are not provided. The results are presented for a 1 day simulation. A third example of power demand curve derivation is provided by Dominguez-Navarro et al. [
13]. In this study, they ran a Monte Carlo simulation, considering an average time between two arrivals at the station as a function of the hour of the day. A lognormal distribution of SoC was used, coupled to a distribution of battery capacities ranging from 3.6 to 63 kWh. If all charging points were occupied, vehicles automatically left the station. Various configurations with five 50 kW charging points in combination with renewable power generation were investigated.
While stochastic approaches appear to be well-suited for modeling power demand profiles at fast charging stations, they are rarely used to cover a wide range of station capacities (in terms of vehicles per week) and constraints (in terms of queuing and installed charging points). In the same way, battery assisted charging stations [
14] are well covered in the literature, but methods and results may present versatility and universality hurdles for practical implementation. Several products are being commercialized by companies such as Porsche™ [
15], ads-tec™ [
16], Volkswagen™ [
17], and Freewire [
18], with modular solutions in the range of 70 to 360 kWh, but no consistent modeling approach is available yet to assess their capabilities.
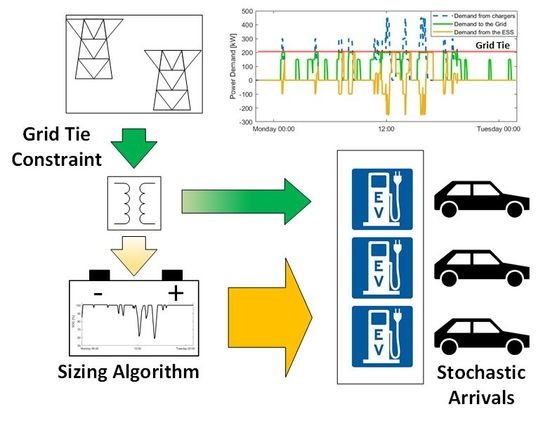
Herein, we report a robust stochastic approach, considering various charging station capacities and queuing characteristics, with an appropriate ESS sizing algorithm introduced to address grid connection constraints. Similarly, various implementation scenarios can be investigated for a given battery capacity. The developed methodology is applied for a specific case study, considering a Swiss charging station with the same frequentation as an average gas station.
2. Model and Methods
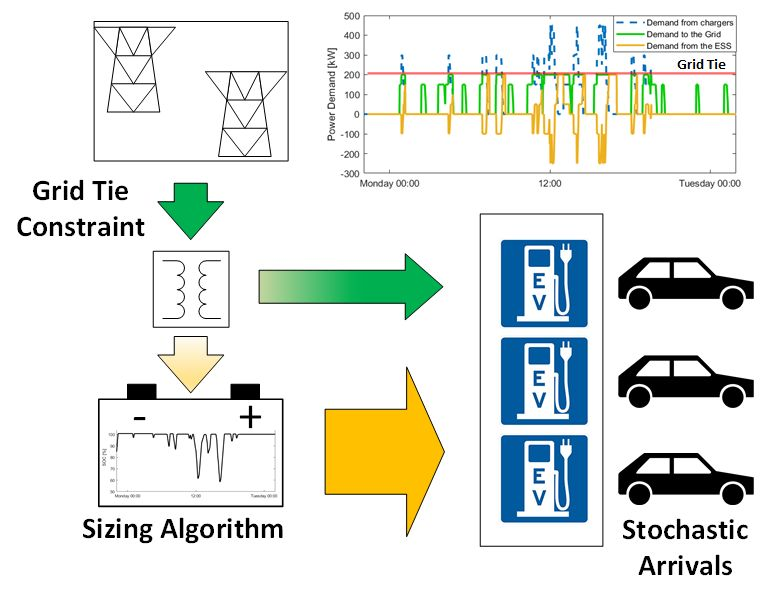
The charging station problem involves different timescales, ranging from the minute, for a charging event, to the year, for seasonal effects. A stochastic approach to model the charging demand at the station is presented, and used in a second phase as input data for an ESS sizing algorithm. Two parameters were considered for the analysis: the number of installed charging points and the contracted power available from the grid, i.e., the grid tie.
2.1. Charging Demand and Charging Points
Several assumptions are required to derive the power demand profile at the station: the duration of charging events, the power profile of individual charging events, and, finally, the hourly distribution of charging events throughout the week and queuing models. Unfortunately, only limited datasets are available for fast charging stations. No 150 kW public station has yet reached its full capacity in terms of frequentation, due to the limited availability of EVs with this charging capability. A stochastic approach was therefore used to model charging datasets as representative as possible of a full scale EV deployment.
The duration of fast charging events is expected to be in the range of 12 to 30 min. The real value depends on many factors related to the vehicle itself, but also to the behavior and preferences of the driver. A random integer value between 12 and 30 min was assumed. During such charging events, 25 to 70 kWh can be transferred to the vehicle. Even if a normal distribution of charging durations was observed in some early measurements [
19], this might be a bias due to the limited diversity of vehicles’ battery capacities available at this time. Such a distribution will limit the dispersion of the results. A distribution of vehicle’s SoC at arrival can be also used to derive charging duration, as previously mentioned [
11,
12].
While we considered vehicles with a 150 kW charging capability, a constant charging power of 150 kW is not practically implemented in order to prevent excessive battery degradation. A large variety of battery management systems (BMS) and charging strategies are used by car manufacturers, but the general idea is that, at high SoC, the charging power decreases [
20]. Thus, based on preliminary protocols [
20], we here assumed that the nominal 150 kW charging power is applied from the beginning until the last 4 min, and from there on linearly decreases down to 50 kW.
The hourly distribution of charging events during the week was based on the measurements made at Nexant™ petrol stations [
21]. This typical distribution has been observed in various locations, including EV charging stations [
7,
22,
23], and all regions display morning and an evening peaks. While overnight charging may represent a large share of charging events, long transit axes with fast charging stations will likely be used in the same way as current petrol stations. It is known that some extreme charging event periods such as Thanksgiving and Christmas will largely overshoot the average frequentation [
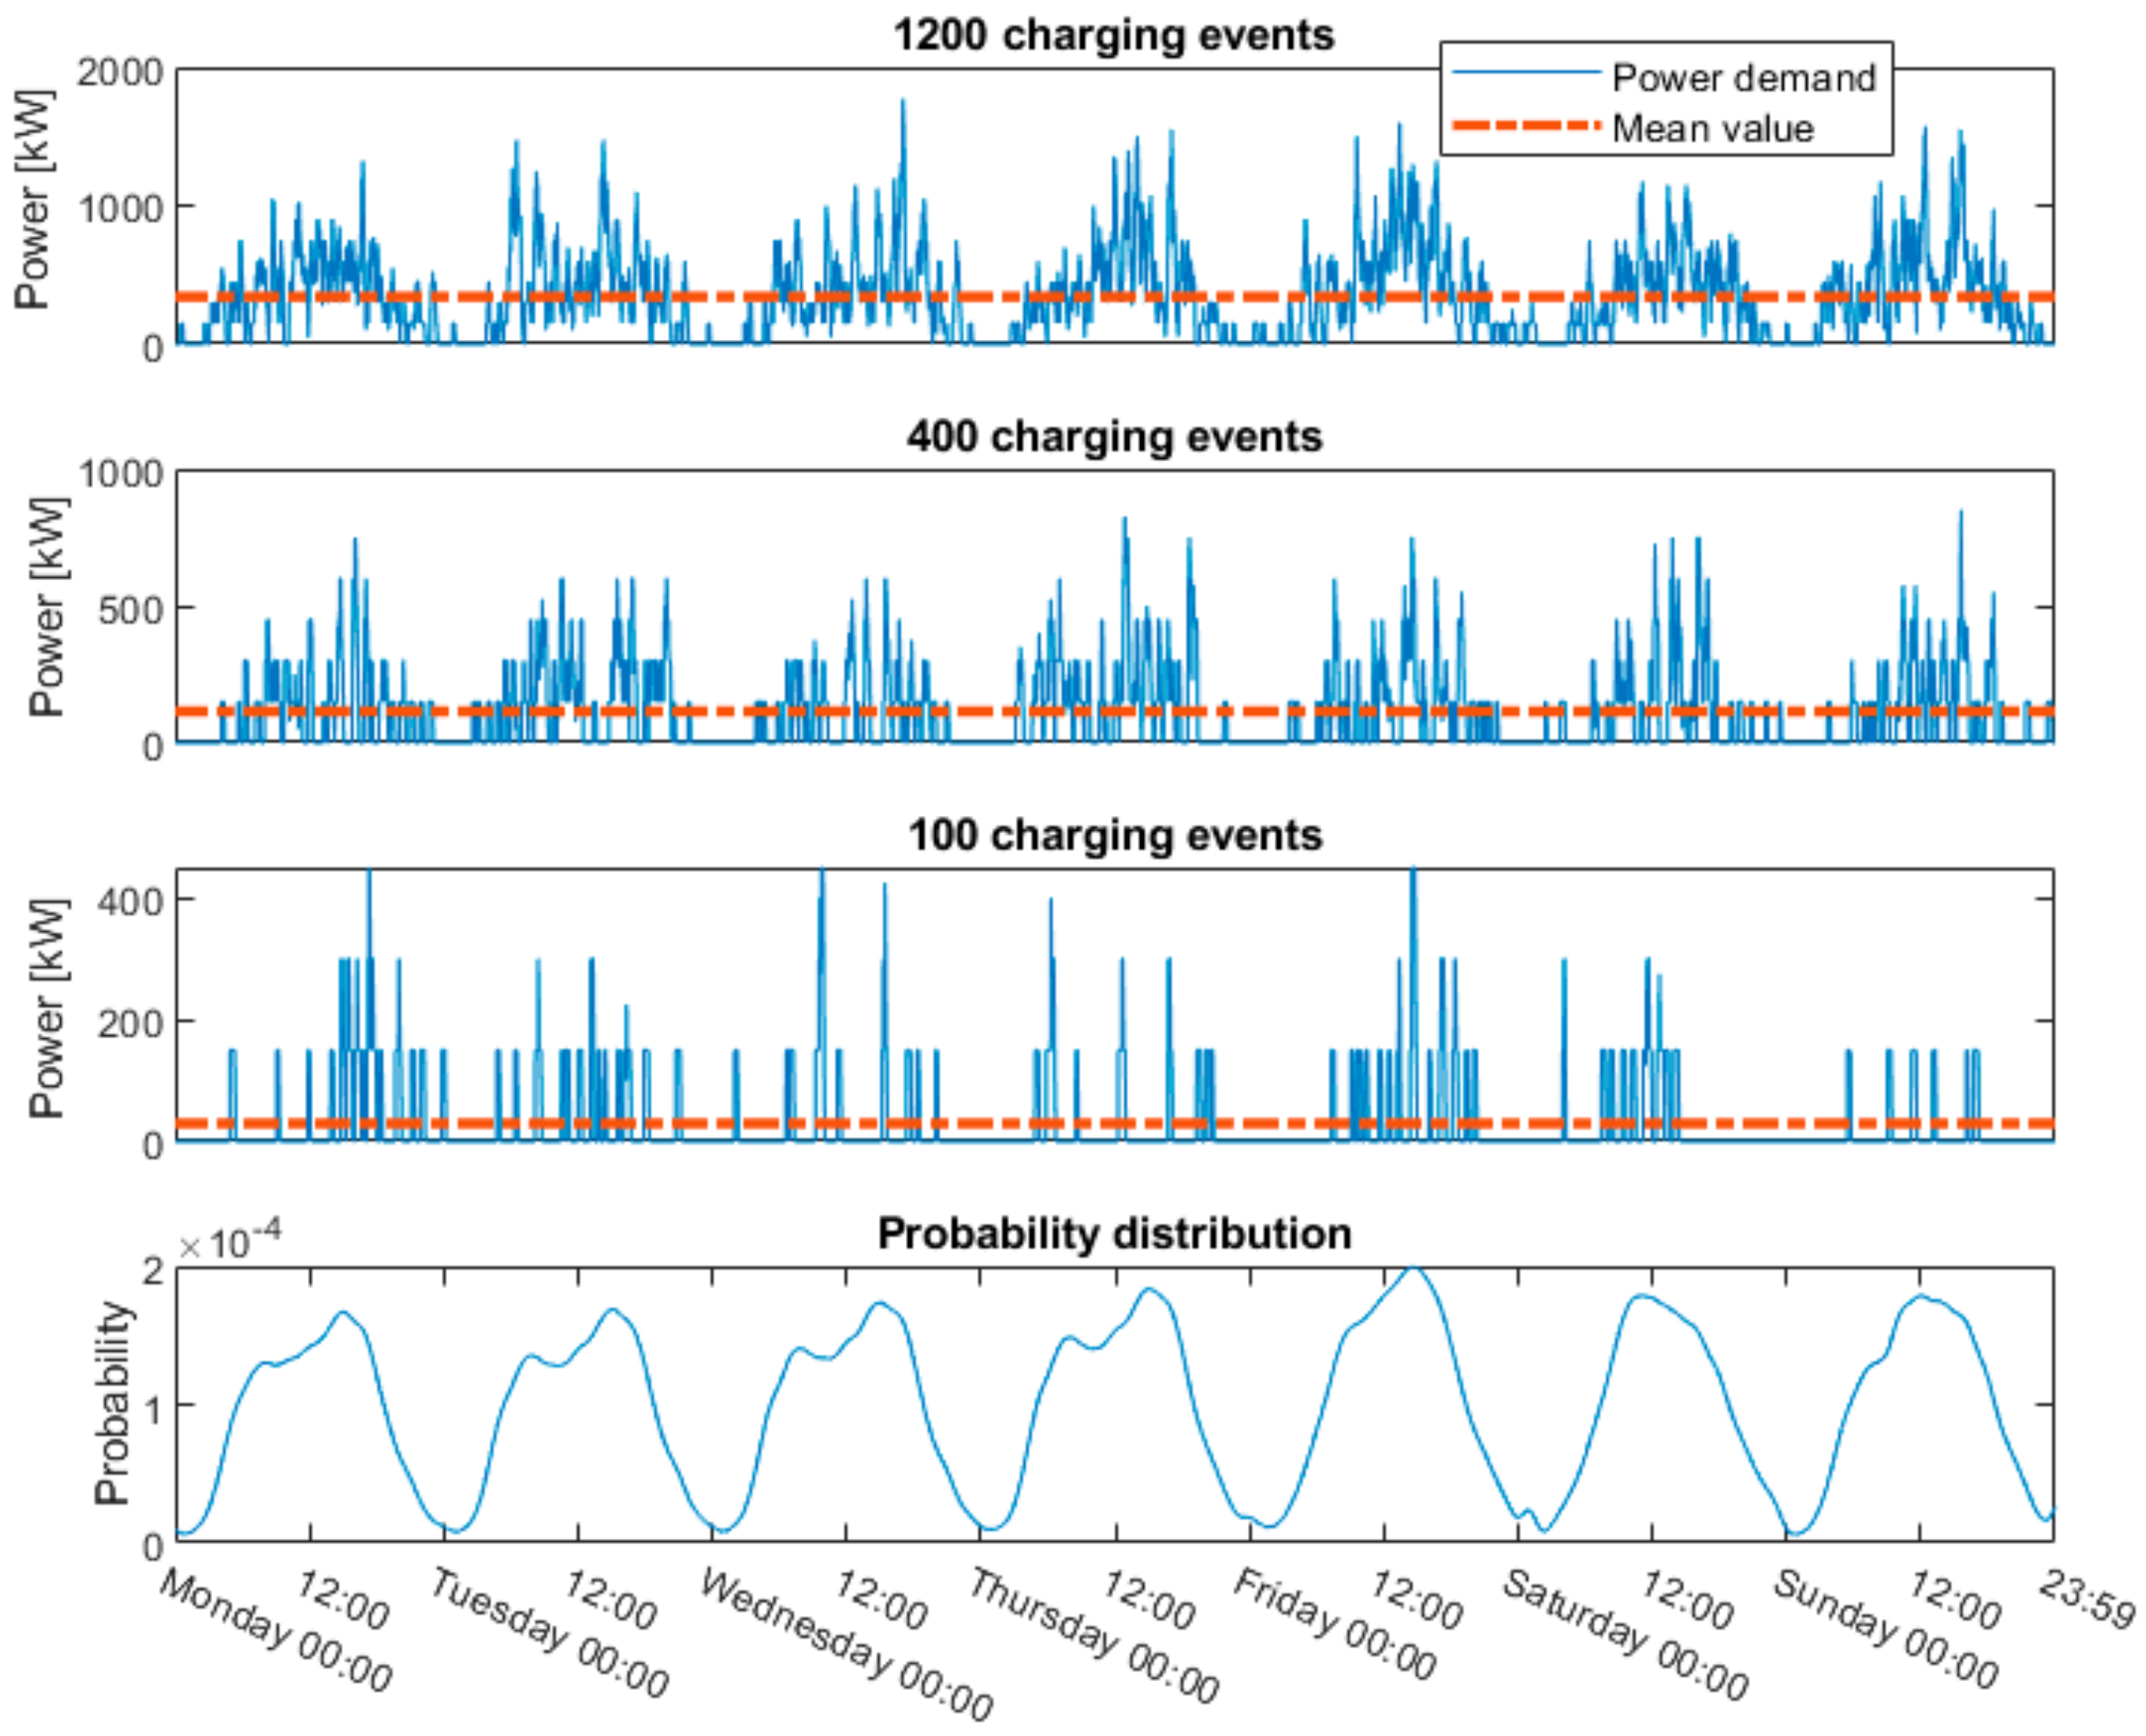
24], and other seasonal effects have been observed, but these are not considered here. The probability distribution was used to generate the time of arrival of each vehicle during the week. We obtained the power demand curves presented in
Figure 1.
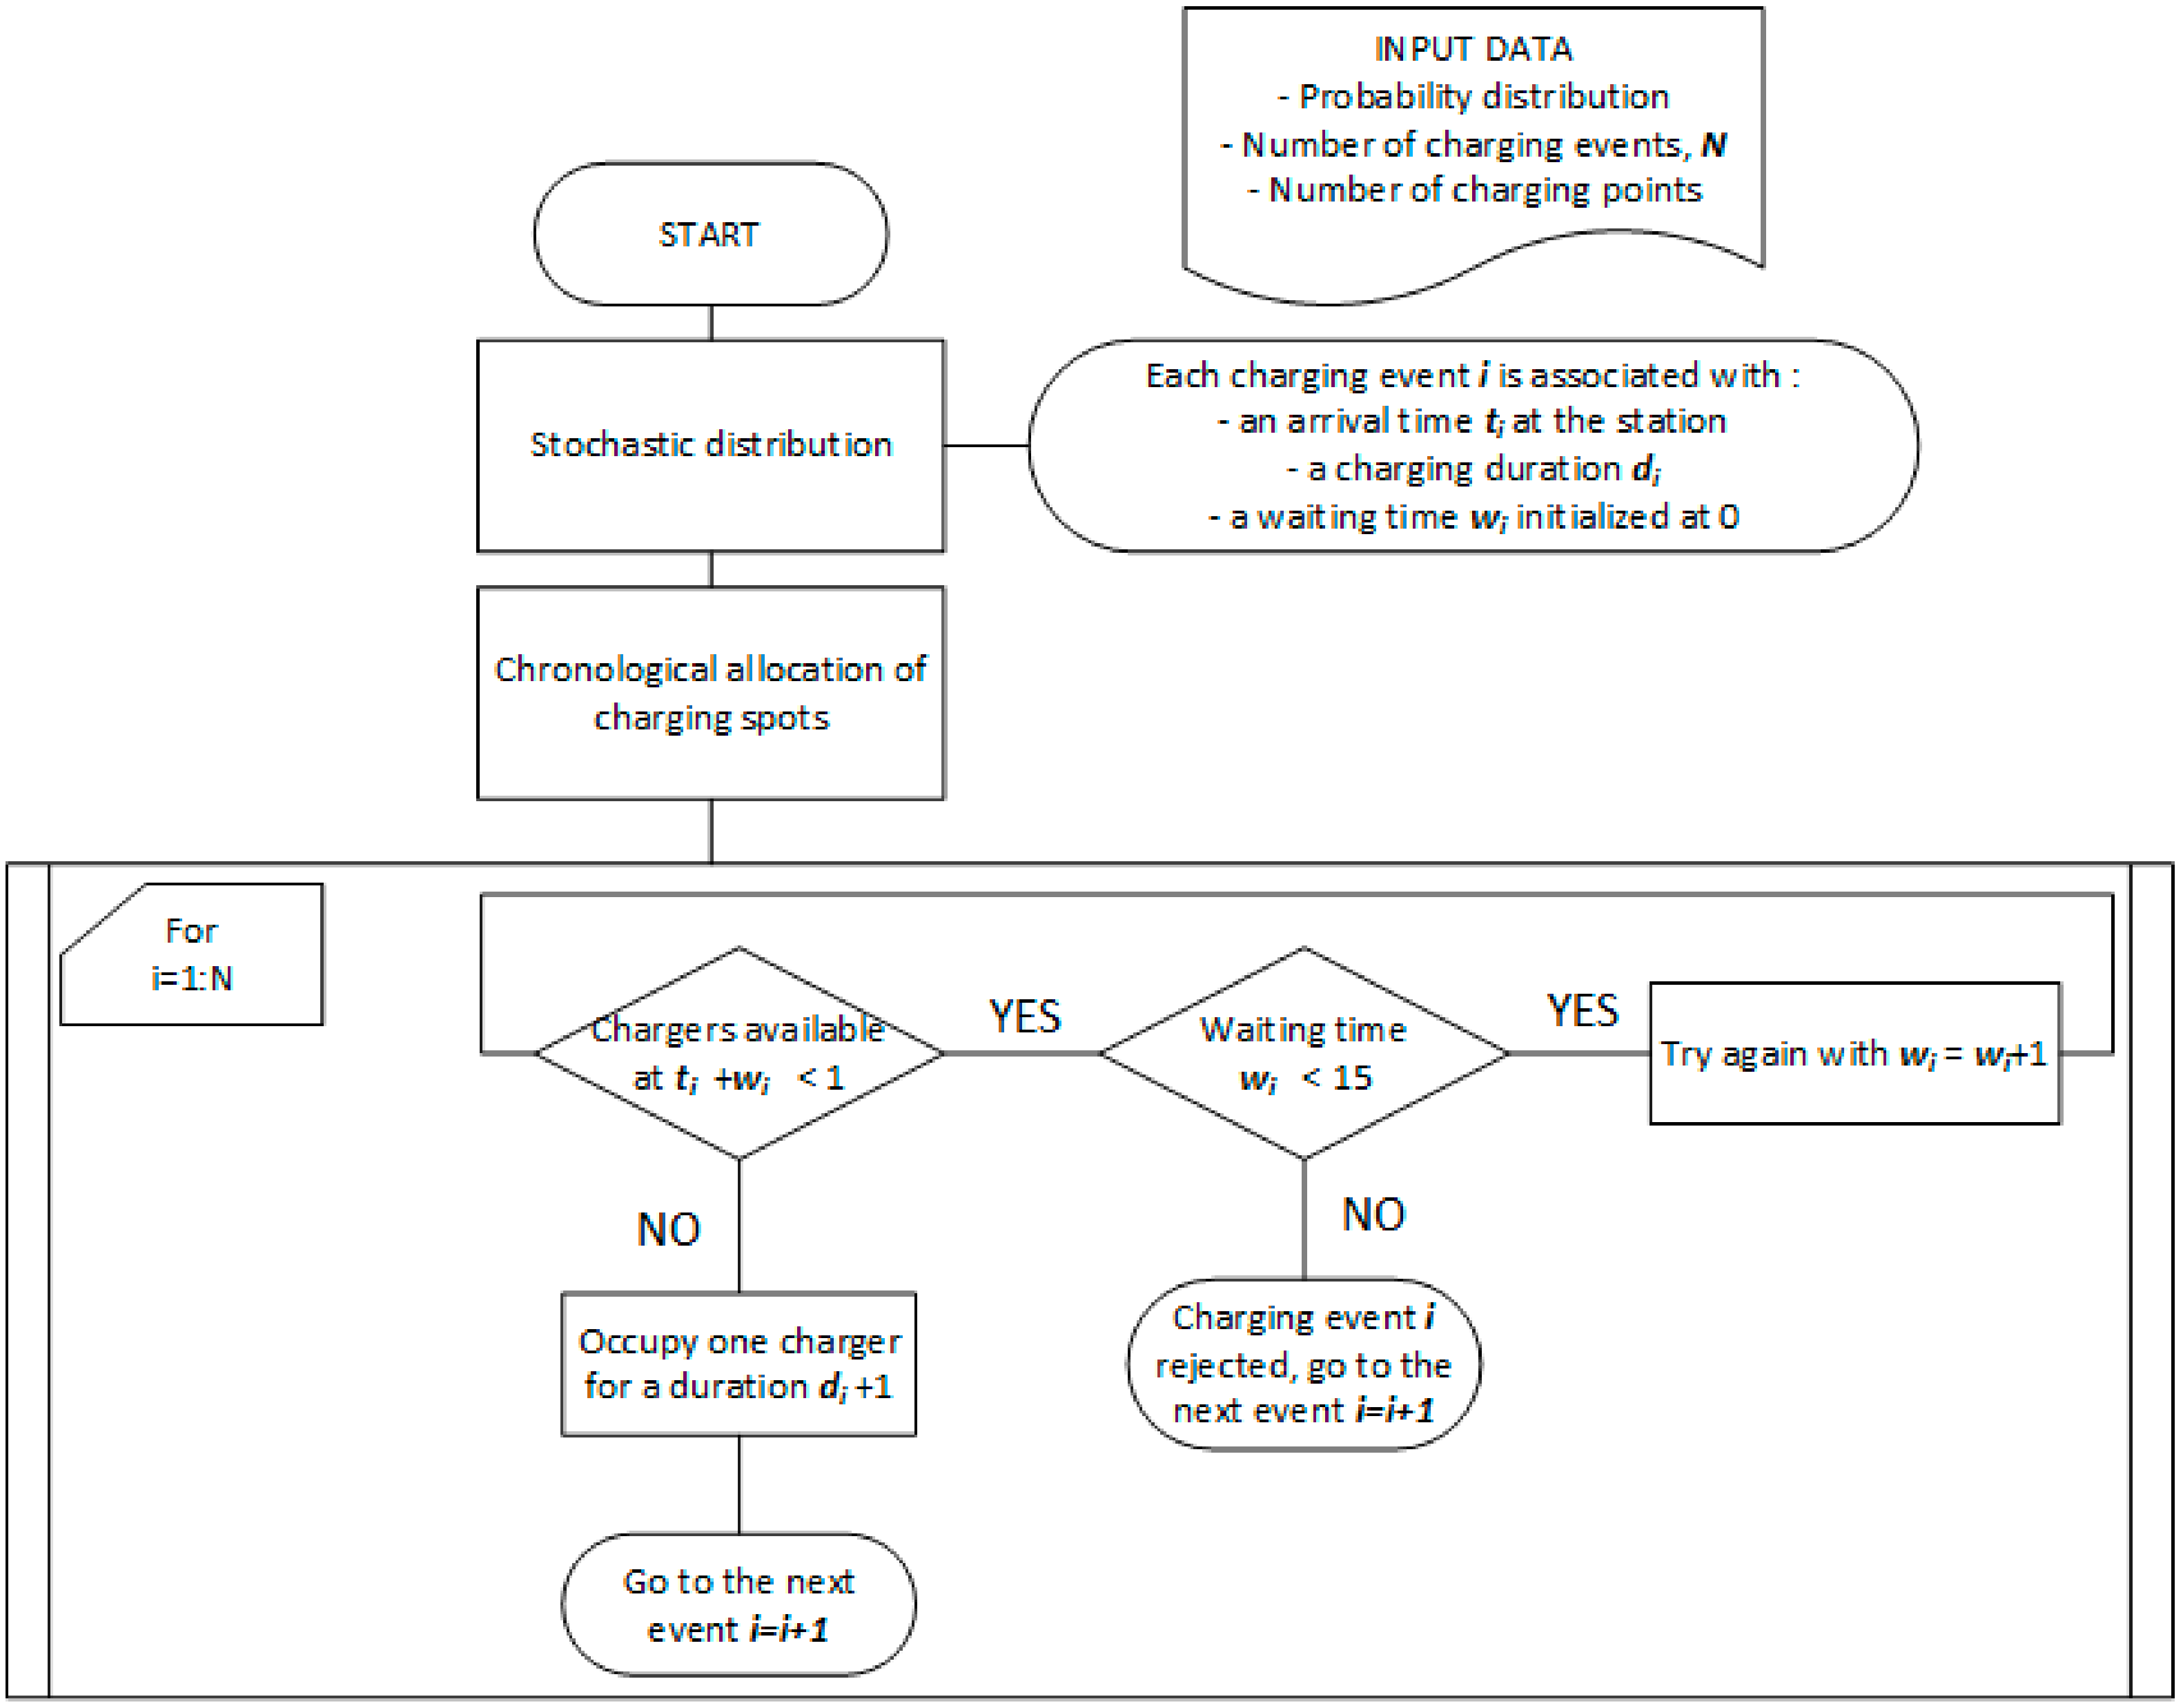
Since a limited number of charging points is available at each station, a queuing model was implemented. If all charging points were used, we assumed that a new charging event could be delayed by up to 15 min before being considered rejected, i.e., the corresponding user decides not to recharge. Three metrics were used to assess the capacity of the station:
- -
The percentage of users needing to wait in order to get access to a charging point;
- -
The percentage of users needing to wait more than 5 min to get access to a charging point;
- -
The percentage of users rejected (or waiting more than 15 min).
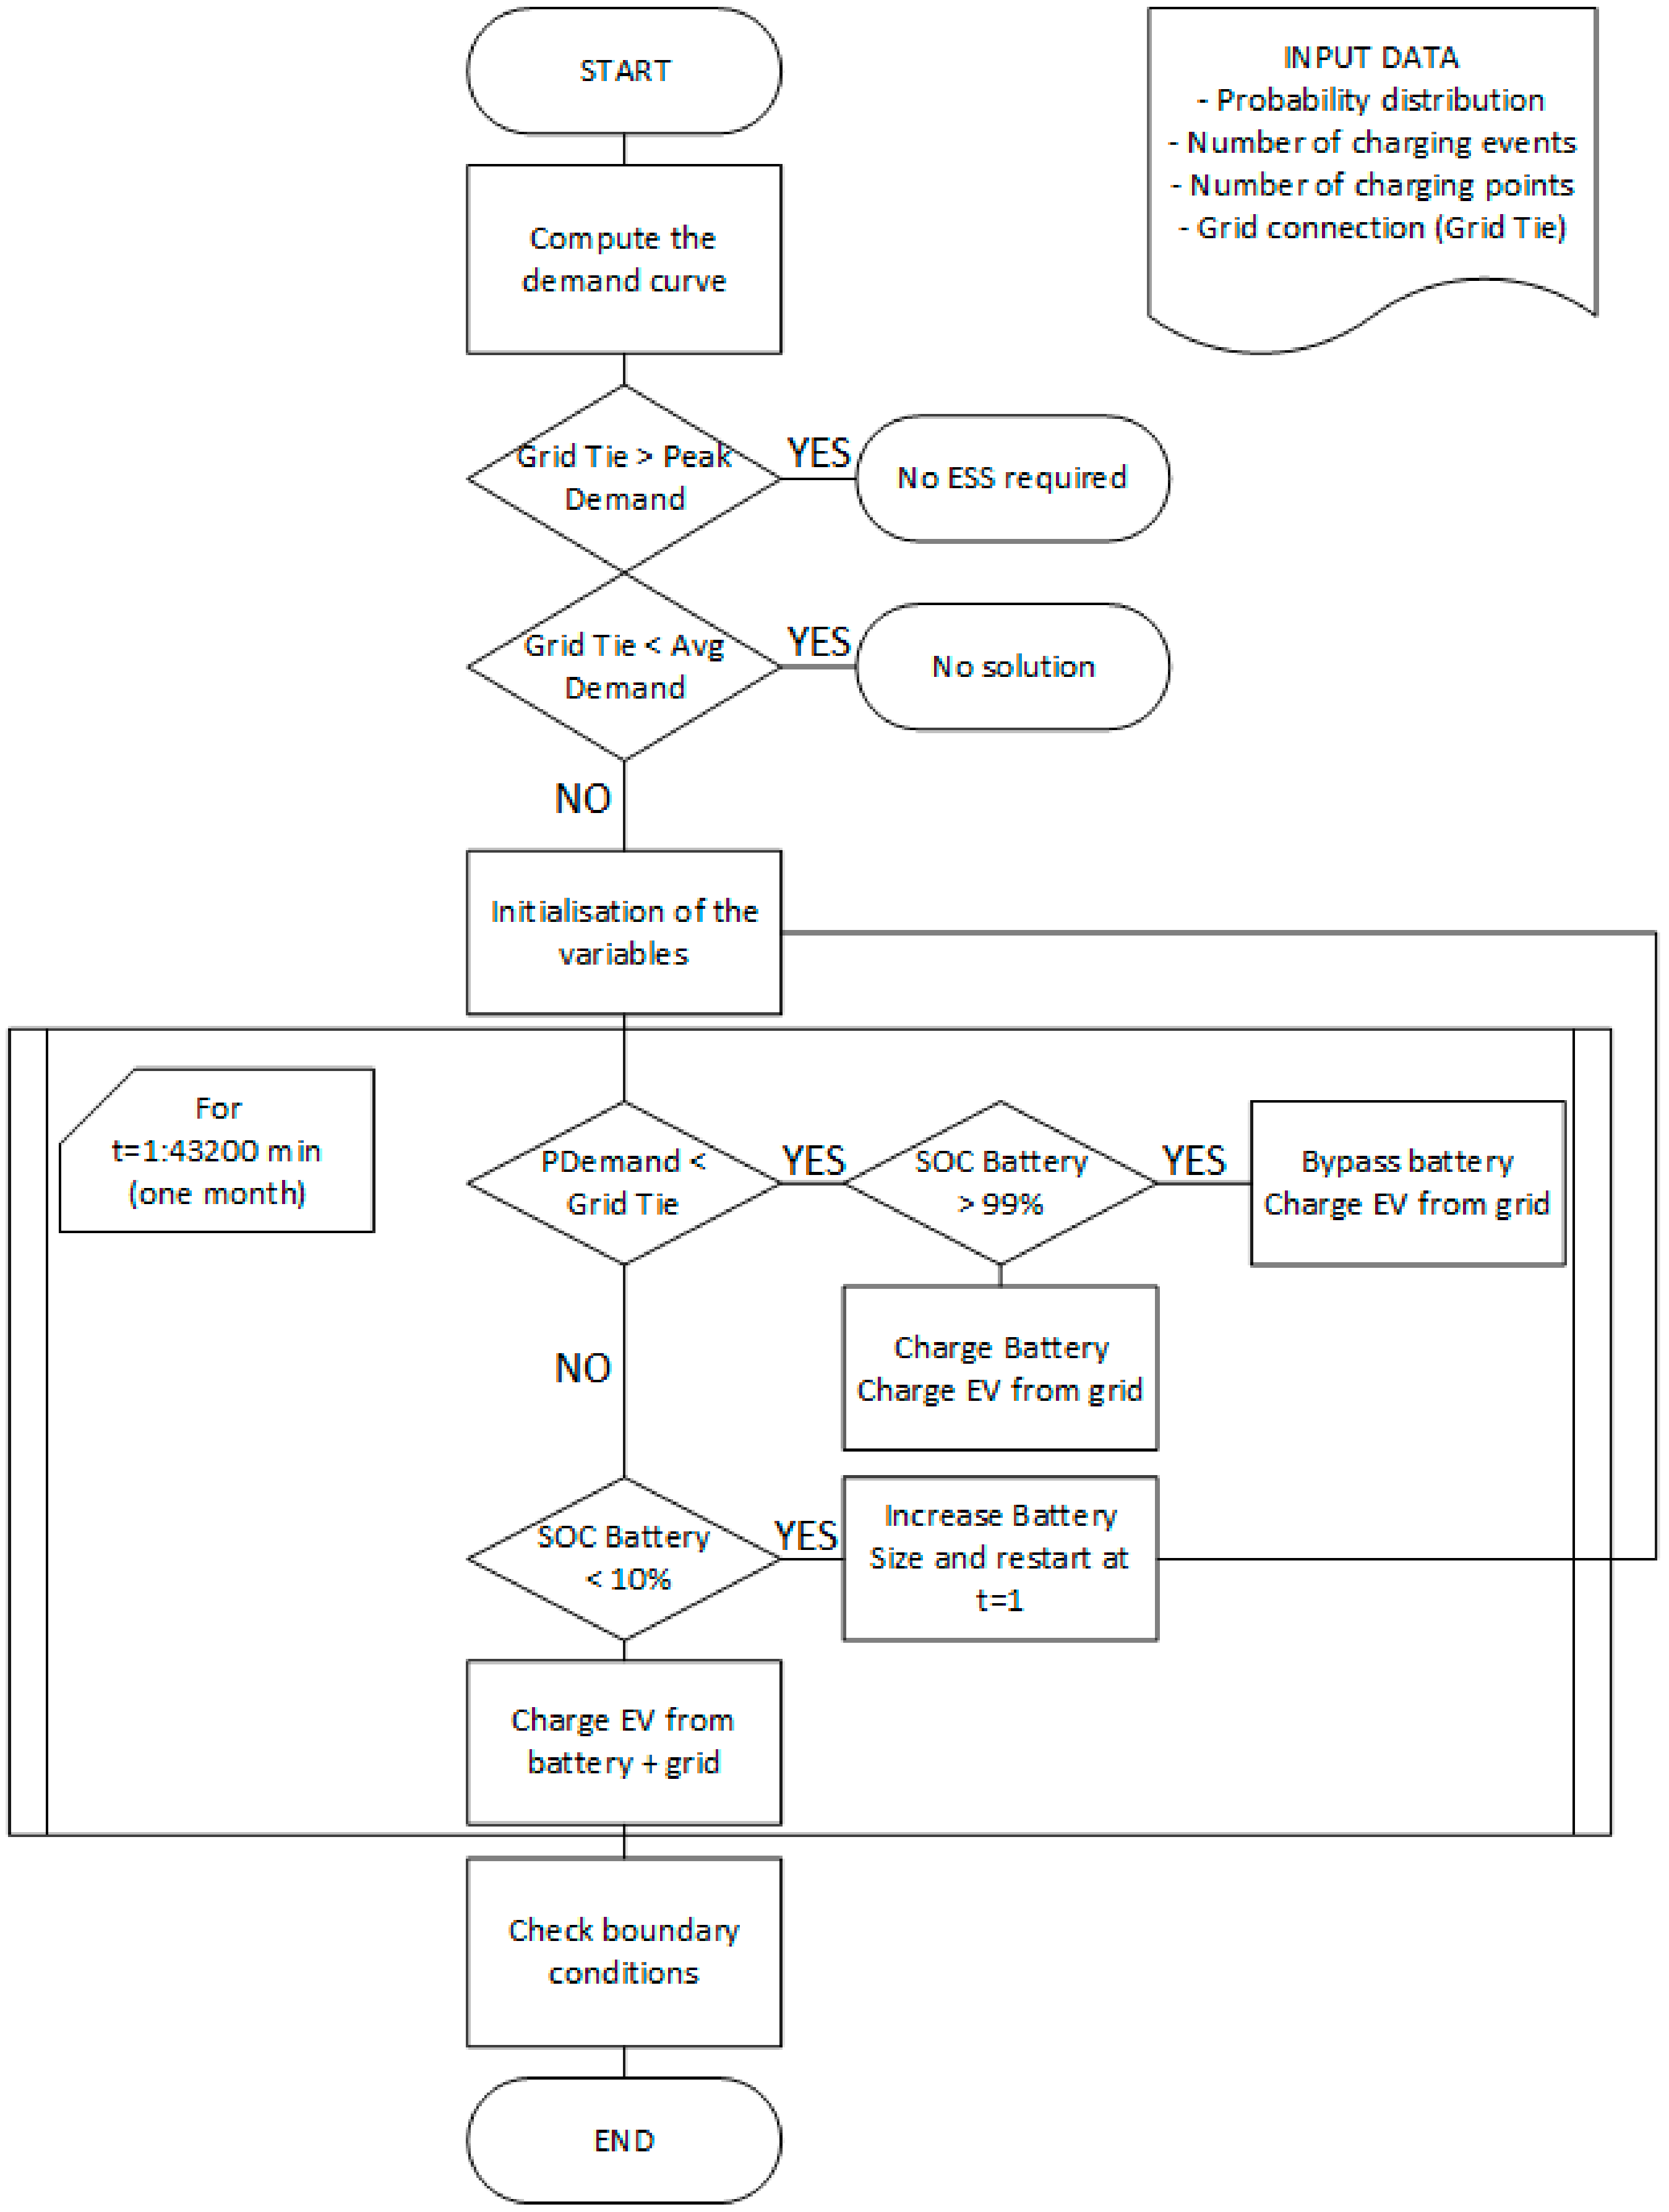
Using these metrics, we defined a minimum number of charging points able to meet the expected demand while keeping acceptable queuing levels. Allowing some queuing at the station can be considered the first measure to limit the required grid tie for a given number of charging events. The algorithm to compute the demand curve and queuing metrics is presented in
Figure 2.
2.2. ESS Operation and Sizing
The modeling from the previous section highlights a considerable potential to reduce peak power requirements considering the average power, as shown in
Figure 1. This characteristic, particularly prominent for small stations, is specific to charging stations with very large peak-to-average power ratios, as presented in
Table 1.
Without ESS, the grid connection must be dimensioned to cover the peak power, which results in oversized power transformers and expensive demand charges. With an ESS, the required grid connection can approach the average power demand. The ESS provides additional power when the grid connection is not sufficient. Subsequently, the ESS is recharged when the power demand is below the contracted power.
While the ESS capacity, in kWh, requires running of an algorithm with power demand curves, the ESS power requirements are immediately determined by the difference between the peak demand and the grid tie.
Once the number of charging events and the corresponding number of charging points was defined, the stochastic model from the previous section was used to compute the power demand curve. If the grid tie is smaller than the peak power demand but larger than the average demand, an ESS can be installed. The algorithm used to define the appropriate capacity is presented in
Figure 3. The ESS capacity was iteratively increased until a full month could be covered without the SoC going below 10%. We also ensured that, at the end of the month, the battery could be returned at the same SoC as in the beginning. A charging and a discharging efficiency of 95% was considered (90% round trip). Because of the stochastic nature of the problem, 100 months were simulated in order to ensure the consistency of the results. The algorithm was stopped if the required ESS capacity exceeded 1.1 MWh.
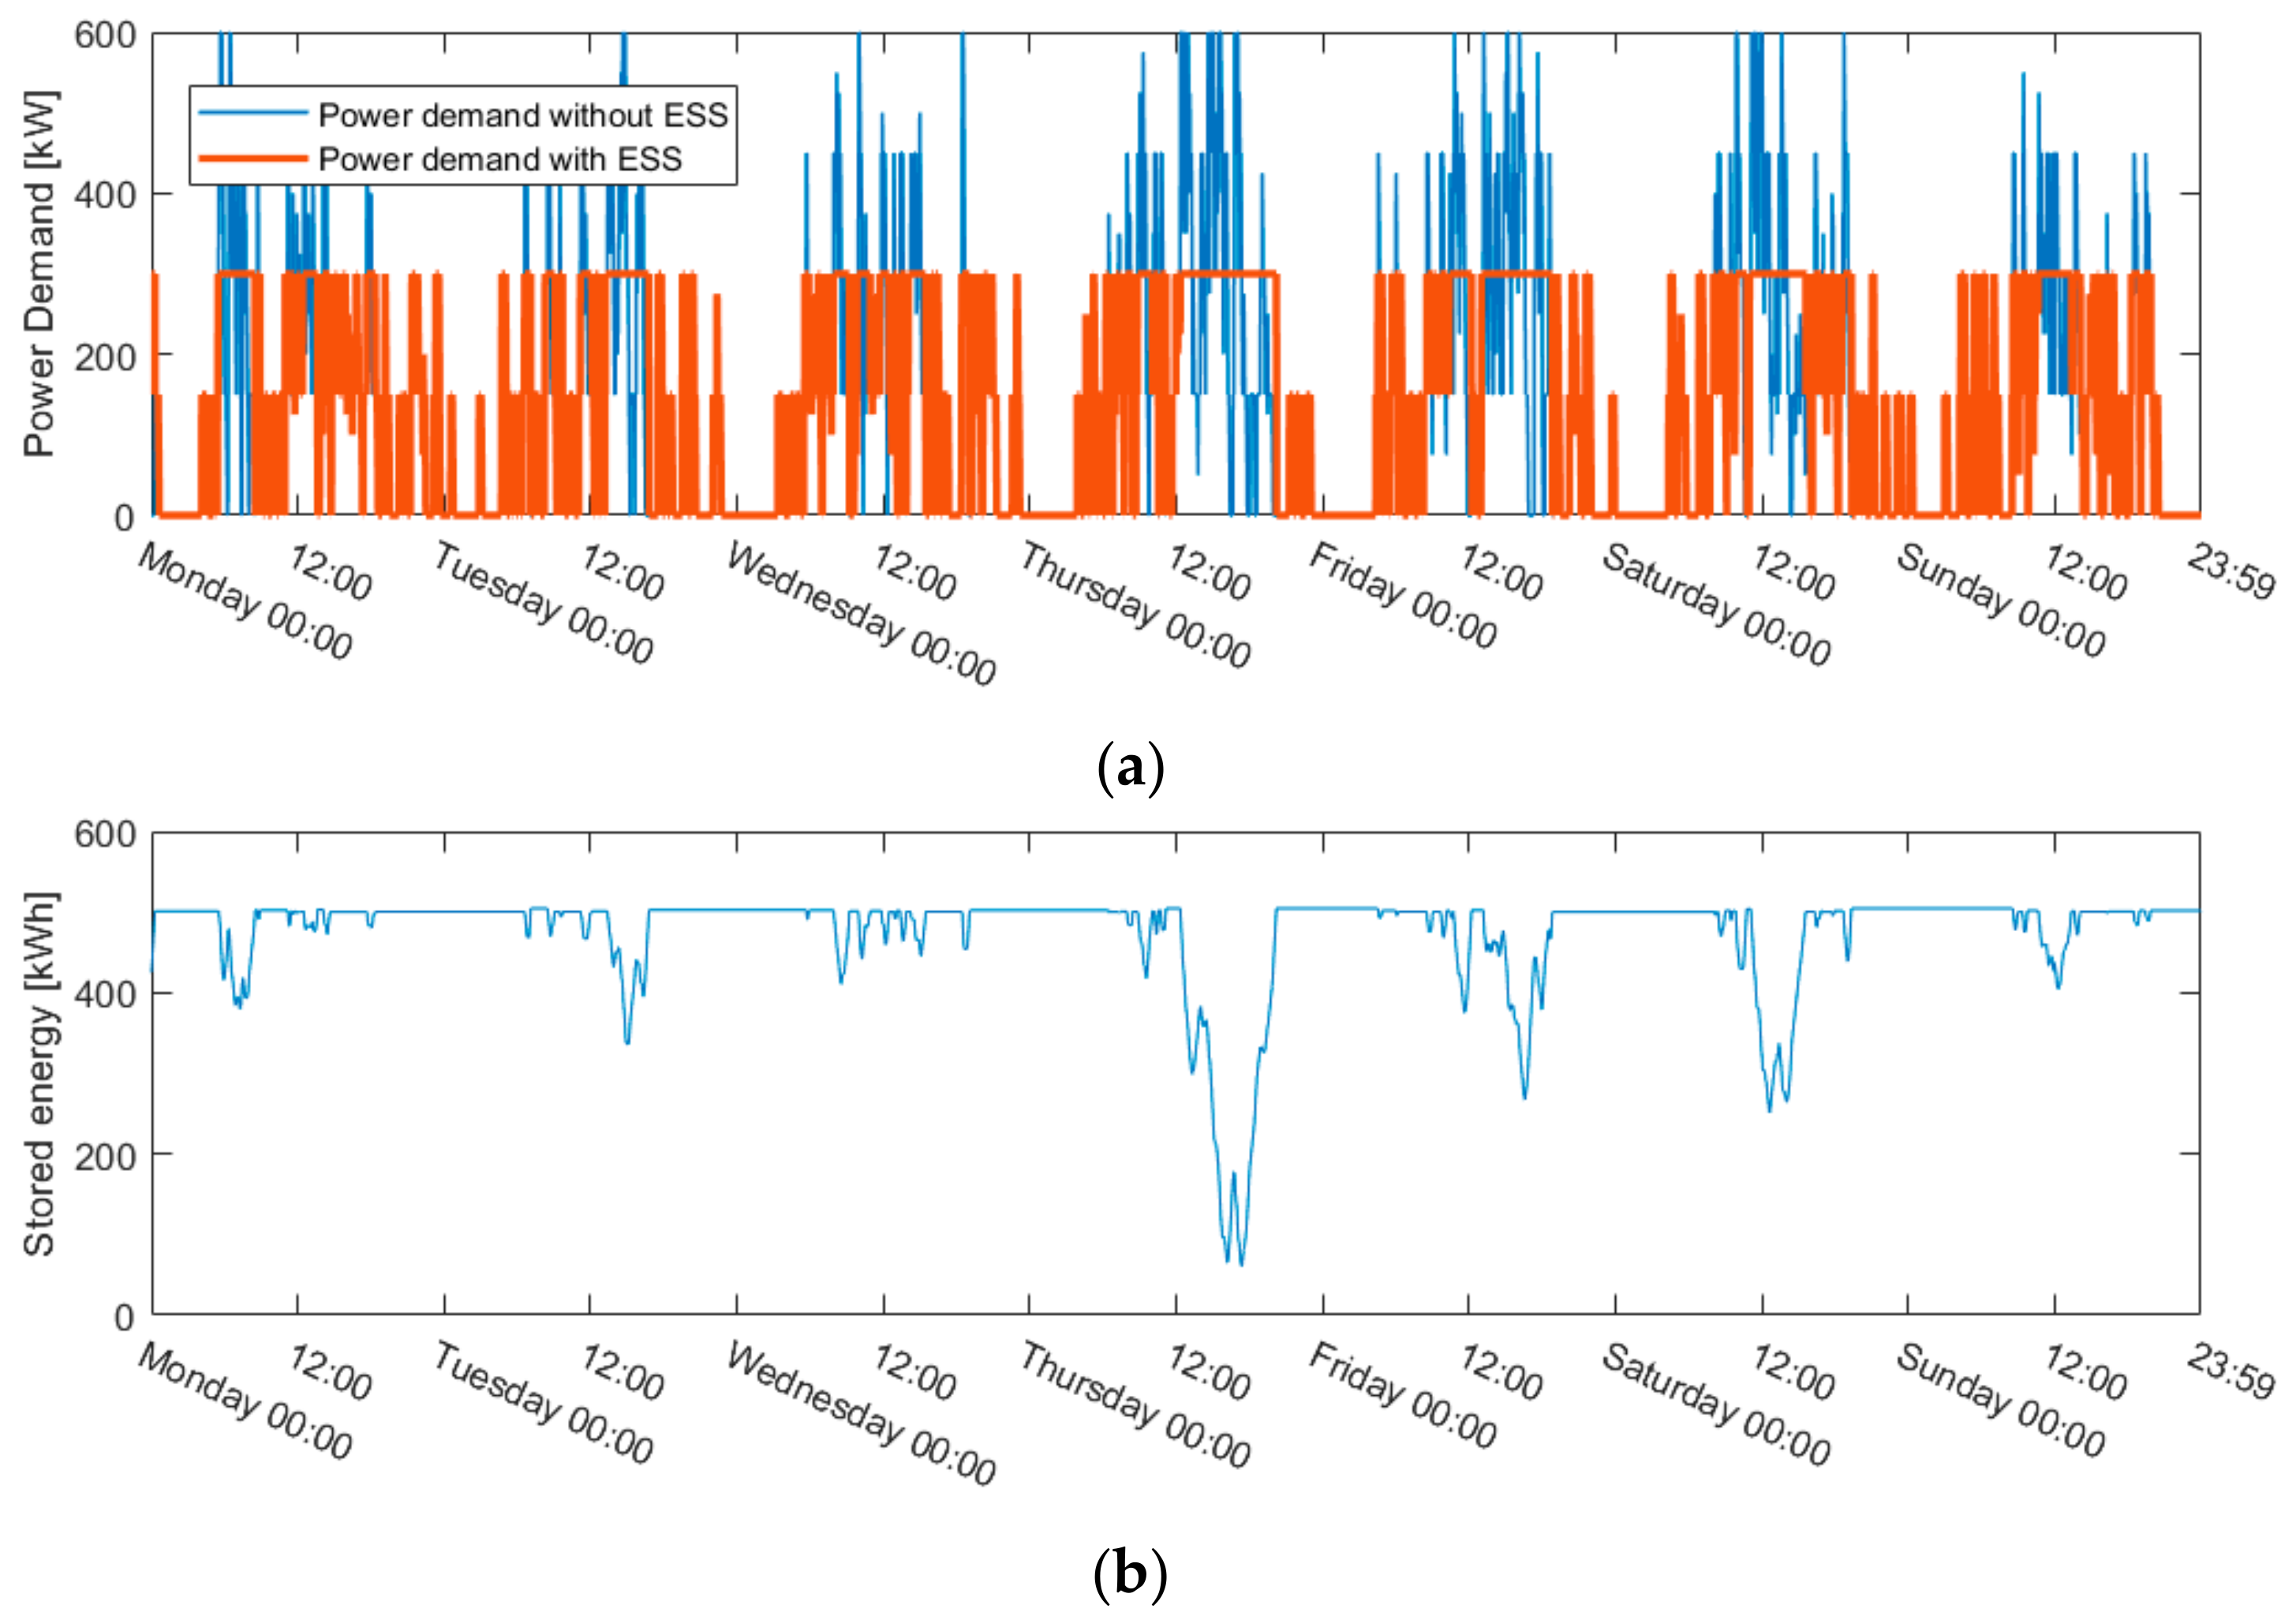
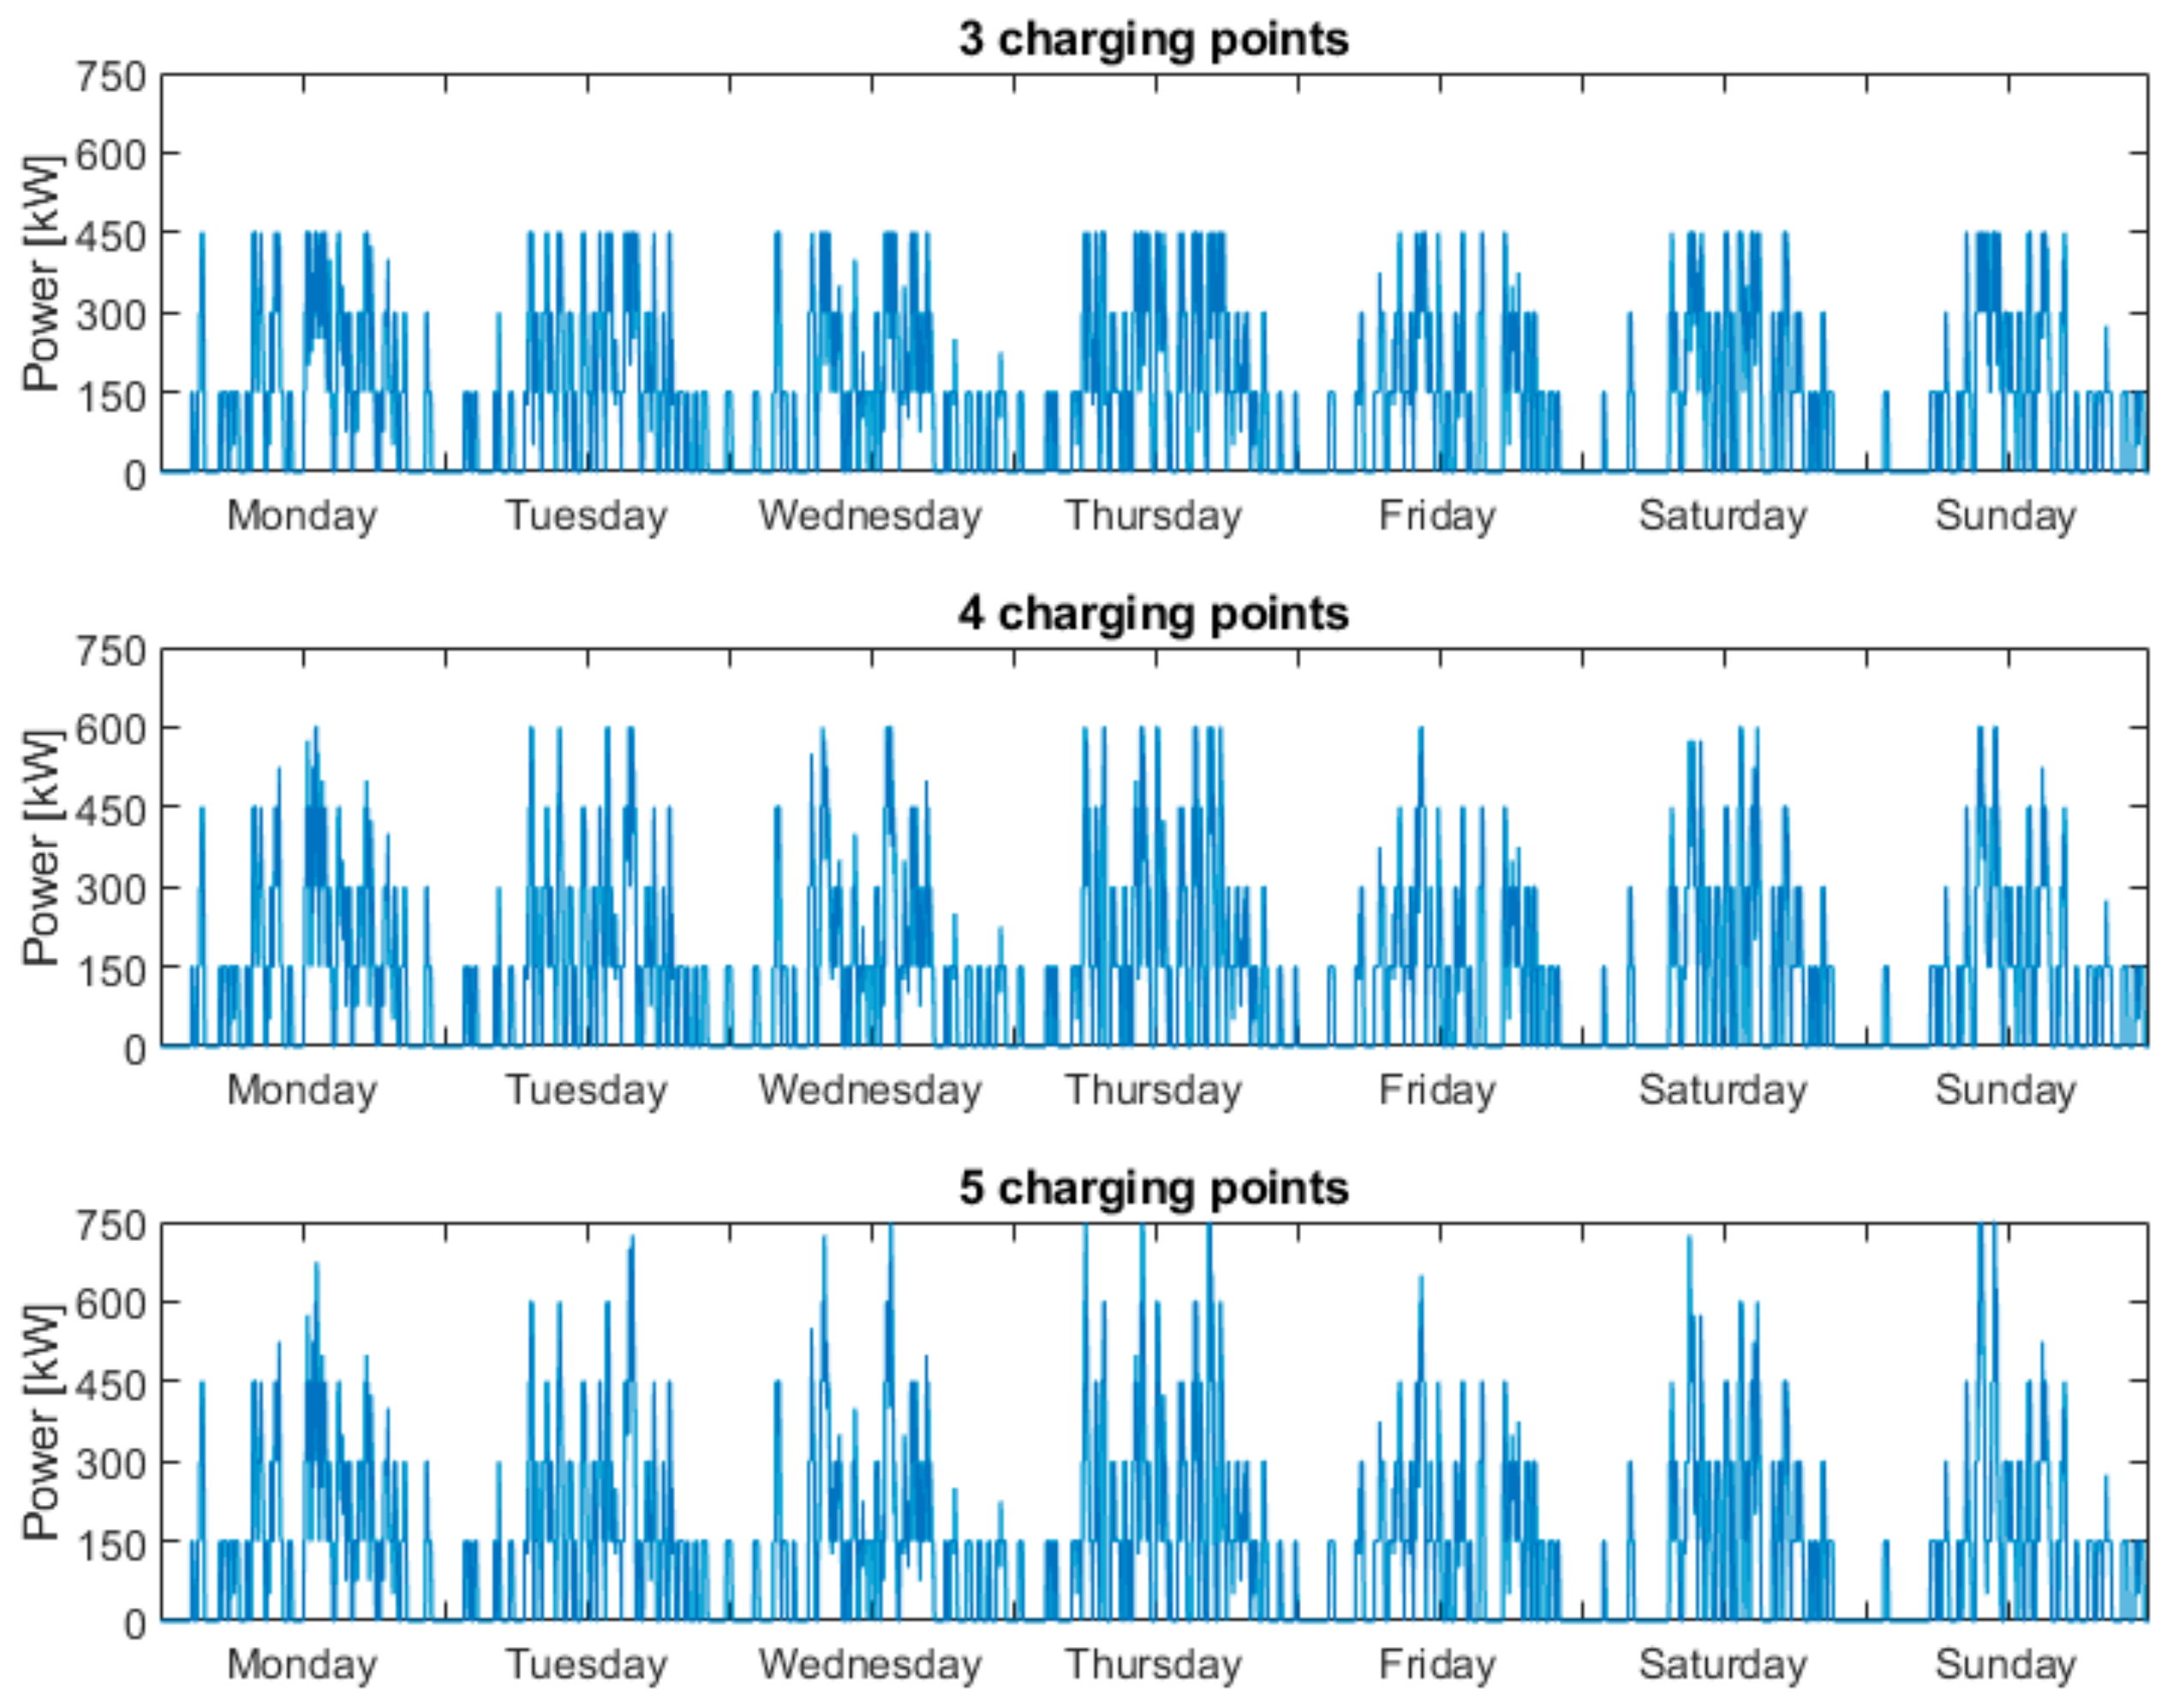
A typical mode of operation of the ESS during a week is represented in
Figure 4. We can note that the ESS undergoes only a limited number of full discharge cycles, which only occur during peak hours without idle periods to recharge the ESS.
3. Results and Discussion
The results from the stochastic approach and the battery sizing algorithm are successively presented to demonstrate the relevance of ESS integration for multi-stall charging station installation. We illustrate the application of this method for a case study representing an average Swiss charging station in a hypothetical 100% EV scenario.
3.1. Appropriate Number of Charging Points
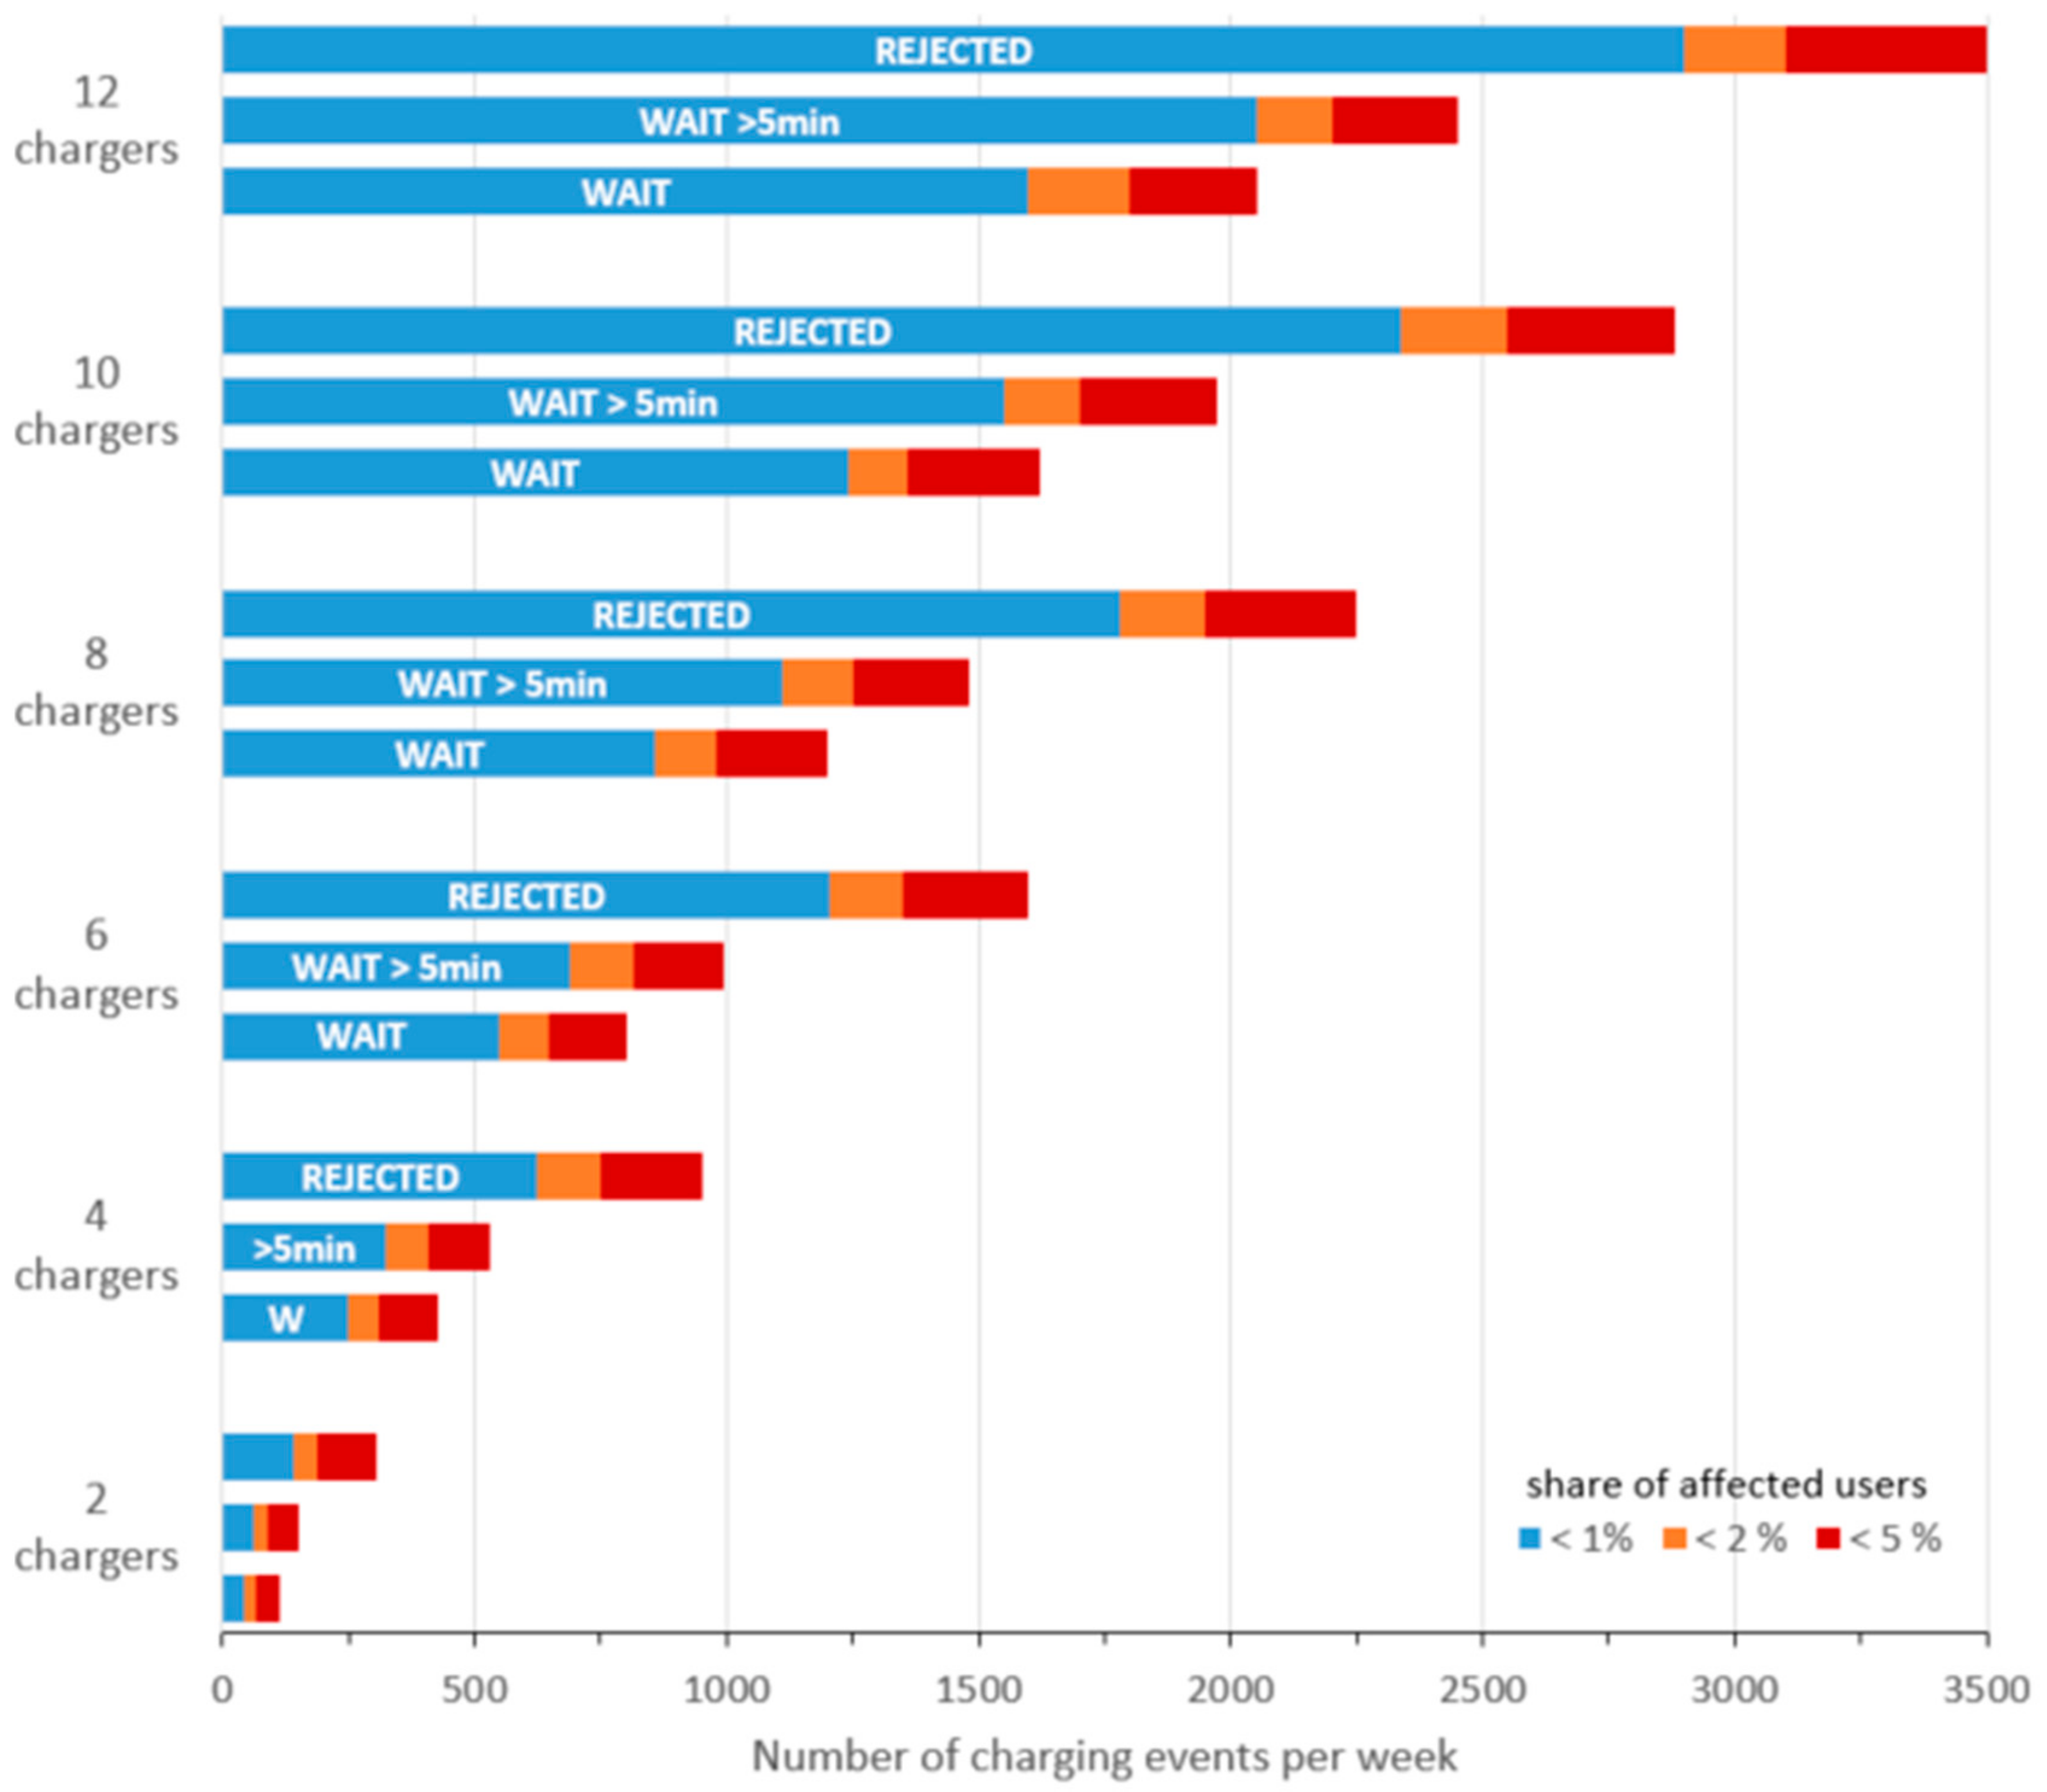
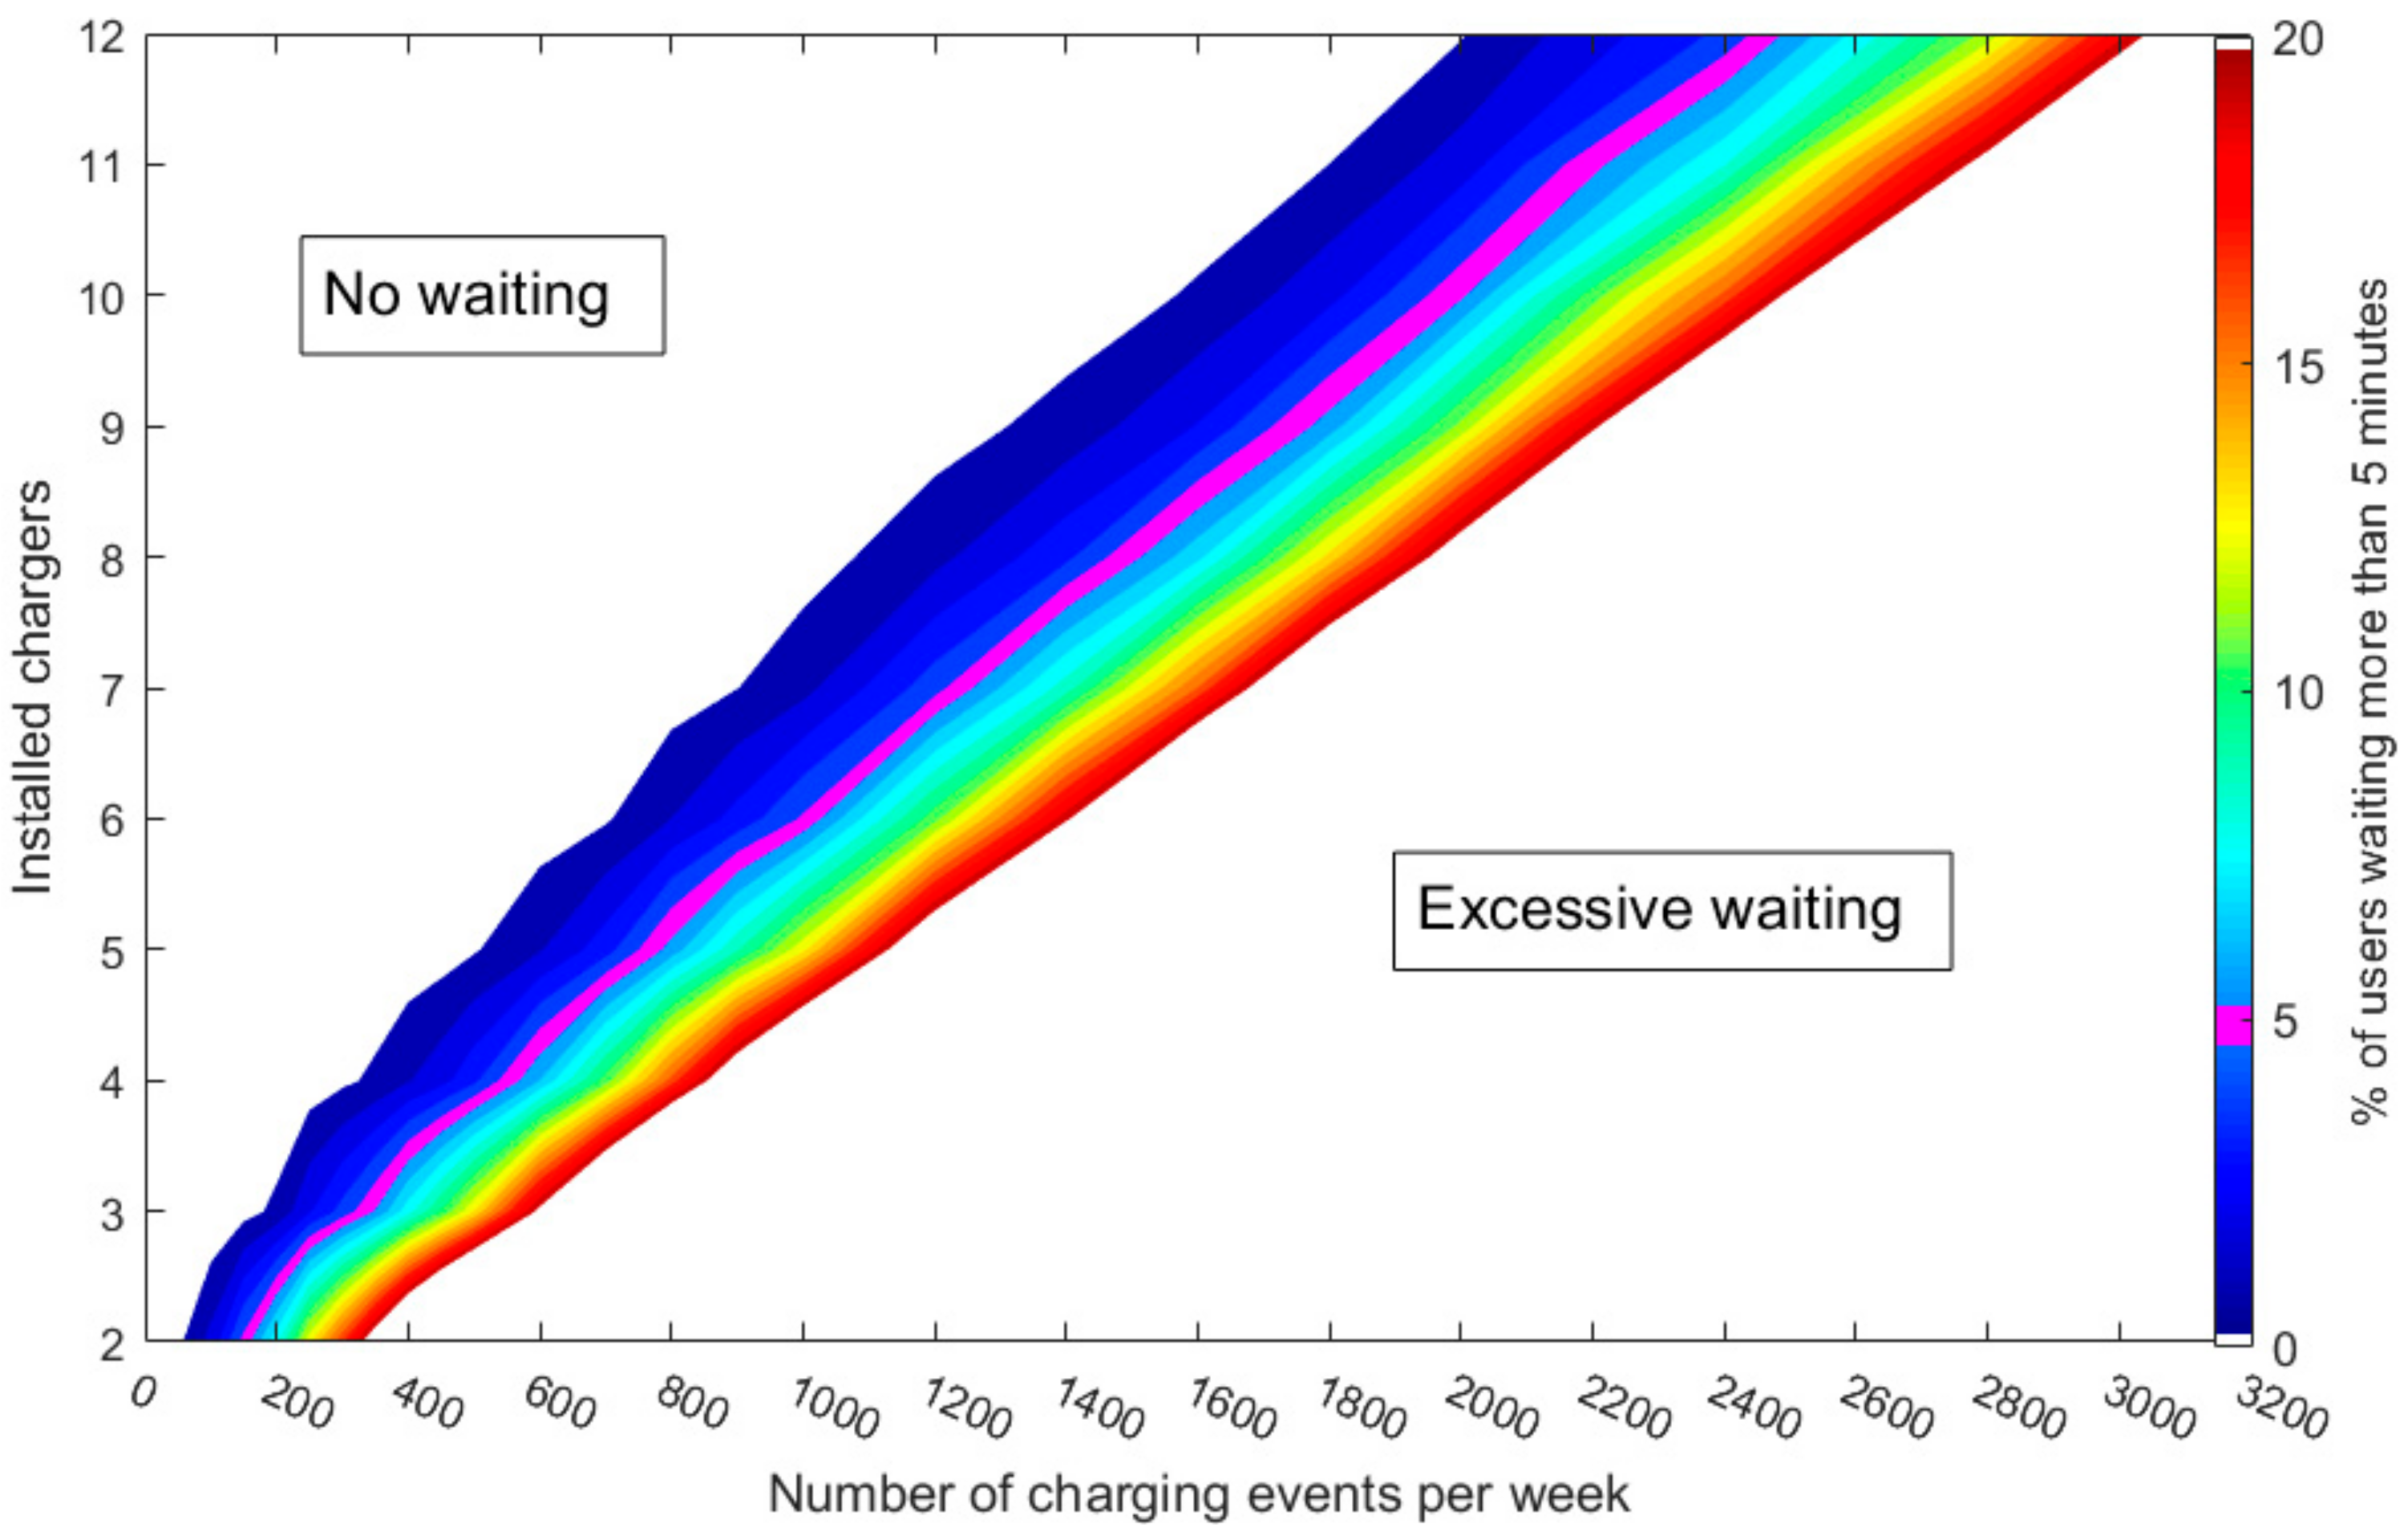
The stochastic distribution of charging events throughout the month results in some queuing. For 2 to 12 chargers and from 0 to 3500 charging events, the queuing events were accounted and are presented in
Figure 5. Within the blue region, less than 1% of the users are subject to the respective queuing experience: waiting, waiting more than 5 min, or being rejected. For example, 1000 charging events per week can be provided with only 4 charging points, but with more than 5% of charging events rejected (queuing for more than 15 min). Six charging points seems to be more appropriate, with 5% of the users waiting more than 5 min and less than 1% rejected. Finally, a higher level of service is offered with 8 charging points for 1000 charging events per week, with only 2% of users needing to wait.
With four-stall charging stations, Fastned™ expect to deliver 27 MWh per week, and with eight stalls, 55 MWh, corresponding respectively to 550 and 1100 EVs per week [
25], which is in line with the numbers presented here.
For the rest of the analysis, we considered a number of charging points sufficient to ensure that less than 5% of the charging events are delayed by more than 5 min. This corresponds to the region on the left of the pink line in
Figure 6. Above this limit, we can consider that the station is undersized, and too many users will be rejected.
3.2. ESS Sizing
The most challenging situation corresponds to a station used at full capacity, defined here as 5% of the users waiting more than 5 min. With vehicles queuing to get a charging spot, peak power consumption periods last longer, and, thus, more storage capacity is required. Taking the worst-case scenario for ESS sizing ensures that, as long as the station is used for its designed capacity, the proposed storage capacity will be sufficient.
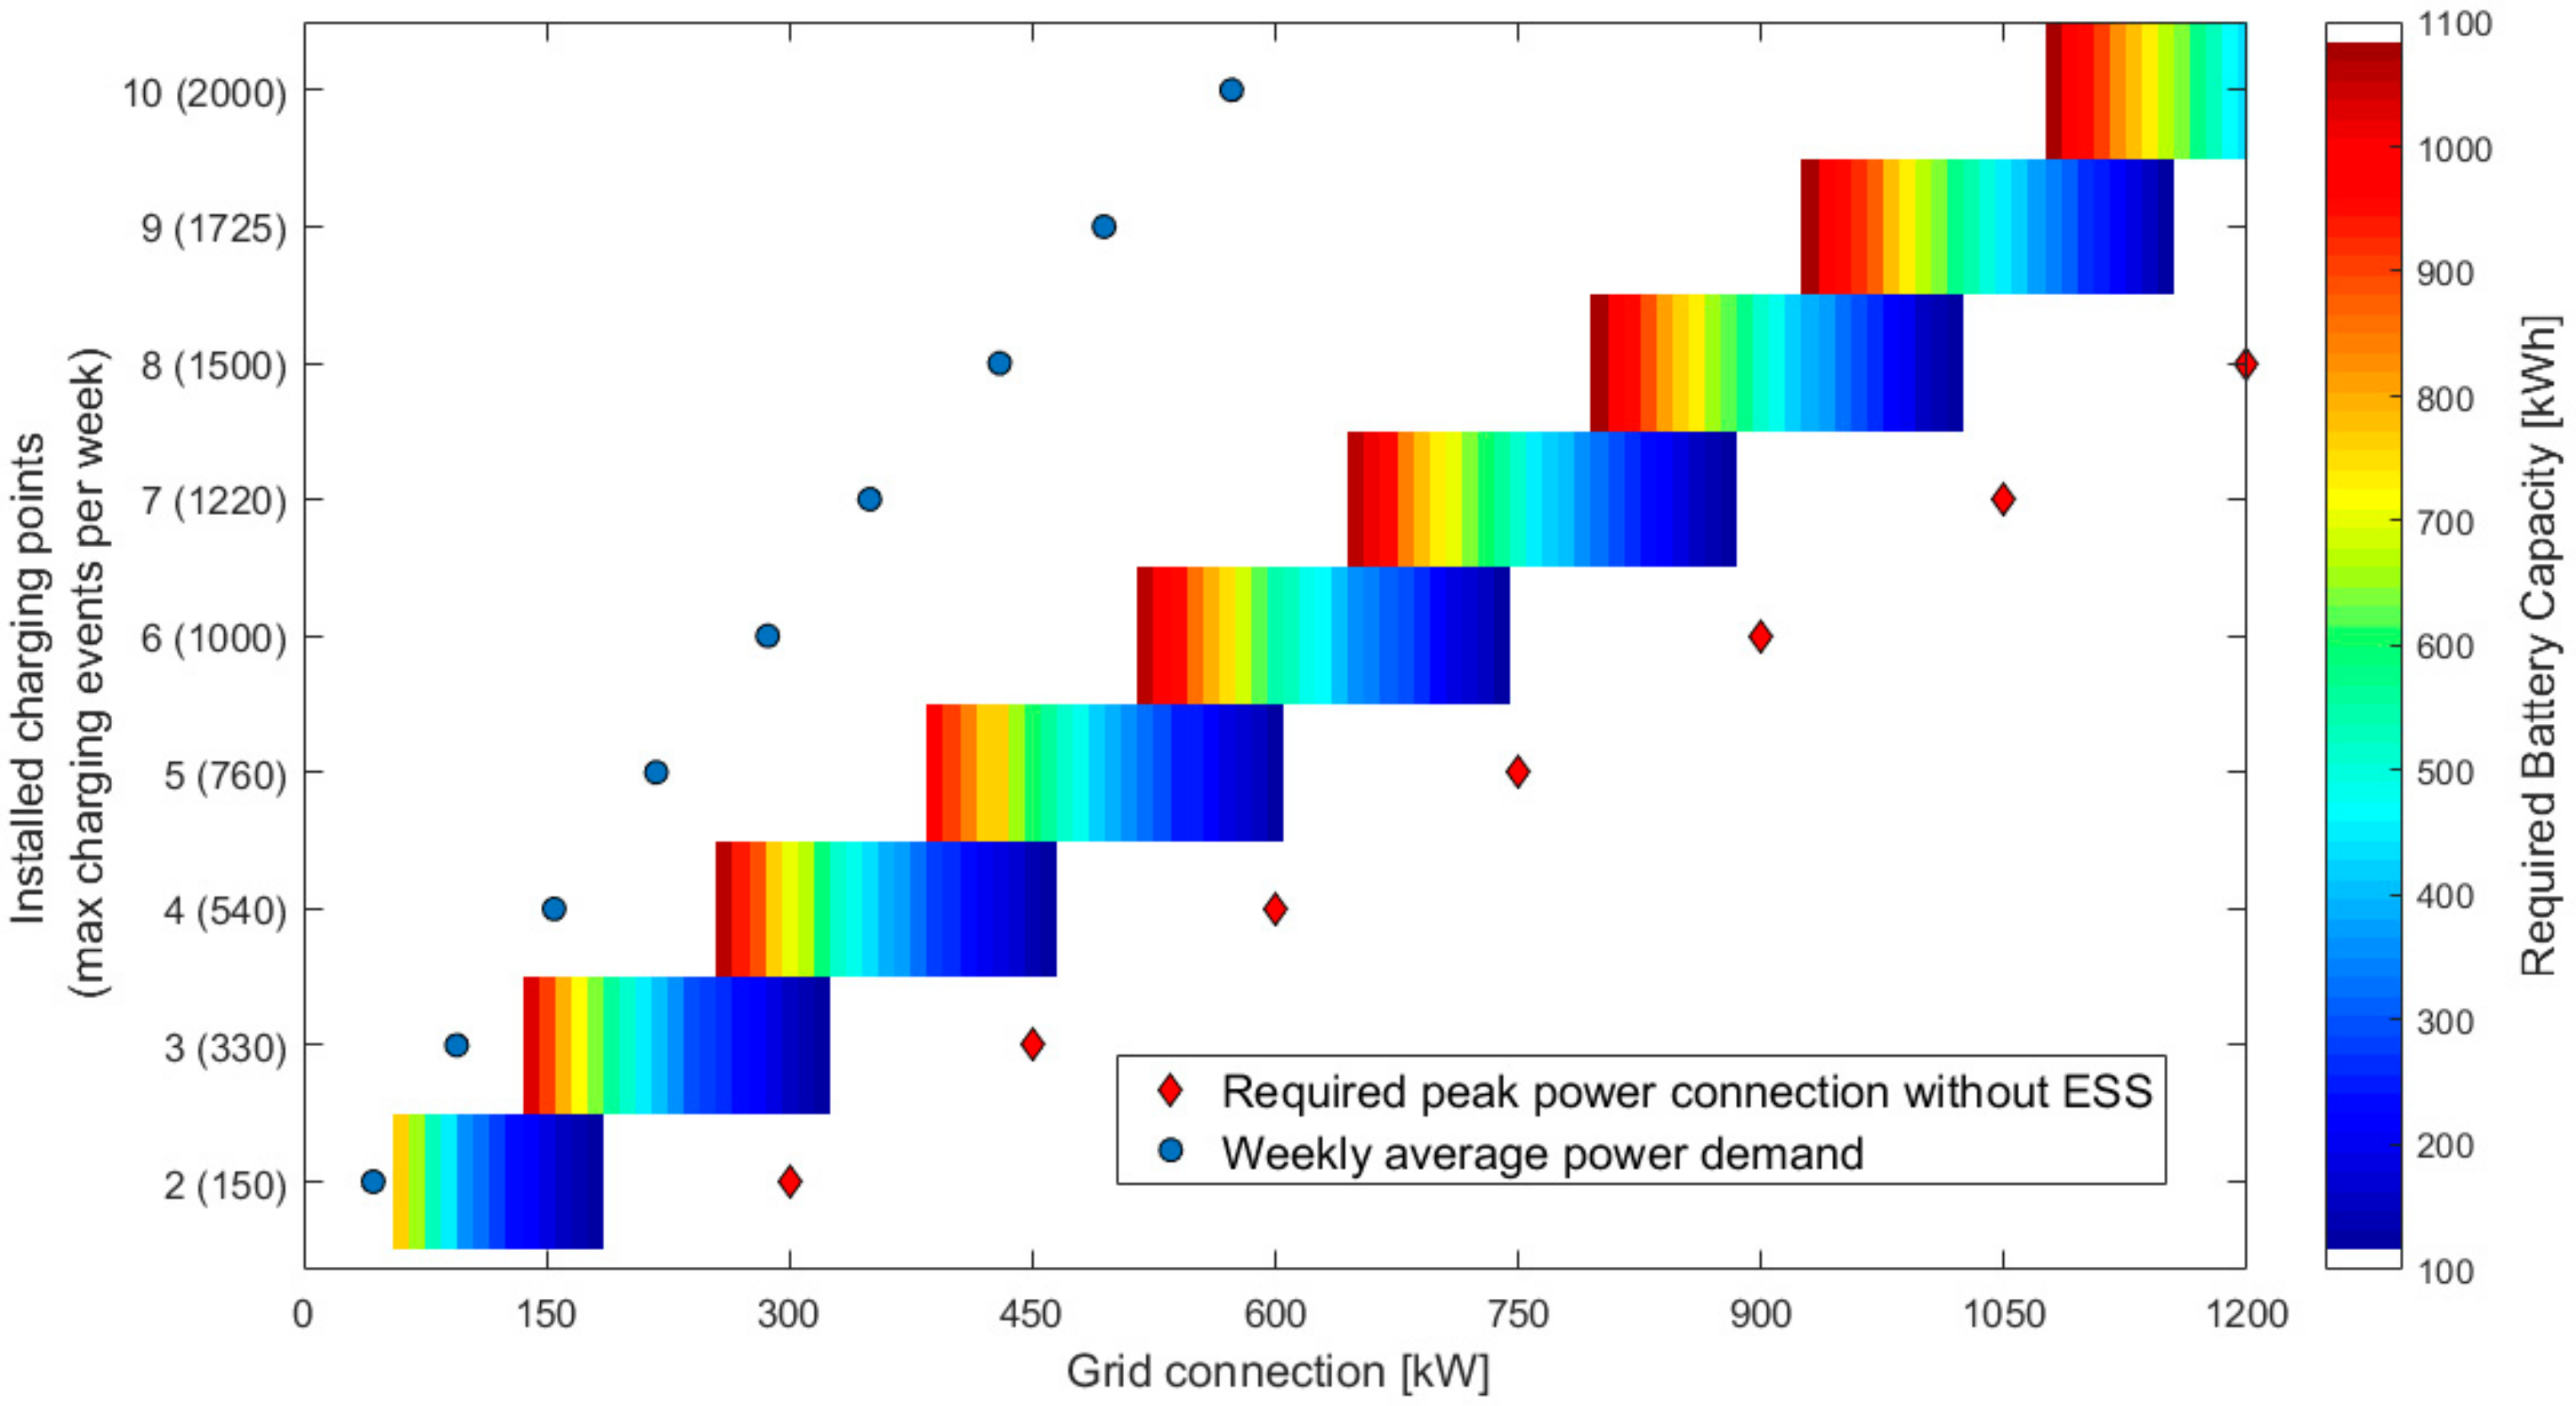
The results of the sizing algorithm are presented in
Figure 7. The red diamond markers represent the peak power demand when all charging points are occupied; it corresponds to the required grid tie when no ESS is installed to provide additional power. It appears that even the smallest ESS considered, 100 kWh, would bring significant savings in terms of required grid tie, with 100 to 200 kW reductions. This is a consequence of the very short duration of peak events, with all chargers occupied, as presented in
Figure 1. With a 550 kWh/300 kW ESS, a six-stall charging station can serve up to 1000 users per week with 33% reduction of the grid tie.
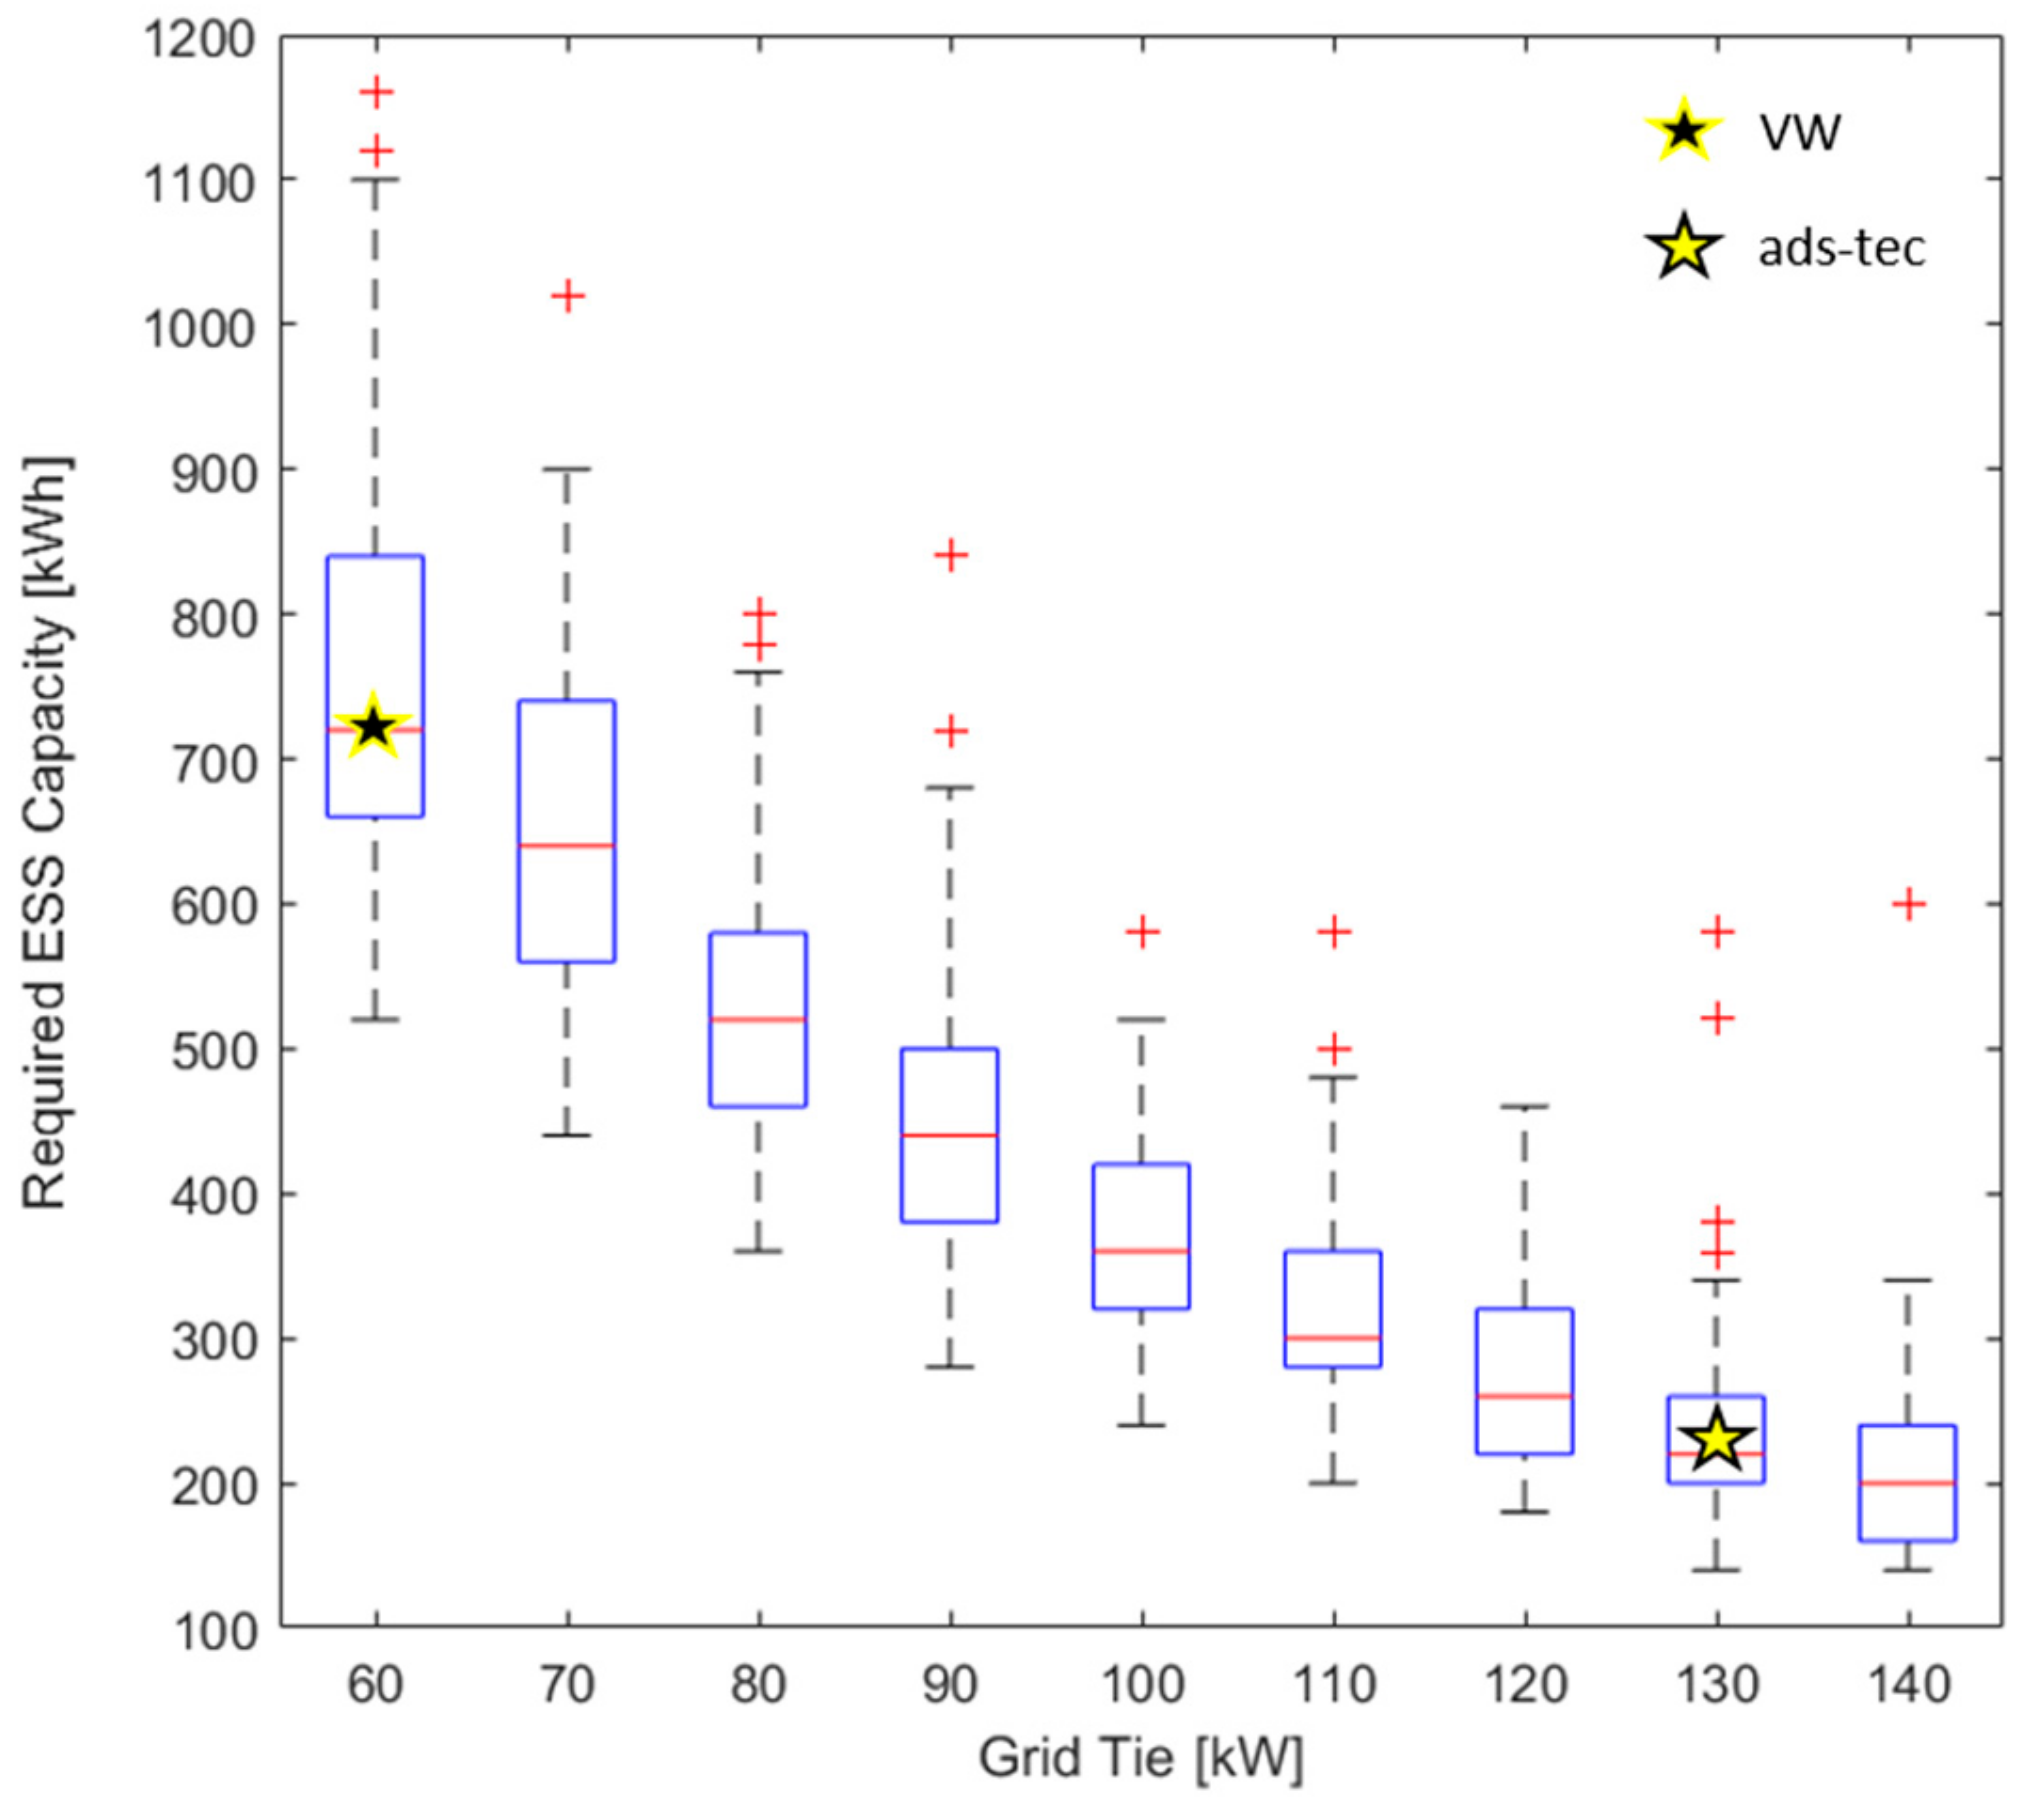
Interestingly, it appears that the solution with two modules from the company ads-tec™ (240 kWh/200 kW) [
16] is suitable for a two-stall charging station and a 130 kW grid connection. The 360 kWh system with a 30 kW grid connection proposed by VW™ [
17] largely covers the needs of a one-stall charging station with up to 22 charging events per week (6 kW average consumption). The present model indicates that 175 kWh would be sufficient. With two stalls, 150 charging events per week, and a 60 kW grid connection, our algorithm recommends a slightly bigger system, with 765 kWh on average instead of 720 kWh. However, the dispersion of the results over the 100 months simulated, presented in
Figure 8, indicates that, for a 60 kW grid tie, the median (red line) ESS capacity is 720 kWh. The 25th and 75th percentile are, respectively, 660 and 840 kWh, thus the VW™ modules seem also to be adequately sized.
3.3. Case Study
In western Switzerland, we have noted demand charges in the range of 4.4 to 15.5 CHF/kW/month, and, in addition to this monthly charge, the initial installation of the grid connection typically costs around 100 CHF/kW. Under these conditions, there is a clear incentive for CSOs to limit the installed grid tie.
We present here a grid tie reduction strategy for CSOs, assuming the frequentation of an average gas station in Switzerland, i.e., 450 charging events per week [
26].
The first decision concerns the number of charging points required to satisfy this charging demand. The queuing metrics are reported in
Table 2, including a +/− 10% variation in the number of charging events per week.
With more than 10% of the users waiting more than 5 min, it appears that a three-stall charging station will not offer a satisfying customer experience, and, in return, it may affect the probability distribution of charging events. Indeed, the 450 charging events per week largely exceeded the rated capacity of 330 charging events per week reported in
Figure 6. For four and five installed charging points, the queuing metrics are below our defined threshold of 5% of users waiting more than 5 min.
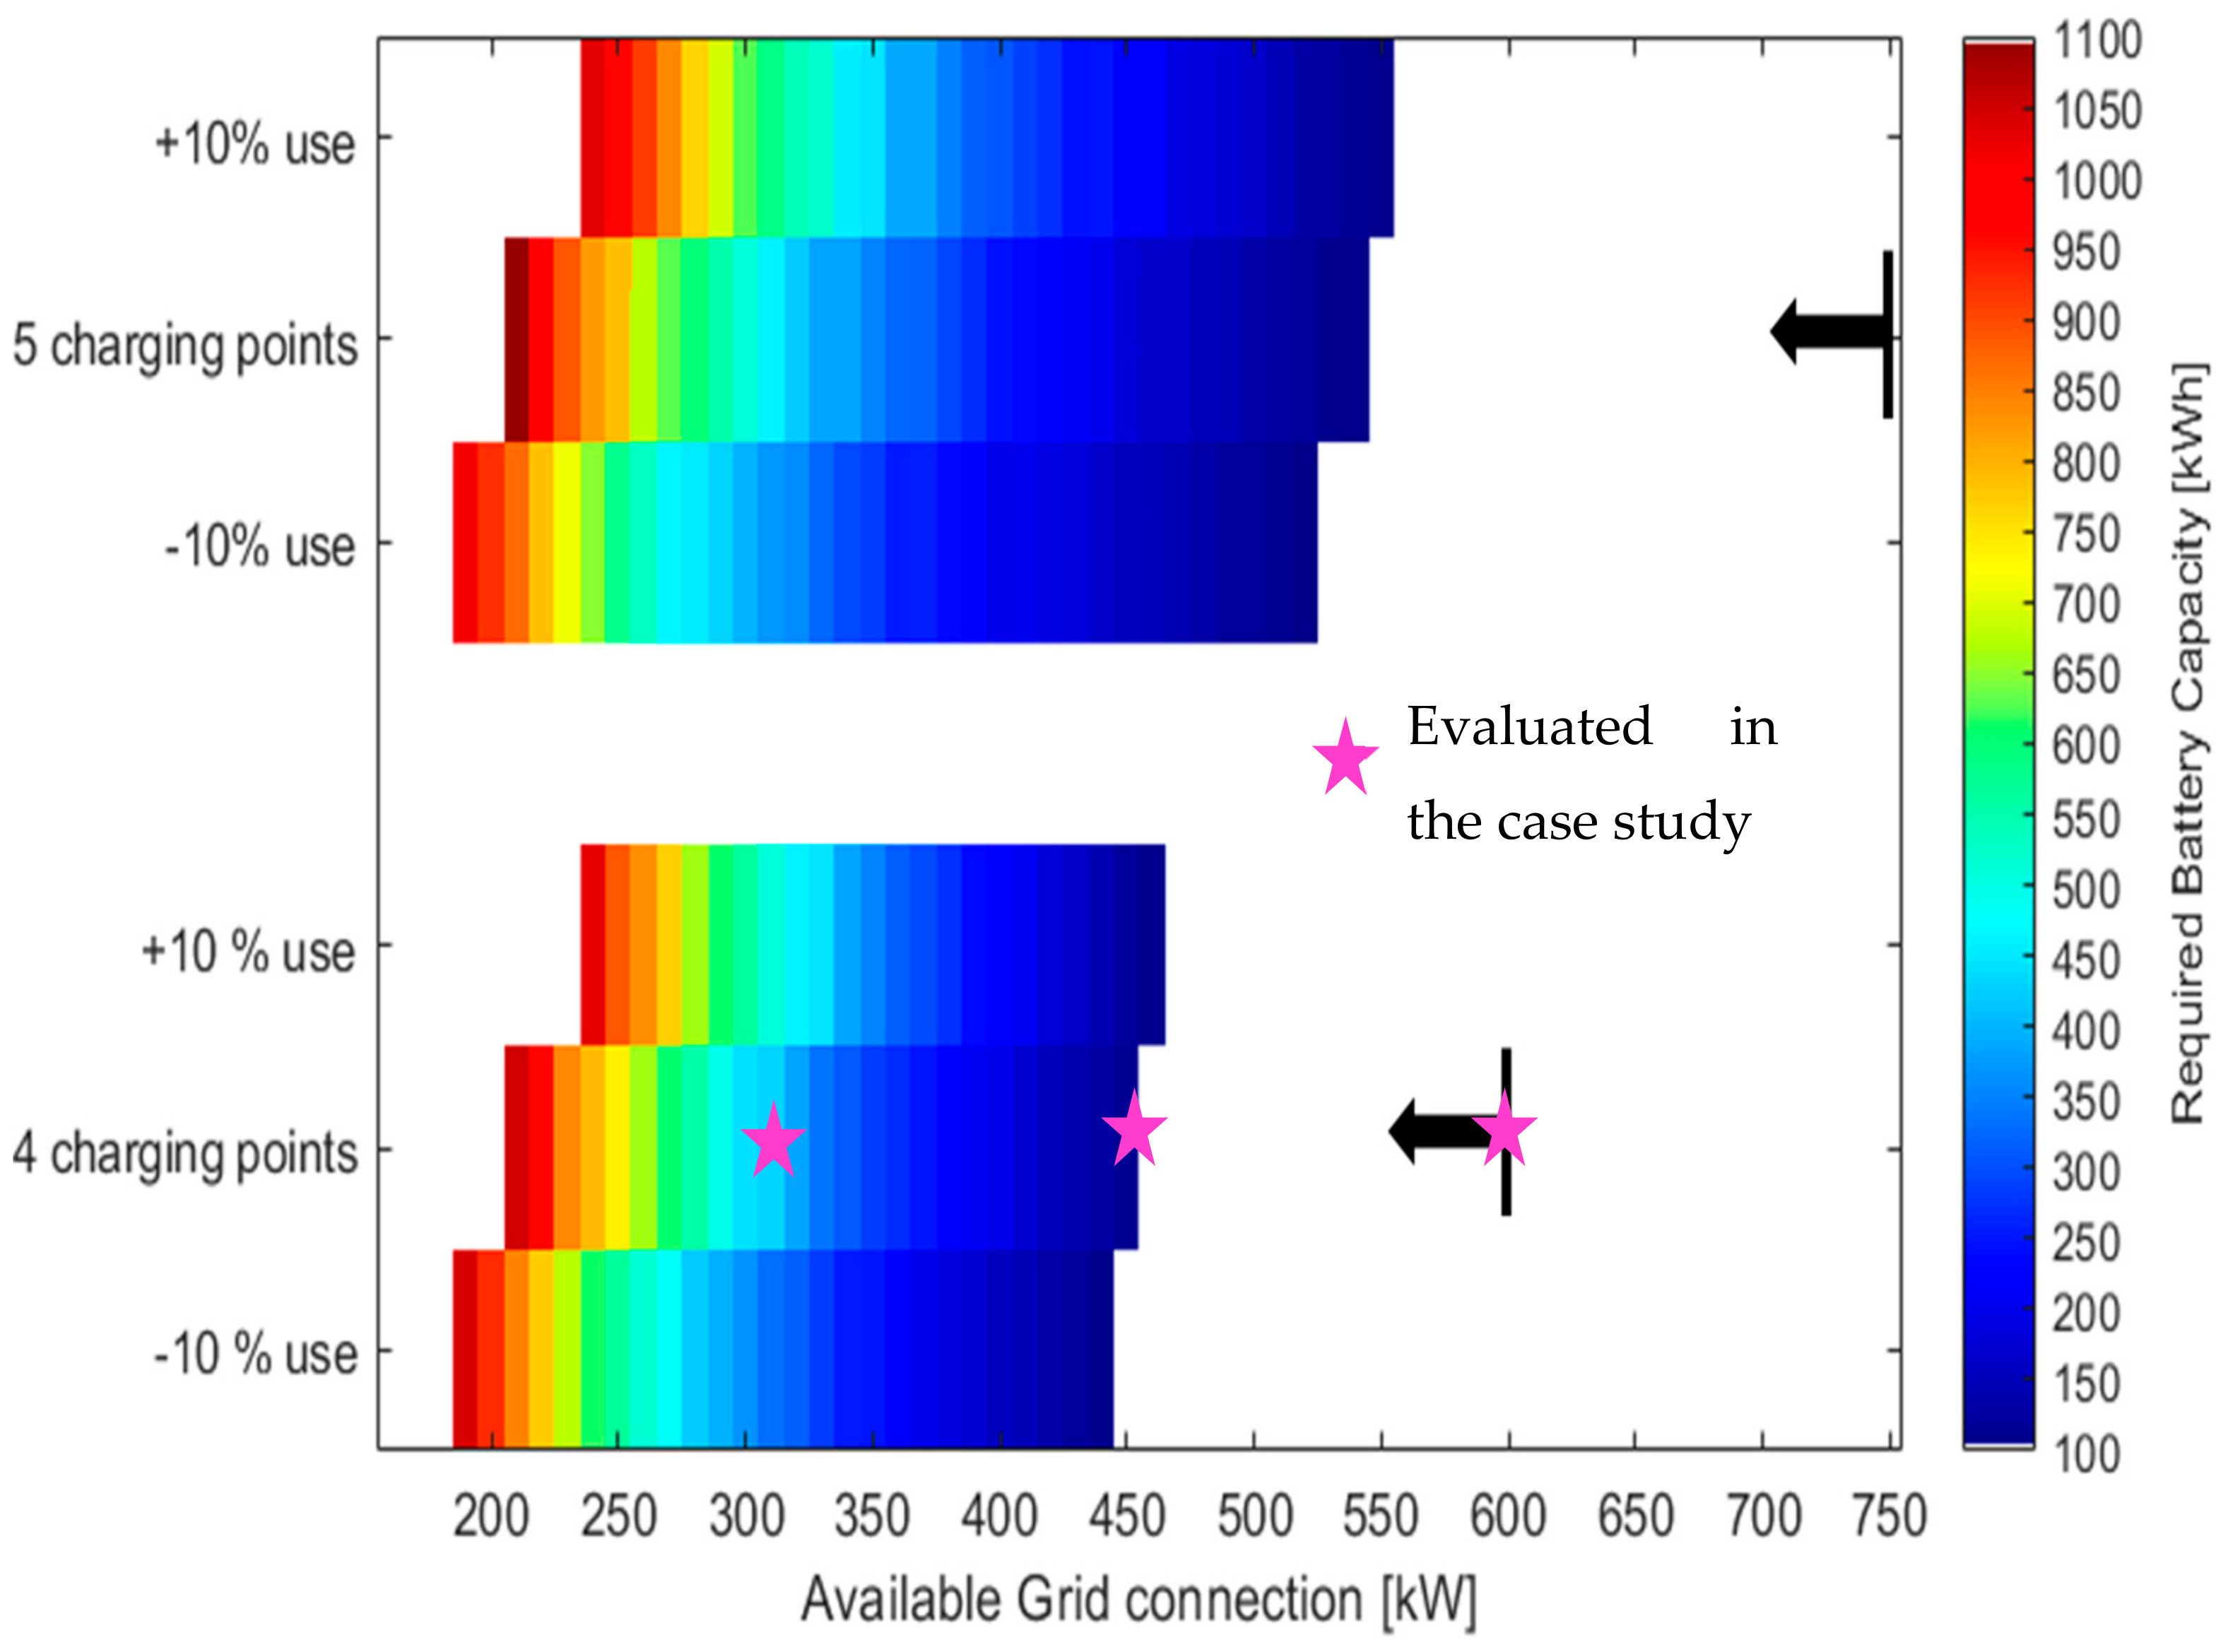
In
Figure 9, we can observe the concentration of charging events when a constraint on the available charging points is introduced. With three installed charging points, the station is fully occupied for 1118 min per week (12% of the time). With four and five charging points, the station requests the full power for, respectively, 278 min and 65 min.
Installing four charging points instead of five can already reduce the required grid connection from 750 kW to 600 kW, and thus 15 kCHF can already be saved in initial grid connection fees, and 660–2325 CHF per month in demand charges. In order to further reduce the required grid tie, without affecting queuing time, such as with the three-stall station, an ESS can be installed. The ESS sizing algorithm presented in
Figure 3 was used for 450 charging events per week and four and five charging points. The results are presented in
Figure 10.
Compared to
Figure 7,
Figure 10 indicates smaller battery capacities and lower achievable grid connections. Indeed,
Figure 7 was designed for stations used at full capacity (i.e., 5% of users waiting more than 5 min), while we consider here 450 charging events per week in both cases. With a rated capacity of 540 and 760 charging events for, respectively, four and five charging points, there are thus fewer events where the ESS needs to be used. It highlights that stations used under their nominal capacities have larger demand charge reduction potential and require smaller ESS.
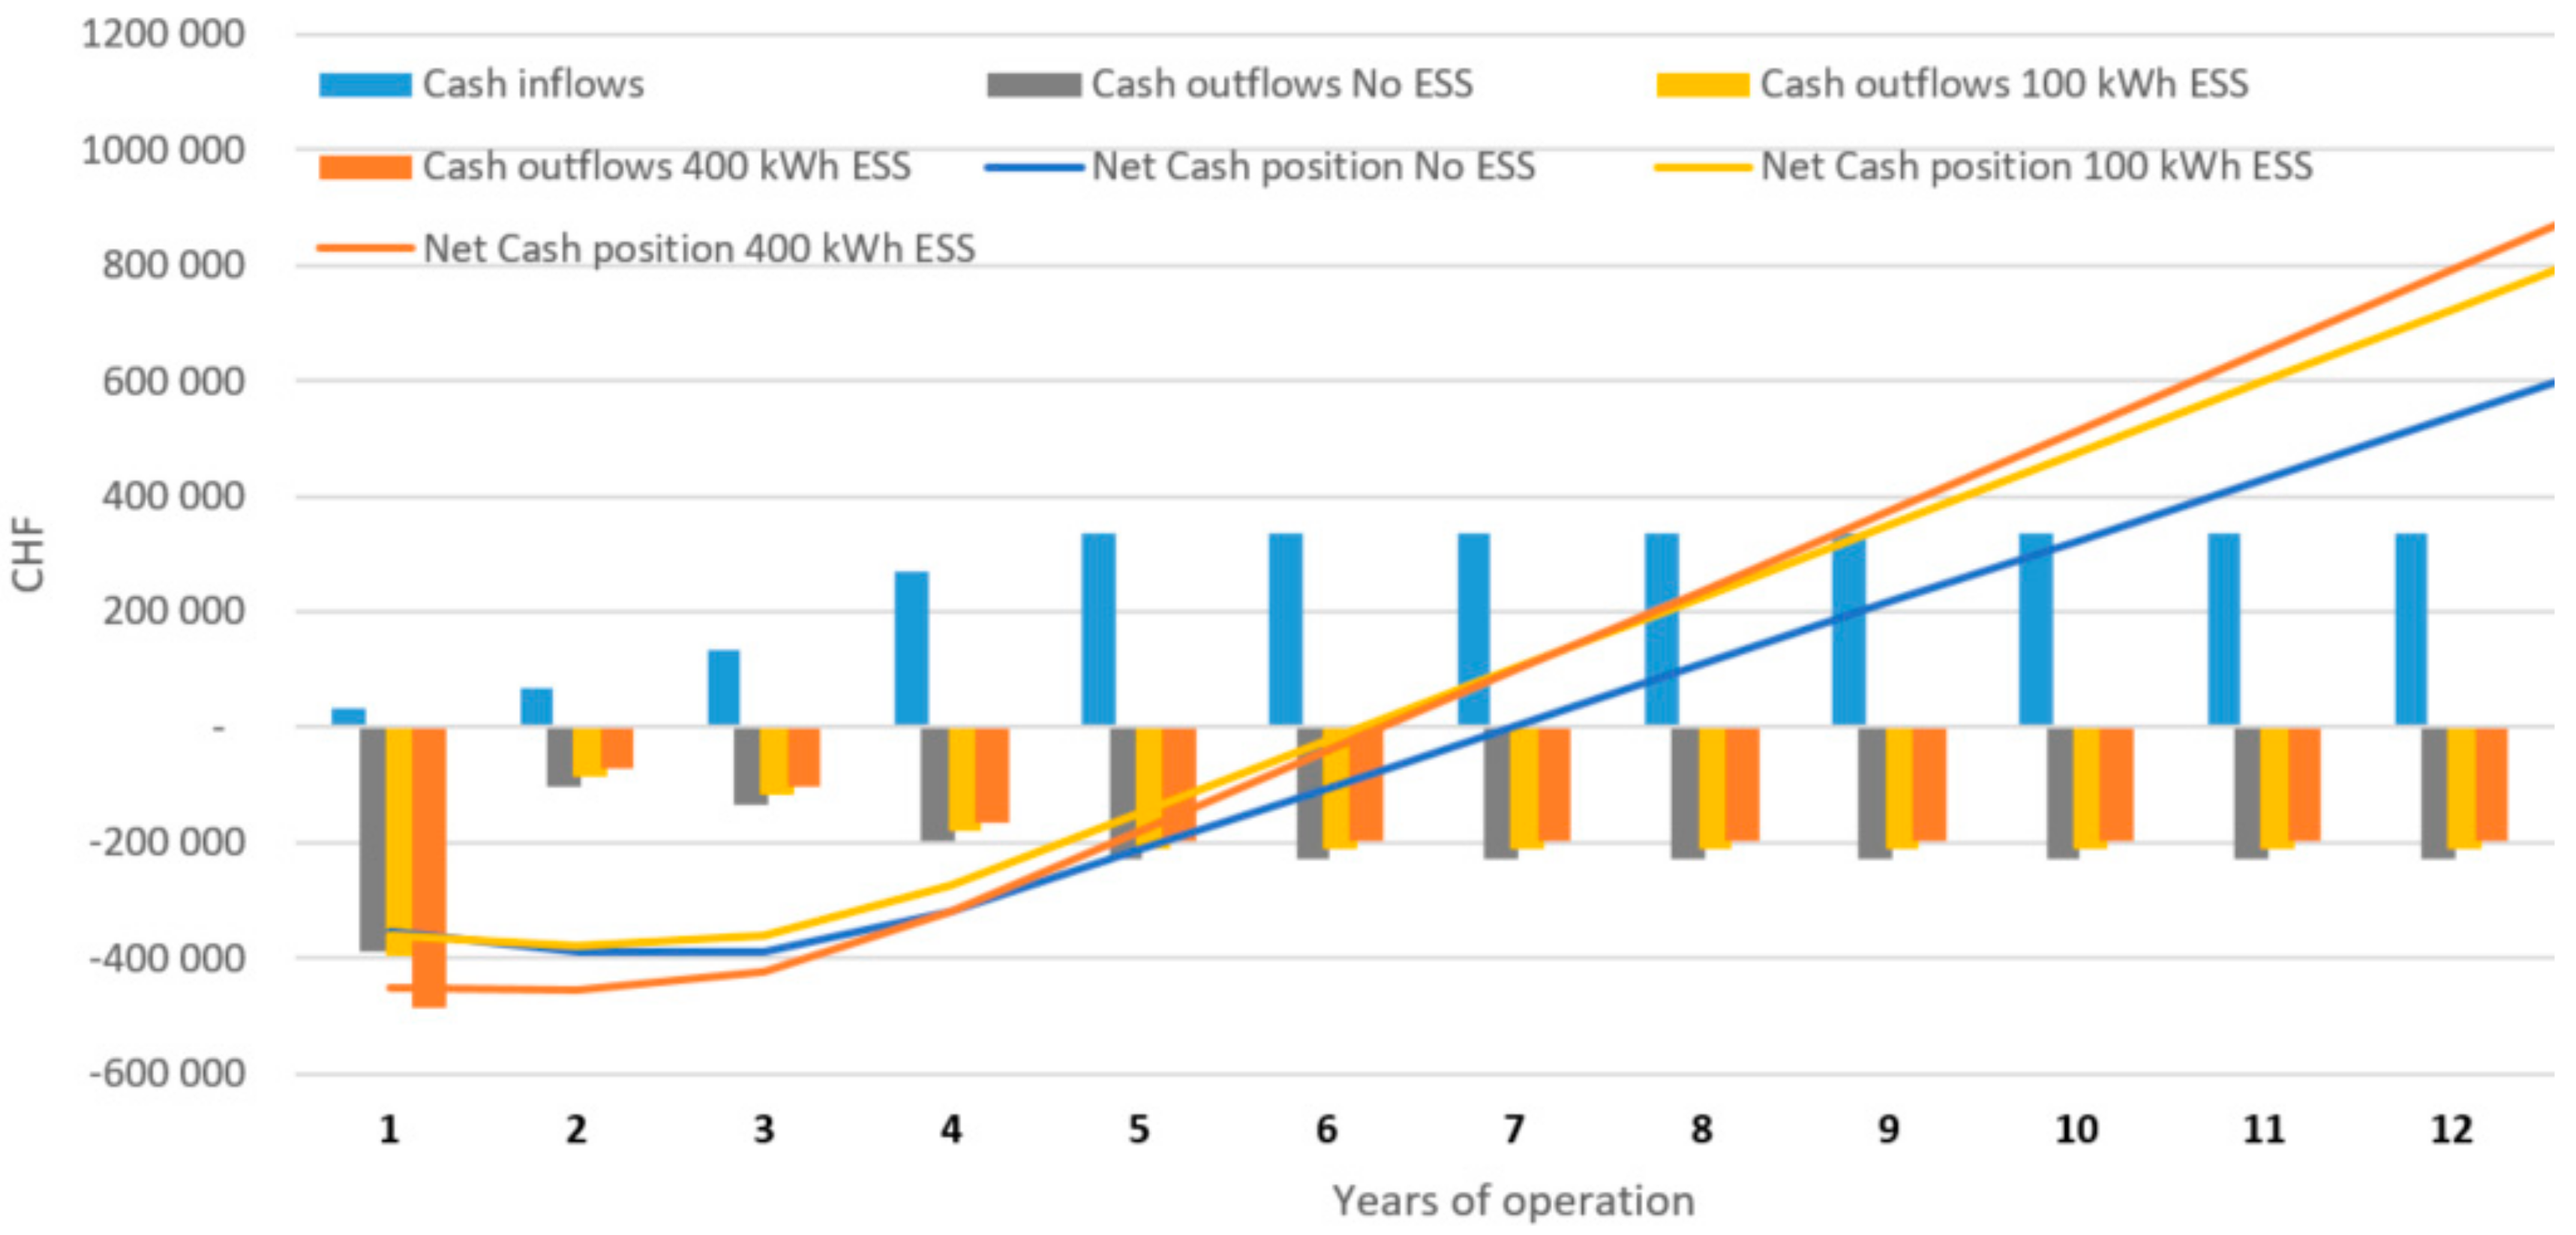
Three cases were retained for an economic evaluation of a CSO’s business case. The reference case is a direct connection between the grid and the chargers, with 600 kW thus required for four charging points. This reference was compared with a station with a 100 kWh ESS/450 kW grid connection and a 400 kWh ESS/320 kW grid connection.
Based on the economic parameters presented in
Table 3, we evaluated the expected income statement of a CSO. We assumed that the station reached its nominal throughput of 450 charging events per week after five years of operation.
In
Figure 11, we observe that, despite a larger initial investment, the 100 kWh and the 400 kWh cases are both beneficial due to the cumulative savings in demand charge. In both cases, the energy losses in the ESS represent only 0.3% and 1.1% of the total energy consumed at the station, because power is requested from the ESS only during peak periods. Without ESS, the demand charge represents 32% of the electricity expenses for the CSO compared to 26% with a 100 kWh ESS and 19% with a 400 kWh ESS.
ESS in fast charging stations are subject to less than one full cycle per day, thus, with a reported cycle life above 2000 full cycles [
27], an ESS can be easily operated for 8 to 10 years. Considering actual energy installation costs below
$400/kWh for a large variety of technologies [
27], the payback period for the ESS can happen in less than two years. Battery degradation and thermal modeling were studied by Richard and Petit [
11]. They concluded that degradation costs can be largely covered by grid services during the night. Efficiency losses will affect marginally affect electricity expenses, considering the 0.3 and 1.1% losses mentioned earlier.
4. Conclusions
This study provides a tangible method to reduce the required grid tie for multi-stall EV charging stations. The first stage, using a versatile stochastic approach, recommends a number of charging points as a function of the expected capacity.
In a second stage, an ESS is introduced to further reduce the grid tie and associated demand charge. A sizing algorithm, simulating 100 months, shows, for all cases between 150 and 2000 charging events per week, that a 500 kWh ESS can further reduce the grid tie by 200 to 300 kW. Substantial savings are already obtained with 100 kWh ESS, with 100–150 kW reductions.
Finally, the method was applied on a specific case study with 450 charging events per week. It demonstrated that stations used under their nominal capacity present even larger power savings potential. An appropriately sized ESS can help to improve the profitability of CSOs, especially in early EV deployments, ensuring that the nominal power remains available for customers while the monthly demand charge is lowered for the CSO. In addition, new locations become eligible to install fast charging stations, relaxing the existing constraints regarding the grid connection.
We presented here a consistent methodology to assess the relevance of ESS implementation along three parameters: the number of charging points, the available grid connection, and the ESS capacity.
While the electrification of the transport sector has initially targeted passenger vehicles, electric versions of lorries and trucks are becoming available. With different distribution patterns for charging events and higher charging power, the methodology described in this study can be used to equip motorways with the expected 500 kW [
28] charging points, and to limit demand charge for 3 to 6 MW peak installations [
29].
The stochastic approach can easily be adapted to other probability distributions, including extreme charging demand periods and various charging modes. Future work could also introduce a constraint on the grid power supply regarding the availability of renewables, and discuss examples such as the 1.5 MWh battery installed to charge EVs in Utrecht, Netherland [
30], or the charging test site from ElaadNL with a 138 kWh ESS coupled with vehicle-to-grid capabilities [
31]. The aggregation of grid services in low utilization periods would be also relevant for future research [
11]. In combination with EV deployments scenarios, electricity grid reinforcement alternatives and local ESS installation can be compared for countrywide transition strategies towards electric mobility.


