Abstract
Detecting and determining which systems or subsystems of a wind turbine have more failures is essential to improve their design, which will reduce the costs of generating wind power. Two of the most critical failures, the generator and gearbox, are analyzed and characterized with four metrics. This failure analysis usually begins with the identification of the turbine’s condition, a process normally performed by an expert examining the wind turbine’s service history. This is a time-consuming task, as a human expert has to examine each service entry. To automate this process, a new methodology is presented here, which is based on a set of steps to preprocess and decompose the service history to find relevant words and sentences that discriminate an unhealthy wind turbine period from a healthy one. This is achieved by means of two classifiers fed with the matrix of terms from the decomposed document of the training wind turbines. The classifiers can extract essential words and determine the conditions of new turbines of unknown status using the text from the service history, emulating what a human expert manually does when labelling the training set. Experimental results are promising, with accuracy and F-score above 90% in some cases. Condition monitoring system can be improved and automated using this system, which helps the expert in the tedious task of identifying the relevant words from the turbine service history. In addition, the system can be retrained when new knowledge becomes available and may therefore always be as accurate as a human expert. With this new tool, the expert can focus on identifying which systems or subsystems can be redesigned to increase the efficiency of wind turbines.
1. Introduction
Nowadays, the fastest growing renewable source of energy in the world is wind energy [1]. This technology makes an important contribution to meeting the ambitious climate and energy objectives for 2020 established by the European Commission [2]. One of the requirements is to ensure that at least 20% of electricity production is from renewable energy sources [3]. Although nowadays wind energy technology is already contributing to solving serious environmental problems such as climate change, it is anticipated that this role will be accentuated in the following years. It is calculated that the operation and maintenance costs of wind farms represent a range between 10–35% of total generation costs [4]; therefore this is one of the major issues concerning wind energy performance and exploitation. Being able to reduce these costs would have a direct impact in the increment of wind farm competitiveness, accelerating the transition from fossil fuels to other type of sources, cleaner and more sustainable [5]. The wind sector has an annual profit shortfall due to the malfunctioning of wind turbines. The amount of lost profits is estimated at less than one billion euros in Europe, and more than double for the rest of the world. In addition, if operating costs are added to the calculation, the loss can increased by a factor of three. Therefore, operation and maintenance (O&M) improvement tasks are crucial for all the actors involved, taking into account the current economic situation of the sector, without generation bonuses and also with the sales price policy of generation restricted by the new regulations (see [6,7]).
A major task of the operation and maintenance process is to ascertain the possible causes of a failure leading to the stopping of production of the wind turbine. This is a key step in reducing inactivity of wind turbines or in identifying critical failures as soon as they appear. Therefore, the set of methodologies and tools that assist this procedures can be very beneficial for wind farm proprietors, not only for the sake of increasing energy production and availability, but also in terms of reducing costs.
The first operation and maintenance processes were corrective, which means that after the turbines failed and faults were detected, maintenance was undertaken. This is a costly approach due to lack of planification. Conversely, preventive maintenance attempts to repair or replace components before they break down, but this is costly because maintenance tasks are performed more often. A good trade-off between the two strategies mentioned above is what we call condition-based maintenance (CBM), which relies on ongoing surveillance and detection of emerging faults and determining the necessary maintenance tasks before a fault occurs [8]. This is accomplished using condition monitoring systems (CMS), which entail the acquisition of data from sensors, its preprocessing, the posterior evaluation and finally the interpretation of the result. This is performed by means of ‘the supervisory control and data acquisition data’ (SCADA) systems. In order to obtain reliable information on possible breakdowns, it is necessary to continuously monitor and diagnose the state of health of the wind turbines. At the same time, it is necessary to develop preventive maintenance procedures to avoid unexpected problems in the wind turbines For this reason, many efforts are being made to improve the performance of the wind farms through the use of SCADA data which, in modern wind turbines, collects hundreds of signals (temperatures in several points, pressures, gearbox lubrication system data, currents, voltages, etc.). The complete SCADA data sets will frequently include the average values of 10 minutes or even 5 min windows, and also some statistics (min, max, std).
A fundamental way to better understand the failures that occur in the wind turbine components as a previous step to improve designs, is the study of the resonant coupling of energy that occurs between coherent turbulent fields (phenomena that often occurs during at nighttime), and the natural vibrational modes of a turbine rotor blade, and how this resonance induces a flow or flux of turbulent kinetic energy into the blade structure which is propagated into the remainder of the turbine. That amount of energy must be dissipated by the turbine structure causing a decreasing of component lifetimes and reliability [9]. To better understand this phenomena, computationally intense numerical simulations were performed in [9,10,11], providing relevant insights about different component fatigue failures, as for instance those occurring in the drivetrain bearing.
The presented approach differs from the general approach, and is inspired by the fact that today, expert knowledge still plays a fundamental role in this field. For example, when a wind farm that (mainly) contains a large number of turbines begins to be monitored, an important task is to identify a reduced set of turbines that are representative of the entire wind farm, for detailed inspection of these rather than having to spend time on all the turbines. To do this, we initially need to be able to group the turbines according to their condition. That task, assigned to an human expert, consist on analyzing the O&M historic data (written annotations made by maintenance personnel during their interventions on wind turbines). However, exhaustive and manual exploration of turbine variables becomes an unfeasible task, mainly because each manufacturer reports events in their own way, and the large number of manufacturers and potential events is too large. This means that, for example, the names of the variables and the physical location of the sensors may differ from one manufacturer to another. Failure events are also different for each manufacturer. For example, there is no standard code that refers to a particular kind of malfunction, such as a gearbox malfunction Human experts can only focus on a few turbines, as the amount of data to be processed and the significant number of working conditions would make it impossible to follow all of them comprehensively. When reviewing the repair and maintenance actions of a turbine, this expert may discover, for example, that a machine shortens oil change cycles and, as a consequence, may infer a possible failure of a subsystem related to that observation. In this paper, guided by the way experts proceed in their work, the underlying hypothesis is that automatic text mining can be used as an emerging and complementary tool to predict possible failures in the automatic processing of O&M information and could be extended to all machines.
To test this hypothesis, the wind turbines on which a component replacement has been performed are selected. Particularly, two kinds of components have been investigated: (i) the generator subsystem (with brushes included) and (ii) the gearbox (gearbox bearing also included). This selection is in the interest of anticipating the detection of failures of this type, given their economic impact on the operation of the wind farm’s performance. So, in the first step, all the O&M records of machines that have undergone one of these replacements are divided into two parts, one containing the data from the O&M records before the action (replacement) and the other after it. On the other hand, 10-min measurements of wind speed and energy generated, retrieved from the SCADA system, are also used to verify that the power curve (power vs. wind speed) before and after component substitution actually manifests an observable variation in performance. From these power curves, which indicate the relationship between wind energy and the electrical energy generated, four metrics are extracted that will allow comparing the performance of the turbine before and after the change of components. This study attempts to automate the exploration of O&M documents and to quantify the frequency of the words that appear before and after the event (substitution/repair), in order to construct an ontology that links the presence of a set of words with the appearance of failure.
The proposed method applies text pre-processing to select the word roots, when possible. This procedure applies to all datasets that will be used for the training of a decision tree (DT) and a Random Forest (RF) based classifier, where classes are tagged with ‘before’ and ‘after’ labels, corresponding to the information obtained pre- and post-event, respectively. Although text mining and ontology development has been used in various industrial applications such as in post-project reviews [12], knowledge discovery from the diagnosis data in the automotive sector [13] or the analysis of sustainability trends in the process industries [14], there is very little work done in the wind energy field [15] and as far as we know, the most significant works in this context is the semi-automatic construction of an ontology from Wikipedia articles [16], the accident analysis carried out in [17] and, the dictionary learning approach used to monitoring the train bearings of wind turbines in [18]. Other significant contributions in semantic networks and text mining in the industrial context can be found in [19,20].
The structure of the paper is the following: Section 2 provides a description of the data, pre-processing, text-mining, performance metrics and model creation strategies. In Section 3 the experimental work is presented, together with the discussion within the context of the presented research in a real wind farm. Finally, Section 4 is devoted to the conclusions of the proposed methodology and outlines future work in this area.
2. Materials and Methods
Two main aspects are discussed here: firstly, how to test and demonstrate that there is a change in the performance of the turbine after a maintenance intervention (performance metrics) and secondly, how to analyze the words used by the maintenance personnel, in order to discover which words are the important ones (text mining).
2.1. Performance Metrics
Power curves are a well-known method to determine the wind turbine health status [21]. In the present work, a logistic regression method was used as it generated low mean squared error (MSE) and mean absolute error (MAE) results compared to other methods [22]. The logistic regression was fitted to the data points with the tuning of three parameters that later on were used as metrics to compare the turbine behaviour before and after the failure. The performance metrics was carried out in the following way:
- Download the wind and power features, separately for each turbine. Then, a discretization was applied to the wind values with a precision of 0.1 m/s.
- Find the logistic function that better fits the cloud of points (wind speed, power). Two R functions were used (SSlogis and NLS) to derive the three parameters of the curve in a MSE framework. These three parameters were the horizontal asymptote (Asym), the inflection point (Xmid) and the step of the curve.
2.2. Data
The data used in this work was the maintenance service history completed by the maintenance personnel. The maintenance service history is referred as work order (WO). Because there was no specific procedure on how to report all maintenance work, the available text was in a free format and can contain many errors (spelling, punctuation, etc.). An important pre-processing step needed to be carried out. The process was as follows:
2.2.1. Work Order Download
All the work orders were downloaded from the maintenance database. These orders have the following characteristics:
- The hour and date were instantaneous.
- The WO id identified each intervention. There can be several lines for each WO id because each one was duplicated for each material used and for each comment entered in the system.
- The “wo_class” tag identified a class of intervention categorized in one of the major failures.
- The important files were: work_description (indicates in a extended way the work done), material_code (indicates the material used), problem_found (indicates what happened), problem_source (indicates the origin of the problem), problem_solution (indicates the adopted solution ).
To build the input dataset, sentences with the same work order ID were added to a common paragraph (register entry/table row) separated by a punctuation mark. This was repeated for each work order id.
2.2.2. Common Errors
A dictionary type file (“common_errors.csv”) was loaded, where misspelled words or words with different endings were mapped to a common or correct word, for example: aaverias → averiar, acaba/acababado → acabar, amarilloblanco → amarillo blanco, anntirobo → anti robo, etc. This file was used later in the text mining process.
2.2.3. Removing Words
Different word files were loaded, containing words to be deleted, such as personal names, places names or words with no effect on the model such as bar, comer (eat), etc.
2.3. Building the Training and Testing Dataset
The training dataset was built by taking 60% of turbines with WO. The remaining 40% of turbines with WO and the remaining without WO were assigned to the testing dataset.
For each turbine, and having all the N registers sorted by date, the process was as follows:
- The register in which the repair intervention started is labelled as “F” register.
- The register in which the repair intervention ended is labelled as “FF” register.
- The registers 1 to F-1 are labelled as “1”, indicating ‘before failure repair’ events.
- The The registers FF+1 to N are labelled as “0”, indicating ‘after failure repair’ events.
2.4. Text Mining
Text mining can be applied using different methods and procedures [23]. An interesting procedure to process general text was described in [24], while [25] presented another strategy for social and economics text processing. These two methods were used in the present work, after adapting them to the wind turbines scenario. With the training and testing datasets built, a corpus was created using all the documents (WO inputs). The following steps were applied to it:
- The dots and commas were eliminated: removePunctuation
- The numbers were deleted: removeNumbers
- The empty spaces at the begining and at the end were eliminated: stripWhitespace
- All text was converted to lowercase: tolower
- All the brackets such as ’()’, ’’ or ’[]’ were deleted: bracketX
- All the words loaded in the step Section 2.2.3, together with the STOP words were eliminated: removeWords stopwords (for the Spanish language, ’ES’)
- Common errors loaded in the step Section 2.2.2 were repaired.
- All the accents were cleared, changing the vowel with accent for the equivalent without accent.
- All the text was stemmed using the function STEMDOCUMENT of the package TM, using the parameters for the Spanish language (’ES’)
2.4.1. Document Term Matrix
Finally, the document term matrix was created independently for the training and testing datasets. This matrix contains only “1” or “0”, where each column was a word and each row was a sentence. If the sentence i contained the word of column j, the cell was set to “1”, otherwise it was set to “0”.
2.4.2. Word Clouds
A word cloud [26] is a useful tool to analyze and find out the most common words in a document which are summarized in a simplified figure. Gan et al. [26] considered the word clouds as the most versatile methods over many document visualization tools. The generated figures used the size and the color to indicate clusters of words with almost the same frequencies. The larger a word was, the more frequently it was found in the document. The colors were used to identify the clusters. Word clouds were also helpful to compare between datasets or conditioned datasets with specific labeling that separated the document entries in different groups. In this case, we have selected Ian Fellows’ word cloud package [27], available through the CRAN project.
2.5. Modelling
Two family models have been used: DT and RF. For both of them, different models have been derived from different frequency ranges. For each model, different optimization parameters, described in each section, have been applied. In all the cases, the parameter to be optimized is the ROC curve.
These ranges established the minimum and maximum number of occurrences that a word must have throughout the training text to be taken in the model. Different experiments have been done with different ranges from the least common words to the most common words. For each of those ranges, four metrics have been calculated to characterize the models: the accuracy (classification rate), the F-score, the kappa and the area under the curve (AUC). These models have a 2D matrix as input, and a binary vector as output, indicating to which class the input belongs to. The 2D input matrix contains the maintenance interventions/service logs, organized as follows: the different words roots are in columns and the sentences in rows. The binary output vector contains a “0” or a “1” for the maintenance interventions after (“0”) or before (“1”) the turbine system is repaired.
2.5.1. Decision Trees
DT-based models have been optimized by grid searching for “CP” complexity from 0 to 0.05 in 0.005 increments. A 10-fold cross validation was applied 10 times to each model. The models were tuned using the CARET library tuning tools through a grid search and with the ROC curve as a metric. Data was normalized by applying z-score before feeding the model.
The tree was drawn in order to determine which words have had more importance in the different decisions.
2.5.2. Random Forest
For the RF-based models, a five-fold cross-validation has been used, with a maximum number of 50 trees. Additionally, the model was tuned using grid search on the variable mtry, which controlled the number of random variables used for each tree. The importance given by the RF model to each word was extracted and used to obtain the relevant words. Because a stemming process was first applied, the original word has been retrieved when plotting it.
3. Results and Discussion
3.1. Performance Metrics
Panel (a) of Figure 1 shows the scatter-plot of the wind speed versus power of the generator before (red points) and after (blue points) failure for turbine 153. The horizontal axis corresponds to the wind speed (m/s) and the vertical axis corresponds to the power (Kw). Over the scatter- plot, logistic functions (sigmoids) that best fit the data points before (red) and after (blue) the maintenance intervention were superimposed. The numerical values of the parameters of the logistic functions, before the intervention, were: (i) Kw, and . After the intervention, all the parameters changed to: (i) Kw, and . The area under the curve (AUC) was 8.9 before the intervention and 9.642 after the intervention, indicating that the performance of the turbine increased after the failure was repaired. Panel (b) of Figure 1, corresponds to the zoomed part, and shows that the blue line is mostly above the red line, indicating that after repair the performance of the turbine increases.
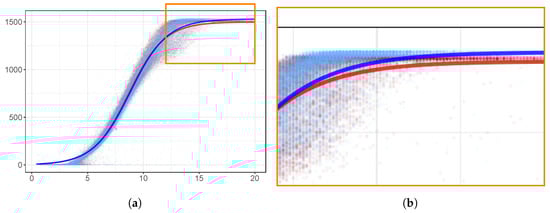
Figure 1.
Scatter-plot of the wind speed versus power of the generator before and after failure for turbine 153. Logistic functions (sigmoids) that best fit the data points before (red) and after (blue) the maintenance intervention are superimposed. Panel (a) shows the entire power curve, while panel (b) shows the critical part where maximum power is expected.
Figure 2 shows the differences of the power generated in KW, obtained as the subtraction between the power after the maintenance operation and the power before the maintenance. It is observed that in the range where the turbine operated at maximum efficiency (which corresponds to the zoomed part of Figure 1, between 13 and 25 m/s of wind speed), the turbine had higher energy production after repair (positive values of the subtraction curves), whatever the means (panel (a)) or the medians (panel b) are subtracted.
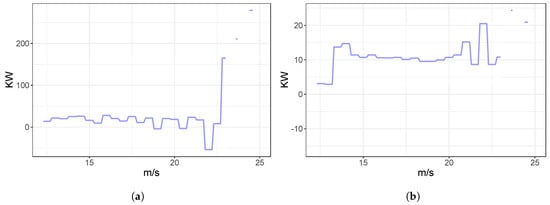
Figure 2.
Curve of the difference of the generated power after maintenance minus before maintenance. Horizontal axis is the wind speed in m/s, vertical axis is the energy production in KW. Panel (a) is calculated by subtracting the mean values, while panel (b) is calculated by subtracting he median values.
3.2. Word Clouds
These are the results of applying the word cloud algorithm to the dataset that contains all the turbines sentences before and after the generator was changed on Figure 3. Also the same is done for the case of the gearbox change in Figure 4. Both algorithms were configured to analyze the top 200 words. It was important to note that the most common word root was prevent that stands for prevention and the same happened for the word root cambi that means change, so in both cases (before and after), there was a regular preventive change in the turbine, mainly produced by scheduled maintenance.
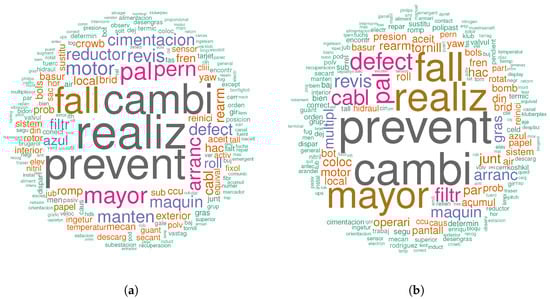
Figure 3.
Word clouds with the top 200 most frequent words for the generator before (a) and after (b) the replacement. Notice that the most important words (the biggest ones) have changed. For example, the word realiz (to do something) is no longer the most important in (a); or the word manten (maintenance) appears before but not after.
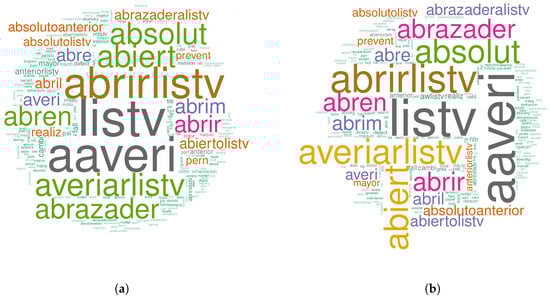
Figure 4.
Word clouds with the top 200 most frequent words for the gearbox before (a) and after (b) the replacement. In this case, even if the most important words are similar, the clusters have changed. However, both word clouds seem similar, and further analysis has to be done in order to obtain clear differences.
3.3. Model Results
Two different models were applied to both generator and gearbox failures. Table 1 summarizes the metrics results for both DT and RF models. The same is presented in Table 2 for the gearbox failures models. These results show that it was possible to determine the state of the turbine simply by capturing the combination of words that are present in the event of a fault. Depending on the type of model, the sequence or combination of words that are present in the unhealthy turbine was shown by printing the decision trees; in others evaluating their importance. Both methods achieved an adequate level of detection, but the most important point was which combination of words the expert should take into account when analyzing new turbines or creating a supervised classification problem with healthy and unhealthy turbines using analog SCADA data.

Table 1.
Classification metrics results for generator failures with Decision Trees and Random Forest models. Min. frequency % and max. frequency % columns indicate the minimal and maximal frequency that a word has to be in the training dataset to be chosen to train the model.
Table 2.
Classification metrics results for gearbox failures with Decision Trees and Random Forest models. Min. frequency % and max. frequency % columns indicate the minimal and maximal frequency that a word has to be in the training dataset to be chosen to train the model.
3.3.1. Decision Trees
Generator Failures
The classification results are shown in Figure 5. Numerical values are presented in the Table 1. We observe that the best range that a word has to be in the training dataset to be chosen to train the model (minimum and maximum frequency) is from 1% to 90%. A similar behavior (and therefore the same range) was observed for the kappa (panel (c)) and F-score (panel (b)) values. On the contrary, the AUC (panel (d)) got the best result in the range from 1% to 90%. The decision tree is shown in the Figure 5 for the best range from 1% to 90%. This figure shows the decisions of the different levels of the sub-trees in boxes. These boxes were colored green when the probability of the class “before the failure” won, and blue when the probability class “after the failure” won. Each one of these boxes shows the probability of each class and the percentage of observations included in this node. In this case, the last sheet on the left side was selected if the text subestacion was smaller than 11. The winning class was “before the failure” and therefore the box was green. This node contains 83% of the observations, which is a large proportion of them.
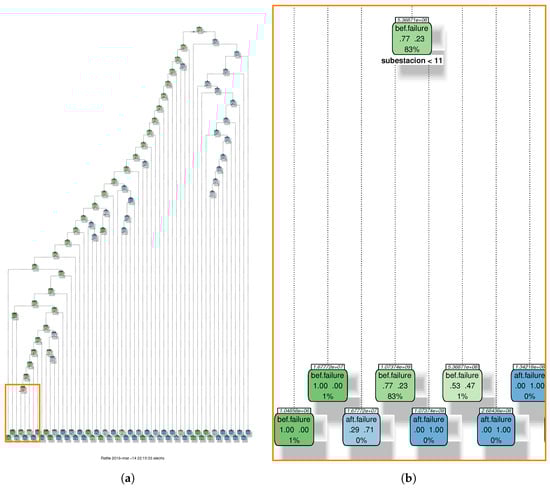
Figure 5.
Decision tree result for the generator failures (a). The model was generated with the words that have a frequency from 1% to 90%. This range is a good trade-off for each of the metrics of Figure 6. The zoomed panel (b) shows that with only the word subestacion almost the 83% of the observations are classified as “before failure”.
Gearbox Failures
The classification results metrics are shown in Figure 7 and the decision tree is shown in Figure 8. Numerical values are presented in the Table 2. The accuracy is showed in panel (a), and the best values are obtained for the range from 1% (min freq) to 90% (max freq). The same behaviour is observed for the F-score in panel (b) and for the kappa in panel (c). For the AUC, in panel (d), the best result is obtained in a narrower range, from 40% to 90%. The decision tree is depicted in Figure 8, for the best range from 1% to 90%, showing the different nodes of decisions in boxes. As before, green boxes correspond to the case when the “before failure” class probability won, and in blue color when the “after failure” probability class won. Each of these boxes contains the probability of each class and the percentage of observations included in this node. In this case, the last leaf on the left side was selected if the word root potenciometr was smaller than 19. The winning class was “before failure” and therefore the box was in green color. This node contains 93% of the observations, which was a large proportion of them.
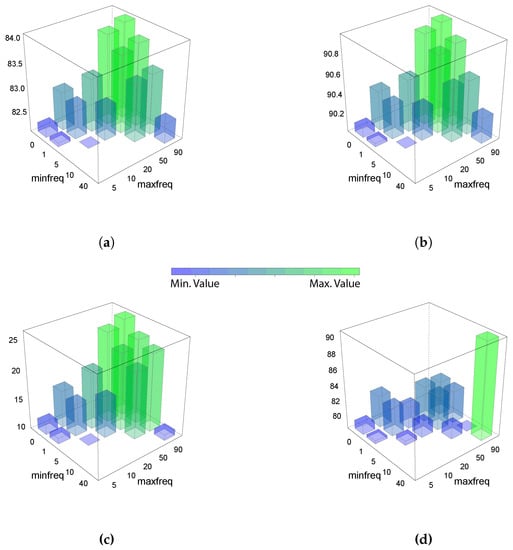
Figure 7.
Summary of the results for the gearbox failures using a decision tree model. The vertical axis indicates the minimum frequency % of a word in the training dataset in order to be selected by the model. The horizontal axis indicates the maximum frequency %. Each of the panels show a different metric for the same experiment. (a) shows the Accuracy %, (b) the F-Score in %, (c) the Kappa in % and (d) indicates the AUC. Empty blocks (ranges) are values that cannot be calculated are from a predictionwith a unique class output.
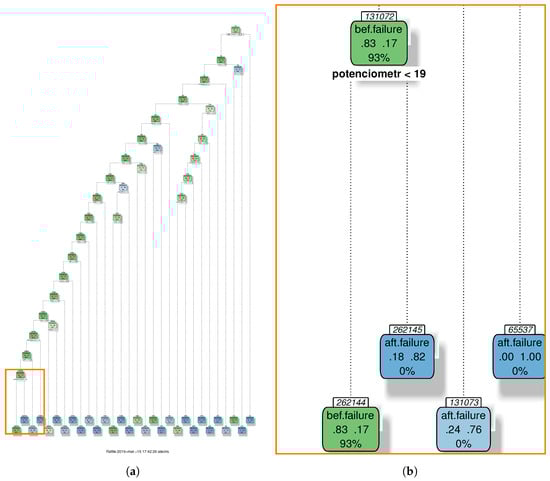
Figure 8.
Decision Tree result for the gearbox failures (a). The model was generated with the words that have a frequency from 1% to 90%. This range is a good trade-off for each of the metrics of Figure 7. The zoomed panel (b) shows that with only the word potenciometr almost the 93% of the observations are classified as “before failure”.
3.3.2. Random Forest
Generator Failures
The classification results are shown in Figure 9. Numerical values are presented in the Table 1. The accuracy is in panel (a), where the best values are obtained in a narrower range from 1% (min freq) to 5% (max freq). The same behaviour was obtained for the F-score in panel (b) and for the kappa in panel (c). In the case of AUC, the best range was between 0% to 5%. The variable importance is shown in Figure 10, where the word augment that stands for increase, was one of the most important variables in this model. In that case, the best word frequency range, based on the metrics used to characterize the results, was from 1% to 10%.
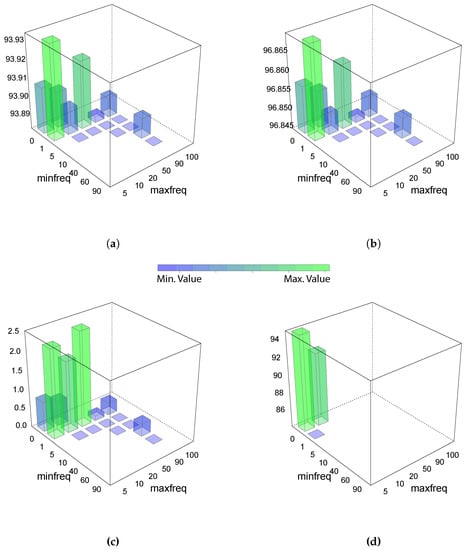
Figure 9.
Summary of the results for the generator failures using a random forest model. The vertical axis indicates the minimal frequency % of a word in the training dataset in order to be selected by the model. The horizontal axis indicates the maximum frequency %. Each of the panels show a different metric for the same experiment. (a) shows the accuracy %, (b) the F-score in %, (c) the kappa in % and (d) indicates the AUC. Empty blocks (ranges) are values that cannot be calculated are from a prediction with a unique class output.
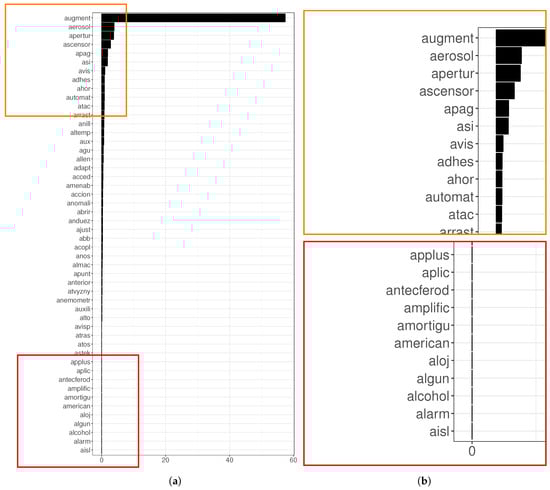
Figure 10.
(a): Top 100 random forest variable importance for the failures of the generator. The model was generated with words that have a frequency from 1% to 10%. This range is a good trade-off according to the metrics of Figure 9. The top most and less important words can be seen in panel (b), delimited by an orange and a red square, respectively. The RF model selected the word augment, which is the root of the word augmentar (to increase), as the most important one.
Gearbox Failures
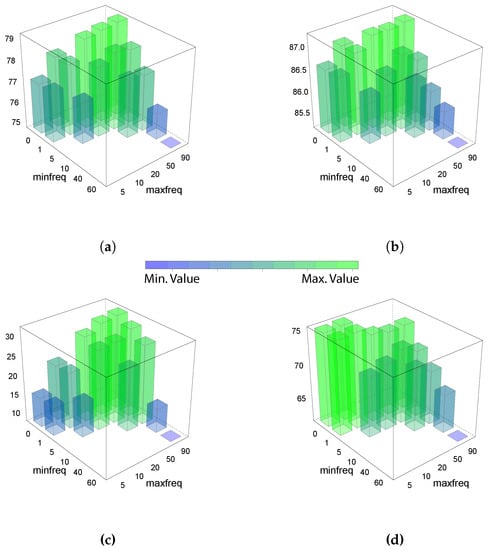
The classification results are shown in Figure 11. Numerical values are presented in Table 2. The accuracy is depicted in panel (a), where the best values are obtained in a narrower range from 1% (min freq) to 5% (max freq). The same behavior was observed for the F-score in panel (b), for the kappa in panel (c) and for the AUC in panel (d). The variable importance is shown in Figure 12, where the word arranc that stands for start was one of the most important variables in this model. In that case, the best range, based on the metrics used to characterize the results, was from 1% to 50%.
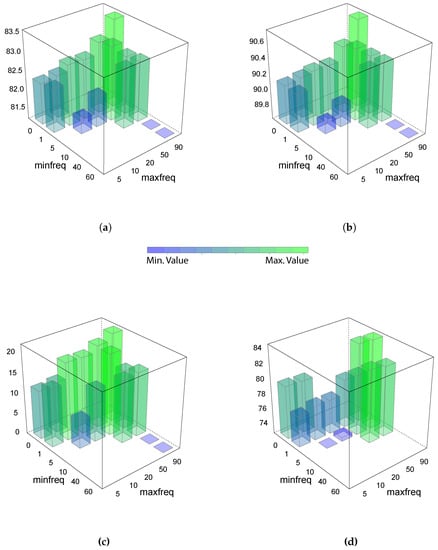
Figure 11.
Summary of the results for the gearbox failures using a random forest model. The vertical axis indicates the minimal frequency % of a word in the training dataset in order to be selected by the model. The horizontal axis indicates the maximum frequency %. Each of the panels show a different metric for the same experiment; (a) shows the accuracy %, (b) the F-score in %, (c) the kappa in % and (d) indicates the AUC. Empty blocks (ranges) are values that cannot be calculated from a prediction with a unique class output.
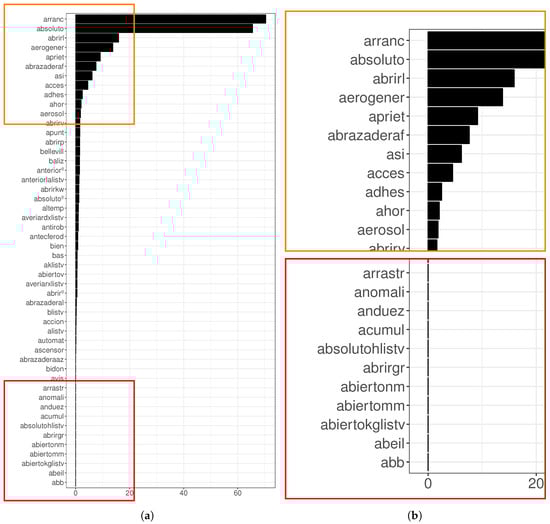
Figure 12.
(a): Top 100 random forest variable importance for the gearbox failures. The model was generated with words that have a frequency from 1% to 50%. This range is a good trade-off according to the metrics of Figure 11. The top most and less frequent words can be seen in panel (b), delimited by an orange and a red square, respectively. The RF model selected the words arranc, which is the root of the word arrancar (to start), and absoluto (absolute), as the most important ones.
As can be seen, it is important to use the information available in the service history logs. This allows us to know what interventions and repairs have been carried out. The analysis of this information implies that several pre-processing steps must be performed. Among them, pre-cleaning the text was key. This cleaning step was a process that must include technical language. Note that this step depended on the wind turbine model, as many words were names of particular parts or components of a particular model. This implies that models built for one type of machine and wind turbine may not work properly for another type of turbine.
Because the text used by maintenance personnel does not come from a set of predefined phrases, the complexity of the problem increases. This is why this first approach to text mining has required a great deal of effort. A dictionary of more than 600 terms has been built to replace the misspelled terms used by maintenance personnel with the correct ones.
Another important issue has been the search for the roots of the words. The available library (TM) did not include the treatment of technical words. Therefore, a replacement text list (a dictionary with the root of the technical words) has been added to the library. With the previous pre-processing steps, it was possible to derive successful classification models using simple and traditional methods.
4. Conclusions
In this work, a study based on the text-mining of work orders has been carried out to detect, by means of machine-learning tools, the essential words used by maintenance personnel in the maintenance/repair of turbines. It has been shown that when a turbine has a fault in the generator system and it has been repaired, there is a difference in the amount of wind production. This difference is shown in the power curve before and after the maintenance intervention. This difference is captured with the parameters of the sigmoid curve that best fit the cloud of points. These metrics are useful for selecting the turbine that has the greatest significant difference before and after the failure. Having access to the machine’s service reports which contains the description of the maintenance and/or repair carried on, having a real difference in turbine’s performance and being able to quantify and compare it, further analysis has been carried out using natural language processing techniques to train the DT and RF model with the maintenance logs of this turbine. The pre-processing of the text of the machine’s service reports allows the generation of classification models that obtain accuracy and F-score rates above 90% in several cases. This shows that the classifier has extracted the important words that characterize a failure case. We observe that the more important the difference in these metrics, the better the results obtained for the text classification model.
Through the analysis of the relevance in the DT and RF models, it is possible to find which word/words indicate that a turbine has a failure. This allows to automate the detection of interventions in new turbines to know their state from start. So far, this is done manually by a human expert who looks for words and combinations of them that are key in maintenance and/or repair interventions. This is tedious work which can be biased by the expert judgement and/or affected by other non-technical aspects. Now, with the proposed system, this can be done using the classification model, and therefore we can know when a turbine has a failure through this text mining process, which applies a data labelling before and after a specific sequence or combination of words. A number of future works have been identified, and there is much room for improvement, because there are several critical steps that have a significant impact on the final result. For the pre-processing step, a better sentence analysis can be done; a syntax analysis step can be implemented to identify the technical domain nouns and verbs and create the model with them. In addition, the construction of the document term matrix can be improved by generating a combination of two, three, or “n” terms at the expense of computational time. In addition, a third dimension can be added indicating the type of term (verb, noun, adverb, etc.) since in the stemming process this information can be lost.
Author Contributions
Conceptualization, A.B.-M., P.M.-P., K.G. and J.S.-C.; methodology, A.B.-M. and K.G.; software, A.B.-M. and K.G.; validation, P.M.-P., K.G. and J.S.-C.; formal analysis, A.B.-M. and K.G.; investigation, A.B.-M., P.M.-P. and J.S.-C.; resources, J.C.; data curation, A.-B.M. and J.C.; writing—original draft preparation, A.-B.M., P.M.-P. and J.S.-C.; writing—review and editing, A.B.-M., P.M.-P. and J.S.-C.; visualization, A.B.-M., K.G. and J.S.-C.; supervision, K.G. and J.S.-C.; project administration, J.C. and J.S.-C.
Funding
This research received no external funding.
Acknowledgments
The authors would like to thank the Smartive company (http://smartive.eu/) for providing the data used in the experimental part.
Conflicts of Interest
The authors declare no conflict of interest.
Abbreviations
The following abbreviations are used in this manuscript:
| AUC | area under the curve |
| CBM | condition based maintenance |
| CMS | condition monitoring systems |
| CM | confusion matrix |
| CP | decision trees complexity parameter |
| DT | decision trees |
| MAE | mean absolute error |
| MSE | mean squared error |
| O&M | operation and maintenance |
| RF | random forest |
| SCADA | supervisory control and data acquisition data |
| WO | work order |
References
- Renewable Energy Policy Network for the 21st Century. Renewables 2016—Global Status Report; Technical Report; REN21: Paris, France, 2016; ISBN 978-3-9818107-0-7. [Google Scholar]
- European Comission. Renewable Energy: Progressing towards the 2020 Target. Technical Report 31 November 2011. Available online: https://eur-lex.europa.eu/legal-content/EN/TXT/PDF/?uri=CELEX:52011DC0031 (accessed on 21 March 2019).
- Eurostat. Energy Balance Sheets 2011–2012; Technical Report 9; Eurostats (European Union): Luxembourg, 2014. [Google Scholar] [CrossRef]
- Milborrow, D. Operation and Maintenance Costs Compared and Revealed; Haymarket Business Media: London, UK, 2006; Volume 19, pp. 1–87. [Google Scholar]
- Besnard, F.; Bertling, L. An approach for condition-based maintenance optimization applied to wind turbine blades. IEEE Trans. Sustain. Energy 2010, 1, 77–83. [Google Scholar] [CrossRef]
- European Commission. European Commission Guidance for the Design of Renewables Support Schemes. 2013. Available online: https://ec.europa.eu/energy/sites/ener/files/com_2013_public_intervention_swd04_en.pdf (accessed on 21 March 2019).
- European Commission. Energy and Environment State Aid Guidelines 2014–2020. Available online: https://eur-lex.europa.eu/legal-content/EN/TXT/PDF/?uri=CELEX:52014XC0628(01)&from=EN (accessed on 21 March 2019).
- García Márquez, F.P.; Tobias, A.M.; Pérez, J.M.P.; Papaelias, M. Condition monitoring of wind turbines: Techniques and methods. Renew. Energy 2012, 46, 169–178. [Google Scholar] [CrossRef]
- Kelley, N.D.; Jonkman, B.J.; Scott, G.; Bialasiewicz, J.; Redmond, L.S. Impact of Coherent Turbulence on Wind Turbine Aeroelastic Response and Its Simulation; Technical Report; National Renewable Energy Lab. (NREL): Golden, CO, USA, 2005.
- Churchfield, M.J.; Lee, S.; Michalakes, J.; Moriarty, P.J. A numerical study of the effects of atmospheric and wake turbulence on wind turbine dynamics. J. Turbul. 2012, 13, N14. [Google Scholar] [CrossRef]
- Nandi, T.N.; Herrig, A.; Brasseur, J.G. Non-steady wind turbine response to daytime atmospheric turbulence. Philos. Trans. R. Soc. A Math. Phys. Eng. Sci. 2017, 375, 20160103. [Google Scholar] [CrossRef] [PubMed]
- Choudhary, A.K.; Oluikpe, P.; Harding, J.A.; Carrillo, P.M. The needs and benefits of Text Mining applications on Post-Project Reviews. Comput. Ind. 2009, 60, 728–740. [Google Scholar] [CrossRef]
- Rajpathak, D.G. An ontology based text mining system for knowledge discovery from the diagnosis data in the automotive domain. Comput. Ind. 2013, 64, 565–580. [Google Scholar] [CrossRef]
- Te Liew, W.; Adhitya, A.; Srinivasan, R. Sustainability trends in the process industries: A text mining-based analysis. Comput. Ind. 2014, 65, 393–400. [Google Scholar] [CrossRef]
- Hossain, M.L.; Abu-Siada, A.; Muyeen, S. Methods for Advanced Wind Turbine Condition Monitoring and Early Diagnosis: A Literature Review. Energies 2018, 11, 1309. [Google Scholar] [CrossRef]
- Küçük, D.; Arslan, Y. Semi-automatic construction of a domain ontology for wind energy using Wikipedia articles. Renew. Energy 2014, 62, 484–489. [Google Scholar] [CrossRef]
- Asian, S.; Ertek, G.; Haksoz, C.; Pakter, S.; Ulun, S. Wind turbine accidents: A data mining study. IEEE Syst. J. 2017, 11, 1567–1578. [Google Scholar] [CrossRef]
- Martin-del Campo, S.; Sandin, F.; Strömbergsson, D. Dictionary learning approach to monitoring of wind turbine drivetrain bearings. arXiv 2019, arXiv:1902.01426. [Google Scholar]
- Çinicioğlu, E.N.; Ertek, G.; Demirer, D.; Yörük, H.E. A framework for automated association mining over multiple databases. In Proceedings of the IEEE 2011 International Symposium on Innovations in Intelligent Systems and Applications, Istanbul, Turkey, 15–18 June 2011; pp. 79–85. [Google Scholar]
- Ertek, G.; Tokdemir, G.; Sevinç, M.; Tunç, M.M. New knowledge in strategic management through visually mining semantic networks. Inf. Syst. Front. 2017, 19, 165–185. [Google Scholar] [CrossRef][Green Version]
- Uluyol, O.; Parthasarathy, G.; Foslien, W.; Kim, K. Power curve analytic for wind turbine performance monitoring and prognostics. In Proceedings of the Annual Conference of the Prognostics and Health Management Society, Montreal, QC, Canada, 25–29 September 2011; Volume 2, pp. 1–8. [Google Scholar]
- Lydia, M.; Selvakumar, A.I.; Kumar, S.S.; Kumar, G.E.P. Advanced Algorithms for Wind Turbine Power Curve Modeling. IEEE Trans. Sustain. Energy 2013, 4, 827–835. [Google Scholar] [CrossRef]
- Feinerer, I.; Hornik, K.; Meyer, D. Text Mining Infrastructure in R. J. Stat. Softw. 2008, 25, 1–54. [Google Scholar] [CrossRef]
- Hotho, A.; Nürnberger, A.; Paaß, G. A Brief Survey of Text Mining. Ldv Forum 2005, 20, 19–62. [Google Scholar] [CrossRef]
- Karl, A.; Wisnowski, J.; Rushing, W.H. A practical guide to text mining with topic extraction. Wiley Interdiscip. Rev. Comput. Stat. 2015, 7, 326–340. [Google Scholar] [CrossRef]
- Gan, Q.; Zhu, M.; Li, M.; Liang, T.; Cao, Y.; Zhou, B. Document visualization: An overview of current research. Wiley Interdiscip. Rev. Comput. Stat. 2014, 6, 19–36. [Google Scholar] [CrossRef]
- Fellows, I. Wordcloud: Word Clouds; R Package Version 2.6. Available online: https://cran.r-project.org/web/packages/wordcloud/wordcloud.pdf (accessed on 21 March 2019).


© 2019 by the authors. Licensee MDPI, Basel, Switzerland. This article is an open access article distributed under the terms and conditions of the Creative Commons Attribution (CC BY) license (http://creativecommons.org/licenses/by/4.0/).