Article

A Design of PWM Controlled Calibrator of Non-Sinusoidal Voltage Waveforms

FESB, University of Split, R. Boskovica 32, HR-21000 Split, Croatia
*
Author to whom correspondence should be addressed.
Energies 2019, 12(10), 1966; https://doi.org/10.3390/en12101966
Submission received: 20 April 2019 / Revised: 16 May 2019 / Accepted: 21 May 2019 / Published: 23 May 2019

Abstract

:
Power quality conditions in electrical power networks have drastically changed in recent years. A number of electrical devices and power generators that are the main sources of disturbances is ever increasing. Thus, the need for calibrators of different electrical equipment that will be able to generate non-sinusoidal voltages and/or currents has proportionally increased. This paper presents a simple, unconventional approach of generating voltage harmonics, which do not rely on digital-to-analog (D/A) boards and power amplifier to amplify low-voltage signals. A fundamental part of the calibrator is the insulated gate bipolar transistor (IGBT) inverter with low-pass LRC filter at its output, which eliminates higher harmonics from the generated voltage. Desired voltage waveform is directly generated at the inverter’s output, thus the power amplifier is omitted from the setup. The modulation technique used for controlling IGBTs is the well-known sine pulse width modulation (PWM). Magnitudes and phase angles of the desired harmonics are regulated to compensate for the phenomena that may have a negative influence on their values: Nonlinearities of the system, temperature variation, voltage drops on parasitic components, etc. Experimental results show great potential of the proposed method for the design of the voltage calibrator for various electrical instruments.

1. Introduction

Power quality (PQ) disturbances have emerged as one of the most important issues of concern in today’s power network in recent decades. The main source of PQ disturbances is increased usage of power electronics devices and nonlinear loads. In addition, this PQ deterioration trend will continue in the following years due to development of smart grids. One of the main features of smart grids is deregulation of the electricity market that implies the possibility of connecting distributed generation systems throughout the power network (e.g., small wind turbines and photovoltaic plants) that results in harmonic distortion. The impact of harmonics on calibration and operation of different measuring instruments in smart grids has been analyzed in references [1,2]. In addition, the need for realistic simulation and validation environments are essential for phasor measurement unit (PMU) development and deployment [3]. It should be pointed out that PMUs are an indispensable part of modern power monitoring and/or control systems since the dynamic states of wide-area power systems as well as microgrid can be estimated in real time using data obtained from these instruments [4,5].
European Parliament has issued the Measuring Instruments Directive (MID) in 2004, revised in 2014, concerning the devices and systems which directly or indirectly affect the life of citizens, one of which are electrical energy meters (EEM), [6]. The MID defines the requirements that the abovementioned devices and systems have to satisfy before being placed on the market and/or put into use. Some of the essential requirements are rated operating conditions, allowable errors, reproducibility, durability, etc. The rated operating conditions (i.e., normal working conditions) in electrical power systems have changed significantly in recent decades due to the aforementioned PQ issues. Up to now, measuring devices have been calibrated and tested according to sinusoidal conditions, which no longer represent actual working conditions.
The need for an arbitrary waveform generator that will act as a calibrator of measuring instruments under non-sinusoidal conditions came out in the last decade. Test setup for calibration of voltage transducers and current/voltage transformers, respectively, were proposed in references [7,8]. These test setups are based on the well-known principle of generating low-voltage arbitrary waveform signals at analog outputs of digital-to-analog conversion (DAC) board connected to a PC. Low-voltage signals are then amplified to the desired voltage level by means of different electrical/electronic devices. The signal generation procedure is practically the same in every study except for the power amplification stage. Power amplification is the key and the most challenging part of the arbitrary waveform generation process and, therefore, different designs of power amplifiers will be appropriately highlighted and presented. The combination of an audio power amplifier and step-up voltage transformer or current transformer has been applied in references [7,8], respectively. Class-D power amplifiers, which are first introduced in the audio area, amplify input signal using techniques similar to the approach presented in this paper. Different hardware designs of class-D power amplifiers and different modulation techniques that generate pulse train at the output of switching devices are presented in references [9,10]. Arbitrary waveform generator for tests on compact fluorescent lamps is presented in reference [11], where the same system as in references [7,8] is utilized, except for the voltage amplifier. In the last decade, the calibration of EEM has also become an important topic of interest to scientists and to the end users of EEM. PQ disturbances (especially harmonics, which are most frequent in the power network) can affect the performance (reading) of EEM and, therefore, affect the billing charges of the end users. New digital energy meters are especially sensitive to harmonic distortion due to different measuring algorithms implemented and a lack of precise definition of “normal operating conditions”, i.e., it is unclear which voltage harmonics can emulate conditions in today’s power grid [12]. AC electronic load (ACEL) that can emulate linear or nonlinear loads and is designed for on-site calibration of EEM is presented in reference [13]. The core of ACEL is single-phase IGBT full bridge and hysteresis current regulator. “Add On” device for calibration of EEM in the real electromagnetic environment, working on the similar principle as the device in reference [13], is developed in reference [14]. Criteria for selecting voltage and current waveforms, calibration procedure, and the set of voltage and current waveforms for the calibration of EEM under non-sinusoidal conditions are discussed in reference [15]. The studies [16,17] proposed a similar scheme for calibration of EEM as in references [7,8], except for different power amplifiers. Montano et al. have put the focus on developing user-friendly, flexible arbitrary waveform generator, which can be applied in various fields, from testing equipment under working conditions to machine learning, and as a teaching tool for students [16]. Procedures for error reduction in generation of arbitrary waveforms that improve the spectral purity of the signal have been developed in reference [17]. In addition, there are various commercial calibrators/AC power sources available on the market for calibration of different electrical instruments [13,14,18].

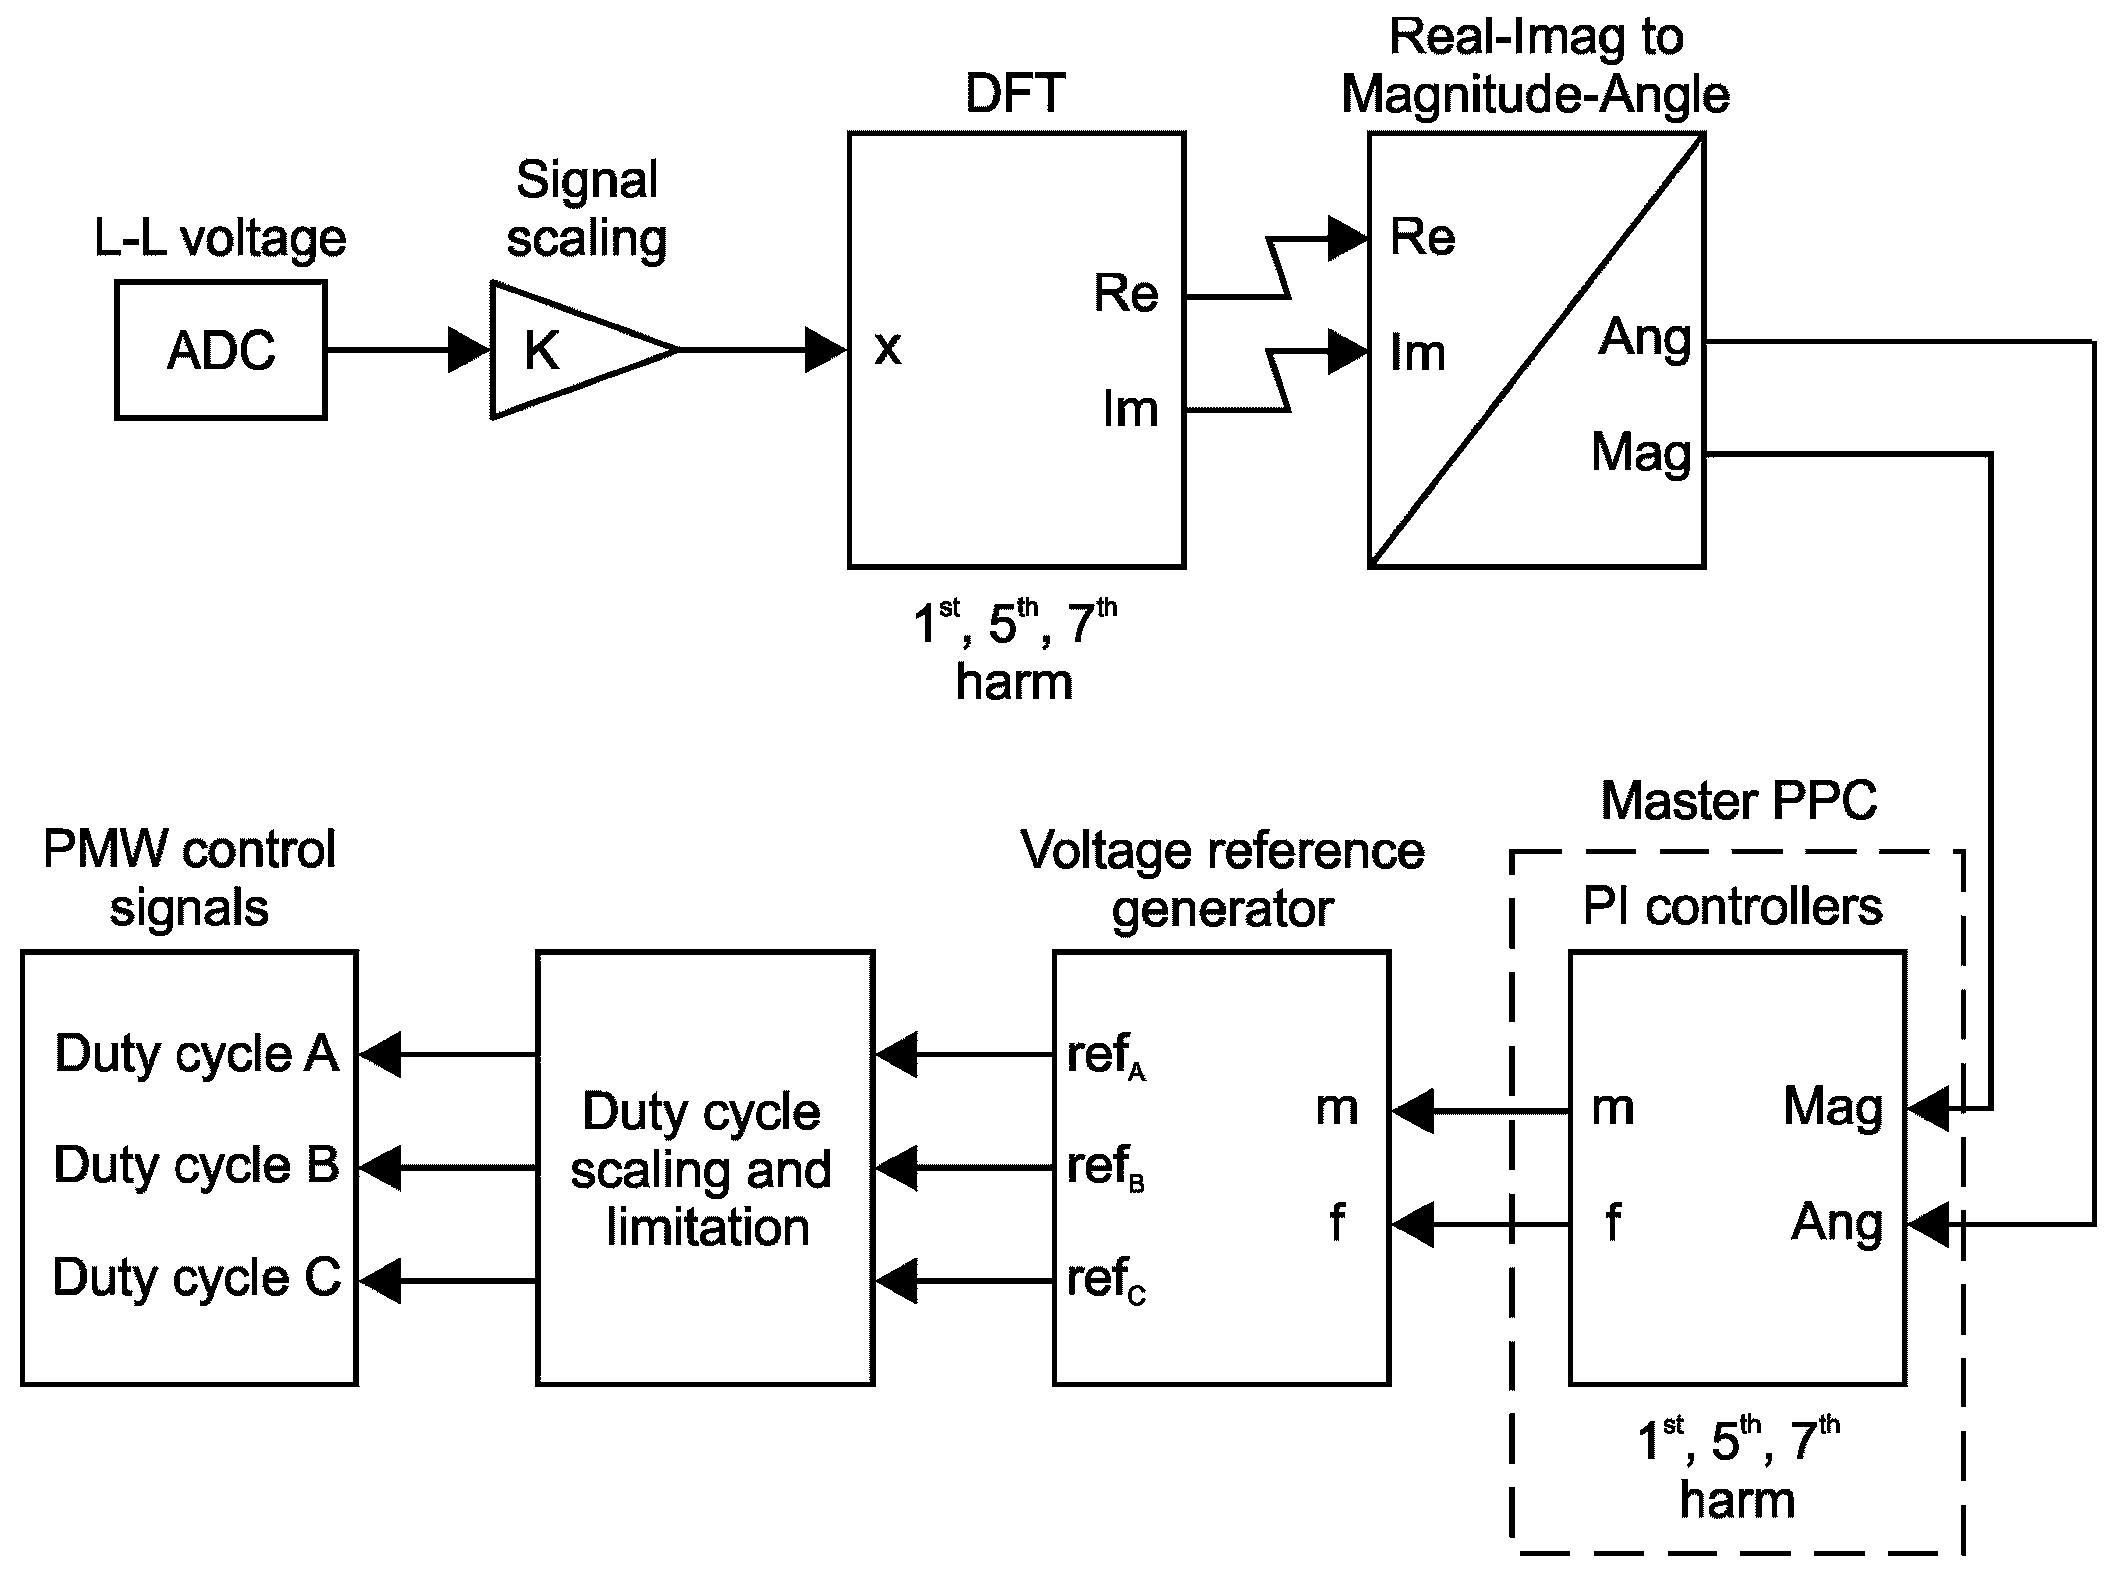
2. System Description

The block diagram of the proposed system used to generate the distorted voltage waveforms is shown in Figure 1. The three-phase IGBT inverter is fed by the stabilized DC voltage supply. Control signals for IGBT switches are generated from digital outputs (DO) of the DS1104 controller board installed in the host PC [19]. The LRC filter is connected at the inverter AC output in order to attenuate voltage higher harmonics, especially harmonics at the filter resonant frequency and harmonics in the vicinity of switching frequency and its integer multiples. Filtered voltage is then supplied to symmetrical resistive load. Three line-line voltages are measured and after signal conditioning they are acquired with analog inputs (AI) and processed within the controller board’s digital signal processor (DSP). It should be pointed out that the observed system is practically symmetrical and thus for the sake of simplicity only one line-line voltage is taken into consideration for the rest of the study. This assumption is experimentally verified by measuring all three voltages and choosing balanced components of the system shown in Figure 1.
Hardware of the proposed experimental setup is given in the following sections. In this subsection, focus is on the operating principle of the distorted waveform generator, i.e., on the program code implemented and built in the MATLAB-Simulink environment.
The Simulink model can be divided into three distinct parts: Discrete Fourier transform (DFT), voltage proportional-integral (PI) controllers and voltage reference generator. The simplified model is shown in Figure 2. In the subsequent paragraphs, all three model parts are briefly presented.

2.1. Discrete Fourier Transform

The recursive formula of the sliding window discrete Fourier transform has been derived from well-known equations [20]
X ( k ) = j = 1 N x ( j ) ω N k ( j 1 ) ω N = e ( 2 π i ) / N ,
where x(j) is the sampled time domain signal, N is the integer number of discrete data points, which define the period of the fundamental harmonic, k ∈ [0, N–1] is the respective harmonic and i is the imaginary unit. Equation (1) can be interpreted as a cross correlation of the input signal x(j) and the complex sinusoid at discrete frequency, i.e., it acts like a filter for a given frequency.
To prevent spectral leakage and thus incorrect calculation of the voltage magnitude and phase angle, N must be an integer
N = T 1 / T s ,
where T1 is the fundamental voltage harmonic period and Ts is the sample time, which specifies the algorithm execution rate. The magnitude and phase angle of the specified harmonics are then calculated from the complex output of the DFT block as seen in Figure 2.

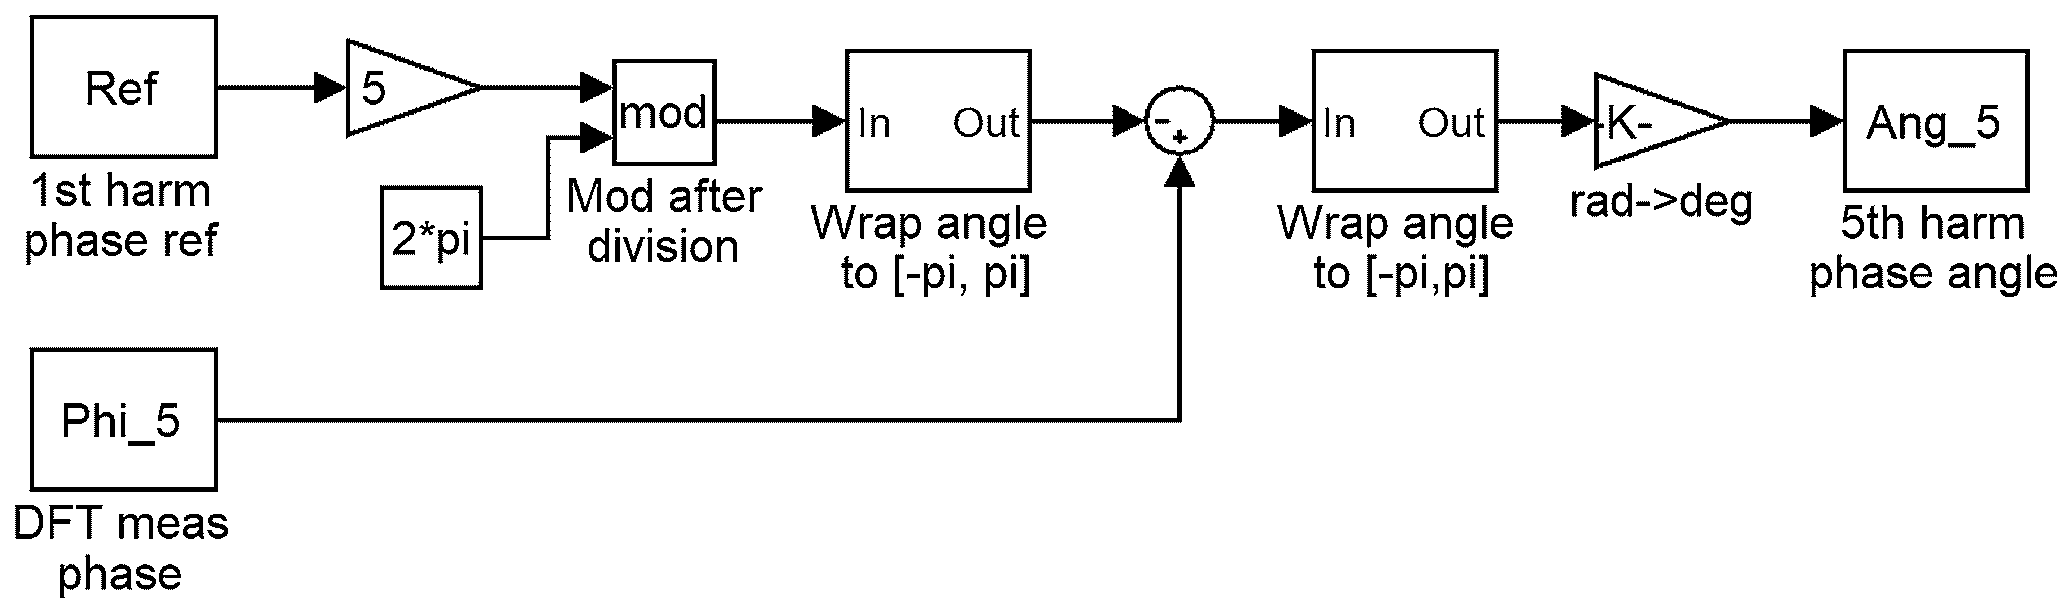
2.2. Voltage PI Controllers

In this study, the fundamental, 5th and 7th harmonics were generated for the sake of brevity and clarity. In addition, the choice of 5th and 7th harmonics is logical because they usually contribute the most to the total harmonic distortion (THD). The third harmonic and its multiples do not exist in harmonic spectrum because of symmetrical wye connected load that is detached from the ground. Inclusion of other higher order harmonics is straightforward and involves easy addition of PI controllers (by means of parallelism) for corresponding harmonics.
The output of the digital PI controller is defined in the recursive form as
u ( k ) = K p ( 1 + T s T i ) e ( k ) + ( u ( k 1 ) K p e ( k 1 ) ) ,
where k is the current time instant, e is the error value, Kp and Ti are PI controller proportional gain and integral time constants, respectively. Moreover, measures to prevent the PI controller windup effect are also implemented. The PI controller’s output magnitudes are limited to the values suitable for laboratory voltage reference generator while PI controllers phase angle outputs are limited from –π to π.
In this study 6 independent PI controllers have been used, 3 for magnitudes and 3 for the phase angles of the fundamental, 5th and 7th harmonic, respectively. The 5th harmonic phase angle calculation process is illustrated in Figure 3. The DFT measured phase was obtained from the DFT block in Figure 2 by Equation (1), and is a nearly linear ramp function from –π to +π. The system’s 1st harmonic referent phase angle generated by DSP is a linear ramp function from –π to +π. The system angle is common for all the harmonics and is stored within the look-up table to improve overall computational efficiency. The difference between these phase angles represents the 5th harmonic phase angle, which is used as the phase angle PI controller feedback. The calculation process is similar for fundamental and 7th harmonics, i.e., for any given integer harmonic.
On the other hand, control of the corresponding voltage harmonic magnitude is even simpler since the DFT block in Figure 2 outputs nearly constant magnitude value and is directly used as the magnitude PI controller feedback.

2.3. Voltage Reference Generator

Voltage reference generator is the integral part of the Simulink model. It generates control signals for the IGBTs in order to achieve target line-line voltage at the AC output of the power inverter. The modulation technique employed in the study for controlling the IGBT switching is the sine pulse width modulation (PWM) [21].
Sine PWM is based on generation of 3 referent sine waves (for each phase leg), where fundamental, a low-frequency component of inverter’s output pulsed voltage, is proportional to the referent voltage. In other words, the instantaneous value of the referent sine wave directly corresponds to the IGBTs duty cycle. Furthermore, due to the digital implementation of the modulation system, referent sinusoids are sampled using symmetrical regular sampled PWM strategy where sampling occurs at the positive peak of the triangular carrier signal and are held constant for the entire carrier interval [21]. The frequency of referent sinusoid is equal to the frequency of the output voltage fundamental harmonic while the carrier frequency defines the PWM frequency. The line-line voltage fundamental harmonic magnitude is equal to
V 0 = 3 M V D C / 2 ,
where M is the modulation index with range 0 < M < 1 and VDC is the DC link voltage.
It must be noted that in the paper referent signals are obtained as a sum of various harmonics sine waves rather than one pure sine wave, but the principle of operation is the same as it is presented for the sine PWM.
The outputs of magnitude and phase angle PI controllers are processed and then led to the voltage generator block in Figure 2. Based on the 3 arbitrary waveforms that represent 3 line-line voltages at the output of the block, appropriate duty cycles are generated, scaled, and limited to adjust their magnitudes to the input range of the power inverter driver block DSP_PWM3 [19]. DSP_PWM3 is a built-in function programmed on the DSP side of the DS1104 controller board. It enables the control signals for both the upper and lower IGBTs in every phase leg taking into account dead time to avoid short circuiting of the DC link bus.

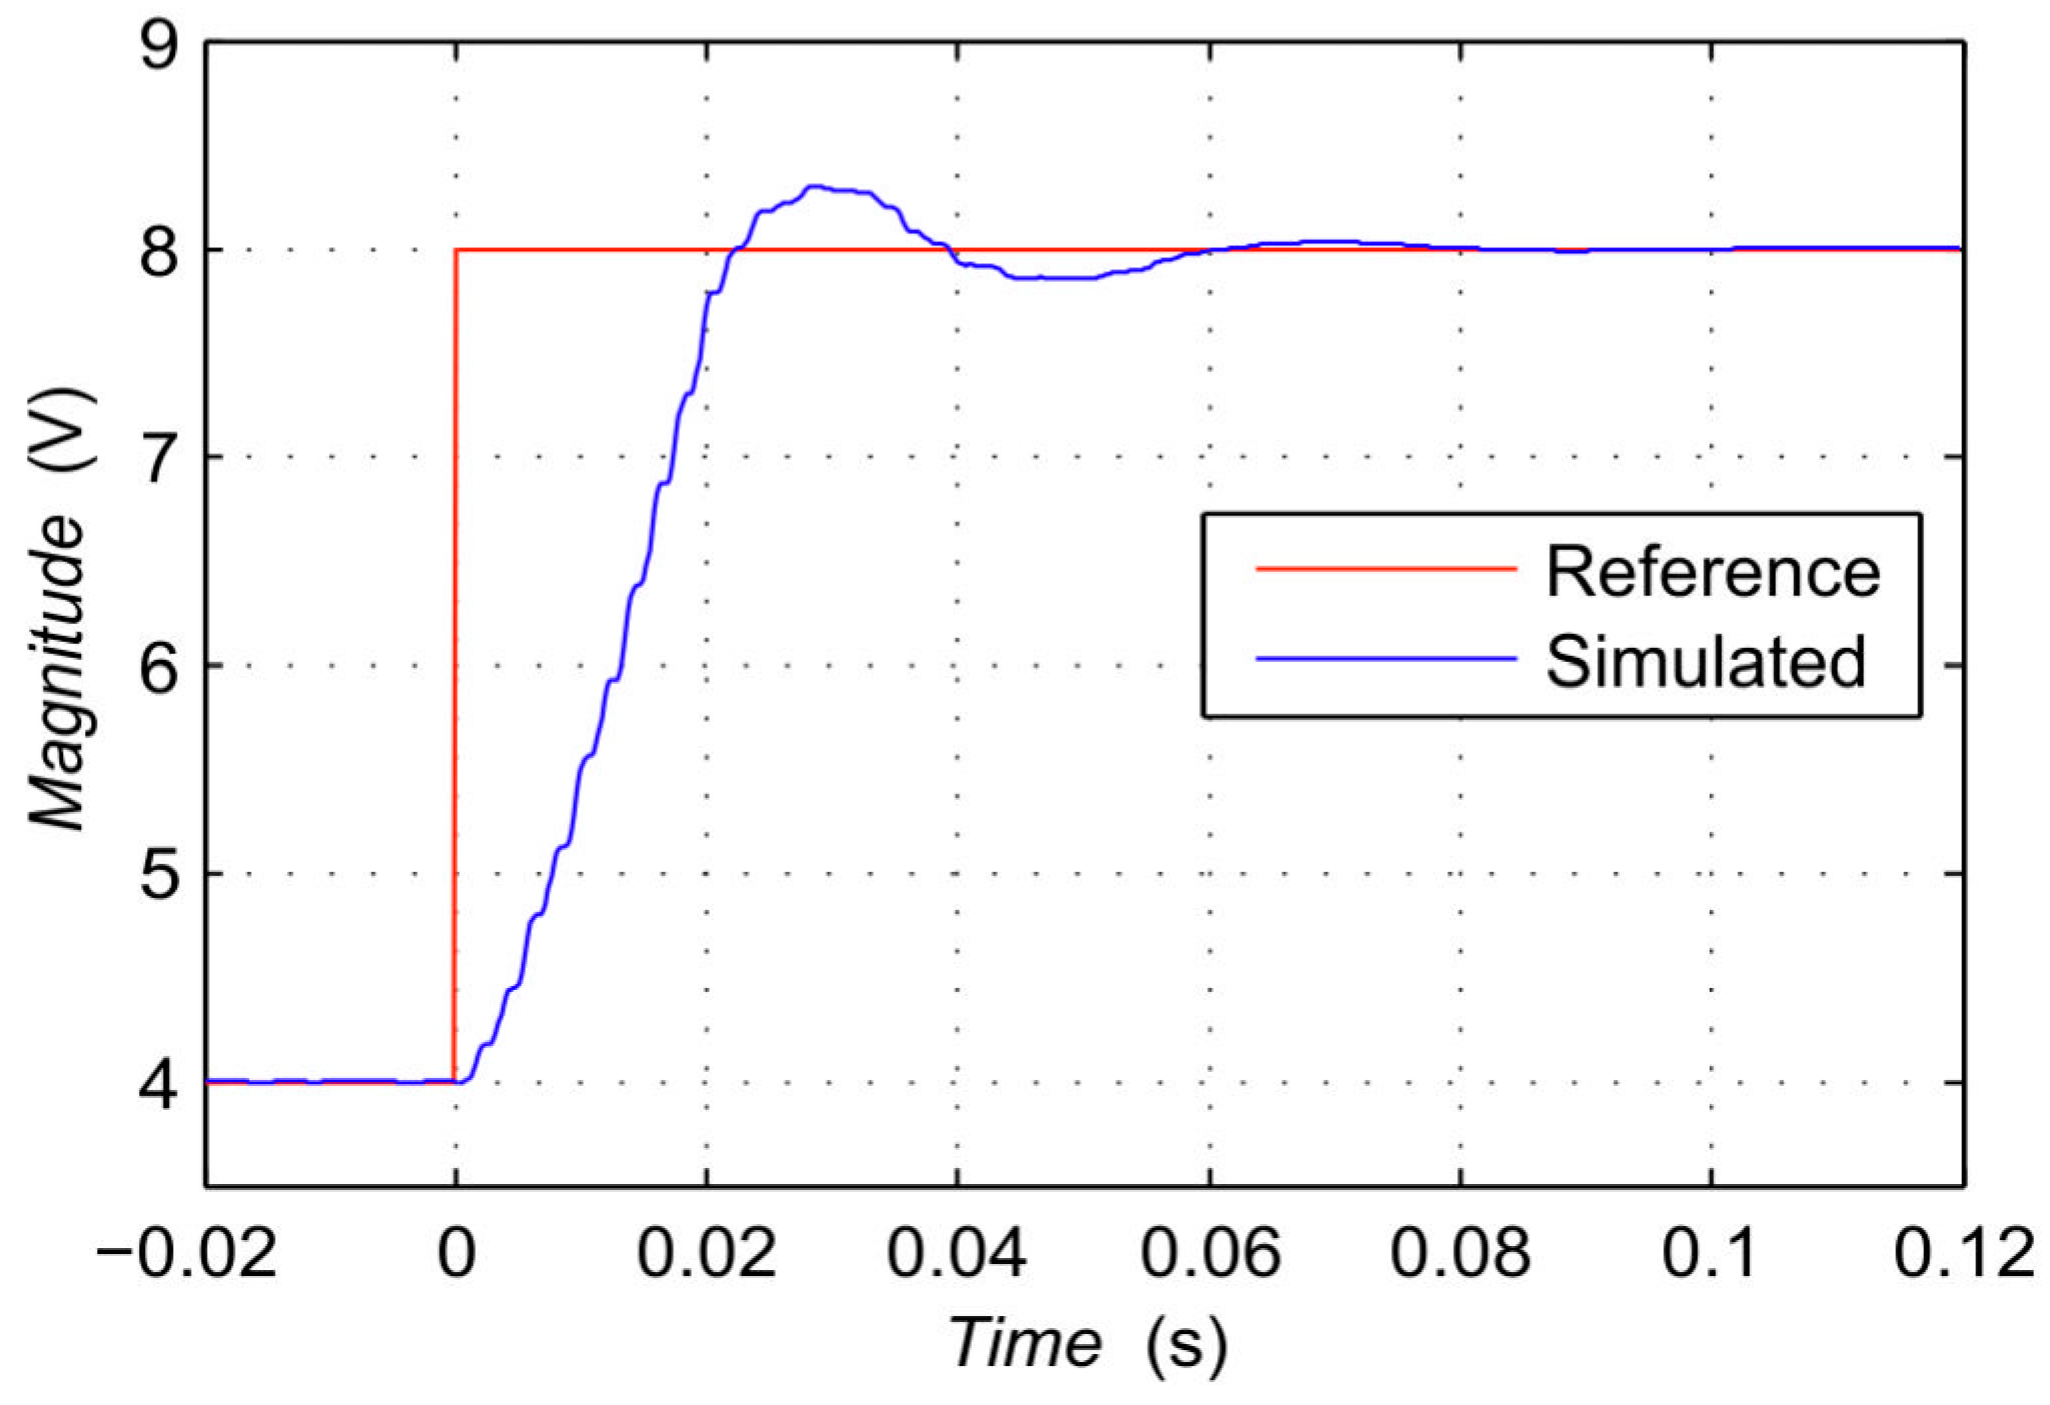
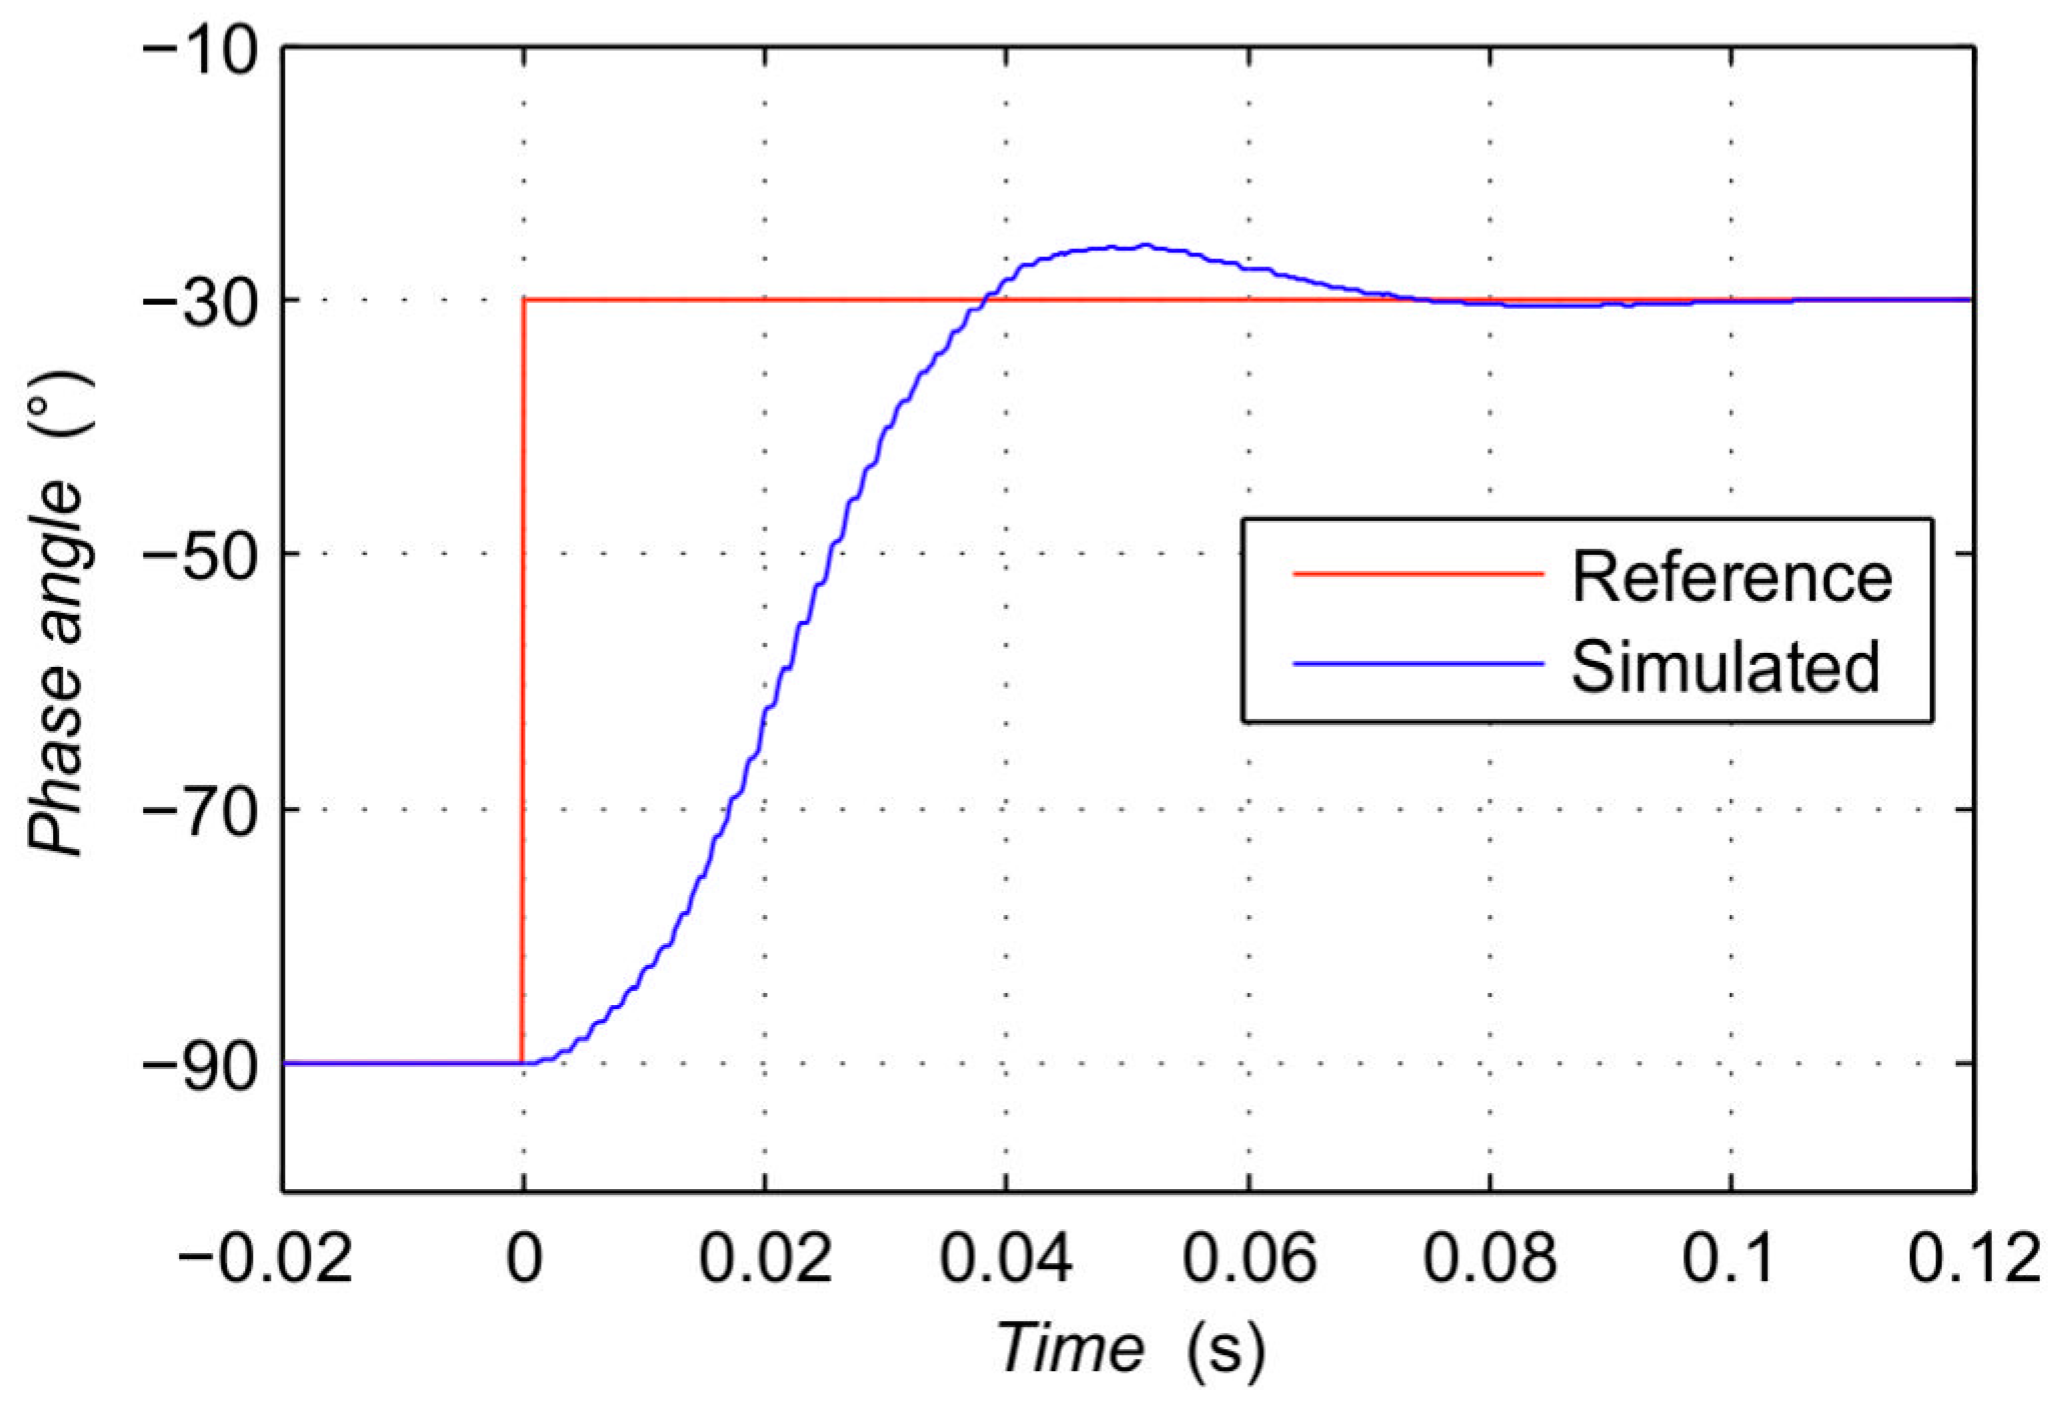
3. Simulation Results
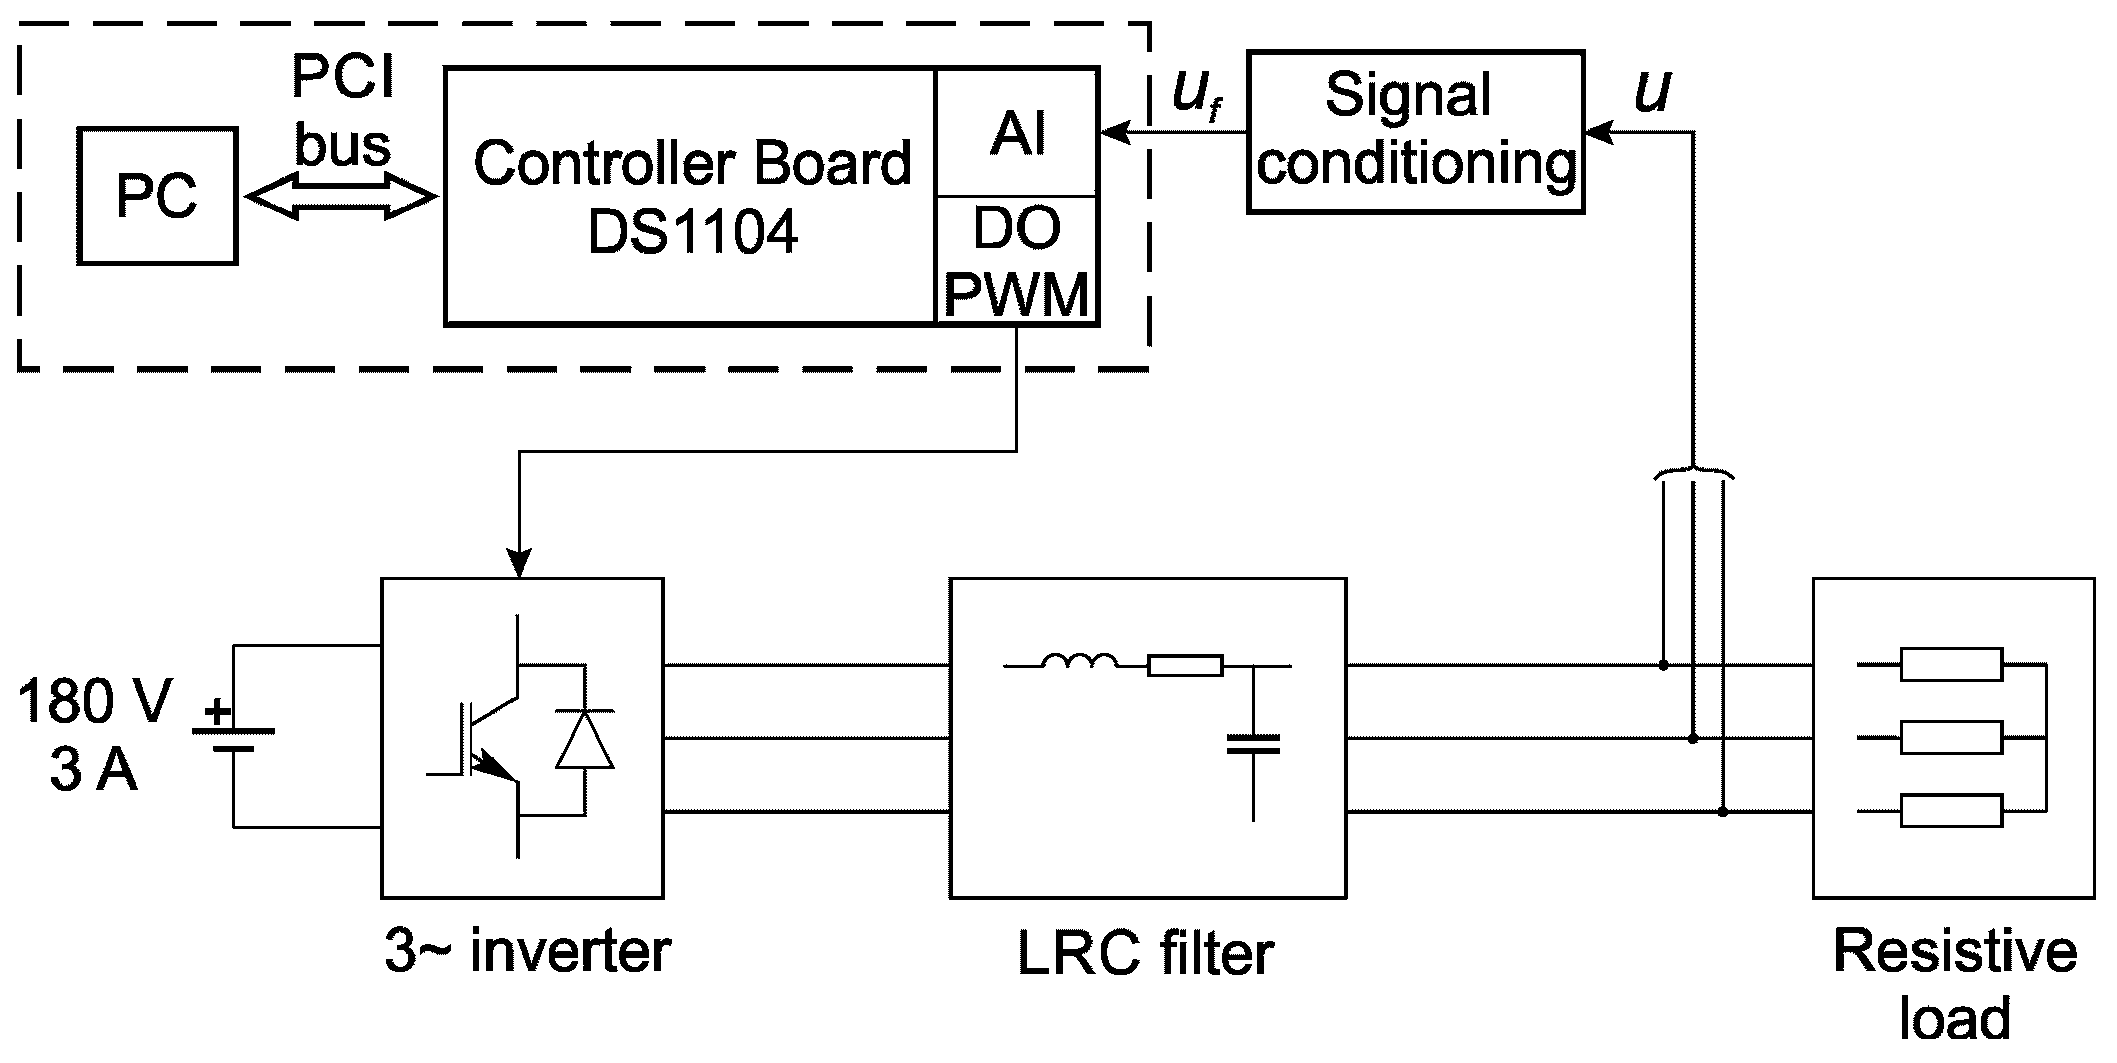
Firstly, the simulation model was developed in the MATLAB-Simulink environment to emulate the test setup and to study the system behavior. The simulation model consists of signal generation, control, and a measurement section described in the previous chapter and power section that is implemented in the PLECS Blockset software package (Ver 3.6.9, Plexim GmbH, Zurich, Switzerland). In comparison to the Simulink software package, PLECS facilitates modeling and simulation of power electronic systems. Control, measurement, signal generation, and signal processing sections are exactly the same in simulation and in the program implemented on dSPACE hardware. For this reason, the simulation model closely emulates real test setup (as it is experimentally confirmed in the following sections), i.e., we were able to produce voltage waveform consisting of the fundamental 5th and 7th harmonics of various magnitudes and phase angles. Certain particularities associated with hardware nonlinearity can be observed in measured magnitudes and phase angles during laboratory testing, but that will be explained in the next section.
In this section, behavior of regulation loops is studied, i.e., the response to reference change of certain harmonic parameters are presented. Figure 4 displays the 5th harmonic magnitude response while Figure 5 shows the 7th harmonic phase angle response to the step reference change, respectively. From these two figures one can see that the PI controllers are well tuned and that the 7th harmonic phase angle is reaching steady state slower than the 5th harmonic magnitude. This is the direct consequence of the larger delay introduced by the LRC filter in regulation loops, especially for voltage higher harmonics, which can be easily verified by plotting Bode phase diagram of the system shown in Figure 1. It should be emphasized that in this study the PI controller parameters were tuned using the trial and error approach.

4. Laboratory Setup

Laboratory test setup is shown in Figure 6 [22]. The power stage consists of three-phase IGBT inverter, DC supply, LRC filter, and three-phase wye connected resistors. DC link bus is supplied via 180 V, 3 A linear voltage source. The DC link voltage can be set to any desired value, but in this study, it was limited to 180 V. This is due to the fact that the transformers secondary line-line voltages are usually limited to 110 V, which is taken into account when selecting the modulation index value in order to assure operation in the PWM linear range. LRC filter components were chosen to reduce magnitudes of the voltage harmonics above switching frequency to less than 0.1 % of the fundamental harmonic full-scale range. Their values are: L = 3.6 mH, C = 30 µF, R = 12 Ω. Load resistance was set to 100 Ω. Line-line voltage was obtained using the 25 MHz bandwidth differential probe [23].

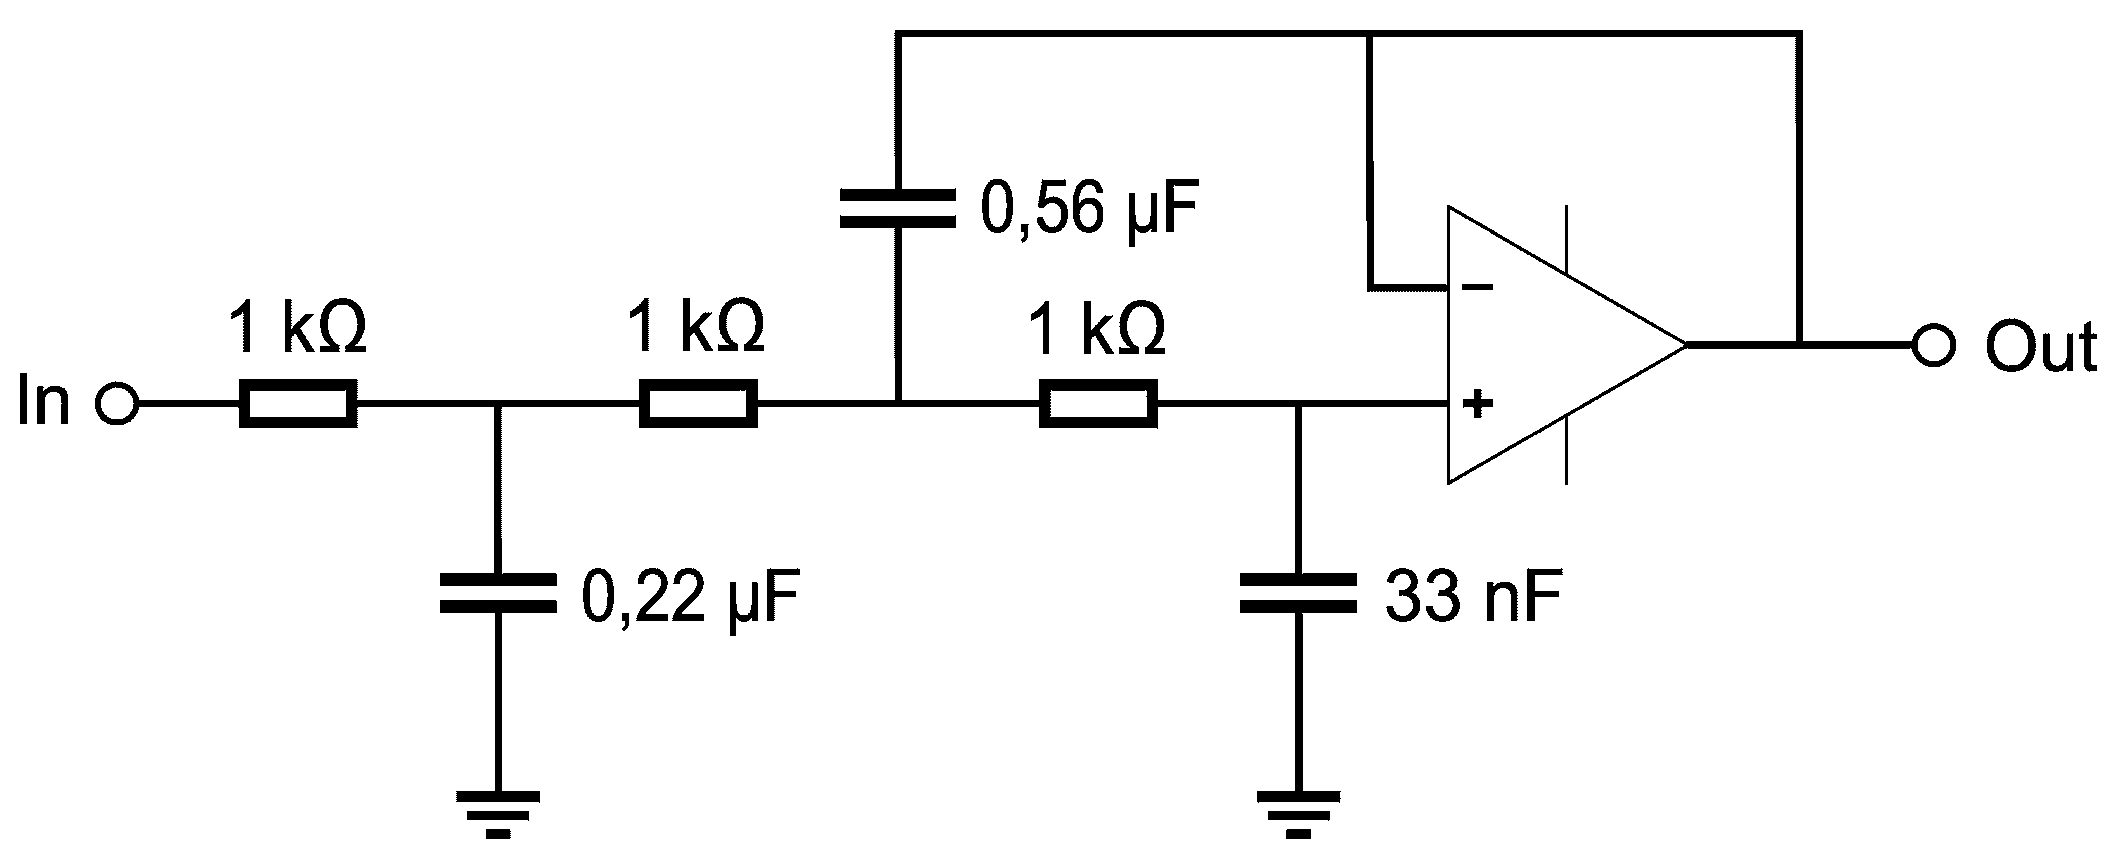
4.1. Anti-Aliasing Filter
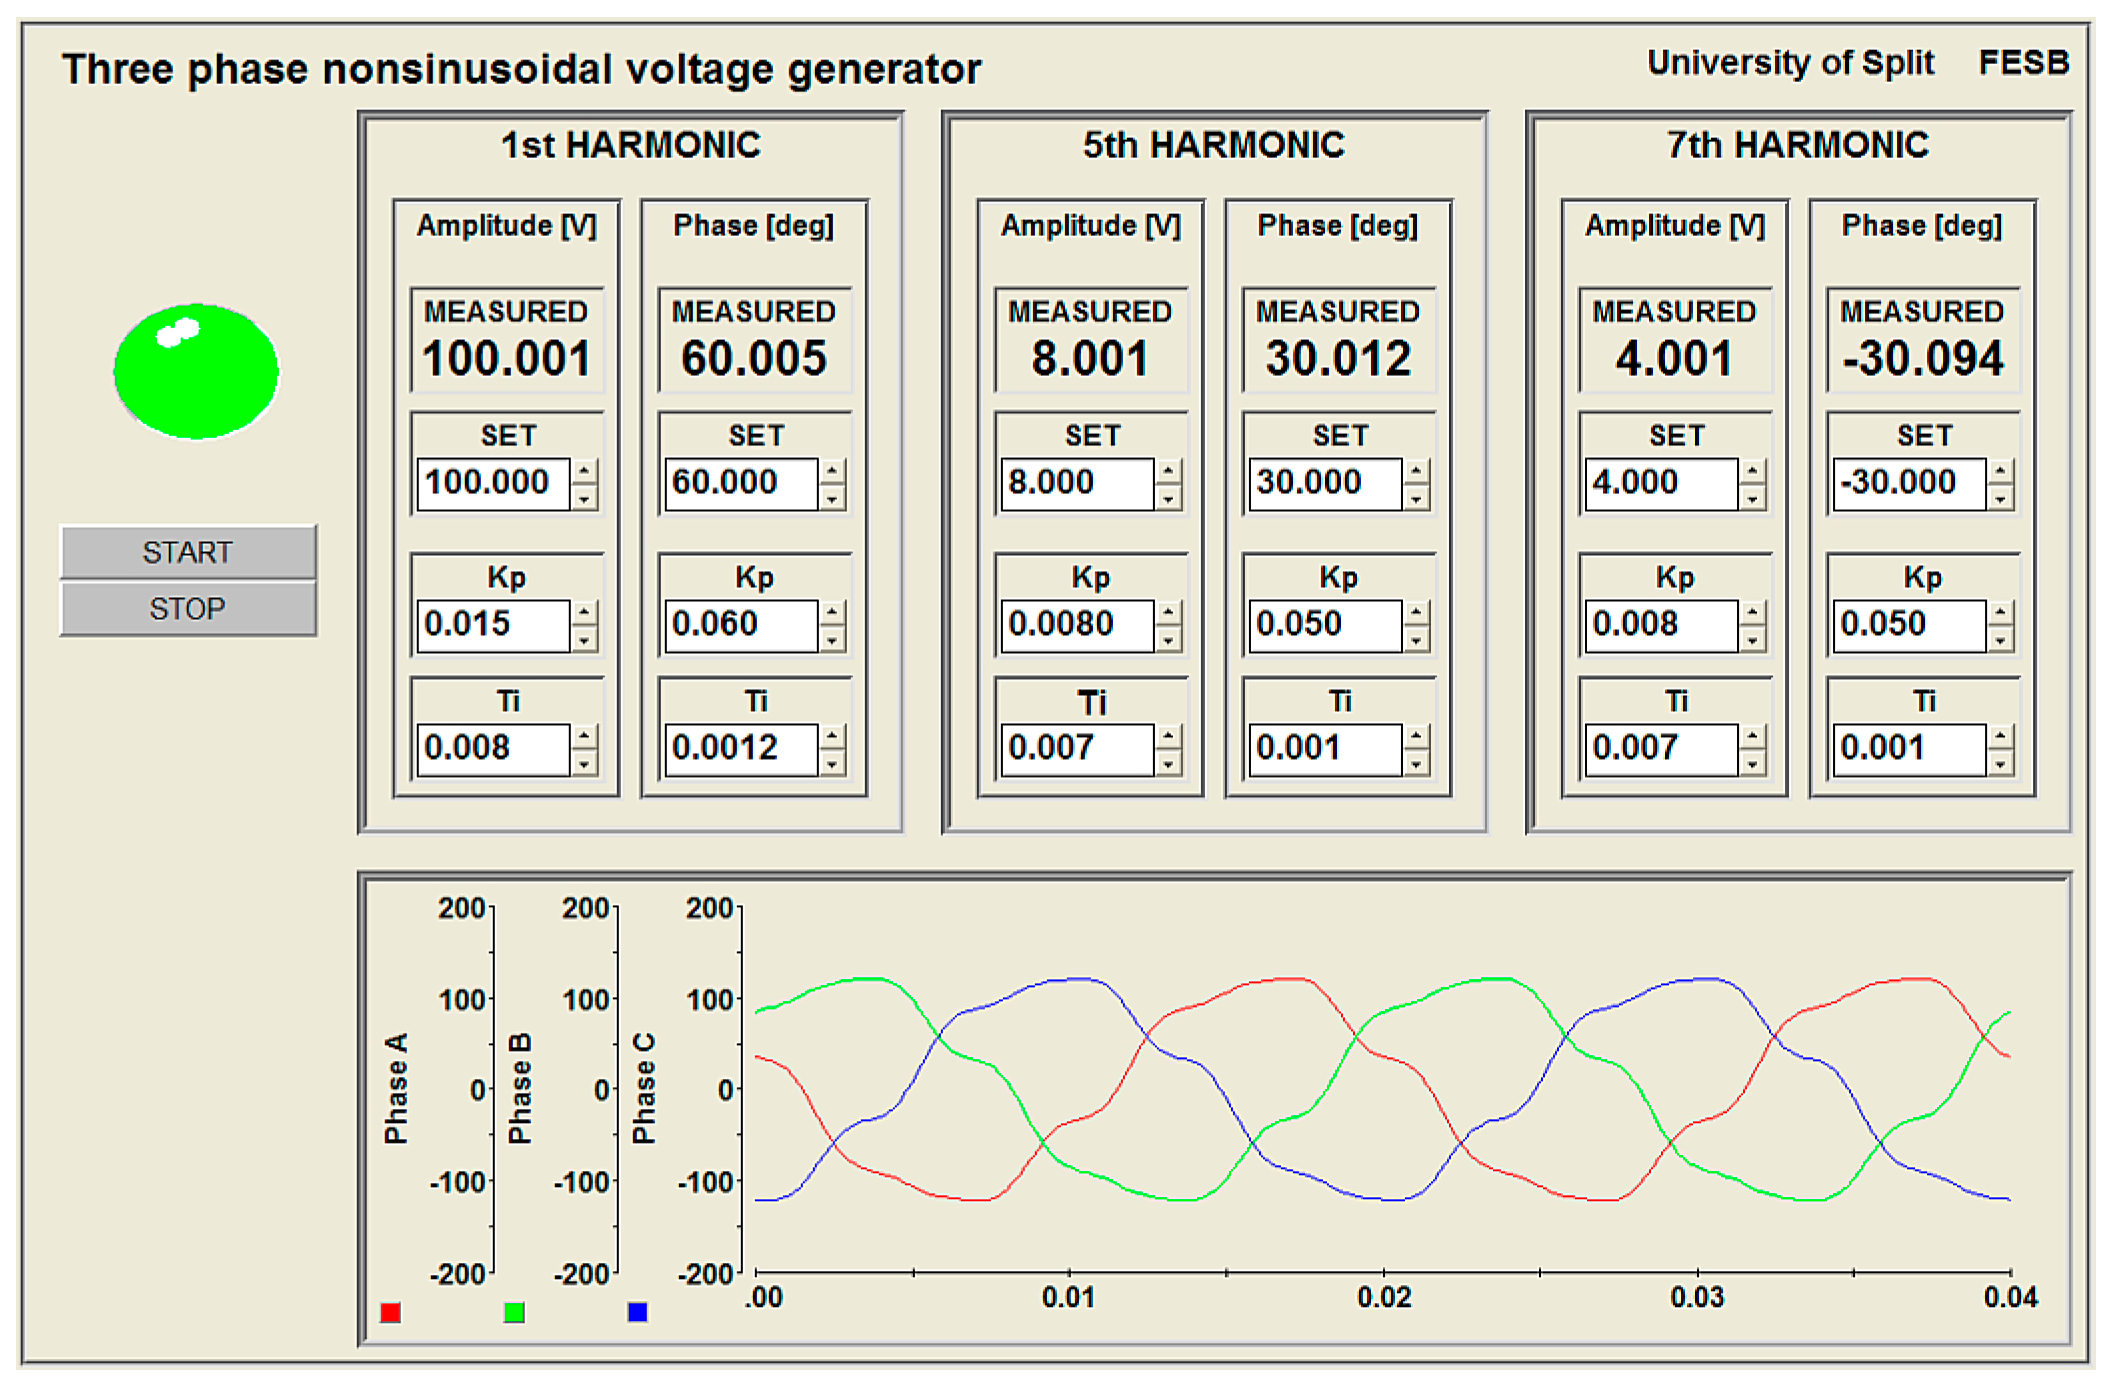
Measured voltage signal was led to the anti-aliasing filter shown in Figure 1, which restricts bandwidth of the input signal thus that Nyquist sampling theorem is fulfilled. As already stated, algorithm sampling frequency, i.e., execution frequency is the same as the PWM frequency and it is equal to 5 kHz. Thus, to prevent the aliasing effect, a low-pass filter was introduced to attenuate spectral lines above Nyquist frequency, which is equal to half of the sampling frequency. Butterworth third order active low-pass filter, designed according to the unity-gain three-pole configuration, meets the following requirements: –3 dB cutoff frequency at 1 kHz and minimum –40 dB stopband attenuation at 5 kHz [24]. Filter frequency response is shown in Figure 7, while Figure 8 shows the filter and exact values of individual components used.
The third order Butterworth filter with defined specifications is sufficient for attenuation of voltage higher harmonics, because the LRC filter connected at the inverter output is the first step in the harmonic’s attenuation process. The transfer function in s-domain of the normalized three-pole filter is given by Equation (5). The known transfer function enables compensation of magnitude change and phase angle delay that is introduced by the anti-aliasing filter.
H ( s ) = 1 0.9991 s 3 + 1.9989 s 2 + 1.9992 s + 1 ,

4.2. ControlDesk

The host PC was equipped with a DS1104 Controller Board with 100 digital and analog I/O ports [22]. In this experiment three analog inputs (12-bit resolution, ±10 V input range) and six digital outputs (TTL logic) were used. Easy access to this I/O is provided with CLP1104 Connector Panel.
The ControlDesk (Ver 3.3, dSPACE GmbH, Paderborn, Germany) is dSPACE experiment software for the electronic control unit (ECU) development. After generating a real-time application in the Simulink environment, program code was downloaded to the DS1104 Controller Board and real-time experiments were performed with ControlDesk [19].
Graphical user interface (GUI) designed in ControlDesk is displayed in Figure 9. It enables real-time monitoring of voltage harmonics, adjusting magnitude, and phase reference values of voltage harmonics and tuning PI controllers’ parameters.

5. Algorithm Optimization

In the second section of this paper the principle of operation and main parts of the control algorithm have been presented. However, because of implementation of this program in real time, certain particularities will be introduced and highlighted. Namely, most programs designed in dSPACE can be divided into two parts. The first part is executed in embedded DSP synchronously with the DS1104 controller board analog and digital I/O peripherals. The second part usually serves for visualization purposes and communication with GUI. The latter is usually executed within the Master PPC part of DS1104 controller board.
The key parts of the algorithm (voltage measurement, discrete Fourier transform, and control signals generation) are placed into the DSP subsystem whose execution is triggered with the PWM interrupt signal. Their execution is synchronized with the PWM interrupt signal, thus program code must be executed within one period of the PWM interrupt signal. The frequency of the PWM interrupt signal is obviously the same as the PWM switching frequency, i.e., period of the PWM interrupt is equal to Ts. Sample time was set to 200 µs, thus according to reference (2), one period of fundamental voltage harmonic is described with 100 equally spaced samples.
The main obstacle that we met in this work was the complexity of the program. For that reason, great attention was given to the optimization of the program code inside the triggered DSP subsystem.
DFT was only calculated for the fundamental, 5th and 7th harmonics, and not for the whole frequency range. Trigonometric functions used in the model (sine and cosine) were also computationally expensive thus certain approximations were introduced. Sine and cosine functions have been approximated in two ways, with lookup tables and reduced Taylor series. These simplifications expand functionality of the system and enable addition of other voltage higher harmonics in the described setup.
Moreover, 6 PI controllers were left out of the triggered subsystem to simplify the DSP program due to memory limitations. To avoid this obstacle, they were implemented within the Master PPC subsystem executed with the same sample time as DSP subsystem. It is important to note that the Master PPC subsystem does not guarantee determinism and synchronism with analog and digital I/O peripherals. Nevertheless, it is not of crucial importance for slow changing system variables observed in Figure 2.
PWM control signals are trigonometric functions of two or three parameters (for three-phase symmetric system) and can be simplified by using well known trigonometric identities. For instance, referent cosine signal for the second phase (L2) may be expressed as
cos ( x + φ 120 ° ) = cos ( x ) S 1 cos ( φ 120 ° ) M 1 sin ( x ) S 2 sin ( φ 120 ° ) M 2 ,
where x is the referent angle generated inside the triggered DSP subsystem and φ is the control angle obtained at the output of PI phase angle controller shown in Figure 2. Hence, S1 and S2 are calculated inside the triggered subsystem while M1 and M2 are obtained from the Master PPC.

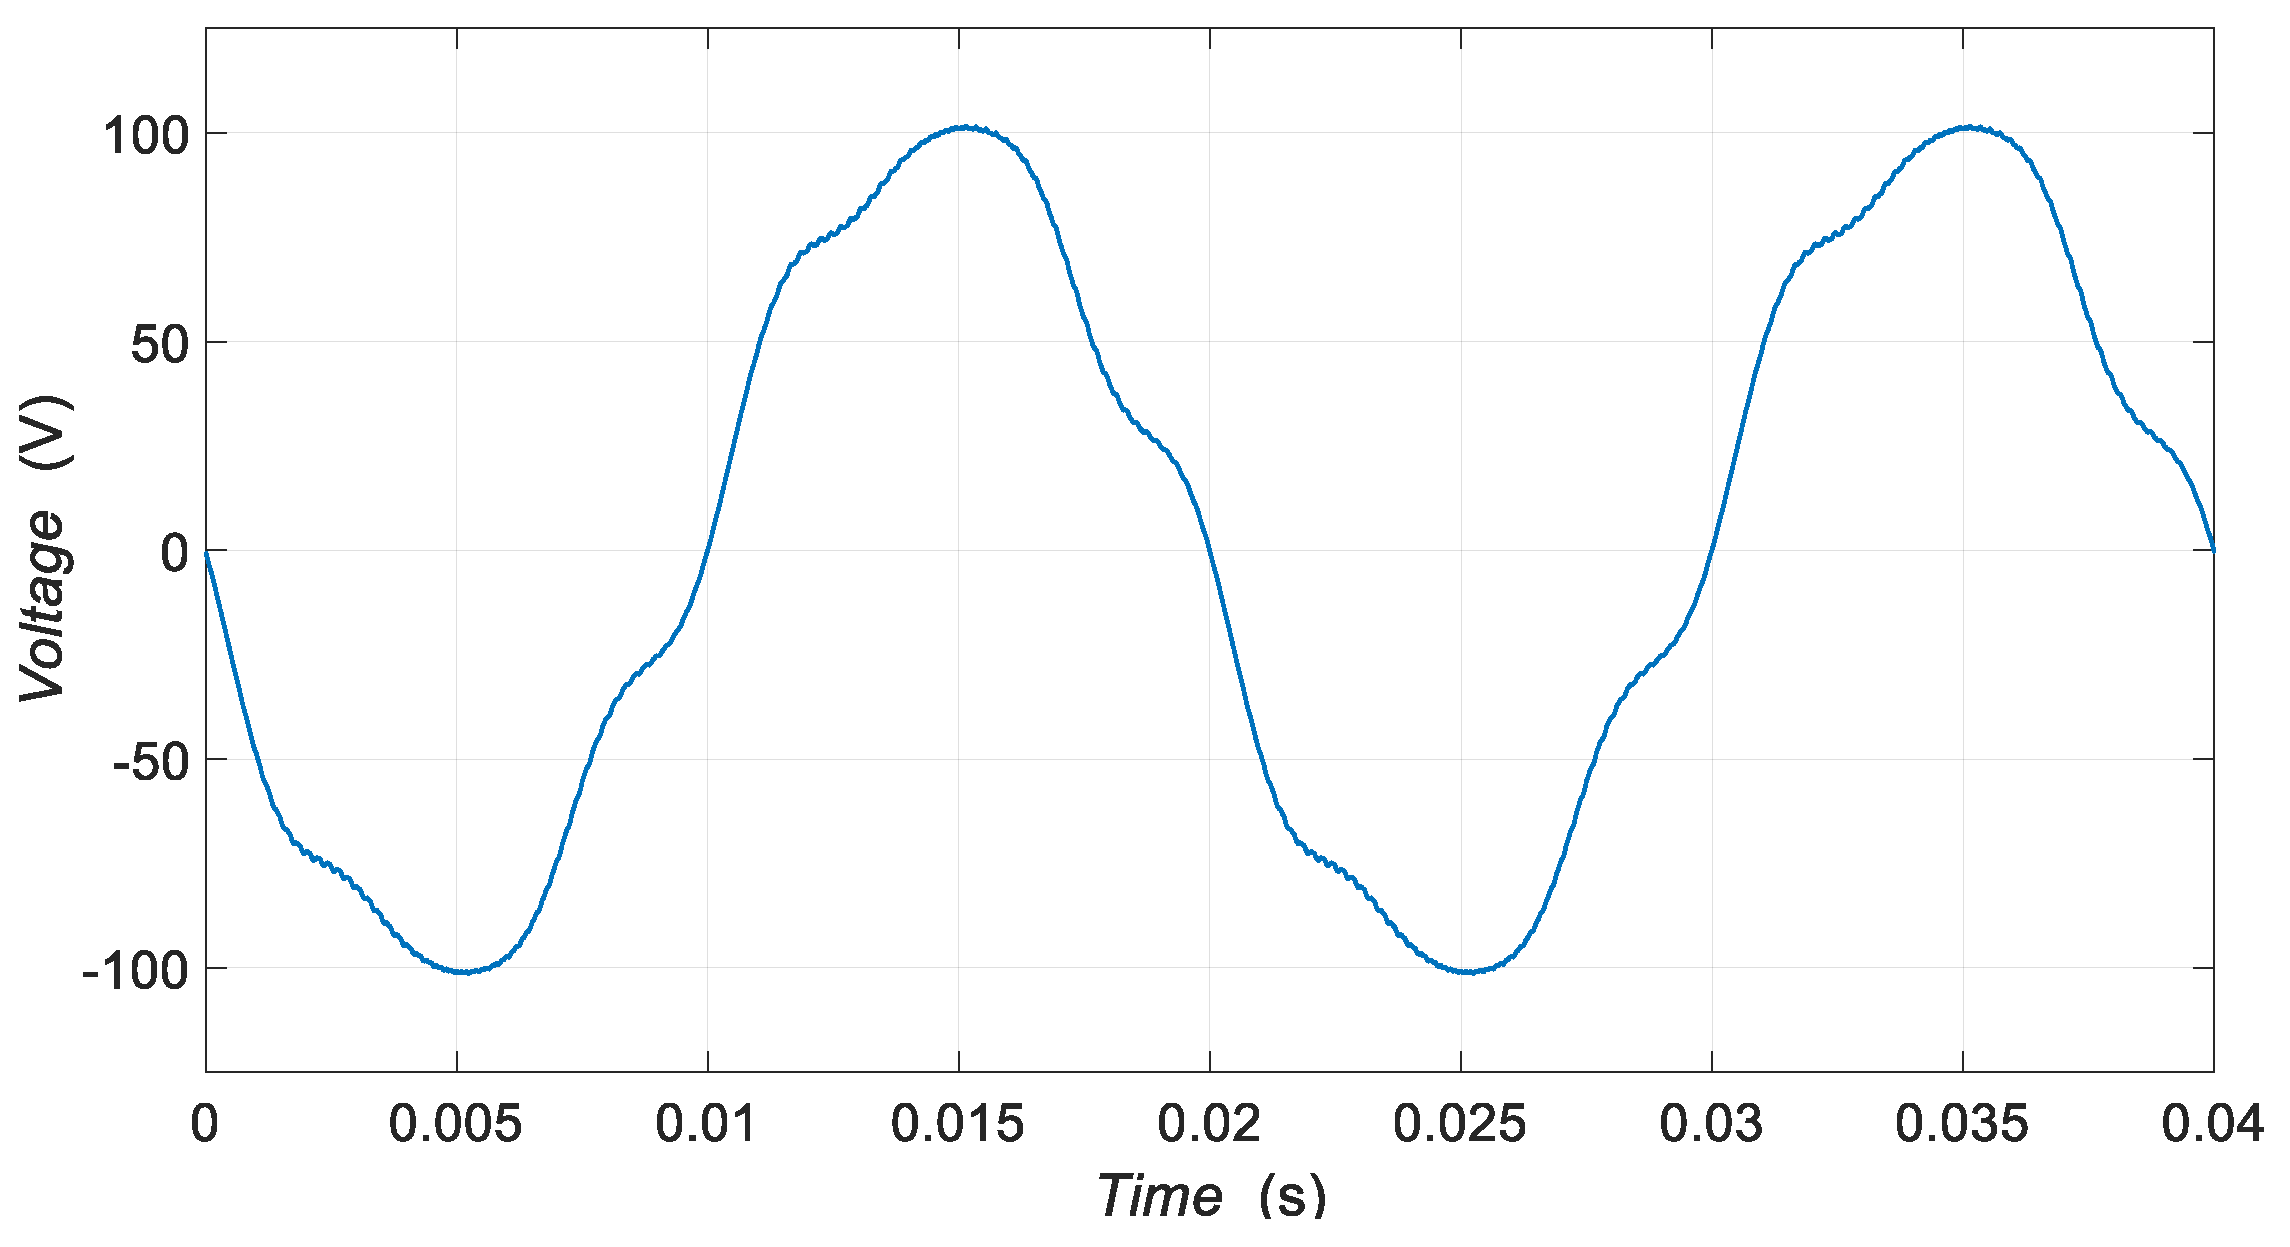
6. Experimental Results

Line-line voltage was measured with the differential probe and the measured data were processed in the MATLAB environment. Magnitude readings of three harmonics in the Simulink model (monitored in ControlDesk) were compared to the calibrated Hewlett-Packard 35665A Dynamic Signal Analyzer to compensate for the intrinsic offsets of the analog inputs of the DS1104 controller board. Furthermore, measurements were acquired for waveform visualization and validation with 14-bit, 250 MHz bandwidth and 500 MS/s digital USB oscilloscope type Handyscope HS5 manufactured by TiePie. Referent (distorted) line-line voltage, arbitrarily chosen, is shown in Figure 10.
Figure 11 shows the magnitude spectrum relative to the magnitude of the fundamental harmonic in log-log scale. It can be noticed that besides the 1st, 5th, and 7th harmonics as well as the first switching harmonics in the vicinity of 5 kHz, magnitudes of all other harmonics are below 0.1 % of the fundamental harmonic magnitude. The main reason why harmonics with magnitude less than 0.1 % of the fundamental harmonic magnitude are not considered is the 12-bit analog-to-digital (A/D) converter resolution of the DS1104 controller board. This is equivalent to the –60 dB and it is at least 10 dB greater than the noise floor. Higher accuracy and improved computational efficiency of presented calibrator can be achieved by replacing 12-bit with 24-bit A/D converters, using higher switching frequency and faster controllers based on the field programmable gate array (FPGA) technology, which is the objective of our future work. In this way, the calibrator will satisfy the requirements of Class A instruments [25].
Figure 12, Figure 13 and Figure 14 show histograms of magnitudes and phase angles of the fundamental, 5th and 7th harmonics. The red curve represents the normal distribution function fitted on the same data used for plotting histograms. Expectation (mean) and standard deviation of normal density function plotted in Figure 12, Figure 13 and Figure 14 are given in Table 1. Magnitude and phase angle mean values are also reference values defined by the user.
One can notice higher values for the standard deviations of the 5th and 7th harmonic phase angles that is caused by harmonic phase calculation. One must bear in mind that with the same sampling rate, the higher frequency signals inherently have a higher phase error margin. Obviously, this phase angle calculation principle will affect all the higher harmonics, i.e., their resolution will decrease, and the standard deviation will be slightly greater. Despite these limitations, PI controllers are well tuned, as can be concluded from Figure 12, Figure 13 and Figure 14. It has been shown that all the measurements are nearly normally distributed with stable mean and standard deviation values as given in Table 1.
The difference between the measured histogram and normal probability density function as well as the discrepancy between mean and mode values is assumed to be the consequence of intrinsic systematic errors (e.g., discrepancy between dSPACE and oscilloscope crystal clocks and A/D converters resolutions, IGBTs dead time, etc.) and they will be the subject of future investigations [26,27].

7. Conclusions

This paper has described a simple, original approach to the design of a three-phase generator of non-sinusoidal voltage waveforms. This generator can be used as a voltage calibrator of desired harmonic distortion for different electrical devices. In contrast to the common calibrators present in today’s market, which amplify low voltage signal obtained from the D/A board, this proposed calibrator consists of a three-phase IGBT inverter and LRC filter.
Voltage harmonics magnitude and phase angle closed control loops enable accurate and precise adjustment of waveform parameters. The IGBT’s control algorithm is easy to understand and it enables simple extension to the higher harmonics. The results obtained in this paper show benefits of the proposed calibrator and suggest further development of hardware and software. Some of these improvements involve developing a new power filter at the inverter output, testing new switching devices for the inverter and control algorithm upgrade for expanding calibrator functionality and computational efficiency.

Author Contributions

Conceptualization, G.P. and M.D.; investigation, J.A.B. and M.D.; methodology, G.P.; software, J.A.B. and G.M.; Validation, G.M.; visualization, J.A.B.; writing—original draft, G.P. and J.A.B.; writing—review and editing, G.M. and M.D.

Funding

This paper is fully supported by the Croatian Science Foundation under the project Metrological infrastructure for smart grid IP-2014-09-8826.

Conflicts of Interest

The authors declare no conflict of interest.

References

  1. Sharma, K.; Saini, L.M. Performance analysis of smart metering for smart grid: An overview. Renew. Sustain. Energy Rev. 2015, 49, 720–735. [Google Scholar] [CrossRef]
  2. Arseneau, R.; So, E. Calibration services in support of smart grid applications. In Proceedings of the Power and Energy Society General Meeting, San Diego, CA, USA, 22–26 July 2012. [Google Scholar] [CrossRef]
  3. Stifter, M.; Cordova, J.; Kazmi, J.; Arghandeh, R. Real-Time Simulation and Hardware-in-the-Loop Testbed for Distribution Synchrophasor Applications. Energies 2018, 11, 876. [Google Scholar] [CrossRef]
  4. Zhou, N.; Meng, D.; Huang, Z.; Welch, G. Dynamic State Estimation of a Synchronous Machine Using PMU Data—A Comparative Study. IEEE Trans. Smart Grid 2015, 6, 450–460. [Google Scholar] [CrossRef]
  5. Klaric, M.; Kuzle, I.; Holjevac, N. Wind Power Monitoring and Control Based on Synchrophasor Measurement Data Mining. Energies 2018, 11, 3525. [Google Scholar] [CrossRef]
  6. Directive 2014/32/EU of the European Parliament and of the Council, Official Journal of the European Union. March 2014. Available online: https://eur-lex.europa.eu/legal-content/EN/TXT/HTML/?uri=CELEX: 32014L0032&qid=1484670008365&from=EN (accessed on 22 May 2019).
  7. Faifer, M.; Ottoboni, R.; Toscani, S.; Cherbaucich, C.; Mazza, P. Metrological characterization of a signal generator for the testing of medium-voltage measurement transducers. IEEE Trans. Instr. Meas. 2015, 64, 1837–1846. [Google Scholar] [CrossRef]
  8. Aristoy, G.; Trigo, L.; Santos, A.; Brehm, M.; Slomovitz, D. Measuring system for calibrating high voltage instrument transformers at distorted waveforms. In Proceedings of the Conference on Precision Electromagnetic Measurements (CPEM), Ottawa, ON, Canada, 10–15 July 2016. [Google Scholar] [CrossRef]
  9. Hwang, Y.-S.; Shen, J.-H.; Chen, J.-J.; Fan, M.-R. A THD-reduction high efficiency audio amplifier using inverter-based OTAs with filter-output feedback. Microelectron. J. 2013, 45, 102–109. [Google Scholar] [CrossRef]
  10. Jasielski, J.; Kuta, S.; Machowski, W.; Kolodziejski, W. Hybrid DPWM implementation using coarse and fine programmable ADLL. Microelectron. J. 2014, 45, 1202–1211. [Google Scholar] [CrossRef]
  11. Topalis, F.V.; Gonos, I.F.; Vokas, G.A. Arbitrary waveform generator for harmonic distortion tests on compact fluorescent lamps. Measurement 2001, 30, 257–267. [Google Scholar] [CrossRef]
  12. Manito, A.; Bezerra, U.; Tostes, M.; Matos, E.; Carvalho, C.; Soares, T. Evaluating Harmonic Distortions on Grid Voltages Due to Multiple Nonlinear Loads Using Artificial Neural Networks. Energies 2018, 11, 3303. [Google Scholar] [CrossRef]
  13. Aurilio, G.; Gallo, D.; Landi, C.; Luiso, M. AC electronic load for on-site calibration of energy meters. In Proceedings of the IEEE International Instrumentation and Measurement Technology Conference (I2MTC), Minneapolis, MN, USA, 6–9 May 2013; pp. 768–773. [Google Scholar] [CrossRef]
  14. Amicone, D.; Bernieri, A.; Ferrigno, L.; Laracca, M. A smart add-on device for the remote calibration of electrical energy meters. In Proceedings of the IEEE International Instrumentation and Measurement Technology Conference (I2MTC), Singapore, 5–7 May 2009; pp. 1599–1604. [Google Scholar] [CrossRef]
  15. Georgakopoulos, D.; Wright, P.S. Calibration of energy and power meters under non-sinusoidal conditions. IEE Proc.-Sci. Meas. Technol. 2006, 153, 241–247. [Google Scholar] [CrossRef] [Green Version]
  16. Montano, J.C.; Leon, C.; Garcia, A.; Lopez, A.; Monedero, I.; Personal, E. Random generation of arbitrary waveforms for emulating three-phase systems. IEEE Trans. Ind. Electr. 2012, 59, 4032–4040. [Google Scholar] [CrossRef]
  17. Delle Femine, A.; Gallo, D.; Landi, C.; Luiso, M. Advanced instrument for field calibration of electrical energy meters. IEEE Trans. Instr. Meas. 2009, 58, 618–625. [Google Scholar] [CrossRef]
  18. Slomovitz, D.; Trigo, L. A power standard system for calibration of power analyzers. In Proceedings of the IEEE PES Innovative Smart Grid Technologies (ISGT LATAM), Montevideo, Uruguay, 5–7 October 2015. [Google Scholar] [CrossRef]
  19. First Work Steps; dSPACE GmbH: Paderborn, Germany, 2007.
  20. Sundararajan, D. The Discrete Fourier Transform: Theory, Algorithms and Applications; World Scientific Pub Co Inc.: Singapore, 2001; pp. 31–66. [Google Scholar]
  21. Holmes, D.G.; Lipo, T.A. Pulse Width Modulation for Power Converters; IEEE Press: Piscataway, NJ, USA, 2003; pp. 95–337. [Google Scholar]
  22. Bosnic, J.A.; Despalatovic, M.; Petrovic, G.; Majic, G. Three-phase programmable sinusoidal voltage generator. In Proceedings of the 1st International Colloquium Smart Grid Metrology, Split, Croatia, 24–27 April 2018. [Google Scholar]
  23. TA057. Pico Technology: Cambridgeshire, UK. Available online: https://www.picoauto.com/products/electric-and-hybrid-vehicle/25-mhz-1400-v-differential-oscilloscope-probe-x20-x200 (accessed on 15 April 2019).
  24. Williams, A.; Taylor, F. Electronic Filter Design Handbook; McGraw-Hill: New York, NY, USA, 2006; pp. 9–441. [Google Scholar]
  25. Electromagnetic compatibility (EMC)—Part 4-30: Testing and measurement techniques—Power quality measurement methods, IEC 61000-4-30. 2015. Available online: https://webstore.iec.ch/publication/21844 (accessed on 22 May 2019).
  26. Majic, G.; Despalatovic, M.; Verunica, K. Influence of dead time on voltage harmonic spectrum of grid-connected PWM-VSC with LCL filter. In Proceedings of the 10th International Conference on Compatibility, Power Electronics and Power Engineering (CPE-POWERENG), Bydgoszcz, Poland, 29 June–1 July 2016; pp. 228–233. [Google Scholar] [CrossRef]
  27. Majic, G.; Despalatovic, M.; Terzic, B. LCL Filter Design Method for Grid-Connected PWM-VSC. J. Electr. Eng. Technol. 2017, 12, 1945–1954. [Google Scholar] [CrossRef]
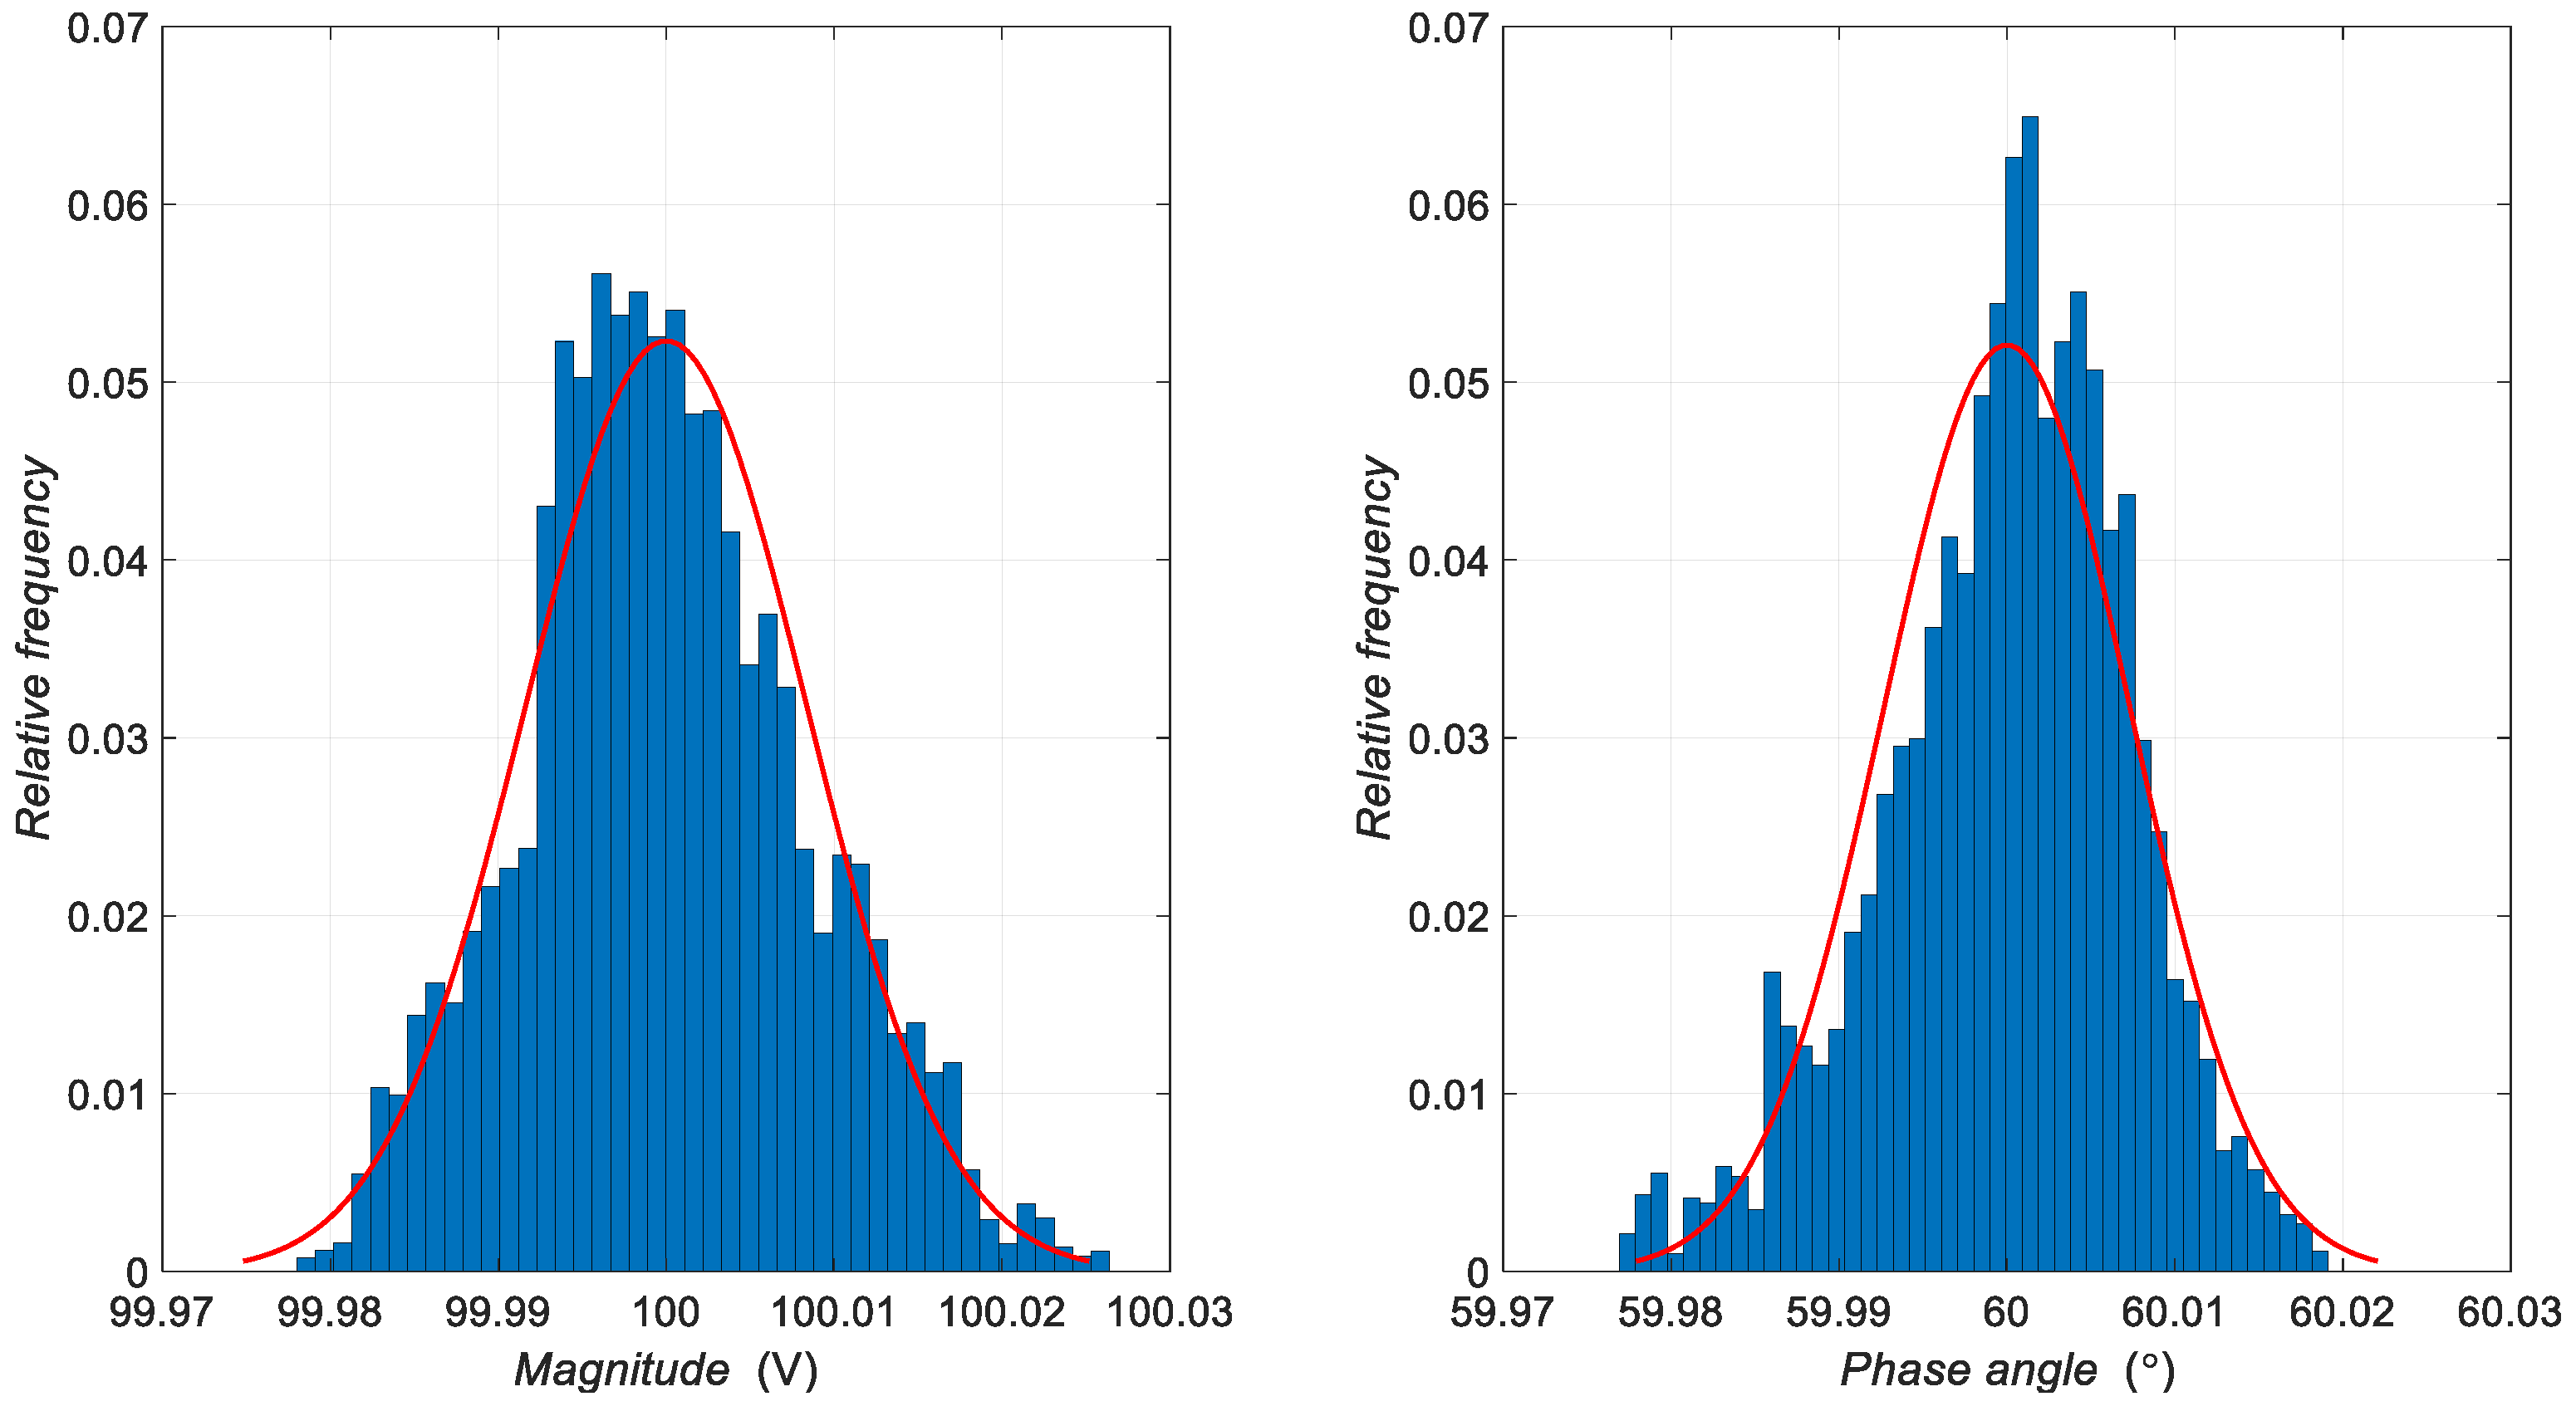
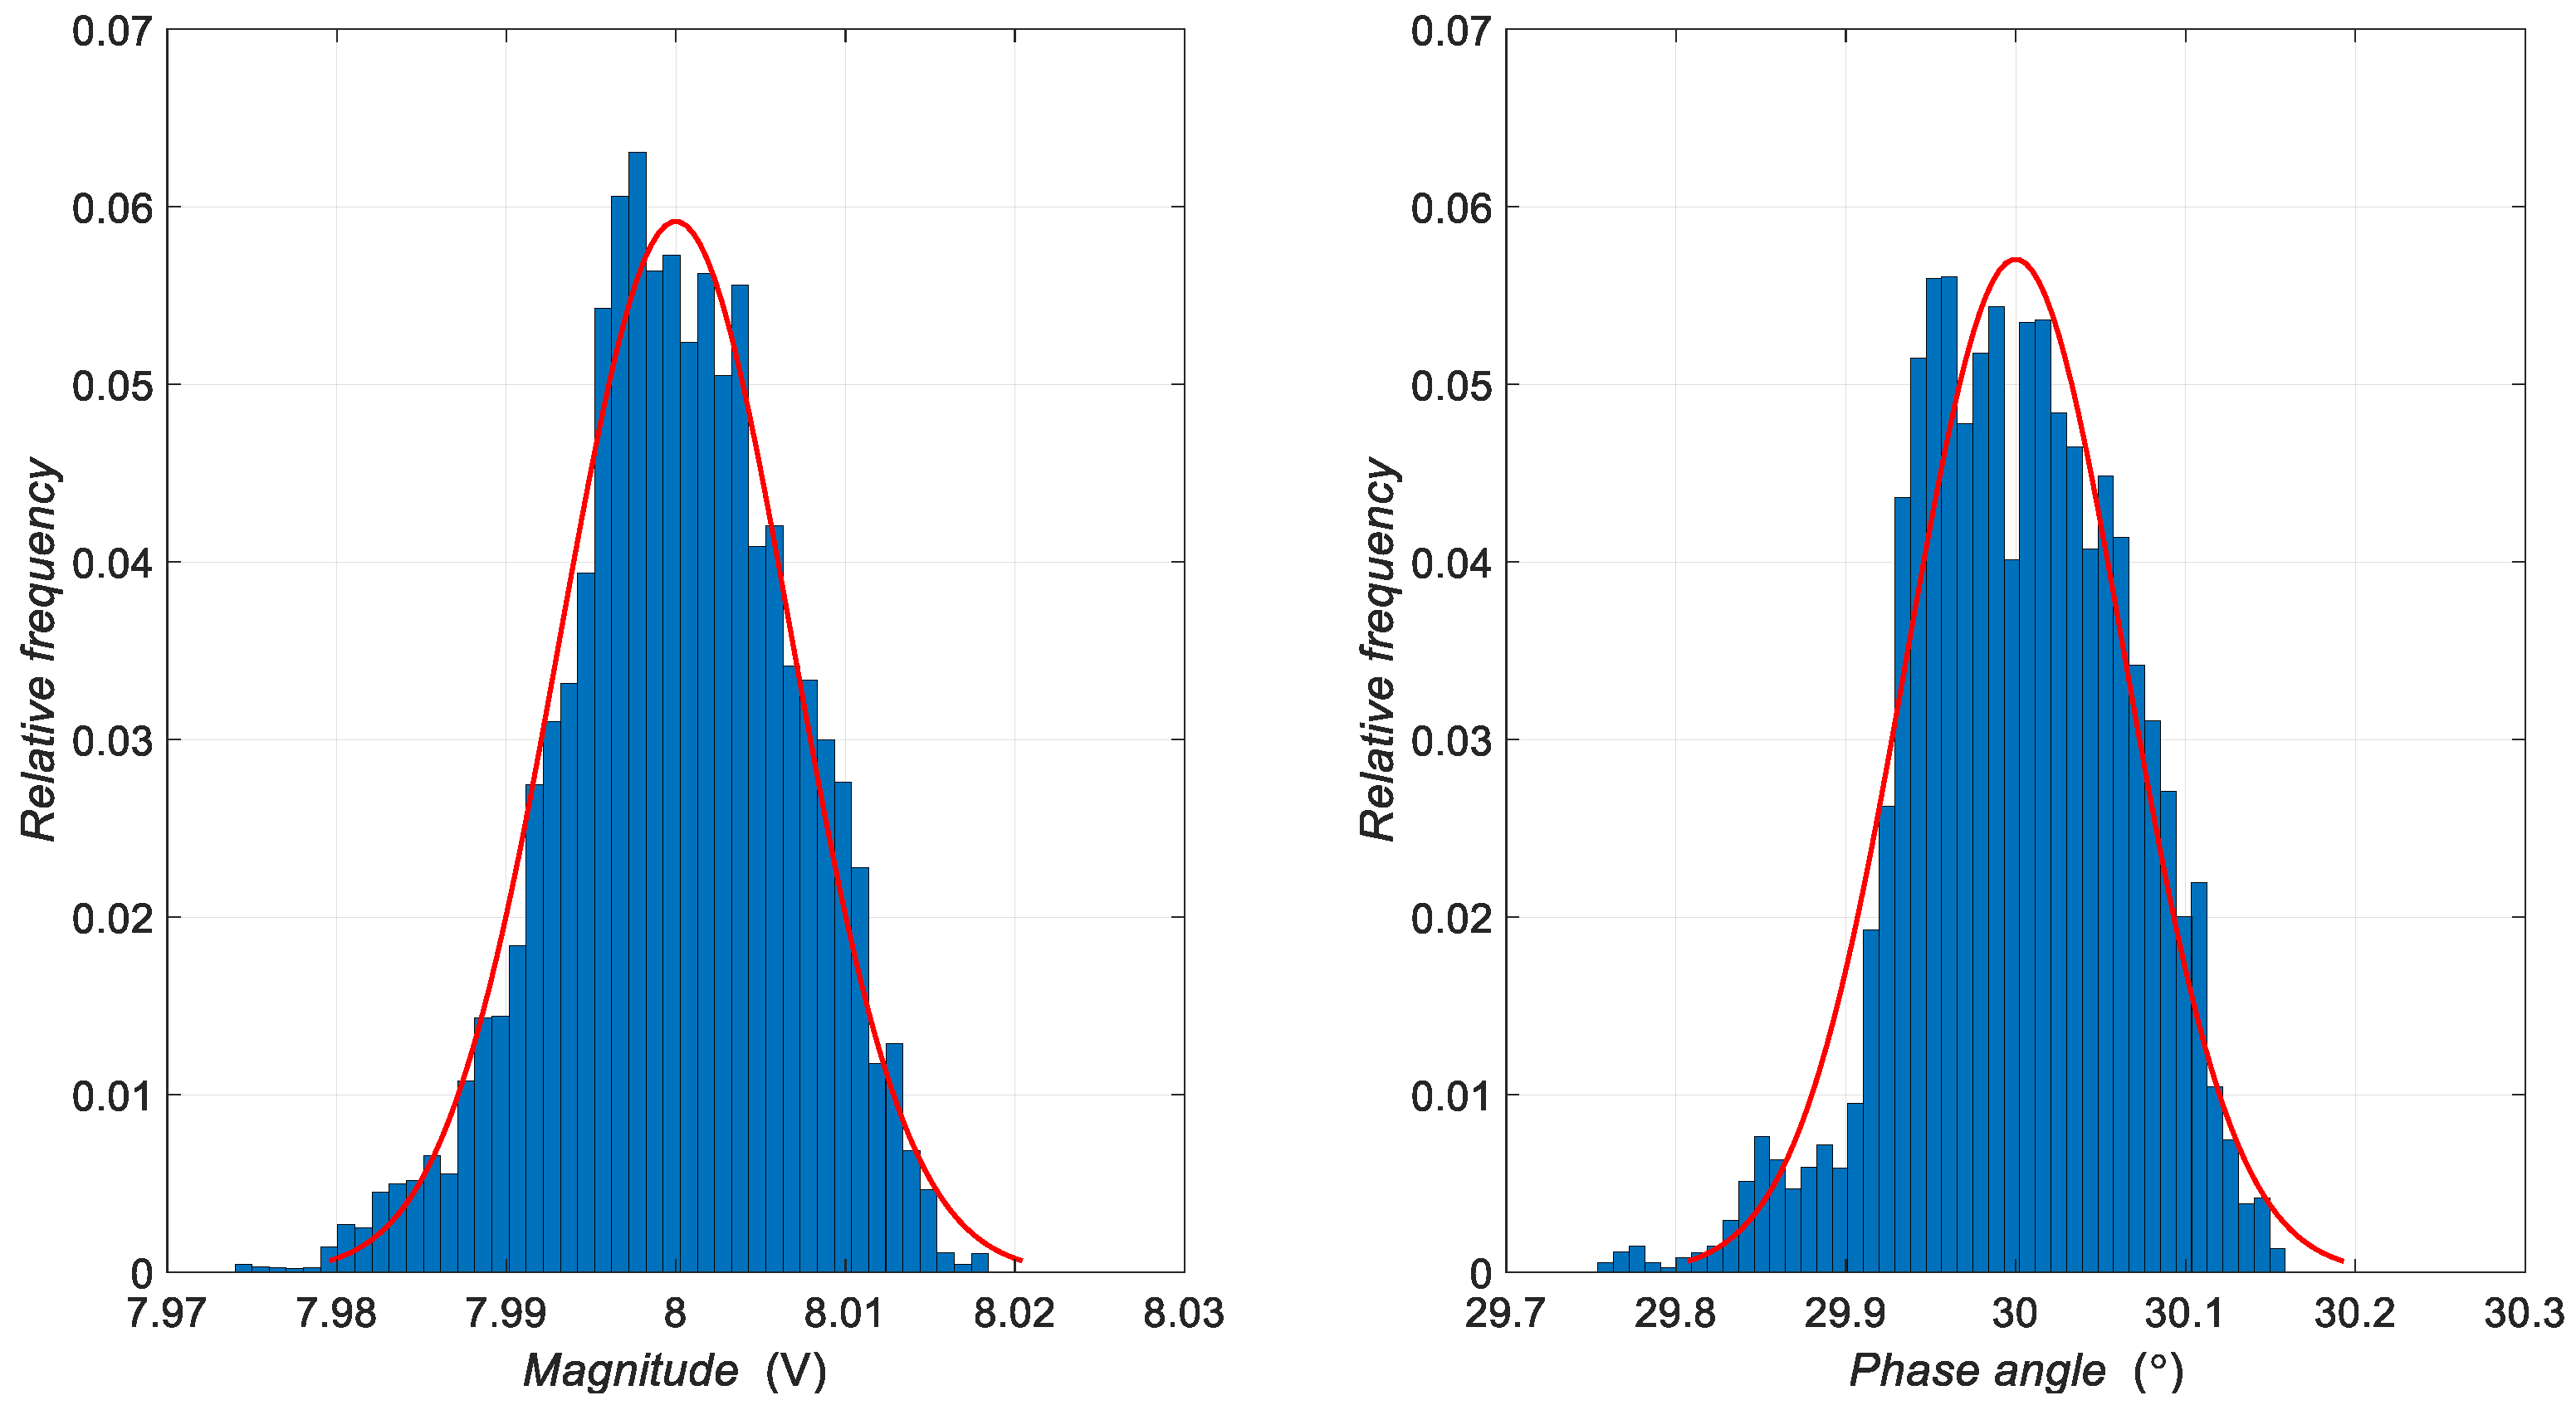
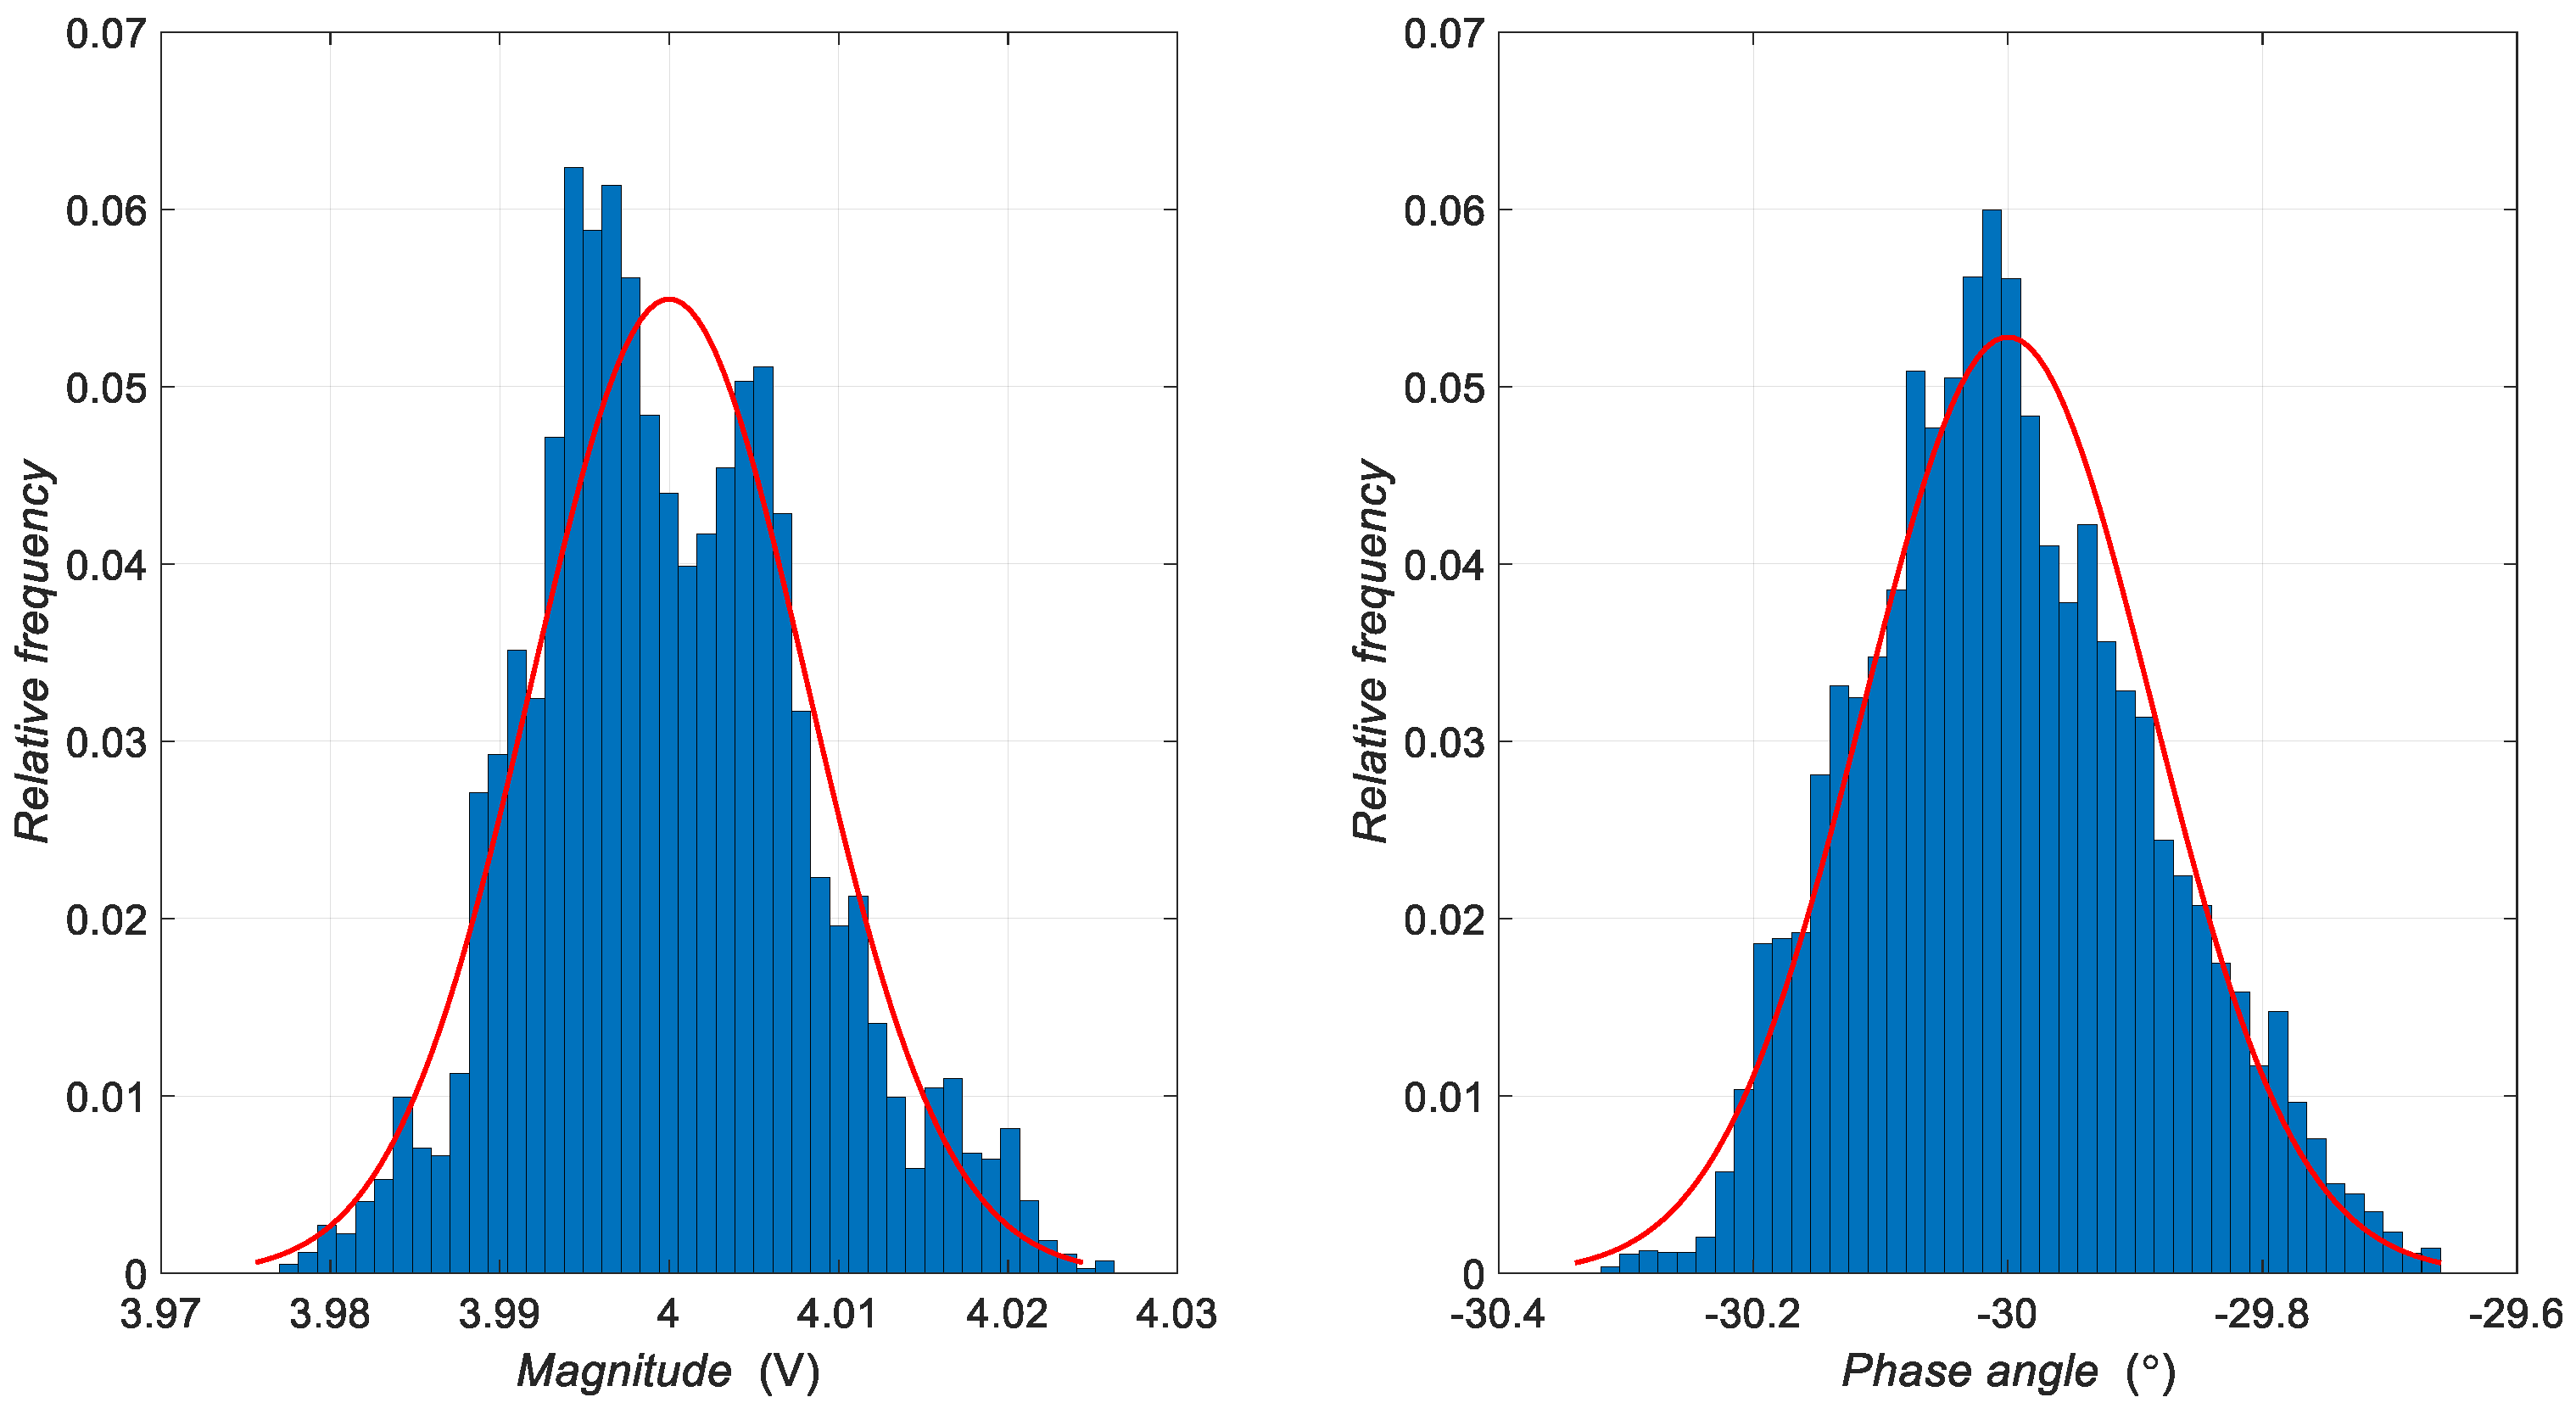
Figure 1. Block diagram of the three-phase voltage generator.
Energies 12 01966 g001
Figure 2. Simulink model for driving three-phase IGBT inverter.
Energies 12 01966 g002
Figure 3. Voltage 5th harmonic phase angle calculation.
Energies 12 01966 g003
Figure 4. Voltage 5th harmonic magnitude response to step reference.
Energies 12 01966 g004
Figure 5. Voltage 7th harmonic phase angle response to step reference.
Energies 12 01966 g005
Figure 6. Laboratory testbed for distorted voltage generation.
Energies 12 01966 g006
Figure 7. Bode amplitude diagram of the anti-aliasing filter.
Energies 12 01966 g007
Figure 8. Third order Butterworth active low-pass filter.
Energies 12 01966 g008
Figure 9. Graphical user interface (GUI) of three-phase non-sinusoidal voltage generator.
Energies 12 01966 g009
Figure 10. Waveform of generated line-line voltage.
Energies 12 01966 g010
Figure 11. Relative magnitude spectrum of generated line-line voltage.
Energies 12 01966 g011
Figure 12. Histogram of fundamental harmonic magnitude and phase angle.
Energies 12 01966 g012
Figure 13. Histogram of 5th harmonic magnitude and phase angle.
Energies 12 01966 g013
Figure 14. Histogram of 7th harmonic magnitude and phase angle.
Energies 12 01966 g014
Table 1. Mean and standard deviations of voltage harmonics magnitudes and phase angles.
Harmonic OrderParameterMeanStandard Deviation
1Magnitude
Phase angle
100 V
60 °
0.0084 V
0.0074 °
5Magnitude
Phase angle
8 V
30 °
0.0068 V
0.0643 °
7Magnitude
Phase angle
4 V
–30 °
0.0081 V
0.1133 °

