Abstract
In order to study the mechanics and acoustic emission (AE) characteristics of fractured rock under water-rock interaction, dried and saturated sandstone samples with prefabricated double parallel cracks were prepared. Then, uniaxial compression experiments were performed to obtain their AE signals and crack propagation images. The results show that water reduces the strength and fracture toughness of fractured sandstone and enhances plasticity. After saturation, the samples start to crack earlier; the cracks grow slowly; the failure mode is transformed from shear failure along the prefabricated cracks to combined shear and tensile failure; more secondary cracks are produced. The saturated samples release less elastic energy and weaker AE signals in the whole failure process. However, their AE precursor information is more obvious and advanced, and their AE sources are more widely distributed. Compared with dry specimens, the AE frequencies of saturated specimens in the early stage of loading are distributed in a lower frequency domain. Besides, the saturated samples release less complex AE signals which are dominated by small-scale signals with weaker multi-fractal characteristics. After discussion and analysis, it is pointed out that this may be because water makes rock prone to inter-granular fracture rather than trans-granular fracture. The water lubrication also may reduce the amplitude of middle-frequency band signals produced by the friction on the fracture surface. Multi-fractal parameters can provide more abundant precursory information for rock fracture. This is of great significance to the stability of water-bearing fractured rock mass and its monitoring, and is conducive to the safe exploitation of deep energy.
1. Introduction
Due to the exhaustion of shallow resources, the exploitation of mineral resources and oil-gas energy has gradually entered the deep part of the Earth. Deep energy exploitation means that the rock mass is in a more complex geomechanical environment [1,2]. In order to ensure the safe exploitation of energy, the mechanism of rock failure and instability monitoring has gradually become the focus of attention and research [3].
Water can significantly affect the mechanical properties of rocks, especially sedimentary rocks containing clay minerals such as sandstone and shale [4,5]. Current studies show that with the increase of water content, the uniaxial compressive strength, elastic modulus and tensile strength of rocks all decrease to varying extents [6]. The pre-peak region of stress-strain curve of saturated rock specimens shows strong non-linear characteristics [7]. Verstrynge et al. [8] pointed out that the continuity of bonding is the main factor leading to the strength reduction of hydrated iron sandstones. With regard to the effect of water on crack growth, Roy et al. [9] through notched semi-circular bending (NSCB) tests showed that the fracture characteristics of rocks decreased with the increase of water saturation. Zhou et al. [10] quantitatively measured the fracture toughness and crack growth rate of sandstone with different water content in NSCB process. Therefore, the influence of water should be fully considered in the study of rock mass stability.
The acoustic emissions (AE) of rocks are signals released in the form of an elastic wave by a part of the strain energy when the rock breaks under external loads [11,12]. AE signals contain abundant rock fracture information. Acoustic emission signal analysis methods mainly include time series parameter analysis methods and waveform analysis methods. The parameter analysis method is the most widely used method to invert the stress state of rock mass by counting, energy and other time-varying parameters. Waveform analysis mainly uses a fast Fourier transform (FFT) to transform signals from time domain to frequency domain, and reveals the characteristics of rock fracture evolution through frequency domain distribution [13,14,15]. These different parameters can reflect the development of cracks and the macroscopic and microscopic scales of fractures in rocks from different perspectives. As a non-destructive testing method, it is widely used for monitoring rock stability in engineering practice [16,17]. Because of the non-linear and multi-scale characteristics of rock mass fracture, AE signals show typical multi-fractal characteristics in the time domain [18]. With the help of dynamic time-varying law of multi-fractal spectrum parameters, the macro-micro mechanism of rock fracture can be deeply excavated, and more abundant parameters and information can be provided for rock mass stability monitoring in engineering practice [19]. On the issue of AE monitoring of water-bearing rocks, previous studies have pointed out that the elastic energy released during material failure under water softening is less and the AE signal is weakened [10,20]. However, the related studies are basically limited to the analysis of acoustic emission time series characteristic parameters, the specific weakening mechanism still needs to be further explored. Through multi-parameter analysis of AE signals, especially the multi-fractal parameters analysis, the influence of water on macroscopic and microscopic failure modes and AE response of fractured rocks can be revealed in depth. Moreover, the multi-fractal parameters have great application prospects in the detection of stability of aquifer rock mass in engineering field.
In engineering practice, various fault structures, joints and fissures of rock mass will cause local stress concentration. The process of initiation, expansion, overlap and penetration of these discontinuities is the main manifestation of rock mass instability and failure [21]. Therefore, the study of mechanical behavior of fractured rock mass under load and its signal monitoring are related to the stability and safety of the project. To address this issue, many scholars have carried out a series of experiments by making prefabricated cracks with different shapes, quantities and arrangements [22,23,24,25,26]. Therefore, in this study, the sandstones commonly exist in practice filed were adopted to make samples with prefabricated double parallel cracks, and then the samples were separately dried and saturated with water. Next, uniaxial compression experiments were performed to observe the process and AE signals of crack initiation, development and penetration and analyze the time series and frequency domain characteristics of AE signals. Furthermore, based on the time-variant multi-fractal theory, differences in AE signals of saturated and dried samples in the failure process were further explored. The effect of water on rock micro-fracture mode and corresponding acoustic emission signal response were discussed. This is of great significance to investigate the stability of water-bearing fractured rock mass and its monitoring, and is conducive to the safe exploitation of deep energy.
2. Experimental Samples, Schemes and Results
2.1. Sample Preparation
The rock samples used in the experiment, which corresponded to white sandstone, were taken from Renshou County, Sichuan Province, China. The large rock mass was processed along the same direction by a cutting machine into samples which were 60 mm long, 30 mm wide and 120 mm high. The ends of samples were flattened with a double-sided grinder to make the unevenness less than 0.2 mm. Then, two 2-mm-wide parallel cracks penetrating the sample were machined using a wire cutter. The position and parameters of the cracks are shown in Figure 1. After the preparation of prefabricated cracks, we selected samples without any other visible damage.
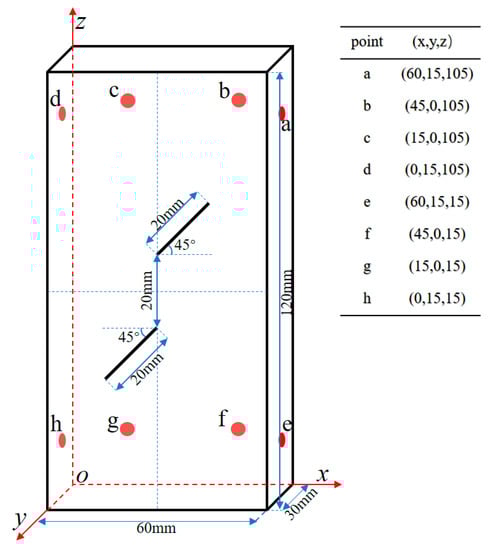
Figure 1.
Schematic diagram of samples and layout of AE probes.
Ten samples were selected for the experiment and divided into two groups. One group was placed in a constant temperature drying oven at 105 °C to be dried for 24 h, after which the samples were taken out to cool naturally. Meanwhile, their masses and longitudinal wave velocities were measured using a ZBL-U520 non-metal detector. The other group was placed in a container and completely submerged by water, during which the samples were weighed regularly. After they reached the natural saturated state, their masses and longitudinal wave velocities were measured. The test results are given in Table 1. The average moisture content of the saturated samples was 3.25%. The samples did not vary notably, with basically the same velocities. The wave velocity increased by about 10.27% after saturation. The dried samples were numbered as DS1-5, while the saturated ones were numbered as SS1-5.

Table 1.
Experimental results.
2.2. Experimental System
The experimental system mainly includes a loading system, an AE acquisition system and an image acquisition system, as presented in Figure 2. The loading system is a new SANS microcomputer-controlled electro-hydraulic servo press testing machine consisting of a press, a DCS controller and a PowerTest V3.3 control program. The AE acquisition system is a 24-channel Micro-II AE monitoring host produced by Physical Acoustics Corporation (Princeton, NJ, USA). Equipped with AE probes, the system can not only collect AE time domain parameters and original waveform data in real time through the Rock Test for Express-8 software, but also realize functions such as spectrum analysis and three-dimensional positioning of AE events. The image is captured by a high resolution industrial camera (Prosilica Gc2450 produced by AVT, Stadtroda, Germany) equipped with a matching ultra-high precision 10 megapixel lens (LM5JC10M, KOWA, Nagoya, Japan). In addition, a stable light source is used to supplement the light for clearly capturing the image of crack propagation in fractured sandstone.
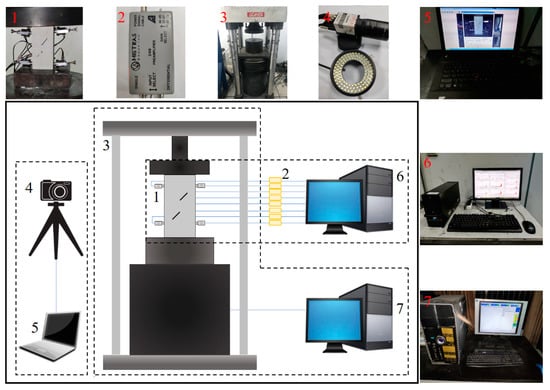
Figure 2.
Schematic and physical diagrams of the experimental system (1-Samples and AE probes; 2-AE Preamplifier; 3-Experimental press; 4-Industrial camera and light supplementary lamp; 5-Image acquisition system; 6-AE acquisition system; 7-Loading system).
2.3. Experimental Procedure
In order to locate the AE, eight AE probes with a central frequency of 150 kHz were arranged at different positions of the sample. The coordinate positions are illustrated in Figure 1. To reduce signal attenuation, appropriate amount of special coupling agent was applied to the joints between AE probes and the sample. Then, the equipment lines were connected and debugged. The amplification factor, the threshold value and the sampling rate of AE acquisition were set to 40 dB, 45 dB and 2 MSPS, respectively. A lead-breaking experiment was carried out before the test to ensure the accuracy of AE acquisition. The press was load-controlled with a loading rate of 200 N/S. The press, AE acquisition and image acquisition started simultaneously until the sample was destroyed. After the experiment, the collected data and images were processed and analyzed.
2.4. Experimental Results
The main test results of all dried and saturated fractured sandstone samples are given in Table 1. In the table, the peak strain denotes the strain corresponding to the uniaxial compressive strength; and the cracking stress level stands for the ratio of the stress to the uniaxial compressive strength at the crack initiation of pre-fabricated cracks in the samples. The uniaxial compressive strengths and elastic moduli of saturated fractured sandstone samples decrease by about 29.63% and 35.44%, respectively. Peak strains of the saturated samples are about 1.32 times those of the dried samples, and the cracking stress levels of the saturated ones are about 25% lower than those of the dried ones. The AE peak counts and cumulative counts of the saturated samples are about 39.09% and 17.93% of the dried ones, respectively.
3. Mechanical Behavior
3.1. Stress-Strain Characteristics
The mechanical characteristics of saturated and dried fractured sandstone under uniaxial compression were analyzed by taking four samples DS1, DS2, SS1 and SS2 as examples. Figure 3 exhibits the samples’ stress-strain curves which can be roughly divided into four stages according to the crack growth process: the compaction stage (Stage I), the crack initiation and stable development stage (Stage II), the crack accelerated growth stage (Stage III) and the failure stage (Stage IV). In Figure 3, SS1 is used as an example to divide the stages. In the compaction stage, the stress-strain curve is concave. In Stage II, the samples mainly undergo elastic deformation, so the curve is smooth and straight. Secondary micro-cracks are generated and developed slowly in the compacted rock in this stage, and the saturated samples even exhibit macro-crack growth at the later stage. In Stage III, the samples demonstrate obvious yield characteristics. With their deformation rates obviously accelerated, the cracks extend at higher rates and converge to form local macro-cracks. Compared with the dried samples, the saturated ones exhibit more obvious characteristics of Stage III and have higher deformation rate, larger deformation amount and more obvious crack growth. The saturated specimens enter the stage III when the stress level reaches about 80% of the peak strength, while the dry specimens are above 90%.
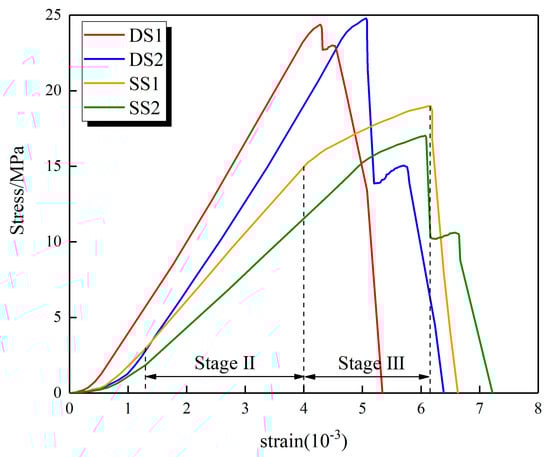
Figure 3.
Stress-strain curves.
3.2. Failure Mode
The final failure modes of dried and saturated samples under uniaxial compression are shown in Figure 4. The two kinds of samples both start to crack from the stress concentration zone at the inner ends of the two prefabricated cracks, after which the cracks connect to form a rock bridge crack and expand gradually at the outer end until the samples fail and lose stability. The dried samples undergo a typical shear failure as their cracks expand and slip, so do the saturated samples. However, the saturated samples also form typical tensile cracks along the loading direction at the outer end of the prefabricated cracks, and there are many secondary micro-cracks in them. The water-induced deterioration of rock samples reduces the cohesive force between the internal particles and decreases the fracture toughness and crack growth rate [10]. Therefore, compared with the dried samples, the saturated ones show the characteristics of early cracking, continuous and slow crack growth, and more diverse crack modes in the fracture process.
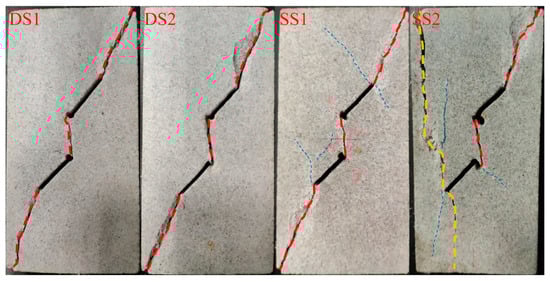
Figure 4.
Failure modes.
4. AE Response
4.1. AE Time Series Characteristics
The parameter AE count was used to study the AE time series characteristics in the failure process of dried and saturated fractured sandstone. AE count-time characteristics and crack growth images at different stress levels ( being uniaxial compressive strength) are presented in Figure 5 where time is divided into stages according to stress-strain characteristics. The saturated samples release less elastic energy during their fracturing, and their AE is weakened [10]. On the whole, the AE counts of saturated samples stabilize at a low level during the loading, and their cumulative counts increase slowly. In contrast, the dried samples release more abundant AE signals and constantly experience small rupture events with higher levels of AE counts, and their cumulative counts grow at relatively high rates. In stage III, the samples undergo a large amount of plastic deformation and fracture, and crack growth accelerates. As a result, AE signals increase obviously. The saturated samples enter this stage earlier, and AE signals begin to increase earlier correspondingly. The results are similar to the research results of Liu et al. [27] which reveal that water stimulates the generation of AE. The AE precursor of saturated fractured sandstone comes earlier and is more obvious, which is very helpful for the monitoring and early warning of rock failure and instability. The dried samples start to crack later, without obvious crack and AE precursor characteristics. After the peak stress is reached, the cracks are connected instantaneously, with strong impact tendency. The AE increases sharply at the moment of rupture, reaching the peak value. In contrast, for the saturated samples, the cracks develop earlier and expand gradually, with weak impact tendency. Their AE peak values at the moment of rupture are much lower than those of the dried samples.
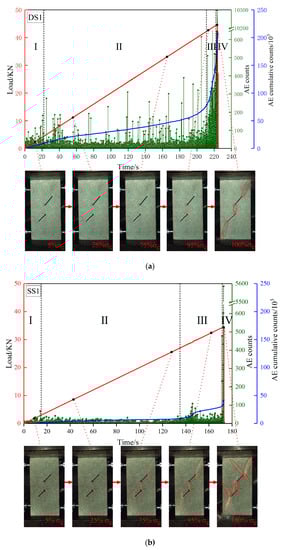
Figure 5.
Images and AE counts in the crack growth process, (a) DS1; (b) SS1.
4.2. AE Frequency Domain Characteristics
In this paper, the waveforms loaded to different stress levels during the deformation and fracture of saturated and dried fractured sandstone samples were processed by using the Fourier analysis method. The spectra of different stress levels are shown in Figure 6. As the loading goes on, the AE amplitudes of the dried and saturated samples both increase gradually, and the main frequency amplitudes of the saturated samples are always smaller than those of the dried ones. The main frequency of AE distributes in obvious varying bands which can be roughly divided into 0–50 KHz (low frequency band), 75–125 KHz (middle frequency band), and 150–200 KHz (high frequency band). AE frequency distribution of dry specimens is wider in the early and middle stages of loading. In this process, the frequencies of the saturated samples are mainly distributed in the middle and low frequency bands, due principally to the water-induced change in the microscopic fracture mode, which will be described in detail in the following section. When the loading reaches the peak stress, the samples undergo macroscopic large-scale fracturing, and the AE shows the characteristics of low frequency and high amplitude, which is consistent with the results of Lu et al. [28].
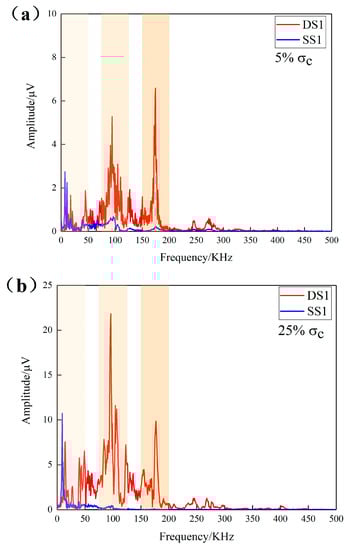
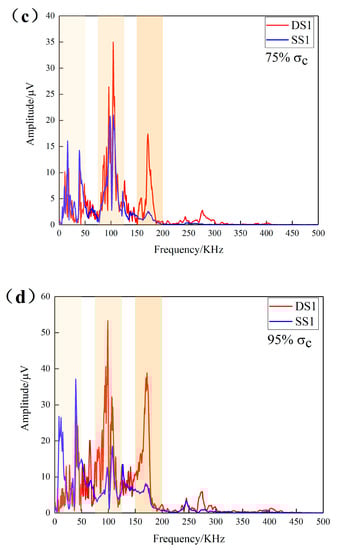
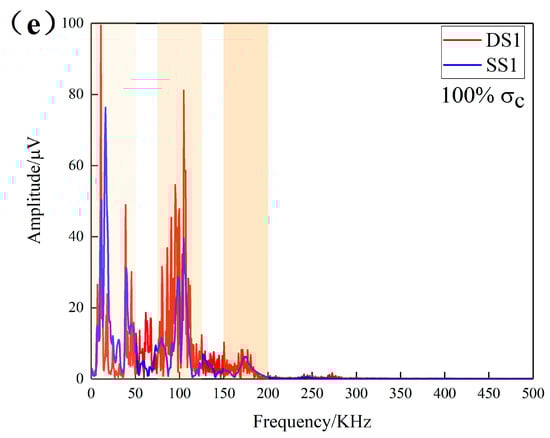
Figure 6.
Evolution process of AE spectrum.
4.3. AE Source Distribution and Evolution Characteristics
AE location technology can capture the source location and development process of AE event and help to intuitively locate the source of rock failure and instability danger in engineering practice. The effect of water should also be fully considered in the application of this technology. The experimental monitoring results are shown in Figure 7. The evolution of AE source is basically consistent with the actual crack propagation and damage evolution of the sample. In addition to the dense AE events at the macroscopic crack locations, the AE sources of the saturated samples are more widely distributed at other locations. This is related to the water-induced deterioration of rock: Water mesoscopically softens and damages the whole rock sample at different locations, leading to the occurrence of some rupture events during the loading.
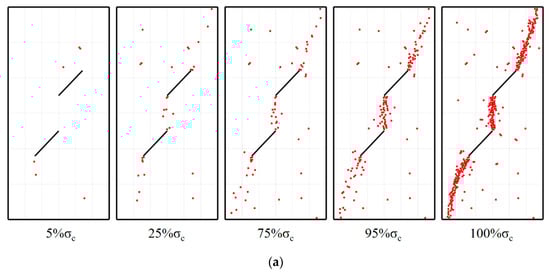
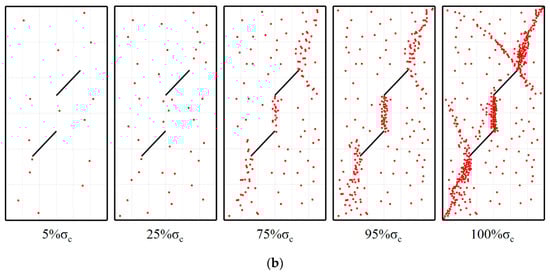
Figure 7.
AE localization and evolution process, (a) DS1; (b) SS1.
4.4. AE Time-Variable Multi-Fractal Characteristics
The AE signals of fractured sandstone throughout the loading process by means of the commonly used window multi-fractal singular spectrum [29,30]. It is assumed that the time sequence and time sub-sequence of AE signal are {yi} and {xi}, respectively; and the total time of AE is T. If the time interval of data acquisition is Δt in the time window lt, then the AE time series set Xm in lt is:
where n is a positive integer.
The multi-fractal spectrum of AE time series is calculated by the method of box-counting dimension. The dynamic fractal singularity index at time is:
where is the defined partition function, i.e. statistical moment; is the quality index of the time Tm, and the multi-fractal spectrum tends to be stable when reaches a certain value in calculation; is the singularity index which reflects the non-uniformity degree of probability subset; , namely, the non-uniformity degree of subset, is the frequency at which the represented subset appears in the entire subset set.
The multi-fractal spectrum - can reflect the non-uniform distribution of signals. The larger the spectrum width is, the greater the difference of signal distribution and the more obvious the multi-fractal characteristics are. reflects the relationship between the occurrence frequencies of large and small signals. The smaller the is, the larger the proportion of large-scale rupture signals gets, and vice versa. can also be used to measure the proportion of strong and weak AE generation mechanisms. > 0 indicates that weak micro-generation mechanism dominates, while < 0 indicates that strong micro-generation mechanism dominates. The above equations are programmed and calculated using the MATLAB software. Taking DS1 and SS1 as examples, the calculation results are shown in Figure 8 and Figure 9.
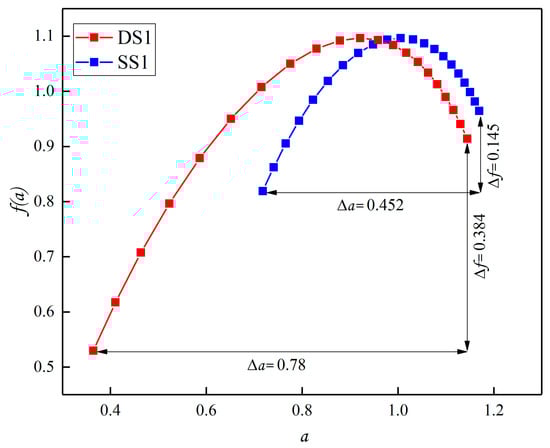
Figure 8.
AE multi-fractal spectrum of the whole loading process.
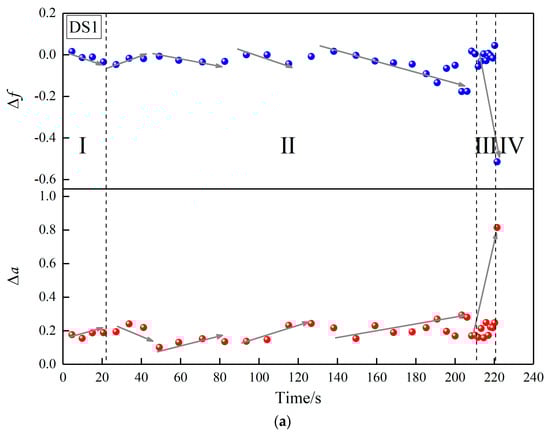
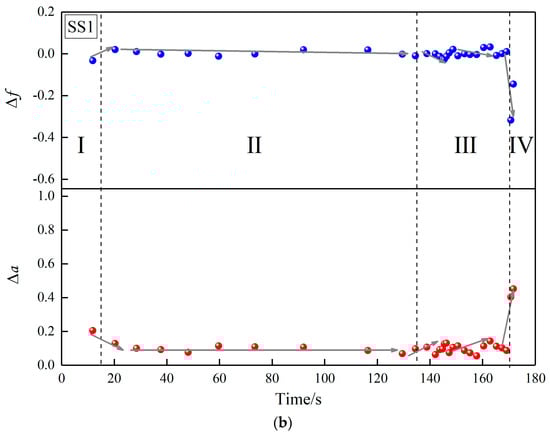
Figure 9.
Time series variation of AE multi-fractal characteristic parameters, (a) DS1; (b) SS1.
For the dry samples, as the loading goes on, ∆a rises with fluctuations; AE exhibits more and more obvious fractal characteristics; ∆f decreases with fluctuations; and the proportion of large-scale signals increases gradually. When the samples rupture and lose stability, ∆a reaches a maximum of 0.81, and ∆f reaches a minimum of −0.52. Compared with dried samples, the saturated ones have weaker multi-fractal characteristics and complexity of signals as a whole. Besides, the small-scale signals dominate. In Stage II, the ∆a values of saturated samples are small and do not change much, and the ∆f values also basically maintain at around 0. ∆a and ∆f do not fluctuate obviously until the stage of crack accelerated expansion. During the rapture, ∆a reaches a maximum of 0.45, and ∆f reaches a minimum of −0.32. The difference in AE multi-fractal characteristics of the saturated and dried samples reflects the different macroscopic and microscopic fracture scales. Firstly, the more brittle dried samples release greater elastic energy released during the rupture, so the strong AE signals account for a larger proportion. Secondly, the simpler microscopic form of rupture of saturated samples results in the weaker complexity of AE signals. The rise of ∆a and the decrease of ∆f can also be used as precursors for rock failure. Besides, the two parameters of the saturated samples are also more notable than those of the dried ones, because they enter phase III earlier and undergo more plastic deformation and rupture, to which the AE responds significantly.
5. Discussion
On the issue of water-rock interaction, scholars generally believe that the effect of water on the mechanical properties and crack propagation of rock mass is a joint result of the combination of physics, chemistry and mechanics [31,32,33,34]. The degradation mechanism can be summarized as follows: the ion exchange and adsorption between water and rock chemically corrodes the rock. The internal cementing material swells when it encounters water, resulting in expansive stress. Moreover, the material can be easily eroded by water to weaken the bond between the particles. As the dissolved minerals enable more water fill the fracture, they accelerate the erosion of micro-crack tips and increase the stress of micro-crack tips, which contributes to the further development of degradation. Therefore, under the action of water-rock interaction, the macroscopic and microscopic modes of rock failure will both change. As illustrated in Figure 10, after the samples are saturated with water, they are more likely to undergo inter-granular fracture because of the water-induced dissolution of inter-granular cementing material. In addition, the saturated samples have less trans-granular fractures and simpler micro-fracture modes. This is also the microscopic reason for the weak multi-fractal characteristics of AE from water saturated samples. In the initial stage of loading, the samples mainly produce micro-cracks in the lattice range. Generally speaking, trans-granular fracture produces greater AE signal energy than inter-granular fracture [35,36]. At the initial stage of loading, there are differences in the frequency distribution and amplitude of AE between dry and saturated samples. The difference in the AE intensity can also suggests that the micro-fracture mode of samples transforms from trans-granular fracture to inter-granular fracture. Zhu et al. [37] believed that the middle frequency signals were mainly related to cross-sectional friction, which agrees with the experimental results. The samples mainly undergo shear failure, and much friction and slip of fracture surface, producing many middle frequency signals accordingly. Moreover, due to the lubrication of water, the signal amplitudes of saturated samples are also weaker than those of dried samples in the middle frequency band.
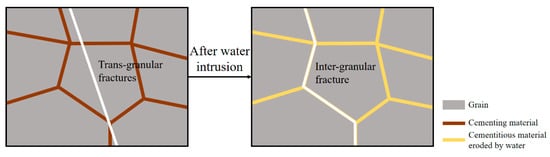
Figure 10.
Transformation of microscopic fracture mode of fractured sandstone under the water-rock interaction.
Rock loading in laboratory and rock mass instability in engineering practice are both processes of stress concentration and stress concentration and energy release in rock mass, but with different scales. Therefore, testing the AE signal of rock sample failure in the laboratory can provide sufficient guidance for rock mass stability detection in engineering practice [38]. For example, the AE frequency distribution in the process of water-saturated sandstone fracture is in a lower frequency band, which means that the water content in rock mass should be fully considered in the selection of AE detection frequency band in engineering practice. Moreover, whether in laboratory or in engineering site, the test value of AE is closely related to the test equipment, rock properties and site environment. And it is difficult to measure by a unified value. Therefore, in-depth data deconstruction and analysis of non-linear characteristics of AE are very helpful to improve the accuracy of stability prediction. Multi-fractal parameters also provide more abundant parameter information for judging the stability of aquifer rock mass, which has great application value in engineering practice.
6. Conclusions
(1) After saturation, the strength and fracture toughness of sandstone samples are reduced and the plasticity is enhanced. Compared with the dried samples, the saturated ones start to crack earlier and have cracks that grow more slowly. For the saturated samples, the failure mode transforms from shear failure along prefabricated cracks to shear and tensile combined failure, and many cracks are generated in the process of deformation and failure.
(2) On the whole, the saturated samples have weaker AE signals than the dried samples, with lower level of AE counts, slowly increasing cumulative counts and less peak counts. Water enables the samples to undergo plastic failure earlier and enhances and advances the AE precursor signals, which is conducive to the monitoring and early warning of rock mass stability in engineering. AE sources of saturated samples are more widely distributed.
(3) Compared with the dry samples, AE signals of saturated samples are mainly distributed in the lower frequency bands in the early stage of loading. This may be because the water intrusion transforms the micro microscopic fracture mode of rocks from trans-granular fracture to inter-granular fractures. The water lubrication may also reduce the amplitude of middle frequency signals produced by the friction on the fracture surface.
(4) In light of the time-variable multi-fractal theory, the AE time series signals of dried and saturated samples were deconstructed. It is found that saturated samples have weaker multi-fractal characteristics, a simpler microscopic fracture mode and a smaller proportion of large-scale signals. Besides, the multi-fractal parameters ∆a and ∆f of the saturated samples do not rise and fall significantly until the accelerated crack propagation stage, which can be used as the precursor information of rock failure and instability.
Author Contributions
Conceptualization, H.L. and R.S.; Data curation, H.L.; Supervision, D.L., H.J., T.L., T.C. and Z.H.; Writing—original draft, H.L.; Writing—review & editing, R.S.
Funding
This research is supported by the Fundamental Research Funds for the Central Universities, grant number 2019XKQYMS55.
Conflicts of Interest
The authors declare no conflict of interest.
References
- He, M.C.; Xie, H.P.; Peng, S.P.; Jiang, Y.D. Study on rock mechanics in deep mining engineering. Chin. J. Rock Mech. Eng. 2005, 24, 2803–2813. [Google Scholar]
- Shen, R.X.; Qiu, L.M.; Lv, G.G.; Wang, E.Y.; Li, H.R.; Han, X.; Zhang, X.; Hou, Z.H. An effect evaluation method of coal seam hydraulic flushing by EMR. J. Nat. Gas Sci. Eng. 2018, 54, 154–162. [Google Scholar] [CrossRef]
- He, M.C.; Miao, J.L.; Feng, J.L. Rock burst process of limestone and its acoustic emission characteristics under true-triaxial unloading conditions. Int. J. Rock Mech. Min. Sci. 2010, 47, 286–298. [Google Scholar] [CrossRef]
- Baud, P.; Zhu, W.L.; Wong, T.F. Failure mode and weakening effect of water on sandstone. J. Geophys. Res. Solid Earth 2000, 105, 16371–16389. [Google Scholar] [CrossRef]
- Talesnick, M.; Shehadeh, S. The effect of water content on the mechanical response of a high-porosity chalk. Int. J. Rock Mech. Min. Sci. 2007, 44, 584–600. [Google Scholar] [CrossRef]
- Erguler, Z.A.; Ulusay, R. Water-induced variations in mechanical properties of clay-bearing rocks. Int. J. Rock Mech. Min. Sci. 2009, 46, 355–370. [Google Scholar] [CrossRef]
- Tang, S.B. The effects of water on the strength of black sandstone in a brittle regime. Eng. Geol. 2018, 239, 167–178. [Google Scholar] [CrossRef]
- Verstrynge, E.; Adriaens, R.; Elsen, J.; Balen, K.V. Multi-scale analysis on the influence of moisture on the mechanical behavior of ferruginous sandstone. Constr. Build. Mater. 2014, 54, 78–90. [Google Scholar] [CrossRef]
- Roy, D.G.; Singh, T.N.; Kodikara, J.; Das, R. Effect of Water Saturation on the Fracture and Mechanical Properties of Sedimentary Rocks. Rock Mech. Rock Eng. 2017, 50, 2585–2600. [Google Scholar]
- Zhou, Z.L.; Cai, X.; Ma, D.; Cao, W.Z.; Chen, L.; Zhou, J. Effects of water content on fracture and mechanical behavior of sandstone with a low clay mineral content. Eng. Fract. Mech. 2018, 193, 47–65. [Google Scholar] [CrossRef]
- Cox, S.J.D.; Meredith, P.G. Microcrack formation and material softening in rock measured by monitoring acoustic emissions. Int. J. Rock Mech. Min. Sci. Geomech. Abstr. 1993, 30, 11–24. [Google Scholar] [CrossRef]
- Mansurov, V.A. Acoustic emission from failing rock behaviour. Rock Mech. Rock Eng. 1994, 27, 173–182. [Google Scholar] [CrossRef]
- Přikryl, R.; Lokajíček, T.; Li, C.; Rudajev, V. Acoustic Emission Characteristics and Failure of Uniaxially Stressed Granitic Rocks: The Effect of Rock Fabric. Rock Mech. Rock Eng. 2003, 36, 255–270. [Google Scholar] [CrossRef]
- Kong, B.; Wang, E.Y.; Li, Z.H.; Wang, X.R.; Liu, J.; Li, N. Fracture Mechanical Behavior of Sandstone Subjected to High-Temperature Treatment and Its Acoustic Emission Characteristics Under Uniaxial Compression Conditions. Rock Mech. Rock Eng. 2016, 49, 4911–4918. [Google Scholar] [CrossRef]
- Kong, B.; Wang, E.Y.; Li, Z.H.; Wang, X.R.; Niu, Y.; Kong, X.G. Acoustic emission signals frequency-amplitude characteristics of sandstone after thermal treated under uniaxial compression. J. Appl. Geophys. 2017, 136, 190–197. [Google Scholar] [CrossRef]
- Li, D.X.; Wang, E.Y.; Kong, X.G.; Jia, H.S.; Wang, D.M.; Ali, M. Damage precursor of construction rocks under uniaxial cyclic loading tests analyzed by acoustic emission. Constr. Build. Mater. 2019, 206, 169–178. [Google Scholar]
- Moradian, Z.; Einstein, H.H.; Ballivy, G. Detection of Cracking Levels in Brittle Rocks by Parametric Analysis of the Acoustic Emission Signals. Rock Mech. Rock Eng. 2016, 49, 785–800. [Google Scholar] [CrossRef]
- Kong, B.; Wang, E.Y.; Li, Z.H.; Wang, X.R.; Chen, L.; Kong, X.G. Nonlinear characteristics of acoustic emissions during the deformation and fracture of sandstone subjected to thermal treatment. Int. J. Rock Mech. Min. Sci. 2016, 90, 43–52. [Google Scholar] [CrossRef]
- Kong, X.G.; Wang, E.Y.; He, X.Q.; Li, D.X.; Liu, Q.L. Time-varying multifractal of acoustic emission about coal samples subjected to uniaxial compression. Chaos Solitons Fractals 2017, 103, 571–577. [Google Scholar] [CrossRef]
- Ranjith, P.G.; Jasinge, D.; Song, J.Y.; Choi, S.K. A study of the effect of displacement rate and moisture content on the mechanical properties of concrete: Use of acoustic emission. Mech. Mater. 2008, 40, 453–469. [Google Scholar] [CrossRef]
- Chen, M.; Yang, S.Q.; Gamage, R.P.; Yang, W.D.; Yin, P.F.; Zhang, Y.C.; Zhang, Q.Y. Fracture Processes of Rock-Like Specimens Containing Nonpersistent Fissures under Uniaxial Compression. Energies 2019, 12, 79. [Google Scholar] [CrossRef]
- Yang, S.Q. Crack coalescence behavior of brittle sandstone samples containing two coplanar fissures in the process of deformation failure. Eng. Fract. Mech. 2011, 78, 3059–3081. [Google Scholar] [CrossRef]
- Bobet, A.; Einstein, H.H. Fracture coalescence in rock-type materials under uniaxial and biaxial compression. Int. J. Rock Mech. Min. Sci. 1998, 35, 863–888. [Google Scholar] [CrossRef]
- Wong, L.N.Y.; Einstein, H.H. Systematic evaluation of cracking behavior in specimens containing single flaws under uniaxial compression. Int. J. Rock Mech. Min. Sci. 2009, 46, 239–249. [Google Scholar] [CrossRef]
- Lee, H.; Jeon, S. An experimental and numerical study of fracture coalescence in pre-cracked specimens under uniaxial compression. Int. J. Solids Struct. 2011, 48, 979–999. [Google Scholar] [CrossRef]
- Yang, S.Q.; Dai, Y.H.; Han, L.J.; Jin, Z.Q. Experimental study on mechanical behavior of brittle marble samples containing different flaws under uniaxial compression. Eng. Fract. Mech. 2009, 76, 1833–1845. [Google Scholar] [CrossRef]
- Liu, D.Q.; Wang, Z.; Zhang, X.Y.; Wang, Y.; Zhang, X.L.; Li, D. Experimental investigation on the mechanical and acoustic emission characteristics of shale softened by water absorption. J. Nat. Gas Sci. Eng. 2018, 50, 301–308. [Google Scholar] [CrossRef]
- Lu, C.P.; Dou, L.M.; Wu, X.R.; Mou, Z.L.; Chen, G.X. Experimental and empirical research on frequency-spectrum evolvement rule of rockburst precursory microseismic signals of coal-rock. Chin. J. Rock Mech. Eng. 2008, 27, 519–525. [Google Scholar]
- Hu, S.B.; Wang, E.Y.; Li, Z.H.; Shen, R.X.; Liu, J. Time-varying multifractal characteristics and formation mechanism of loaded coal electromagnetic radiation. Rock Mech. Rock Eng. 2014, 47, 1821–1838. [Google Scholar] [CrossRef]
- Kong, B.; Wang, E.Y.; Li, Z.H.; Lu, W. Study on the feature of electromagnetic radiation under coal oxidation and temperature rise based on multi-fractal theory. Fractals 2019, 27, 1950038-14. [Google Scholar] [CrossRef]
- Ciantia, M.O.; Castellanza, R.; Prisco, C.D. Experimental study on the water-induced weakening of calcarenites. Rock Mech. Rock Eng. 2015, 48, 441–461. [Google Scholar] [CrossRef]
- Zhou, C.Y.; Deng, Y.M.; Tan, X.S.; Liu, Z.Q.; Shang, W.; Zhan, S. Experimental research on the softening of mechanical properties of saturated soft rocks and application. Chin. J. Rock Mech. Eng. 2005, 24, 33–38. [Google Scholar]
- Zhu, B.L.; Li, X.N.; Wu, X.Y.; Wang, Y.J. Experimental Study of micro-characteristics of swelling for black shale under influence of water. Chin. J. Rock Mech. Eng. 2015, 34, 3896–3905. [Google Scholar]
- Liu, X.R.; Fu, Y.; Zheng, Y.R.; Liang, N.H. A Review on Deterioration of Rock Caused by Water-Rock Interaction. Chin. J. Undergr. Space Eng. 2012, 8, 77–82. [Google Scholar]
- Zhou, H.; Meng, F.Z.; Liu, H.T.; Zhang, C.Q.; Lu, J.J.; Xu, R.C. Experimental study on characteristics and mechanism of brittle failure of granite. Chin. J. Rock Mech. Eng. 2014, 33, 1822–1827. [Google Scholar]
- Miao, J.L.; He, M.C.; Li, D.J.; Zeng, F.J.; Zhang, X. Acoustic emission characteristics of granite under strain rockburst test and its micro-fracture mechanism. Chin. J. Rock Mech. Eng. 2009, 28, 1593–1603. [Google Scholar]
- Zhu, Z.F.; Chen, G.Q.; Xiao, H.Y.; Liu, H.; Zhao, C. Study on crack propagation of rock bridge based on multi parameters analysis of acoustic emission. Chin. J. Rock Mech. Eng. 2018, 37, 909–918. [Google Scholar]
- Cai, W.; Dou, L.M.; Zhang, M.; Cao, W.Z.; Shi, J.Q.; Feng, L.F. A fuzzy comprehensive evaluation methodology for rock burst forecasting using microseismic monitoring. Tunn. Undergr. Space Technol. 2018, 80, 232–245. [Google Scholar] [CrossRef]
© 2019 by the authors. Licensee MDPI, Basel, Switzerland. This article is an open access article distributed under the terms and conditions of the Creative Commons Attribution (CC BY) license (http://creativecommons.org/licenses/by/4.0/).