1. Introduction
Ethylene is a hidden organic chemical that is crucial to modern human life. It is hidden because it is a precursor to products used in most households worldwide but not sold directly to consumers. For example, ethylene is the chemical base for polyethylene (PET) bottles, car parts, buckets, pipes, and plastic sheeting. These items are not mere trinkets. They are integral to the food, water, and shelter provisioning systems that define human well-being. Ethylene molecules surround us, but people never “see” them. As a result, most people are unaware of the climate change and economic impacts of ethylene.
This paper examines four possible futures for the chemical ethylene in the United States (U.S.). The analysis pairs scenarios for meeting future ethylene supply under differing societal approaches to climate change [
1] with recently published perspectives on the transition to bio-based chemicals [
2,
3,
4]. The new scenarios developed herein explore the feasibility of transitioning away from fossil fuels to a bioeconomy future for ethylene production in the U.S. from the perspective of sustainable biomass availability and greenhouse gas emissions.
The debate in the policy and academic literature on ethylene from biomass has been increasing of late because of concerns about the climate change impacts of fossil fuels, regional and national energy security, and employment in agricultural areas. Recent publications, such as the Straathof et al. (2017) “Potential of commodity chemicals to become bio-based according to maximum yields and petrochemical prices” and Fiorentino et al.’s (2017) article “Chemicals from biomass: technological versus environmental feasibility”, are examples of current interest in the field [
5,
6]. These two articles share the same impetus—transitioning from the fossil fuel/petroleum chemistry of today to biomass chemistry in the future. There is an urgent need to adopt low-carbon production methods and policies to phase out fossil fuels in all sectors to abate and mitigate global climate change [
2,
7,
8].
U.S. climate change-relevant policies, such as the Energy Policy Act of 2005 and the Energy Independence and Security Act of 2007, focus on electricity generation and transportation because they are the greatest users of fossil fuels [
9,
10]. However, energy-intensive industries are also significant sources of GHGs, primarily using fossil fuels as energy and feedstocks. The U.S. emitted 6511 million metric tons of CO
2-equivalent greenhouse gases (MMTCDE) in 2016, of which 22% were from the industrial sector [
11]. The topic of this paper, ethylene production, generated approximately (±) 20 MMTCDE in 2016, based on 27 million tons of ethylene produced [
11]. Envisioning biomass alternatives to the fossil fuels-based production of ethylene is an essential step towards a low-carbon economy.
Ethylene is economically important in the U.S. and worldwide. It is the leading commodity chemical in the world, in an increasingly economically important chemicals industry. For example, the value of U.S. chemical shipments in 2017 was
$526 billion dollars, an increase of
$23 billion over 2016 [
12]. In addition, 529,000 people were directly employed in the U.S. chemicals industry in 2017 [
12]. Comparing ethylene to other important chemicals illustrates its scale and significance. As presented in
Table 1, the U.S. EPA Greenhouse Gas Reporting Program (GHGRP)’s data shows that the production volume of ethylene is over half of select widely-used chemicals [
11].
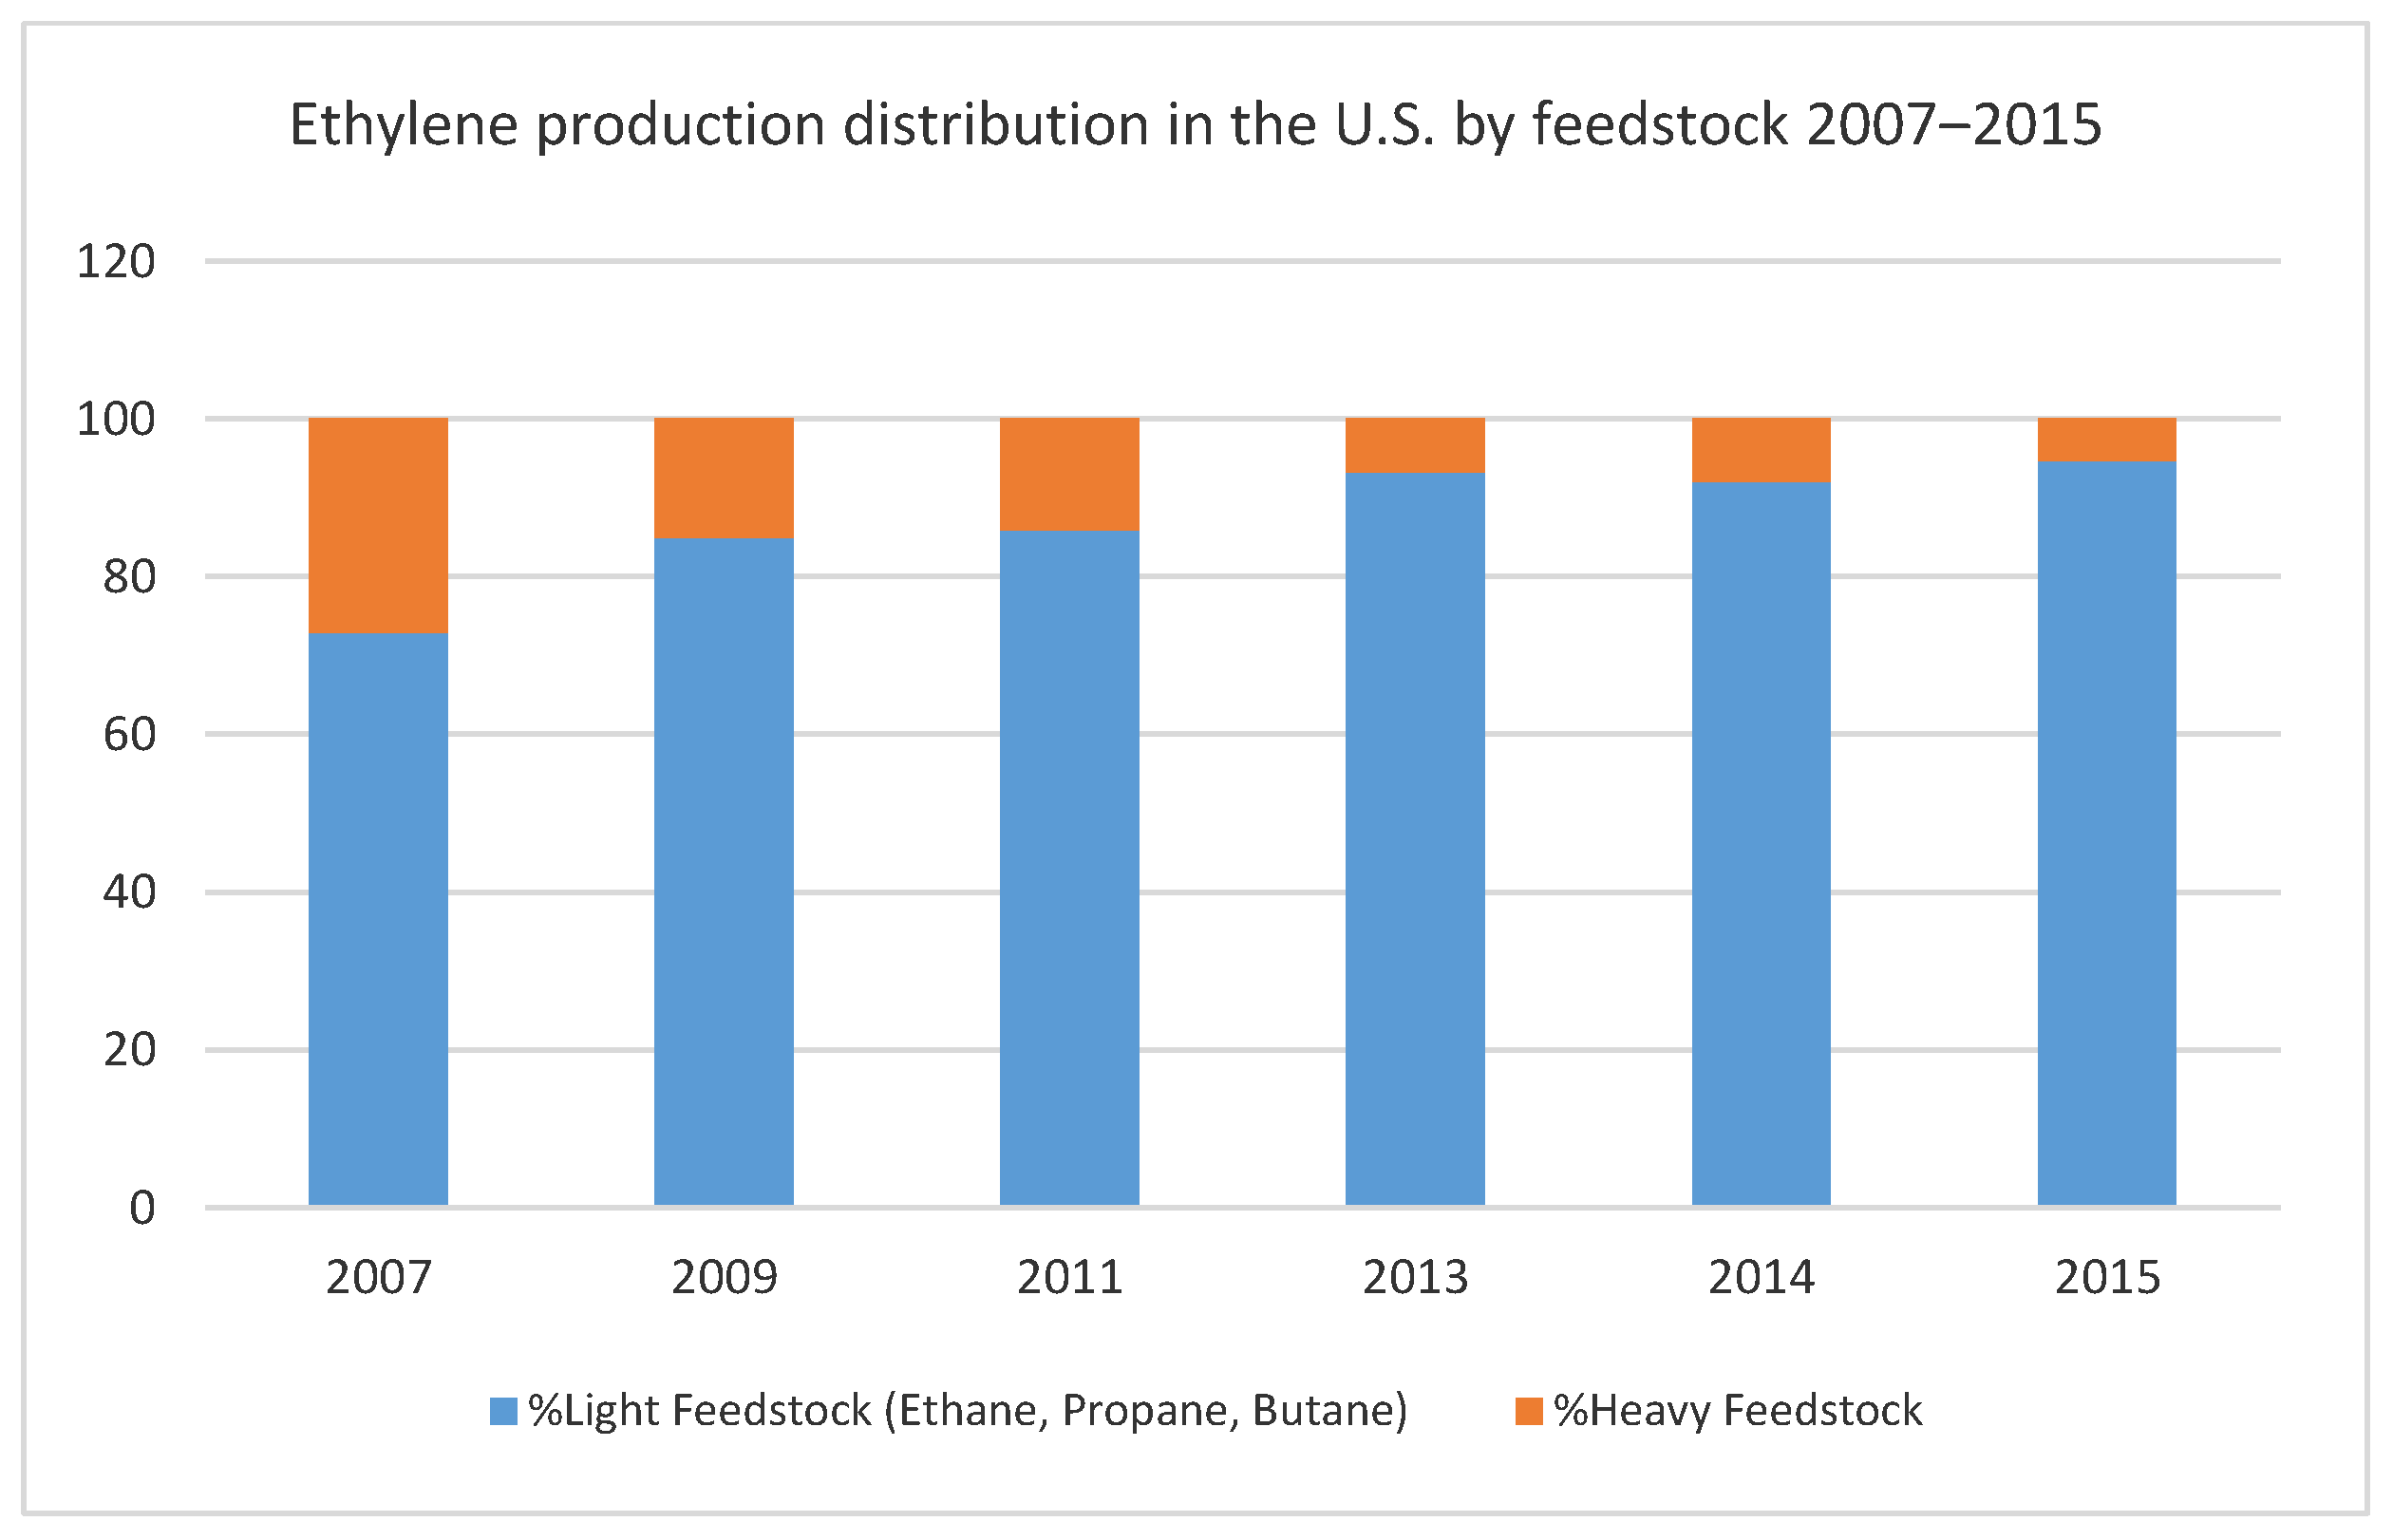
In the U.S. and worldwide, fossil fuels are the main source of feedstock to manufacture ethylene. In the U.S., there has been a recent shift from heavy feedstocks, such as naphtha from crude oil, to light feedstocks, such as ethane from natural gas. The substitution of feedstock from heavy to light feeds is a consequence of abundant natural gas entering the market due to new shale gas exploitation. The low-cost ethane used as feedstock for ethylene is a co-product of shale gas. The substitution was motivated by the price difference between higher cost heavy feeds and lower cost natural gas liquids (NGLs) that contain ethane, propane, and butane and natural gas feeds. As the majority (60%) of ethylene’s production cost is due to the price of feedstock, manufacturers who substituted naphtha with ethane were able to increase profits [
13]. The feedstock shift was not initiated by climate change or environmental concerns. The chemical industry in the U.S. has increasingly moved towards NGL and natural gas, thus reinforcing its reliance on fossil fuels. As shown in
Table 2, American Chemistry Council data explains the industry’s feedstock mix, with light feeds at 79% of all feedstocks by 2017 [
12]. For ethylene,
Figure 1 indicates that the proportion of light feeds rose from 73% in 2007 to 95% in 2015 [
14].
The problem is that an increasing ethylene supply, given current modes of production, means increasing greenhouse gas emissions and climate change impacts. Thus, low-carbon alternatives to fossil ethylene and other chemicals are being studied and commercialized [
15]. Several ethylene supply analyses generally agree that the U.S. will produce more ethylene in the future [
1,
13,
16,
17,
18,
19]; however, there is no consensus on how the volumes of ethylene supplied might be produced or replaced. For example, carbon dioxide from the atmosphere is a potential renewable feedstock for chemicals [
17]. Plastics have a wide array of possible alternatives in a potentially growing market. According to European Bioplastics, 2.11 million tons of alternative plastics capacity exists in 2018, amounting to less than 1% of global plastics production [
20]. For example, bio-succinic acid (bio-SAC), polylactic acid (PLA), and polyhydroxyalkanoate (PHA) are examples of alternatives to petrochemicals for plastics. The scale of the challenge is daunting and requires that many possible solutions be researched. The current bioethylene-focused research is one part of solving the problem.
The author analyzed scenarios for bioethylene from ethanol, rather than platform/bulk chemicals in general or exotic feedstocks, such as carbon dioxide or algae, because it is a short- to medium-term solution. Every scenario assumes that the primary route to U.S. bioethylene in the future is biomass fermentation to ethanol and subsequent ethanol dehydration to ethylene based on the following observations:
- (1)
Ethylene is necessary for modern living and it is widely used.
- (2)
Bioethylene is molecularly identical to fossil ethylene, therefore, a “drop-in” option that does not require rethinking and retooling the downstream supply chain of ethylene to final products.
- (3)
Bioethylene is commercially available now, although not produced in the U.S., indicating a nascent market.
- (4)
Bioethylene from ethanol production routes are well-known technologies.
- (5)
The U.S. is a top producer and consumer of both ethanol and ethylene.
- (6)
Commercial-scale cellulosic biomass conversion to ethanol already exists in the U.S.; although, it is a small segment of today’s ethanol supply.
As a result, of the listed factors, the ethanol-to-ethylene process is the most likely short- to medium-term biotechnology of choice for the U.S. in future.
The analysis explores the question, “Will there be enough biomass feedstock to support future bioethylene production under climate change sensitive growth scenarios for the U.S.?” To answer the research question, this study constructed four future climate change sensitive scenarios for competitive and sustainable biomass feedstock for bioethylene production. According to Kircher (2015) “Feedstock supply is the primary sustainability issue.” [
21] The literature review in
Section 2 explains that studies on bioethylene and biochemicals rarely address the critical issue of sustainable biomass feedstock availability in depth. A sustainable biomass feedstock supply is a necessary pre-condition for the future of U.S. bioethylene. In addition, most studies assume that only the lowest cost ethylene (fossil ethylene) is economically feasible whilst higher cost options are not feasible. These approaches fail to include the main inspiration for bioethylene production—social response to climate change and the need to sustainably reduce greenhouse gas emissions due to fossil ethylene. The study addresses these two shortcomings of the existing literature.
In contrast to most analyses in the field, feasibility is gauged by the availability of sustainably harvested biomass at an economical price level rather than the lowest-cost option. Under these conditions, a rapid phase out of fossil fuel feedstock for ethylene is feasible. A significant percentage of fossil ethylene supply can transition to bioethylene by 2030, if cellulosic ethanol from corn stover expands in all scenarios.
The remainder of the article is organized as follows:
Section 2 reviews the relevant literature that forms the corpus to which this article contributes.
Section 3 describes the methods and data of the study.
Section 4 presents the results.
Section 5 is a discussion of the implications of the study results and
Section 6 concludes the article.
2. Literature Review
This section discusses 11 relevant published analyses and compares them to the contributions of the current work. These papers inform the ongoing academic and practical discussion on bioethylene, biochemical, and bioplastics commercialization, which is a broad field. Dauenhauer and Huber (2014) explained the immense growth in biochemistry research after 2002, noting that “The urgent need for sustainable carbon-based resources has elevated biomass conversion into fuels and chemicals to one of the most important scientific challenges of the 21st century.” [
22] Within this sea of information, the literature review sought out papers that compared environmental impacts of bioethylene from multiple feedstocks with fossil ethylene from natural gas in the U.S. In addition, papers that focus on sustainable supply of biomass in the U.S. Surprisingly, this funnel approach resulted in relatively few analyses; therefore, the literature review was broadened to include papers that are more general.
The literature review is ordered into four categories, from general to specific. The general literature overviews the biobased chemicals field and includes (1) Technical reviews of biochemical groups that include ethylene and (2) Reviews of markets for bioproducts including bioplastics. The second category presents two important bioethylene review papers. The third category is papers that include the data and analyses of interest. These papers tend to be life cycle analyses of bioethylene that estimate the environmental impacts of various feedstocks. The discussion and summary in
Table 3 compare the key features of these papers to the current work.
Technical reviews of biochemicals including ethylene—A recent review paper by Fiorentino et al. (2017) details biobased routes for each of the top ten platform chemicals and discusses environmental feasibility for biobased chemicals as a group [
6]. Although feedstock availability is listed as a determining factor, this point is not developed in the paper. A similar paper by Straathof et al. (2017) details several bio-based production routes for commodity chemicals and compares the resulting price of these to petrochemical routes [
5]. The availability of biomass feedstock is not considered in the analysis. The Haveren et al. (2008) technical review paper of biomass routes for chemicals includes a short medium and long term (30-year) outlook for biomass based routes to chemicals, specifically ethylene [
23]. General biomass supply is also included in this paper, noting that in large part biomass feedstock does not drive up food prices.
Analyses of market potential for bioproducts—The Golden et al. (2018) report analyzes market trends for bio-based products in the U.S. [
24]. It provides a wealth of aggregate historical data for the period 2008 to 2014/2016 on ethanol production capacities, biobased renewable chemicals, and bioplastics. The report notes that data is limited for renewable chemicals; therefore, the macro level data illustrates the growth and scale of the industry. The report notes that the U.S. imports more bioplastics than it exports, therefore, the market and capacity for increasing U.S. production of bioplastics exists. On feedstock availability, this report discusses the main crops used for bio-based products, corn and soybeans in aggregate but does not speculate on their future or the sustainability of current or future production levels. Bruijnincx and Weckhuysen (2013) conclude that the shale gas boom will create demand for biobased chemicals [
25]. They argue that an increase in future ethylene supply from shale gas, will lower propylene and butadiene supply; therefore, biomass chemical refineries can fill these needs. Although this paper includes supply as a key variable, it focuses on biobased options for the supply of propylene and butadiene, under the assumption that shale gas will be the main feedstock for ethylene. Rogers et al. (2017) analysis is the state-of-the-art assessment of bioproducts according to future sustainable biomass availability in the U.S. [
26]. It uses the same biomass availability data as the current work to develop its bioproduct scenarios. The underlying data is from the U.S. Department of Energy’s 2016 Billion Ton Report (1BT), which is the most recent and detailed data available [
3]. See
Section 3 Materials and Methods. Rogers et al. (2017) analysis estimates the economic and environmental consequences of allocating the sustainable biomass “budget” to alternative sectors such as Bio-based Chemicals, Wood Pellets, Thermal Energy, and Gasoline Blendstock. The analysis also estimates the potential scale of future biochemicals supply, “bio-based products from the projected bio-economy could produce 17.4 billion pounds of bio-based chemicals” by 2030 [
26].
Reviews of bioethylene—The 2013 International Renewable Energy Agency (IRENA) report, “Production of Bioethylene Technology Brief” by Broeren is a comprehensive state-of-the-art report at the time [
27]. It concludes that bioethylene is more expensive than fossil fuel ethylene, except in Brazil where bioethylene production costs are low. The IRENA report lists estimates for bioethylene’s GHG emissions from LCAs found in the literature as of 2013 and compiles the known bioethylene factories. Finally, the report notes that the main barriers to bioethylene production are biomass availability and price in comparison to low-cost fossil fuel ethylene. The review paper by Mohsenzadeh et al. (2017) focuses on bioethylene [
28]. It discusses all of ethylene’s possible production routes, including common petrochemical routes and somewhat theoretical routes, such as microorganisms. The ethanol to ethylene route is explained in detail. The article’s economic evaluation was based on Sweden. The price of feedstock is essential to the analysis, concluding that bioethylene is unprofitable. However, the availability of feedstock is not explicitly analyzed. The section entitled “Current Technologies and Industrial Plants” [
28] provides a useful update to the IRENA Report’s compilation of bioethylene production capacity in 2013 [
27].
Analyses of the environmental impacts of bioethylene from multiple feedstocks in the U.S.—Ghanta, Fahey et al. (2014) conducted a comprehensive life-cycle analysis of ethylene from diverse feedstocks (natural gas, naphtha, and corn-based ethanol) [
29]. The authors’ analysis estimates environmental impacts including greenhouse gas emissions and soil, air, and water pollution. The LCAs were conducted at several levels of granularity including the production of fertilizers and pesticides and their use in the cultivation of corn. The results show that ethylene’s negative environmental impacts are primarily from the choice of energy carrier used to fuel the production process rather than the choice of energy carrier used as feedstock. This finding corresponds with [
30]’s conclusions. Moreover, corn-ethanol-based ethylene in the cradle-to-gate analysis has the highest greenhouse gas output because of energy-intensive stages in ethanol production, i.e., fertilizers for growing corn and heat energy for drying it before fermentation to ethanol [
29]. The estimates in this study are opposed to similar studies that generally conclude that bioethylene produces less greenhouse gasses than fossil fuel ethylene. The LCA is missing the cellulosic ethanol to ethylene route, which may have affected its conclusions as cellulosic ethanol tends to have less impacts as described by [
31]. Haro et al. (2013) analyzed the technical and economic viability of several previous case studies for biomass ethanol-based ethylene using current and “promising” technologies [
32]. Although biomass availability is not analyzed, the authors highlight its critical role, stating “The availability of biomass, which is actually the bottleneck for all biomass-derived products, along with the future regulation of biofuels is the key to the development of future bio-ethylene production” [
32]. The study uses cost competitiveness as the deciding factor to conclude that with today’s technology and policy, only Brazilian bioethylene is viable.
McKechnie et al.’s (2015) paper examines the environmental and financial implications of ethanol for bioethylene production versus fuel for vehicles [
31]. This LCA analysis estimates GHG and fossil energy use of ethylene production using natural gas feedstock and biomass feedstock (corn grain and corn stover). The LCAs incorporate the Argonne National Laboratory 2014 GREET LCA tool estimates for ethanol from corn grain and corn stover. The current work applies the MMTCDE estimates from this study because it provides a detailed methodology section and compares ethylene feedstocks of interest with consistent parameters. McKechnie et al.’s study concludes that, although bioethylene from corn grain would reduce the life cycle of GHG emission by 114% and cellulosic corn stover-based bio-ethylene would reduce emissions by 200%, the cost of producing bioethylene is not economically feasible in comparison to the cost of producing natural-gas-based ethylene at 2013 prices [
31]. Once again, low-cost is the defining variable that trumps climate change today and in the future.
Although the current analysis uses the carbon dioxide emissions estimates from McKechnie et al.’s paper, it builds on their work in several ways. First, the authors state that “changes in demand for ethylene” [
31] is beyond the article’s scope, whereas the present analysis employs changes in ethylene supply/demand due to societal approaches to climate change futures.
In summary, eight key features of the current work highlight its contribution to the field as shown in
Table 3. Chiefly, the focus is bioethylene rather than organic chemicals in general or products derived from ethylene as described by categories one and two. This research uses realistic ethylene supply estimates as targets, a feature often lacking in other studies. Its scenario method includes socioeconomic factors and sustainable biomass supply estimates according to societal responses to climate change. In addition, this study is U.S. based in contrast to several others. In contrast to many studies, “economically feasible” is not defined as the lowest cost option. The focus is on sustainable biomass availability at a competitive level.
3. Materials and Methods
As described in the literature review, whether ethylene from biomass is worth the policy and capital investments needed to make it a reality is a puzzle that several researchers have attempted to solve. However, the puzzle of bioethylene in the U.S. in the context of climate change calls on transdisciplinary knowledge that is beyond the scope of individual studies. It is impossible to include every piece of the bioethylene puzzle in one independent analysis. Therefore, most research in this field combines original data with existing data to develop new analyses. The current work similarly relies on publicly available expert analyses, metaphorically putting the puzzle pieces together with the author’s earlier analysis to present comprehensive scenarios.
The present study seeks to understand if biomass would be available for the manufacturing of ethylene scenarios in the U.S. in 2030, 2035, 2040, and 2050. The method applied is scenario analysis. This research develops qualitative and quantitative scenarios reflecting a range of perspectives on future biomass deployment enabling a transition away from fossil fuels based on published literature. The new scenarios are modelled in Microsoft Excel 2013. The four new scenarios (A, B, C1, and C2) capture each of the key features listed in
Table 3. In order to provide a detailed description of the method,
Section 3.1 describes the underlying components of the scenarios.
Section 3.2 presents the completed qualitative and quantitative scenarios narratives.
3.1. Underlying Components of the Scenarios
Each scenario consists of two parts, the narrative and its quantification. The first part is the narrative for future ethylene supply. These narratives are anchored in the Shared Socioeconomics Pathways (SSPs) framework for plausible societal developments in light of climate change expressed as challenge to climate change mitigation and adaptation.
Section 3.1.1 provides a general overview of the SSP framework.
Section 3.1.2 explains how the SSPs are applied to future ethylene supply in previous work, Foster (2018).
Section 3.1.3 describes the 1BT report, the estimates of future biomass supply. The narratives are extended to include future developments in biochemicals and biomass availability in the U.S. built on the viewpoints expressed in:
Smith et al. (2019), “Current fossil fuel infrastructure does not yet commit us to 1.5 °C warming” [
2], which indicates rapid phase-out of fossil fuels replaced by biomass.
Rogers et al. (2017) “An assessment of the potential products and economic and environmental impacts resulting from a billion ton bioeconomy” [
26], which indicates slow but steady growth in bioeconomy-based products.
International Energy Agency (2018), “The future of petrochemicals: Towards more sustainable plastics and fertilisers” [
4], which indicates long-term reliance on fossil fuels and little growth in biochemicals.
Each scenario narrative is quantified for analysis. The data captures the distinct perspectives indicated in the literature noted above. These varying perspectives influence the rate at which biomass will be deployed and the type of biomass deployed (corn grain, corn stover, energy crops, etc.) in the future. The baseline magnitude and composition of the sustainable biomass to meet future ethylene supply is provided by the 1BT report. In addition, the SSPs provide the socioeconomic data (GDP and Population) for each narrative as embedded in the ethylene supply targets from Foster (2018).
3.1.1. The Shared Socioeconomic Pathways (SSPs)
The SSPs were recently developed by an international group of scientists as a new methodology and tool for climate change and sustainability science [
33]. The uses of the SSPs have been steadily expanding over the last five years; over three hundred SSP papers are published. A list of SSP papers appear at [
34]. The basic SSPs provide qualitative narratives and quantitative interpretation of plausible societal developments in the future based on experts’ opinions. The driving forces of the pathways are challenges to climate change mitigation and challenges to climate change adaptation. “[T]he SSPs are intended to describe worlds in which societal trends result in making mitigation of, or adaptation to, climate change harder or easier...” [
35] Each SSP has differing consequences for energy, land use, and pollution [
36]. The quantitative interpretations of the narratives include socioeconomic data at the global, regional and country level, such as GDP, Population, and Urbanization [
37]. This data is freely available to researchers at [
38].
The current research uses the SSP narratives as they were intended and as described in [
33,
35,
39]. The SSP narratives and quantification should be “extended”, to regions, countries, or sectors to develop scenarios for subjects of interest. The subject-specific scenarios herein (bio-ethylene) begin with the basic SSP narratives—augmented qualitatively and quantitatively with the perspectives on future developments of biochemical and future biomass availability estimates. In addition, it is not necessary to use all five pathways in an analysis, focusing instead on the scenarios that are most relevant to the subject.
The current work uses, SSP1 “Sustainability”, SSP3 “Regional Rivalry”, and SSP5 “Fossil Fuel Development” because these scenarios fit well to the key features that are important to understand bioethylene developments. SSP2 “Middle of the Road” reflects current trends from about 2015, the time that the papers quantifying the SSPs were published [
40,
41,
42,
43]. In the author’s opinion, the current trends, as of 2019, for the U.S. indicate increasing fossil fuel development, in line with SSP5; therefore, SSP2 is not included in this analysis. Instead, two SSP5 based scenarios (C1 and C2) reflecting current conditions and potential futures are developed. SSP4 “Inequality” supposes a greater division of social classes, within and across countries, but maintains a middle class. The impacts of SSP4 on energy and land significant when comparing different regions or countries. The SSP4 is not relevant as this analysis is for the U.S. only and apply macro-economic level data that are not sorted by class. The most informative and compelling scenarios for bioethylene are SSP1, SSP3, and SSP5.
3.1.2. Future Ethylene Supply Estimates
The Foster (2018) modelled ethylene supply estimates based on selected SSPs for the U.S. consider feedstock prices including natural gas. The econometric model used actual data from 1986–2014 to project future ethylene supply until 2050. Variables include oil price, gas price, gross domestic product/personal consumption expenditures (GDPPCE), and population. The modelled ethylene supply estimates used herein apply the Energy Information Agency’s reference gas price [
44]. The analysis uses GDP/PCE to reflect consumption of goods [
1]. These estimates provide a “target” that frame the boundary of the analysis, determining how much of the ethylene produced in future years could be derived from biomass in each scenario.
3.1.3. Future Sustainable Biomass Supply Estimates
The scenarios use the data from the “2016 Billion-Ton Report: Advancing Domestic Resources for a Thriving Bioeconomy” (1BT) by the U.S. Department of Energy [
3,
45]. These are the most up-to-date, scientifically informed estimates of current and potential U.S. biomass. “Data sets include potential energy crop production, agricultural residue availability, and forestry production, as well as the potential economic availability of biomass resources delivered to biorefineries.” [
46] The 1BT datasets provide multiple variables and scenarios for all biomass resources currently and potentially available, including energy crops and algae. Some of these are used in the present analysis, e.g., corn grain, agricultural residues and energy crops. The 1BT scenario data include:
Currently used resources;
A base-case scenario with 1% annual growth; and
A high-yield scenario with 3% annual growth.
This collection of datasets is unique because of its level of detail and the two major constraints that are its foundation. The first constraint is sustainable harvest levels. “The scenarios reflect constraints on biomass supply (e.g., excluded areas; implementation of management practices; and consideration of food, feed, forage, and fiber demands and exports) that intend to address sustainability concerns.” [
45] For example, agricultural residue harvesting for biomass is limited to levels that would not damage soil productivity. In addition, the second constraint limits the potential negative effects of land use change as follows. “In addition to the constraint of available land, as established by the USDA baseline... there are annual constraints (5% of permanent pasture, 20% of cropland pasture, 10% of cropland) and cumulative constraints (40% of permanent pasture, 40% of cropland pasture, 10% of cropland) applied to the model regarding land that can be converted to energy crops.” [
3] Therefore, the food versus fuel debate is not applicable to these estimates. These features make the 1BT data an excellent source for the present sustainability-focused analysis, which seeks to quantify the real-world biophysical limits that apply to the bioethylene puzzle.
3.2. The New Bioethylene Scenarios
This section describes each scenario narrative in detail including its rationale. Each of the four scenarios follows its own narrative and quantification based on the components described above.
Table 4 provides a summary of the main assumptions for the variables in the analysis as guided by the scenario narrative. Last,
Table 5 presents the quantitative data, assumptions, and data sources.
Scenario A is a sustainability-focused pathway that demands a swift transition to a bioeconomy within 30 years. This scenario is based on the narrative of SSP1, “Sustainability”, low challenges to climate change adaptation and mitigation. Under this scenario, ethylene supply in 2030 is modelled at ±49.6 million tons. The aim of this scenario is rapid fossil fuel phase-out that retires fossil fuel feedstock for chemicals as per Smith, Forster et al. (2019). The authors suggest a 30-year factory life for industrial infrastructure [
2]. This analysis concurs that, for ethylene in the U.S., a 30-year plant life is reasonable. Other analyses, such as [
32], propose 20 years. Scenario A proposes the 1BT’s 3% high yield scenario for corn grain, corn stover, other agricultural residues, and woody and herbaceous energy crops. The scenario assumes that 100% of agricultural residue, including corn stover, are available for ethanol because ligno-cellulosic ethanol production comes online. The percentage of corn grain for ethanol reaches 50% in 2030 (an increase of 12–15% from 2014/2015) and 65% by 2050. The modelled level is higher than historical levels (See
Figure 2), presuming that the future policy supports the use of ethanol for chemical feedstocks as well as fuel additives. The growth of corn crops for ethanol is due to the Energy Independence and Security Act of 2007 mandating renewable fuels. At present, nearly all gasoline in the U.S. contains ±10% corn grain ethanol, representing ± 38 percent of the U.S. corn supply. Ethanol has averaged 35 percent of corn supply since 2006/2007 [
47].
Scenario A also assumes that the demand for ethanol as a fuel additive declines because of the widespread shift away from fossil fuels based on fewer personal vehicles and more electric cars. Therefore, more ethanol for chemicals becomes available over time, shifting to 90% for chemicals by 2050 and 10% for fuel additives.
Scenario B is a regional energy-focused pathway that emphasizes domestic fossil fuel use and lower economic growth. Ethylene supply in 2030 is modelled at ±38 million tons. This scenario is based on the narrative of SSP3, “Regional Rivalry” and its key assumptions are low growth of biomass resources and low technological development; therefore, the 1BT base case of 1% growth is selected. This scenario takes its initial standpoint on biomass availability from the “ethanol use case” in the article, “An assessment of the potential products and economic and environmental impacts resulting from a billion ton bioeconomy”. This scenario allows for a majority of new resources to be allocated to ethanol [
26]. Further, resources for chemicals are limited to corn grain, corn stover, additional crop residues and energy crops. Algae is excluded in all scenarios herein, as in the “ethanol use case” [
26].
Since SSP3 is a regional development-focused future with less international trade and slow technology change, policymakers will encourage a domestic ethanol market to reduce reliance on imported fuels and sustain employment. Ethanol markets have a high level of policy support, including ligno-cellulosic ethanol development. However, as technological advancement is slow, no new technologies come online (i.e., no algae or carbon dioxide as feedstocks). In this scenario, the current (2014/2015) levels of corn grain for bioenergy exploitation are inflated by 1% growth per year. This is a different assumption from the 1BT and [
26], which keep the current level constant through 2040. 1BT notes the current use of ±25 million tons of corn grain (119 million tons for ethanol and 5.62 million tons for chemicals). This scenario includes high levels of fossil fuel use and lower levels of international cooperation. These characteristics are interpreted as high levels of gasoline vehicles. Therefore, the ethanol is used as a fuel additive (80% of ethanol) through 2050.
Scenario C1 and Scenario C2 are presented together because they are both fossil-fuel development pathways based on SSP5 that are paired with the 2018 International Energy Agency (IEA) report, “The future of petrochemicals: Towards more sustainable plastics and fertilisers”. This IEA report applies a low-cost model that assumes the lowest cost feedstocks are commercialized first. It concludes that chemicals from biomass will be at less than 5% by 2050 because of cheaper fossil fuels [
4]. Interpreting this view for biomass availability for the U.S. generates two scenarios. Scenario C1 assumes only corn grain is converted to ethanol at a 1% growth rate in future. Alternatively, Scenario 2 assumes that corn grain plus corn stover are converted to ethanol at a 1% growth rate. Another feature of Scenario C2 is that only 50% of available corn stover is employed for ethanol production. This is a reasonable alternative because in the U.S. commercial-scale corn stover ethanol already exists. In the author’s opinion, if the U.S. continues along its current lowest cost fossil-fuel dependent path, then cellulosic ethanol will be reversed as in Scenario C1 or maintained at a low level as in Scenario C2. The demand for ethylene in the Scenarios C1 and C2 is high, so it is reasonable to assume that ethanol available for chemicals is limited to a maximum of 20% because, as in Scenario B, most of the ethanol is used as a vehicle gasoline additive. The economy favors fossil fuels for all uses in these scenarios. The SSP Fossil-Fuel Development scenario for ethylene estimates 61 million tons supplied by 2030, reflecting the growth in non-conventional fossil fuels including increased shale gas yields. In the author’s opinion, SSP5 is in line with current U.S. policies favoring fossil fuels.
Table 5 presents the quantification data for each variable in the model including the greenhouse gas emissions factors. Each of the data sources is publicly available and reliable because they are from published peer-reviewed journal articles or the SSP database. The analysis relies on the factors from McKechnie et al. (2015) because they are detailed, transparent, and consistent across feedstocks. “Inclusion of ethanol well-to-gate activities results in bioethylene life cycle GHG emissions of −0.3 kg CO
2eq. kg
−1 and −1.8 kg CO
2eq. kg
−1 for corn grain and corn stover ethanol, respectively. Relative to fossil fuel-derived ethylene (1.8 kg CO2eq. kg
−1), bioethylene production from both ethanol sources is able to significantly reduce life cycle GHG emissions, by 114% (corn grain) and 200% (corn stover).” [
31]
Limitations and future research—There are three limitations to this analysis. First, the biomass availability data in the 1BT report scenarios do not share the underlying socio-economic data of the targeted ethylene supply data. Ethylene supply is a function of the SSPs’ socio-economic (GDP and population) trajectories. The 1BT socio-economic scenarios are the best professional judgment of 2014–2016 economic conditions. In the future, a deeper level of analysis will seek to harmonize the socio-economic data in one integrated model. The current level of analysis defines the research question, analytical methods and qualitative/quantitative scenarios and provides results. These are all important elements for exploring potential futures for an important product—ethylene. The second limitation is that the analysis assumes that ethylene’s feedstock may be biomass-based, but the fuel for the production process is fossil fuel-based (generally natural gas) in all scenarios. This is a necessary simplification because the production and MMTCDE emissions factors identified in the literature (See
Table 5) are based on current U.S. ethylene production technologies, which rely on natural gas. This research identified only one U.S.-focused study that modelled the environmental impacts of renewables as both feedstock and fuel in plastics (HDPE, LDPE, etc.), [
30]. The lack of data on alternatives to fossil fuels used as process energy (heat and electricity) for bioproducts is a limitation in the field. A next step in the current research project could be to conduct LCA analyses for bioethylene with and without renewable fuels. The third limitation of this analysis is that it examines ethylene as a proxy for all chemicals and does not account for alternate uses of biomass. Although an analysis of all competing uses of future biomass is beyond the scope of this study, bioethylene and other biochemicals are “unique commercialization opportunities” [because] “there are no other practical alternatives to fossil-based” ethylene [
26]. Additionally, the focus on ethylene is appropriate because it is the largest volume bulk chemical, which makes the results relevant.
4. Results
This section presents the results of the scenario analyses to answer the question, “Will there be enough biomass feedstock to support future bioethylene production under climate change sensitive growth scenarios for the U.S.?” Additionally, the analysis shows under which circumstances the goal of a low-carbon future for ethylene can be achieved given the scenarios. The projected greenhouse gas impact of each scenario is discussed. The results of each scenario analysis are presented for years 2030–2050, in five-year intervals in
Table 6,
Table 7,
Table 8 and
Table 9 below. The greenhouse gas emissions due to ethylene production in each scenario is depicted in
Figure 3.
The results show that even with the stringent expectations for biochemical commercialization driven by the fossil-fuel development pathways of Scenario C1 and Scenario C2, at least 9% of ethylene supply can be met by biomass. At the other end of the spectrum, Scenario A (Sustainability), with its strong support for biomass under the assumption that fossil fuels must be phased out quickly, results in a pathway leading to biomass availability for nearly five times the ethylene supply required.
4.1. Scenario A
Given the parameters of Scenario A, including a concerted drive to phase out fossil fuel use, substantial biomass resources become available as early as 2030. The result of rapid cellulosic ethanol production combined with energy crop availability results in maximum ethanol production. In addition, ethanol used as a gasoline additive drops to 10% by 2050, leaving the majority for chemicals. This corresponds with SSP1’s constraints on fossil fuels. Transportation would shift towards electricity rather than today’s gasoline/petrol blended with ethanol. Under these conditions, one hundred percent of ethylene supply may be met with cellulosic ethanol alone. This scenario results in carbon sequestration of (negative) 74 MMTCDE in 2030 and (negative) 84 MMTCDE in 2050.
4.2. Scenario B
Scenario B is a slower path towards bioethylene. Given the scenarios’ parameters, by 2030, 56% of ethylene can be supplied with bioethylene. In 2050, the entire ethylene supply can be met with biomass feedstock. The main driver of growth is cellulosic ethanol from agricultural residues and energy crops. Since these feedstocks have such a low carbon footprint, the emissions produced in 2030 is only 3 MMTCDE, even though only 56% of all ethylene is from biomass. Bioethylene may sequester carbon at (negative) 41 MMTCDE by 2050. As noted in the Discussion section, one limitation of this analysis is that the MMTCDE estimates include fossil fuels as production fuel. Fortunately, this feature is an accurate interpretation of SSP3 with high challenges to climate change mitigation and adaptation and SSP5, which has high challenges to climate change mitigation resulting in high fossil fuel use. SSP3 and SSP5 are the narratives for Scenarios B, C1, and C2, respectively. It is an important finding that Scenario B, one of the two most pessimistic climate future narratives within the SSP framework, may still result in negative emission strategies for ethylene/chemicals by 2050—if existing cellulosic technologies for utilizing agricultural residue and energy crops are expanded.
4.3. Scenario C1 and Scenario C2
Scenario C1 and Scenario C2 are based on SSP5, “Fossil Fuel Development”. They provide an interesting comparison between two options limiting feedstocks to corn grain ethanol and corn stover. Scenario C1’s corn grain ethanol utilization results in only 12% of ethylene supply being met by bioethylene in 2030, which declines to 9% in 2050. The percentage of bioethylene declines because the rate of growth in ethylene supply is greater than the slow, 1%, growth of biomass supply. Ethanol growth in the future through 2050 is at similar levels to current use (37–39%) and the majority (80%) is utilized as a fuel additive rather than chemicals. Climate change-relevant emissions due to ethylene supply are 169 MMTCDE by 2050.
Scenario C2 assumes that, in addition to corn grain, only 50% of today’s level of available corn stover is used for ethanol until 2050. Under these assumptions, in 2030, bioethylene reaches 15% of the supply, which declines to 10% by 2050. In 2050, including 10% bioethylene, the emissions would reach 163 MMTCDE.
Scenario C1 and Scenario C2 are thought-provoking because they reflect commonly held beliefs in the field that are illustrated by the IEA’s 2018 report interpreted in these scenarios, “The Future of Petrochemicals: Towards More Sustainable Plastics and Fertilisers”. First, plastics consumption will grow significantly by 2050: “Production volumes for a group of key thermoplastics (including polyethylene terephthalate (PET), high-density polyethylene (HDPE), polyvinyl chloride (PVC), low-density polyethylene (LDPE), polypropylene (PP) and polystyrene (PS)) grow from ±350 Mt in 2017, to 5590 Mt in 2050, an increase of nearly 70%.” [
4] Essentially, the growth of chemicals for the plastics demand outstrips the availability of biomass for bioethylene. Second, the IEA report concludes that low-cost fossil fuels, particularly ethane in the U.S., will dominate chemical production and effectively block biochemicals developing more than 5% of the supply [
4]. Scenario C1 and Scenario C2 show that even with high reliance on fossil fuels and a pessimistic outlook for biomass, a significant 9% of bioethylene supply can be reached with corn grain ethanol alone. Ten percent is achieved with a conservative level of corn stover utilization. These scenarios could sequester ±3 MMTCDE per year and 6 MMTCDE, respectively, making an important contribution to climate change mitigation.
As mentioned, the climate change impacts of each scenario are estimated as MMTCDE.
Figure 3 provides a comparison of these estimates. At 2050, both Scenario A and B result in long-term carbon sequestration and, therefore, are low-carbon development pathways. Scenarios C2 and C1 are high carbon development pathways.
5. Discussion
The results illustrate that low-carbon futures with substantial bioethylene production in the U.S. are possible within biophysical limits, defined as the sustainably harvested biomass projections of the 1BT under a wide range of plausible scenarios for societal approaches to climate change mitigation and adaptation. These results are in line with the findings of [
26]. Further, bioethylene production can make a substantial contribution to reducing greenhouse gas emissions at low production levels (9%) and can act as a carbon sequestration tool at higher levels.
The data show that significant reductions to greenhouse gasses may be achieved even with slow implementation based only on corn grain ethanol (Scenario C1) similar to current levels (37–40% of corn grain supply), without cellulosic agricultural residues or energy crops. This outcome is possible in the near-term (2030) under two conditions. First, price support for corn ethanol production should not be capped based solely on its use as a gasoline additive, as it is currently. Second, the proportion of ethanol for chemicals would grow to 20% by 2030. These conditions depend on policy support. For example, including corn grain ethanol for chemicals under the Energy Independence and Security Act. This scenario does not result in major decarbonization or phase-out of fossil fuels that would contribute to changing the course of global warming. Conversely, Scenarios A and B demonstrate transformative, low-carbon development pathways.
The results of Scenarios A and B show that a major decarbonization of ethylene will rely on cellulosic ethanol and energy crops. The 1BT models assume that energy crops are planted in 2019. With full utilization of agricultural residues and energy crops for cellulosic ethanol production, fossil fuel feedstocks for ethylene could be phased out completely. According to this study, bioethylene could become a carbon sink by 2030 in the high-yield case (Scenario A) and by 2050 in the base-yield case (Scenario B), even if natural gas remained as a fuel as shown in
Figure 3.
The relative prices of the commodities analyzed are not discrete variables in this analysis; however, prices are important and therefore are embedded in two ways. First, the ethylene supply projections include fossil fuel feedstock prices (natural gas and crude oil) [
1]. The natural gas price is based on the reference gas price in the U.S. EIA’s 2014 Annual Energy Outlook [
44]. Second, all the 1BT data are based on a
$60/ton delivered price for all feedstocks as a suitable market price with a 2014/2015 baseline. In this way, feedstock and fuel prices are roughly consistent. They share the same baseline, 2014, and reflect the Department of Energy’s estimates for the study period.
The results focus on physical volumes rather than price comparisons in order to highlight the most important issues, sustainable harvest and climate change impacts. Other articles identify environmental and climate change mitigation benefits of bioethylene and bioplastics [
31,
50,
51]. Acknowledged benefits are commonly side-lined because the costs of bioethylene are too high to compete with fossil-fuel ethylene [
22,
52].
6. Conclusions
In conclusion, the results of this study indicate that the key to motivating bioethylene in the U.S. is policy support, particularly for the expansion of ligno-cellulosic technology improvements and commercialization that can take advantage of the corn stover-based ethanol-to-ethylene route. In addition, policy support for planting and utilizing woody and herbaceous energy crops is necessary. The author notes that the history of corn grain-based ethanol as a gasoline additive is a testament to the success of programs that support bioproduct manufacturers and programs that expand opportunities for bioproducts to reach consumers (research and development, subsidies, credit schemes, mandates for use, etc.). Government policy support has reduced the cost of ethanol production and expanded the range of viable feedstocks, for example, the National Renewable Energy Laboratory achieved a modelled ethanol price of
$2.15/gallon of ethanol for cellulosic feedstock (corn stover) in 2012, down from
$9.00/gallon in 2002 [
53]. Policies that stimulate consumer demand, such as the U.S. Department of Agriculture’s BioPreferred program, promote biobased products through certification and federal procurement policy mandates [
24]. A range of policy tools should be activated to spur U.S. bioethylene production in the short-term.
Ethylene is a high-value chemical that benefits from the fresh surfeit of shale gas in the U.S., prompting the question, “Is bioethylene relevant when natural gas is cheap and abundant?” Bioethylene will remain relevant because irreversible climate change that threatens life on Earth is an unacceptable risk [
54,
55]. It is pertinent and timely to examine the possibility of phasing out fossil fuels in the supply chain of critical products to mitigate climate change. As new alternatives to fossil fuels are proposed and evaluated, the most important aspect is that new material supply chains are constrained by realistic biophysical boundaries. This constraint is often overlooked because the abundance of agricultural land is assumed.
This paper’s contribution is demonstrating that bioethylene production in the U.S. can be a powerful climate change mitigation strategy built on sustainable agriculture. Bioethylene is a realistic alternative to fossil fuel ethylene under several climate change-sensitive future scenarios. In all scenarios ethylene supply grows, even with lower national consumption rates. Ethylene supply is intrinsically linked to the car parts, packaging, adhesives, and medical devices, etc. that are woven through the fabric of modern life. This outcome poses a challenge to realizing a low carbon future for ethylene. Bioethylene from ethanol produced with multiple feedstocks, sustainably harvested, is a solution within reach.


