Abstract
This paper presents a methodology to design and utilize a supervisory controller for networked power converters in residential applications. Wireless networks have been interfaced to multiple power factor correction (PFC) converters which are proposed to support reactive power. Unregulated reactive power support from PFC converters could cause reactive power deficiency and instability. Therefore, a supervisory controller is necessary to govern the operation of PFC converters. WiFi and WirelessHART networks have been used to implement the supervisory controller. Different nodes of the power network are connected by wireless communication links to the supervisory controller. Asynchronous communication links latency and uncertain states affect the control and response of the PFC converters. To overcome these issues, the supervisory controller design method has been proposed based on the system identification and the Ziegler-Nichols rule. The proposed supervisory controller has been validated by using a hardware-in-the-loop (HIL) test bed. The HIL testbed consisted of an OP4510 simulator, a server computer, Texas Instrument-Digital Signal Controllers (TI-DSCs), WiFi and WirelessHART modules. Experimental results show that the proposed supervisory controller can help to support and govern reactive power flow in a residential power network. The proposed method of controller design will be useful for different small-scale power and wireless network integration.
1. Introduction
According to the US Department of Energy, residential loads have consumed 20.44% of the total energy in 2017 [1]. Residential loads consume both active and reactive power. Reactive power demand in a home is usually fulfilled from the grid. Recently, power factor correction converters have been integrated into some of the residential appliance, which minimizes reactive power consumption from the grid [2,3,4,5]. A recent study shows that additional reactive power could be supported from renewable resources and power factor correction (PFC) converters in residential applications [6,7]. However, unregulated reactive power support from PFC converters could cause reactive power deficiency and instability. To utilize the additional reactive power resources in a residential power network, a supervisory controller is necessary. A supervisory controller should monitor and control the reactive power flow in the residential power network. This paper presents a methodology to design a supervisory controller which governs reactive power flow in a residential power network. Wireless networks were used to implement the proposed supervisory controller.
The supervisory controller for large power and energy management systems are well established technology. It is known as supervisory control and data acquisition (SCADA) [8]. Because of the scalability, SCADA is not an appropriate tool to control reactive power flow in a small residential power network. Distributed controllers for power converters have been developed using communication network [9,10]. It has potential for wireless network integration but does not provide a centralized solution for reactive power management. A supervisory controller has been validated using an FPGA for power converters in Reference [11]. Reference [11] has only a single controller for multiple converters, which manages all PWM signals without a communication network. Other power and energy management systems have been implemented using fuzzy logic, distributed, model predictive and supervisory controller in References [12,13,14,15,16,17]. However, these solutions don’t give the opportunity to control power flow using a communication network in a residential application. As a result, a solution has been proposed by assuming that there are reactive power resources as well as a communication network available in the residential applications [18,19].
The possible energy sources in residential applications include utility grid, solar panel, wind generator, stored energy, and so forth. These energy sources supply both active and reactive power. In the residential applications, energy is consumed by different kinds of loads , which include high-consumption applications such as HVAC systems, ovens or refrigerators, along with low-power devices such as televisions and light fixtures. Conventional residential loads consume both active power, P and reactive power, Q. However, smart loads which use PFC converters could contribute reactive power, Q, rather than consuming [6]. Examples of smart loads include HVAC systems, electric vehicle (EV) chargers, computers, televisions and other digital appliances [20,21,22]. Typically, this is accomplished through the use of boost PFC converters [23,24]. As a result, these appliances have the readily available converters to support reactive power. The main role of these converters is to supply specified current and voltage to the appliances. However, these converters can contribute a specified amount of reactive power to the grid without hampering their main functionality.
Recent advances in technology has has trended towards connecting residential appliances to networks. The connectivity to networks and management of appliance features is represented by smart technologies and Internet of Things [21]. The connectivity to appliances has been implemented using WiFi, WirelessHART, Bluetooth, Zigbee and Ethernet [25,26,27,28]. By using this connectivity, some specific parameters of power converters can be monitored and controlled [19].
Appliances as reactive power resources and the connection to a wireless network facilitates the opportunity to implement supervisory controller. However, the reactive power management system now becomes more complex because of the integration of power network and wireless network. This system has multiple power nodes which are connected by communication links. Multiple wireless communication links have different delays, asynchronous latency and uncertainty. These factors affects the operation of PFC converters which ultimately affects the reactive power management system. Due to the system complexity and delays, the top-level supervisory controller can’t be designed accurately using a conventional state space averaging method. To address this issue, a system identification-based supervisory controller design method has been proposed in this paper. The proposed method considers uncertainty, complexity and delays. It uses the Ziegler-Nichols rule to design a proportional-integral (PI) controller. The proposed supervisory controller has been implemented in a server computer and validated using an hardware in the loop (HIL) test bed set up.
The HIL test bed was built to simulated a residential power network in real-time using OPAL-RT OP4510 [29]. The power converters of have been controlled by Texas Instrument Digital Signal Controllers (TI DSC) [30]. WirelessHART and Wi-Fi networks were used for connectivity [31,32]. Level shifting and scaling circuit were built to make the TI DSC compatible for OP4510.
Multiple tests were conducted using the HIL test bed to validate the feasibility and compatibility of the supervisory controller. The performance of the supervisory controller has been evaluated by analyzing the dynamic response for reactive power support. Test results show that PFC converters can support reactive power to the residential application in different conditions with the help of an optimal supervisory controller. Section 2 of this paper describes the proposed scenario for this power network. Section 3 describes the proposed supervisory controller design method. HIL testbed and experimental results are presented in Section 4 and Section 5, respectively.
2. Networked Power Converters
Considering the wireless connectivity to smart residential appliances, a scenario for a residential power network has been proposed in the following.
2.1. Power Network Configuration
The proposed residential power network configuration is shown in Figure 1 which has both conventional lagging load and PFC connected smart loads. A supervisory controller has been implemented in the power network using wireless nodes. Figure 1 shows the active and reactive power supplies from grid. Conventional loads with a lagging power factor are represented by a single block in Figure 1. Three separate PFC connected smart loads are distributed and are assumed to contribute reactive power. Based on the active and reactive power supply and consumption, the balanced power condition could be described by (1) and (2).
where, is the active power consumption from grid, is the reactive power consumption from grid, is the active power consumption of conventional residential loads, is the reactive power consumption of conventional residential loads, is the active power consumption of PFC connected loads, is the reactive power consumption or contribution of PFC connected loads.Here, n denotes the PFC number and N is the number of available PFC connected resources. The reactive power resources and loads are described pictorially in Figure 1 for .
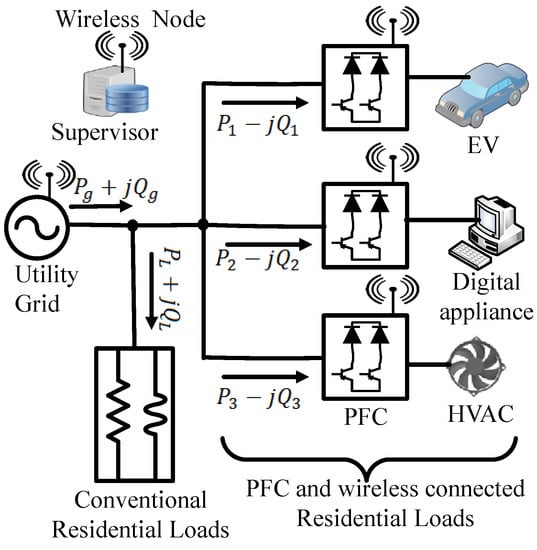
Figure 1.
Reactive power resources in wireless networked residential loads.
2.2. PFC Connected Smart Residential Load
PFC converters for the appliance in Figure 1 can support reactive power. The circuit configuration for a PFC converter supporting reactive power is shown in Figure 2. Bridgeless unidirectional single phase boost PFC converter topology has been used in Figure 2. This converter has two diodes, , and two semiconductor switches, , , input inductor, L and DC bus capacitor, C. The detailed analysis of the circuit is available in References [6,7,33]. Each converter is controlled by using a PFC controller. It generates complementary pulse width modulated (PWM) signals for and [34].
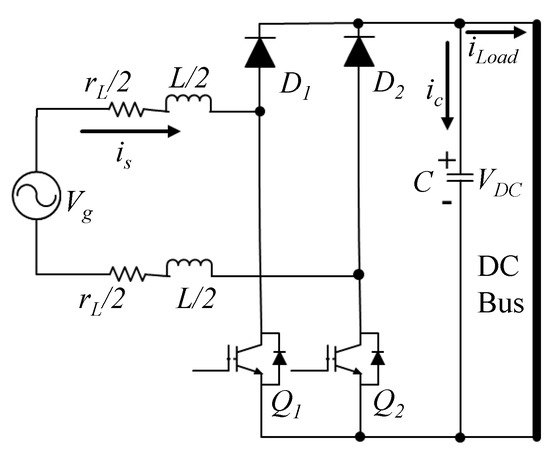
Figure 2.
Circuit diagram of a bridgeless ac-dc boost power factor correction (PFC) converter.
The controller for PFC converter can supply a specified amount of reactive power.
This type of PFC controller is shown in Figure 3. The controller takes as reactive power reference and contributes Q to the power network.
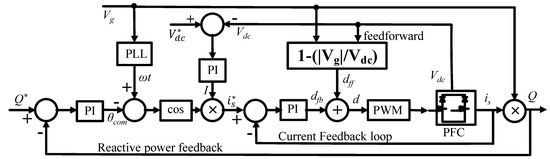
Figure 3.
Control diagram of a bridgeless ac-dc boost PFC converter.
The controller initially maintains the proper DC bus voltage and in-phase current. Then, by controlling current, it makes the PFC converter the leading load and contributes reactive power to the network. This controller uses both feedback and feedforward terms to maintain inner current and outer voltage loops. Output current, DC link voltage and reactive power measurements are used as feedback signals for PI controllers. Phase angle, , is determined by phase lock loop (PLL) using grid voltage, .Feedback and feedforward duty cycle values are added before the generation of PWM signals.
The inner current loop is the fastest control loop in this controller and maintains leading-phase current based on the compensation angle, and the output of the voltage control. DC voltage feedback control is maintained by a PI controller, voltage reference, and feedback . The is determined by using a PI controller and reactive power feedback. A sinusoidal signal is reconstructed using PLL and a cosine function. The reactive power compensation loop has 2 key Equations (3) and (4).
AC current reference, , is obtained by I, and .
Error in the inner current loop is calculated by applying the following equation.
Current error is compensated by feedback duty, , using (9).
Feedforward duty, is generated from (10).
Finally, feedback and feedforward duty is added to generate PWM signal.
The detailed description and design of the PFC controller for reactive power support is available in Reference [6]. The waveforms of input current, duty and PWM switching signal are shown Figure 4.
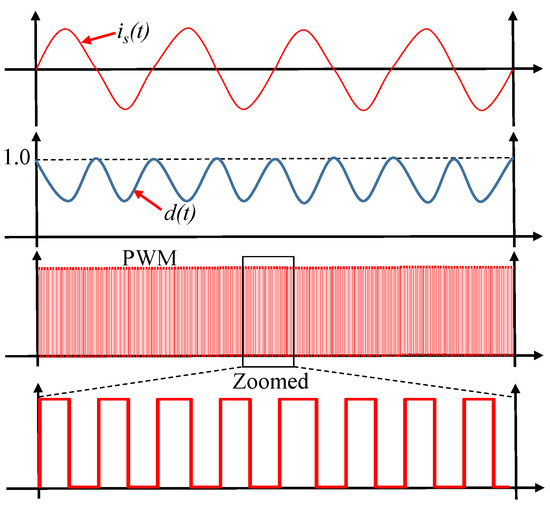
Figure 4.
Waveforms during PFC switching.
2.3. Wireless Network and Supervisory Reactive Power Control
To improve the overall power factor in the proposed scenario, a supervisory controller has been included in Figure 1 using the wireless connectivity. The proposed power network has three PFC converters.These PFC converter can contribute a specified amount of reactive power as discussed in Section 2. However, reactive power demand could change with time. In demand-varying conditions, the supervisory controller identifies the reactive power demand and maintains equal amount of reactive power support from the PFC converters. If the load demand for reactive power increases, the supervisory controller ensures more reactive power. On the other hand, if the load demand decreases, the supervisory controller decreases reactive power supplied. Through this method, the supervisory controller tries to maintain unity power factor for the proposed scenario. It is recommended to maintain the grid’s power factor (p.f.) as close to 1.00 possible [35]. From the definition of power factor, the following equation can be written.
From (12), it is clear that the power factor will be unity if and only if . In that case, the condition of (2) becomes the condition of (13).
In dynamic conditions, (13) can be expressed by (14).
where, t represents time. The grid reactive power is minimized by making close to 0. To minimize , the supervisory control technique was applied as shown in Figure 5. In this proposed technique, a proportional integral (PI) controller is used to compensate to 0.
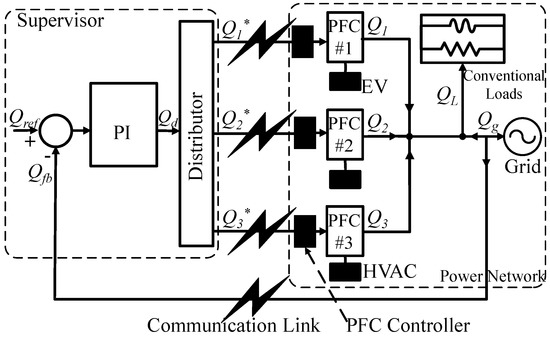
Figure 5.
Supervisory control for reactive power resources using wireless connectivity.
The supervisory controller is shown in Figure 5 and named as supervisor. Supervisor is comprised of a PI controller, reference and distributor. is set to zero, so that become zero. From the difference of the and , the error is generated. Based on the error, the PI controller sets a reference of total reactive power demand, . is total reactive power that need to be fulfilled by all available PFC converters. Using a distributor, this demand is distributed and assigned to individual PFC controllers. Individual PFC controllers get command for reactive power references of . The commands are obtained though wireless network. After performing the control, PFC converters contribute amounts of reactive power to the power network. Individual PFC converter has individual local control loops to maintain reactive power support. These local controllers get the reference from supervisory controller based on their capacity.
The response time, wireless communication delay and capacity of the PFC converters are factors of the supervisory control design consideration. The supervisor is a single input multiple output (SIMO) system. The power network of the smart home is considered as a multiple input single output system (MISO). The whole system is a single input single output (SISO) feedback system. A host program maintains the supervisory controller. A varmeter measures reactive power consumption from the grid, . is the feedback for the supervisory controller.
3. Supervisory Controller Design
The supervisory controller governs the distributed PFC connected loads using wireless communication link and a server. The response of the supervisory controller is slower than the individual PFC controllers. The control system configuration, design challenges and solution are discussed below.
3.1. Control System Configuration
The functional block diagram of the supervisory reactive power control scheme is shown in Figure 5 for the power network of Figure 1. Figure 5 describes the role of the supervisor which is comprised of a PI controller and a distributor. To design the proper PI controller, the system should be analyzed in the control system perspective. By that manner, supervisory reactive power compensation system can be modeled as in the control system as shown in Figure 6.
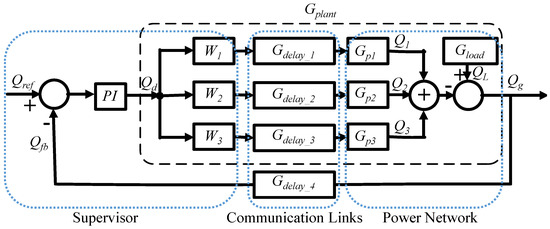
Figure 6.
Control block diagram for reactive power compensation with multiple PFCs.
In the control block diagram, , and are the weighting factors of the distributor. is the transfer function of the communication delay due to wireless links. is the transfer function for conventional loads. , and are transfer functions of the PFC converters including their controllers for reactive power compensation. To design the proper PI controller, all PFC converters, delays and loads transfer functions have been put together and considered as plant, . The output of the PI controller determines the reactive power demand, . The transfer function of the overall feedback loop can be written as in (15).
For asynchronous unequal delays and dynamic loading conditions the transfer function of the plant can be written as in (16).
where, , . denotes trace of the matrix. Although Equations (15) and (16) are seem like deterministic representation of the feedback system, the dynamic nature of can cause this representation to yield inaccurate results. , changes with the change of , , , , , , and . changes with the change of load demand. The response of , and are mutually independent and asynchronous because of the different command schedules for different PFC converters. The transfer functions for , and ) can be determined from Section 2.2. is the reason for multiple phase shifts between commands. , and are variable with respect to the capacity of the PFC converters. As a result, has uncertainty, non-linearity and multiple asynchronous phase shifts in dynamic conditions.
3.2. System Identification
Because of the uncertainty, non-linearity and asynchrony, accurate can’t be determined from (16) at any instant. So, alternative method is proposed to get the transfer function response characteristics. System identification method is applied to get the characteristic of the system. The system has been identified for , , and by applying step input and measuring settling time. The settling time is the main feature that has been used to design supervisory controller considering it is an asynchronous distributed system. The settling time depends on the transfer function of the system.
3.3. Solution for Multiple Asynchronous Phase Shift
Different settling time, wireless communication delay time and overall response time for the proposed supervisory control system are explained by timing diagram in Figure 7. The timeslots , and are communication delay time for PFCs; in other words those are settling time of . After these time slots PFCs execute their received command from supervisory controller within their settling times. The received commands are reference amount of reactive power assigned for the individual PFC converters. The necessary times for reactive power compensation of PFC’s are , and ; in other words these are settling time of , and . is a flexible waiting time before getting reactive power measurement from varmeter.
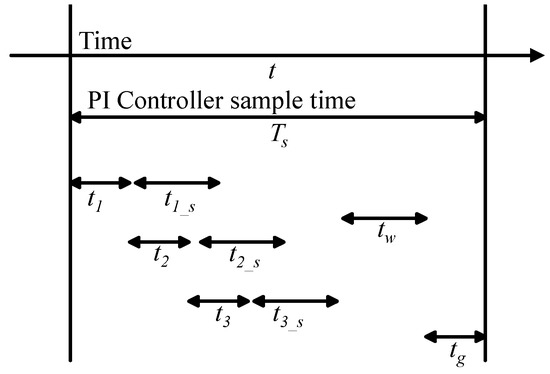
Figure 7.
Time slots consideration for supervisory controller design.
is the communication time slot assigned for varmeter to send data to supervisor. The optimal value of and are determined by from the experiments. The value of , , , and are determined by system identification method as discussed in Section 3.2. The overall value of , and depends on the communication link and should be determined with certainty. The value of can be adjusted to ensure certainty of the response. All the time slots are added in (17) to get the minimum optimal sample time, , for the supervisory controller.
3.4. PI Controller Design
The minimum sample time, , is used to design the discrete PI controller. The block diagram for the discrete PI controller is shown in Figure 8a. The integrator for the PI controller has a sample time of . The output of the PI controller is , which is the reactive power demand from all of the PFC converters. Since the system has certainty of response using the sampling time of , Ziegler-Nichols rule can be used to design PI compensator for this system [36,37,38]. Using the rule, the values of and are determined by (18) and (19) for the ultimate gain .
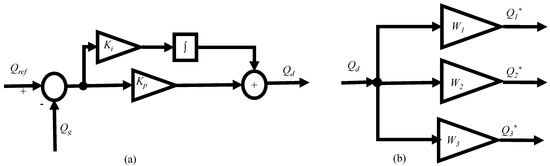
Figure 8.
Detail diagram of supervisory control (a) proportional-integral (PI) controller (b) Distributor.
For the wireless communication, communication time is much higher than response time of PFC converters that is, . The value of ultimate gain is 1 for such system.
3.5. Distributor Design
The value of the is distributed by the weighting factors , and . The weighting factors are determined from the maximum reactive power support capacities (, and ) of the PFC converters. The value of weighting factors can be determined from (20).
4. Testbed Description
The configuration for hardware-in-the-loop (HIL) testbed for the proposed supervisory controller and scenario is shown in Figure 9.
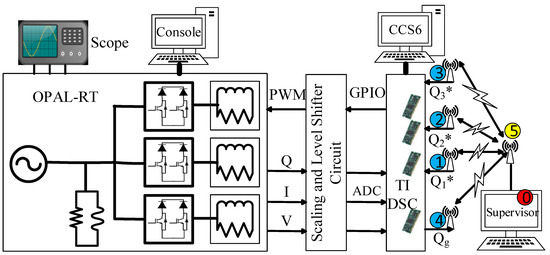
Figure 9.
Block diagram of the testbed.
The testbed consists of an Opal-RT real-time simulator OP4510, TI-DSCs, scaling and level shifter circuits, AwiaTech wirelessHART modules [39], ESP8266 Wi-Fi modules [40] and communication links. The proposed power network has been simulated in real-time using OP4510 real-time simulator. The waveforms of voltages, currents and reactive power were observed from both the oscilloscope and the computer console connected to the OP4510. The real time simulation data is also stored in .mat files from the console for further analysis. The measured voltages, currents and reactive powers from OPAL-RT are scaled down using the Op-Amp based circuit to use in the ADC of the TI-DSCs. One of the TI-DSCs transmits the value of reactive power consumption from the grid input power node. The rest of the TI- DSCs are designated to control the PFC converters. The controller of Figure 3 has been implemented to those TI-DSCs. TI-DSCs were programmed using Code Composer Studio v.6 (CCS6). All the TI-DSCs are connected to AwiaTech wirelessHART modules and ESP8266 Wi-Fi modules via serial (UART) connections for the communication links to the supervisor. Communication nodes are numbered from 0 to 5 in Figure 9. The connections of ESP8266 Wi-Fi and AwiaTech wirelessHART modules were switchable in the node 1–4. Node 5 has different configurations based on the communication preference. The description of wireless network configuration will be discussed in the Section 4.3.1.
The HIL testbed is validated by three types of physical devices: wireless modules, digital controllers and real time simulator. The actual testbed setup is shown in Figure 10. OP4510 is used to simulate the power stages in real time; TI-DSCs are used as controllers of the PFC converters; AwiaTech wirelessHART or ESP8266 Wi-Fi modules are used as interface of communication link; Op-Amp based circuits have been used for the ADC scaling and buffers have been used for the level shifting of PWM signals; a supervisory controller have been implemented in the computer that is connected to the internet and the master AwiaTechHART module. The supervisory controller ensures zero reactive power consumption from the grid. The components of the test bed are described in the following subsections.
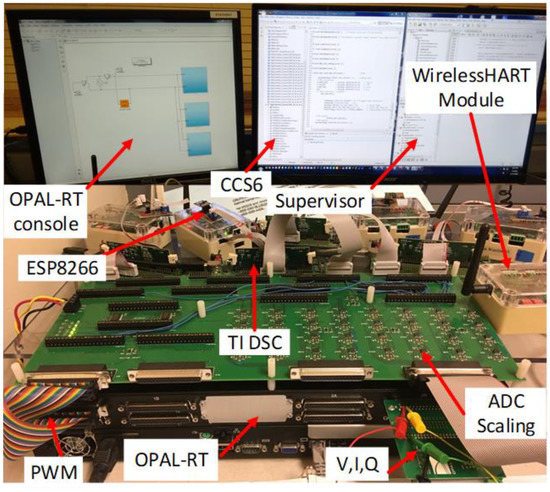
Figure 10.
Hardware in the loop testbed set up.
4.1. Hardware Description
4.1.1. Real Time Simulator
The power stages of the PFC converters, loads, measurement of voltage and current and active and reactive power are simulated in real-time (RT) using OPAL-RT real-time simulator, OP4510. It has 128 I/O channels, a quad core INTEL Xeon 3.3 GHz processor as well as a Kintex 7 FPGA for sub-microsecond simulation time steps [41]. Each core of the processor has the capability to simulate up to 20 µs time step. The system is compatible with Simulink and the SimPowerSystems library. The OP4510 is also connected to an oscilloscope to monitor voltage, current and reactive power in real time. For this testbed, analog values of voltages and currents are routed from the FPGA based model to the DAC channels directly. The PWM signals are interfaced with digital input pins which drive the FPGA based modesl of IGBTs. These two steps ensure sub-microsecond RT simulation. The reactive power is calculated using Fourier transform in the CPU core at a step of 25 µs and later routed to DAC channels.
4.1.2. ADC Scaling and Level Shifting Circuit
The analog output signals for V, I and Qs are ±16 V in OP4510. The ADC level of TI-DSCs is limited to 0–3.3 V. To interpret and match the analog signal level properly, Op-Amp (TL082C) based scaling and offsetting circuits have built. The GPIO of TI-DSC has a logic level of 3.3 V and OP4510 takes 5 V PWM input. As a result, a 74HC240D IC has been used as a buffer for level shifting. The level shifting and ADC scaling circuit has been built up in the same PCB as shown in Figure 10. The PCB also has connectivity to Opal-RT by two DB37 connectors and connect TI-DSCs with the 20 pin connectors. This circuit has 32 analog and 32 digital re-routable channels. The ADC scaling and level shifting circuit is shown in Figure 11.
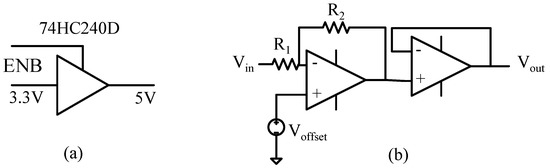
Figure 11.
Interface circuit: (a) level shifting (b) ADC scaling.
4.1.3. Texas Instruments Digital Signal Controller
The TI-DSC, TMS320F28335, was selected to control the PFC converters that were simulated in real-time on the OP4510. In addition, the DSC code includes UART communication which interfaces either the AwiaTech wirelessHART or the ESP8266 Wi-Fi modules. The TMS320F28335 is a 32 bit floating point processor with clock speeds up to 150 MHz and 18 PWM channels [42].
4.1.4. WirelessHART and AwiaTech Wireless 220 Module
To implement the communication system for the testbed, AwiaTech WirelessHART (Wireless Highway Addressable Remote Transducer) modules were chosen. WirelessHART is a simple, secure, reliable, real-time and open-standard networking technology, operating in the 2.4 GHz ISM radio band [43]. It uses a time-synchronized, self-organizing and self-healing mesh network architecture. At the bottom of its communication stack, WirelessHART adopts IEEE 802.15.4-2006 [31] as the physical layer. On top of that, WirelessHART defines its own time-synchronized data link layer. In WirelessHART, communications are precisely scheduled based on Time Division Multiple Access (TDMA) and employ a channel hopping scheme for added system data bandwidth and robustness [43]. AwiaTech Wireless provides a variety of interfaces such as UART, JTAG, SPI/I2C and USB, which provides us the flexibility for interconnecting the TI DSC. The features of this module are shown in Figure 12a.
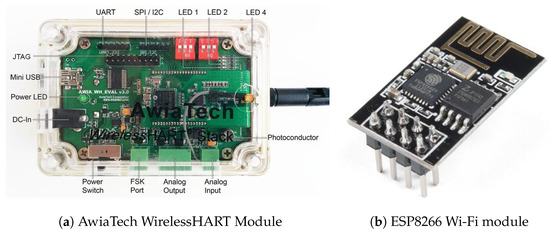
Figure 12.
Wireless communication modules.
4.1.5. WiFi and ESP8266 Module
Four ESP8266 modules have been used in the test bed [40]. ESP8266 has serial communication (UART) features as in Figure 12b. It can give any microcontroller access to your WiFi network and maintain TCP/IP protocol by IEEE standard 802.11/b/g/e [32]. These modules have been programmed using an Arduino programming environment.
4.2. Software Components Description
4.2.1. TI DSC Code Architecture
The PFC controller has a 20 µs sample time. It generates a 50 kHz PWM signal. One interrupt has been used to compute ADC values, scaling, controller operation and the PWM update. For the low speed communication links, a polling method has been used. The communication function is executed in an infinite while loop. All the functions are executed within a 20 µs window.
The ADC interrupt and controller computations consume only 12 µs and the remaining 8 µs is designated for communication through UART. Figure 13 describes the interrupt and while loop structure.
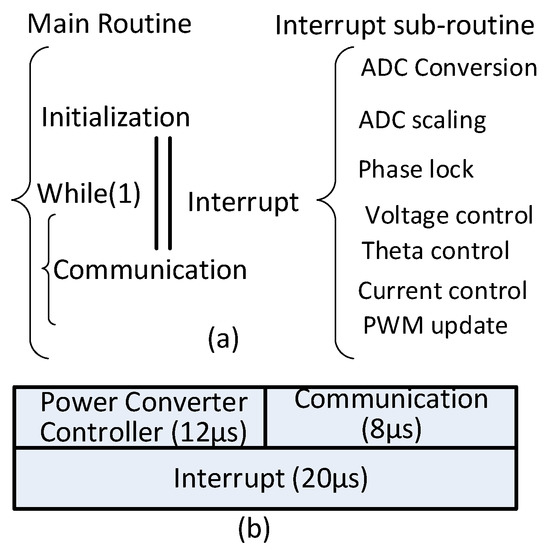
Figure 13.
(a) Code structure of TI DSC (b) Execution time of code sections.
4.2.2. Host Program
AwiaTech wireless provides a Java package “Host” which is encapsulated within a series of APIs, enabling users to write programs which process all the data acquired from WirelessHART network. Based on these APIs, “Host” software is customized as an interface between the wireless network and the supervisory controller. This design separates communication and control, which provides scalability to use other wireless communication technologies without modifying the controller code. In addition, this architecture enables the convenient use of other languages. The host program has been modified using TCP/IP link as well. The TCP/IP link has been used to maintain communication links to the ESP8266.
4.2.3. Supervisory Controller Implementation
The supervisory controller gives the control signal to the power converters. It is also capable of collecting data from the input port of the power network. The algorithm for the supervisory controller is written in C++ code and later called from the JAVA platform which maintains communication functions. The supervisory controller has a low speed proportional integral controller with a limiter and distributor as discussed in Section 3.
4.2.4. Dataflow
A complete dataflow is presented in Figure 14. The data flow in the test bed is composed of 8 steps, starting from a TI DSC and ending in a TI DSC. First, a TI-DSC sends a HART-IP command containing data to the AwiaTech wireless (device) through UART. Second, AwiaTech wireless forwards this command to the access point based on WirelessHART standard. Third, the access point sends data to a desktop running Host and Gateway software with UART over USB using a FTDI chip. Fourth, after Host receives the data, it forwards it to the supervisory controller. For the WiFi network, HART-IP has been decoded at ESP8266 and sent to the AP and host through the Wi-Fi. Our Host program will exchange messages with the controller through Stdin and Stdout. The dataflow in the other direction will follow the same steps in reverse.
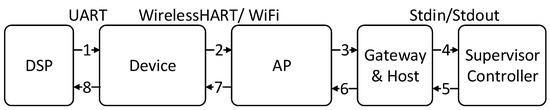
Figure 14.
Dataflow between TI DSC and supervisory controller.
4.3. Communication Link Description
4.3.1. Wireless Communication Set Up
The communication network topology for WiFi and WirelessHART has been shown in Figure 15.
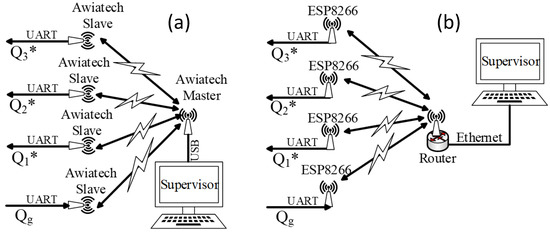
Figure 15.
Wireless network topologies for testbed (a) WirelessHART (b) WiFi.
Either all ESP8266 or all AwaiaTech modules are connected to the TI-DSC through UART. The UART to module connections are switchable for Wi-Fi and wirelessHART. Four AwiaTech modules maintain communication links with a fifth AwiaTech wireless module, which is connected to a host computer, where the supervisory controller is running.
On the other hand ESP8266 is connected to the internet via Wi-Fi and a router. The supervisory controller can use internet to control the PFC converters for Wi-Fi network preference. Multiple unidirectional PFC converters contribute reactive power support by following a reference command by a supervisory controller via wireless modules. Real-time algorithms or strategies for energy and power management systems can validate their performance in this testbed. The network topology in our experiments is shown in Figure 16, the blue circles are devices connected to TI DSCs; the yellow circle is the access point and the red circle is the gateway. A dotted line indicates the wireless communication through WirelessHART or WiFi. The solid line indicates the wired communication through USB or Ethernet. The numbers on the lines show the signal strength of the wireless links. The Figure 16 shows all the components in our network and their unique IDs, types and scan periods.

Figure 16.
Wireless network topology.
4.3.2. Integrity of the Specification
The Figure 17 shows an example of simplified network schedule which is shared with all the devices and the access point in the network. The super-frame size is 500 ms and two up-links and down-links for each device are statically allocated inside one superframe. In Figure 17, a time slot is represented by a small square with a number and an arrow. For example, means the time slot is scheduled for Device 2 as an up-link. The wireless message exchanging sequence is shown in Figure 17. At the beginning of a super-frame, the TI-DSC sends measurement to Device 1.
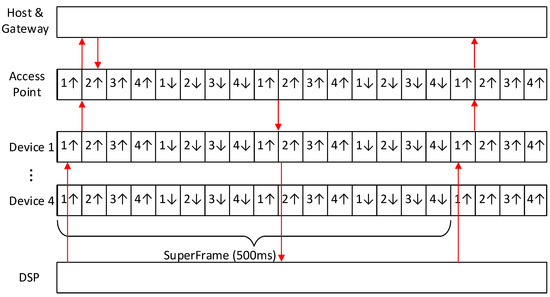
Figure 17.
Communication schedule configuration.
Then Device 1 sends the data to an access point within its own timeslot. After receiving the data, the access point sends the data to the host. Next, the Host software will send what it just received to the supervisor controller for calculation. After that, the controller will send data back to control the TI DSC. It will go through the path in reverse. The access point will get the data and wait for the time slot allocated for Device 1. Once the time slot arrives, the access point sends the data down to Device 1 and then Device 1 sends data to the TI-DSC through UART. Theoretically, if we set the super-frame length to be 500 ms and within one super-frame and we allocate two time slots as up-links, the smallest sampling period would be 250 ms. However, due to the noisy wireless environment, we chose a much larger sampling rate and super-frame length. From the wireless link test, we were able to make the super-frame size 1.5 s without any data loss.
5. Experimental Results
The test bed has been implemented to validate the supervisory controller for reactive power support using the proposed power network of Figure 1. OP4510 has simulated the power network in real-time. It takes PWM signal as input and gives analog signals as output. Rest of the components are actual physical device in the HIL test bed. Multiple tests have been conducted to validate the idea of reactive power support and supervisory controller.
5.1. Reactive Power Compensation in a Single PFC Converter
Reactive power has been supported by applying controller of Figure 3 to a PFC converter. The wave form of voltage and current in a PFC converter for different conditions has been captured using an oscilloscope and shown in the following figure. The waveforms are collected from the analog output of the OP4510 real-time simulator. PFC 1 has been built up as in the circuit of Figure 2 using mΩ, mH, µF and mΩ. PFC 1 is rated for V(rms), Hz, kW, V(DC) and = 56.79753 Ω. Different power conversion criteria for PFC 1 under conditions of Figure 18 are shown in the Table 1.
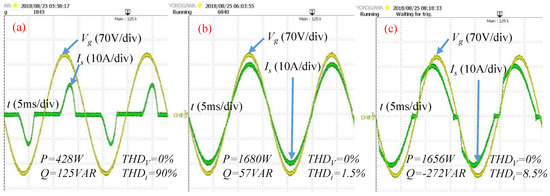
Figure 18.
Input voltage and current waveforms in PFC 1: (a) no controller, (b) in phase controller, and (c) leading phase controller, .

Table 1.
Power conversion in PFC 1 for different conditions.
Figure 18a shows the input current and voltage waveforms without applying any control that is, current flows through the diode only.
This condition has very poor performance and can not fulfil the rated conditions. It has very high total harmonic distortion (THD) for the input current. After applying the reactive power compensation algorithm of Figure 3, voltage and current are almost in phase as in Figure 18b. Reactive power has not been injected for this case that is, reactive power reference is zero, . Although is equal to zero but, is not exactly zero because of delays, offset and measurement errors. In this case, current distortion is minimum. Leading phase of current has been achieved as in Figure 18c as has been set to negative values. Hence, reactive power has been supported by PFC 1. In this case, the current is not a pure sine wave at zero crossing because of zero crossing distortion. The distortion phenomenon has been considered to determine the maximum capacity of reactive power support () for PFC 1. Since, the household load is very small with respect to grid, the voltage supply has been considered to be coming from an infinite bus. As a result, distortion for input voltage, is zero in the realtime simulation.
5.2. Reactive Power Support Using Supervisory Controller
After setting up the communication networks successfully, the HIL test was conducted for the proposed residential power network. For the proposed scenario, rated grid voltage is 120 V(rms), 60 Hz. Conventional load is 1500 VA with 0.8 power factor that is, = 1200 W, = 900 VAR. Rated output voltage, , of all three PFCs is 250 V(DC). Output power, , rating of the PFC’s are 1.1 kW, 1.5 kW and 1.7 kW.
Weighting factors used in supervisory controller , and are 0.25, 0.35 and 0.4 respectively. Reactive power has been supported by the PFC converters to the load as shown in the in Figure 19. In this case, real-time simulation has been conducted for communication and control sample time, = 4 s. Supervisory controller engagement time has been set as reference, , on the time axis. Logged data from OP4510 shows that reactive power consumption from grid becomes 0 VAR within 75 s of applying the controller. The initial and final value of the reactive power for the grid, the load and the PFCs is shown in the Table 2.
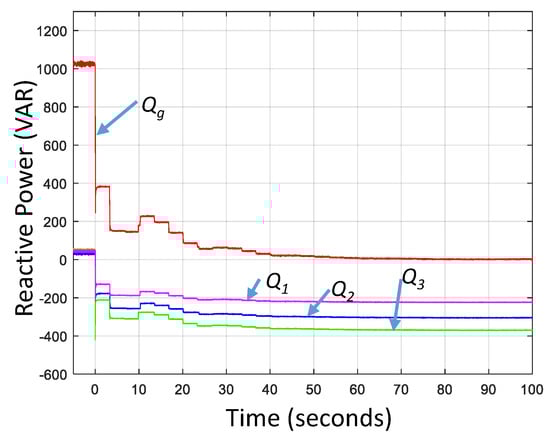
Figure 19.
Reactive power support by 3 PFC converters and supervisory controller.
Table 2.
Reactive power in different nodes of the proposed power network.
5.3. Reactive Power Support in Different Conditions
The performance of the supervisory controller has been tested for different conditions.
5.3.1. Variation of Load
The designed supervisory controller has been tested for loading conditions of ( = 1350 W, = 654 VAR), ( = 1200 W, = 900 VAR) and ( = 1050 W, = 1072 VAR). For all loading conditions, become 0 VAR within 75 s.
5.3.2. Variation of Wireless Network
The supervisory controller was tested using WirelessHART and Wi-Fi. It compensated grid reactive power for both networks as shown in Figure 20a.
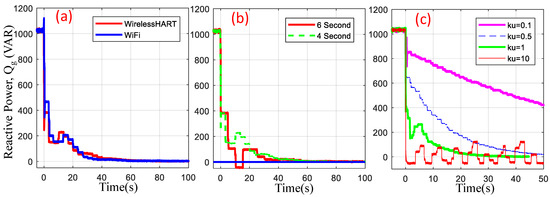
Figure 20.
Performance of supervisory controller: (a) network variation, (b) sampling time variation and (c) gain variation.
5.3.3. Sampling Time Variation
The effect of different communication sampling times has been evaluated in Figure 20b. For four and six second sampling times, supervisory controller regulated to 0 VAR. The higher the sampling time, the slower the response time for overall reactive power compensation. Minimum stable communication and control sampling time for this system has been measured to be 1.5 s. This sampling time has been used for optimal controller.
5.3.4. Gain Variation and Optimal Controller
To verify the optimal supervisory controller, the response of reactive power compensation has been compared for different , and gains. The response has been judged by settling time, overshoot, undershoot and stability. Figure 20c shows performance of supervisory controller with different gains. This controller has used = 1.5 s communication sampling time. The settling time and other factors of performance for the PI compensator are shown in Table 3.
Table 3.
Supervisory controllers performance with different PI gains.
5.4. Reactive Power Support in Dynamic Load
Different load profiles of Table 4 have been applied to test the supervisory controller. Reactive power demand were changed as the load changed.
Table 4.
Load profiles for dynamic performance test.
Load profile 1 has been applied for the conditions of Figure 21a,c. Load profile 2 has been applied and results have been gathered in Figure 21b. The PFC converters used for Figure 21a,b have the power rating() of = 1.1 kW, = 1.5 kW and = 1.7 kW. The maximum reactive power supply capacity of those PFC converters are = −300 VAR, = −400 VAR and = −600 VAR. , and have determined the weighting factors , and by (20). Load profile 1 is based on the power factor change and load profile 2 is based on apparent power demand increment.
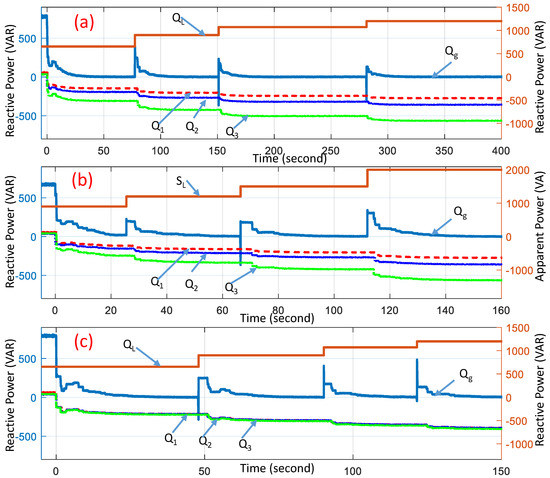
Figure 21.
Reactive power support in dynamic loads: (a) load profile 1, (b) load profile 2 and (c) Load profile 1 with equal reactive power support capability.
Dynamic response of Figure 21c used load profile 1 but it used identical 3 PFC converters. In this case, = 1.5 kW, = 1.5 kW, = 1.5 kW, = −400 VAR, = −400 VAR, and = −400 VAR. As a result, reactive power contribution from PFC converters is equal at different times in the real time simulation.
Load profiles have been implemented by changing the loads using an external switch. As a result there is a transient reactive power spike and an unequal load profile duration. For all of these conditions, the optimal controller has been used, which ensured the stable and quickest response. and have also been recorded for all the tests. for all the tests is 0% as the grid has been considered as an ideal voltage source in the real-time simulation. has varied between 4% to 10.65% for all the loading conditions after the settling times. It was observed that an increase in real and reactive power consumption ratio correlated with a decrease in .
6. Conclusions
The PFC converters are considered as reactive power resources in this paper. The supervisory controller is proposed to manage those resources. The WiFi and WirelessHART have provided the interface between the supervisory controller and reactive power resources. The optimal sampling time of the supervisory controller has been determined by various tests. The optimal gain is explained theoretically and validated experimentally. The dynamic performance of the supervisory controller has been validated using different load profiles with the reactive power demand, PFC capacity and load variations. The HIL test results prove the concept and feasibility of additional reactive power support from PFC converters in residential applications. The proposed controller design method will be useful for other small-scale power and wireless network integration.
Author Contributions
All the authors contributed substantially to the manuscript.Contributions of each author are as follows: conceptualization, S.M.R.I. and S.-Y.P.; methodology, S.M.R.I., S.-M.P. and S.Z.; software, S.M.R.I. and S.Z.; validation, S.M.R.I. and S.-Y.P.; formal analysis, S.M.R.I.; investigation, S.M.R.I.; resources, S.M.R.I. and S.-M.P.; data curation, S.M.R.I.; writing—original draft preparation, S.M.R.I.; writing—review and editing, S.M.R.I. and S.-Y.P.; visualization, S.M.R.I.; supervision, S.-Y.P. and S.H.; project administration, S.-Y.P.; funding acquisition, S.-Y.P.
Funding
This research was funded by National Science Foundation OF FUNDER grant number 1446157.
Acknowledgments
This work was supported by the National Science Foundation under grant no. 1446157. However, any opinions, findings, conclusions or recommendations expressed here in are those of the authors and do not necessarily reflect the views of the National Science Foundation.
Conflicts of Interest
The authors declare no conflict of interest. The funders had no role in the design of the study; in the collection, analyses or interpretation of data; in the writing of the manuscript or in the decision to publish the results.
References
- The U.S. Energy iNformation Administration Report 2017: Energy Consumption by Sector. Available online: https://www.eia.gov/totalenergy/data/monthly/pdf/sec2_3.pdf (accessed on 17 May 2019).
- Dixon, J.; Moran, L.; Rodriguez, J.; Domke, R. Reactive Power Compensation Technologies: State-of-the-Art Review. Proc. IEEE 2005, 93, 2144–2164. [Google Scholar] [CrossRef]
- Bing, Z.; Chen, M.; Miller, S.K.T.; Nishida, Y.; Sun, J. Recent Developments in Single-Phase Power Factor Correction. In Proceedings of the 2007 Power Conversion Conference, Nagoya, Japan, 2–5 April 2007; pp. 1520–1526. [Google Scholar] [CrossRef]
- Mansouri, M.; Kaboli, S.H.A.; Selvaraj, J.; Rahim, N.A. A review of single phase power factor correction A.C.-D.C. converters. In Proceedings of the 2013 IEEE Conference on Clean Energy and Technology (CEAT), Lankgkawi, Malaysia, 18–20 November 2013; pp. 389–394. [Google Scholar] [CrossRef]
- Nallusamy, S.; Velayutham, D.; Govindarajan, U.; Parvathyshankar, D. Power quality improvement in a low-voltage DC ceiling grid powered system. IET Power Electron. 2015, 8, 1902–1911. [Google Scholar] [CrossRef]
- Park, S.M.; Park, S. Versatile Control of Unidirectional AC–DC Boost Converters for Power Quality Mitigation. IEEE Trans. Power Electron. 2015, 30, 4738–4749. [Google Scholar] [CrossRef]
- Ivaldi, J.; Park, S.; Park, S. Integration strategy for bidirectional and unidirectional converters aiming for zero power pollution in residential applications. In Proceedings of the 2015 9th International Conference on Power Electronics and ECCE Asia (ICPE-ECCE Asia), Seoul, Korea, 1–5 June 2015; pp. 1756–1761. [Google Scholar] [CrossRef]
- Radvanovsky, R.; Brodsky, J. Handbook of SCADA/Control Systems Security; CRC Press: Boca Raton, FL, USA, 2013. [Google Scholar]
- Nasirian, V.; Yadav, A.P.; Lewis, F.L.; Davoudi, A. Distributed Assistive Control of Power Buffers in DC Microgrids. IEEE Trans. Energy Convers. 2017, 32, 1396–1406. [Google Scholar] [CrossRef]
- Azidehak, A.; Yousefpoor, N.; Bhattacharya, S. Control and synchronization of distributed controllers in modular converters. In Proceedings of the IECON 2014—40th Annual Conference of the IEEE Industrial Electronics Society, Dallas, TX, USA, 29 October–1 November 2014; pp. 3644–3650. [Google Scholar] [CrossRef]
- Gutierrez, A.; Chamorro, H.R.; Jimenez, J.F. Supervisory control for interleaved boost converters using HiLeS-designer. In Proceedings of the 2014 16th European Conference on Power Electronics and Applications, Lappeenranta, Finland, 26–28 August 2014; pp. 1–6. [Google Scholar] [CrossRef]
- Shen, J.; Khaligh, A. A Supervisory Energy Management Control Strategy in a Battery/Ultracapacitor Hybrid Energy Storage System. IEEE Trans. Transp. Electrif. 2015, 1, 223–231. [Google Scholar] [CrossRef]
- Babakmehr, M.; Harirchi, F.; Alsaleem, A.; Bubshait, A.; Simões, M.G. Designing an intelligent low power residential PV-based Microgrid. In Proceedings of the 2016 IEEE Industry Applications Society Annual Meeting, Portland, OR, USA, 2–6 October 2016; pp. 1–8. [Google Scholar] [CrossRef]
- Gabbar, H.A.; El-Hendawi, M.; El-Saady, G.; Ibrahim, E.A. Supervisory controller for power management of AC/DC microgrid. In Proceedings of the 2016 IEEE Smart Energy Grid Engineering (SEGE), Oshawa, ON, Canada, 21–24 August 2016; pp. 147–152. [Google Scholar] [CrossRef]
- Hosseinzadeh, M.; Salmasi, F.R. Robust Optimal Power Management System for a Hybrid AC/DC Micro-Grid. IEEE Trans. Sustain. Energy 2015, 6, 675–687. [Google Scholar] [CrossRef]
- AlBadwawi, R.; Issa, W.; Abusara, M.; Tapas, M. Supervisory Control for Power Management of an Islanded AC Microgrid Using Frequency Signalling-Based Fuzzy Logic Controller. IEEE Trans. Sustain. Energy 2018, 1. [Google Scholar] [CrossRef]
- Kothari, D.P.; Singh, B.; Pandey, A. Fuzzy supervisory controller for improved voltage dynamics in power factor corrected converter. In Proceedings of the 2002 IEEE Internatinal Symposium on Intelligent Control, Vancouver, BC, Canada, 30–30 October 2002; pp. 93–97. [Google Scholar]
- Islam, S.M.R.; Maxwell, S.; Hossain, M.K.; Park, S.; Park, S. Reactive power distribution strategy using power factor correction converters for smart home application. In Proceedings of the 2016 IEEE Energy Conversion Congress and Exposition (ECCE), Milwaukee, WI, USA, 18–22 September 2016; pp. 1–6. [Google Scholar] [CrossRef]
- Islam, S.M.R.; Maxwell, S.; Park, S.; Zheng, S.; Gong, T.; Han, S. Wireless networked dynamic control testbed for power converters in smart home applications. In Proceedings of the 2017 IEEE Applied Power Electronics Conference and Exposition (APEC), Tampa, FL, USA, 26–30 March 2017; pp. 1196–1202. [Google Scholar] [CrossRef]
- Harper, R. (Ed.) The Connected Home: The Future of Domestic Life; Springer: Cambridge, UK, 2011. [Google Scholar]
- Kayas, O. How to Smart Home: A Step by Step Guide for Smart Homes & Building Automation, 5th ed.; Key Concept Press: Wyk, Germany, 2017. [Google Scholar]
- White, R.M. How to Calculate Electrical Loads and Design Power Systems; CreateSpace Independent Publishing Platform: Scotts Valley, CA, USA, 2011. [Google Scholar]
- Murray, A.; Li, Y. Motion Control Engine Achieves High Efficiency with Digital PFC Integration in Air Conditioner Applications. In Proceedings of the 2006 IEEE International Symposium on Electronics and the Environment, Scottsdale, AZ, USA, 8–11 May 2006; pp. 120–125. [Google Scholar] [CrossRef]
- Fasugba, M.A.; Krein, P.T. Gaining vehicle-to-grid benefits with unidirectional electric and plug-in hybrid vehicle chargers. In Proceedings of the 2011 IEEE Vehicle Power and Propulsion Conference, Chicago, IL, USA, 6–9 September 2011; pp. 1–6. [Google Scholar] [CrossRef]
- Gungor, V.C.; Lu, B.; Hancke, G.P. Opportunities and Challenges of Wireless Sensor Networks in Smart Grid. IEEE Trans. Ind. Electron. 2010, 57, 3557–3564. [Google Scholar] [CrossRef]
- Gungor, V.C.; Sahin, D.; Kocak, T.; Ergut, S.; Buccella, C.; Cecati, C.; Hancke, G.P. Smart Grid Technologies: Communication Technologies and Standards. IEEE Trans. Ind. Inform. 2011, 7, 529–539. [Google Scholar] [CrossRef]
- Yarali, A. Wireless Mesh Networking technology for commercial and industrial customers. In Proceedings of the 2008 Canadian Conference on Electrical and Computer Engineering, Niagara Falls, ON, Canada, 4–7 May 2008; pp. 000047–000052. [Google Scholar] [CrossRef]
- Luan, W.; Sharp, D.; Lancashire, S. Smart grid communication network capacity planning for power utilities. In Proceedings of the IEEE PES T D 2010, New Orleans, LA, USA, 19–22 April 2010; pp. 1–4. [Google Scholar] [CrossRef]
- Technologies OPAL-RT. OP4510 RT-LAB-RCP/HIL SYSTEMS User Guide. Available online: https://www.opal-rt.com/simulator-platform-op4510/ (accessed on 17 May 2019).
- Texas Instruments Inc. TMS320F28335, TMS320F28334,TMS320F28332, TMS320F28235, TMS320F28234, TMS320F28232 Digital Signal Controllers (DSCs) Data Manual. Available online: http://www.ti.com/lit/ds/symlink/tms320f28335.pdf (accessed on 17 May 2019).
- IEEE Standards. IEEE 802.15.4 WPAN TG. Available online: www.ieee802.org/15/pub/TG4.html (accessed on 17 May 2019).
- IEEE Standards. IEEE 802.11TM WIRELESS LOCAL AREA NETWORKS. Available online: http://www.ieee802.org/11/ (accessed on 17 May 2019).
- Mohan, N. Power Electronics: Converters, Applications, and Design; John Wiley and Sons: New York, NY, USA, 2002. [Google Scholar]
- Monmasson, E. Power Electronic Converters: PWM Strategies and Current Control Techniques; John Wiley and Sons: New York, NY, USA, 2013. [Google Scholar]
- Chang, J.M.; Pedram, M. Power Optimization and Synthesis at Behavioral and System Levels Using Formal Methods; Springer: New York, NY, USA, 1999. [Google Scholar]
- Ogata, K. Modern Control Engineering; Pearson: New York, NY, USA, 2009. [Google Scholar]
- Ziegler, J.; Nichols, N. Optimum settings for automatic controllers. Trans. ASME 1942, 64, 759–768. [Google Scholar] [CrossRef]
- Co, T.B. Ziegler-Nichols Closed Loop Tuning. Available online: http://pages.mtu.edu/~tbco/cm416/zn.html (accessed on 17 May 2019).
- AwiaTech. Advancing Wireless Industrial Automation. Available online: http://www.AwiaTech.com (accessed on 17 May 2019).
- SparkFun Electronics. ESP8266 WiFi Module, Datasheet. Available online: https://www.sparkfun.com/products/13678 (accessed on 17 May 2019).
- Xilinx. Kintex 7 FPGA Product Table. Available online: http://www.xilinx.com/support/documentation/selection-guides/kintex7-product-table.pdf (accessed on 17 May 2019).
- Texas Instruments Inc. TMS320x2833x, 2823x High Resolution Pulse Width Modulator (HRPWM). Available online: http://www.ti.com.cn/cn/lit/ug/sprug02b/sprug02b.pdf (accessed on 17 May 2019).
- Nixon, M. A Comparison of WirelessHARTTM and ISA100.11a. Available online: https://www.emerson.com/documents/automation/a-comparison-of-wirelesshart-isa100-11a-en-42598.pdf (accessed on 17 May 2019).
© 2019 by the authors. Licensee MDPI, Basel, Switzerland. This article is an open access article distributed under the terms and conditions of the Creative Commons Attribution (CC BY) license (http://creativecommons.org/licenses/by/4.0/).