Article

Experimental Study of a Moored Floating Oscillating Water Column Wave-Energy Converter and of a Moored Cubic Box

1
Department of Civil Engineering, Ghent University, Technologiepark 60, B-9052 Zwijnaarde, Belgium
2
Environmental Physics Laboratory, Universidade de Vigo, 36310 Pontevedra, Vigo, Spain
3
Department of Civil Engineering, Università degli Studi di Firenze - UniFI, Via di Santa Marta 3, 50139 Florence, Italy
4
School of Sustainable Design Engineering, University of Prince Edward Island, Charlottetown, PE C1A 4P3, Canada
*
Authors to whom correspondence should be addressed.
Energies 2019, 12(10), 1834; https://doi.org/10.3390/en12101834
Submission received: 24 April 2019 / Revised: 8 May 2019 / Accepted: 9 May 2019 / Published: 15 May 2019
(This article belongs to the Special Issue Renewable Energy in Marine Environment)

Abstract

:
This paper describes experimental research on a floating moored Oscillating Water Column (OWC)-type Wave-Energy Converter (WEC) carried out in the wave flume of the Coastal Engineering Research Group of Ghent University. This research has been introduced to cover the existing data scarcity and knowledge gaps regarding response of moored floating OWC WECs. The obtained data will be available in the future for the validation of nonlinear numerical models. The experiment focuses on the assessment of the nonlinear motion and mooring-line response of a 1:25 floating moored OWC WEC model to regular waves. The OWC WEC model motion has 6 degrees of freedom and is limited by a symmetrical 4-point mooring system. The model is composed of a chamber with an orifice on top of it to simulate the power-take-off (PTO) system and the associated damping of the motion of the OWC WEC model. In the first place, the motion response in waves of the moored floating OWC WEC model is investigated and the water surface elevation in the OWC WEC chamber is measured. Secondly, two different mooring-line materials (iron chains and nylon ropes) are tested and the corresponding OWC WEC model motions and mooring-line tensions are measured. The performance of these two materials is similar in small-amplitude waves but different in large wave-amplitude conditions. Thirdly, the influence of different PTO conditions is investigated by varying the diameter of the top orifice of the OWC WEC model. The results show that the PTO damping does not affect the OWC WEC motion but has an impact on the water surface elevation inside the OWC chamber. In addition, an unbalanced mooring configuration is discussed. Finally, the obtained data for a moored cubic model in waves are presented, which is a benchmarking case for future validation purposes.

1. Introduction

The Oscillating Water Column (OWC) is a Wave-Energy Converter (WEC) which mainly consists of a hollow chamber, open below the water level, in which a column of water is forced to oscillate once excited by the external incident waves. The oscillation of water surface inside the chamber introduces an air-pressure variation on the above air volume that drives an air turbine and, in turn, a coaxial electrical generator. Hence, wave energy is firstly converted into pneumatic energy, secondly mechanical, and thirdly into electrical energy; the turbine and generator assembly is called hereafter the power-take-off (PTO) system of the OWC WEC. A common way of installing the OWC WECs is by fixing them to the coastline or to the nearshore seabed. This approach provides convenience in construction, operation, and maintenance. However, the available wave-energy potential decreases due to the energy dissipation of the waves approaching the coast as a result of wave-transformation processes. Consequently, offshore floating OWC WECs are interesting as they are prone to exploit the higher wave-energy resources available at an offshore sea site [1].
A comprehensive review of the history and development of OWC WECs has been given by [2], where several floating OWC WEC concepts such as the Backward Bend Duck Buoy (BBDB) [3], the Spar Buoy [4], and the U-Gen [5] WECs are introduced. Besides the functionality and efficiency of different floating OWC WECs, the hydrodynamic behaviors regarding their motion and mooring system are topics of high interest. Different numerical models have been employed to simulate the dynamics of OWC WECs. Codes based on potential theory, such as WAMIT [6], are widely used for a fast prediction of the motion of different types of floating OWC WECs, for example, the cylinder OWC WEC [7], the BBDB WEC [8,9] and the spar-buoy OWC WEC [10]. Computational Fluid Dynamics (CFD) is another popular methodology to solve the nonlinear air-fluid-mooring-coupling problem. Luo et al. [11] reports simulations of a heave-only floating OWC WEC connected to a spring type of mooring system in a numerical wave tank developed using the Fluent software [12]. Elhanafi et al. [13] thoroughly described a fully 3D numerical investigation of the hydrodynamic behavior of a floating moored OWC WEC by means of the STAR-CCM+ software [14] and validated their results using experimental data. The mooring lines in the employed tests are simulated by four pretensioned springs and are connected vertically to loadcells, and the mooring survivability is investigated in Elhanafi et al. [15]. Besides Eulerian-based methods, Lagrangian-based methods are reported as well in the literature. For example, Crespo et al. [16] presented a numerical model of a floating moored OWC WEC using Smoothed Particle Hydrodynamics (SPH) methods coupled with inelastic catenary theory, and a validation study of this model is presented in [17].
Experimental studies are also seen in the investigation of moored floating OWC WECs, for example, Correia da Fonseca et al. [18] studied the dynamics, energy extraction, and mooring system performance of the spar-buoy OWC WEC. He et al. [19] presented a series of experiments of an OWC WEC integrated to floating box-type breakwaters, primarily with a focus on coastal protection. Although many works have been carried out in the study of floating moored OWC WECs, there exist knowledge gaps in this field. On one hand, the available experimental data of floating moored OWC WECs remains scarce in the reported literature. Most of the studies focus on deep water linear wave condition scenarios, such as in [13,18,20]. On the other hand, much research concerns the heave-only OWC WEC model, such as [19]. Therefore very few studies presented the 6-degrees-of-freedom (6-DOF) motion of a floating moored OWC WEC. Gomes et al. [21] presented the 6-DOF motion response of a very small scale (1:120) slack-moored spar-buoy model, but the mooring-line tension is not investigated. Therefore, it is necessary to carry out more comprehensive studies of the motion and mooring system behaviors of a floating moored OWC WEC, especially, by means of the experiments in wave flume or wave tank as suggested by EMEC [22].
The present paper focuses on an experimental study of a slack-moored floating OWC WEC model in a wave flume. The geometry of this model is originated from the study by Crema et al. [23] who presented a concept of assembling many single units of OWC WECs fixed to a very large floating system power plant to be installed in the Mediterranean Sea. The performance of a single unit fixed OWC WEC is investigated by an experimental study carried out in the wave flume of the University of Florence (LABIMA) [24]. This laboratory scale model has also served as a benchmark test case for the assessment of CFD approaches such as that based on the Lattice Boltzmann Method [25] and the OpenFOAM source code [26]. Moreover, Simonetti et al. [27] have discussed, by means of numerical investigations, the optimization of the main geometric characteristics and the PTO damping.
For the present study of this floating moored OWC WEC model, the primary objective is to investigate the motion behavior and mooring-line tensions of the OWC WEC model subjected to regular waves of different wave periods and wave heights. Two mooring-line materials, iron chain and nylon rope, are used during the experiments for the sake of understanding the impacts of the mooring features on the nonlinear motion of the OWC WEC model. The choice of these two materials has been made to generate numerical validation data for two very different mooring-line materials, with the nylon rope representing a soft and flexible mooring line and with iron chain representing much stiffer mooring line. The PTO damping is simulated by placing an orifice on top of the OWC WEC model, through which the air can exchange between the inside of the OWC chamber and the atmosphere. Different PTO damping characteristics are compared by adjusting the orifice diameter. It should be noted that the study is not aimed at developing a new OWC WEC concept nor improving the energy conversion efficiency. In addition, in our study we include a physical model of a moored floating cubic box with dimensions and mooring system layout similar to that of the OWC WEC model. In the literature, box test cases are often used to validate numerical models (e.g., RANS, SPH, BEM-based solvers). To our knowledge, experimental validation data from tests with boxes are reported only in a few works ([28,29]). However, these test data include only simple free-floating boxes. Therefore, there is a scarcity in test data with moored floating boxes which can serve for validation of numerical models dealing with moored floating structures. As such, in the present study we introduced the box tests to deal with this knowledge gap. The novelty of the work lies on the nonlinear responses of the motion and mooring system of the floating OWC WEC model in nonlinear intermediate depth water wave conditions. Moreover, as the nonlinear numerical models are becoming increasingly popular for the simulation of floating moored OWC WECs, their validation using experimental data is crucial. However, such experimental studies are rarely seen in the literature. Therefore, a second objective of this work is to provide open access experimental data for the validation of numerical models currently under development in the wave-energy research community.
The manuscript starts in Section 1 with an introduction in numerical and experimental floating OWC WEC models and in the objectives of the present study. In Section 2, a description of the experimental setup is provided. In Section 3, validation cases using a simple slack-moored cubic box model are provided. An overview and discussion of the hydrodynamic performance of the laboratory scale OWC WEC model is presented in Section 4. Finally, the main conclusions of this work are summarized in Section 5.

2. Experimental Setup

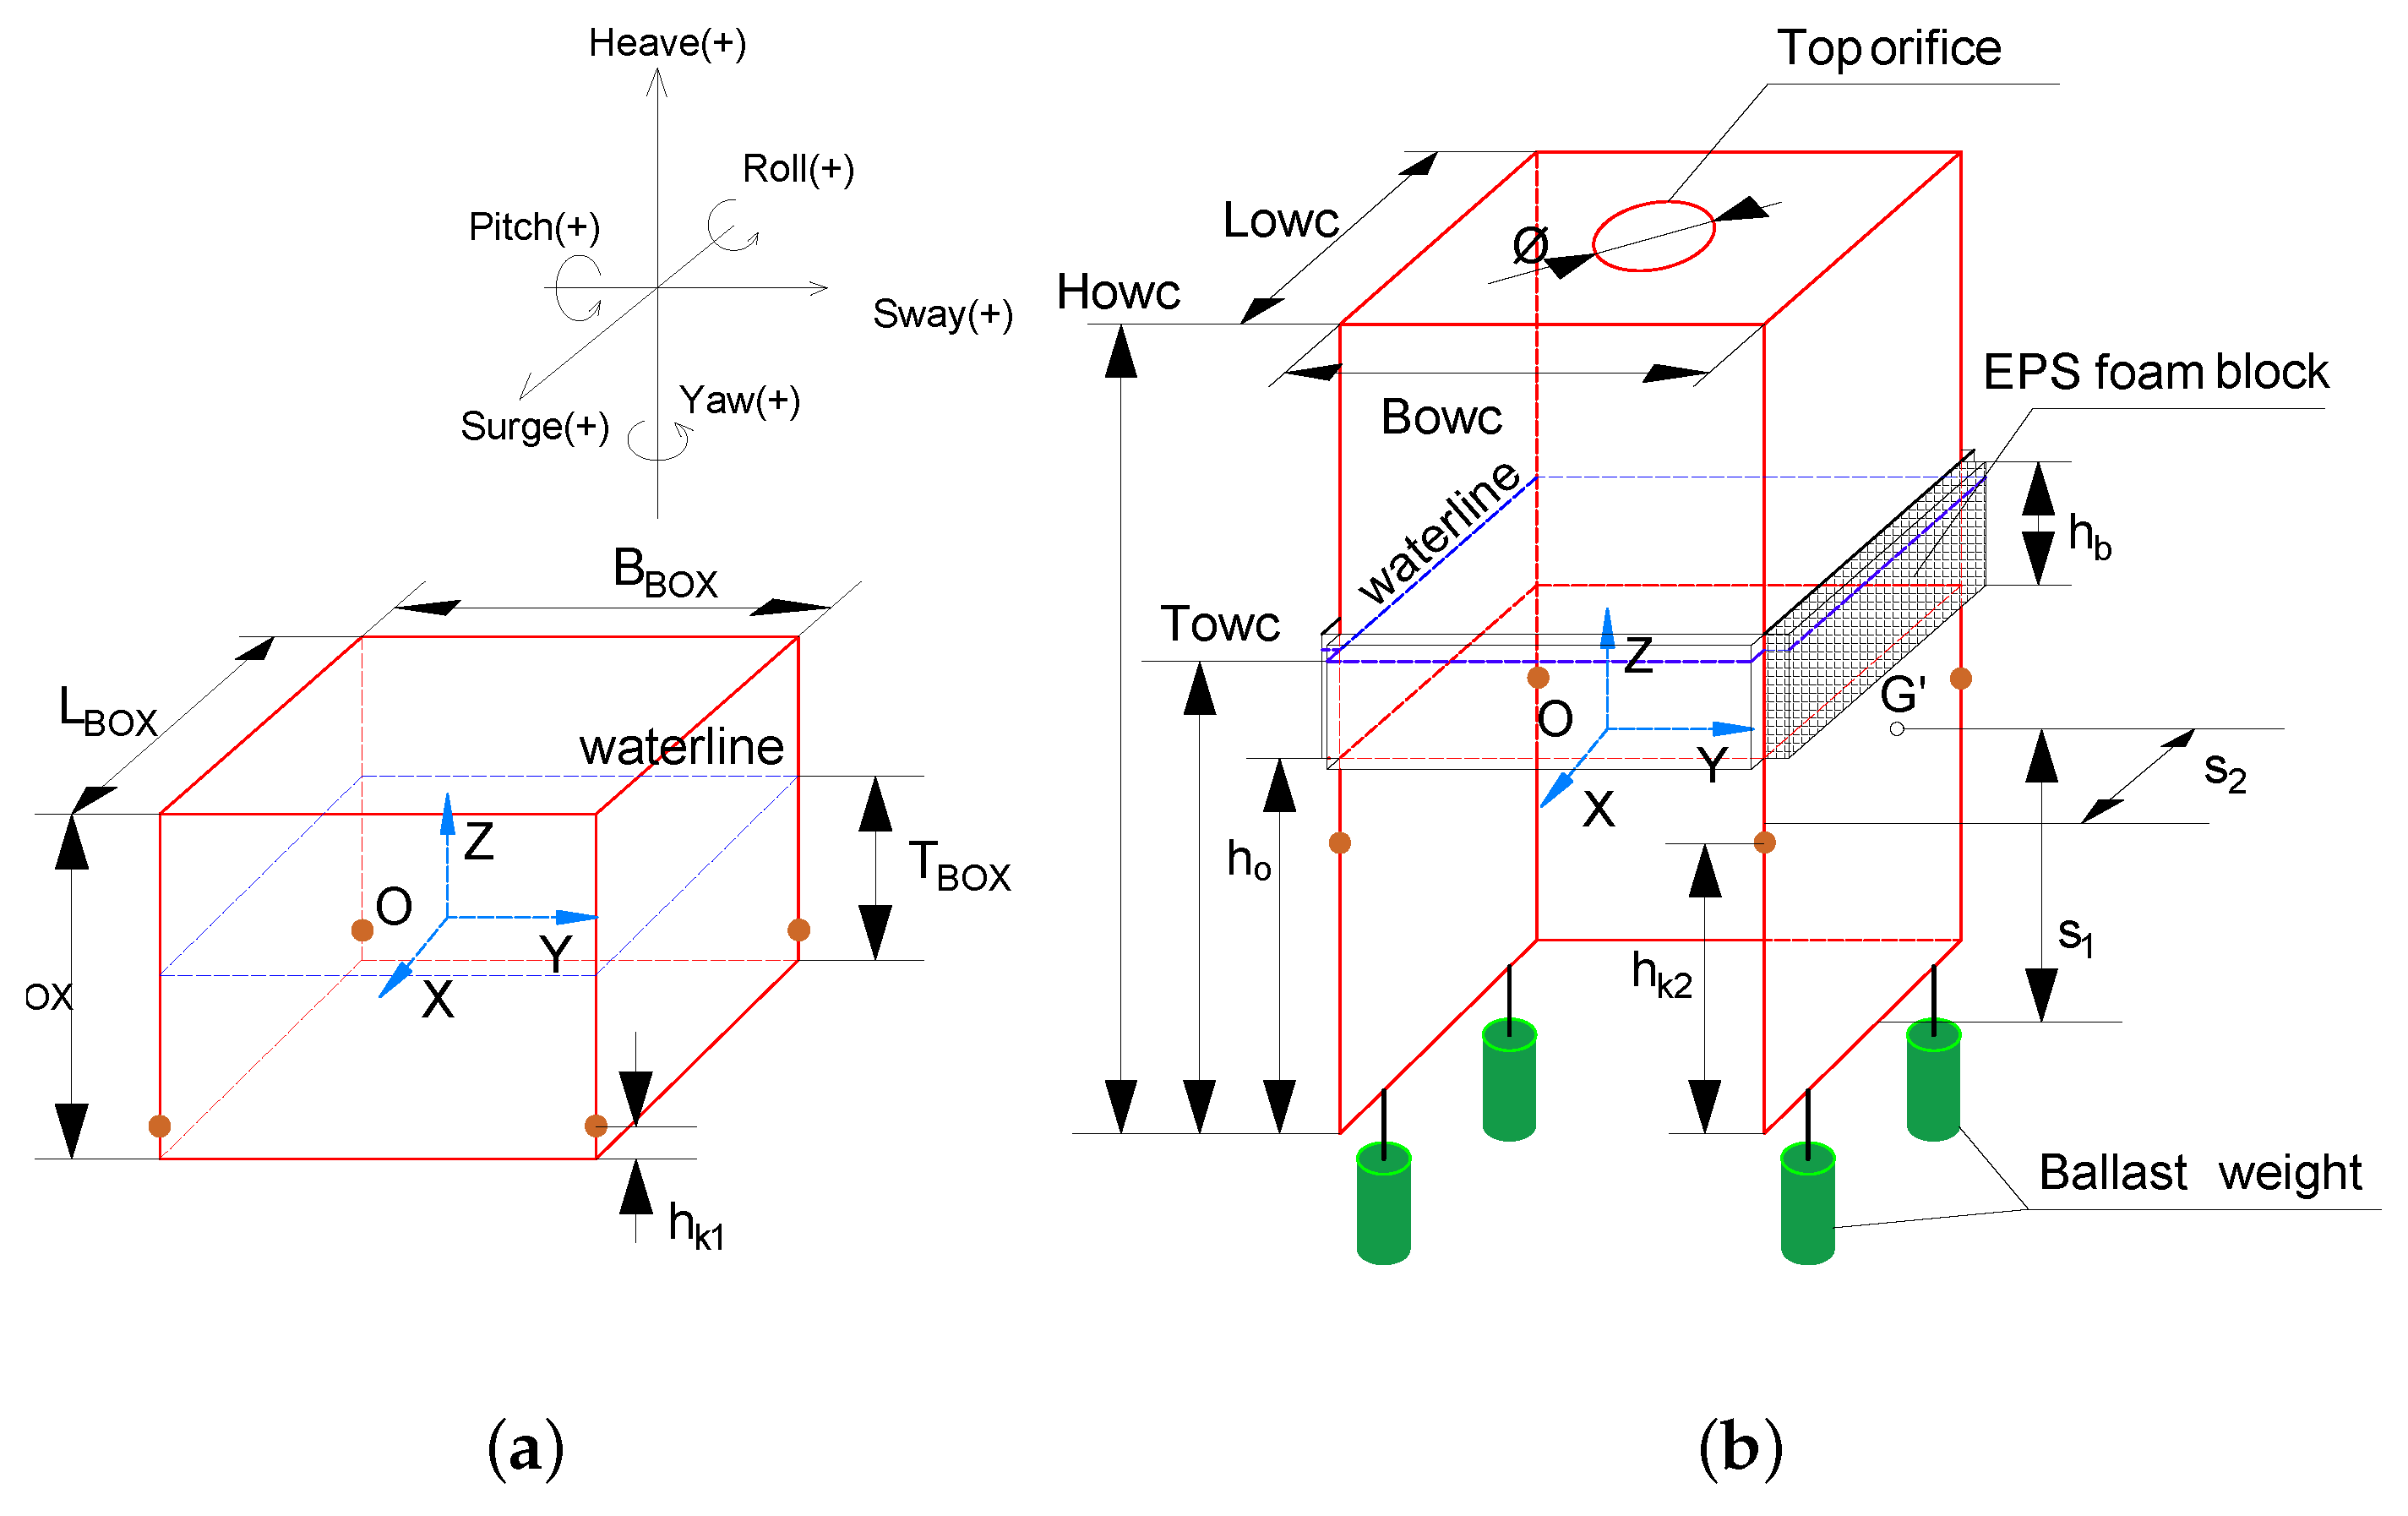
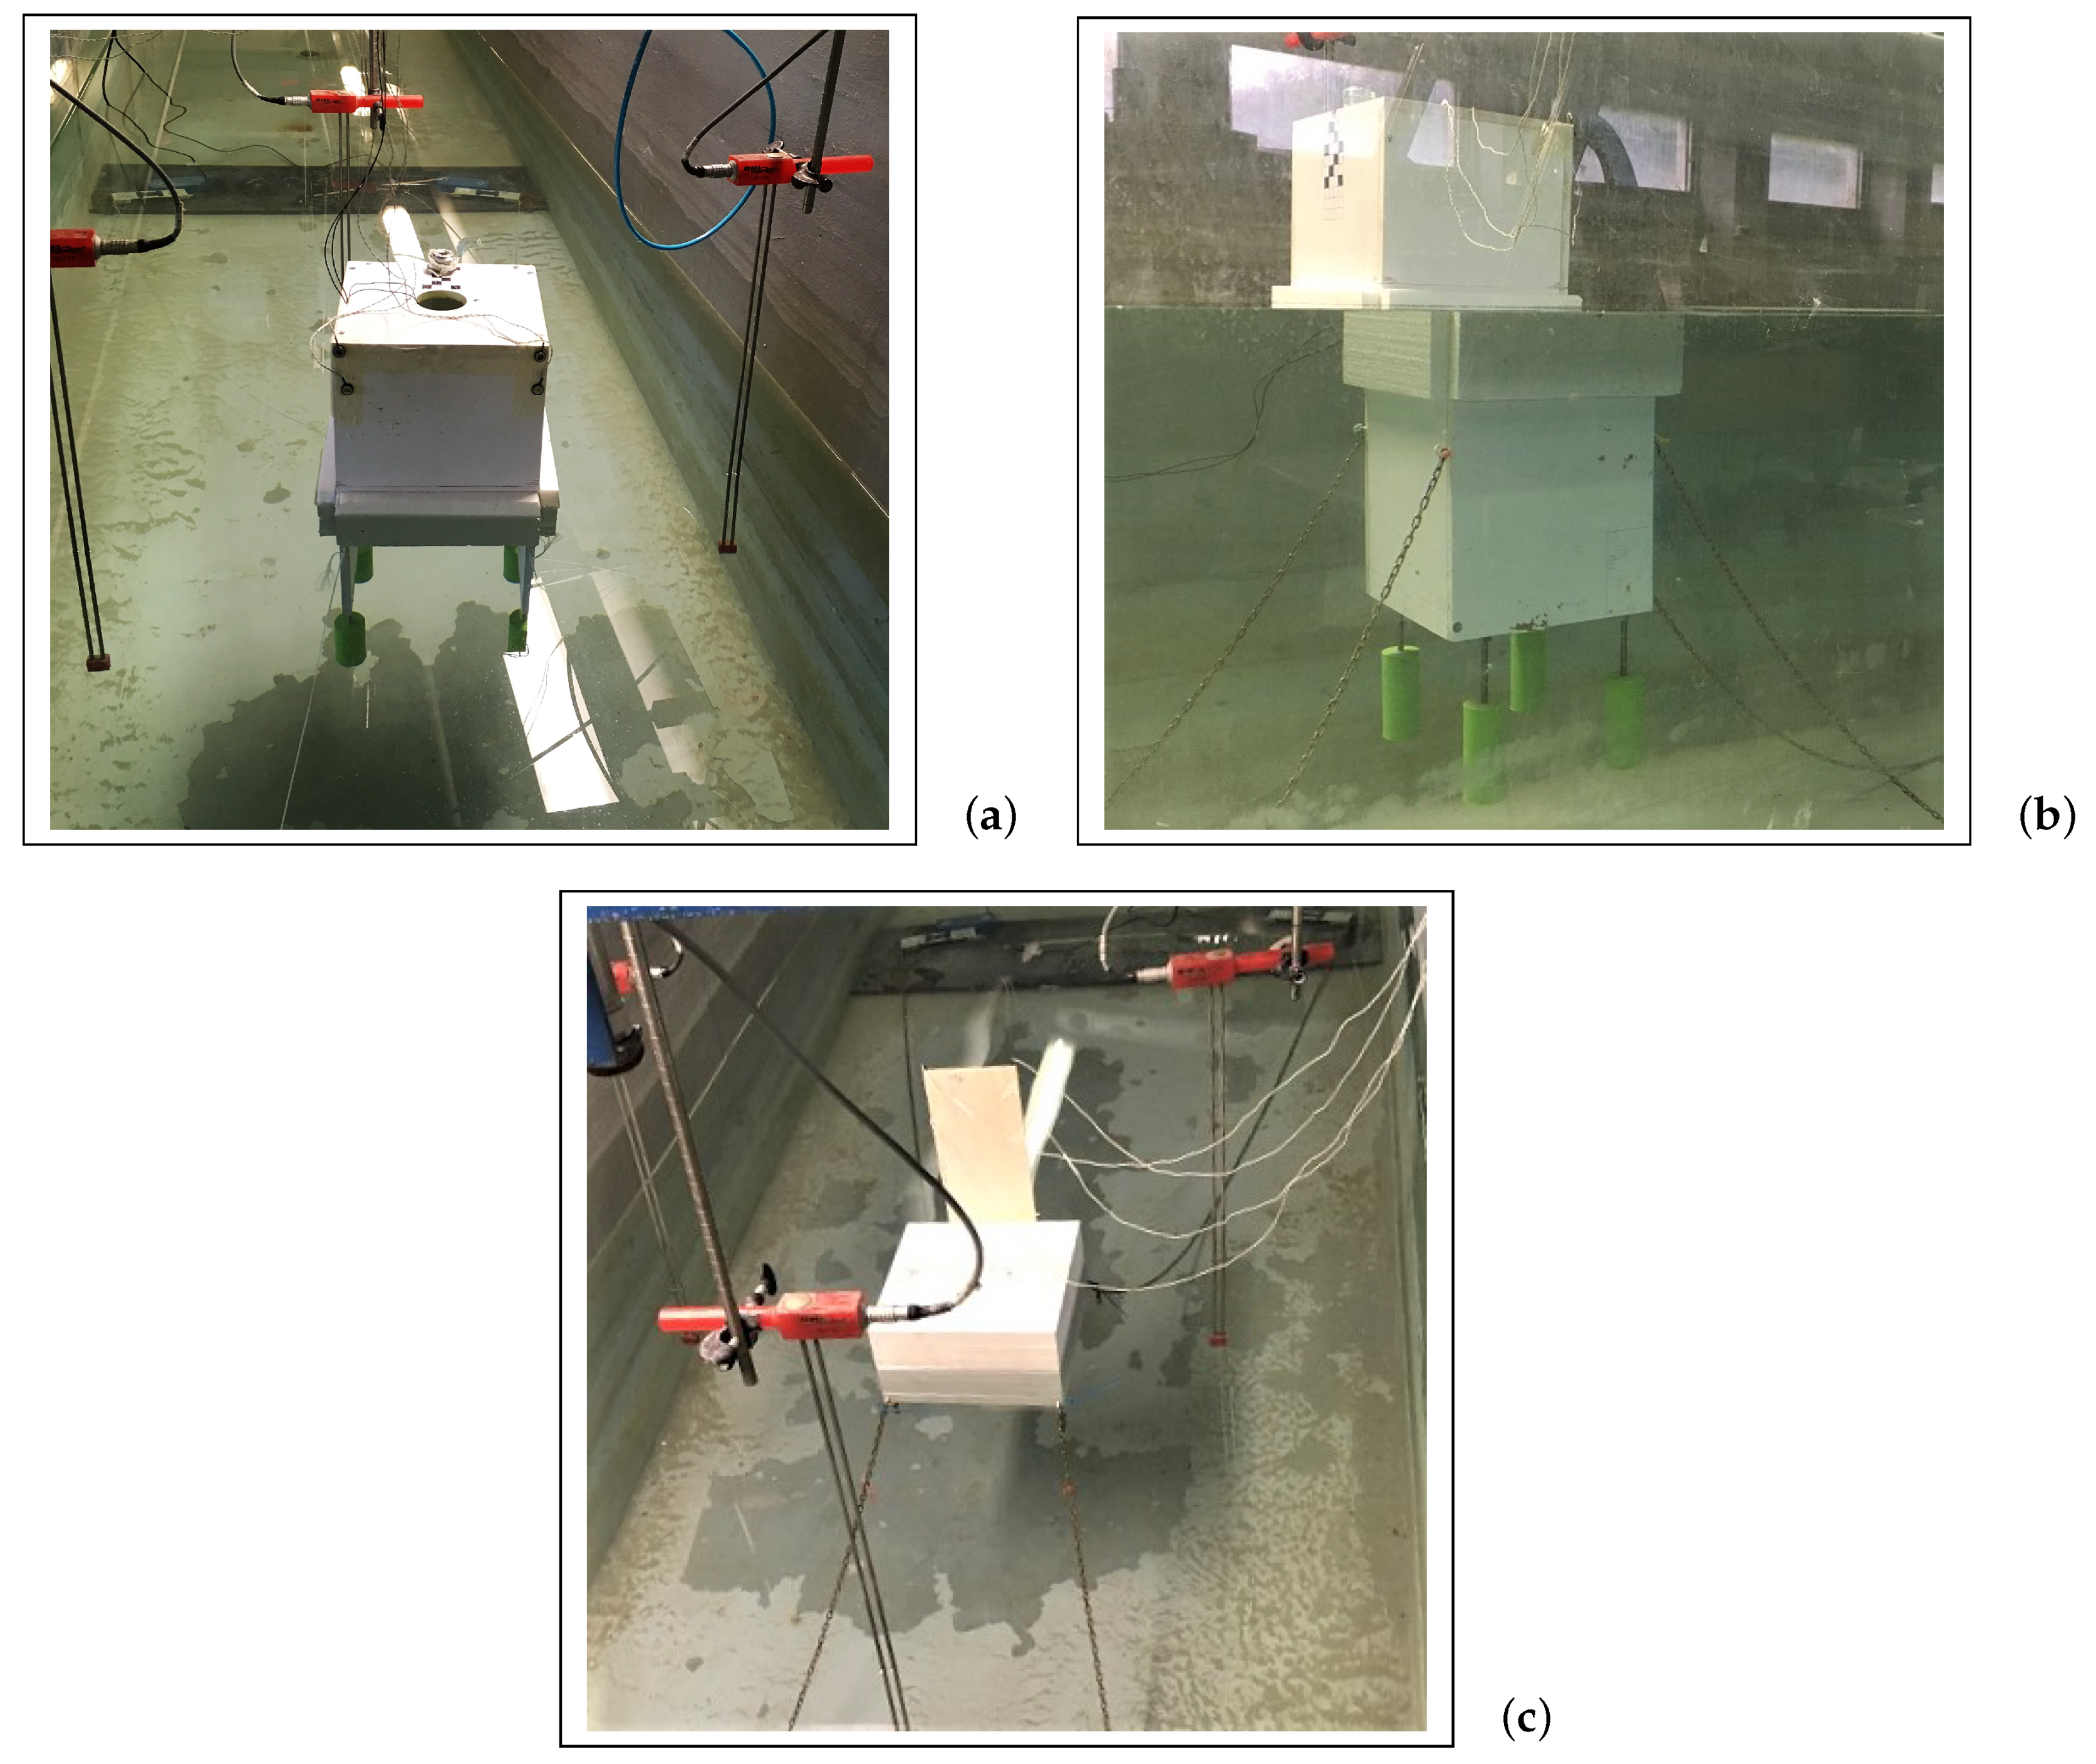
2.1. Description of the Models

Two models have been employed in the present experimental study. The first one is a simple solid cubic box model (referred to as “BOX” here after), which is used to check the reliability of the installed mooring system, to validate the appropriate installation of all the instruments and of the recorded data, and to provide benchmark experimental data of the BOX motion and mooring-line tensions in nonlinear regular waves. Figure 1a provides an illustration of the BOX model, while all the relevant geometric characteristics are listed in Table 1. The center of gravity is in the geometrical center of the BOX model.
The second model is a 1:25 scaled OWC WEC shown in Figure 1b. The model is made by light PVC material. The front open side of the OWC WEC model is placed facing the incoming waves. Openings are made on the front and bottom surfaces to obtain higher wave-energy flux. The wall thickness is 10 mm for the four side surfaces and the top surface. Due to this design, the model is asymmetrical regarding its principle axis which results in its destabilization. Therefore, extra ballast weights (green cylinders in Figure 1b) are added at the four bottom corners of the OWC WEC model to lower down the center of gravity and to reach a hydrostatic balance. At the same time, four light expanded polystyrene (EPS) foam blocks (shadowed part in Figure 1b) are attached on the four vertical surfaces near the waterline to provide enough buoyancy and stability. The dimensions of each block are 20.0 cm length, 0.8 cm width and 8.0 cm height. The center of gravity of the OWC WEC model is located on the symmetry plane of the WEC. The distances from the gravity center to the front and the bottom sides are annotated using point G’ as reference, which is the projection point of the center of gravity on the side surface shown in Figure 1b. To simulate the air turbine PTO damping, an orifice of a diameter of 5.0 cm is made on the top surface of the OWC WEC model, which equals to approximately 6.1% of the top surface area. Table 2 lists the geometric properties of OWC WEC model.

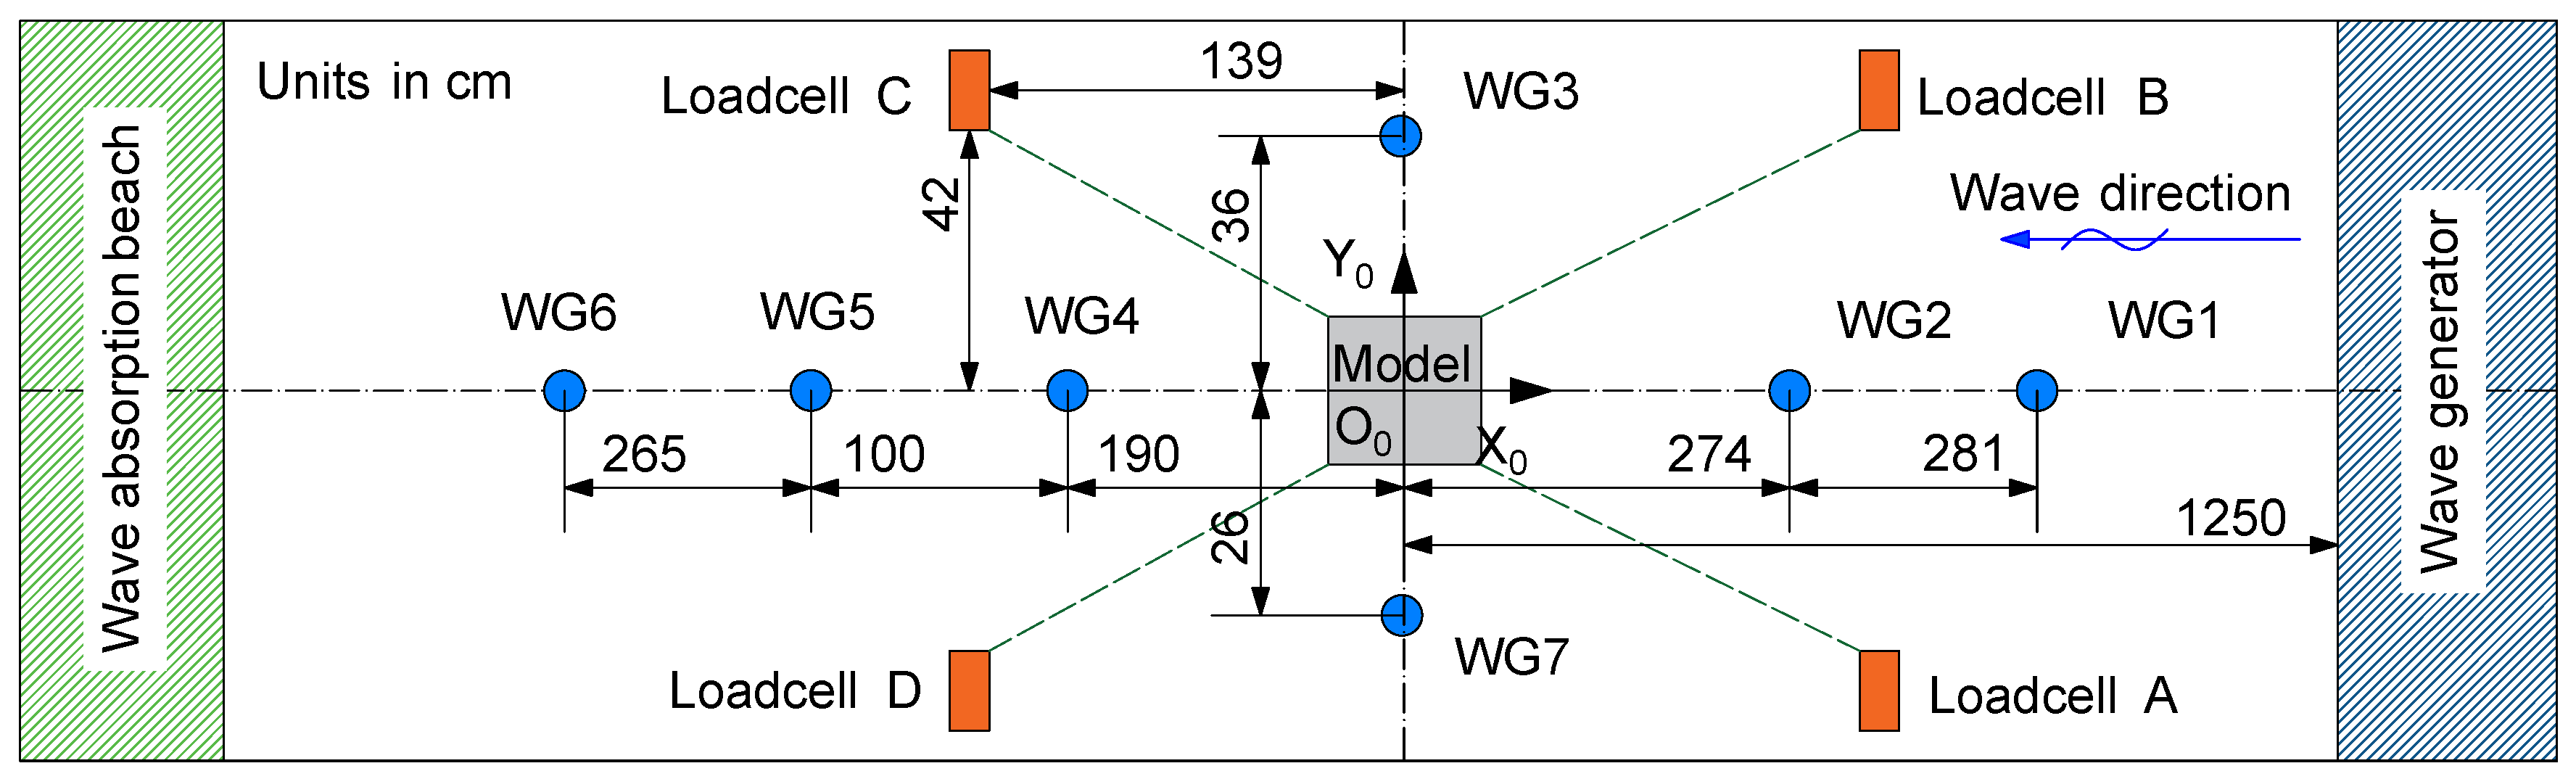
2.2. Wave Flume Setup and Instrumentation

The experiments are performed in the 30.0 m long, 1.0 m wide and 1.2 m high wave flume of the Coastal Engineering Research Group at the Department of Civil Engineering of Ghent University. The maximum operating water depth is 80 cm. The global coordinate system O 0 X 0 Y 0 Z 0 is defined at the bottom of the wave flume, with the positive O 0 X 0 axis pointing to the wave paddle and the positive O 0 Z 0 axis with a vertical upward direction. The center of gravity of the OWC WEC model or of the box model is located at the origin point of this global coordinate system. Seven resistive wave gauges (WG1 to WG7) are installed along the wave flume to record wave surface elevations ( ζ ) at different locations. For the OWC WEC model, one wave gauge (WG8) is installed in the chamber center, which moves with the model and measures the average in-chamber water surface elevation. Figure 2 gives a plan view of the general experimental layout of the wave flume and shows the locations of the employed instrumentation.
A four-point symmetric slack mooring system is used in the experimental setup. The anchor of each mooring line is connected to a loadcell fixed to the wave flume bottom. The distances between loadcells and models are annotated in Figure 2, while the fairlead of each mooring line is attached to the floating model. Each loadcell measures the horizontal component of the mooring-line tension (F), and has a measurement range of 100 N and a sampling frequency of 1000 Hz. To investigate the effect of the mooring-line material on the model response, iron chains and nylon ropes have been used alternatively. The elasticity properties of the two materials are acquired by performing tension tests at the laboratory of Material Science at Ghent University. The mooring-line parameters are listed in Table 3.
The 6-DOF motion of the floating models is captured using an optical tracking motion system, CTrack, developed by Ctech Metrology [30]. CTrack consists of a camera, several marker receivers, and dedicated processing software. The marker receivers are installed on the floating model. Based on the spatial relationship between markers and camera, a local coordinate system OXYZ is created fixed to the center of gravity of each one of the floating models, and the real-time motion is measured. The 6-DOF motion includes translations and rotations along the X, Y, and Z axes, where the three translations are the surge (x), sway (y) and heave (z), and the three rotations are the roll ( ϕ ), pitch ( θ ) and yaw ( ψ ). The local coordinate system and the definition of the 6-DOF motion are visualized in Figure 1a. Figure 3 shows the experimental setup in the wave flume from different perspectives.

2.3. Experimental Program

The present study focuses mainly on the response of the motion and mooring-line tensions of the floating OWC WEC and the BOX model subjected to unidirectional regular waves. State-of-the-art second order wave generation and absorption techniques have been applied [31]. Seven Test groups are conducted. The parameter ranges of the applied wave conditions and water depth in each Test group are listed Table 4. Test group 1 is a validation Test group of the BOX model in the wave conditions of 1.6 s T 2.0 s and 12.0 cm H 15.0 cm, where H is the wave height and T is the wave period. The iron chain mooring lines are applied in this Test group. Test group 2 to 7 investigate the OWC WEC model. Test group 2 studies the motion response of the model in relatively small wave-amplitude conditions ( 4.0 cm H 8.0 cm) while Test group 3 uses larger wave-amplitude conditions ( 11.0 cm H 14.0 cm). Test groups 2 and 3 are conducted using the iron chain as the mooring-line material. To compare the impact of different mooring-line materials, in Test groups 4 and 5 the nylon rope is used instead of the iron chain. Test group 4 uses the same wave conditions as in Test group 2 and Test group 5 uses the same wave conditions as in Test group 3. A sensitivity test regarding a scenario of unequal mooring-line lengths, is carried out in Test group 6. This Test group 6 investigates the response of mooring-line tensions due to the variation of the length of one of the four mooring lines, and discusses the effect of this unbalanced mooring system. Moreover, to further investigate the influence of larger orifice PTO damping qualitatively, in Test group 7, a ∅ = 1.0 cm orifice is used and is compared to a ∅ = 5.0 cm one (Test group 3) under the same wave conditions.
For all the wave conditions used in the experimental program, the wave steepness is kept in the range of H / λ < 1 / 20 to ensure non-breaking wave conditions, where λ is the wave length. However, as the water depth (d) is limited, the wave conditions are no longer linear. The wave nonlinearity can be assessed by plotting all the applied wave conditions used in each Test group in the adapted Le Méhauté diagram [32], as shown in Figure 4. It is clearly seen that most of the waves used in Test groups 1 to 5 are in the intermediate water depth region and they satisfy the Stokes 2nd order wave theory. Furthermore, for Test group 1, the cases of H = 15.0 cm waves are in the Stokes 3rd order wave region. In addition, each wave train contains less than 20 waves and the data acquisition system is stopped before the reflected waves reach the model, so any wave reflection effects from the wave absorption beach located at the opposite end of the wave flume will not be considered. Please note that all presented H and T are target wave condition values. This means that the H and T values resulting from the Fourier transformation analysis are slightly different because all presented results refer to test cases where a BOX or an OWC WEC model is always present in the wave flume. As such wave radiation, diffraction, and reflection induced by the floating objects is included in the presented results.

2.4. Uncertainty Sources

There are several uncertainty sources related to the obtained experimental data which should be considered. These uncertainty sources may affect the interpretation of the here presented results. The sources of uncertainty are listed as below.
(1) For mooring system, uncertainties are related to the measurement of the mooring-line material elasticity, length, and weight and volume per unit length, the locations of loadcells and fairleads, and the tensions.
(2) For the floating object, uncertainties are related to the measurement of: the geometrical dimensions of the model, the mass, the center of gravity, and momentum of inertia of the model, the spatial position of the model, including the initial position and the 6-DOF motion.
(3) For the wave generation system, uncertainties are related to the measurement of the wave surface elevation and the wave period.

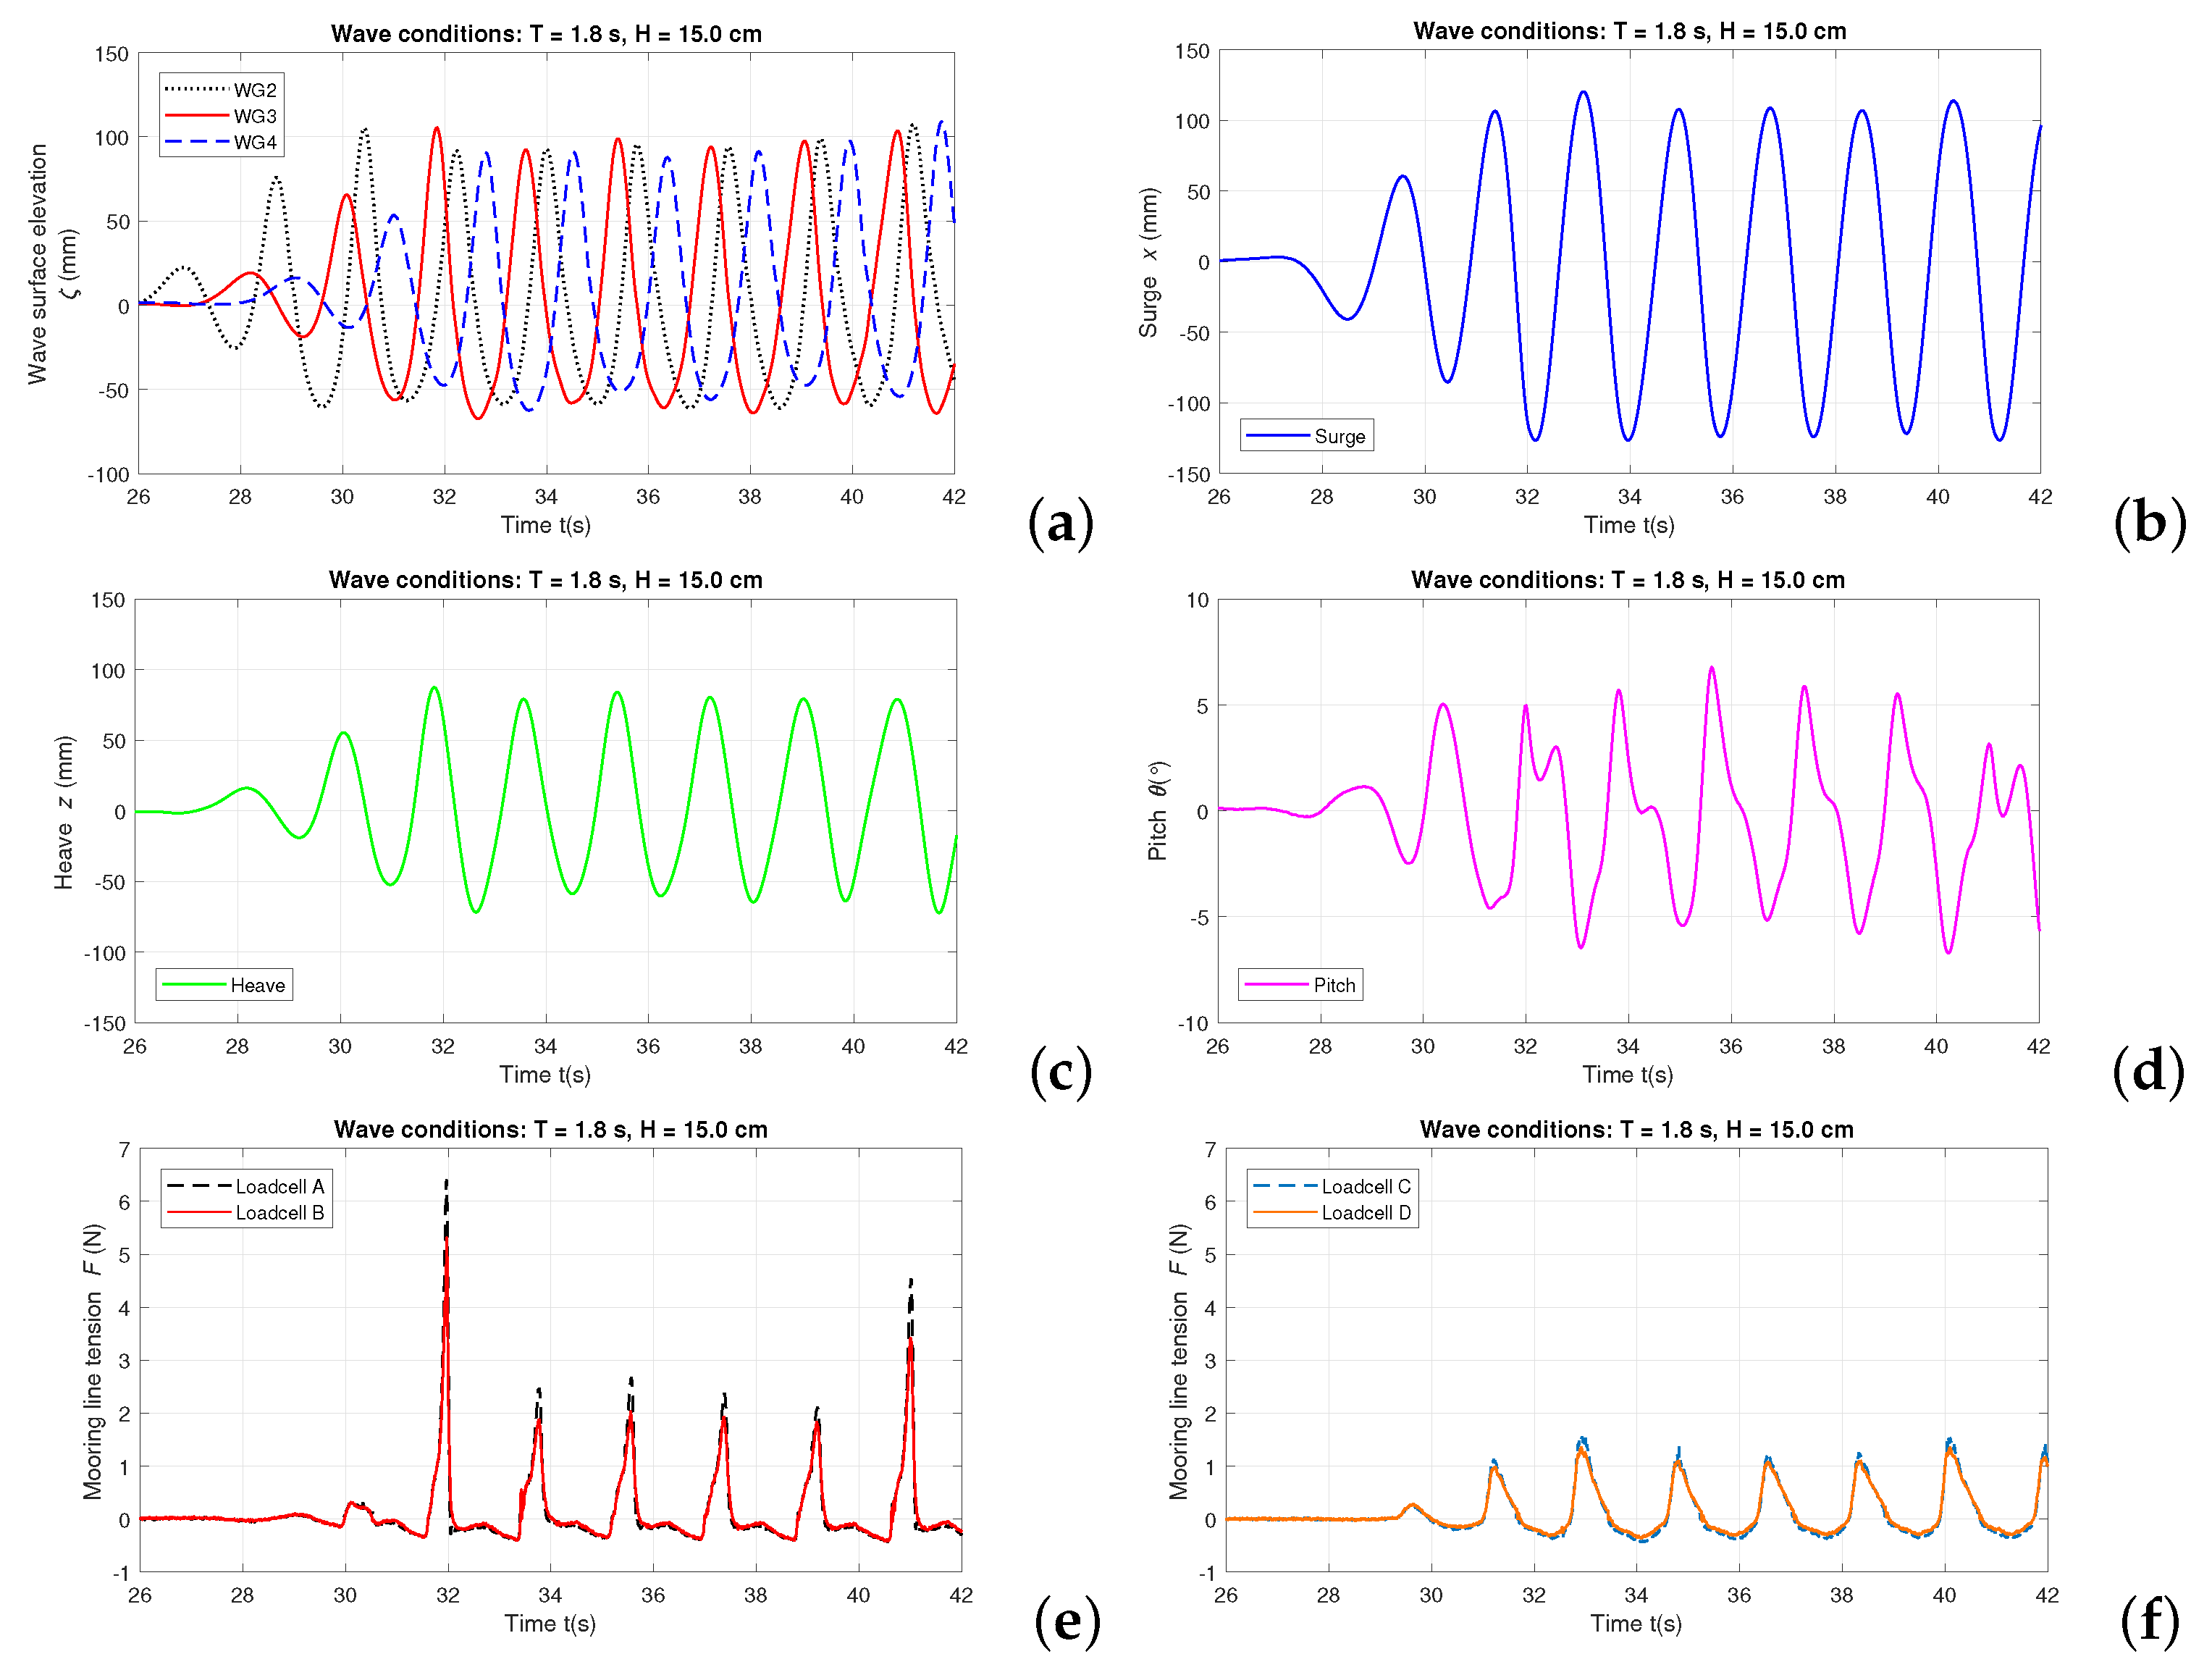
3. BOX model Experimental Results

The BOX model experimental results are obtained from Test group 1. In this paper, we present two datasets with the synchronized information of water surface elevations acquired from WG2, WG3, and WG4 (see Figure 3), motion time series of surge, heave, and pitch obtained from the CTrack system and horizontal components of mooring-line tensions obtained from four loadcells. The case of regular waves of T = 1.6 s and H = 12.0 cm is displayed in Figure 5, while another test with regular waves of T = 1.8 s and H = 15.0 cm is shown in Figure 6. The loadcells are initialized when the BOX model is at the equilibrium position. The mooring-line tension data is post-processed via an averaging filter.
The results are discussed in terms of wave field modification due to the presence of the BOX model. Firstly, nonlinearity of the incident waves is observed from the recorded water surface elevations. In both Figure 5a and Figure 6a, the recorded data of all the three wave gauges show that the incident wave forms have flat troughs and sharp peaks. Especially in Figure 6a, the average wave trough value obtained by WG2 is ζ = 58.7 mm while the average peak value is ζ = 93.4 mm . The nonlinear wave forms are due to the intermediate water depth, as explained in Figure 4.
Secondly, in both Figure 5a and Figure 6a, the wave heights measured by WG4 are smaller than those measured by WG2 and WG3, since WG4 is located behind the BOX where the incident waves are diffracted after passing the model. Meanwhile, because WG3 is close by the BOX model, the wave heights recorded by WG3 are slightly larger than those recorded by WG2 as both the incident waves and the radiated waves due to the BOX motion are captured.
For the BOX model motion in the regular wave conditions of T = 1.6 s and H = 12.0 cm, the surge motion of the BOX model (Figure 5b) is not steady regarding the motion amplitude in each wave period. This occurs because the presence of the iron chain mooring lines imposes a low frequency component to the wave induced surge motion. The heave (Figure 5c) and pitch (Figure 5d) motions of the BOX model are regular and the motion amplitudes are steady. The measured mooring-line tensions as plotted in Figure 5e,f show a good balance between the two mooring lines that are connected to Loadcell A and B, and between the two connected to Loadcell C and D, respectively.
When considering the regular wave conditions of T = 1.8 s and H = 15.0 cm, different motion characteristics of the BOX are observed. As displayed in Figure 6b, the surge motion shows a more regular pattern compared to the surge motion shown in Figure 5b. For the heave motion of the BOX (Figure 6c), although the motion is regular, nonlinear effects are obvious as the average peak value is z = 80.7 mm and the average trough value is z = 61.9 mm . Moreover, as shown in Figure 6d, the pitch motion of the BOX contains strong nonlinearity and is very irregular. This is due to a combined effect of the nonlinear incident waves and of the mooring lines. For the mooring-line tensions in this test, Figure 6e,f show a good balance between the tensions measured by Loadcell A and B, and between those measured by Loadcell C and D, respectively.
The results of the two cases presented in this section will be employed in the development of fully nonlinear numerical models as a benchmark experiment for numerical validation.

4. OWC WEC Model Experimental Results

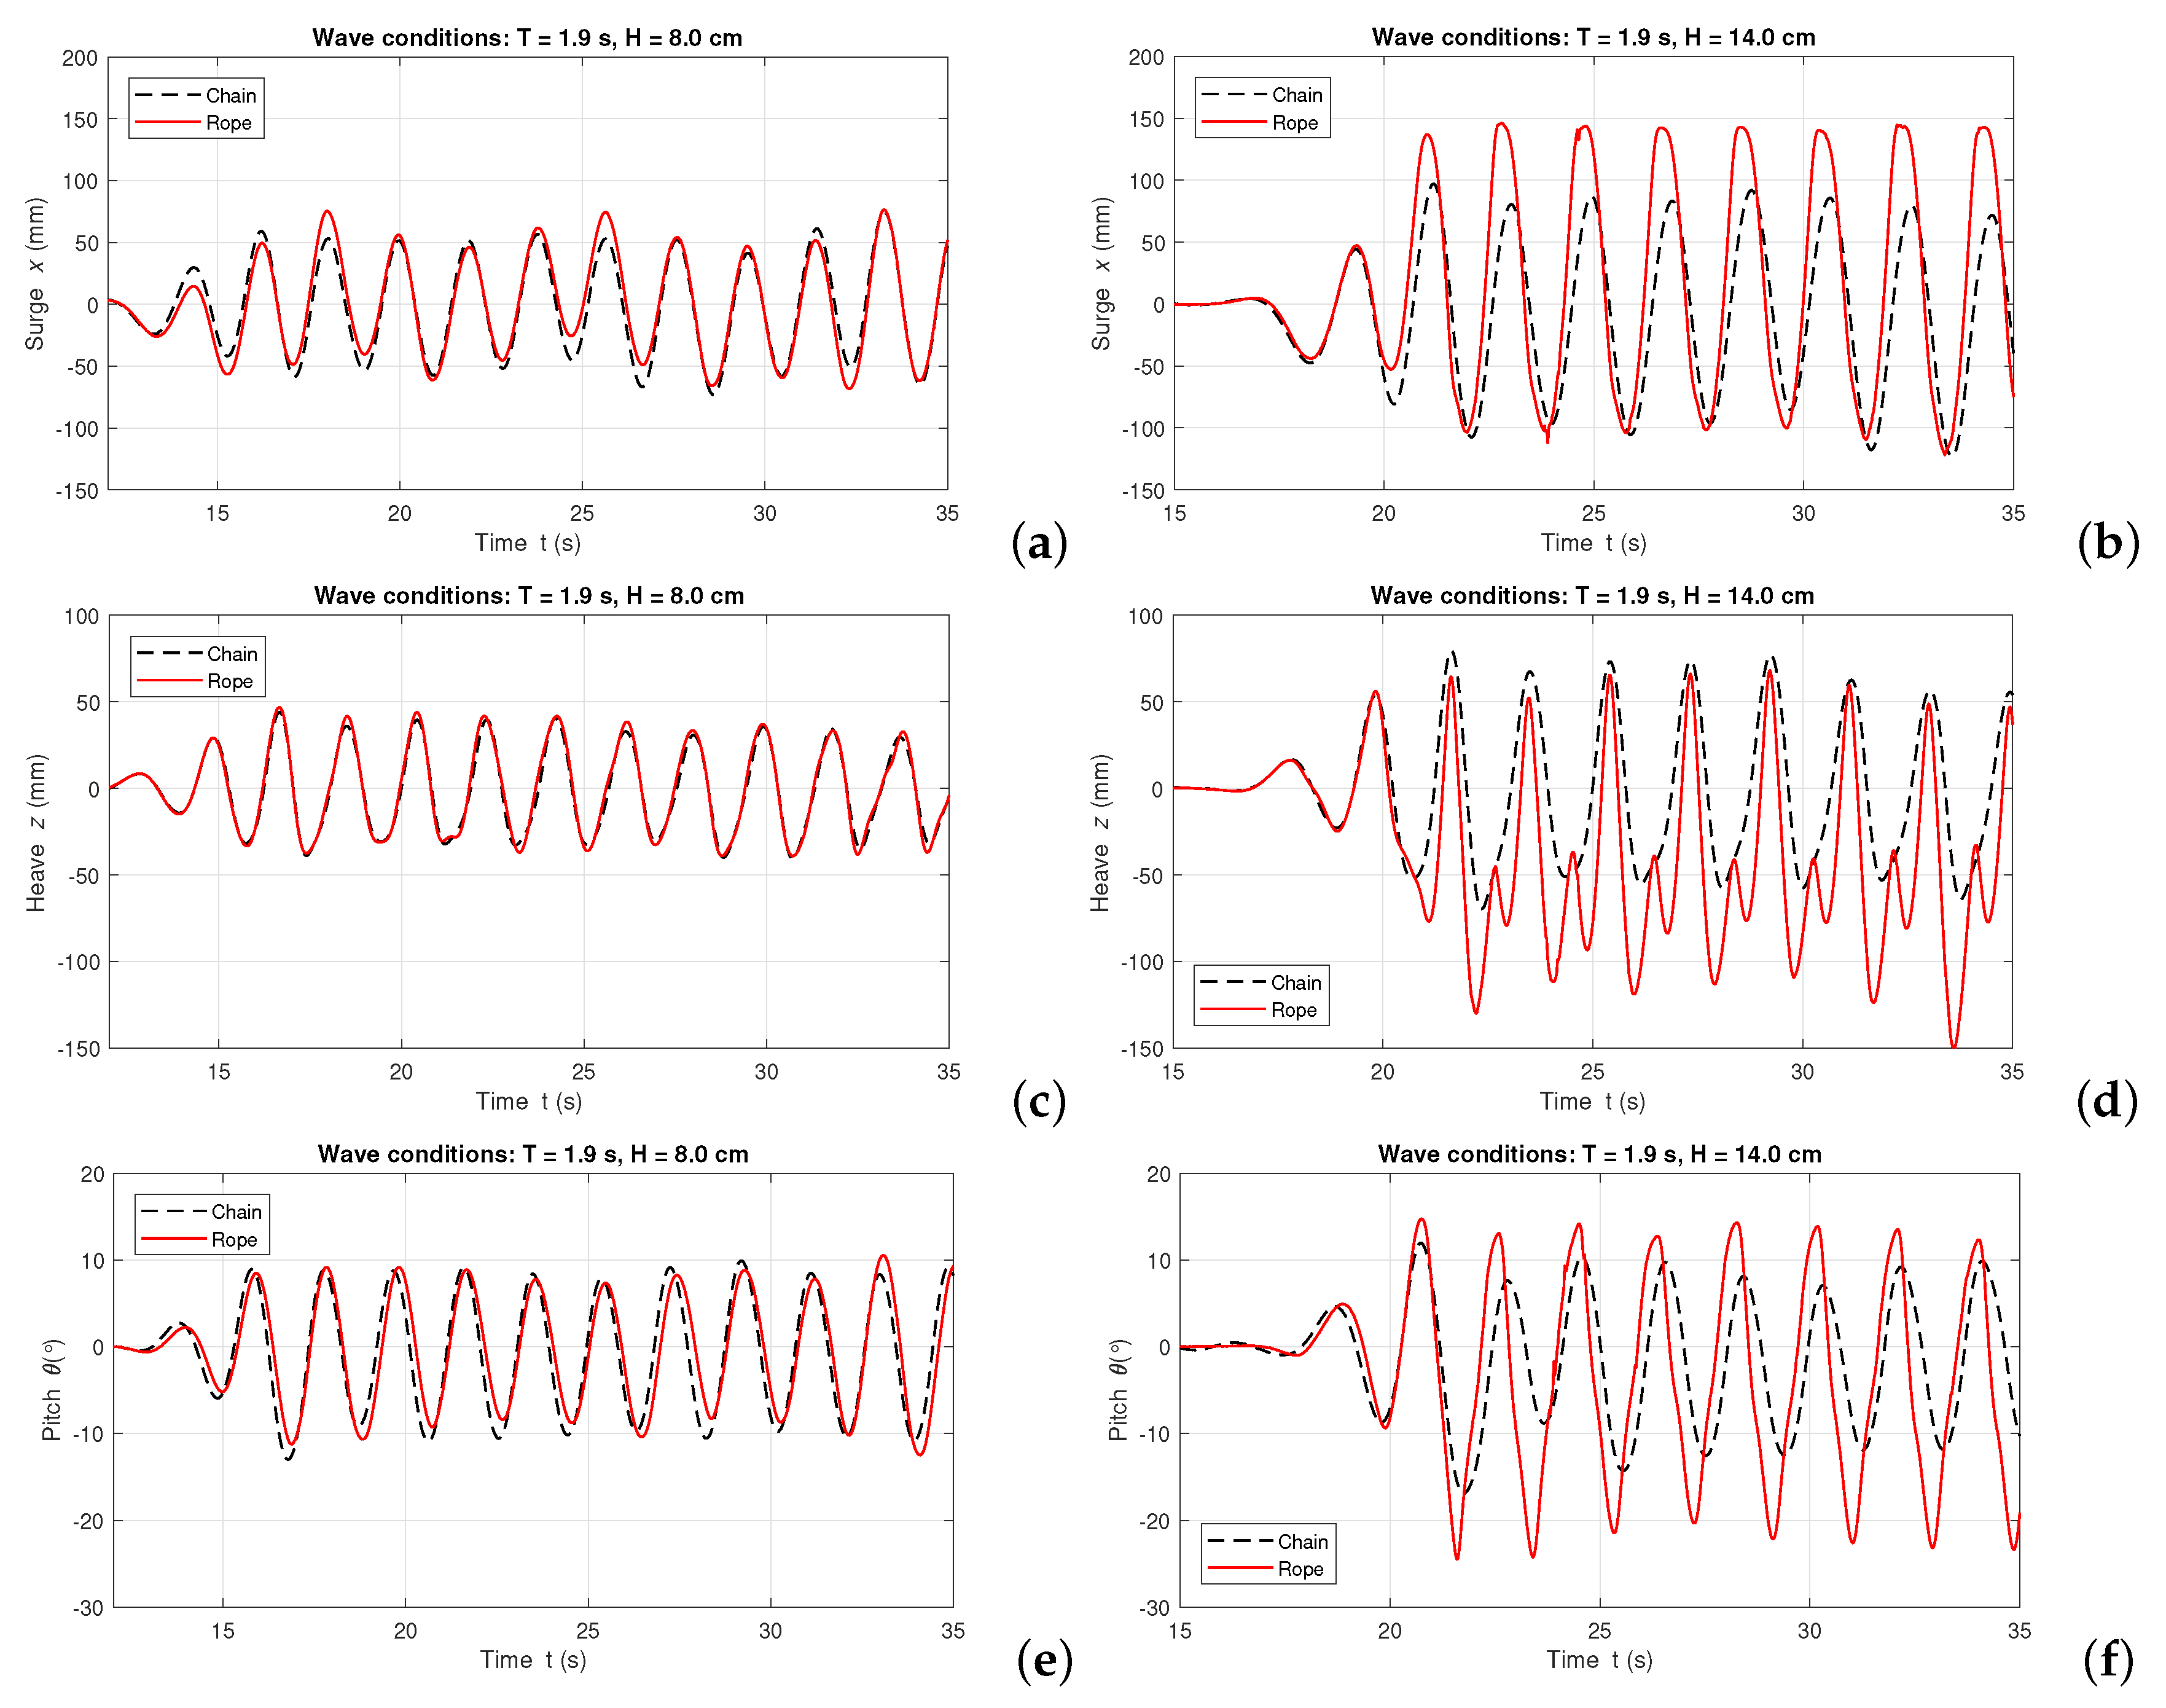
4.1. OWC WEC Motion Response

The motion response to regular waves is defined as the motion amplitude of a floating object in regular waves per unit amplitude. By varying the frequency of the incident wave, a motion response curve can be obtained to depict the motion characteristics of the floating system in the frequency domain. For a moored floating OWC WEC, the motion response information reflects its motion amplitude, provides its natural frequency and reveals nonlinear effects due to the mooring system and the incoming waves.
Tests are carried out with both small-amplitude waves (Test groups 2 and 4) and large amplitude waves (Test groups 3 and 5). For Test groups 2 and 4, H = 4.0 cm (when T 1.1 s) and H = 8.0 cm (when T 1.2 s) are used; the later one stands for H = 2.0 m in prototype scale. For Test groups 3 and 5, the applied wave heights are H = 11.0 cm and H = 14.0 cm, and the wave period is set within the range of 1.5   s T 2 s. Moreover, according to the suggestion given by ITTC guidelines [33], the translation motion response data is expressed by a division of the mean single motion amplitude over an averaged wave amplitude, as x / η 0 or z / η 0 , where η 0 = H / 2 .
The experimental results of the OWC WEC surge response to small-amplitude waves (Test groups 2 and 4) and large amplitude waves (Test groups 3 and 5) are shown in Figure 7a,b, respectively, and the results of its heave response are shown in Figure 8a,b. In addition, comparisons between the surge and heave response in different wave heights when using one mooring-line material are visualized in Figure 7c (surge response when using only iron chain), Figure 7d (surge response when using only nylon rope) and Figure 8c (heave response when using only iron chain) and Figure 8d (heave response when using only nylon rope).
Firstly, the resonance periods in surge and heave of the OWC WEC model are observed as plotted in Figure 7a and Figure 8a, respectively. For a wave period of T = 0.9 s, the OWC WEC surge motion response reaches a minimum value. The heave resonance period ( T r , h e a v e ) for using the nylon rope mooring lines is T r , h e a v e = 0.9 s, and when using iron chain T r , h e a v e = 1.0 s. This modification of T r , h e a v e shows the effect of the mooring-line material: the floating system has a total mass of both the OWC WEC model and the mooring lines, so the heavy iron chain mooring line increases the resonance period of the OWC WEC heave motion. Secondly, Figure 7a and Figure 8a also show that when 1.0   s T 1.7 s, the OWC WEC motion response due to using the chain mooring lines are very similar to the response when using the rope. Obvious differences occur in surge motion when T 2.0 s. As the density of nylon rope material is close to the water density, the rope could not provide any stiffness as a free hanging chain unless the mooring lines are fully stretched. As a result, though the rope mooring lines are shorter, they lead to larger surge amplitude than using the chain when T 2.0 s. This effect is more obvious in large amplitude waves, as shown Figure 7b. Thirdly, it is clearly seen from Figure 8b that the OWC WEC heave response when using nylon rope material reaches over 1.0 when T 1.8 s, and goes up to 1.45 for T = 2.0 s.
To investigate this further, a comparison of the OWC WEC motion response is performed for wave conditions of the same wave period but different wave height, T = 1.9   s , H = 8.0 cm and T = 1.9   s , H = 14.0 cm. The motion logs of the OWC WEC model are plotted in Figure 9. It is observed that when H = 8.0 cm, the three motions (surge, heave and pitch) are well matched for both of the tested mooring materials. This indicates that the mooring system does not significantly affect the OWC WEC motion at this wave period and when small wave heights are applied. When H = 14.0 cm, strong nonlinearity emerges as the incoming waves are close to Stokes 3rd order region (Figure 4). Figure 9b is the surge motion history of the OWC WEC model and shows that the chain mooring line contributes to smaller surge motion than the nylon rope. For the OWC WEC surge motion when using nylon ropes, the average surge peak value is x = 142.3   cm and the average trough value is x = 102.3 cm, which clearly reflect a nonlinear surge motion behavior. The equilibrium drift, on the contrary to the iron chain case, is to the wave incoming direction. This is caused by the strong shock force from the nylon rope lines. For the OWC WEC heave mode as displayed in Figure 9d, two peaks and troughs appear in one wave period when using the rope mooring lines. The major peak is induced by waves, and the minor peak occurs due to a shock load from the mooring line when the rope is suddenly stretched. The value of this major peak of the heave motion is close to the peak value of the OWC WEC heave motion when using the iron chain. However, when using the nylon rope, the mooring-line shock loads acting on the OWC WEC model lead to lower major heave troughs and amplify the heave motion response up to over 1.0, as shown in Figure 8b. This is primarily due to the low stiffness of the flexible and soft nylon rope material. Moreover, in Figure 9f, nonlinear effect is also obvious for the pitch motion of the OWC WEC model in large waves when using nylon rope, where the average pitch trough is θ = 20.6 and the average pitch peak is θ = 13.8 . Compared to using iron chain, using nylon rope introduced larger pitch motion amplitude and sharper pitch peaks and pitch troughs, which means the corresponding mooring-line shock loads introduce a more intense rotational acceleration to the OWC WEC model, and hence, result in a possible sloshing effect inside the OWC WEC chamber.

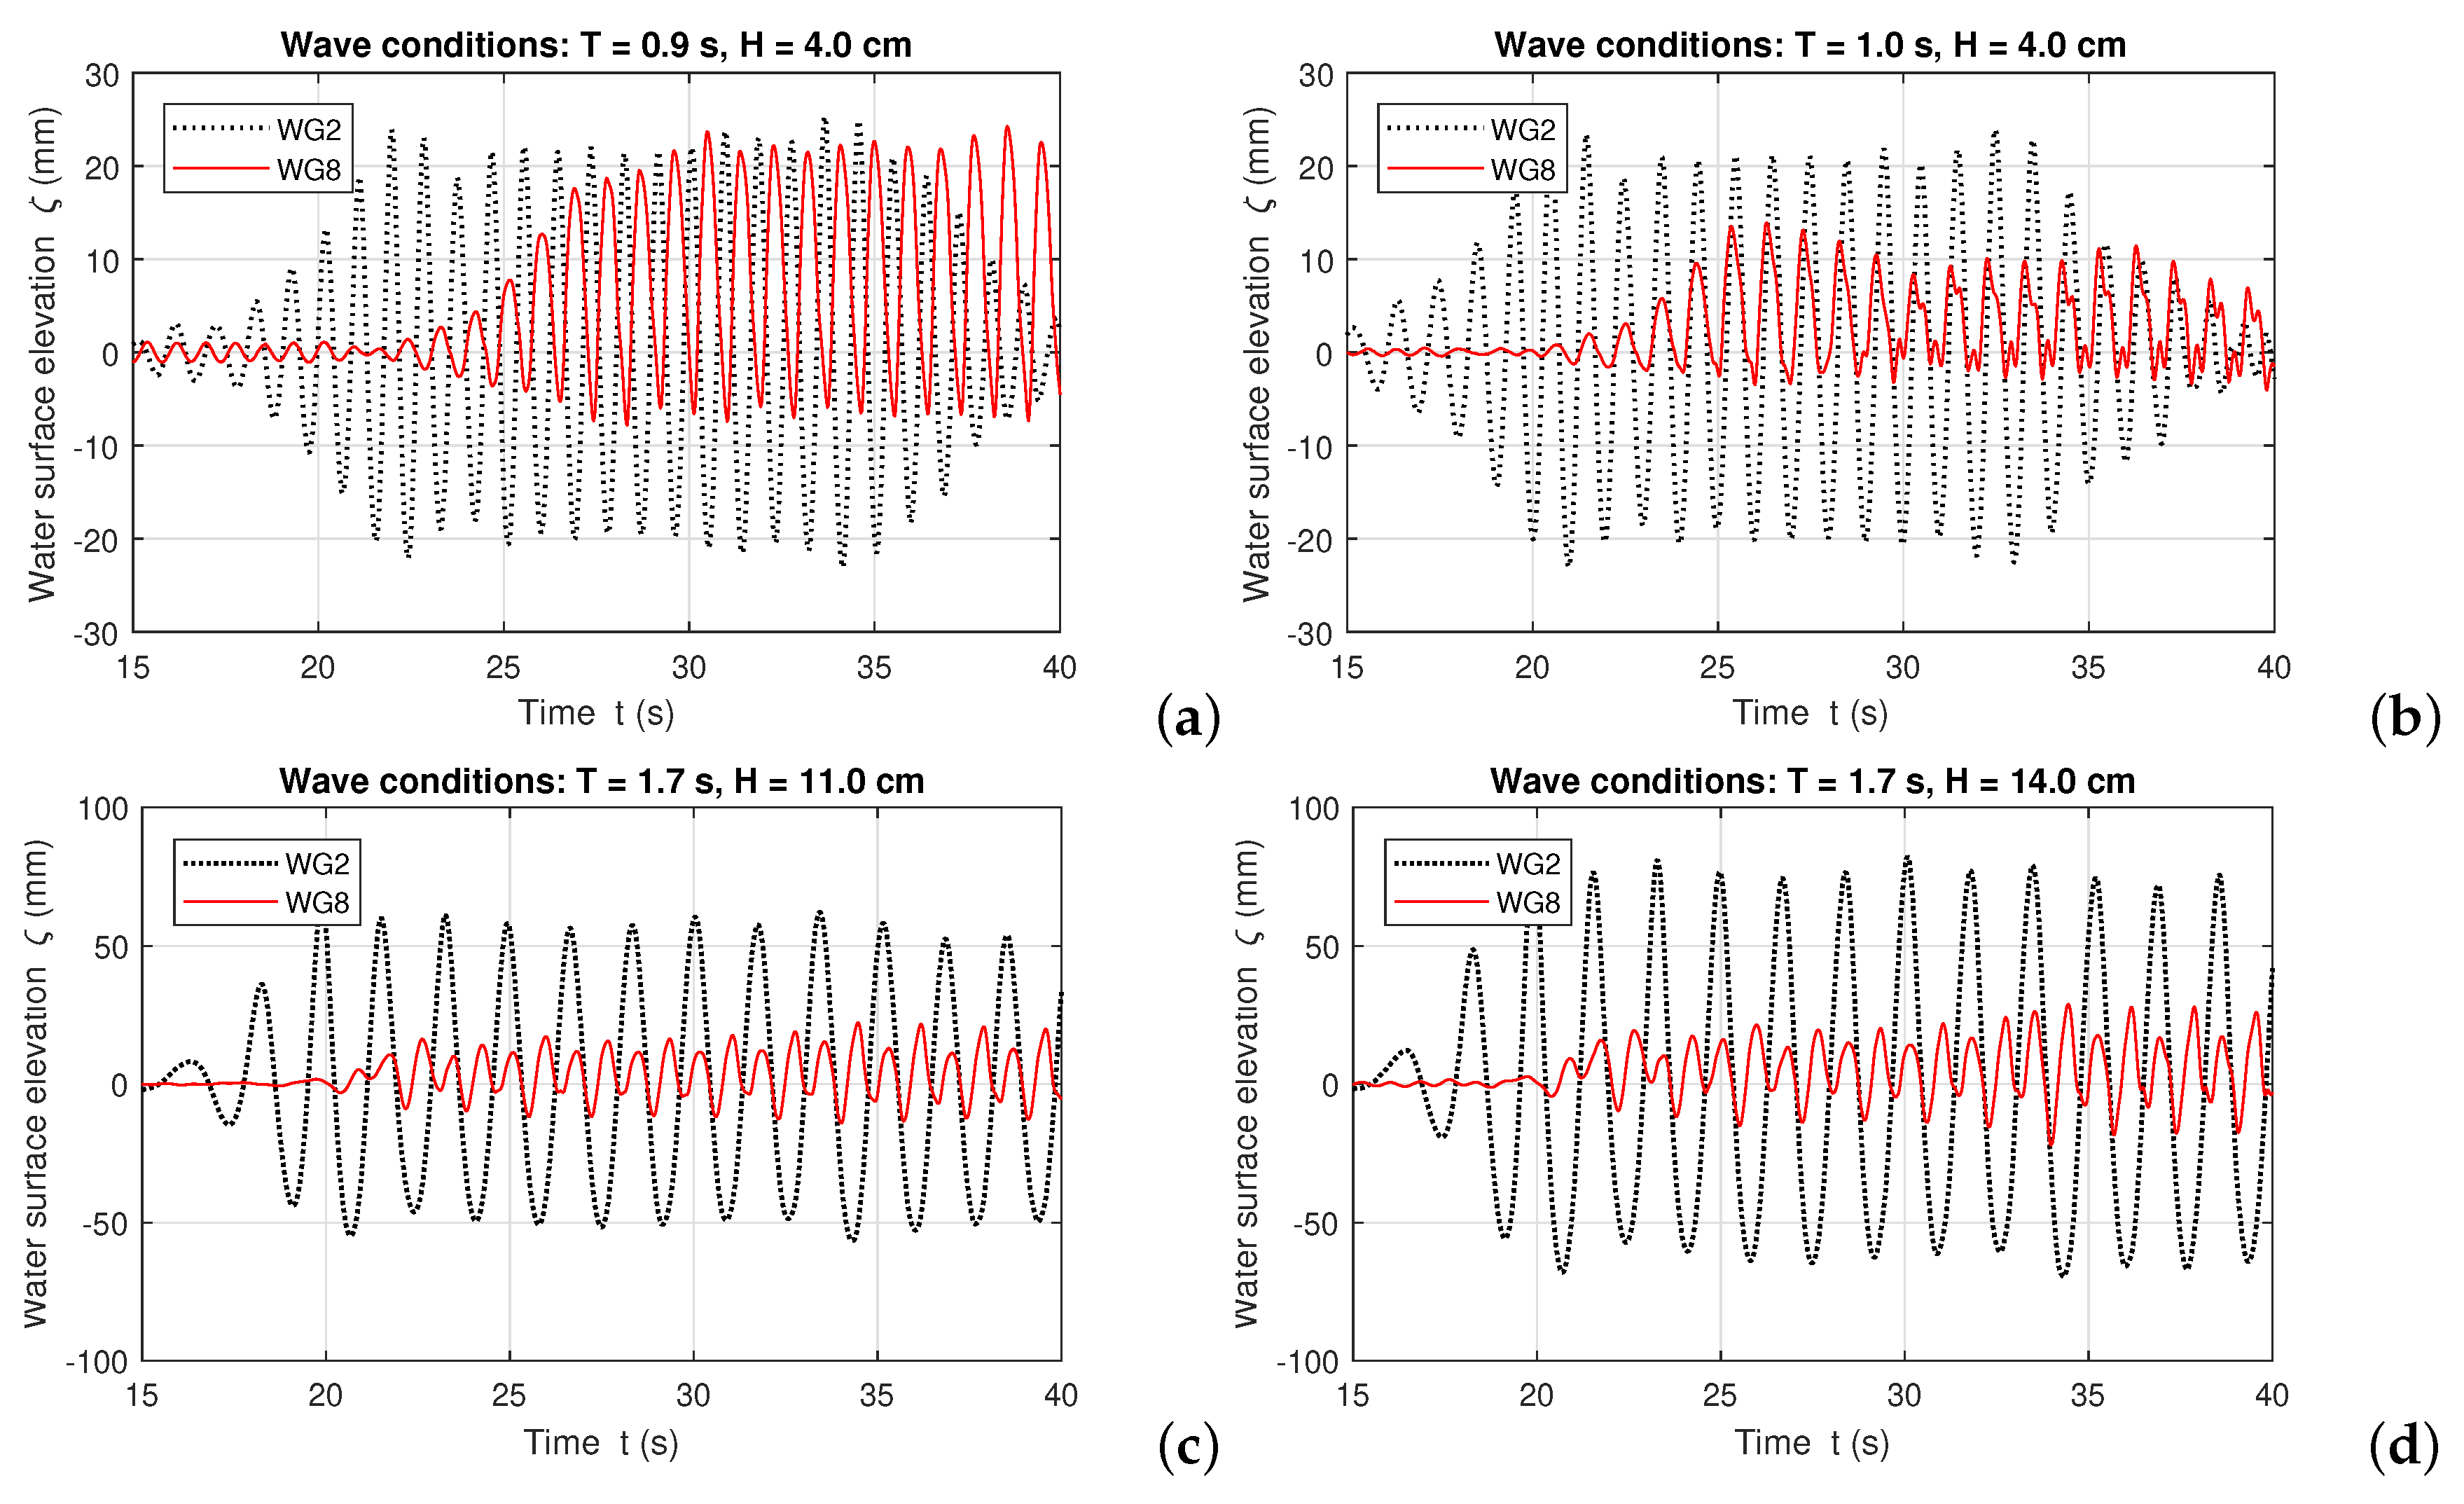
4.2. Water Surface Elevation Variation Inside the OWC WEC Vhamber

The time averaged energy output of an OWC WEC is given by Equation (1) [13],
P E = 1 T 0 T Δ p ( t ) q ( t ) d t
where P E is the mean power output, Δ p ( t ) is the pressure variation inside the OWC WEC chamber during a wave period, q ( t ) is the air volume flux and T is the wave period. The mean water surface elevation variation inside the OWC WEC chamber determines the air flux through the orifice at the top of the chamber, and hence, contributes significantly to the potential energy output of the WEC. Based on this, comparisons between the in-chamber water surface elevation and the wave surface elevation outside the OWC WEC model are made for various wave conditions. Figure 10 depicts the water surface elevations ( ζ ) recorded by WG2 (located in front of the OWC WEC model) and WG8 (inside the OWC WEC chamber). The considered wave conditions are characterized by T = 0.9 s and H = 4.0 cm in Figure 10a, T = 1.0 s and H = 4.0 cm in Figure 10b, T = 1.7 s and H = 11.0 cm in Figure 10c, and T = 1.7 s and H = 14.0 cm in Figure 10d. The mooring-line material is iron chain for all these cases.
Differently from the heave motion resonance period of the OWC WEC T r , h e a v e = 1.0 s obtained in Section 4.1, resonance of the in-chamber water surface elevation occurs at T r , c h a m b e r = 0.9 s. The in-chamber water surface elevation amplitude decreases approximately 50% as the incident wave period increases 0.1 s regarding T r , h e a v e . This indicates a narrow frequency band of optimum power output of the studied floating moored OWC WEC, which is similar to the result obtained from the investigation of a fixed detached OWC WEC as described by [23]. For the in-chamber water surface elevation in large wave conditions of T = 1.7 s, H = 11.0 cm and H = 14.0 cm, clearly the resonance does not occur.

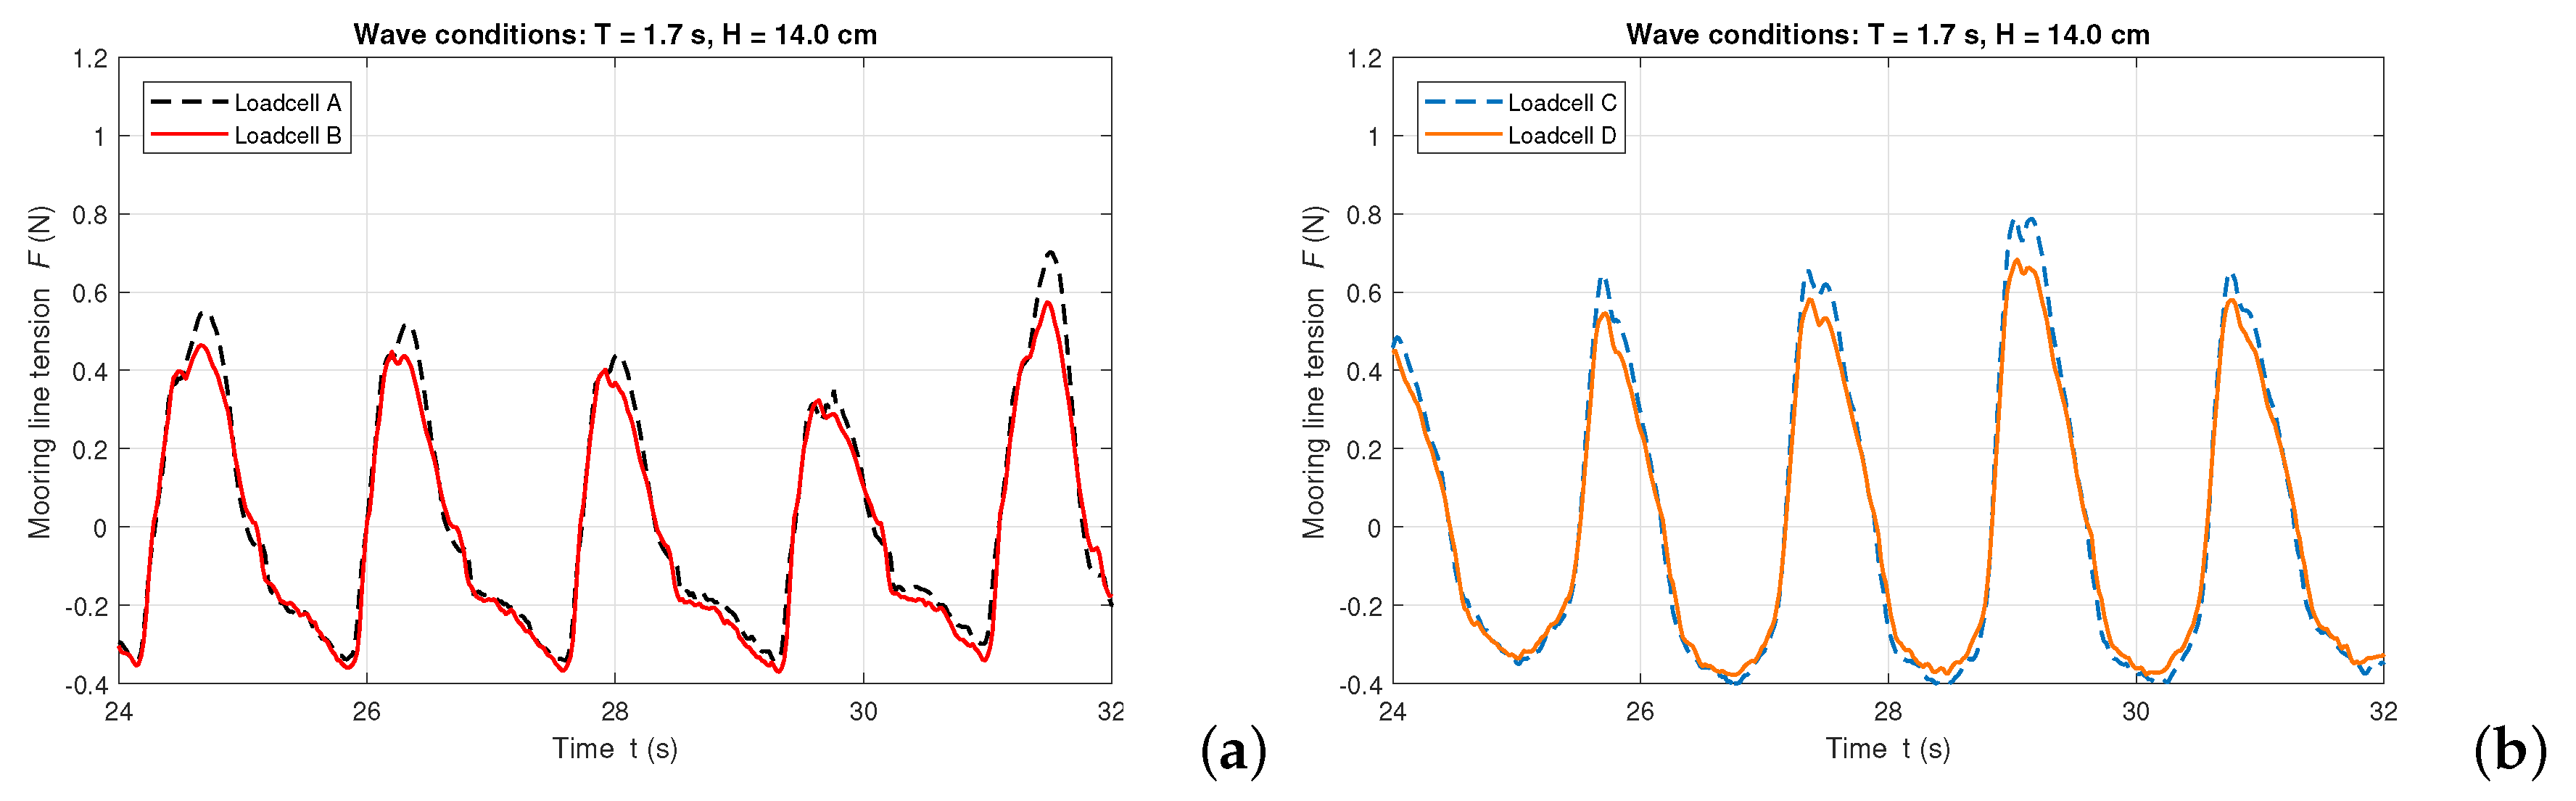
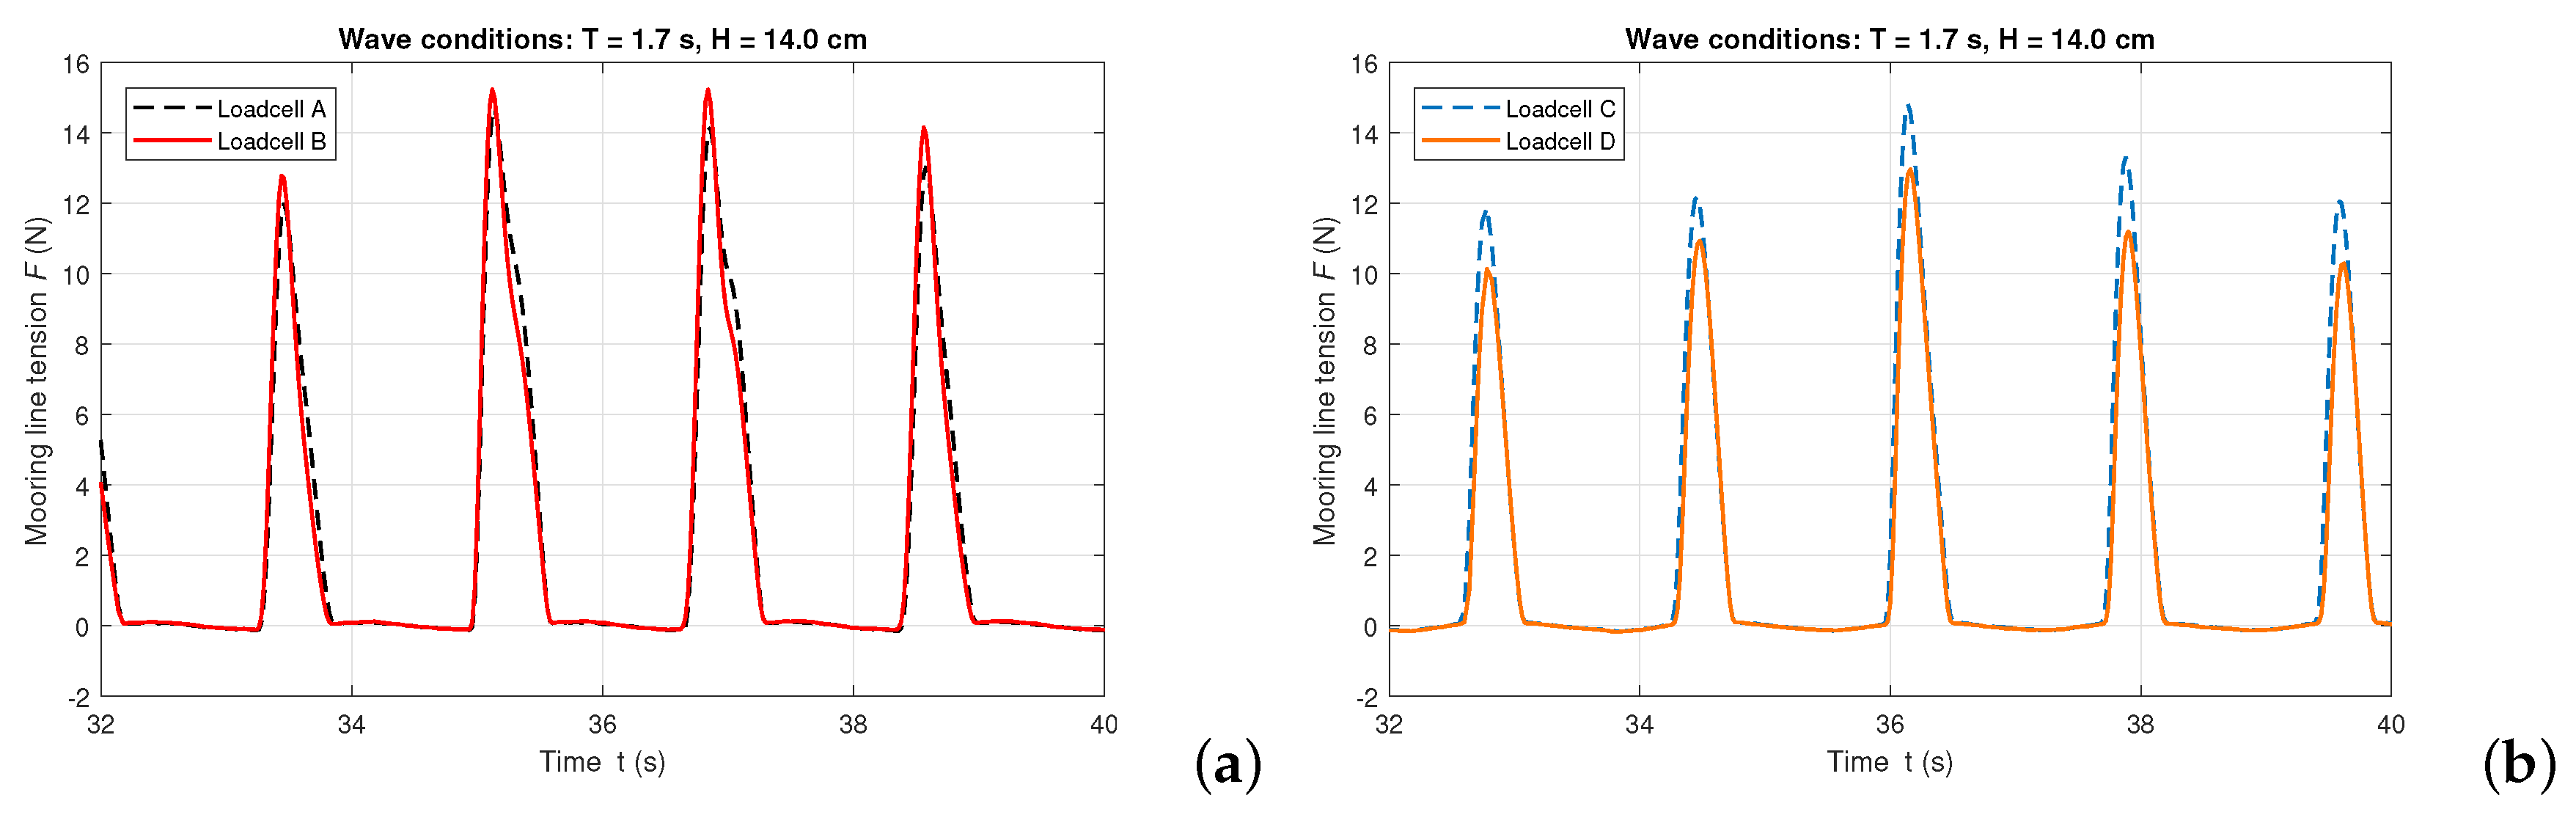
4.3. Mooring-Line Tensions

As described in Section 4.1, the mooring-line material plays an important role for the OWC WEC model motion in large amplitude waves. In this section, we show that the mooring-line tension at the anchor location, also differs. Examples are given for the regular wave conditions of T = 1.7 s and H = 14.0 cm, as presented in Figure 11 and Figure 12. Figure 11 illustrates the horizontal components of the chain mooring-line tensions measured by all four loadcells and Figure 12 illustrates the registered data for the rope mooring lines. It is observed that using rope mooring line has introduced periodic shock loads exceeding 10.0 N, which are significantly larger than those when using chain mooring line for the same wave conditions.

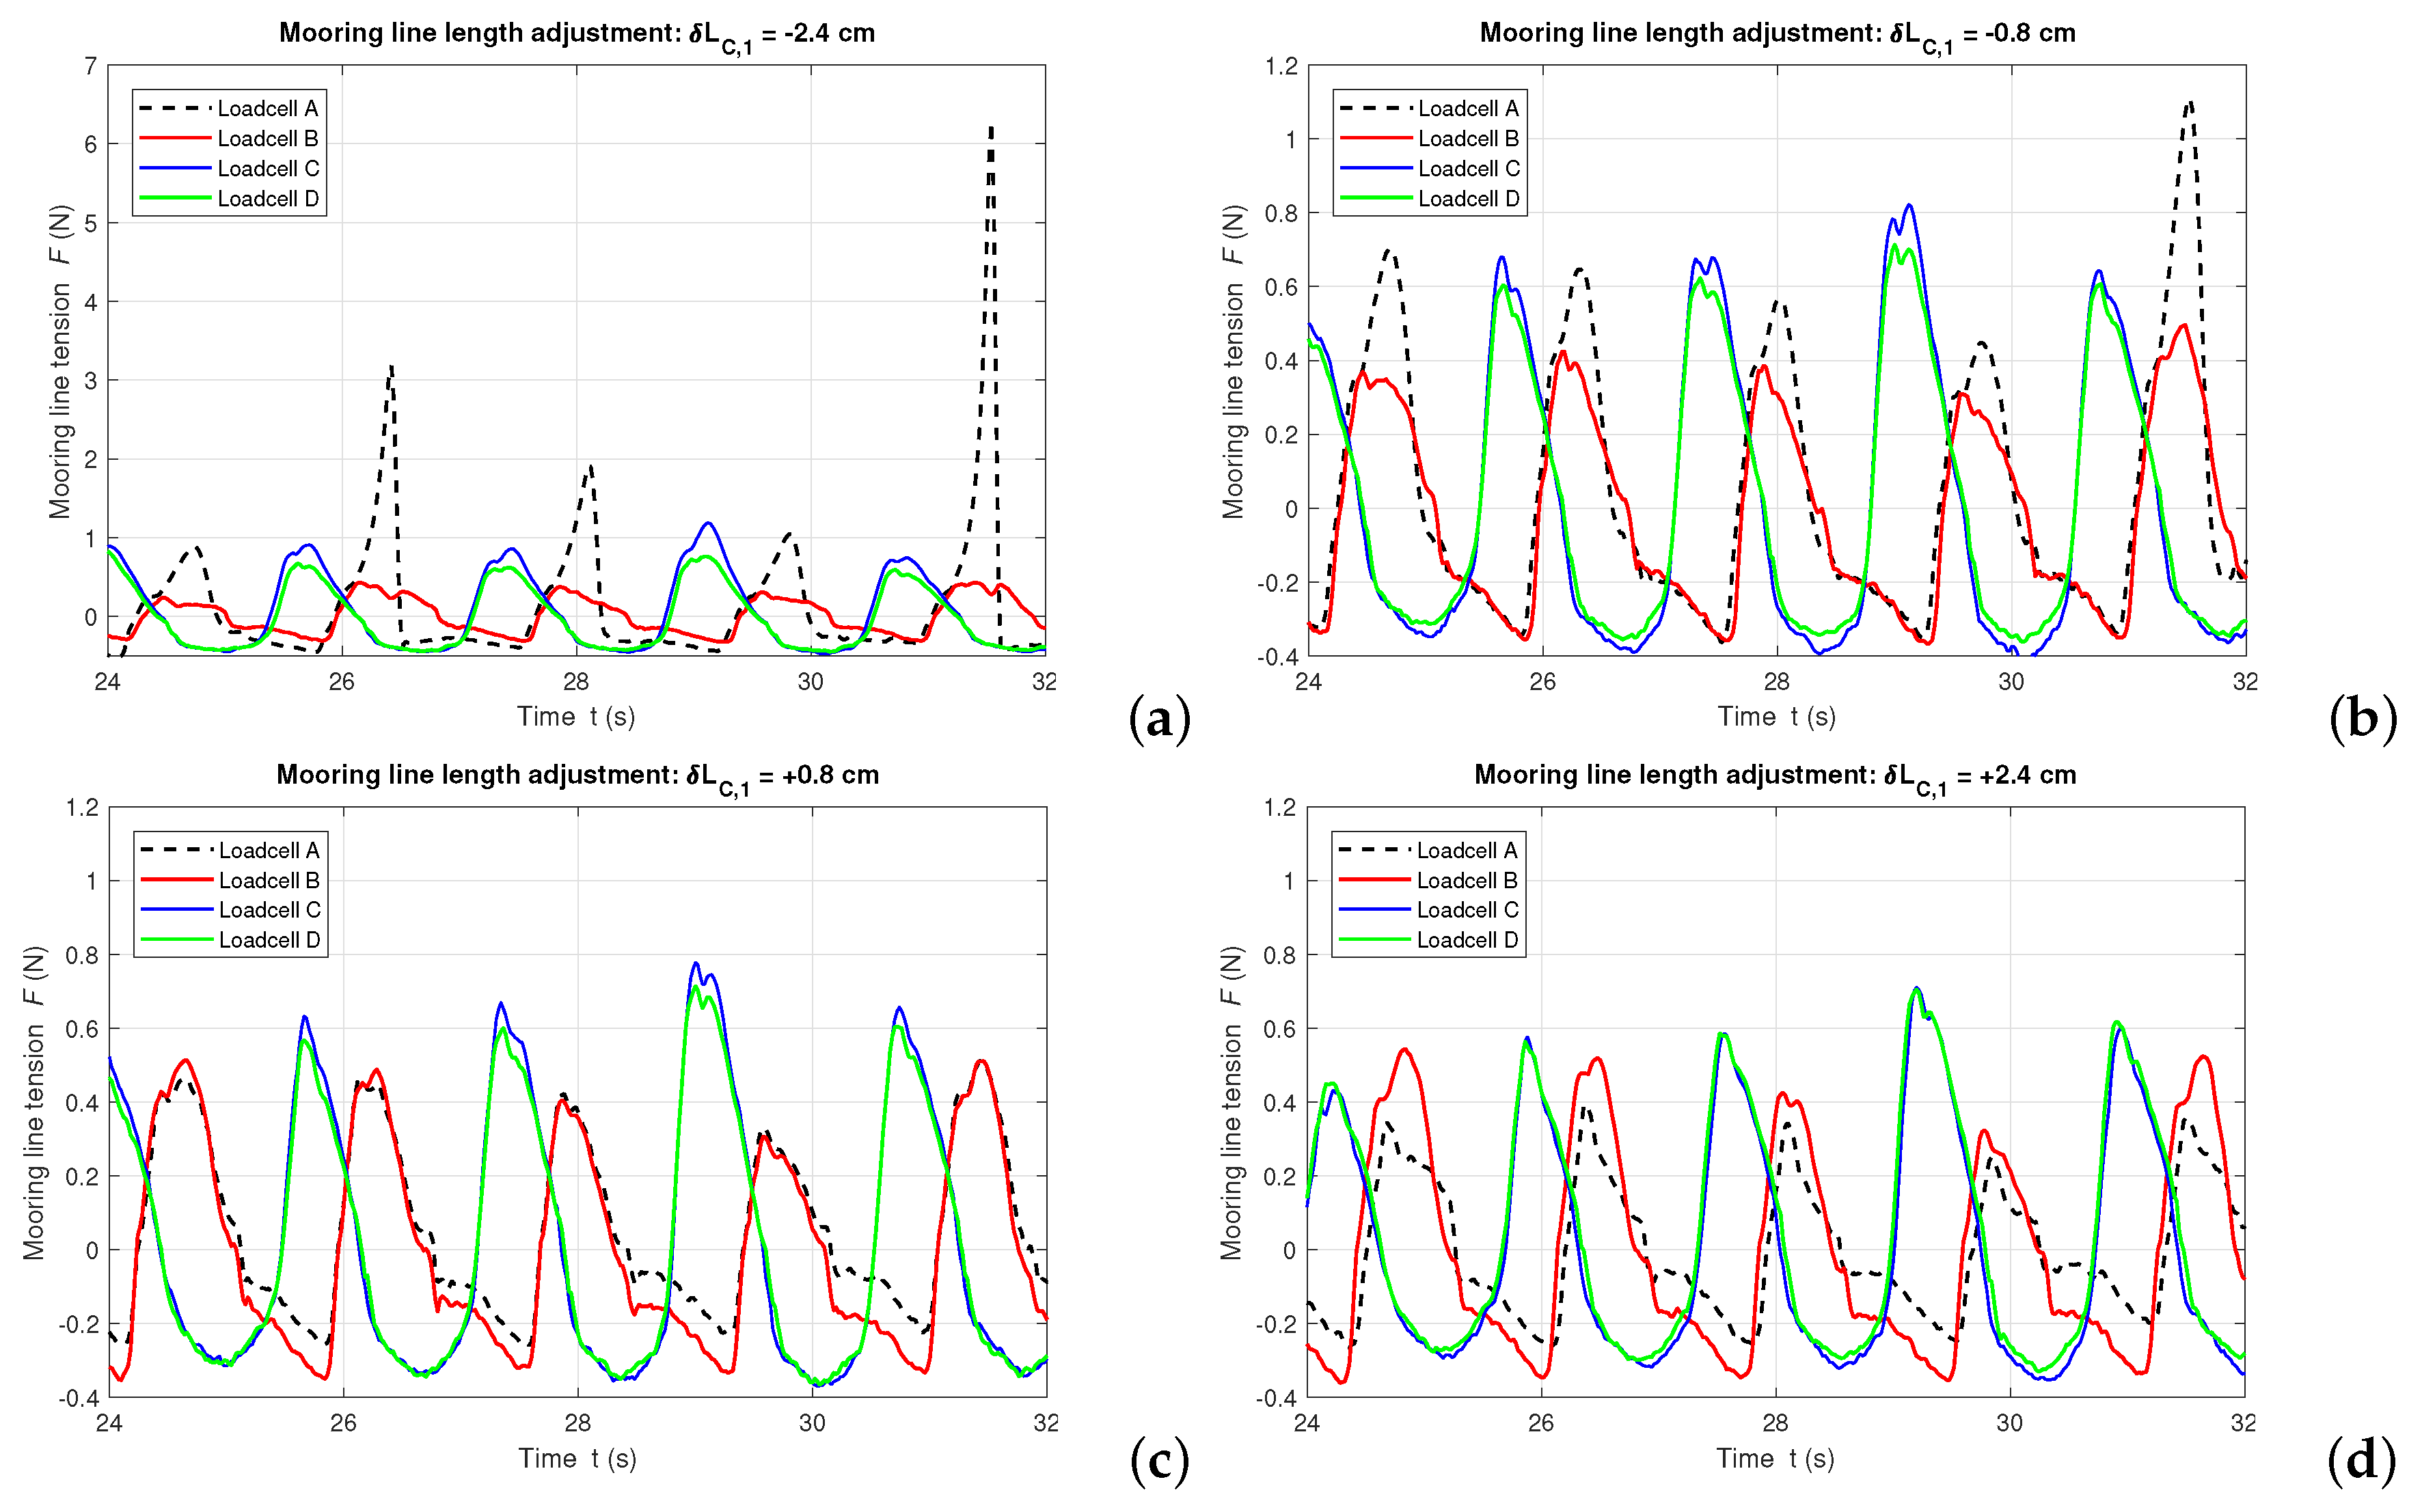
4.4. Effect of Unequal Mooring-Line Lengths

The mooring-line length affects the performance of a moored floating system. During the tests, a perfect symmetry of the mooring system is difficult to achieve while even slightly unequal lengths of the mooring lines introduce effects on the mooring-line tensions that need to be considered. This section discusses the sensitivity of the mooring-line tensions to the unbalanced mooring-line lengths. For this purpose, Test group 6 (see Table 4) is performed with uniform regular wave conditions of T = 1.7 s and H = 14.0 cm. The length of the front mooring line connected to Loadcell A, noted as L C , 1 , is adjusted within the range of ± 1.65 % of the initial length L C (Table 3). Using δ L C , 1 to note the increment of the mooring-line length, the mooring-line length adjustment is within the range of 2.4   cm δ L C , 1 2.4 cm, and with a step of 1.6 cm. Given the iron chain mooring-line parameters of Table 3, δ L C , 1 = 0.8 cm indicates increase of the mooring-line length by adjusting one segment on the chain, while a negative δ L C , 1 means decrease of the length. The mooring-line tensions measured by each loadcell when δ L C , 1 varies are shown in: Figure 13a for δ L C , 1 = 2.4 cm (−1.65% of L C , 1 ), Figure 13b for δ L C , 1 = 0.8 cm (−0.55 % of L C , 1 ), Figure 13c for δ L C , 1 = 0.8 cm (+0.55% of L C , 1 ) and Figure 13d for δ L C , 1 = 2.4 cm (+1.65% of L C , 1 ). According to the obtained results, the mooring-line tensions are sensitive to the mooring-line length variation. Shock loads have been observed as the length is shortened by 2.4 cm (or else, when δ L C , 1 = 2.4 cm, which equals to an adjustment of the chain by 3 segments), when the maximum tension attains to 5 times of the average load of the other mooring lines. This investigation illustrates the necessity of a balanced mooring configuration during the wave flume tests.

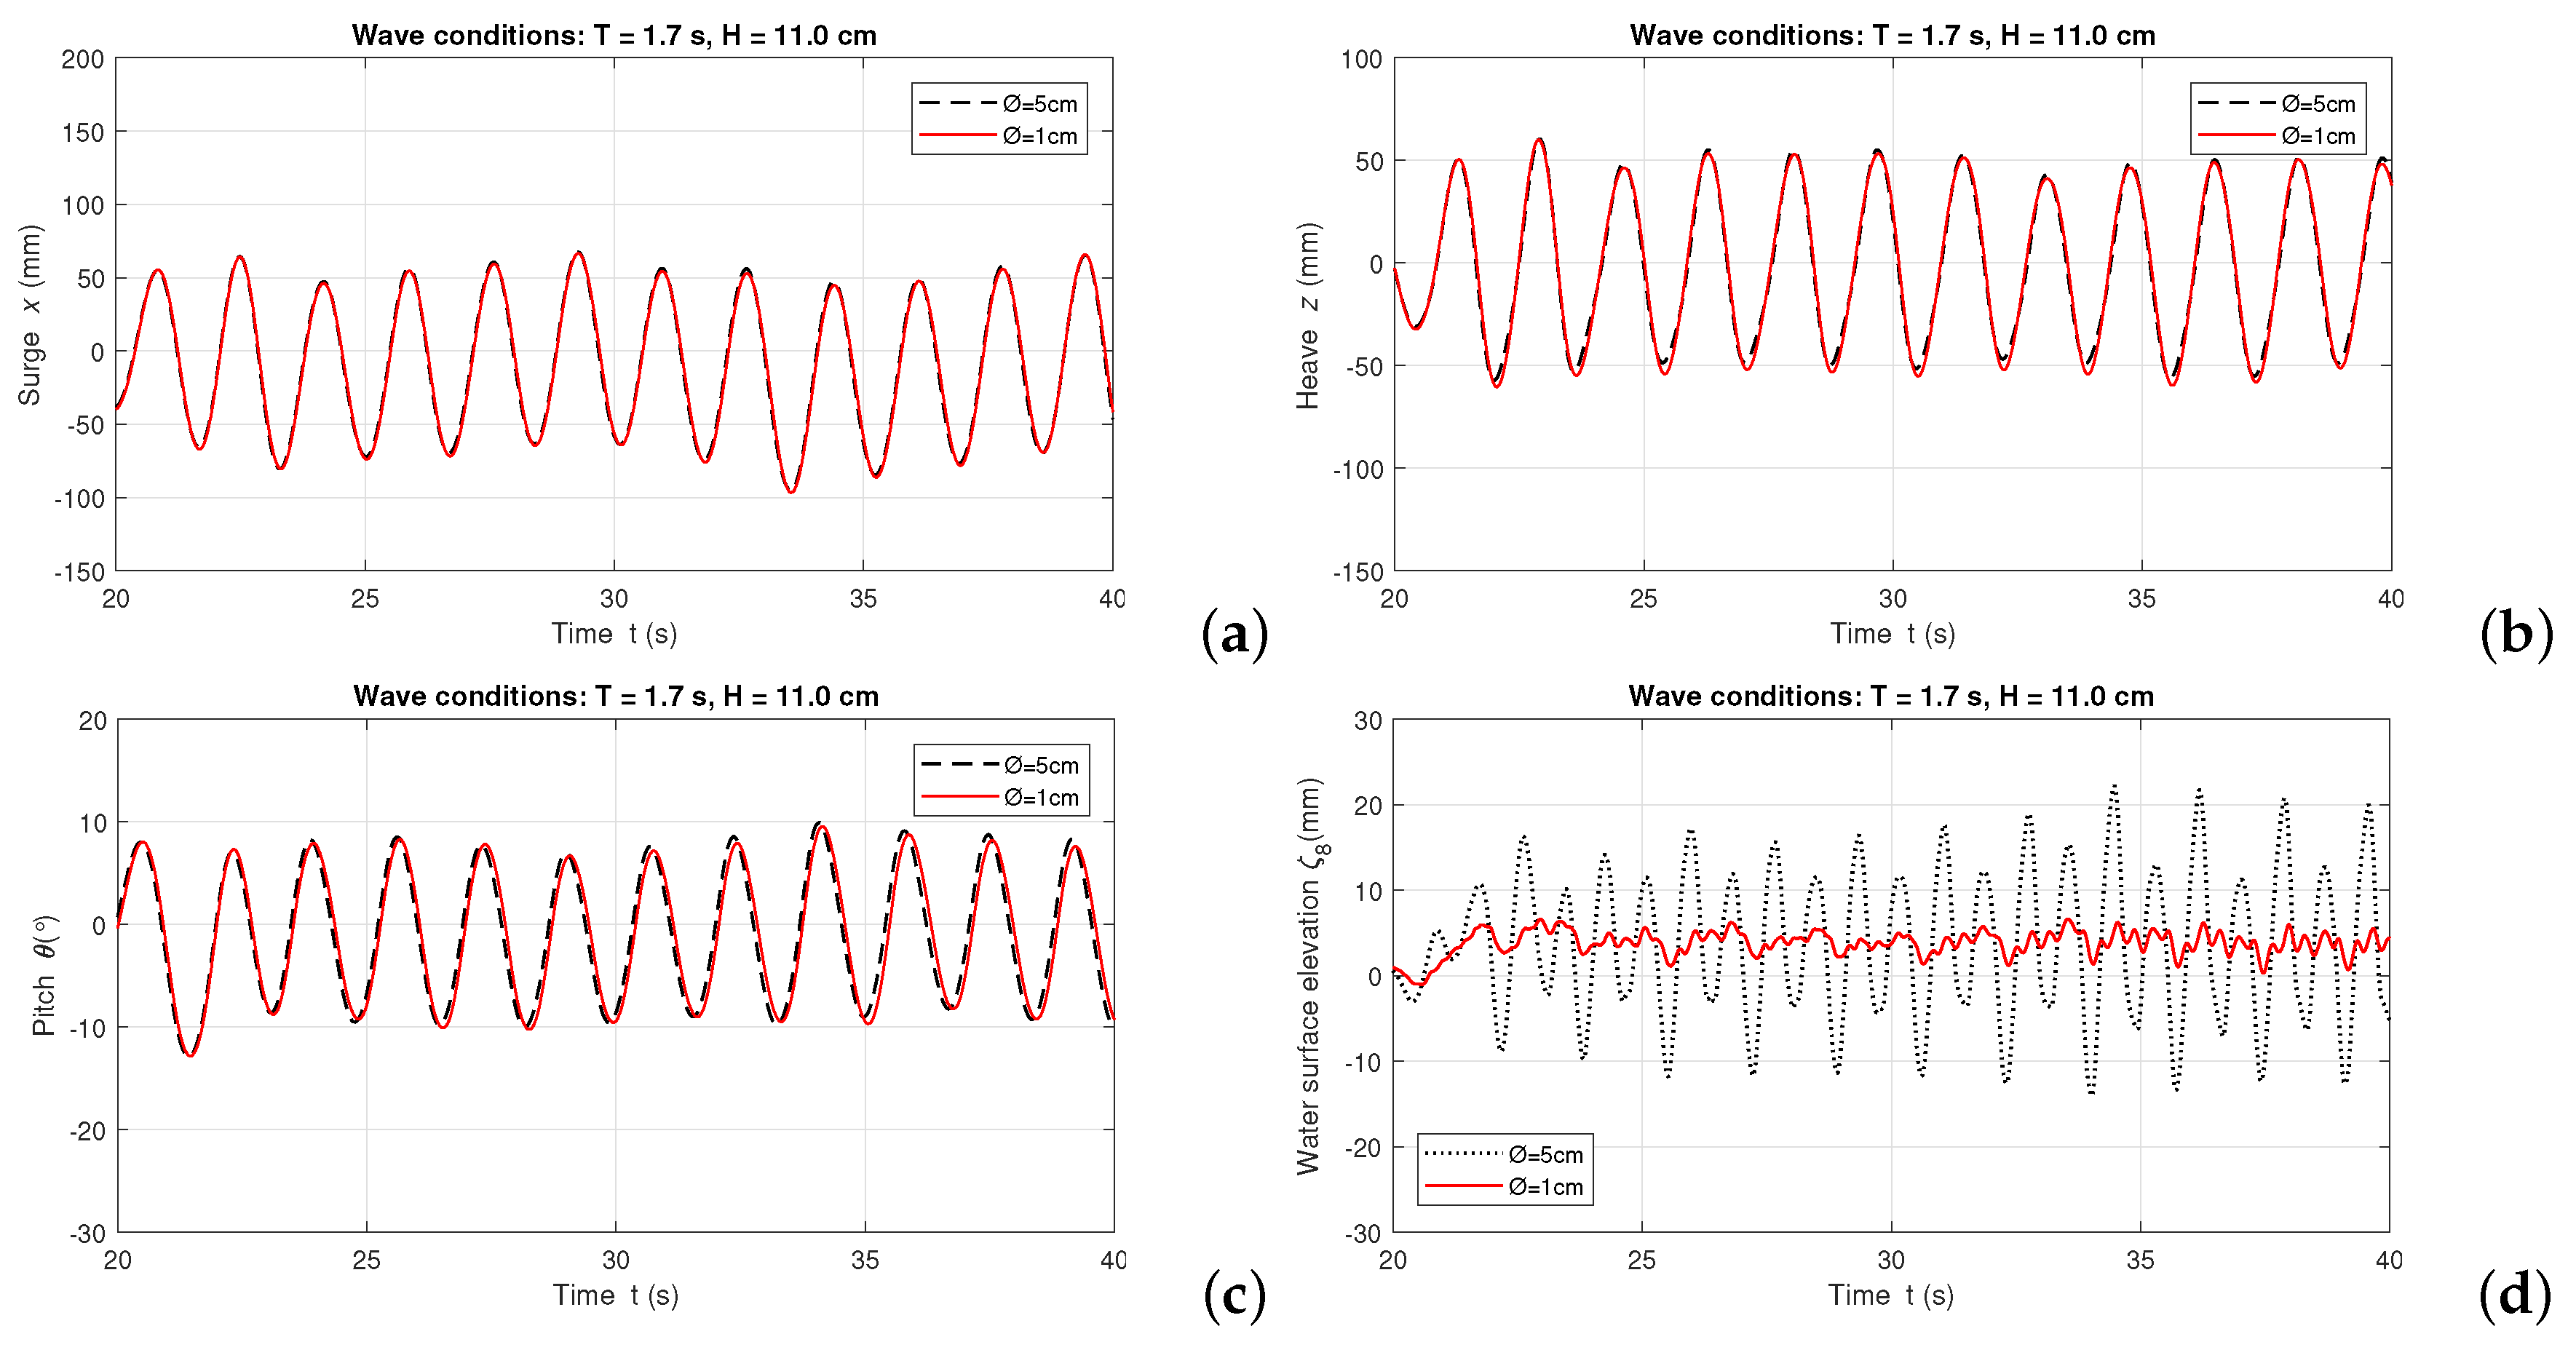
4.5. Effect of the Orifice Diameter at the Top of the OWC WEC Chamber

The size of the orifice diameter on top of the OWC WEC chamber is important for simulating the PTO damping of the OWC WEC since it determines the air-pressure drop inside the chamber [23]. According to the pipe flow theory, a smaller orifice diameter means a higher air-pressure drop and momentum loss rate during the air exchange, which indicates a higher damping of the PTO system. Based on this concept, as described in Table 4, Test group 7 is conducted by replacing the original ∅ = 5.0 cm orifice by a smaller one of ∅ = 1.0 cm diameter. The investigation focuses on the comparison of the OWC WEC motion and of the in-chamber water surface elevation. An example from the regular wave conditions of T = 1.7 s and H = 11.0 cm is shown in Figure 14. The comparative results for different orifice diameters show almost identical OWC WEC motion time series (see Figure 14a–c). This is because the PTO damping due to the orifice diameter variation is negligible compared to the system’s hydrodynamic damping. However, as shown in Figure 14d, the amplitude of in-chamber water surface elevation is reduced to less than 4 mm when the orifice diameter decreases, meaning that there is limited air volume exchange through the ∅ = 1.0 cm orifice.

5. Conclusions

In this paper, an experimental study for investigating the motion in regular waves and mooring-line tension characteristics of a 1:25 scaled slack-moored floating OWC WEC model is presented. Different wave conditions, PTO damping characteristics and mooring-line materials and lengths are studied.
Firstly, by applying a series of nonlinear regular wave conditions, the motion response of the OWC WEC model is recorded. With using iron chain mooring lines, the heave motion resonance period of the OWC WEC model is T r , h e a v e = 1.0 s and the in-chamber water surface elevation resonance is observed when T r , c h a m b e r = 0.9 s.
Secondly, the effect of different mooring-line materials, nylon rope and iron chain, is investigated in both small and large wave-amplitude conditions. When small wave-amplitude conditions are applied (wave height H 8.0 cm), either using iron chain or nylon rope mooring line gives similar surge and heave motion response of the OWC WEC model within the wave period range of 1.0   s T 1.7 s. However, the use of nylon rope leads to smaller heave motion resonance period of the OWC WEC, T r , h e a v e = 0.9 s, than when using the iron chain, and larger surge motion response amplitude when T 2.0 s. On the other hand, when the incident wave heights H 11.0 cm, the OWC WEC surge and heave motion of using the nylon rope mooring line is significantly larger than that when using the iron chain mooring line. Meanwhile, strong nonlinear effects in the OWC WEC heave motion occurs when using the nylon rope. Moreover, the use of nylon rope introduces mooring-line shock loads under the regular wave conditions of H = 14.0 cm and T = 1.7 s.
Thirdly, a scenario of an unbalanced mooring system due to unequal mooring-line lengths is investigated by adjusting the length of one mooring line. The results show that the tensions of the mooring lines of the floating OWC WEC model is sensitive to the variation of the mooring-line length. When decreasing the mooring-line length L C , 1 (connected to Loadcell A) by 2.4 cm, which is equal to only three segments on the iron chain, severe anchor shock loads have been captured by the loadcell.
Finally, a qualitative study of the PTO damping impact on the motion of the floating moored OWC WEC model is performed through a comparison of the obtained results between two different sized orifices on top of the model. These orifices simulate the effect of the PTO damping. A small orifice represents high PTO damping while a large diameter orifice represents a limited PTO damping. It is shown that the orifice diameter has a very limited influence on the motion of the OWC WEC model. However, a smaller top orifice introduces a more stable in-chamber water surface elevation.
In addition, two datasets from tests with a generic cubic floating box (BOX) model moored to the wave flume bottom are presented. These data include synchronized wave surface elevations, surge, sway, and pitch motion of the BOX as well as the mooring-line tensions. As a result, of applying nonlinear regular waves and the slack chain mooring system, the nonlinear motion results of the BOX model are obtained and analyzed. The datasets will be further used by researchers as a benchmark case for further development of fully nonlinear numerical models used to simulate the behavior of moored floating objects.
The presented study is novel as it focuses on the nonlinear responses of the motion and mooring system of a floating OWC WEC and BOX model in nonlinear intermediate depth water wave conditions. As nonlinear numerical models are becoming increasingly popular for the simulation of floating moored OWC WEC models, their validation using experimental data is crucial. The present study covers then this existing data gap seen in the literature regarding floating moored OWC WECs, by providing an open access experimental database.

Author Contributions

Formal analysis, M.W.; Investigation, M.W., C.A. and T.V.; Methodology, C.A. and L.C.; Project administration, V.S. and P.T.; Validation, A.C., M.H. and M.G.-G.; Writing—original draft, M.W.; Writing—review and editing, V.S., C.A., A.C. and L.C.

Funding

The present study at UGent is part of the preparatory phase for the MaRINET2 EsfLOWC project which has received funding from the EU H2020 Programme under grant agreement No. 731084. The present experiments at UGent are supported by the Research Foundation Flanders (FWO), Belgium - FWO.OPR.2.0—FWO research project No. 3G029114. The work is also partially financed by the Ministry of Economy and Competitiveness of the Government of Spain under project “WELCOME ENE2016-75074-C2-1-R”. The first author would like to acknowledge his PhD funding through a Special Research Fund of UGent, (BOF).

Conflicts of Interest

The authors declare no conflict of interest. The funders had no role in the design of the study; in the collection, analyses, or interpretation of data; in the writing of the manuscript, or in the decision to publish the results.

Abbreviations

The following abbreviations are used in this manuscript:
BBDBBackward Bend Duck Buoy
BOXcubic floating box model
CFDComputational Fluid Dynamics
DOFDegree of Freedom
EMECThe European Marine Energy Center
EPSExpanded Polystyrene
ITTCThe International Towing Tank Conference
OWCOscillating Water Column
PTOpower-take-off
SPHSmoothed Particle Hydrodynamics
WECWave-Energy Converter
WGwave gauge

References

  1. Falcão, A.F.O. Wave energy utilization: A review of the technologies. Renew. Sustain. Energy Rev. 2010, 14, 899–918. [Google Scholar] [CrossRef]
  2. Falcão, A.F.O.; Henriques, J.C.C. Oscillating-water-column wave energy converters and air turbines: A review. Renew. Energy 2016, 85, 1391–1424. [Google Scholar] [CrossRef]
  3. Masuda, Y.; Yamazaki, T.; Outa, Y.; McCormick, M.E. Study of back bent duct buoy. Proc. OCEANS’87 1987, 19, 384–389. [Google Scholar]
  4. McCormick, M.E. Analysis of a wave energy conversion buoy. J. Hydronaut. 1974, 8, 77–82. [Google Scholar] [CrossRef]
  5. Fonseca, N.; Pessoa, J. Numerical modelling of a wave energy converter based on U-shaped interior oscillating water column. Appl. Ocean Res. 2013, 40, 60–73. [Google Scholar] [CrossRef]
  6. WAMIT Inc. WAMIT User Manual; Version 6.4; WAMIT Inc.: Chestnut Hill, MA, USA, 2019. [Google Scholar]
  7. Sheng, W.; Lewis, A.; Alcorn, R. Numerical studies of a floating cylindrical OWC WEC. In Proceedings of the ASME 2012 31st International Conference on Ocean, Offshore and Arctic Engineering, Rio de Janeiro, Brazil, 1–6 July 2012. [Google Scholar]
  8. Sheng, W.; Lewis, A.; Alcorn, R. Numerical studies on hydrodynamics of a floating oscillating water column. In Proceedings of the ASME 2011 30th International Conference on Ocean, Offshore and Arctic Engineering, Rotterdam, The Netherlands, 19–24 June 2011. [Google Scholar]
  9. Bailey, H.; Robertson, B.R.D.; Buckham, B.J. Wave-to-wire simulation of a floating oscillating water column wave energy converter. Ocean Eng. 2016, 125, 248–260. [Google Scholar] [CrossRef]
  10. Gomes, R.P.F.; Henriques, J.C.C.; Gato, L.M.C.; Falcão, A.F.O. Wave power extraction of a heaving floating oscillating water column in a wave channel. Renew. Energy 2016, 99, 1262–1275. [Google Scholar] [CrossRef]
  11. Luo, Y.; Wang, Z.; Peng, G.; Xiao, Y.; Zhai, L.; Liu, X.; Zhang, Q. Numerical simulation of a heave-only floating OWC (oscillating water column) device. Energy 2014, 76, 799–806. [Google Scholar] [CrossRef]
  12. ANSYS. Ansys Manual, Release12.1. Available online: http://www.afs.enea.it/project/neptunius/docs/fluent/ (accessed on 14 May 2019).
  13. Elhanafi, A.; Macfarlane, G.; Fleming, A.; Leong, Z. Experimental and numerical investigations on the hydrodynamic performance of a floating-moored oscillating water column wave energy converter. Appl. Energy 2017, 205, 369–390. [Google Scholar] [CrossRef]
  14. CD-Adapco. User Guide STAR-CCM+, Version 10.02. Available online: https://mdx.plm.automation.siemens.com/star-ccm-plus (accessed on 14 May 2019).
  15. Elhanafi, A.; Macfarlane, G.; Fleming, A.; Leong, Z. Experimental and numerical investigations on the intact and damage survivability of a floating-moored oscillating water column device. Appl. Ocean Res. 2017, 68, 276–292. [Google Scholar] [CrossRef]
  16. Crespo, A.J.C.; Altomare, C.; Domínguez, J.M.; González-Cao, J.; Gómez-Gesteira, M. Towards simulating floating offshore oscillating water column converters with smoothed particle hydrodynamics. Coast. Eng. 2017, 126, 11–26. [Google Scholar] [CrossRef]
  17. Crespo, A.J.C.; Matthew, H.; Domínguez, J.M.; Altomare, C.; Wu, M.; Verbrugghe, T.; Stratigaki, V.; Troch, P.; Gómez-Gesteira, M. Floating moored oscillating water column with meshless SPH method. In Proceedings of the ASME 2018 37th International Conference on Ocean, Offshore and Arctic Engineering, Madrid, Spain, 17–22 June 2018. [Google Scholar]
  18. Correia da Fonseca, F.X.; Gomes, R.P.F.; Henriques, J.C.C.; Gato, L.M.C.; Falcão, A.F.O. Model testing of an oscillating water column spar-buoy wave energy converter isolated and in array: Motion and mooring forces. Energy 2016, 112, 1207–1218. [Google Scholar] [CrossRef]
  19. He, F.; Leng, J.; Zhao, X. An experimental investigation into the wave power extraction of a floating box-type breakwater with dual pneumatic chambers. Appl. Ocean Res. 2017, 67, 21–30. [Google Scholar] [CrossRef]
  20. Rapaka, E.V.; Natarajan, R.; Neelamani, S. Experimental investigation on the dynamic response of a moored wave energy device under regular sea waves. Ocean Eng. 2004, 31, 725–743. [Google Scholar] [CrossRef]
  21. Gomes, R.P.F.; Henriques, J.C.C.; Gato, L.M.C.; Falcão, A.F.O. Wave channel tests of a slack-moored floating oscillating water column in regular waves. In Proceedings of the 11th European Wave and Tidal Energy Conference, Nantes, France, 6–11 September 2015. [Google Scholar]
  22. EMEC. Tank testing of wave energy conversion systems. In Marine Renewable Energy Guides; The European Marine Energy Center Ltd.: London, UK, 2009. [Google Scholar]
  23. Crema, I.; Simonetti, L.; Cappietti, H.; Oumeraci, H. Laboratory experiments on oscillating water column wave energy converters integrated in a very large floating structure. In Proceedings of the 11th European Wave and Tidal Energy Conference, Nantes, France, 6–11 September 2015. [Google Scholar]
  24. LABIMA. Available online: https://www.labima.unifi.it/ (accessed on 13 May 2019).
  25. Thorimbert, Y.; Latt, J.; Cappietti, L.; Chopard, B. Virtual wave flume and oscillating water column modeled by lattice Boltzmann method and comparison with experimental data. Int. J. Mar. Energy 2016, 14, 41–51. [Google Scholar] [CrossRef]
  26. Simonetti, I.; Cappietti, L.; Elsafti, H.; Oumeraci, H. 3D numerical modelling oscillating water column wave energy conversion devices: Current knowledge and OpenFOAM® implementation. In Proceedings of the 1st International Conference on Renewable Energies Offshore, Lisbon, Portugal, 24–26 Novermber 2014; pp. 497–504. [Google Scholar]
  27. Simonetti, I.; Cappietti, L.; Elsafti, H.; Oumeraci, H. Optimization of the geometry and the turbine induced damping for fixed detached and asymmetric OWC devices: A numerical study. Energy 2017, 139, 1197–1209. [Google Scholar] [CrossRef]
  28. Ren, B.; He, M.; Dong, P.; Wen, H. Nonlinear simulations of wave-induced motions of a freely floating body using WCSPH method. Appl. Ocean Res. 2015, 50, 1–12. [Google Scholar] [CrossRef]
  29. Hadžić, I.; Hennig, J.; Perić, C.; Xing-Kaeding, Y. Computation of flow-induced motion of floating bodies. Appl. Math. Model. 2005, 29, 1196–1210. [Google Scholar] [CrossRef]
  30. Ctech. Available online: http://www.ctechmetrology.com/ (accessed on 13 May 2019).
  31. Troch, P. Experimentele Studie en Numerieke Modellering van Golfinteractie Met Stortsteengolfbrekers—Appendix E (in Dutch). Ph.D. Thesis, Ghent University, Ghent, Belgium, 2000. [Google Scholar]
  32. Le Méhauté, B. An Introduction to Hydrodynamics and Water Waves; Springer: Berlin, Germany, 1976. [Google Scholar]
  33. ITTC. Seakeeping Experiments, Recommended Procedures and Guidelines; International Towing Tank Conference. Available online: https://ittc.info/ (accessed on 14 May 2019).
Figure 1. Geometry of floating models: (a) BOX; (b) OWC WEC.
Energies 12 01834 g001
Figure 2. Top view of the experimental setup.
Energies 12 01834 g002
Figure 3. Moored models in the wave flume: (a) front view of the OWC WEC model with rope mooring; (b) side and back view of the OWC WEC model with chain mooring (this image of the model “broken” into two pieces is a result of light refraction); (c) back view of the BOX model with chain mooring.
Energies 12 01834 g003
Figure 4. Applied wave conditions plotted in the adapted Le méhauté diagram [32]. All cases in Test group 1 to 5 are plotted. [Adapted with from Le méhauté, B. An Introduction to Hydrodynamics and Water Waves]
Energies 12 01834 g004
Figure 5. Synchronized data of validation test with BOX model in regular waves of T = 1.6 s and H = 12.0 cm (target values): (a) wave surface elevation; (b) surge motion; (c) heave motion; (d) pitch motion; (e) mooring-line tensions measured by Loadcell A and B; (f) mooring-line tensions measured by Loadcell C and D.
Energies 12 01834 g005
Figure 6. Synchronized data of validation test with BOX model in regular waves of T = 1.8 s and H = 15.0 cm (target values): (a) wave surface elevation; (b) surge motion; (c) heave motion; (d) pitch motion; (e) mooring-line tensions measured by Loadcell A and B; (f) mooring-line tensions measured by Loadcell C and D.
Energies 12 01834 g006
Figure 7. OWC WEC surge motion response for different mooring-line materials: (a) wave height H = 4.0 cm and H = 8.0 cm; (b) wave height H = 11.0 cm and H = 14.0 cm; (c) using only iron chain, H = 4.0 cm to H = 14.0 cm; (d) using only nylon rope H = 4.0 cm to H = 14.0 cm. (All wave conditions are target values).
Energies 12 01834 g007
Figure 8. OWC WEC heave motion response for different mooring-line materials: (a) wave height H = 4.0 cm and H = 8.0 cm; (b) wave height H = 11.0 cm and H = 14.0 cm; (c) using only iron chain, H = 4.0 cm to H = 14.0 cm; (d) using only nylon rope H = 4.0 cm to H = 14.0 cm. (All wave conditions are target values).
Energies 12 01834 g008
Figure 9. OWC WEC model motions in regular waves of T = 1.9 s: (a) surge, H = 8.0 cm; (b) surge, H = 14.0 cm; (c) heave, H = 8.0 cm; (d) heave, H = 14.0 cm; (e) pitch, H = 8.0 cm; (f) pitch, H = 14.0 cm. (All wave conditions are target values).
Energies 12 01834 g009
Figure 10. Water surface elevation time series: (a) T = 0.9 s and H = 4.0 cm; (b) T = 1.0 s and H = 4.0 cm; (c) T = 1.7 s and H = 11.0 cm; (d) T = 1.7 s and H = 14.0 cm. (All wave conditions are target values.
Energies 12 01834 g010
Figure 11. Iron chain mooring-line tensions measured by loadcells in regular waves of T = 1.7 s and H = 14.0 cm (target values): (a) Loadcells A and B; (b) Loadcells C and D.
Energies 12 01834 g011
Figure 12. Nylon rope mooring-line tensions measured by loadcells in regular waves of T = 1.7 s and H = 14.0 cm (target values): (a) Loadcells A and B; (b) Loadcells C and D.
Energies 12 01834 g012
Figure 13. Mooring-line tensions measured by loadcells in regular waves of T = 1.7 s and H = 14.0 cm (target values) for unequal mooring-line lengths: (a) δ L C , 1 = 2.4 cm (−1.65% of L C , 1 ); (b) δ L C , 1 = 0.8 cm (−0.55 % of L C , 1 ); (c) δ L C , 1 = 0.8 cm (+0.55% of L C , 1 ); (d) δ L C , 1 = 2.4 cm (+1.65% of L C , 1 ).
Energies 12 01834 g013
Figure 14. Comparisons of the OWC WEC motion and water surface elevation inside the chamber between different orifice sizes regular waves of T = 1.7 s and H = 11.0 cm (target values): (a) surge; (b) heave; (c) pitch; (d) in-chamber water surface elevation.
Energies 12 01834 g014
Table 1. Geometric characteristics of the BOX model.
SymbolDescriptionUnitValue
B B O X Width of BOX modelcm20.0
L B O X Length of BOX modelcm20.0
H B O X Height of BOX modelcm13.2
T B O X Draft of BOX modelcm7.9
M B O X Mass of BOX modelg3148.0
h k 1 Mooring-line fairlead heightcm0.5
I X X , B O X Moment of inertia around X axis cm 2 1.5 × 10 5
I Y Y , B O X Moment of inertia around Y axis cm 2 1.5 × 10 5
I Z Z , B O X Moment of inertia around Z axis cm 2 2.1 × 10 5
Table 2. Geometric characteristics of the OWC WEC model.
SymbolDescriptionUnitValue
B O W C Width of OWC modelcm20.0
L O W C Length of OWC modelcm20.0
H O W C Height of OWC modelcm44.0
T O W C Draft of OWC modelcm26.0
M O W C Mass of OWC modelg2593.0
I X X , O W C Moment of inertia around X axis cm 2 7.2 × 10 5
I Y Y , O W C Moment of inertia around Y axis cm 2 9.4 × 10 5
I Z Z , O W C Moment of inertia around Z axis cm 2 5.6 × 10 5
h o Front opening heightcm19.0
h k 2 Mooring-line fairlead heightcm15.0
h b EPS foam block heightcm8.0
s 1 Vertical height of center of gravitycm15.2
s 2 Distance from center of gravity to front surfacecm9.9
Orifice diametercm5.0
Table 3. Mooring-line parameters.
MaterialSymbolDescriptionUnitsParameter
Iron chainL C Total length of chain mooring linecm145.5
k C Chain elasticityN/mm19.0
lLength per chain segmentcm0.8
wChain weight per centimeterg/cm0.6
vChain volume per centimeter cm 3 /cm0.1
Nylon ropeL R Total length of rope mooring linecm144.0
k R Rope elasticityN/mm1.1
Table 4. Experimental program.
Test GroupModelRange of Regular
Wave Period,
T (s)
Range of Regular
Wave Height,
H (cm)
Water
Depth,
d (cm)
Mooring
Line
Material
Note
1BOX1.6–2.012.0–15.050.0ChainBenchmark test
2OWC0.7– 2.14.0–8.060.0ChainSmall wave amplitude
3OWC1.5– 2.011.0–14.060.0ChainLarge wave amplitude
4OWC0.7–2.14.0–8.060.0RopeSmall wave amplitude
5OWC1.5–2.011.0–14.060.0RopeLarge wave amplitude
6OWC1.714.060.0ChainUnbalanced mooring
7OWC1.5–2.011.060.0Chain∅ = 1.0 cm

