Article

A Self-Powered Glucose Biosensor Operated Underwater to Monitor Physiological Status of Free-Swimming Fish

Department of Mechanical and Mechatronic Engineering, National Taiwan Ocean University, Keelung 202-24, Taiwan
*
Author to whom correspondence should be addressed.
Energies 2019, 12(10), 1827; https://doi.org/10.3390/en12101827
Submission received: 21 April 2019 / Revised: 6 May 2019 / Accepted: 12 May 2019 / Published: 14 May 2019
(This article belongs to the Section A4: Bio-Energy)

Abstract

:
The changes in blood glucose levels are a key indicator of fish health conditions and are closely correlated to their stress levels. Here, we developed a self-powered glucose biosensor (SPGB) consisting of a needle-type enzymatic biofuel cell (N-EFC), which was operated underwater and connected to a charge pump integrated circuit (IC) and a light emitting diode (LED) as the indicator. The N-EFC consisted of a needle bioanode, which was inserted into the caudal area of a living fish (Tilapia) to access biofuels, and a gas-diffusion biocathode sealed in an airtight bag. The N-EFC was immersed entirely in the water and connected to a charge pump IC with a capacitor, which enabled charging and discharging of the bioelectricity generated from the N-EFC to blink an LED. Using a smartphone, the glucose concentration can be determined by observing the LED blinking frequencies that are linearly proportional to the blood glucose concentration within a detection range of 10–180 mg/dL. We have successfully demonstrated the feasibility of the SPGB used to continuously monitor the physiological status of free-swimming fish treated with cold shock in real time. The power generated by a free-swimming fish with an N-EFC inserted into its caudal area, swimming in a fish tank with a water temperature (Tw) of 25 °C, exhibited an open circuit voltage of 0.41 V and a maximum power density of 6.3 μW/cm2 at 0.25 V with a current density of 25 μA/cm2. By gradually decreasing Tw from 25 °C to 15 °C, the power generation increased to a maximum power density of 8.6 μW/cm2 at 0.27 V with a current density of 31 μA/cm2. The blood glucose levels of the free-swimming fish at 25 °C and 15 °C determined by the blinking frequencies were 44 mg/dL and 98 mg/dL, respectively. Our proposed SPGB provides an effective power-free method for stress visualization and evaluation of fish health by monitoring a blinking LED through a smartphone.

1. Introduction

Inadequate breeding environments, such as overcrowded farming, the deterioration of water quality and extremely cold/hot weather can induce stress in fish and affect their development and health [1]. Stressed fish consequently become immunocompromised causing mass mortality owing to the decrease in resistance to infectious diseases. The change in blood glucose levels, which closely correlate to stress levels in fish and represent the status of respiratory or nutritional disturbance, is a blood indicator that can help determine fish health conditions [2].
Conventional methods used to measure the fish blood glucose levels require the fish to be anesthetized; blood is then withdrawn and its glucose level is measured in the atmospheric environment. These methods are labor-intensive and it is difficult to acquire true blood glucose levels in fish that exhibit abnormal physiological statuses. To address this issue, Endo et al. developed several wireless biosensors to continuously monitor the levels of glucose, lactic acid, and cholesterol in free-swimming fish [3,4,5,6,7,8]. Their biosensor was constructed using noble wire coated with a specific enzyme as the working electrode and AgCl2 paste as the reference electrode, which was implanted into the eyeball of the fish. The developed biosensor was connected to a wireless potentiostat powered with a 3.3 V coin battery for amperometric measurements and wireless transmission. However, this wireless biosensor cannot operate for more than 3 days because of insufficient battery power.
Recently, enzymatic biofuel cells (EFCs), which enable the conversion of chemical energy into electricity through electrochemical reactions of specific enzymes immobilized on electrodes, have attracted considerable attention. They have demonstrated potential for implantation into living organisms to generate electric power from body fluids, enabling them to function as a living battery for implantable sensors and medical devices [9]. In the past decades, several studies have reported the feasibility of such EFCs to generate electric power and drive electronic devices by implantation into different living organisms/species [10], such as rats [11,12,13], rabbits [14], cockroaches [15], clams [16], snails [17], lobsters [18], and insects [19]. However, no studies have been conducted on the use of EFCs to generate electric power directly from a living fish even though they are one of the most abundant living species on earth. We aim to demonstrate the feasibility of EFCs to generate electric power directly from an edible fish such as Tilapia. Tilapia, one of several commercially important aquaculture species, is a popular, tasty, and relatively inexpensive fish that can be bought in a supermarket or a fish market. In contrast to the previously reported implantable EFC operated in the atmospheric environment, we attempt to operate the EFC underwater to generate electrical power directly from a free-swimming fish and monitor the physiological status of the fish based on the efficiency of the generated electrical power.
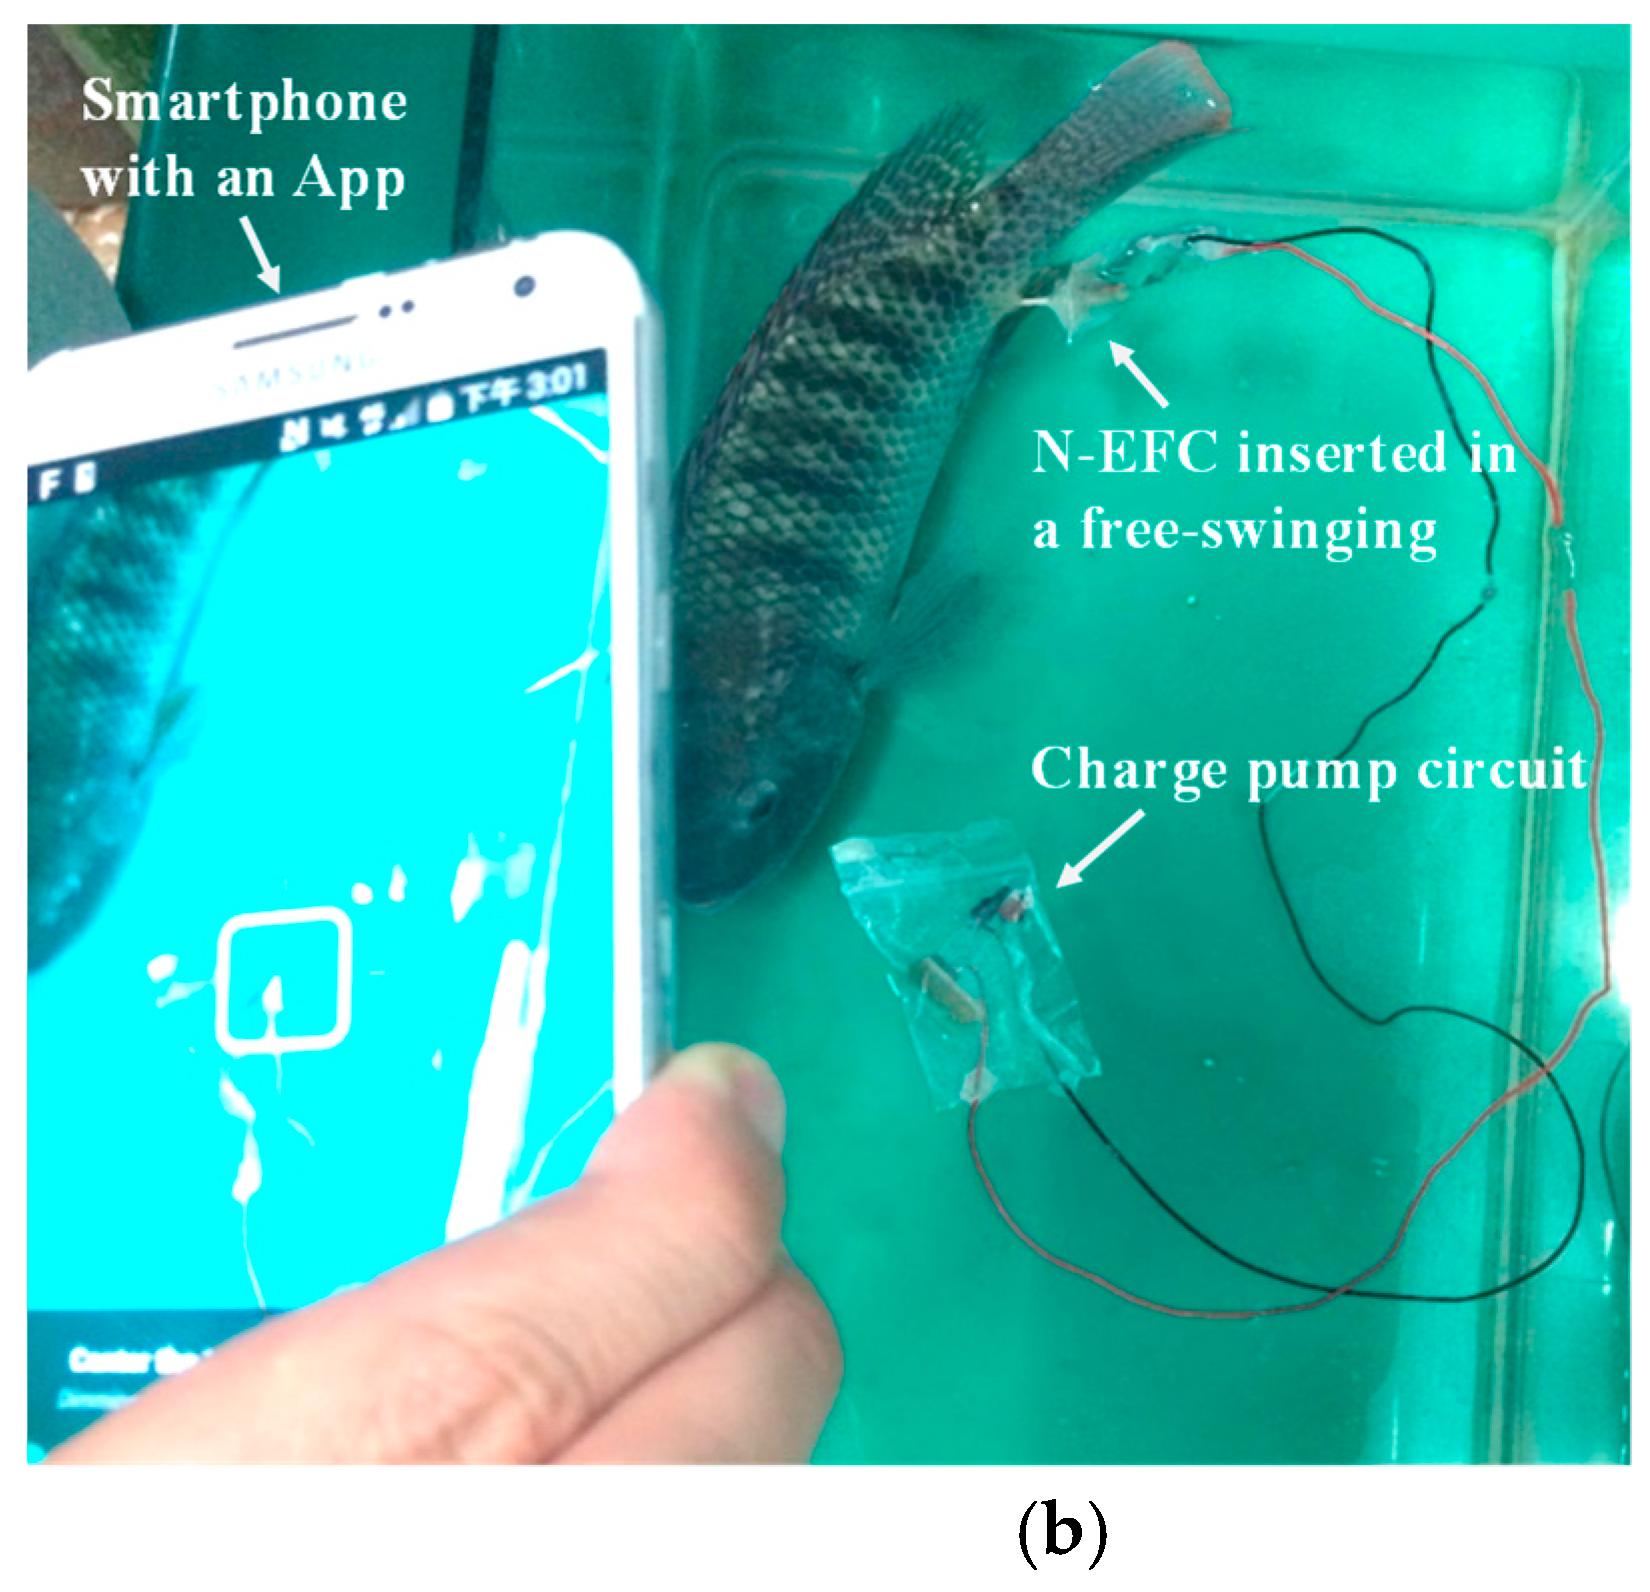
Here, we developed a self-powered glucose biosensor (SPGB) consisting of a needle-type enzymatic biofuel cell (N-EFC), which was operated underwater and connected to a charge pump integrated circuit (IC) and a light emitting diode (LED) as the indicator. Figure 1a,b show a schematic and a photograph of the SPGB used to monitor the physiological status of a free-swimming fish (Tilapia) in a tank in real time using a smartphone with an application (App). The N-EFC was inserted into the caudal area of a living fish to access biofuels along with a gas-diffusion biocathode sealed in an airtight bag. The N-EFC was immersed entirely in water and connected to a charge pump IC and capacitor. This enabled the charge and discharge of the bioelectricity generated from the N-EFC in a quick burst to blink the LED. We sealed the charge pump IC and LED in an airtight bag and let it float on the water surface. By using a smartphone with an App, the glucose concentration can be determined by measuring LED blinking frequencies. We have successfully demonstrated the feasibility of the SPGB used to monitor the physiological status (glucose levels) of a free-swimming fish treated with cold shock in real time via a smartphone. Our proposed SPGB provides an effective power-free method for stress visualization and evaluation of fish health.

2. Materials and Methods

2.1. Materials

Materials Glucose dehydrogenase (GDH) from Pseudomonas sp. (200 U/mg) (E.C. 1.1.1.47), bilirubin Oxidase (BOD) from Myrothecium verrucaria (65 U/mg) (E.C. 1.3.3.5), D-Glucose, 2-methyl-1,4-naphthoquinone (vitamin K3, VK3), N-methyl-2-pyrrolidone (NMP), 2,2′-azinobis (3-ethylben-zothiazoline-6-sulfonic acid ammonium salt) (ABTS), β-nicotinamide adenine dinucleotide, reduced dipotassium salt (NADH), poly-L-lysine hydrobromide (PLL), poly(sodium 4-styrenesulfonate) (PSS) poly(vinylidene fluoride) (PVDF) and ethyl 3-aminobenzoate methanesulfonate salt were purchased from Sigma–Aldrich (St. Louis, MO, USA). Diaphorase (Dp) from Clostridium sp. (30U/mg) (EC 1.6.99.-) was purchased from Toyobo Enzymes Corp. (Osaka, Japan). Ketjen black (KB) was purchased from BooChem Corp. (Shanghai, China).

2.2. Design of Needle-Type EFCs

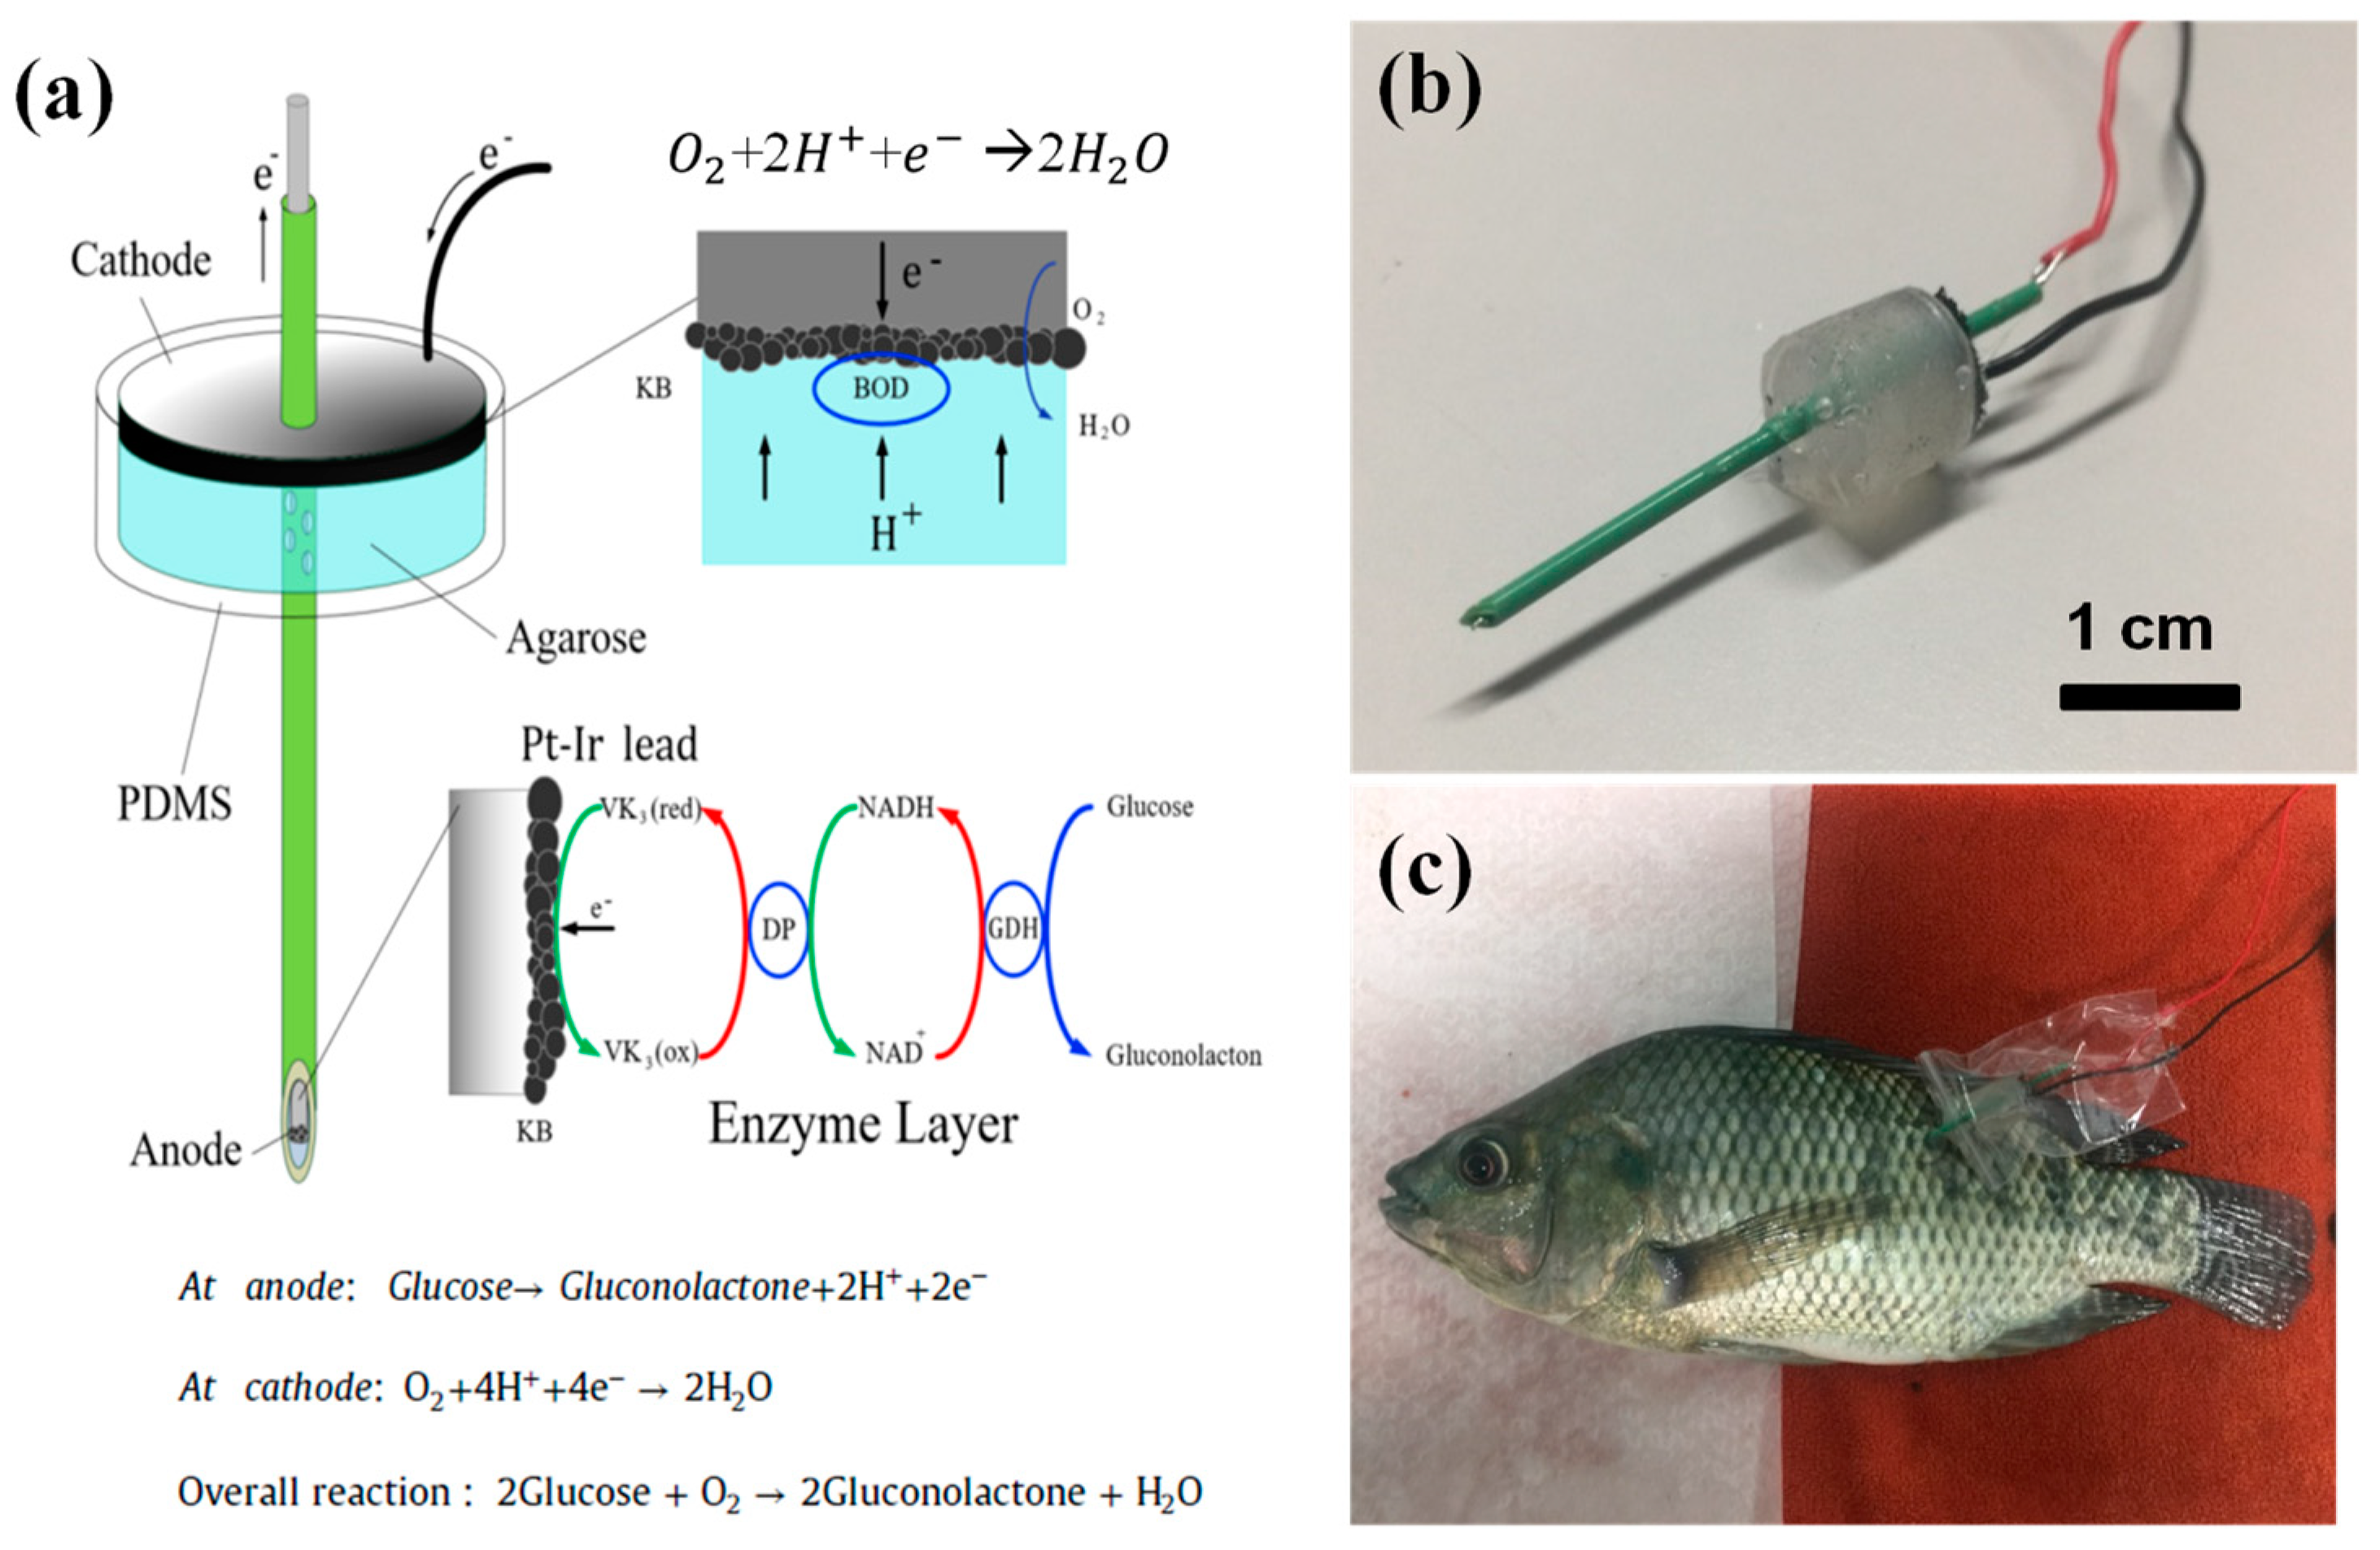
Figure 2a shows the schematic structure of the N-EFC and schemes of glucose oxidation at the anode along with O2 reduction at the enzymatic gas-diffusion cathode. The non-conductive polyetheretherketone (PEEK) tube (Upchurch Scientific Inc., USA) with 1.6 mm O.D., 1.4 mm I.D. and 30 mm in length, was cut and sharpened at one end for use as a non-conductive needle. The flexible PEEK tubing, a semicrystalline thermoplastic with excellent mechanical and chemical resistance properties, has become a popular replacement for stainless steel tubing and can be easily cut to desired lengths. A platinum–iridium wire (Pt-Ir wire) (ϕ = 0.178 mm, 30 mm in length) was used as a bioanode. We first coated the Pt-Ir wire at one end with highly conductive carbon black (KB) to enlarge the effective surface area of the electrode and consequentially increased the catalytic activity. We then deposited the VK3 used as the electron transfer mediator, Dp to catalyze NADH, and GDH to catalyze glucose. We inserted the Pt-Ir wire into the PEEK tube, which was then filled with agarose hydrogel as the electrolyte. We also drilled few holes at PEEK tube to serve as hydrogen ions (H+) channels. For the biocathode, we used BOD-modified carbon cloth, which was mounted on a silicon-based polydimethylsiloxane (PDMS) chamber filled with 1% agarose hydrogel containing buffer salts. The half reactions and the overall reaction are as follows:
At bioanode:
Glucose + NAD +   GDH   Gluconolactone + NADH + H + ,
NADH Dp   NAD + + 2 H + + 2 e ,
At biocathode:
O 2 + 4 H + + 4 e   BOD   2 H 2 O
Overall reaction:
2 Glucose + O 2   GDH   2 Gluconolactone + H 2 O
At the bioanode, GDH oxidizes glucose to produce gluconolactone and NADH by releasing positive hydrogen ions (H+). Dp oxidizes the reduced NADH to generate oxidized NAD+, hydrogen ions, and electrons (e). The electrons travel through the external circuit producing current and the positive hydrogen ions travel through the electrolyte along the needle to recombine with electrons at the biocathode where BOD reduces oxygen to water. The overall reaction can generate electrical power. Figure 2b,c show images of the N-EFC and the N-EFC inserted into a living fish (Tilapia) around the caudal area to access biofuels and a gas-diffusion biocathode sealed in an airtight bag filled with air, respectively.

2.3. Preparation of Enzymatic Electrodes

A Pt–Ir wire (ϕ = 0.178 mm) was used as a bioanode. One end of the Pt–Ir wire was coated with a mixture (4:1, v/v) of 5 mg/mL KB in NMP and 10 % v/v PVDF in NMP and dried at 37 °C for 2 h. Potential differences of 2.0 V and –1.1 V (vs. Ag/AgCl reference electrode) were then applied to the KB electrodes for 15 min and 15 s in 0.1 M (pH 7.0) phosphate potassium buffer (PPB), respectively, to obtain a hydrophilic surface [15,20], which can enhance the efficiency of surface modification in the following process. The bioanode (KB-coated Pt–Ir wire) was then fabricated by dropping it into successive buffers consisting of: 20 mg/mL PLL solution (0.1 M PPB, pH 7), 10 mM VK3 in acetone, 18 mg/mL Dp solution (0.1 M PPB, pH 7), 638 mg/mL NAD+ solution (0.1 M PPB, pH 7), 14 mg/mL GDH solution (0.1 M PPB, pH 7), and 0.7 mg/mL PSS solution (0.1 M PPB, pH 7). The bioanode was dried at 37 °C for 1 h after it was placed in each solution. We inserted the Pt-Ir bioanode into a non-conductive PEEK needle, and a 1% solution of agarose containing buffer salts (80 °C) was injected into the internal needle space and cooled in the air.
A carbon cloth (W0S1009, CeTech Corp., Taiwan) with a diameter of 1 cm was used as a gas-diffusion biocathode. A hole with a diameter of 2 mm was previously punched at the center of the carbon cloth to hold the non-conductive PEEK needle. The potential differences were applied to the carbon cloth to obtain a hydrophilic surface. The KB-coated carbon cloth was modified by successively dropping it into the following buffers: 100 mM ABTS solution (0.1 M PPB, pH 7), 5 mg/mL BOD solution (0.1 M PPB, pH 7), 7.2 mg/mL PLL solution (0.1 M PPB, pH 7) and 10.2 mg/mL PSS solution (0.1 M PPB, pH 7). The biocathode was dried at 37 °C for 1 h after being placed in each solution. This enzyme-modified biocathode was mounted on a chamber made from PDMS, which was filled with 1% agarose hydrogel containing buffer salts.

2.4. Insertion of the N-EFC into a Living Fish

We used Nile Tilapia (Oreochromis niloticus) as the experimental organism (body weight, ca. 300 g; body length, ca. 25 cm) from the Aquatic Animal Center at National Taiwan Ocean University. The fish was cultured in a 25 L fish tank (40 cm × 24 cm × 27 cm). During the experiment, the water temperature was set at 25 °C with continuous aeration and recirculation through a biologic filter. Before inserting the N-EFC, the fish was anesthetized in a water bath containing 400 ppm ethyl 3-aminobenzoate methanesulfonate salt for 10 min. The anesthetized fish was placed on a table; its head was covered with a wet cloth to keep the fish breathing.
To access biofuels, the N-EFC was inserted at a 45° angle into the skin of the anesthetized fish near the lateral line around the caudal area; this area is abundant with arteries, veins, and capillaries. We first used a 20 G injection needle (O.D. = 1.1 mm) to create a small hole and then subsequently used a larger 14G needle (O.D. = 2.11 mm) to make the hole larger to accommodate the N-EFC with O.D. = 1.6 mm. A liquid bandage (Coleskin, Tokyo Koshisha Inc., Japan) was applied around the insertion point to seal the hole, protect the wound from water, and to fix the N-EFC in place. To operate the N-EFC in the water environment, we used a small waterproof plastic bag to cover the biocathode and used glue to seal the bag (Figure 2c). Video S1 in the Supplementary Materials shows the implantation procedure of the N-EFC into the fish. After insertion and fixation, the N-EFC was connected to a charge pump IC and an LED. We noted that the fish with the implanted N-EFC could survive for at least 2 days during measurements. The fish was able to survive for at least one week even after removing the N-EFC and could be used for conducting measurements for a second time owing to its remarkable self-healing ability.

3. Results and Discussion

3.1. Power Generation of the N-EFC

The N-EFC was characterized in vitro by measuring polarization curves at various standard glucose concentration via linear sweep voltammetry (LSV) from an open circuit voltage (OCV) to 50 mV at a slow scan rate (0.1 mV/s) by using an electrochemical analyzer (CHI600C, CH Instruments, Inc., TX, USA). A two-electrode system was used with the cathode as the working electrode and the anode as both the counter and reference electrode. The current and power densities were calculated from polarization curves and the geometrical surface area of the bioanode. Figure 3a depicts the polarization curves, and current and power densities of the N-EFC at various standard glucose concentrations from 10 to 180 mg/dL in 0.1 M phosphate buffer, pH 7.0. The open circuit voltage, maximum current and power densities increased proportionally with increasing glucose concentrations due to the increased catalysis of glucose molecules. In the presence of 180 mg/dL of glucose in air-saturated environment (25 °C, pH 7), the N-EFC exhibited open circuit voltage of 0.43 V and a maximum power density of 11.8 μW/cm2 at 0.22 V with a current density of 53.5 μA/cm2. The maximum power density of the N-EFC increased with increasing glucose analyte concentration from 10 to 180 mg/dL with triplicate testing (r2 = 0.995) as shown in Figure 3b. In addition, the reproducibility of the manufacturing process of the N-EFC was evaluated based on the relative standard deviation (R.S.D) by using three different N-EFCs, where each N-EFC was used to perform five respective measurements operated at a 180 mg/dL glucose solution. The results showed a good reproducibility with a low R.S.D. = 2.3 % indicating the N-EFC can provide stable and accurate glucose measurements with satisfactory precision.

3.2. Bioelectricity Generated from a Living Fish with the N-EFC

To verify the generated bioelectricity from a living fish with the N-EFC operated underwater, we performed three testing conditions where the polarization curves and current and power densities of the N-EFC were measured with an electrochemical analyzer, respectively. (1) We withdrew blood from the fish and directly measured the power of the N-EFC generated from fish blood in air environment (25 °C), denoted as fish blood. (2) After anesthetizing the fish, we then inserted the N-EFC into the fish around the caudal area and measured the power generation from the fish in an air environment (25 °C), denoted as fish in air. (3) We inserted the N-EFC into the fish, subsequently revived the fish in a tank with the water temperature (Tw) at 25 °C, and measured the power generation from a free-swimming fish in water, denoted as fish in water. Figure 4a shows the polarization curves and current and power densities of the N-EFC operated in three testing conditions: Fish blood, fish in air, and fish in water, respectively. The three testing conditions consistently exhibited the open circuit voltage around 0.41 V and a maximum power density around 6.3 μW/cm2. In contrast with the power directly generated from fish blood, the fish with the N-EFC operated in air or water environment generated an approximate maximum power thus verifying that the N-EFC enabled generation of bioelectricity from biofuels in a live fish. Compared to the fish with the N-EFC operated in air, the fish with the N-EFC operated in water generated an approximate maximum power indicating that the N-EFC can successfully operate underwater without loss of electricity and water interference. Particularly, a free-swimming fish with the N-EFC operated underwater generated the maximum power density (6.3 μ/cm2) at a higher current density of 25 μA/cm2. Figure 4b shows an image of a free-swimming fish inserted with the N-EFC connected to an electrochemical analyzer in a fish tank at Tw = 25 °C.
In addition, we also treated the free-swimming fish with cold shock by gradually decreasing the water temperature (Tw) of the fish tank from 25 °C to 15 °C within 30 min and kept the water temperature at 15 °C. Figure 5 depicts the polarization curves, and current and power densities of the N-EFC inserted in the free-swimming fish and operated underwater at Tw = 15 °C and 25 °C. The maximum power density increased from 6.3 to 8.6 μW/cm2 and the maximum current density increased from 41 to 52 μA/cm2 for a live fish swimming at Tw = 15 °C. According to the calibration curve in Figure 3b, maximum power densities of 6.3 and 8.6 μW/cm2 correspond to the glucose concentration of 44 and 98 mg/dL, respectively. The increase in power generation was attributed to the increase in glucose concentration. As the fish encountered environmental stress, i.e., cold shock, a stress hormone, such as cortisol, was induced; this hormone increases blood pressure and blood glucose to overcome the stress of environmental change [21].

3.3. Characterization of Self-Powered Glucose Biosensor

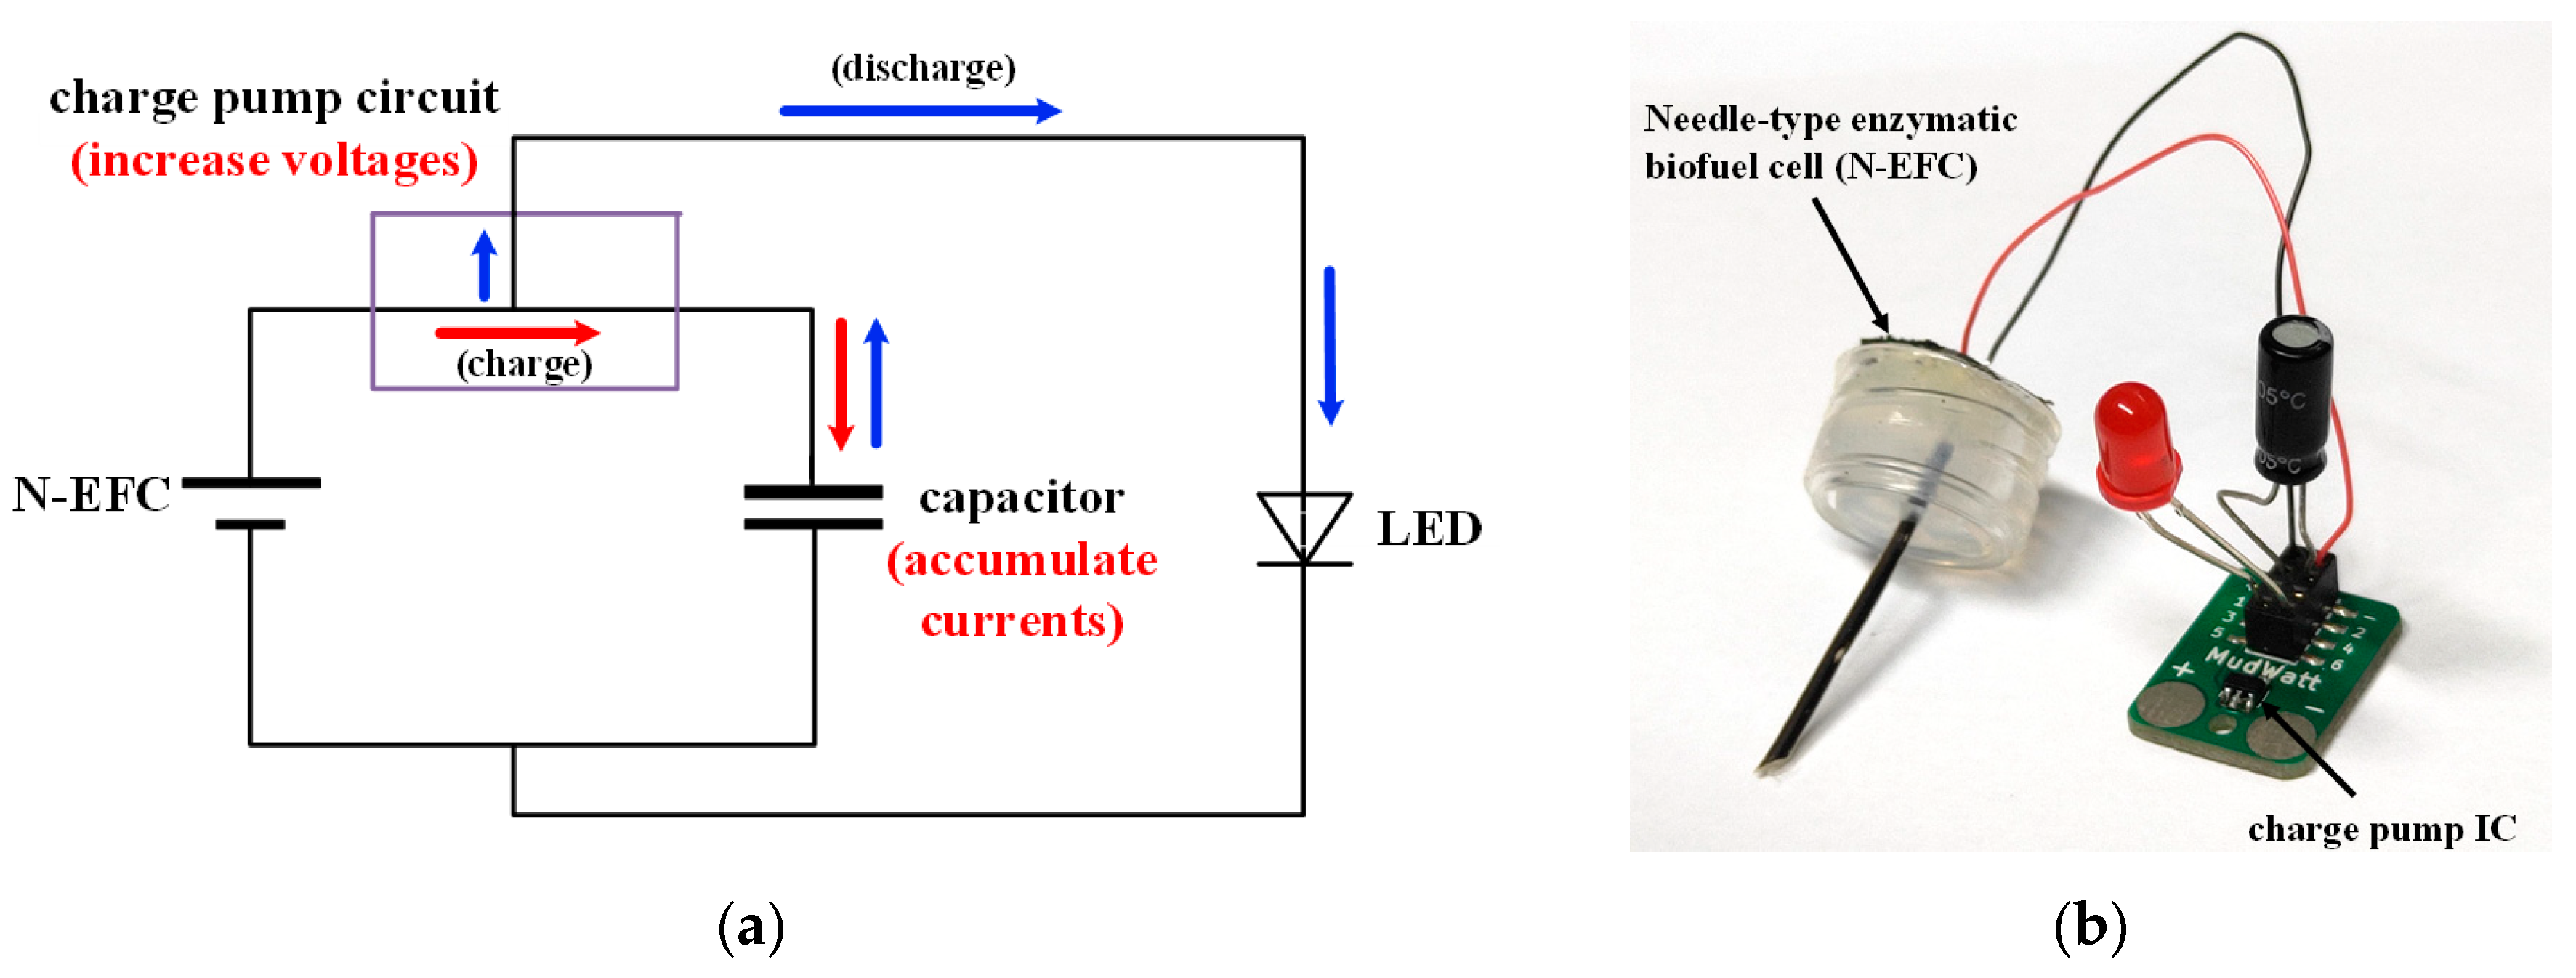
Rather than use an electrochemical analyzer to analyze the glucose concentration of a free-swimming fish, we designed the SPGB to provide a simple, power-free and useful stress visualization to easily evaluate fish health by monitoring LED blinking with a smartphone. Figure 6a depicts the schematic and operation principle of the SPGB. The N-EFC was connected with a charge pump circuit (blinking board, Magical microbes, TX, USA) consisting of an ultra-low voltage operation charge pump IC (S-8823A24-M5T1U, Ablic Inc., Chiba, Japan), 10 μF capacitor and red LED as the indicator. The charge pump IC, which requires an input voltage of at least 0.25 V (26 μW), was used to boost the input low voltages from the N-EFC to 2.4 V and the external capacitor was used to store the electrical charge. If the capacitor reaches the discharge voltage of 2.4 V, the charge pump IC discharges the capacitor to light up the LED until the potential is reduced to 1.8 V and the input power recharges the capacitor again. The repeat of the charge and discharge process leads to the LED blinking. Figure 6b shows the image of the SPGB consisting of the N-EFC connected with a charge pump circuit, 10 μF capacitor and a red LED as the indicator.
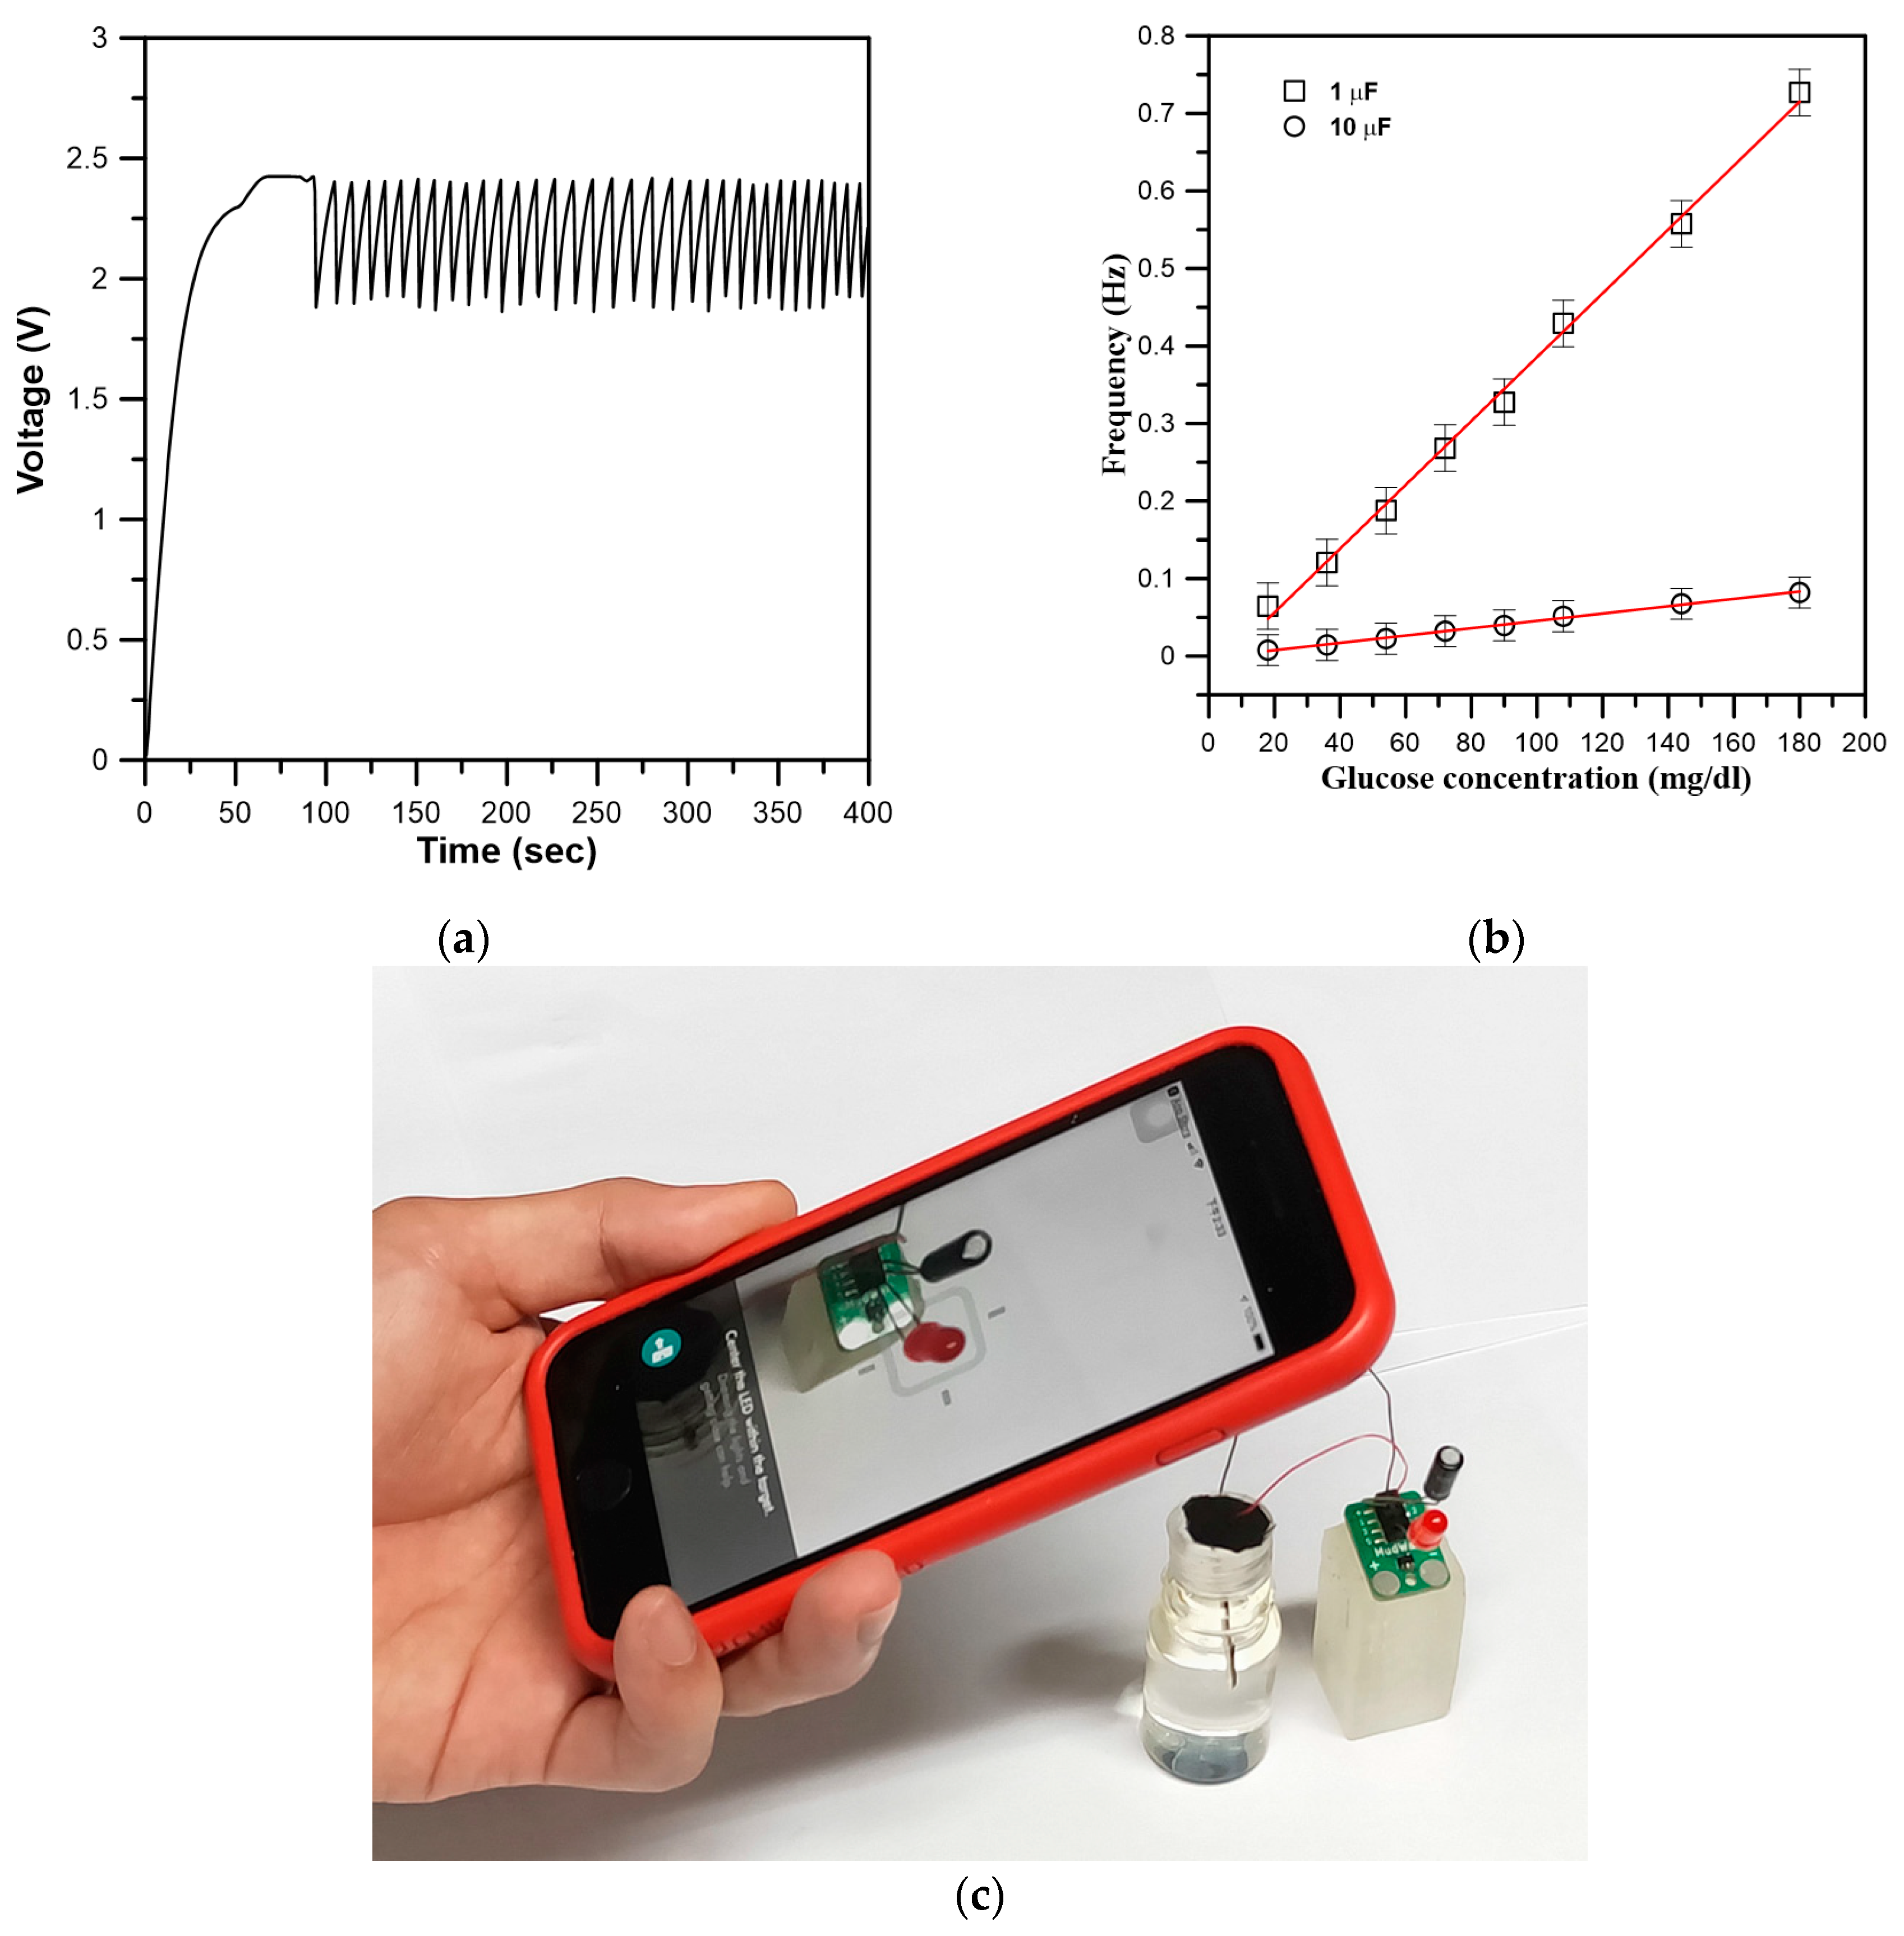
The bioelectricity (power) generated from the N-EFC is directly proportional to the biocatalytic reaction of glucose at the bioanode and used to charge the capacitor with the charge pump IC. Hence, by monitoring the frequencies of the charge/discharge cycle of the capacitor or LED blinking frequency, the glucose concentration can be determined. Figure 7a shows the voltage variation of the charging and discharging cycles of the N-EFC operated with the charge pump IC and 1 μF capacitor in the presence of 70 mg/dL glucose concentration. The charge/discharge cycle was observed to be 0.25 Hz frequency. Video S2 in the Supplementary Materials shows the voltage variation of the charging and discharging cycles measured by using a multimeter and the red LED blinking at 0.25 Hz for the N-EFC operated at 70 mg/dL glucose concentration.
Instead of using a multimeter to measure the frequencies of the charge/discharge cycle of the capacitor, we used a smartphone with the MudWatt Explorer App (available on iTunes and Google Play at no charge) to determine the glucose concentration by measuring the LED blinking frequencies of the SPGB (Figure 7c). As the LED was blinking, we opened the MudWatt Explorer App and aimed it at the target blinking LED using the detecting window. The App will automatically measure the blinking frequencies and calculate the generated power of the N-EFC from the blinking frequencies. Figure 7b shows the triplicate testing of the LED blinking frequencies to various glucose concentrations ranging from 10–180 mg/dL for the charge pump IC connected with at 1 μF and 10 μF, respectively. The average frequency increased linearly with increasing glucose concentration for 1 μF and 10 μF. The prepared SPGB was examined to possess a fast response time of 2 s by successive additions of 20 mg/dL in glucose concentration. In addition, the frequencies of the LED blinking increased with decreasing capacity of capacitors for the N-EFC operated in the same glucose concentration, which is consistent with results of the previous literature [22,23]. The App fails to measure the LED blinking frequencies over 3 Hz due to the speed limitation of images captured on a smartphone.
The SPGB can continuously operate for 2 days with stable LED blinking frequencies by providing sufficient biofuel of 180 mg/dL glucose with about 6% drop of the maximum power density (Figure S1). The detection limit of the SPGB is about 10 mg/dL. The detection limit of the SPGB mainly depends on the minimum input voltage of the charge pump IC to drive its oscillation circuit, which is the 250 mV in this study. The detection limit should be further improved by using a lower voltage-operation charge pump IC. Moreover, the optimization of the N-EFC, such as the amount and activity of enzyme used, reaction area of the needle-type anode, and efficiency of electron transfer rate between the enzyme and electrode, will enable improvement of the detection limit in the future.

3.4. Monitoring of Physiological Status of a Free-Swimming Fish Treated with Cold Shock by SPGB

Temperature is one of the most important environment stresses that influences the normal physiological response of a living fish. Under acute thermal stress of cold shock, fish will rely on their neural and endocrine systems to acclimate environment change. Under such stressful temperature conditions, blood glucose is one of the most common physiological parameters used as a sensitive and reliable indicator for physiological stress responses. Fish health conditions can be evaluated by monitoring blood glucose levels, which are closely correlated with stress levels.
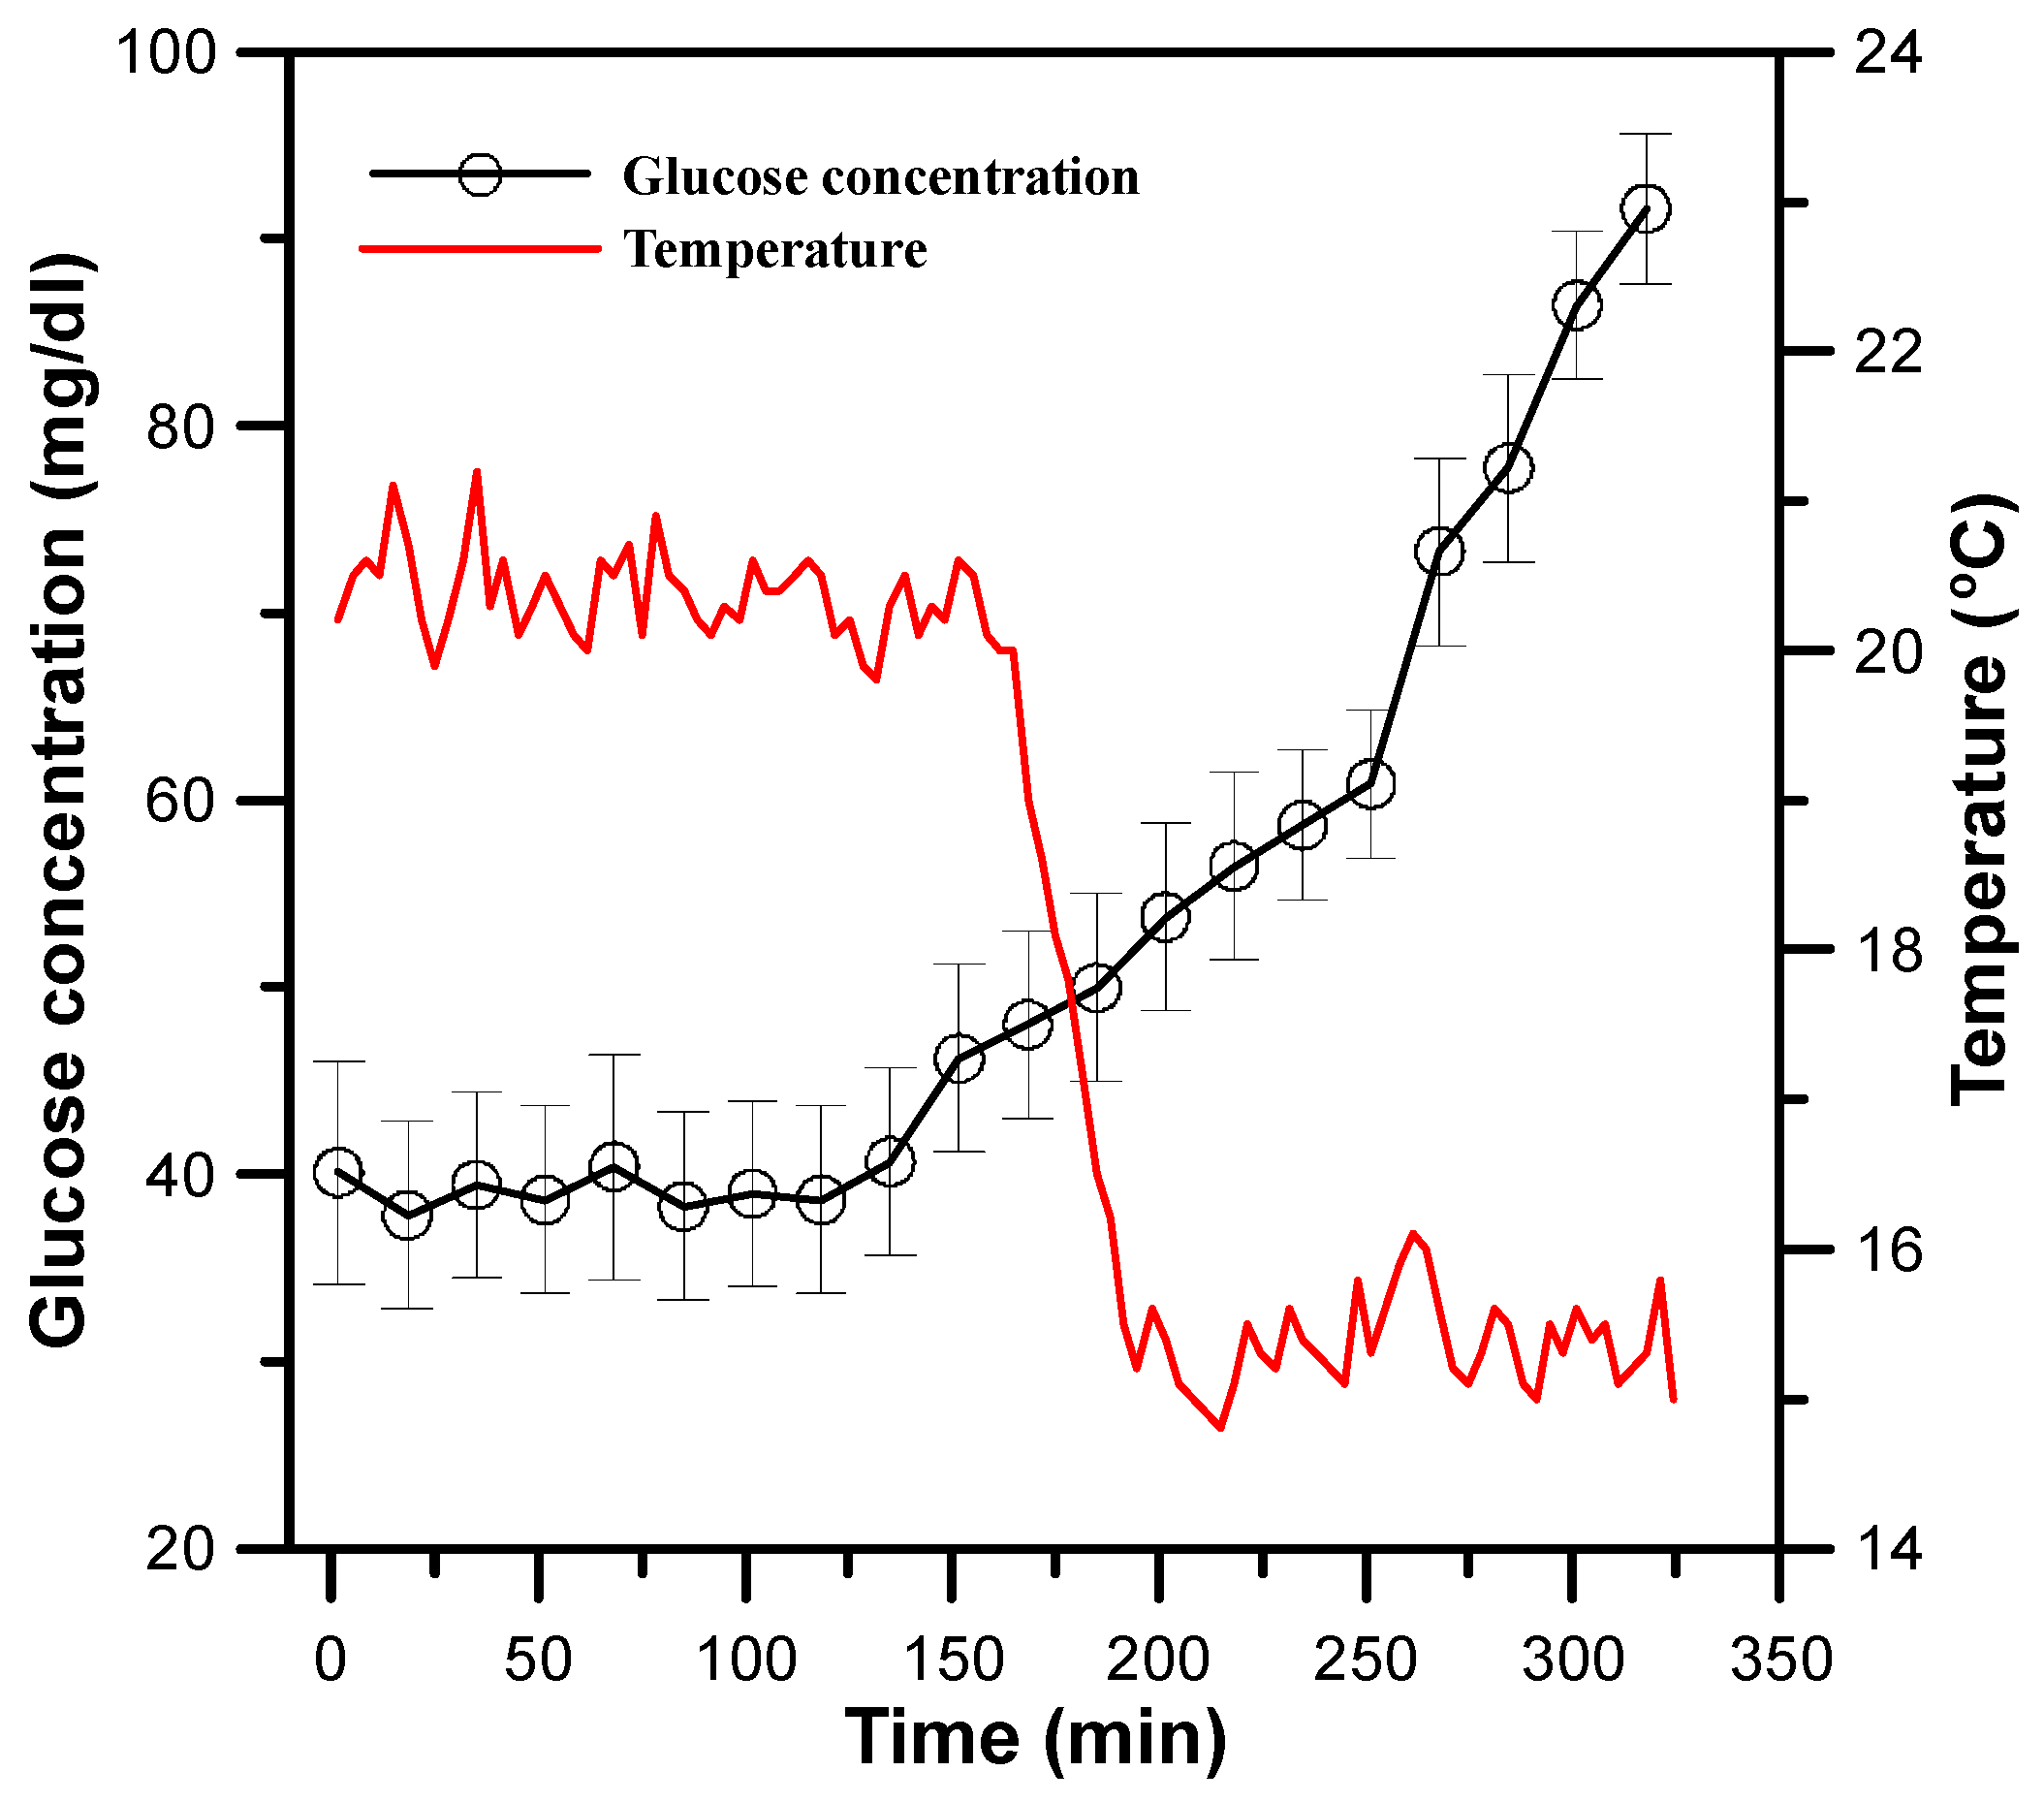
Figure 8 shows the variation of the glucose concentration of a free-swimming fish (Tilapia) treated with a cold shock treatment, determined by measuring the blinking frequencies of the SPGB in real time using a smartphone. The experimental fish was anesthetized, the N-EFC was inserted around the caudal area, and then transferred to a 25 L fish tank. The fish revived and became active within 30 min. The glucose levels were then determined by measuring the blinking frequencies of the SPGB at an interval of 17 min using a smartphone (Figure 1b). Initially, the glucose levels were stable about 42 mg/dL at Tw = 22 °C for 100 min. By gradually decreasing Tw from 22 °C to 15 °C within 20 min and keeping at Tw = 15 °C, the glucose levels correspondingly increased from 42 to 92 mg/dL for 150 min after starting the cold shock treatment. The increase in the glucose concentration attributed to induced stress hormones in fish, such as cortisol, to increase blood pressure and blood sugar to cope with the environmental change [21,24]. The fish implanted with the N-EFC can survive for at least 2 days during measurements due to its remarkable self-healing ability.
In this preliminary experiment, the glucose levels in free-swimming fish treated with cold shock can be continuously measured for 8 h in the fish tank with stable LED blinking frequencies. However, the measurement of glucose levels with the SPGB discontinued, i.e., the LED stopped blinking, and the maximum power density dropped by 40 % after 36 h of continuous operation. We attributed this to the blood coagulation on the bioanode surfaces of the N-EFC. The blood coagulation interferes the transport of glucose to the bioanode thus to decrease power generation. To prevent the formation of blood coagulation on the electrode surface, a coating with 2-methacryloyloxyethyl phosphorylcholine (MPC)-polymer has been proven to be effective for resisting blood coagulation even after immersion in blood for 24 h [14]. The surface modification of the N-EFC with the MPC coating at the bioanodes to serve as a bioinert layer is currently an ongoing procedure in order to operate the SPGB to monitor the physiological status of free-swimming fish for long-term operation.
In addition, according to the previous literature [9], the power density of the EFCs increased with the operated temperature until the temperature was raised to 45 °C to degrade enzymatic activities. At temperature above 45 °C, the power density decreased with the temperature. To verify the temperature dependence of the N-EFC, the maximum power density was examined for the N-EFC operated with a standard glucose concentrations of 180 mg/dL (0.1 M phosphate buffer, pH 7.0) at Tw = 15 °C and 25 °C, respectively. The results show that the maximum power density increased from 10.6 μW/cm2 at Tw = 15 °C to 12.1 μW/cm2 at Tw = 25 °C, which was a 14 % increase due to the temperature dependence. To generate the same maximum power density, the N-EFC operated at Tw = 15 °C needed a higher glucose concentration than it is operated at Tw = 25 °C. Therefore, the blood glucose levels of a free-swimming fish treated with heat shock actually had a higher glucose concentration than it shown in Figure 5 and Figure 8. The integration of the SPGB with a temperature sensor is needed to compensate for the temperature dependence, while it could increase the device complexity. Although we cannot measure accurate blood glucose levels, the SPGB has successfully measured a significant increase of blood glucose for a free-swimming fish treated with heat shock.

4. Conclusions

For the first time, we developed an N-EFC entirely immersed in a watery environment to generate electric power directly from a free-swimming fish (Tilapia). This was done by inserting the N-EFC into a live fish to access biofuels. Moreover, the N-EFC was connected to a charge pump IC and LED functioning as the SPGB to monitor the glucose level of a free-swimming fish by measurement of blinking frequencies using a smartphone with an App. We have successfully demonstrated the SPGB to monitor glucose levels of a free-swimming fish treated with cold shock in real time. Our proposed SPGB provides a power-free and useful stress visualization to easily evaluate fish health by monitoring LED blinking with a smartphone. In the future, we are planning to develop a self-powered biosensor to simultaneously detect the lactate, cholesterol and glucose, which are three of the most important indicators for physiological stress responses.

Supplementary Materials

The following are available online at https://www.mdpi.com/1996-1073/12/10/1827/s1, Video S1 shows the implantation procedure of the N-EFC into the fish. Video S2 shows the voltage variation of the charging and discharging cycles measured by using a multimeter and a red LED blinking at 0.25 Hz for the N-EFC operated at a glucose level of 70 mg/dL. Figure S1 shows that the SPGB continuously operates for 48 h by providing sufficient biofuel of 180 mg/dL glucose with about 6% drop of the maximum power density.

Author Contributions

W.-H.C. and Y.-C.L. performed the design, microfabrication, experiments, and analyzed the data. S.-H.H. contributed to the original idea of this study, supervised the experiments and wrote the manuscript.

Funding

This work was partially supported by the Ministry of Science and Technology, Taiwan, through grant 107-2221-E-019-027.

Conflicts of Interest

The authors declare no conflict of interest.

References

  1. Sopinka, N.M.; Donaldson, M.R.; O’Connor, C.M.; Suski, C.D.; Cooke, S.J. Stress indicators in fish. In Fish Physiology; Academic Press: Cambridge, MA, USA, 2016; Volume 35, pp. 405–462. [Google Scholar]
  2. El-Khaldi, A.T. Effect of different stress factors on some physiological parameters of nile tilapia (oreochromis niloticus). Saudi J. Biol. Sci. 2010, 17, 241–246. [Google Scholar] [CrossRef]
  3. Takase, M.; Yoneyama, Y.; Murata, M.; Hibi, K.; Ren, H.; Endo, H. Carbon nanotube enhanced mediator-type biosensor for real-time monitoring of glucose concentrations in fish. Anal. Bioanal. Chem. 2012, 403, 1187–1190. [Google Scholar] [CrossRef]
  4. Takase, M.; Yoneyama, Y.; Murata, M.; Hibi, K.; Ren, H.; Endo, H. Mediator-type biosensor for real-time wireless monitoring of blood glucose concentrations in fish. Fish. Sci. 2012, 78, 691–698. [Google Scholar] [CrossRef]
  5. Yoneyama, Y.; Yonemori, Y.; Murata, M.; Ohnuki, H.; Hibi, K.; Hayashi, T.; Ren, H.; Endo, H. Wireless biosensor system for real-time cholesterol monitoring in fish “nile tilapia”. Talanta 2009, 80, 909–915. [Google Scholar] [CrossRef]
  6. Hibi, K.; Hatanaka, K.; Takase, M.; Ren, H.; Endo, H. Wireless biosensor system for real-time l-lactic acid monitoring in fish. Sensors 2012, 12, 6269–6281. [Google Scholar] [CrossRef] [PubMed]
  7. Endo, H.; Yonemori, Y.; Hibi, K.; Ren, H.; Hayashi, T.; Tsugawa, W.; Sode, K. Wireless enzyme sensor system for real-time monitoring of blood glucose levels in fish. Biosens. Bioelectron. 2009, 24, 1417–1423. [Google Scholar] [CrossRef] [PubMed]
  8. Endo, H.; Takahashi, E.; Murata, M.; Ohnuki, H.; Ren, H.; Tsugawa, W.; Sode, K. Wireless monitoring of blood glucose levels in flatfish with a needle biosensor. Fish. Sci. 2010, 76, 687–694. [Google Scholar] [CrossRef]
  9. Gonzalez-Solino, C.; Lorenzo, M.D. Enzymatic fuel cells: Towards self-powered implantable and wearable diagnostics. Biosensors 2018, 8, 11. [Google Scholar] [CrossRef] [PubMed]
  10. Cosnier, S.; Le Goff, A.; Holzinger, M. Towards glucose biofuel cells implanted in human body for powering artificial organs: Review. Electrochem. Commun. 2014, 38, 19–23. [Google Scholar] [CrossRef]
  11. Castorena-Gonzalez, J.A.; Foote, C.; MacVittie, K.; Halámek, J.; Halámková, L.; Martinez-Lemus, L.A.; Katz, E. Biofuel cell operating in vivo in rat. Electroanalysis 2013, 25, 1579–1584. [Google Scholar] [CrossRef]
  12. Cheng, H.; Yu, P.; Lu, X.; Lin, Y.; Ohsaka, T.; Mao, L. Biofuel cell-based self-powered biogenerators for online continuous monitoring of neurochemicals in rat brain. Analyst 2013, 138, 179–185. [Google Scholar] [CrossRef] [PubMed]
  13. Zebda, A.; Cosnier, S.; Alcaraz, J.P.; Holzinger, M.; Le Goff, A.; Gondran, C.; Boucher, F.; Giroud, F.; Gorgy, K.; Lamraoui, H.; et al. Single glucose biofuel cells implanted in rats power electronic devices. Sci. Rep. 2013, 3, 1516. [Google Scholar] [CrossRef] [PubMed]
  14. Miyake, T.; Haneda, K.; Nagai, N.; Yatagawa, Y.; Onami, H.; Yoshino, S.; Abe, T.; Nishizawa, M. Enzymatic biofuel cells designed for direct power generation from biofluids in living organisms. Energy Environ. Sci. 2011, 4, 5008. [Google Scholar] [CrossRef]
  15. Shoji, K.; Akiyama, Y.; Suzuki, M.; Nakamura, N.; Ohno, H.; Morishima, K. Biofuel cell backpacked insect and its application to wireless sensing. Biosens. Bioelectron. 2016, 78, 390–395. [Google Scholar] [CrossRef]
  16. Szczupak, A.; Halámek, J.; Halámková, L.; Bocharova, V.; Alfonta, L.; Katz, E. Living battery – biofuel cells operating in vivo in clams. Energy Environ. Sci. 2012, 5, 8891. [Google Scholar] [CrossRef]
  17. Halamkova, L.; Halamek, J.; Bocharova, V.; Szczupak, A.; Alfonta, L.; Katz, E. Implanted biofuel cell operating in a living snail. J. Am. Chem. Soc. 2012, 134, 5040–5043. [Google Scholar] [CrossRef]
  18. MacVittie, K.; Halamek, J.; Halamkova, L.; Southcott, M.; Jemison, W.D.; Lobeld, R.; Katz, E. From “cyborg” lobsters to a pacemaker powered by implantable biofuel cells. Energy Environ. Sci. 2013, 6, 81–86. [Google Scholar] [CrossRef]
  19. Schwefel, J.; Ritzmann, R.E.; Lee, I.N.; Pollack, A.; Weeman, W.; Garverick, S.; Willis, M.; Rasmussen, M.; Scherson, D. Wireless communication by an autonomous self-powered cyborg insect. J. Electrochem. Soc. 2014, 161, H3113–H3116. [Google Scholar] [CrossRef]
  20. Murata, K.; Kajiya, K.; Nakamura, N.; Ohno, H. Direct electrochemistry of bilirubin oxidase on three-dimensional gold nanoparticle electrodes and its application in a biofuel cell. Energy Environ. Sci. 2009, 2, 1280. [Google Scholar] [CrossRef]
  21. Panase, P.; Saenphet, S.; Saenphet, K. Biochemical and physiological responses of nile tilapia oreochromis niloticus lin subjected to cold shock of water temperature. Aquacult. Rep. 2018, 11, 17–23. [Google Scholar] [CrossRef]
  22. Hanashi, T.; Yamazaki, T.; Tsugawa, W.; Ferri, S.; Nakayama, D.; Tomiyama, M.; Ikebukuro, K.; Sode, K. Biocapacitor—A novel category of biosensor. Biosens. Bioelectron. 2009, 24, 1837–1842. [Google Scholar] [CrossRef] [PubMed]
  23. Slaughter, G.; Kulkarni, T. A self-powered glucose biosensing system. Biosens. Bioelectron. 2016, 78, 45–50. [Google Scholar] [CrossRef] [PubMed] [Green Version]
  24. Kuo, C.M.; Hsieh, S.L. Comparisons of physiological and biochemical responses between milkfish (chanos chanos) and grass carp (ctenopharyngodon idella) to cold shock. Aquaculture 2006, 251, 525–536. [Google Scholar] [CrossRef]
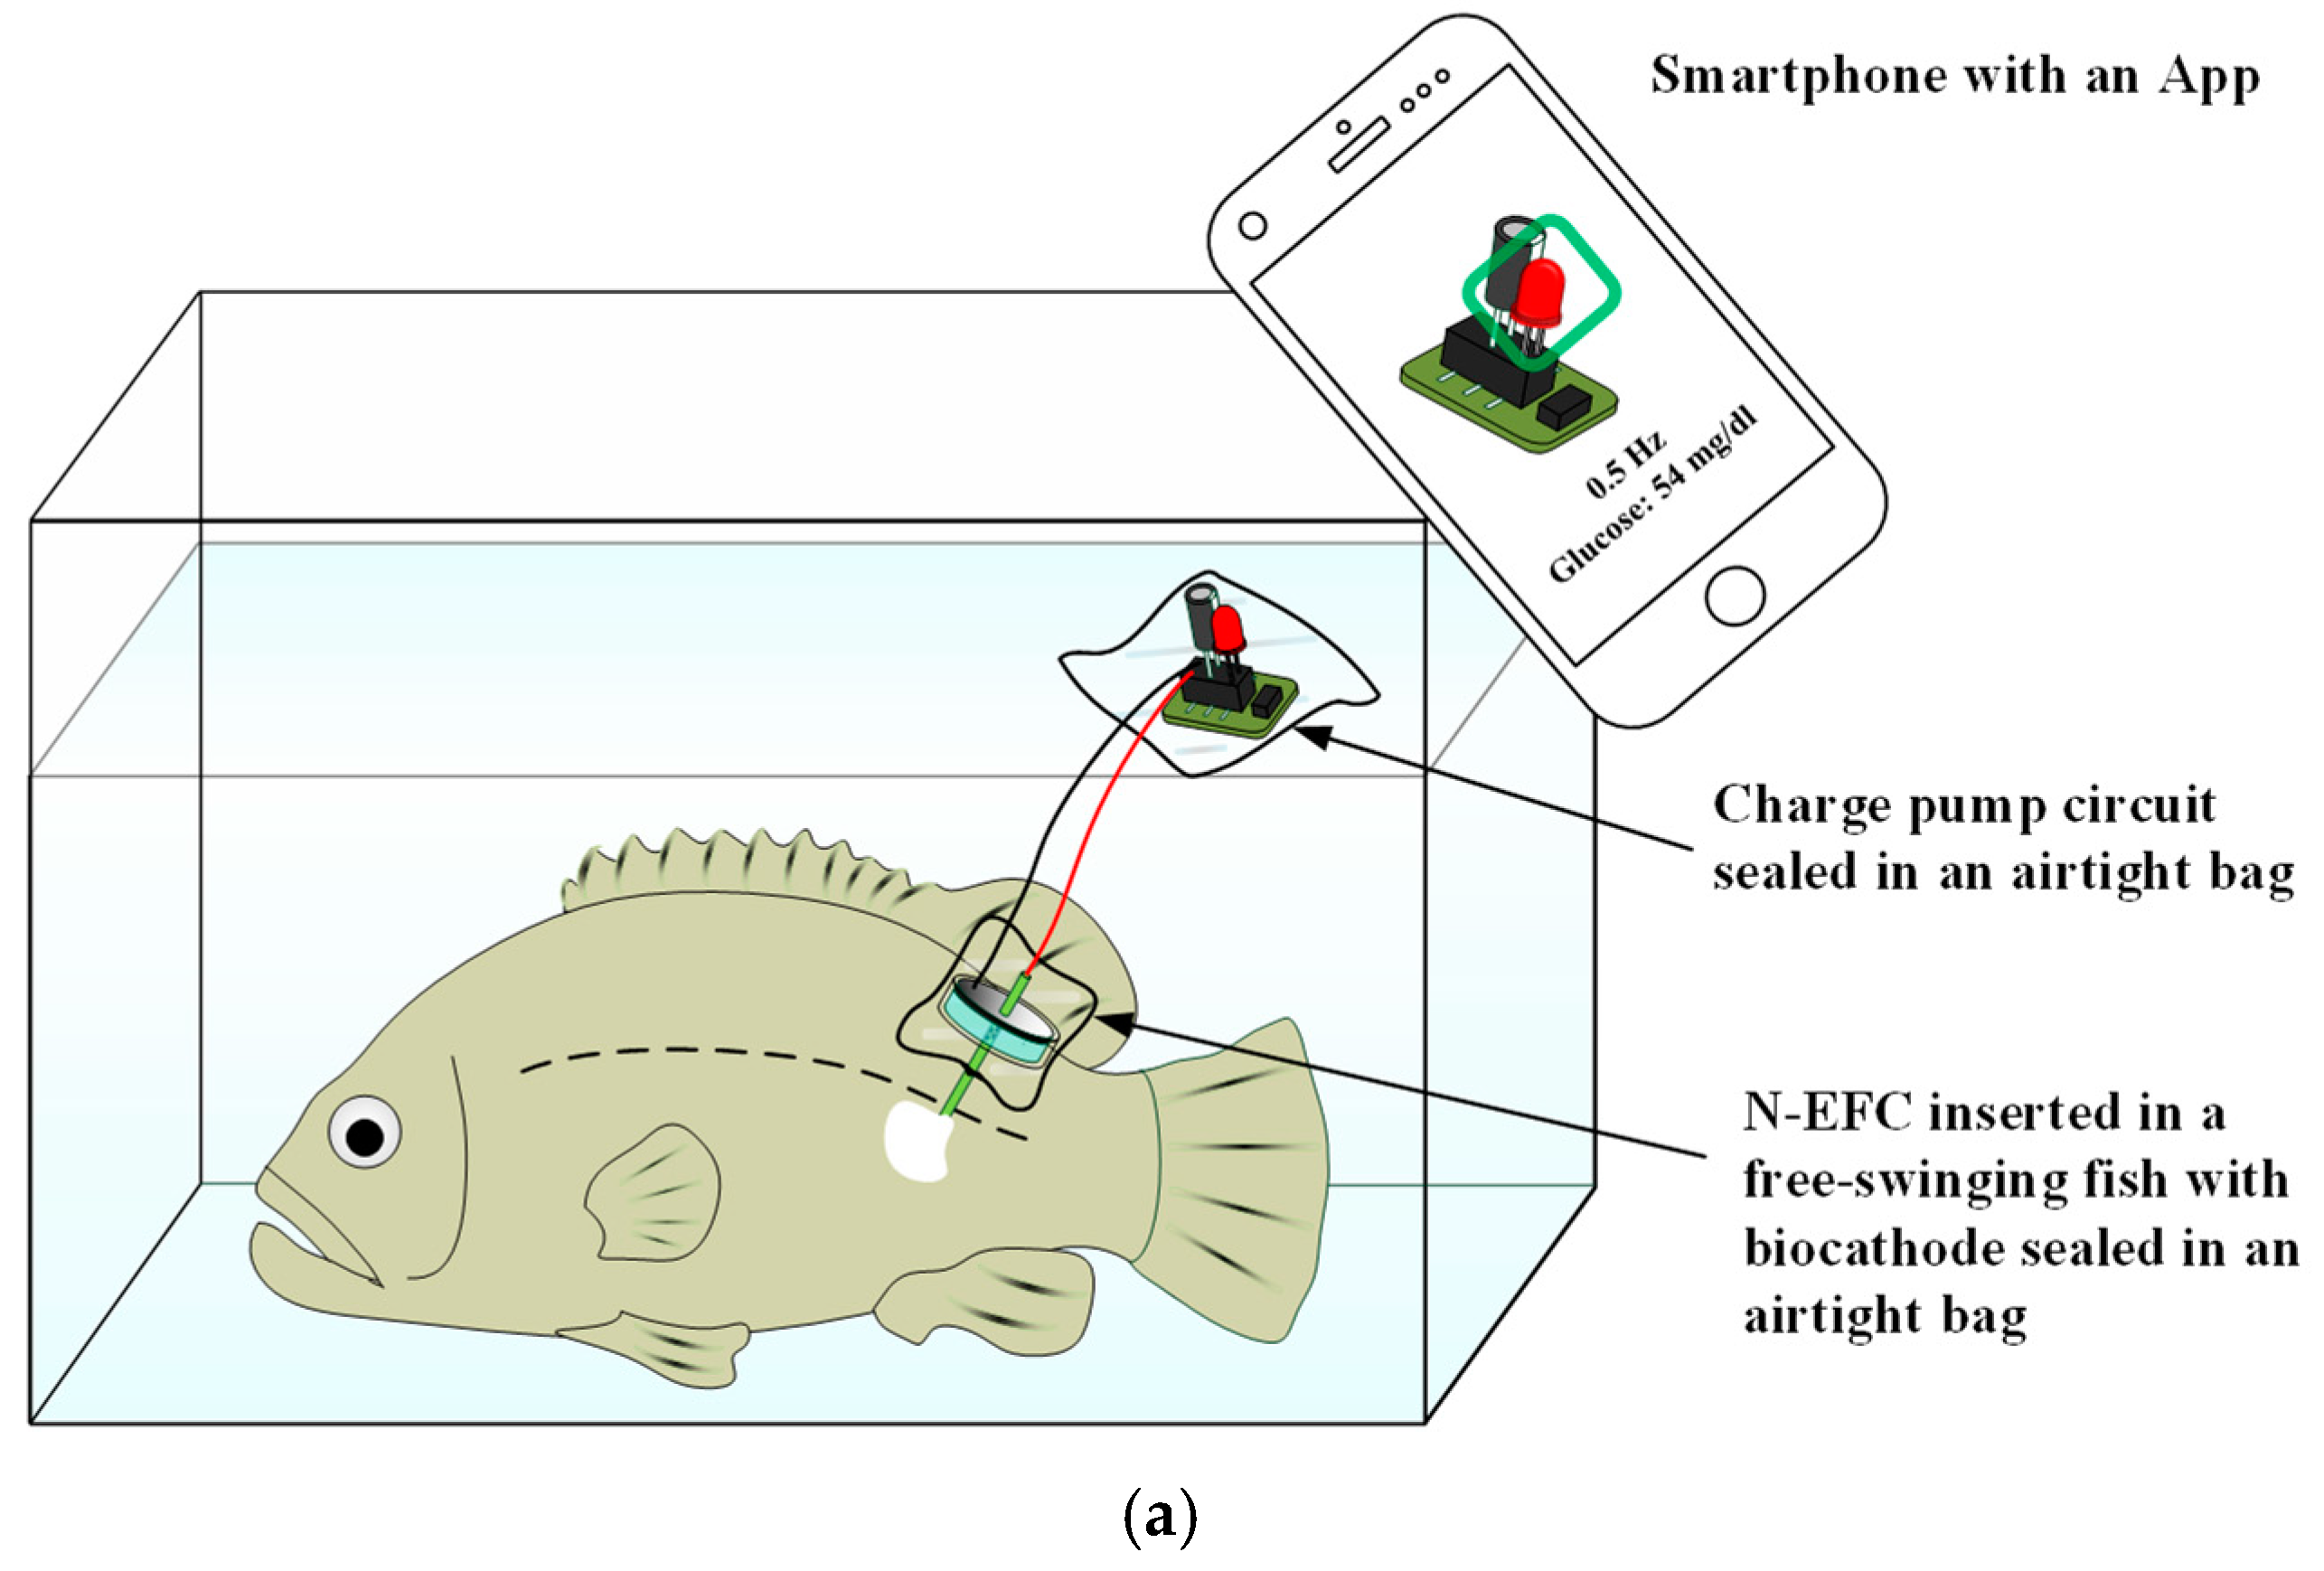
Figure 1. (a) Schematic and (b) photograph of the self-powered glucose biosensor (SPGB) used to monitor the physiological status of a free-swimming fish in a tank (Tilapia) in real time using a smartphone. The SPGB consisted of a needle-type enzymatic biofuel cell (N-EFC), which was operated underwater and connected with a charge pump IC and an LED as the indicator. The N-EFC was inserted into a living fish (Tilapia) around the caudal area to access biofuels along with a gas-diffusion biocathode sealed in an airtight bag. By using a smartphone with an application (App), the glucose concentration can be determined by measuring the LED blinking frequencies of the SPGB.
Energies 12 01827 g001aEnergies 12 01827 g001b
Figure 2. (a) Schematic structure of the N-EFC and schemes of glucose oxidation at the anode along with O2 reduction at the enzymatic gas-diffusion cathode. (b,c) Images of the N-EFC and the N-EFC inserted into a living fish (Tilapia) around the caudal area to access biofuels and a gas-diffusion biocathode sealed in an airtight bag filled with air, respectively.
Energies 12 01827 g002
Figure 3. (a) Polarization curves, and current and power densities of the N-EFC at various standard glucose concentrations from 10 to 180 mg/dL in 0.1 M phosphate buffer, pH 7.0. (b) The relationship between the maximum power density of the N-EFC and the glucose analyte concentration taken from an averaged triplicate experiment (R2 = 0.995).
Energies 12 01827 g003
Figure 4. (a) Polarization curves, and current and power densities of the N-EFC operated in three testing conditions: Fish blood, fish in air, and fish in water, respectively. (b) An image of a free-swimming fish inserted with the N-EFC connected to an electrochemical analyzer in a fish tank at Tw = 25 °C. (Fish blood, fish in air, and fish in water denoted as the power of the N-EFC generated from the blood withdrawn from fish, the fish with the N-EFC operated in air, and the fish with the N-EFC operated in water, respectively.).
Energies 12 01827 g004
Figure 5. Polarization curves, and current and power densities of the N-EFC inserted in the free-swimming fish and operated underwater at Tw = 15 °C and 25 °C.
Energies 12 01827 g005
Figure 6. (a) Schematic and operation principle of the SPGB and (b) an image of the self-powered glucose biosensor (SPGB). The N-EFC was connected with a charge pump circuit consisting of an ultra-low voltage operation charge pump IC, 10 μF capacitor and red LED as the indicator.
Energies 12 01827 g006
Figure 7. (a) Voltage variation of the charging and discharging cycles of the N-EFC operated with a charge pump IC and 1 μF capacitor in the presence of 70 mg/dL glucose concentration. The charge/discharge cycle was observed at 0.25 Hz frequency. (b) The variation in the LED blinking frequencies with respect to various glucose concentrations ranging from 10–180 mg/dL for the charge pump IC connected to a 1 μF and 10 μF capacitor. (c) An image of a smartphone with an App to determine the glucose concentration by measuring the LED blinking frequencies.
Energies 12 01827 g007
Figure 8. Variation of the glucose concentration of a free-swimming fish (Tilapia) treated with cold shock determined by measuring the blinking frequencies of the SPGB in real time using a smartphone. All experiments were carried out in triplicate.
Energies 12 01827 g008