Article

The Acoustic Properties of Sandy and Clayey Hydrate-Bearing Sediments

1
State Key Laboratory of Heavy Oil Processing, China University of Petroleum, Beijing 102249, China
2
Department of Pharmacy, Cangzhou Medical College, Cangzhou 061001, China
*
Author to whom correspondence should be addressed.
Energies 2019, 12(10), 1825; https://doi.org/10.3390/en12101825
Submission received: 13 April 2019 / Revised: 3 May 2019 / Accepted: 8 May 2019 / Published: 14 May 2019
(This article belongs to the Section L: Energy Sources)

Abstract

:
Natural gas hydrates samples are rare and difficult to store and transport at in situ pressure and temperature conditions, resulting in difficulty to characterize natural hydrate-bearing sediments and to identify hydrate accumulation position and saturation at the field scale. A new apparatus was designed to study the acoustic properties of seafloor recovered cores with and without hydrate. To protect the natural frames of recovered cores and control hydrate distribution, the addition of water into cores was performed by injecting water vapor. The results show that hydrate saturation and types of host sediments are the two most important factors that govern the elastic properties of hydrate-bearing sediments. When gas hydrate saturation adds approximately to 5–25%, the corresponding P-wave velocity (Vp) increases from 1.94 to 3.93 km/s and S-wave velocity (Vs) increases from 1.14 to 2.23 km/s for sandy specimens; Vp and Vs for clayey samples are 1.72–2.13 km/s and 1.10–1.32 km/s, respectively. The acoustic properties of sandy sediments can be significantly changed by the formation/dissociation of gas hydrate, while these only minorly change for clayey specimens.

1. Introduction

The combustion of traditional fossil fuel has caused serious environmental issues, such as global warming, leading to the growing demand for low-carbon energy. Natural gas hydrates are solid crystals, which is a special form of natural gas that is widely accumulated in subsea and permafrost zones [1]. It has been estimated that the gross organic carbon in the form of natural gas hydrates exceeds the reserves of all known fossil fuels on the earth, including coal, oil, and conventional gases [2,3]. More importantly, the mole fraction of methane in natural gas hydrates is up to 99%, meaning that it can supply clean energy [4,5]. To exploit this unconventional energy, it is necessary to accurately predict the location of hydrate reservoirs and to estimate the hydrate saturation and the amount of gas trapped in hydrates, which requires the development of detection methods.
Compared with other pore-filling fluids, hydrate-containing sediments exhibit relatively high acoustic velocities, which can be used to identify natural gas hydrate deposits. Song et al. [6] performed a series of tri-axial compression tests to study the mechanical properties of sediments with and without hydrate, finding that the presence of methane hydrate can increase the shear strength of host sediments. Priest et al. [7] measured the seismic velocities of methane hydrate-bearing sediments that were formed by tetrahydrofuran (THF) solution and porous media. The addition of surfactants is used to promote hydrate nucleation to reduce the induction time. Their results showed that when hydrate saturation increases from 0 to 35.27%, the corresponding P-wave velocity increased from 1639 to 2833 m/s. Li et al. [8] reported Vp values from 1706 to 1782 m/s for THF aqueous solution-saturated sandy sediment, which then reached 3295–3984 m/s after completion of hydrate formation. Although Vp increases with hydrate saturation, Zhang et al. [9] could not establish a universal function to correlate Vp with hydrate saturation. A Gas Hydrate And Sediment Test Laboratory Instrument (GHASTLI), designed by the U.S. Geological Survey, was used to study the bulk properties of gas hydrate-bearing sediments. Through this facility, Winters et al. [10] measured the Vp of coarse-grained sediments with different pore space occupancy, such as free gas, ice, water, and gas hydrates. The results showed a Vp range from less than 1 km/s for gas-charged sediment to 1.77–1.94 km/s for water-saturated sediment and 2.91–4.00 km/s for sediment with varying degrees of hydrate saturation. Waite et al. [11] reported that methane hydrate can cement unconsolidated sediment when forming in an abundant gas environment, which would increase the acoustic velocity of hydrate-bearing sediments. Hu et al. [12] suggested that gas hydrate can be treated as a component within a matrix of consolidated sediments when hydrate saturation is above 30% in pore space, otherwise it’s just part of pore fluid or adheres to the surrounding rocks. For instance, they found that numerous small particles start to coalesce together when the hydrate saturation is above 14% for the sediments recovered from the South China Sea [13]. Konno et al. [14] also measured the P-wave velocity of natural sediment cores from the Eastern Nankai Trough. The result demonstrates that Vp varies from less than 1700 m/s in the hydrate-free section to greater than 2300 m/s in the section with hydrate. At present, the relationship between P-wave velocity and hydrate saturation has been widely investigated by using artificial samples.
Except for hydrate saturation and pore space occupants, the lithologic characteristics of host sediments, test conditions (burial depth) and hydrate distribution can also affect the acoustic velocity of hydrate-bearing sediments [15,16]. The reported gas hydrate drilling expeditions found natural gas hydrates are widely abundant in sandy sediments, such as reservoirs in the Nankai trough of offshore Japan [17,18], the Mallik permafrost site in the Northern Canada [19], and clayey sediments at several sites in the Gulf of Mexico [20], the Shenhu area in the South China Sea [21], the Northern Cascadia Margin [22], and the Krishna-Godavari basin in India [23]. However, research on the influence of lithologic characteristics of host sediments and hydrate distribution on the acoustic velocities of hydrate-bearing sediments is limited, which are important to understand the interaction between gas hydrates and host sediments.
Owing to the high cost of recovering natural gas hydrates specimens, laboratory-formed hydrate-bearing sediments are widely used to provide calibration data for seismic detection. For preparing man-made gas hydrate-bearing sediments, one of the challenges is accurately adding predetermined water into host sediments. At present, the most commonly used method is to slowly push gas into initially fully water-saturated sandy sediment until a predetermined amount of water is pushed out of the sample [10]. The second method is the partial water saturation method that porous media are mixed with a limited amount of water to form partially water-saturated sediment [24,25]. These methods don’t take hydrate distribution into consideration, yielding different velocities, even at the same hydrate saturation. The third method is the ice-seeding method that mixes sediments with small ice grains [26,27]. However, this method is not suitable for natural recovered cores, which may change the physical properties of cores, such as their porosity, permeability, and skeleton structure. To accommodate the need for better methods to obtain elastic properties, we propose a new water-adding method for the preparation of gas hydrate in natural recovered cores, and aim at studying the influence of lithologic characteristics of host sediments, test conditions, and pore space occupancy on the acoustic properties of hydrate-bearing sediments, which are necessary for geologic exploration and hydrate development.

2. Experiment Design

2.1. Apparatus

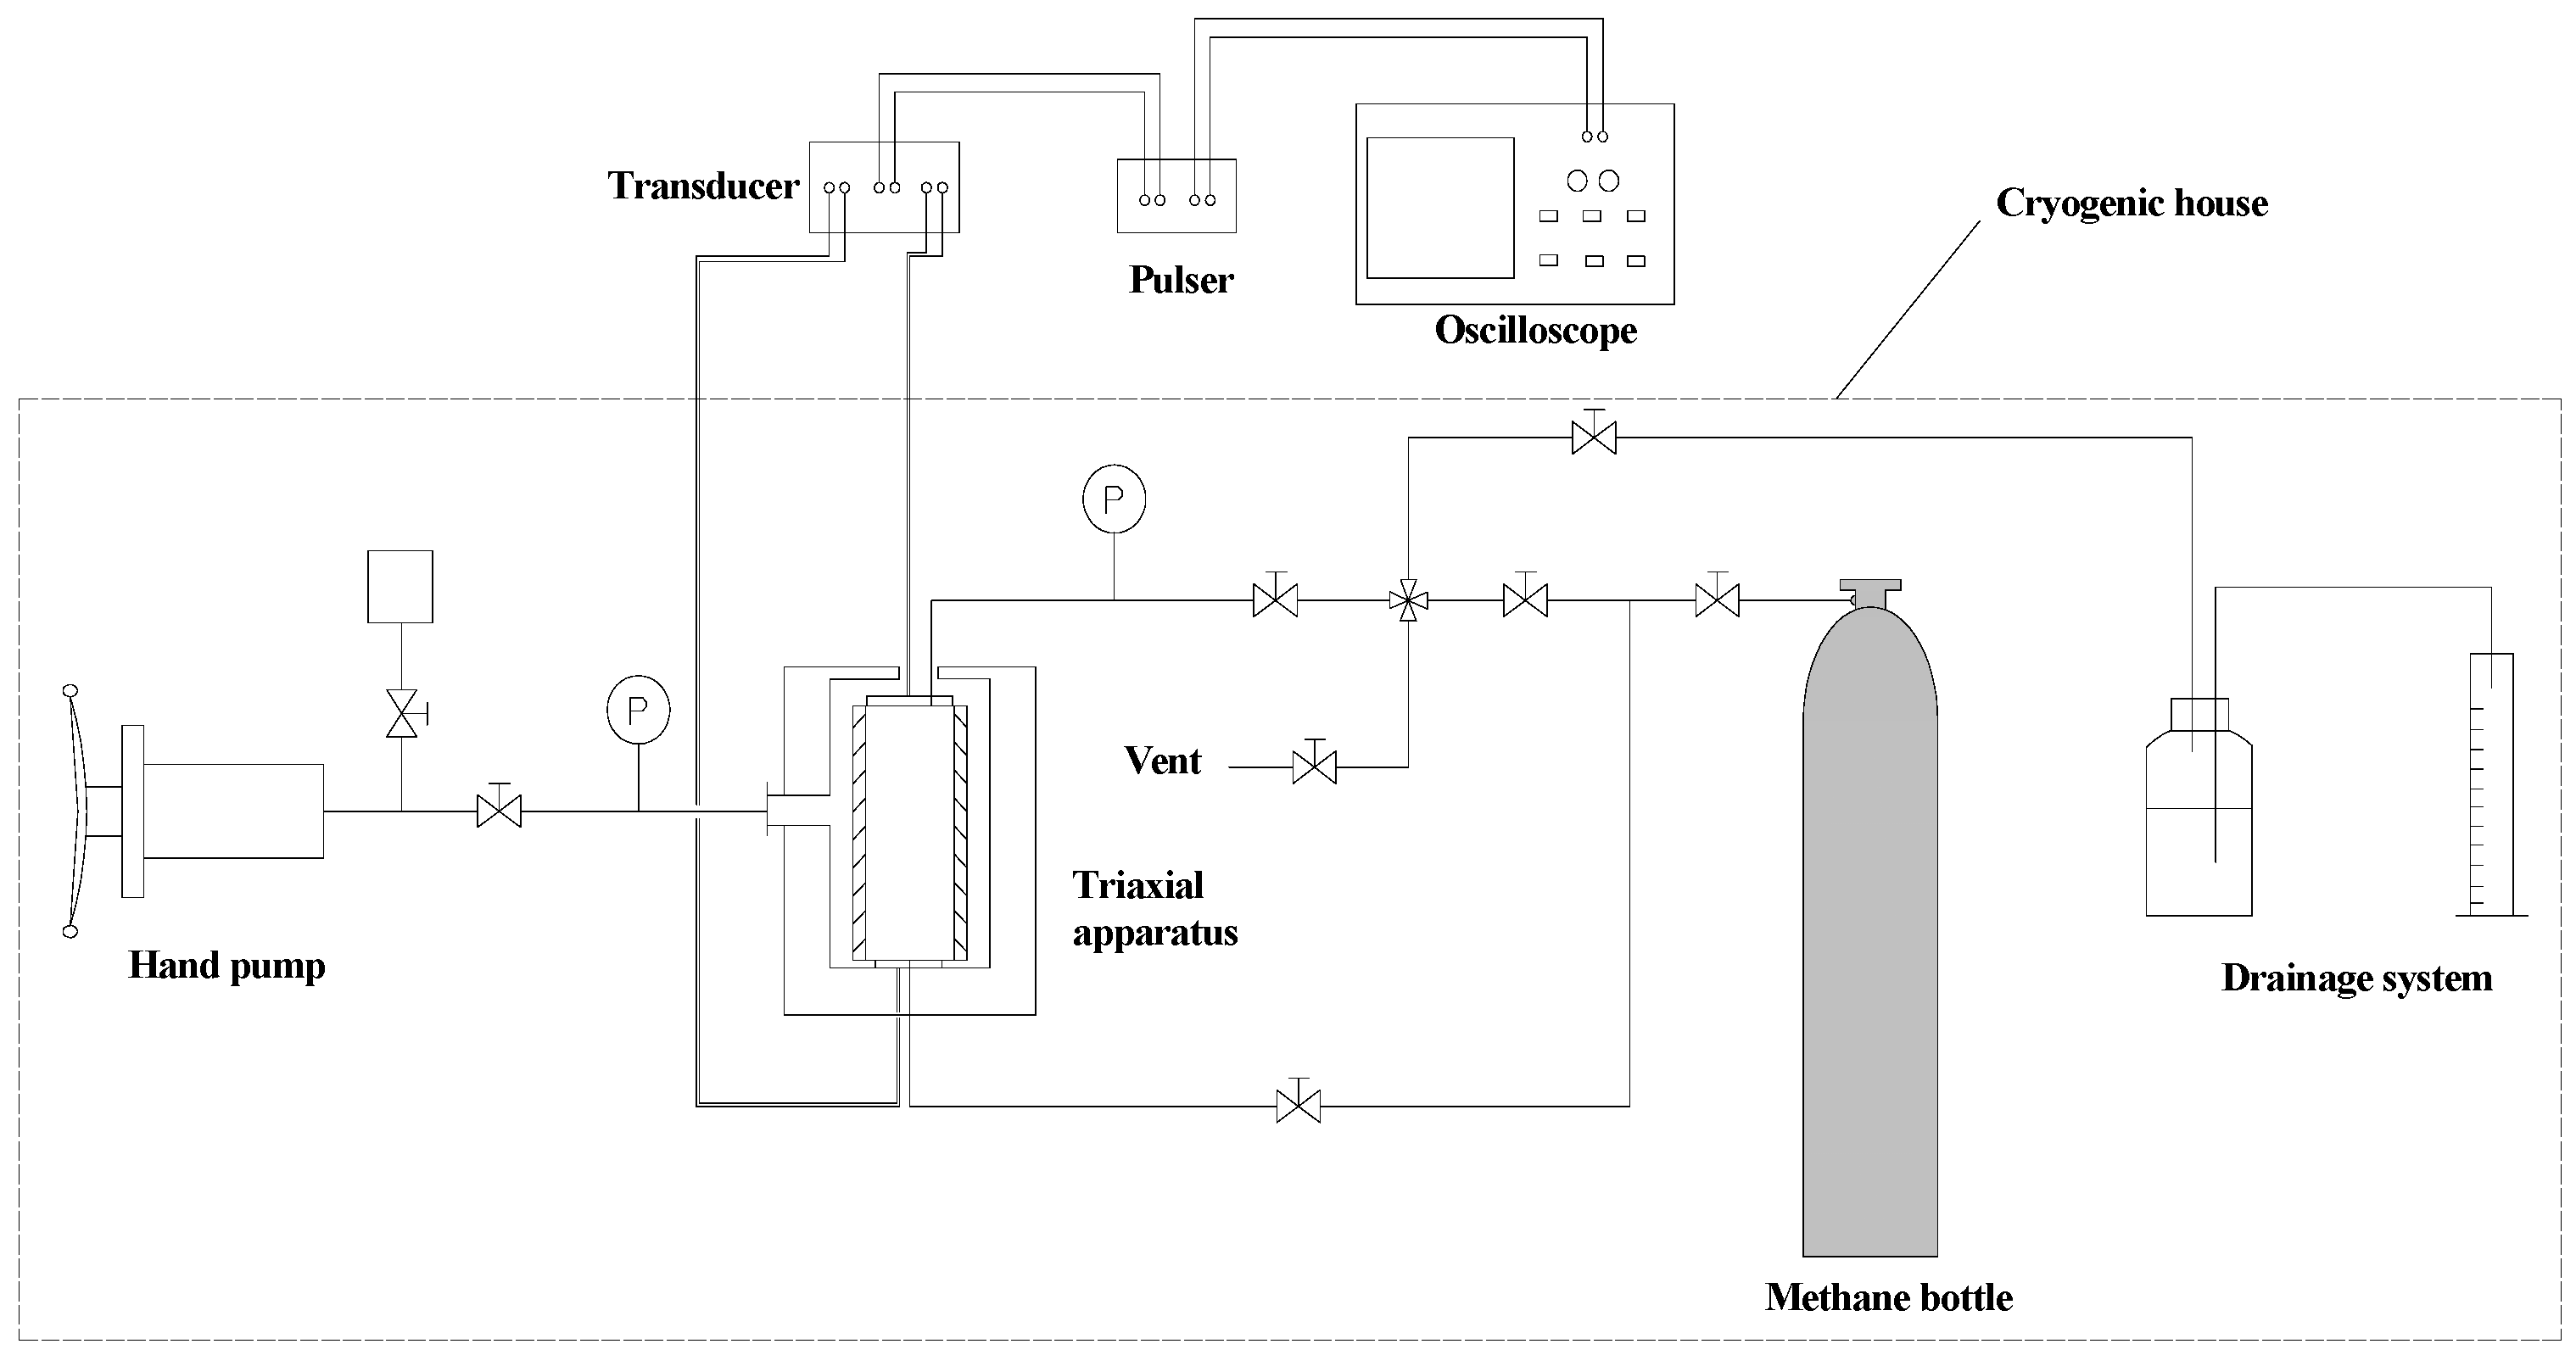
Two types of apparatus are used in this study. One is used to prepare hydrate samples, which includes a water-feeding device, a vacuum pump, a drying oven, a fridge, and a high-pressure reactor. The other is used to measure ultrasonic wave velocity, which includes a pulse sender/receiver machine (5077PR, made by Olympus NDT, Waltham, MA, USA.), a digital oscilloscope (TBS2012B, made by Tektronix Inc., Shanghai, China), two transducers, a core holder setup, a hand pump, and a cryogenic house. The water-feeding device contains a bracket to support core, under which is deionized water, as shown in Figure 1. The temperature range of the dry oven is 0–200 °C, which is used to dry the cores and supply heat for water vaporization. The high-pressure reactor where hydrates were formed is constructed from stainless steel, with an effective volume of 0.1 L (Φ40 × 80) and a maximum working pressure of 60 MPa. The experimental apparatus for measuring ultrasonic wave velocity is shown in Figure 2. The size of cryogenic house is 5 m × 2.5 m × 3 m, with working temperature of 248–323 K. The core holder setup was placed into the cryogenic house to maintain the system temperature, thus protecting methane hydrate from decomposing during acoustic test. The confining pressure was controlled by a hand pump manufactured by Jiangsu Haian petroleum research Ltd. (Haian, China). In addition, a Monitor and Control Generated System (MCGS) manufactured by Beijing Kunlun Coast Sensing Technology Co. Ltd. (Beijing, China) was used to monitor and record the temperature and pressure per minute.

2.2. Materials

Four natural cores recovered from seafloor were studied in this work, two clayey cores named C1 and C2, two sandy cores named S1 and S2. All of them were manufactured in cylindrical shape and protected by heat shrink tubing. The physical parameters of these cores are shown in Table 1. Methane gas with minimum purity of 99.9% was used to prepare hydrate, supplied by Beifen Gas Industry Corporation (Beijing, China). Distilled water was made in the lab.

2.3. Experimental Procedure

The whole experiment process consists of three parts, namely water addition, preparation of gas hydrate, and acoustic velocity measurement. In the first part, all the cores were dried in an oven for 24 h, and then transferred to the water-feeding vessel. After being vacuumed, the water-feeding vessel was placed into a dry oven and heated at 363.15 K, under which deionized water would vaporize and transfer into the pore space of cores. The water addition process took 3–6 h, depending on the porosity of core and predetermined water saturation. After the water vapor injection process, the cores were sent to a fridge where free water was converted into ice. In the second part, the core was placed into a high-pressure reactor in which water and methane gas combined to form hydrate. Owing to the induction time, the hydrate formation process would take at least 12 h. Subsequently, the hydrate-containing core was transferred from the high-pressure vessel to a core holder setup under the temperature of −6 °C. Owing to the self-preservation effect of gas hydrate, the dissociation rate of methane hydrate is lowest when the system temperature is around 268 K [28,29]. After that, the pore pressure was raised up to 8 MPa by injecting methane gas and the confining pressure was set at 11 MPa in the core holder setup. As gas hydrate has a memory effect [30,31], meaning that hydrate forms faster when combined with the water from decomposed hydrate, another three hours was wasted to compensate for the possible dissociated hydrate during the core transfer process. A rubber sleeve was used to separate the core from the confining liquid. In the third part, we changed the pore pressure, confining pressure, and simultaneously collected P-wave and S-wave signals to investigate the effect of effective confining pressure on acoustic velocity. In addition, the exact volume of dissociated CH4 gas from methane hydrate was measured by a drainage method.

3. Calculation Equations

The hydrate saturation was calculated based on following two equations.
S h = V h V pore = m h ρ h V pore
m h = m w + m CH 4 = ( 1 + 8 9 n ) m w
where Sh is the volume saturation of gas hydrate in pore space, mh is the mass of gas hydrate, g; ρh is the density of methane hydrate, 0.910 g/cm3; Vpore is the total pore volume of specimen; mw is the mass of distilled water, g; n is the hydrate number, which is equal to 6 in this work [32].
The P and S-wave velocities can be calculated by the length of core and travel time of acoustic wave.
V p , V s = L t t 0
where L is the length of specimen, m; t is the travel time of P and S-wave, as shown in Figure 3; t0 is the travel time when two detectors tightly touched together, the value is 5.704 × 10⁻⁶ s.
The Vp/Vs ratio is calculated by Equation (4):
T = V p / V s
Combined with Vp and Vs, the elastic modulus of specimen can be obtained by Equation (5).
E = ρ V s 2 ( 3 T 2 1 ) T 2 1
The effective confining pressure is the difference between confining pressure and pore pressure.
δ e f f = P C P P

4. Results and Discussion

4.1. Acoustic Signal

Elastic modulus, shear modulus, and Poisson’s ratio are the key parameters for developing the seismic inversion model, and can be figured out by Vp and Vs. Hence, it is important to acquire the Vp and Vs of hydrate-bearing sediments at the same time, rather than Vp only. On the basis of other seismic instruments [33], we built a new apparatus that not only collects P and S-wave signals, but also supplies confining pressure and pore pressure during the experiment process, allowing simulation of hydrate in situ accumulation conditions. One of the wave diagrams collected in the experiment is shown in Figure 3, from which the travel time can be achieved. Then, acoustic velocity and other parameters of hydrate-bearing sediments were calculated based on Equations (3)–(5), and are listed in Table 2.

4.2. Effect of Pore Occupants

The most relevant physical properties for predicting the behavior of gas hydrate-bearing sediments are pore space occupants, effective stress, and lithologic characteristics of host sediments. The influence of pore occupants on the elastic properties was investigated by measuring the acoustic velocities of recovered cores with water saturation of 20%, hydrate saturation of 20%, and a completely dry core. As shown in Figure 4, both Vp and Vs of hydrate-containing cores are much higher than that of water-containing and dry cores, indicating that gas hydrate is the most important pore occupant that could significantly change the elastic properties of host sediments. Gas hydrate not only can occupy the pore space, but also works as an adhesive to cement surrounding rock particles, which would further strengthen the skeleton structure of sediments [10,12]. Hence, the increase of Vp and Vs are comprehensive results caused by the increase of hydrate concentration in the pore space.
As well as pore occupants, the influence of effective confining pressure on acoustic velocities was also studied in this work. During the acoustic velocity test, the pore pressure was set at 8 MPa to maintain the stability of methane hydrate and the confining pressure ranged from 11 to 23 MPa, resulting in the maximum effective confining pressure reaches 15 MPa. As shown Figure 4, the acoustic velocity of hydrate-containing core linearly increases with effective confining pressure. When the effective confining pressure increases from 3 MPa to 15 MPa, the corresponding P and S-wave velocities would increase about 20% and 10%, respectively. On the other hand, when hydrate saturation changes from 0 to 20%, the corresponding acoustic velocity would increase by about 90%. This means that the effect of buried depth of natural gas hydrates on the seismic velocity can be neglected if the thickness of the hydrate layer is within 100 m.

4.3. Effects of Host Sediments

The host sediments of natural gas hydrates are mainly composed of gravel, sand, silt, clay, and mud [23]. Here, we studied the acoustic properties of sandy and clayey hydrate-bearing sediments. If pore water content is below 30% in sandy sediments, most of the water is bounded in pore space [34]. In addition, disseminated gas hydrate saturations in the pore space of fine-grained clayey sediments are typically <10% [23]. Thereby, the volume fraction of methane hydrate distributed in the cores was controlled below 30% in this work. As shown in Figure 5, when hydrate saturation increases approximately from 5% to 25%, the corresponding Vp ranges from 1.94 to 3.93 km/s, Vs ranges from 1.14 to 2.23 km/s for sandy specimens; Vp and Vs for clayey specimens are 1.72–2.13 km/s and 1.10–1.32 km/s, respectively. When at the same hydrate saturation, the Vp and Vs of sandy specimens are higher than that of clayey specimens, and the difference enlarges with hydrate saturation. Winters et al. [10] suggested that the P-wave velocity of fine-grained sediment is higher than that of coarser-grained sediment, because their bury depths under the sea are different. However, the effective confining pressure was kept the same in our experiment, indicating the difference of acoustic velocity is mainly owing to the lithologic difference of host sediments and the interaction between hydrate and sandy particles.
The acoustic velocities measured in our experiment were also compared with the field data of Mallik 2L-38 well in Northern Canada [35], where the occurrence of natural gas hydrates has been verified. The gravel and sand content of natural samples obtained from Mallik 2L-38 borehole is around 90%, the rest is silt and clay [10]. According to Figure 5, the experimental measured Vp and Vs for sandy hydrate-bearing sediments are higher than field data, while for clayey hydrate-bearing sediments they are lower or close to field data when hydrate saturation is below 25%. Hence the experimental research can supply comparable data for the seismic wave detection of natural gas hydrates.
The physical parameters, such as, elastic modulus, shear modulus, and Poisson’s ratio, of recovered cores containing laboratory-formed hydrate were calculated and listed in Table 2. The Vp/Vs ratio ranges from 1.7 to 1.9 for sandy cores, and 1.55–1.7 for clayey cores. The elastic modulus of hydrate-bearing sediments is an indispensable parameter for seismic inversion models. As shown in Table 2, when hydrate saturation approximates 5–25%, the elastic modulus of sandy hydrate-bearing sediments ranges from 6 to 24 GPa, and ranges from 5 to 9 GPa for clayey hydrate-bearing sediments. The results demonstrate that hydrate saturation and types of host sediments are two dominant factors that affect the elastic properties of hydrate-containing sediments, especially for sandy sediments.

4.4. Effects of Hydrate Dissociation

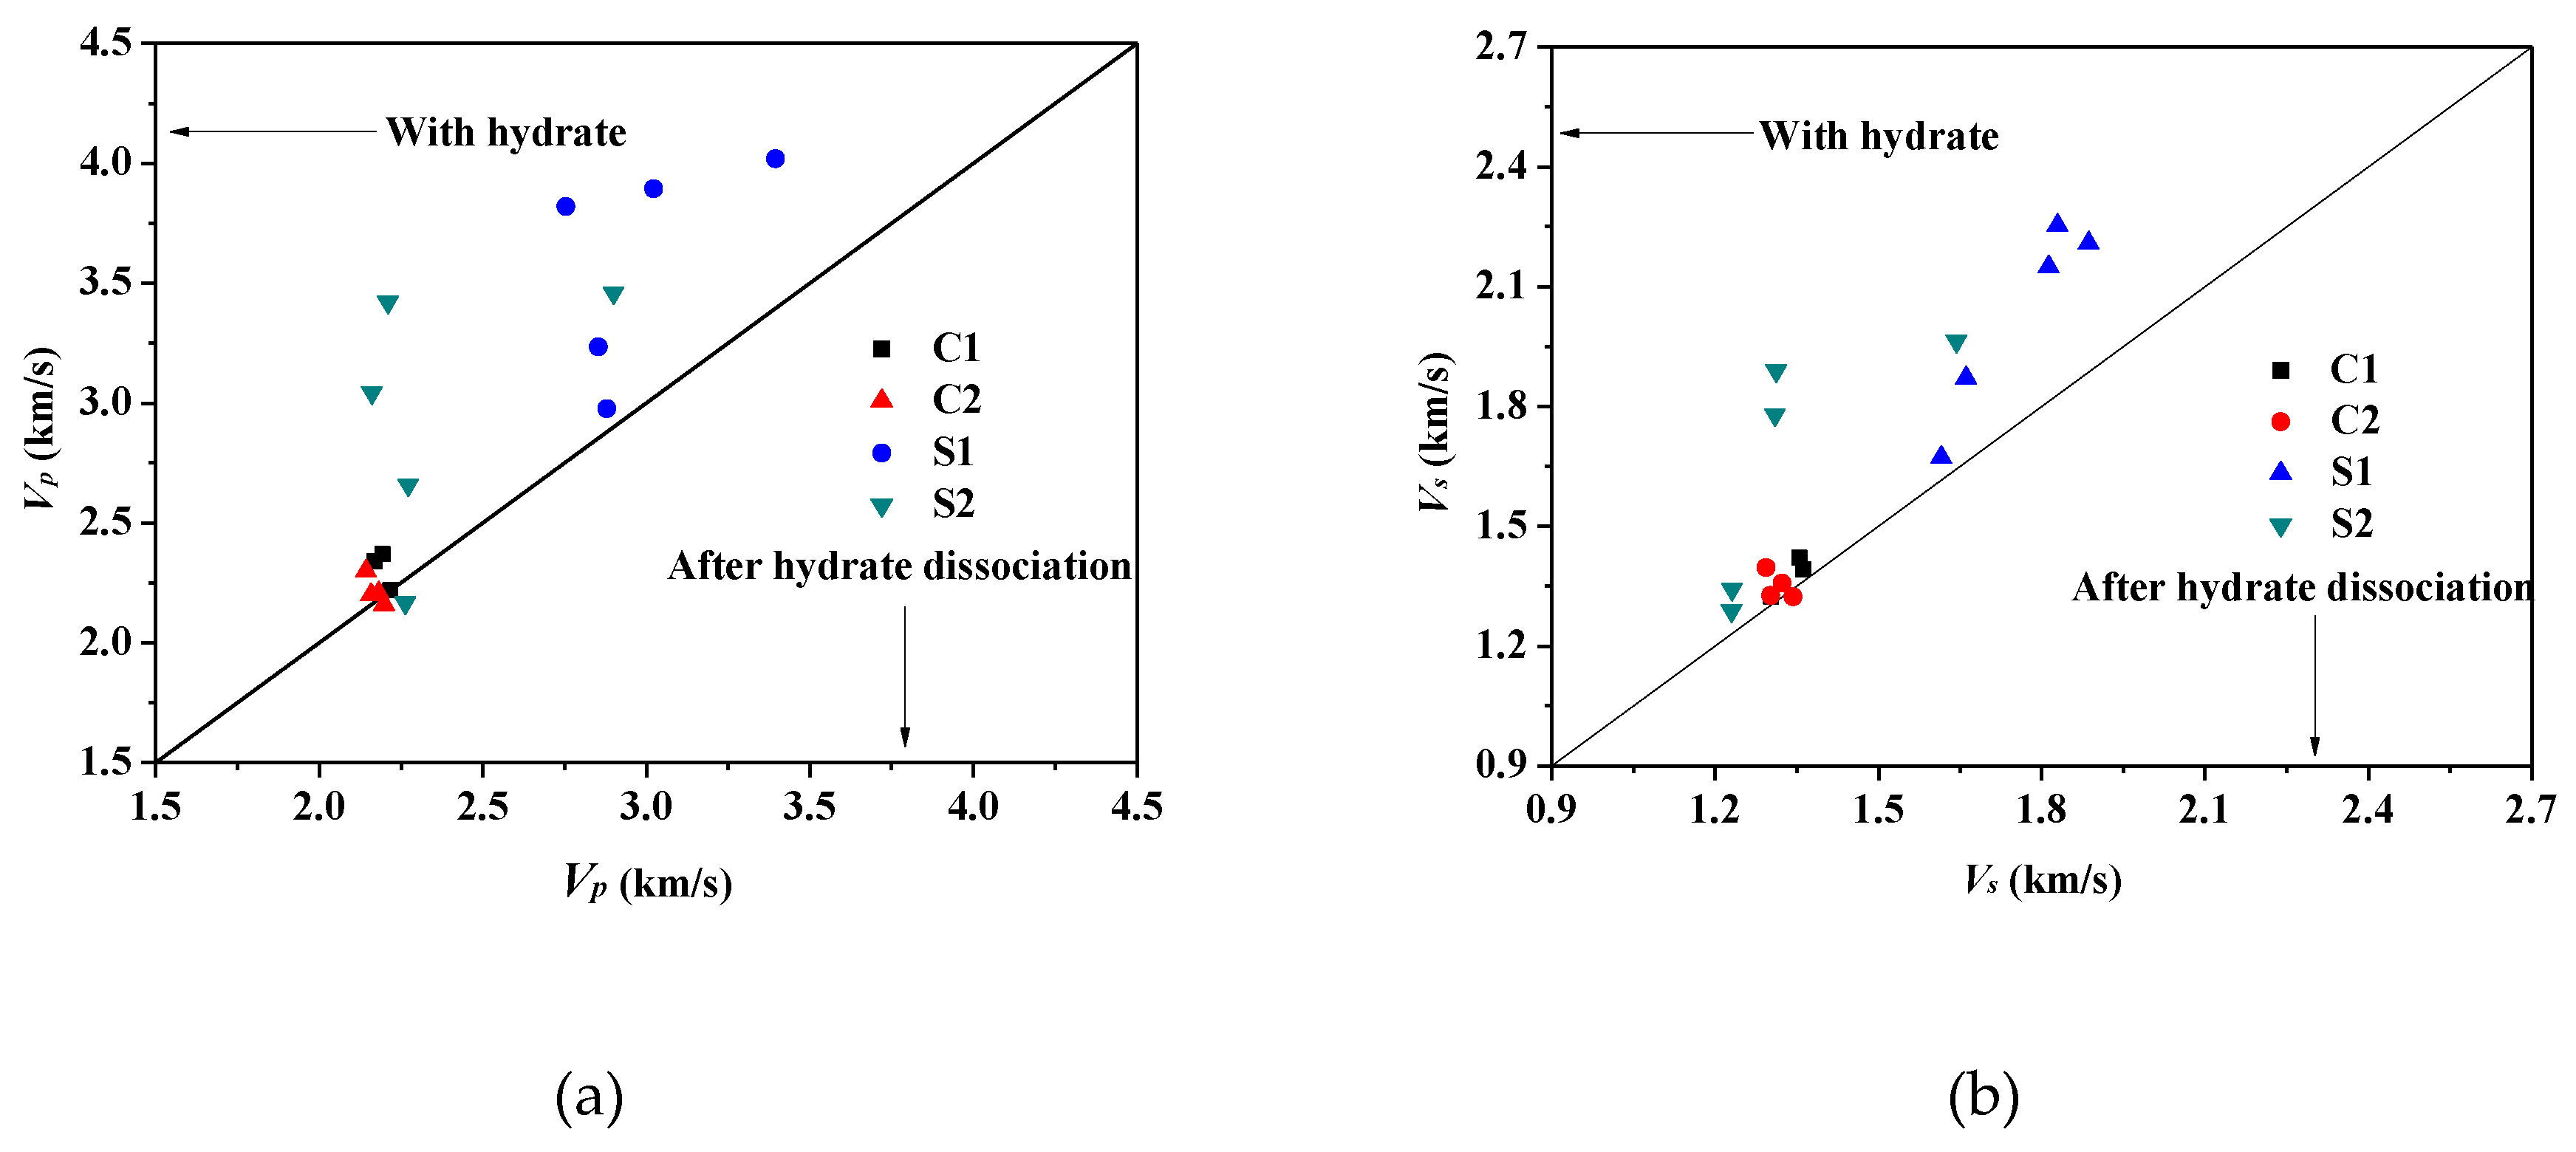
The interaction between host sediments and gas hydrates is a quite important issue, not only for developing remote detection technology, but also for potential environment impacts caused by hydrate dissociation from the sediments. Being solid crystal, gas hydrates can be viewed as pore occupants, or be part of rocks that works as skeleton structure of the reservoir [36,37]. Once the hydrate is dissociating, it may significantly affect layer mechanical strength and cause serious geological disasters, such as submarine landslide, gas release, and break well systems [38,39,40]. In this work, we studied the influence of hydrate decomposition on the physical mechanism of hydrate sediments by comparing the acoustic velocity before and after hydrate decomposition. As shown in Figure 6, the Vp and Vs of clayey specimens barely change after hydrate decomposition, indicating the layer stability can be maintained. It is consistent with the actual result of field hydrates production at Shenhu area in the South China Sea, which was conducted in May, 2017. Hydrate-bearing sediments in the Shenhu area are mainly composed of muddy silt [2], and there were no collapses or landslides duringthe 30-day gas production period. For sandy specimens, the Vp and Vs decrease significantly after hydrate decomposition, especially when hydrate saturation is above 10%, as shown in Figure 6. Both the Mallik onshore production test and Japan Nankai Trough offshore trial found the fluid migration conduits were collapsed or deformed as the hydrates dissociated, causing the subsequent decline in production rate [41,42]. The host sediments of those two sites are coarse sand. Therefore, the risk of submarine landslide and layer collapse is higher for the development of sandy hydrate reservoirs.

5. Conclusions

Seismic wave detection is an effective method to identify subsea hydrate accumulation zones and saturation, but corresponding data are limited because of the high cost of recovering natural gas hydrate cores at in situ conditions. This work performed a series of experiments to study the acoustic properties of submarine recovered cores that contain laboratory-formed hydrate. Compared with effective confining stress and other pore occupants, the amount of gas hydrate obviously plays a dominant role in the physical properties of host sediments. The influence of buried depth of natural gas hydrates on the seismic velocity can be neglected if the thickness of hydrate layer is within 100 m. The acoustic velocity of sandy specimens is much higher than that of clayey specimens when at the same hydrate saturation. Conversely, the dissociation of gas hydrate can significantly change the strength of the skeleton structure of sandy hydrate-bearing sediments. Therefore, the risk of submarine landslide and layer collapse may be higher for the development of sandy hydrate reservoirs.

Author Contributions

Formal analysis, X.-H.W.; Investigation, Q.X., Y.-N.H., Y.-F.W. and Y.-F.S.; Methodology, C.-Y.S. and G.-J.C.; Supervision, C.-Y.S.; Validation, G.-J.C.; Writing—review & editing, X.-H.W.

Funding

This research was funded bythe Science Foundation of China University of Petroleum-Beijing (grant No. 2462018YJRC010, 2462018BJC004, 2462017YJRC052), the China Postdoctoral Science Foundation (grant No. BX201700288, 2017M621024).

Acknowledgments

The authors are very grateful to Wu Xiangyang from Institute of Geology and Geophysics, Chinese Academy of Sciencesfor building the set-up, and all the reviewers for the valuable suggestions.

Conflicts of Interest

The authors declare no conflict of interest.

References

  1. Sloan, E.D.; Koh, C.A. Clathrate Hydrates of Natural Gases; CRC Press: Boca Raton, FL, USA, 2007. [Google Scholar]
  2. Chong, Z.R.; Yang, S.H.B.; Babu, P.; Linga, P.; Li, X.S. Review of natural gas hydrates as an energy resource: Prospects and challenges. Appl. Energy 2016, 162, 1633–1652. [Google Scholar] [CrossRef]
  3. Li, X.S.; Xu, C.G.; Zhang, Y.; Ruan, X.K.; Li, G.; Wang, Y. Investigation into gas production from natural gas hydrate: A review. Appl. Energy 2016, 172, 286–322. [Google Scholar] [CrossRef] [Green Version]
  4. Makogon, Y.F. Natural gas hydrates—A promising source of energy. J. Nat. Gas Sci. Eng. 2010, 2, 49–59. [Google Scholar] [CrossRef]
  5. Boswell, R.; Collett, T.S. Current perspectives on gas hydrate resources. Energy Environ. Sci. 2011, 4, 1206–1215. [Google Scholar] [CrossRef]
  6. Song, Y.; Zhu, Y.; Liu, W.; Zhao, J.; Li, Y.; Chen, Y.; Shen, Z.; Lu, Y.; Ji, C. Experimental research on the mechanical properties of methane hydrate-bearing sediments during hydrate dissociation. Mar. Pet. Geol. 2014, 51, 70–78. [Google Scholar] [CrossRef]
  7. Priest, J.A.; Best, A.I.; Clayton, C.R.I. A laboratory investigation into the seismic velocities of methane gas hydrate-bearing sand. J. Geophys. Res. Solid Earth 2005, 110, B04102. [Google Scholar] [CrossRef]
  8. Li, F.G.; Sun, C.Y.; Zhang, Q.; Liu, X.X.; Guo, X.Q.; Chen, G.J. Laboratory measurements of the effects of methane/tetrahydrofuran concentration and grain size on the P-Wave velocity of hydrate-bearing sand. Energy Fuels 2011, 25, 2076–2082. [Google Scholar] [CrossRef]
  9. Zhang, Q.; Li, F.G.; Sun, C.Y.; Li, Q.P.; Wu, X.Y.; Liu, B.; Chen, G.J. Compressional wave velocity measurements through sandy sediments containing methane hydrate. Am. Mineral. 2011, 96, 1425–1432. [Google Scholar] [CrossRef]
  10. Winters, W.J.; Waite, W.F.; Mason, D.H.; Gilbert, L.Y.; Pecher, I.A. Methane gas hydrate effect on sediment acoustic and strength properties. J. Petrol. Sci. Eng. 2007, 56, 127–135. [Google Scholar] [CrossRef] [Green Version]
  11. Waite, W.F.; Winters, W.J.; Mason, D.H. Methane hydrate formation in partially water-saturated Ottawa sand. Am. Mineral. 2004, 89, 1202–1207. [Google Scholar] [CrossRef] [Green Version]
  12. Hu, G.W.; Ye, Y.G.; Zhang, J.; Liu, C.L.; Diao, S.B.; Wang, J.S. Acoustic properties of gas hydrate–bearing consolidated sediments and experimental testing of elastic velocity models. J. Geophys. Res. Solid Earth 2010, 115, B02102. [Google Scholar] [CrossRef]
  13. Hu, G.W.; Ye, Y.G.; Zhang, J.; Liu, C.L.; Li, Q. Acoustic response of gas hydrate formation in sediments from South China Sea. Mar. Pet. Geol. 2014, 52, 1–8. [Google Scholar] [CrossRef]
  14. Konno, Y.; Jin, Y.; Yoneda, J.; Kida, M.; Egawa, K.; Ito, T.; Suzuki, K.; Nagao, J. Effect of methane hydrate morphology on compressional wave velocity of sandy sediments: Analysis of pressure cores obtained in the Eastern Nankai Trough. Mar. Pet. Geol. 2015, 66, 425–433. [Google Scholar] [CrossRef]
  15. Winters, W.J.; Pecher, I.A.; Waite, W.F.; Mason, D.H. Physical properties and rock physics models of sediment containing natural and laboratory-formed methane gas hydrate. Am. Mineral. 2004, 89, 1221–1227. [Google Scholar] [CrossRef]
  16. Ren, S.R.; Liu, Y.J.; Liu, Y.X.; Zhang, W.D. Acoustic velocity and electrical resistance of hydrate bearing sediments. J. Petrol. Sci. Eng. 2010, 70, 52–56. [Google Scholar] [CrossRef]
  17. Yamamoto, K. Overview and introduction: Pressure core-sampling and analyses in the 2012–2013 MH21 offshore test of gas production from methane hydrates in the eastern Nankai Trough. Mar. Pet. Geol. 2015, 66, 296–309. [Google Scholar] [CrossRef]
  18. Ashi, J.; Tokuyama, H.; Taira, A. Distribution of methane hydrate BSRs and it simplication for the prism growth in the Nankai Trough. Mar. Geol. 2006, 187, 177–191. [Google Scholar] [CrossRef]
  19. Riedel, M.; Collett, T.S.; Malone, M.J. Stages of gas hydrate evolution on the Northern Cascadia Margin. Sci. Drill. 2006, 3, 18–24. [Google Scholar] [CrossRef]
  20. Boswell, R.; Collett, T.S.; Frye, M.; Shedd, W.; McConnell, D.R.; Shelander, D. Subsurface gas hydrates in the northern Gulf of Mexico. Mar. Pet. Geol. 2012, 34, 4–30. [Google Scholar] [CrossRef]
  21. Liu, C.; Ye, Y.; Meng, Q.; He, X.; Li, C.; Zhang, G.; Liang, J.; Lu, J.; Lu, Z.; Zhu, Y. Characterization of natural gas hydrate recovered from both marine and terrestrial regions in China: Laboratory studies. In Proceedings of the 8th International Conference on Gas Hydrates, Beijing, China, 28 July–1 August 2014. [Google Scholar]
  22. Pohlman, J.W.; Canuel, E.A.; Chapman, N.R.; Spence, G.D.; Whiticar, M.J.; Coffin, R.B. The origin of thermogenic gas hydrates on the northern Cascadia Margin as inferred from isotopic 13C/12C and D/H) and molecular composition of hydrate and vent gas. Org. Geochem. 2005, 36, 703–716. [Google Scholar] [CrossRef]
  23. Waite, W.F.; Santamarina, J.C.; Cortes, D.D.; Dugan, B.; Espinoza, D.N.; Germaine, J.; Jang, J.; Jung, J.W.; Kneafsey, T.J.; Shin, H.; et al. Physical properties of hydrate-bearing sediments. Rev. Geophys. 2009, 47, 465–484. [Google Scholar] [CrossRef]
  24. Liu, B.; Pan, H.; Wang, X.; Li, F.; Sun, C.; Chen, G. Evaluation of different CH4-CO2 replacement processes in hydrate-bearing sediments by measuring P-wave velocity. Energies 2013, 6, 6242–6254. [Google Scholar] [CrossRef]
  25. Kneafsey, T.J.; Tomutsa, L.; Moridis, G.J.; Seol, Y.; Freifeld, B.M.; Taylor, C.E.; Gupta, A. Methane hydrate formation and dissociation in a partially saturated core-scale sand sample. J. Petrol. Sci. Eng. 2007, 56, 108–126. [Google Scholar] [CrossRef] [Green Version]
  26. Luo, Y.; Peng, J.; Li, P.; He, J.; Li, L. Influence of heterogeneous hydrate distribution on the compressional wave velocity of hydrate-bearing sediment specimens. J. Nat. Gas Sci. Eng. 2015, 22, 90–97. [Google Scholar] [CrossRef]
  27. Wang, X.H.; Sun, Y.F.; Wang, Y.F.; Li, N.; Sun, C.Y.; Chen, G.J.; Liu, B.; Yang, L.Y. Gas production from hydrates by CH4-CO2/H2 replacement. Appl. Energy 2017, 188, 305–314. [Google Scholar] [CrossRef]
  28. Stern, L.A.; Circone, S.; Kirby, S.H. Anomalous preservation of pure methane hydrate at 1 atm. Phys. Chem. Phys.Chem. 2001, 105, 1756–1762. [Google Scholar] [CrossRef]
  29. Stern, L.A.; Circone, S.; Kirby, S.H.; Durham, W.B. Temperature, pressure, and compositional effects on anomalous or self preservation of gas hydrates. Can. J. Phys. 2003, 81, 271–283. [Google Scholar] [CrossRef]
  30. Zhao, J.; Wang, C.; Yang, M.; Liu, W.; Xu, K.; Liu, Y.; Song, Y. Existence of a memory effect between hydrates with different structures (I, II, and H). J. Nat. Gas Sci. Eng. 2015, 26, 330–335. [Google Scholar] [CrossRef]
  31. Sowa, B.; Maeda, N. Statistical study of the memory effect in model natural gas hydrate systems. J. Phys. Chem. A 2015, 119, 10784–10790. [Google Scholar] [CrossRef] [PubMed]
  32. Li, B.; Li, X.S.; Li, G.; Feng, J.C.; Wang, Y. Depressurization induced gas production from hydrate deposits with low gas saturation in a pilot-scale hydrate simulator. Appl. Energy 2014, 129, 274–286. [Google Scholar] [CrossRef]
  33. Duchkov, A.D.; Golikov, N.A.; Duchkov, A.A.; Manakov, A.Y.; Per-myakov, M.E.; Drobchik, A.N. Equipment for the studies of the acoustic properties of hydrate-containing samples in laboratory conditions. Seism. Instrum. 2016, 52, 70–78. [Google Scholar] [CrossRef]
  34. Wang, X.H.; Sun, J.S.; Jiang, L.Y.; Sun, Y.F.; Sun, C.Y.; Chen, G.J. Occurrence characteristics of gas hydrates formed from seepage gas in sandy deposits. J. Petrol. Sci. Eng. 2016, 147, 451–458. [Google Scholar] [CrossRef]
  35. Dai, J.; Xu, H.; Snyder, F.; Dutta, N. Detection and estimation of gas hydrates using rock physics and seismic inversion: Examples from the northern deepwater Gulf of Mexico. Lead. Edge 2004, 23, 60–66. [Google Scholar] [CrossRef]
  36. Li, D.L.; Wu, Q.; Wang, Z.; Lu, J.; Liang, D.; Li, X. Tri-axial shear tests on hydrate-bearing sediments during hydrate dissociation with depressurization. Energies 2018, 11, 1819. [Google Scholar] [CrossRef]
  37. Terry, D.A.; Knapp, C.C.; Knapp, J.H. Effective-medium models and rock physics analysis for marine gas hydrates in Northern Gulf of Mexico. In Proceedings of the Seventh International Conference on Gas Hydrates, Edinburgh, UK, 17–21 July 2011. [Google Scholar]
  38. Wang, F.; Zhao, B.; Li, G. Prevention of potential hazards associated with marine gas hydrate exploitation: A review. Energies 2018, 11, 2384. [Google Scholar] [CrossRef]
  39. Liu, Z.; Wei, H.; Peng, L.; Wei, C.F.; Ning, F.L. An easy and efficient way to evaluate mechanical properties of gas hydrate-bearing sediments: The direct shear test. J. Petrol. Sci. Eng. 2016, 149, 56–64. [Google Scholar] [CrossRef]
  40. Kwon, T.; Cho, G. Submarine slope failure primed and triggered by bottom water warming in oceanic hydrate-bearing deposits. Energies 2012, 5, 2849–2873. [Google Scholar] [CrossRef]
  41. Yamamoto, K.; Suzuki, K.; Nagano, Y.; Nakatsuka, Y. Approach to study mechanical stability of wellbore and formation for the offshore production test from methane hydrate deposits. In Proceedings of the 8th International Conference on Gas Hydrates, Beijing, China, 28 July–1 August 2014. [Google Scholar]
  42. Dallimore, S.R.; Wright, J.F.; Nixon, F.M.; Kurihara, M.; Yamamoto, K.; Fujii, T.; Fujii, K.; Numasawa, M.; Yasuda, M.; Imasato, Y. Geologic and porous media factors affecting the 2007 production response characteristics of the JOGMEC/NRCan/Aurora Mallik gas hydrate production research well. In Proceedings of the 6th International Conference on Gas Hydrates, Vancouver, BC, Canada, 6–10 July 2008. [Google Scholar]
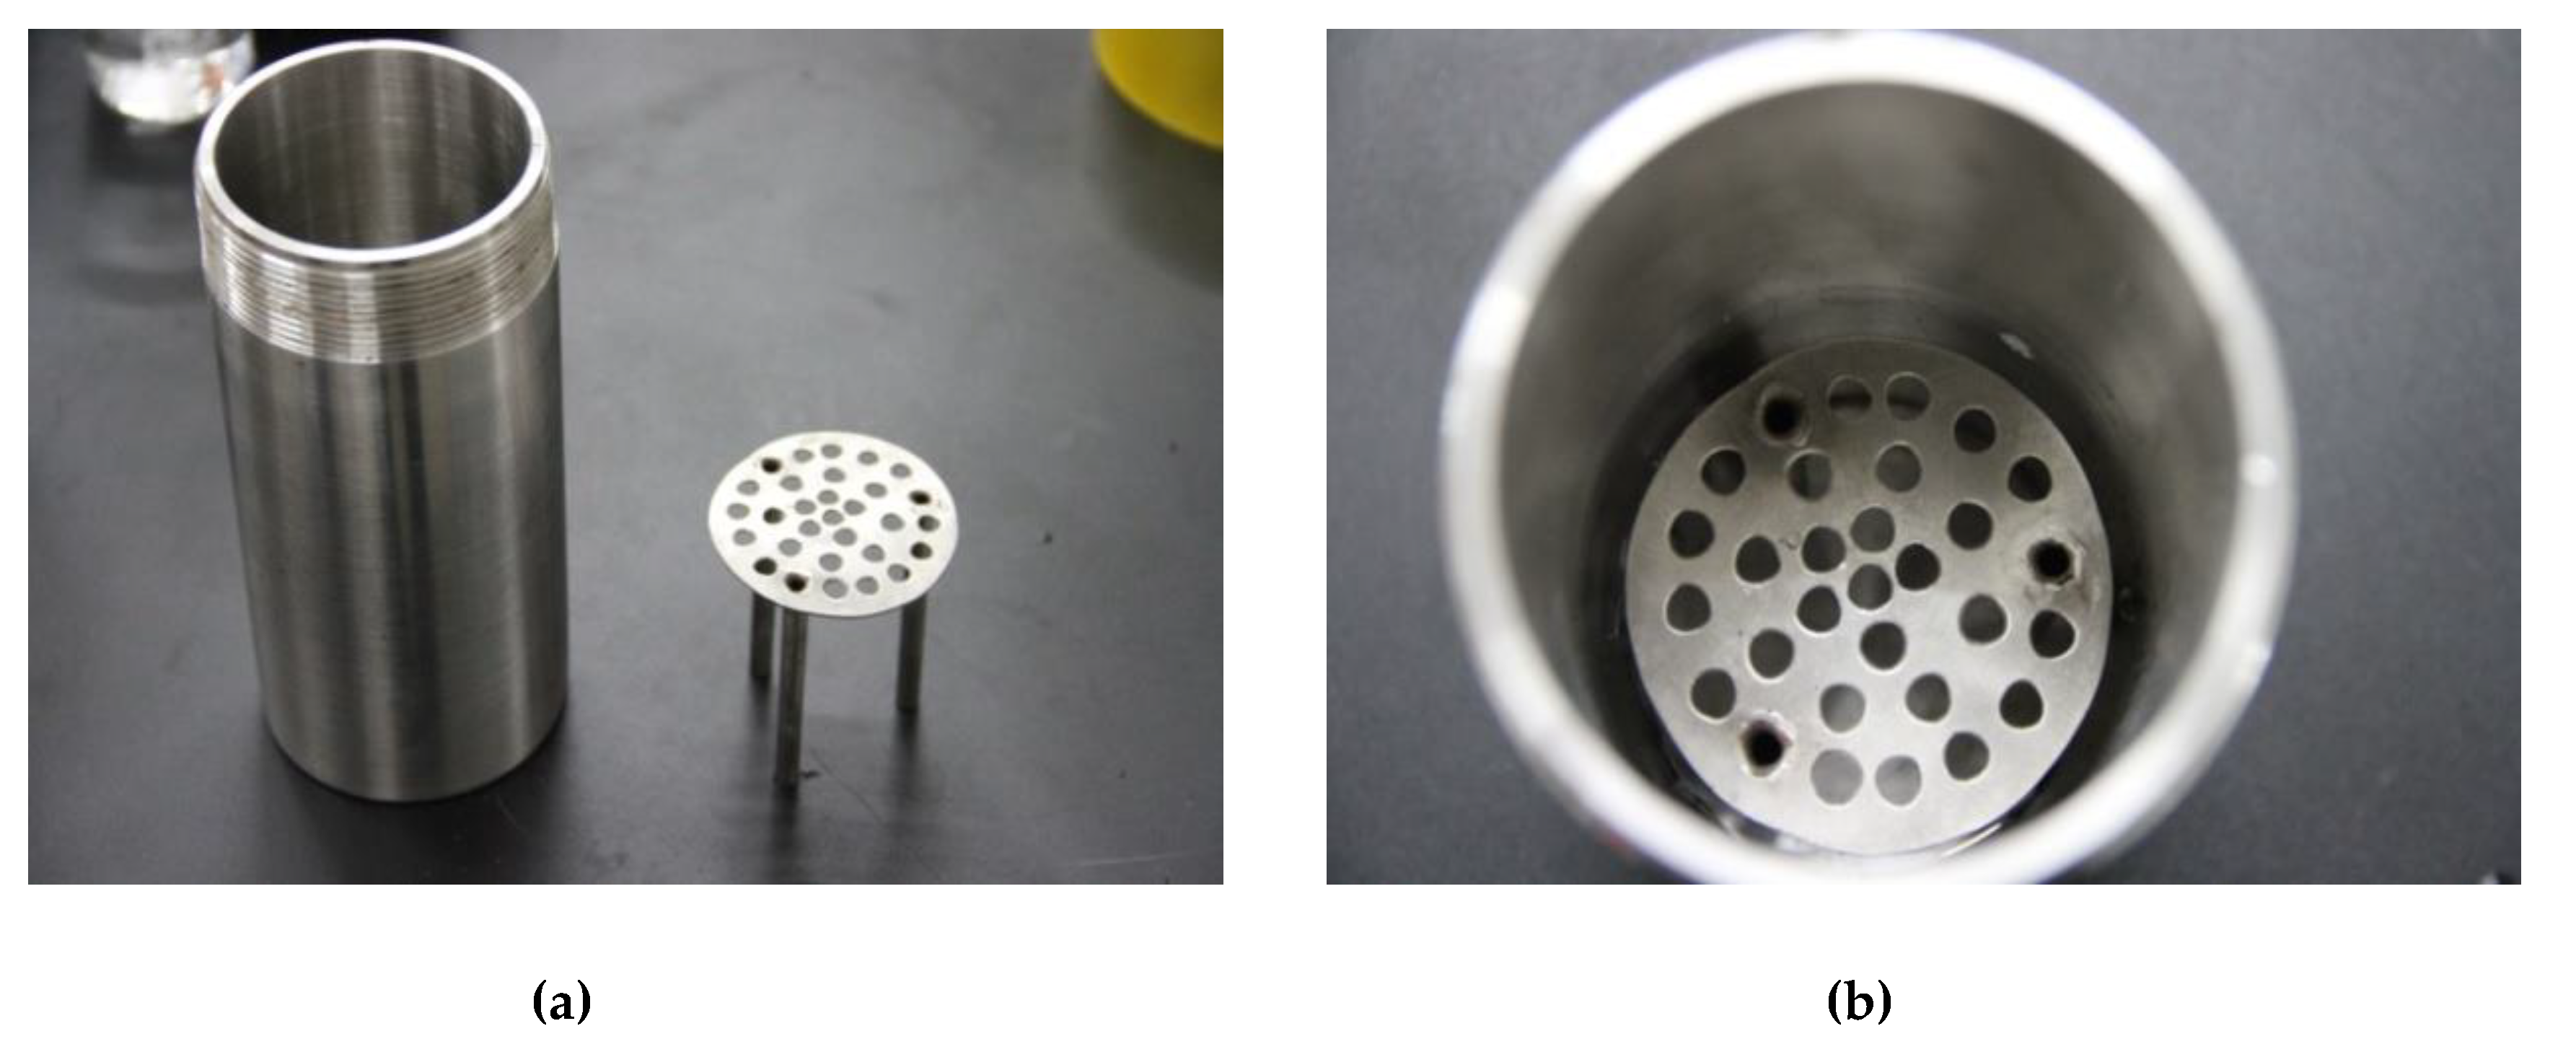
Figure 1. Details of the water-adding device. (a) The picture of a bracket and cylindrical vessel; (b) the bracket was placed into the cylindrical vessel for supporting the cores when adding water vapor.
Energies 12 01825 g001
Figure 2. Schematic diagram of the experimental apparatus used to measure P-wave and S-wave velocities of hydrate-bearing sediments.
Energies 12 01825 g002
Figure 3. Wave diagram of P and S-wave signals collected in the experiment.
Energies 12 01825 g003
Figure 4. The relationship between acoustic velocities, P-wave velocity (a) and S-wave velocity (b), and effective confining pressure, pore occupants for core S1.
Energies 12 01825 g004
Figure 5. The P-wave velocity (a) and S-wave velocity (b) versus hydrate saturation at the effective confining pressure of 3 MPa, respectively. Clayey hydrate-bearing specimens (C1, C2), sandy hydrate-bearing specimens (S1, S2), and the field data of Mallik 2L-38 well in Northern Canada (circles and grey shading).
Energies 12 01825 g005
Figure 6. Comparison of the acoustic velocities of hydrate-bearing sediments before and after hydrate dissociation. (a) P-wave velocity, (b) S-wave velocity. Hydrate saturations are shown in Table 2.
Energies 12 01825 g006
Table 1. The physcial parameters of natural recovered cores.
CoresDensity
(g/cm3)
Porosity
(%)
Length
(mm)
Diameter
(mm)
C11.9729.7454.7737.28
C22.0327.9354.6736.83
S11.7238.7452.3037.16
S21.8934.4547.6536.27
Table 2. Theacoustic parameters of hydrate-bearing sediments formed with natural recovered cores.
CoresSh
(%)
Density
(g/cm3)
Vp
(km/s)
Vs
(km/s)
Vp/VsElastic Modulus
(GPa)
Bulk Modulus
(GPa)
Shear Modulus
(GPa)
Poisson’s Rato
C14.692.0181.921.191.616.773.612.850.19
10.322.0051.981.171.706.754.252.730.23
20.352.0602.131.321.618.534.553.590.19
C26.212.0601.731.101.575.812.812.510.16
11.322.0701.941.231.577.293.563.150.16
14.962.0742.021.251.617.714.103.250.19
21.062.0772.031.261.617.804.163.280.19
S15.601.7872.631.481.789.907.153.900.27
9.881.7943.121.801.7414.509.755.790.25
15.581.8243.832.101.8220.6216.018.020.29
20.061.8343.812.161.7721.5615.298.520.26
26.401.8553.932.231.7623.2516.399.200.26
S24.981.9341.941.141.706.233.952.520.24
11.041.9172.391.401.719.285.973.740.24
15.771.9132.881.681.7113.418.645.400.24
19.351.9473.331.851.8017.0312.736.670.28
26.131.9553.361.921.7518.1212.497.200.26
Note: the absolute errors of P and S-wave velocity are both 0.01 km/s, the combined relative errors of elastic modulus, bulk modulus, shear modulus, and Poisson’s ratio are 9.6%, 4.7%, 1.8%, and 11.0%, respectively.