Article

Design and Simulation of Romanian Solar Energy Charging Station for Electric Vehicles

1
Technical University of Cluj-Napoca, Memorandumului Street, No. 28, 400114 Cluj-Napoca, Romania
2
National Research and Development Institute for Cryogenic and Isotopic Technologies—ICSI Rm. Valcea, Uzinei Street, No. 4, P.O. Box 7 Raureni, 240050 Rm. Valcea, Romania
3
Faculty of Electrical Engineering and Computer Science, Stefan cel Mare University of Suceava, 720229 Suceava, Romania
*
Authors to whom correspondence should be addressed.
Energies 2019, 12(1), 74; https://doi.org/10.3390/en12010074
Submission received: 1 November 2018 / Revised: 29 November 2018 / Accepted: 26 December 2018 / Published: 27 December 2018

Abstract

:
Since mid 2010, petrol consumption in the transport sector has increased at a higher rate than in other sectors. The transport sector generates 35% of the total CO2 emissions. In this context, strategies have been adopted to use clean energy, with electromobility being the main directive. This paper examines the possibility of charging electric vehicle batteries with clean energy using solar autochthonous renewable resources. An isolated system was designed, dimensioned, and simulated in operation for a charging station for electric vehicles with photovoltaic panels and batteries as their main components. The optimal configuration of the photovoltaic system was complete with improved Hybrid Optimization by Genetic Algorithms (iHOGA) software version 2.4 and we simulated its operation. The solar energy system has to be designed to ensure that the charging station always has enough electricity to supply several electric vehicles throughout all 24 h of the day. The main results were related to the energy, environmental, and economic performance achieved by the system during one year of operation.

1. Introduction

Under the Paris Agreement [1], governments have committed to the transition from fossil fuels to cleaner energy sources. Romania’s main obligations under the Paris Agreement are to reduce greenhouse gas emissions by 43% by 2030 compared to 2005, and to participate in the European Union’s efforts to reduce greenhouse gas emissions by 30% by 2030. The Paris Agreement’s signatory countries agreed upon the long-term goal to limit global temperature increase to below 2 °C compared to pre-industrial times and to continue efforts to limit the growth to 1.5 °C to reduce the risks and impacts of climate change.
The new “Energy Strategy of Romania for the period 2016–2030 with perspectives for 2050” [2] has clean energy as its strategic objective, in line with European Commission (EC) Directives 2016/November 30, 2016 [3] (“Clean Energy for All”), and electromobility as a priority direction [4]. The strategy estimates that although the total distance traveled by cars in Romania will increase by about 35% by 2030, CO2 emissions will remain constant. Consumption is forecast to increase by 6% by 2030 [5] as a result of the energy efficiency of new generations of engines.
The electric motor is characterized by high efficiency and a lack of emissions, resulting from the lack of combustion fuels. The main problem with the electric vehicle is the difficulty in storing electricity [6,7]. From a sustainability point of view, there is also the issue of emissions related to fossil fuel power generation. In time, electric vehicles are expected to play a central role as battery efficiency increases along with the production of large amounts of clean electricity [8].
One of the problems with electric cars that concerns potential customers is the lack of a charging station infrastructure or, in more developed countries, the limited size of this infrastructure [9]. People may not buy electric cars not only because they are expensive or have limited autonomy, but because “outlets are not everywhere” [10].
A major problem faced by electric vehicle production companies and governments is related to fears regarding the capacity of electric power distribution networks and how to address the imminent revolution in electromobility [11]. The actual electric power transportation network in Romania was established in the 1980s in order to ensure a maximum power of 12,000 MW on the national level on a daily basis, based upon the industrial momentum. However, the national capacity in Romania has been severely reduced, so that the national consumption varies between 6000 and 8000 MW. At least in theory, the national network has a power reserve of 50% from the initial design [2,6], which is enough to handle charging, even in the fast-charging mode, of a few thousand electrical vehicles in the next few years, without the network being a risk in the short term. The production and distribution of electric power will be tested by many consumers in the next few years.
After 2020, the number of cars with large and extra large batteries will increase substantially, and then electric power distribution will be a problem. Special attention is being paid to the decongestive knots in the capacity of network distribution in each zone, and especially big cities, where a large number of electrical vehicles are expected to be concentrated along with charging stations [12]. Concerns have also been expressed about isolated areas where there is no access to the national electric power distribution network.
“Strategy on the National Market Policy Framework for the Development of Alternative Fuels Market in the Transport Sector and for the Installation of Relevant Infrastructure in Romania” [13] provides for a minimum number of electric vehicles (EV) and plug-in hybrid electric vehicles (PHEV) feed and recharge points in urban agglomerations, but also in rural areas, thus ensuring broad access to alternative fuels infrastructure in the most populated and relevant areas of Romania. At the same time, the territorial arrangement of these areas ensures inter-urban and cross-border connectivity in relation to the Trans-European Transport Network (TEN-T), distances between proposed site locations or between these and the border areas not exceeding 150 km [13].
The further expansion of electric vehicles usage is currently prevented by the low availability of necessary public charging stations infrastructure [14,15]. The trend is that electric vehicle owners prefer charging stations to be at home or at work (city infrastructure concept). These charging stations may be slow-charging, in alternating current (AC) mode 2 or 3. In order to alleviate concentration from big cities, public fast charging stations will be located in supermarket parking spaces [16], lamp post, bollards, near highways or roads of European interest [17] and they should be strategically located to cover the long-distance intercity trips (city/country infrastructure concept). These charging stations may be rapid-charging, in AC mode 2 or direct current (DC) mode 4.
In an increasingly globalized context, Romania’s energy policy is taking place within the changes and developments that take place at the European and world level. Romania’s energy policy must be correlated with similar policies at the global level to ensure convergence in the field. From the point of view of the use of alternative fuels in mobile applications, Romania is in the process of aligning with European standards in the field.
In realization of the present work, actual relevant studies have been identified regarding the design, the optimization, the simulation of solar charging stations for electrical vehicles, different approaches being critically analyzed, but also the current state of the global implementation of these energy generating systems, based upon the green charging solar station concept for green electrical vehicles. At the Romanian level the simultaneous approach of the two green concepts, green charging station powered by renewable energy sources and green electric vehicle, has not been developed and approached. The current paper aims to demonstrate the Green-to-Green concept (EC Directive 2016/30.11.2016–Clean Energy for All [3]) that means to combine electrical vehicle and renewable energy resources usage to reduce greenhouse gases emissions. In this respect, this paper proposes a solution with practical applicability, adapted to geographic characteristics and availability of Romanian solar irradiance, but can be developed anywhere in the world, taking into account the particular availability of local renewable resources. The present study represents an intermediate phase that is part of a complex research project [18], whose main objective is the implementation of advanced theoretical and technological solutions in order to provide some green fixed charging stations for electric vehicles (EV) and plug-in hybrid electric vehicles (PHEV). The desired final result is a pilot charging station which is 100% sustained by renewable energy resources. In this context, this paper represents a starting point for developing some comprehensive studies to demonstrate the utility of the presented technology in the energy sustainability of an EV and PHEV consumer. This study also represents a preliminary step in creating a database in order to establish useful premises for procedure elaboration, design standards, execution and implementation of safe conditions for energy generating systems with photovoltaic panels that can be integrated with mobile applications, electromobility, and includes elements of production, storage, transport and distribution—the necessary infrastructure for the development of a green renewable energy-based economy.
The availability of the location spaces together with urban conditions in Romania allows positioning of charging stations based on the Green-to-Green concept proposed by this paper, both in areas with urban agglomerations, as well as in rural areas [19]. In addition, the solar charging station for electric vehicles proposed in the study, through its presence in congested areas with a high power demand, can help stabilize the operation of the electricity distribution network, both by supplying EV and PHEV consumers, as well as through excess energy that can be used in other applications. Also, this type of charging station can be implemented both in areas that can and cannot connect to the public electrical network.

2. Materials and Methods

In order for this case study to be successful, it was necessary to define the input data [19,20,21] regarding the energy demand of the charging station for electric vehicles, the autochthon availability of solar resources, the characteristics of the energy conversion system, and the photovoltaic system’s configuration, technical, environmental, and financial characteristics of the main components. It was also necessary to describe the mathematical and computational elements regarding the design and simulation [22,23] of Romanian solar energy charging stations for electric vehicles.

2.1. Electrical Load

The energy demand of the charging station for electric vehicles that were considered in this study had an average daily load value of 8.63 kWh/day, a direct current (DC) maximum hourly active power load of 360 W, and a DC maximum in half hour intervals of 415 W.
A constant load profile was fixed to establish the maximum system capacity, which was equal to the maximum energy demand that the photovoltaic charging station for electric vehicles could cover during the charging time [17,24].

2.2. Solar Energy Resources

Solar energy is the most important renewable energy resource, being virtually an inexhaustible source of energy. The potential for solar energy in Romania is relatively important, as it is the second sunniest area in Europe. Thus, for Romania, it is possible to define five sunny zones from the Coast area, Dobrogea, and in most southern areas, to a minimum of 1100–1200 kWh/m2/year in mountainous areas and in the north of the country. In most regions of the country, the annual solar energy exceeds 1250–1350 kWh/m2/year.
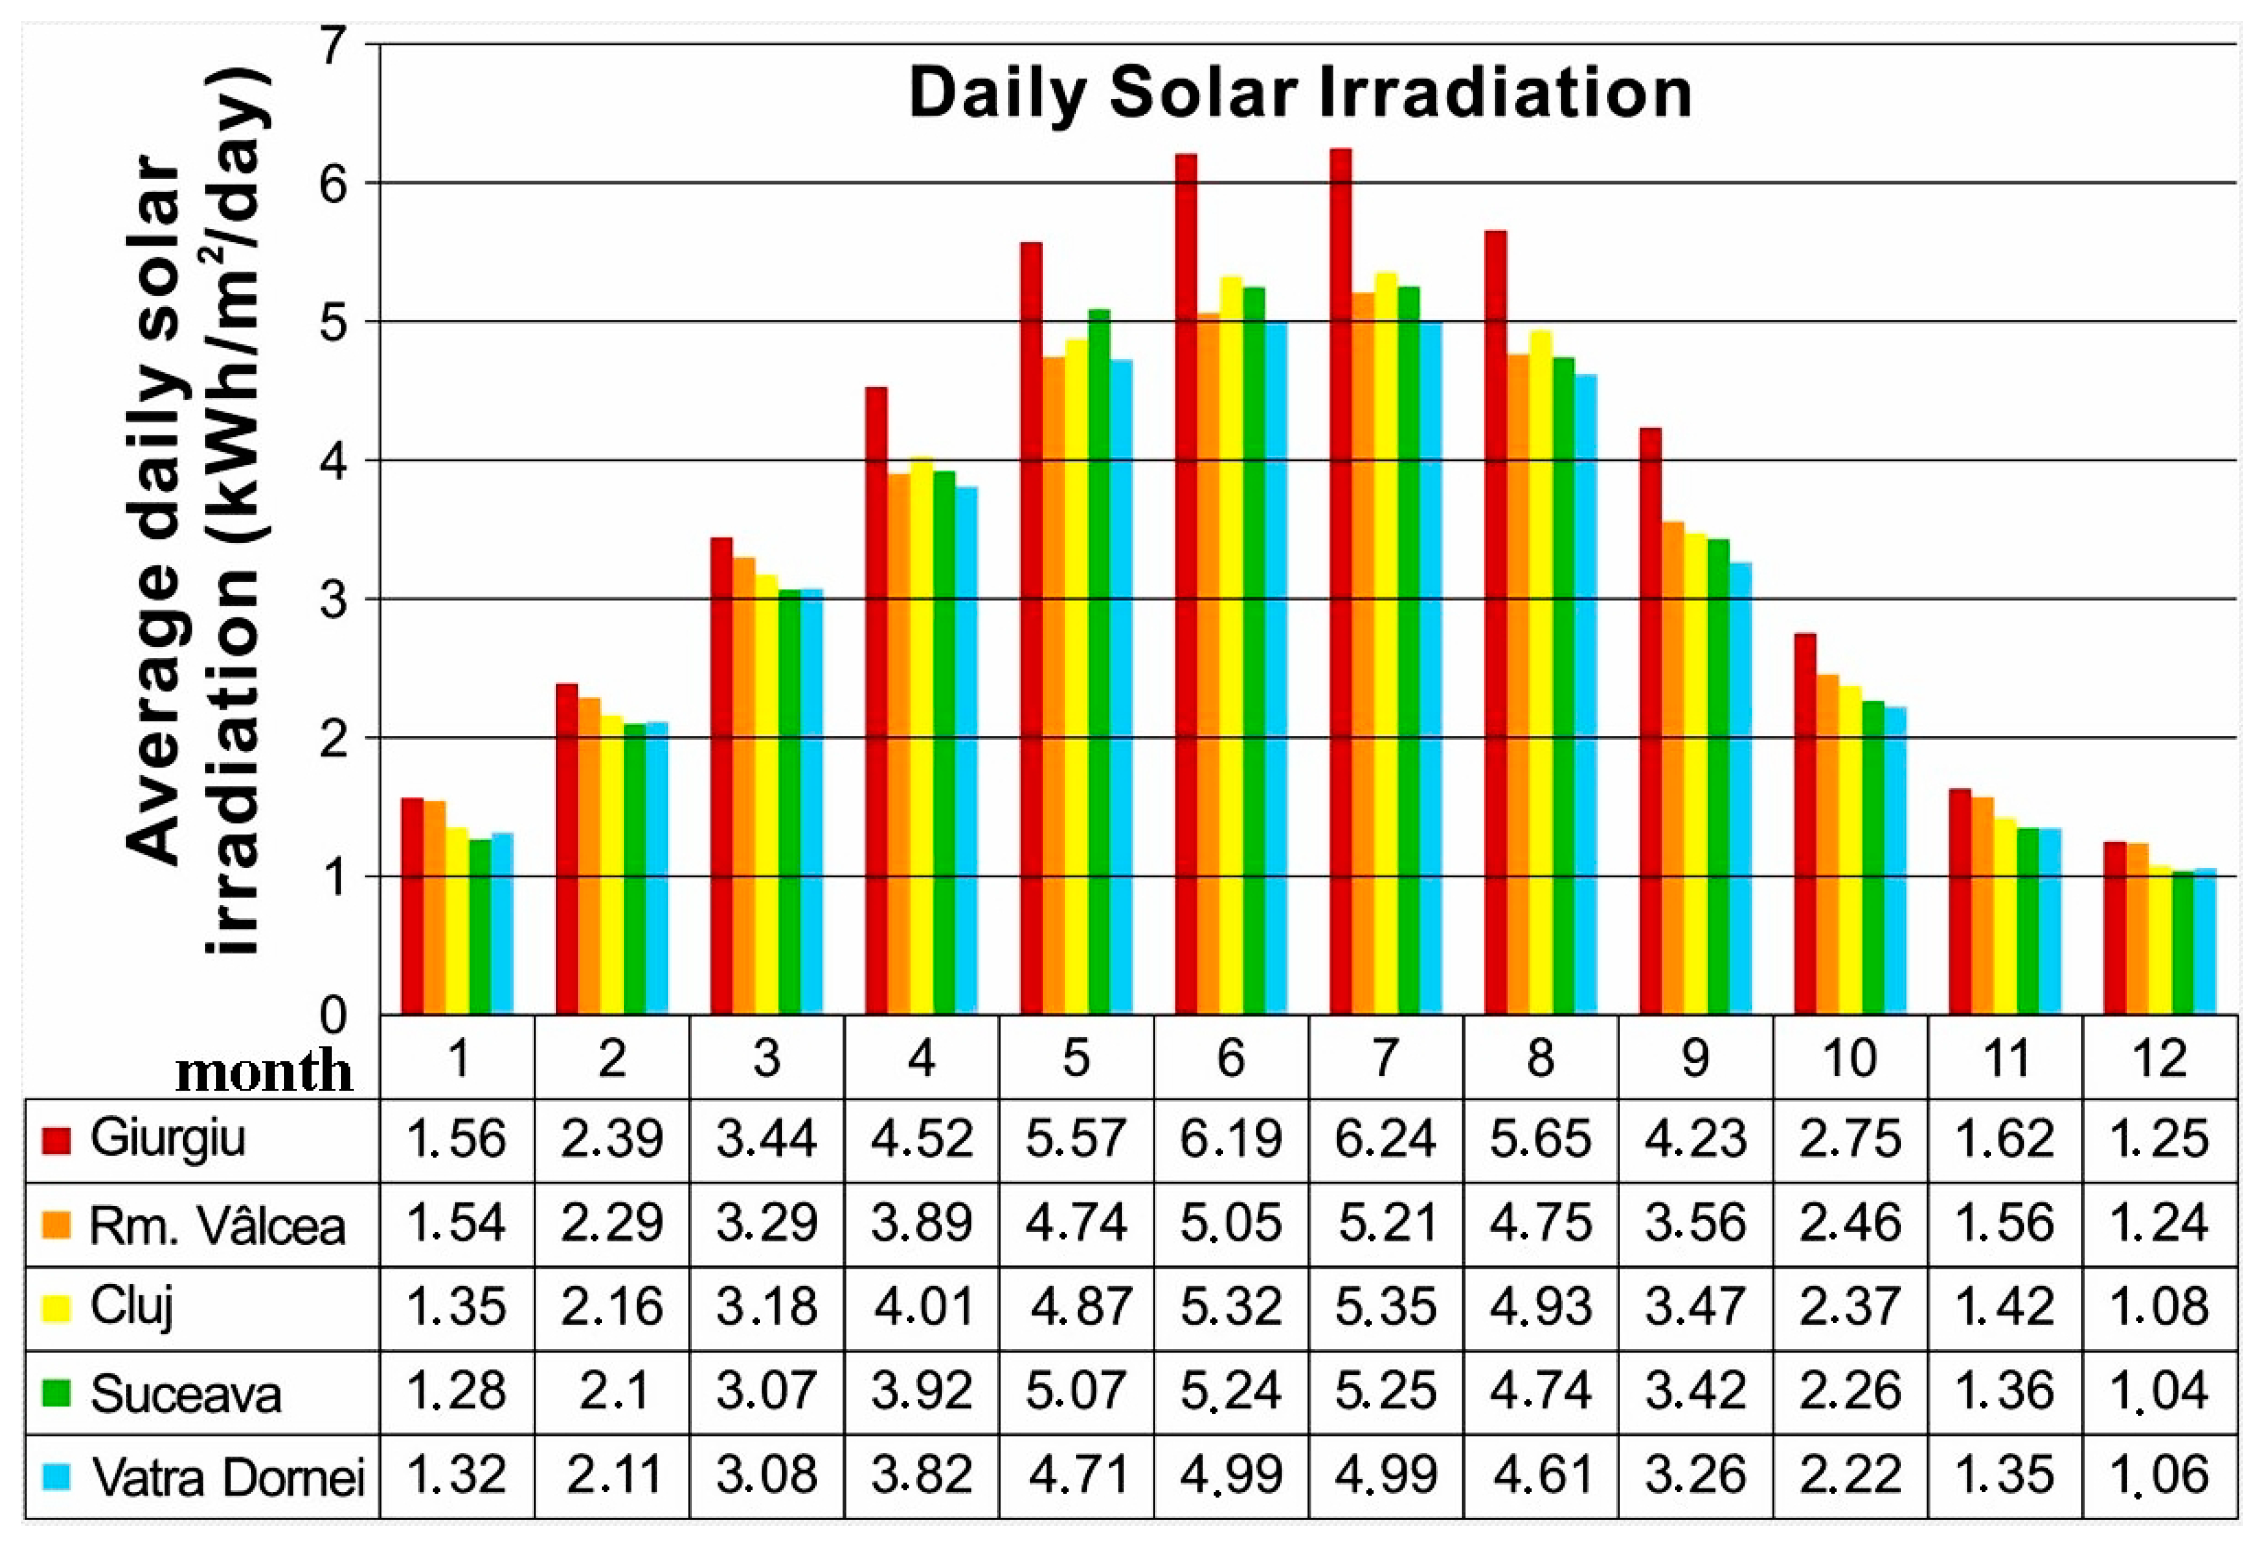
Due to geographical location and climatic conditions, the potential of solar energy was characterized by daily average irradiation, which is presented in Figure 1 [25].
Figure 1 highlights the potential of solar resources for a location in one of Romania’s five sunny zones, but the worst site with regards to solar irradiation (Vatra Dornei) was selected to study the design and simulation of a solar energy system that supplies energy and charging stations for electric vehicles. For this location, the average monthly sunshine duration, calculated from multiannual statistical data, is shown in Table 1. The constant solar Cs averaged 1.355 kW/m2.

2.3. Solar Energy System Configuration

The system that sustains with energy the charging station for electric vehicles is shown in Figure 2. During the day, the electricity is supplied directly from the solar energy resources to the electrical vehicle by the DC bus. The energy generated by photovoltaic panels is charged into the batteries when the production from solar energy is greater than the load, and is discharged from the batteries when the production is lower than the demand of the EV charging station [26,27]. Additionally, it has been recommended to place a DC/alternating current (AC) inverter in the system, so if excess electricity is generated, it can be used in other types of applications [23,28].
The main components of the system were as follows:
  • Photovoltaic panels (PV) were in accordance with the data presented in Table 2. The loss factor wass defined as the increase in power required for the PV generator to compensate for any loss from shadows, orientation, dirt in panels, etc. Usually, the value ranges between 1.1 and 1.3. For this study, the loss factor selected was 1.2 and the PV slope was 60° [29,30,31].
  • The batteries are lead-acid type, and the input data [32] used for the study are presented in Table 3.
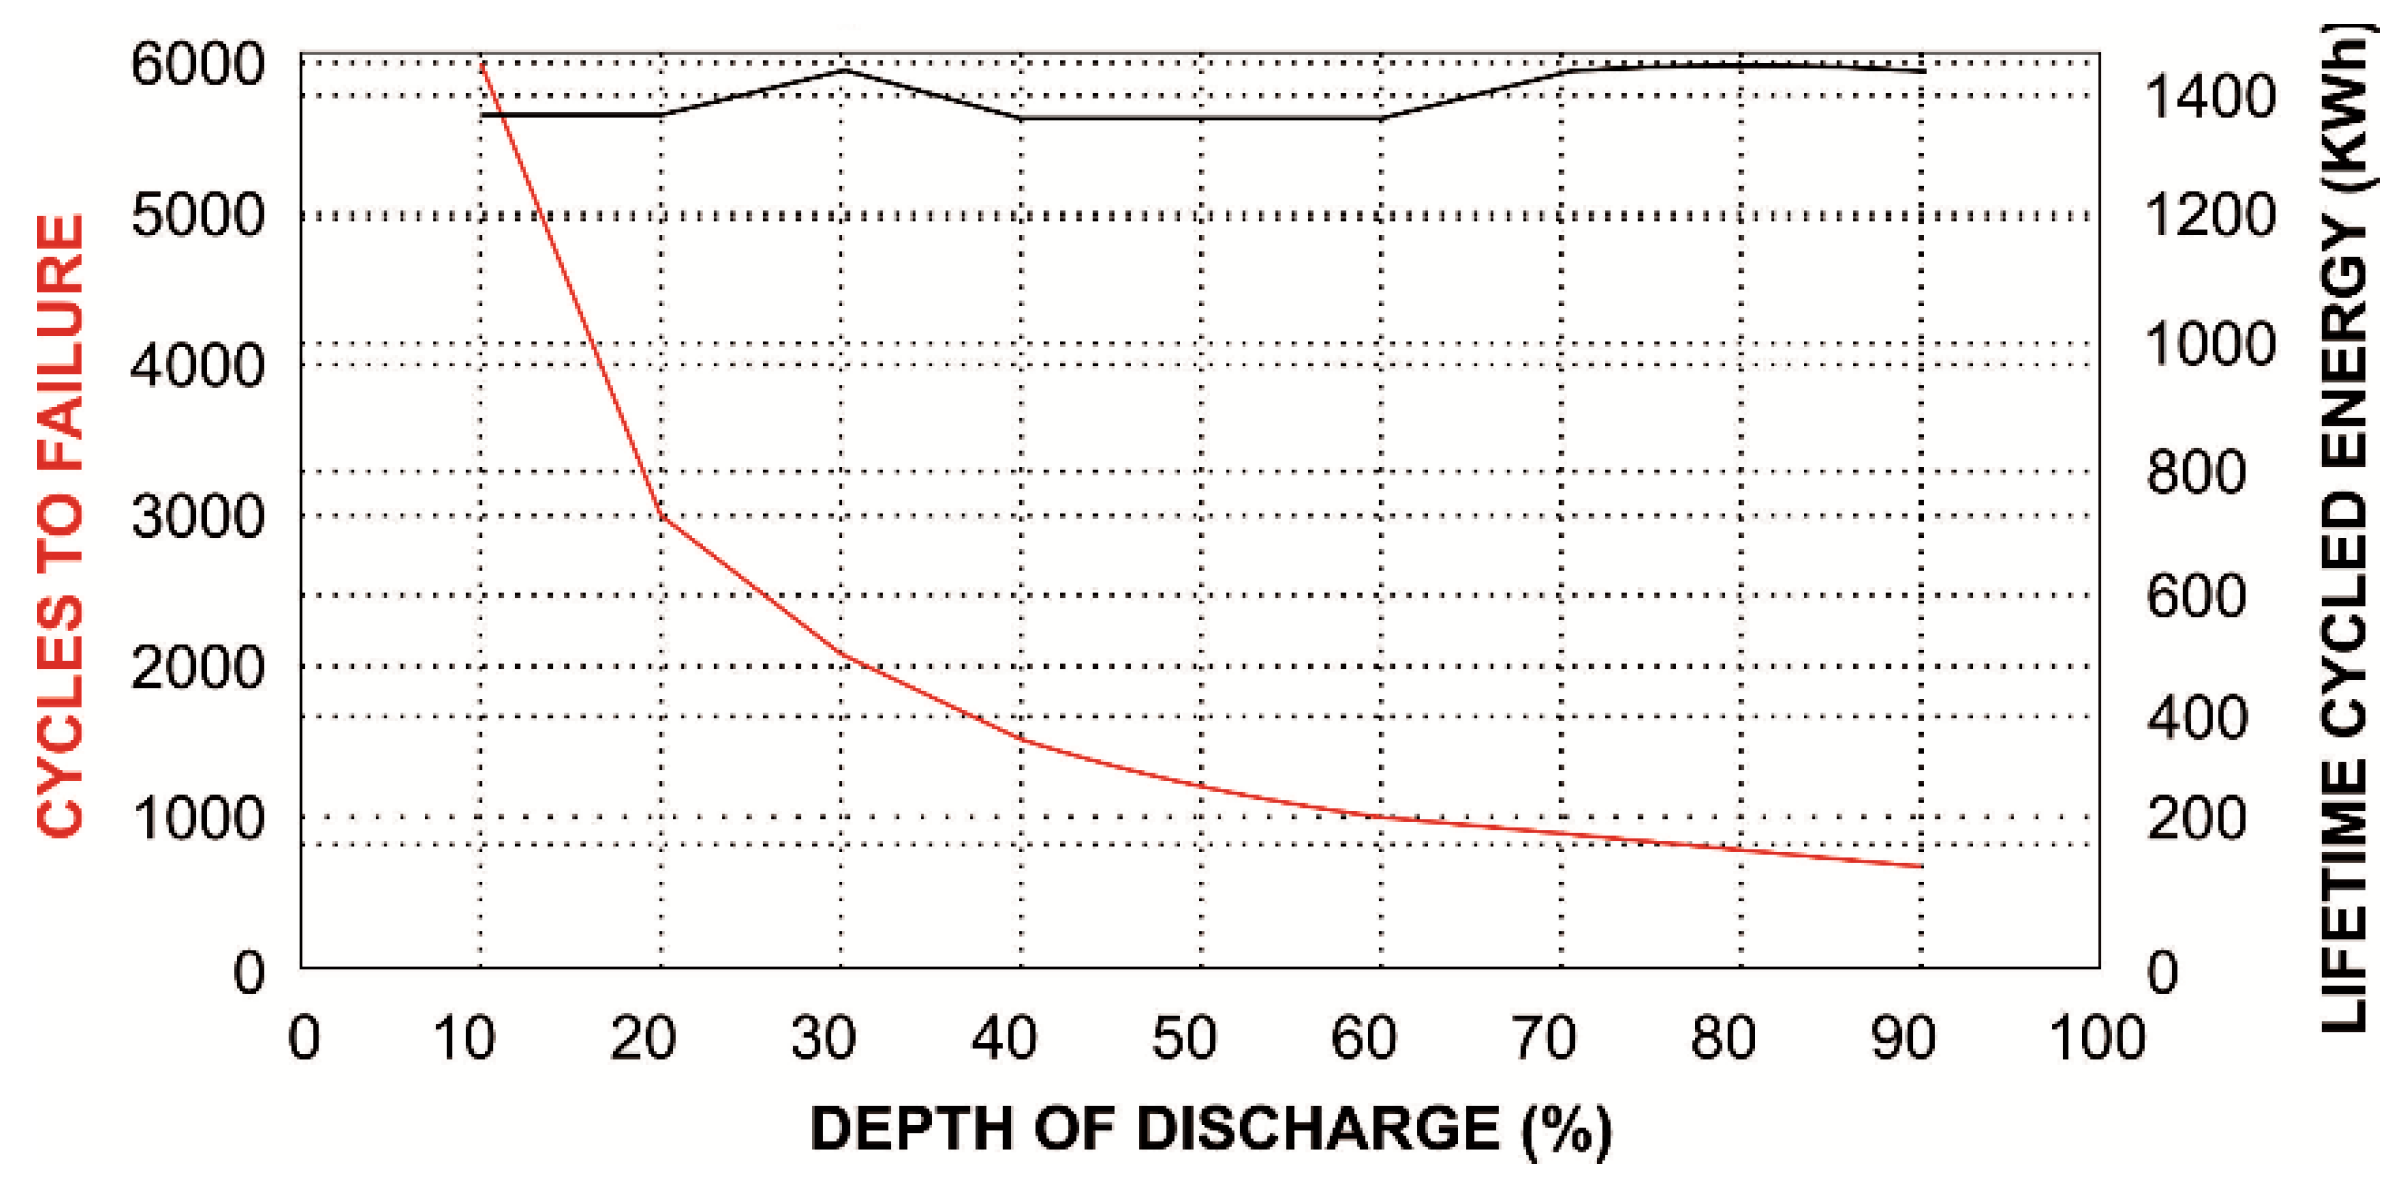
    The data shown in Figure 3 were provided for each battery for the number of life cycles to failure (Ciclesi) for each depth of discharge (DODi %), which are displayed in red [30,33].
    The simulation software used in this study calculated the cycled energy throughout the battery lifetime for each DOD. This value is displayed in gray.
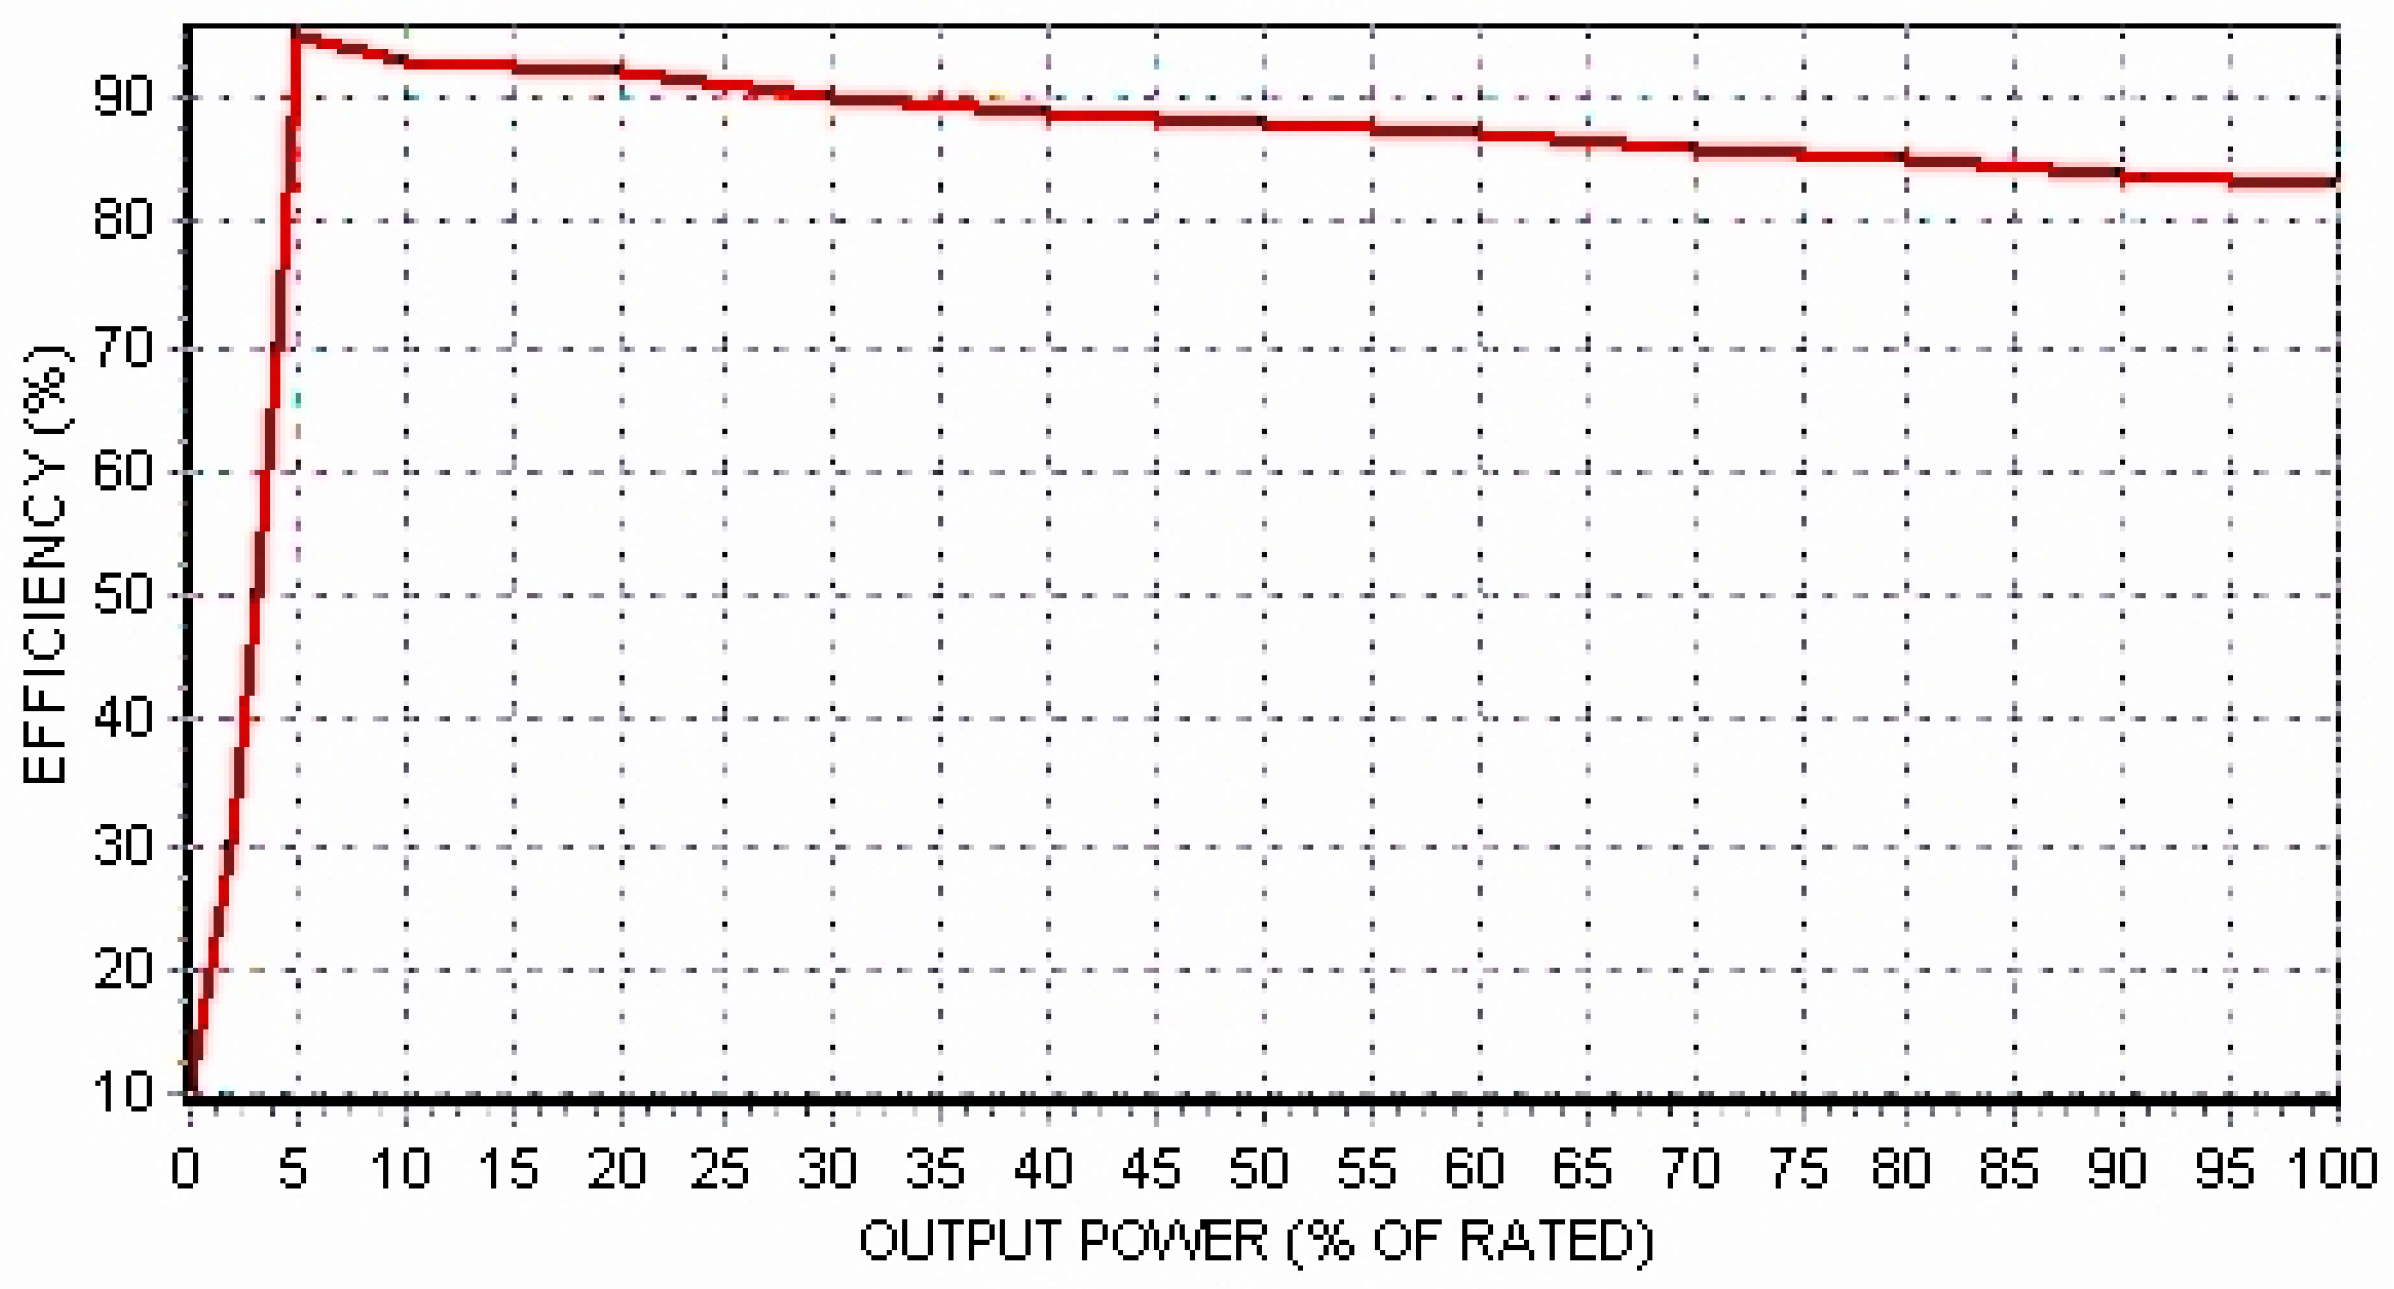
  • The inverter selected for the solar system operation was a 900 VA inverter. Its main characteristics are shown in Table 4 and its efficiency diagram in Figure 4 [30]. The average power was 40% of the rated power of the selected inverter and the average efficiency considered was 88.9%.

2.4. Analytical Description

The power generated by the photovoltaic panels was calculated using Equation (1):
P P V = G i · I S C · F P · U D C
where PPV is power generated by the PV (kWp), Gi is the hourly solar irradiation (kW/m2), ISC is the short-circuit current (A), Fp is the factor of loss compensation by power due to shading, and UDC is the DC voltage generated by the PV (V) [33,34].
The surface size of the photovoltaic panels was calculated according to the manufacturer’s standard dimensions, specified in Table 1 with Equation (2):
A P V _ t o t a l = N P V · A P V
where APV_total is the size of the PV generator (m2), NPV is the number of PV modules needed to obtain the energy ensuring full load coverage during the worst month, and APV is the standard size of the PV unit (m2) [33,34].
The capacity of the solar energy system storage battery pack was determined based on the maximum load demand, calculated with Equation (3) as follows:
C B = 1000 · T · L max N d a y s · V s
where CB is the capacity of the storage battery pack (Ah), T is the time of autonomy needed (days), Lmax is the maximum load demand (kWh), Ndays is the number of days in the worst month, and Vs is the bus nominal voltage (V) [35].
The cycled energy throughout the battery’s lifetime is expressed as:
E c y c l e d _ i = D O D i 100 · C y c l e s i 1000 · C n · V n
where DODi is the depth of discharge (%), Cyclesi is the number of life cycles to failure, Cn is the nominal capacity (Ah), and Vn is the nominal voltage (V) [33].
The number of equivalent cycles is calculated as:
N e q _ c y c l e s = 1000 · E c y c l e d _ a v e r a g e V n · C n
where:
E c y c l e d _ a v e r a g e = E c y c l e d _ i 9
The terms in Equations (5) and (6) have similar meanings as in previous reports [33,34].

2.5. Virtual Simulation Condition

The optimization process had mainly two major components: Choosing the optimal components of the energy system (which was done using the multicriteria analysis methods [19,20,31] and constituted input data for the iHOGA software tool [30]) and optimization with simulation in operation of the energy system (which was done using the software tool).
Computational simulations were conducted with iHOGA software version 2.4 [30], which used the input data presented in the previous sections and supplied information regarding the energy, environmental, and economic performance of the solar energy system during one year of operation and financial performance for a 25-year lifetime.
iHOGA version 2.4 [30] is a computer tool for the optimum dimensioning of hybrid installations, including solar, wind, and hydraulic renewable energies, together with support systems, based on storage (batteries), back-up generators (AC generators), and fuel cells (combined with electrolyser and hydrogen tanks). To achieve this, the software uses genetic algorithms that obtain the optimal combination of components and control strategies [30,33,34].
The optimization type was multi-objective [30,36,37] and conditions were chosen to minimize the following criteria [38]: Uncovered load/operation in stand-alone mode, CO2 emissions, total system cost, excess energy, and power nominal/equipment components reported for ensuring energy demand.
The solar energy system has to be the appropriate size to ensure the charging station always has enough electricity to supply several electric vehicles throughout all 24 h of a day [39].
In this study, load following control strategy was adopted [30,33,34]. In this case, the operation principle of the solar energy system is based on two conditions. (1) If the power generated from renewable sources with photovoltaic panels is greater than the energy demand of the EV charging station, then the excess energy is stored in the battery. (2) If the power generated from the solar resources is less than the energy demand, energy from the battery will be used.

3. Results and Discussion

The performance of the solar energy system of the EV charging station was evaluated through the following indicators [40]: (1) Technical indicators included energy balance over one year of operation, monthly and annual average power, monthly energy for the charging station, hourly simulation results for a day with poor availability of solar radiation, and for a day with very good availability of solar radiation; (2) the environmental indicator was CO2 emissions; and (3) the financial indicators included the cost of the initial investment, total system cost over an operating period of 25 years, and the levelized cost of energy production for the solar system.

3.1. Optimally Configured System Components

Based on input data, mathematical equations, and the computational simulations presented in the previous sections, the optimum configuration of the solar energy system was established.
Photovoltaic panels, which are the primary equipment required for renewable energy conversion with a nominal power of 280 Wp, were wired with two in series x 14 in parallel, resulting in a total installed power of 7.84 kWp. The total installation surface of the photovoltaic panels was 45.65 m2.
Lead-acid batteries—the primary solar energy storage component, with a nominal capacity of 189 Ah—were installed with four in series x eight in parallel, resulting in a total battery bank energy of 72.5 kWh. The total weight of the batteries was 1824 kg; the number of full equivalent cycles was 614.4 with a six-day autonomy.
A 900 VA inverter was used in the solar energy system of the EV charging, which was useful for using excess electricity in other types of applications (electric outlet, lighting, etc.).

3.2. Energy Performance

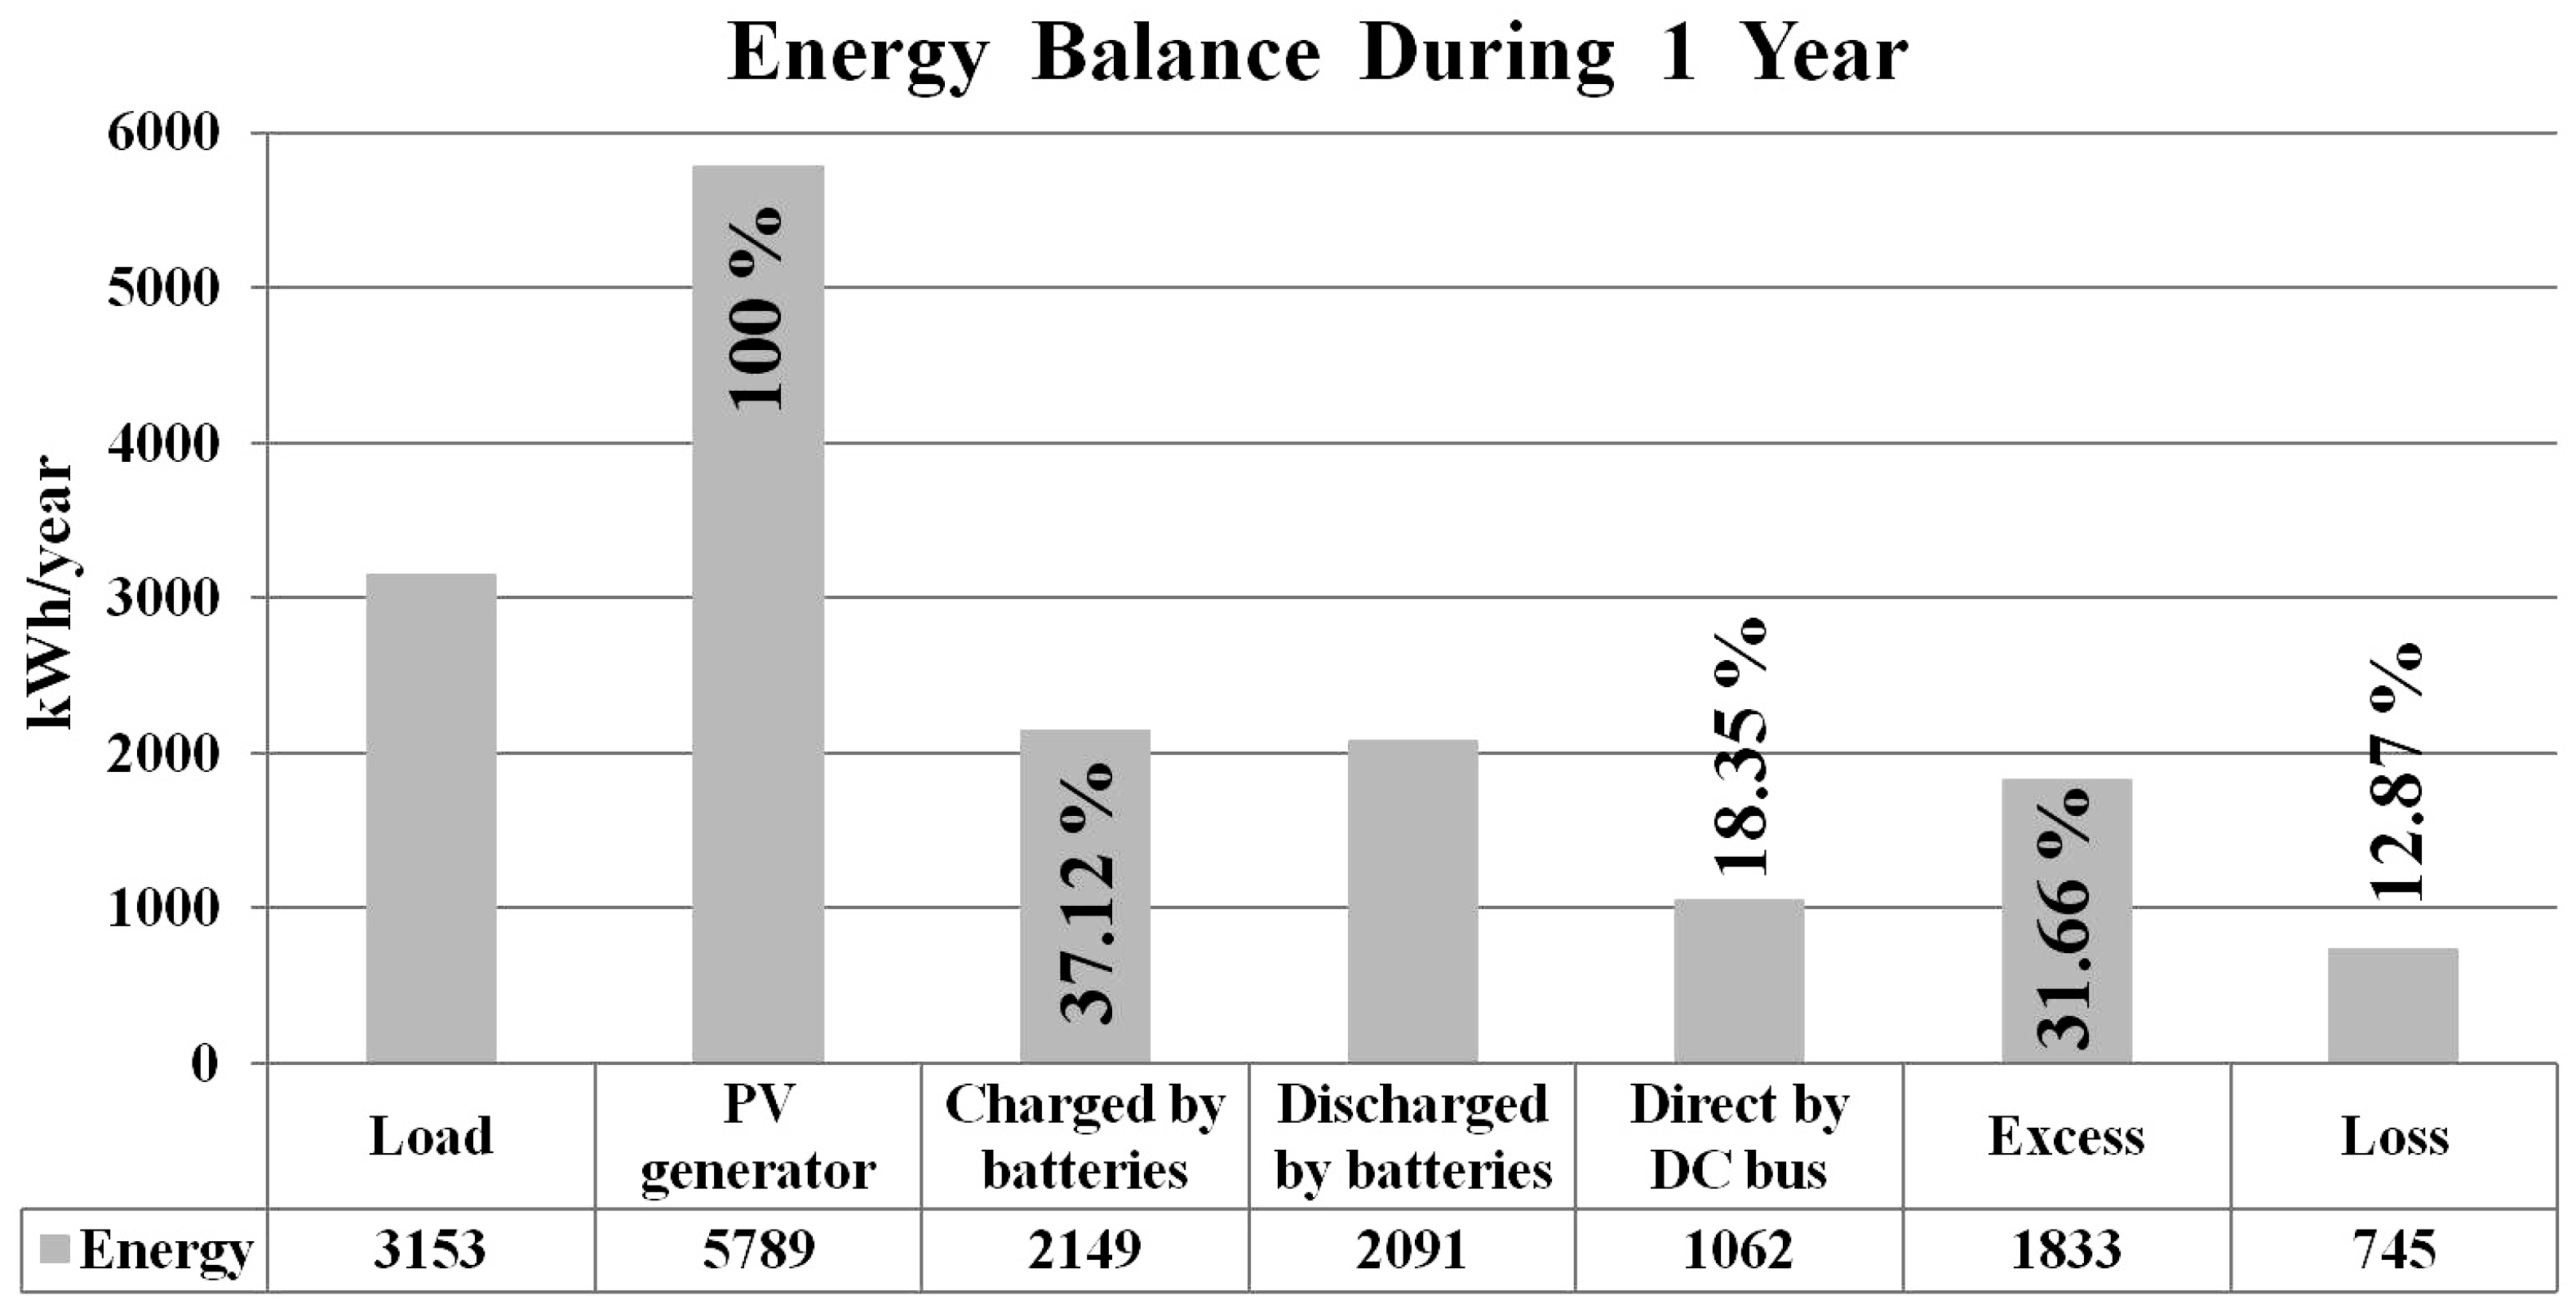
The energy balance of the photovoltaic system is illustrated in Figure 5. For continuous use of the charging station for 24 h per day, for one year of operation, the photovoltaic panels generated a total energy of 5789 kWh/year. From the energy obtained by the solar system, 37.12% was charged into the batteries, 18.35% was used directly via the DC bus by the charging station for electric vehicles, and 12.87% was lost due to the performance of the system components.
During the operation of the system, the excess of energy was 1833 kWh/year, which represented 31.66% of the total PV production. The excess energy could be harnessed either in the charging station by adding storage batteries for EV charging, in the maintenance of the charging station, or for other types of applications [41], such as lighting, charging electronic devices, agricultural activities, electricity supply for irrigation, and greenhouses [42], which generate additional costs, either by injecting electricity into the grid network if possible.
The photovoltaic system of the EV charging station analyzed in this paper can operate in standalone mode, being 100% powered by solar energy resources.
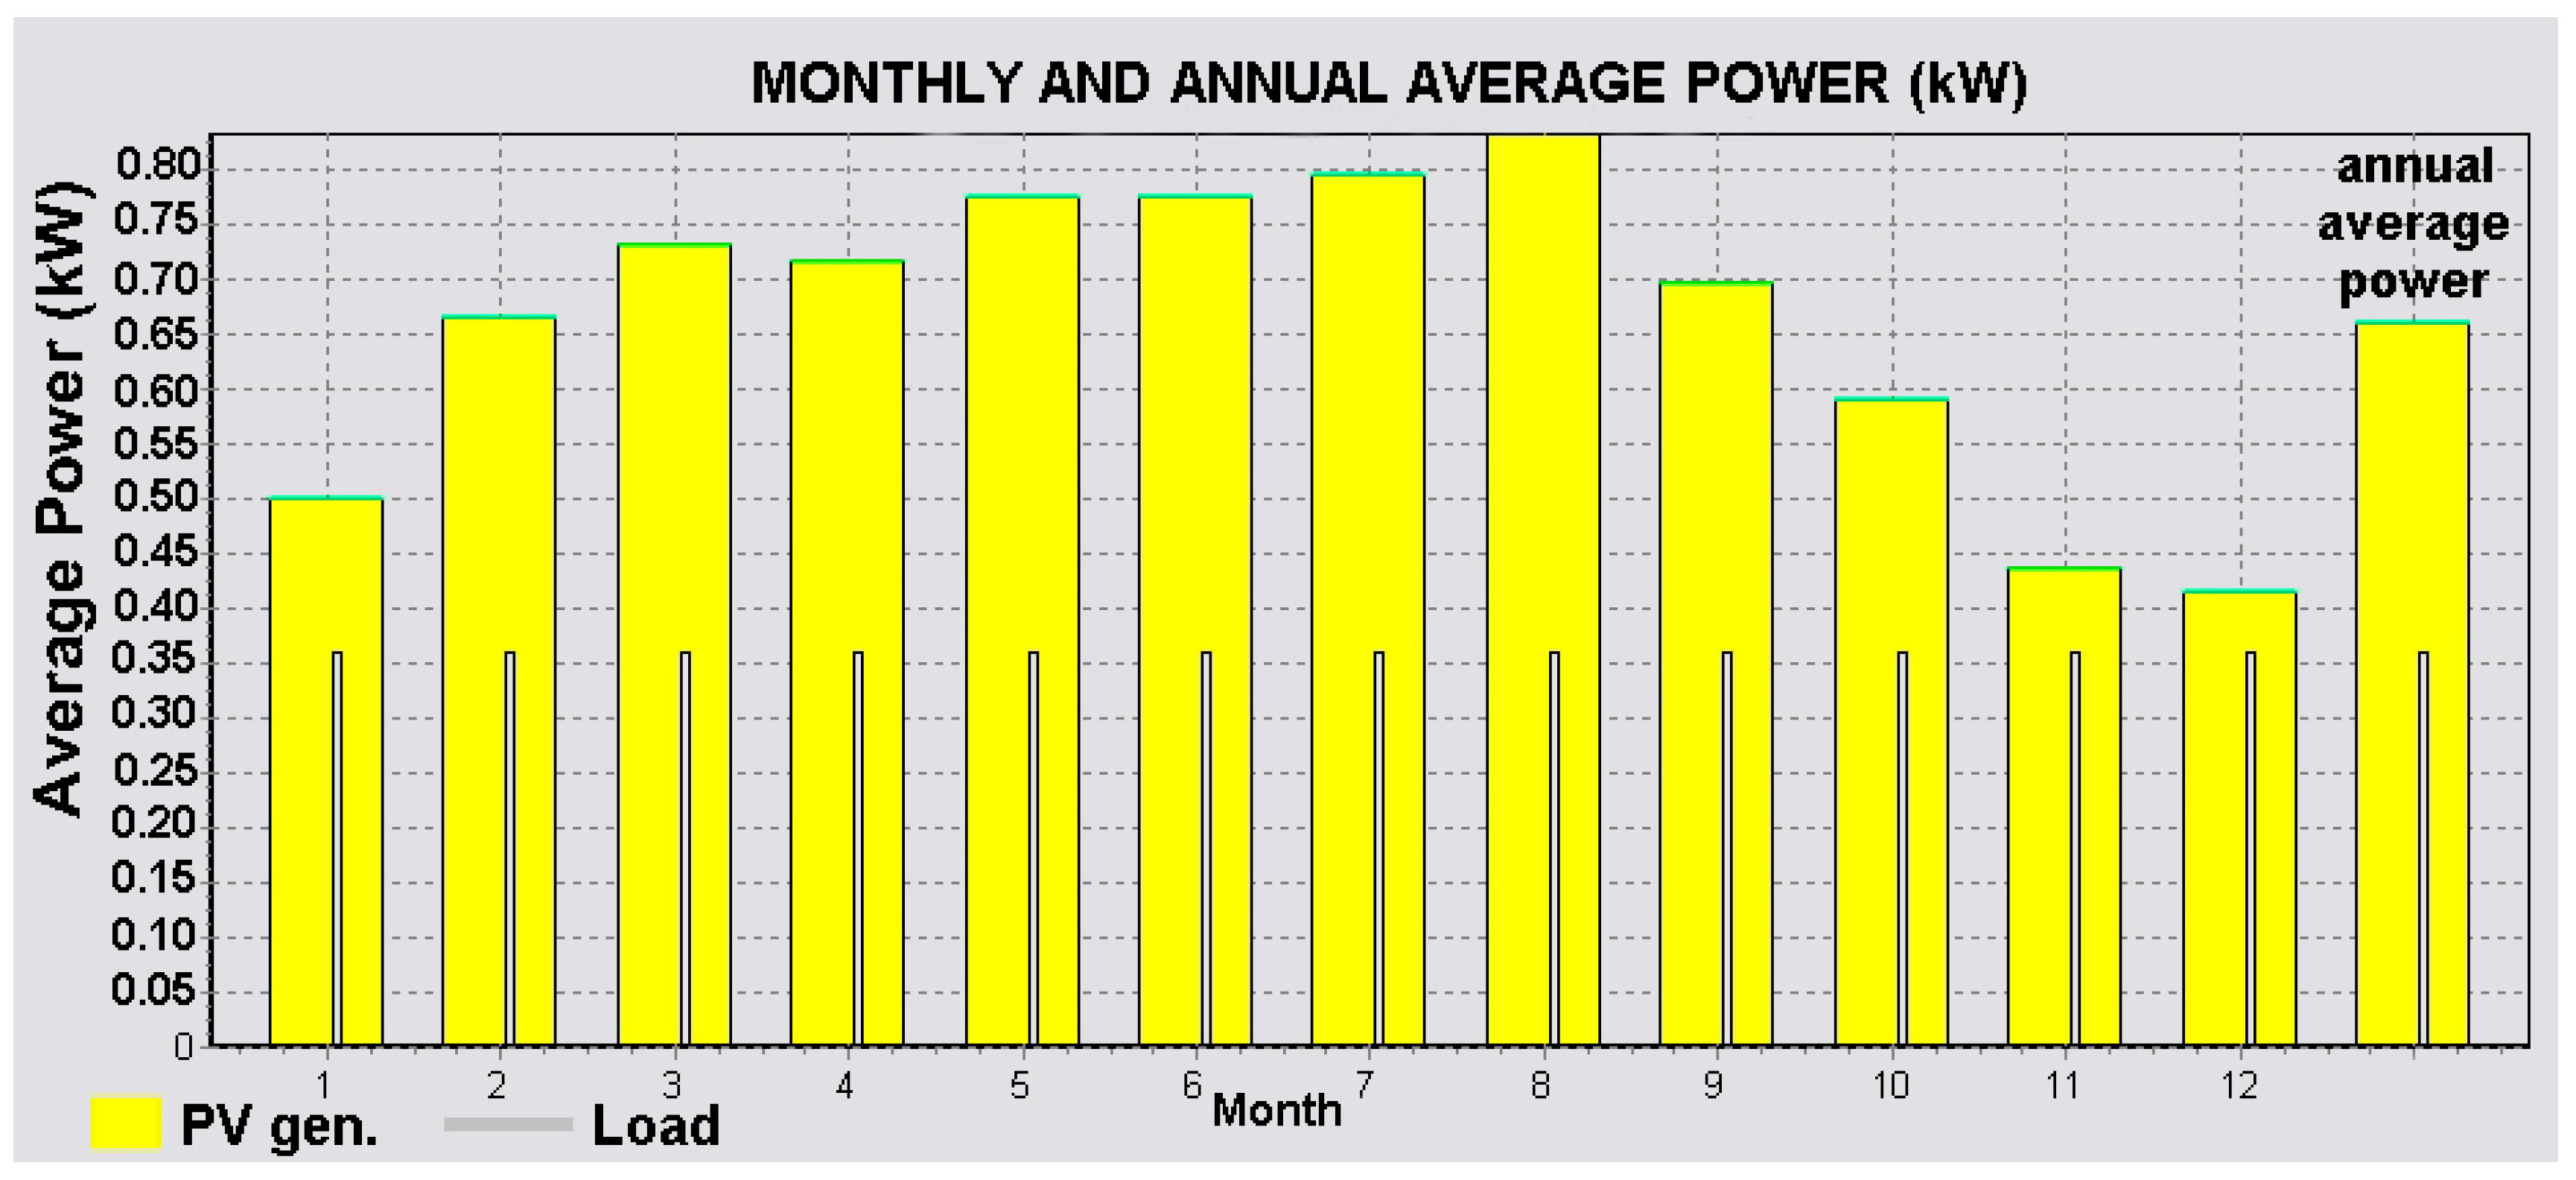
Figure 6 shows the monthly and annual average output power of the solar system. Although solar irradiation on the horizontal surface was at its maximum in June and July, the most advantageous month for output power was August due to the average monthly sunshine duration shown in Table 1, with a monthly average power value of 843 W. The worst month for output power was December, with a monthly average power value of 416 W. The rest of the months had intermediate average power values, and the annual average power, which was created by the system, was 657 W.
The results of the solar charging simulations for one of the sunny days in August (considered the most favorable month of the year based on system operation analysis) are presented in Figure 7.
For the sunniest day in August, sun irradiation was available between 6:00 a.m. and 9:00 p.m., with maximum values between 12:00 p.m. and 3:00 p.m.—the period during which photovoltaic panels generate power for the direct supply of the EV consumer, as well as for storage in batteries in order to meet the energy demands of the charging station for times with low availability of solar irradiation, such as cloudy days and at night. Additionally, the energy excess on this day could be harnessed by injection into the public electricity distribution network if there is a connection to it, used in other types of applications [41,42,43]; or be used in isolated areas that do not have access to the grid.
According to the established input data, the maximum hourly DC active power load of 360 W had a constant load profile throughout the day. This charge station power requirement was 100% directly supplied by the DC bus between 8:00 a.m. and 7:00 p.m., was supplied in mixed mode from the DC bus and energy stored in battery between 6:00 and 8:00 a.m. and 7:00 and 9:00 p.m. due to low solar irradiation, and between 9:00 p.m. and 6:00 a.m. due to being in night mode. The energy demands on the EV charging station was 100% assured by the energy stored in the batteries. The storage of solar energy in the batteries for use in the night mode is made in the interval from 8:00÷14:00, and between 12:00÷19:00 the excess energy was generated.
The results of the simulations obtained for one of the most unfavorable days in December are presented in Figure 8.
For this period, solar irradiation was available between 8:00 a.m. and 5:00 p.m., with maximum power output between 12:00 and 1:00 p.m.—the period during which photovoltaic panels generate power for the direct supply of the EV consumer, as well as for storage in batteries in order to meet the energy demand of the charging station during low solar availability periods and nocturnal mode, without producing excess energy.
The power station load required was 100% directly supplied by the DC bus between 9:00 a.m. and 4:00 p.m. Solar energy was stored in the batteries for use at night. Between 8:00 and 9:00 a.m. and 3:00 and 4:00 p.m., due to low solar irradiation, the power to the EV charging station was supplied in mixed mode—DC bus and energy stored in batteries—and from 17:00 to 8:00, the energy demand was 100% supplied by the energy stored in the batteries.
Figure 9 presents the monthly energy used by the EV charging station.
In December, considered the worst month in terms of solar irradiation, 82.51% of the energy demand was provided by the solar energy batter and only 17.49% came directly from the PV generator via the DC bus.
In June, the best month in terms of solar irradiation, 51.70% of the energy demand was provided by discharged energy from the batteries and 48.30% was supplied directly from the PV generator via the DC bus.

3.3. Environmental Performance

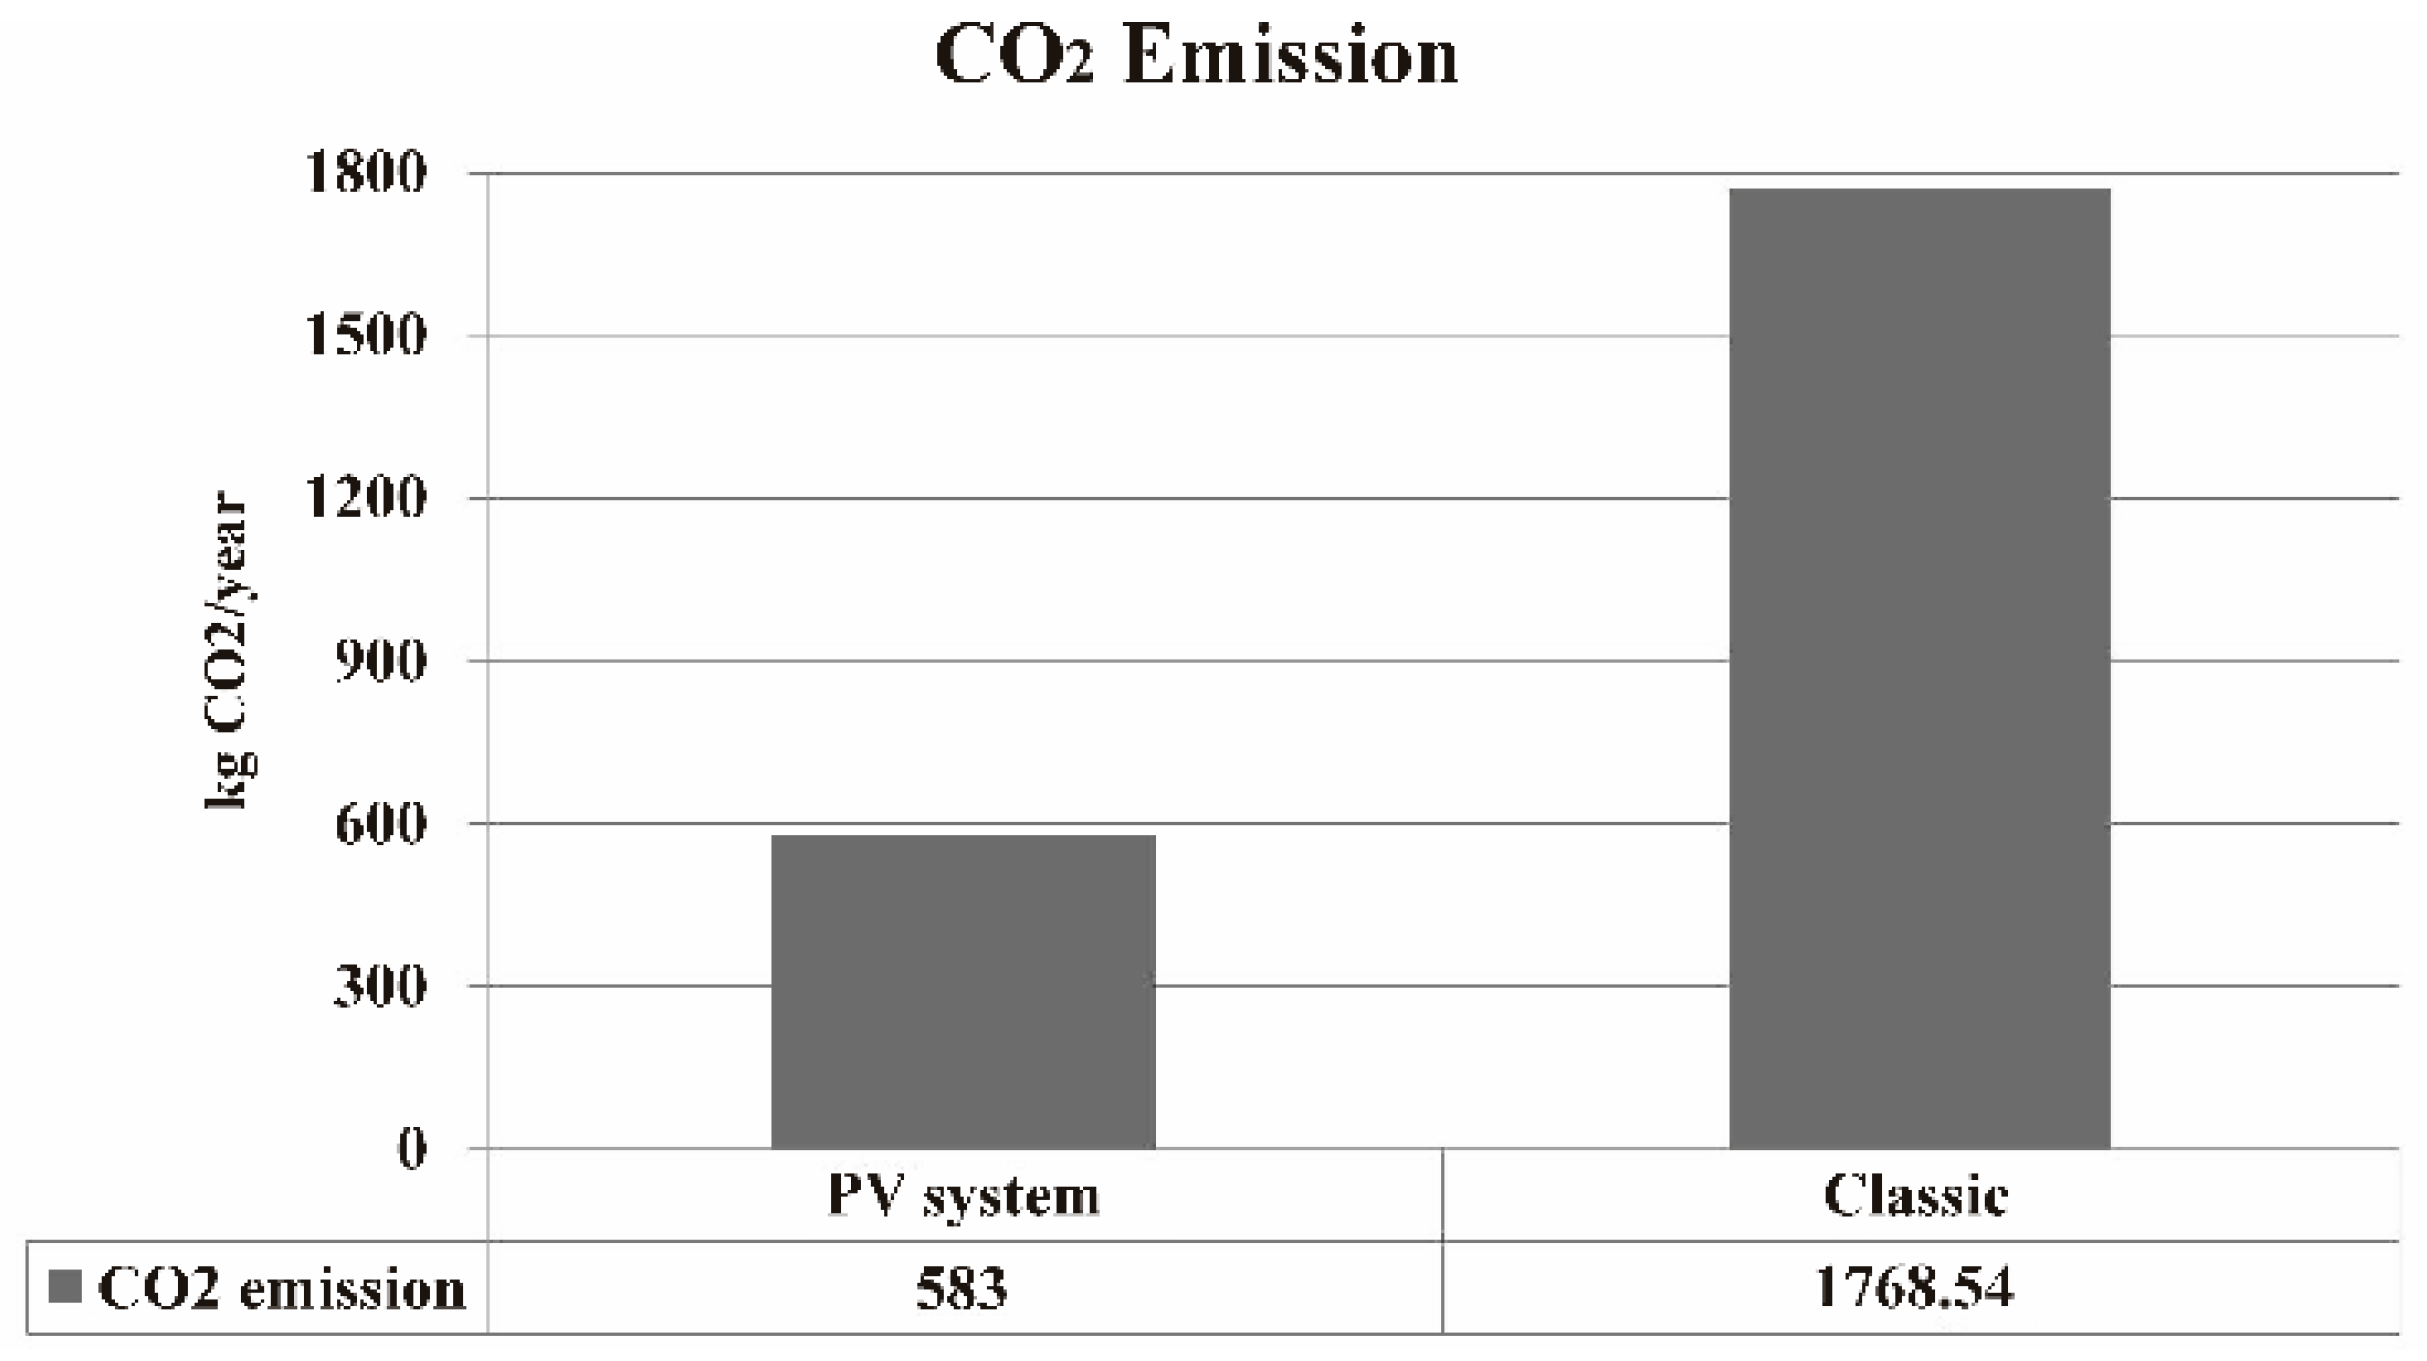
During the one-year operation, the proposed PV system produced 5789 kWh/year, generating a total CO2 emission embedded into 583 kgCO2/year. The amount of pollutants refers only to the CO2 emissions of the system, as no further emissions were produced from the PV generator operation.
In 2017 in Romania, the classic system produced 1 kWh of energy with 0.3055 kgCO2/kWh [44]. To produce the same amount of electricity as in the PV system, the classic system would generate 1768.54 kgCO2. The values are graphically illustrated in Figure 10.
We found that CO2 emissions from the PV system were 67.04% lower than the electricity produced from classical methods.
This concept of energy supply with photovoltaic panels on a charging station, alongside electric vehicles, enriches the quality of life and human health and corresponds to the well-being standard concept. This system can also be implemented in green cities and protected natural areas where there are regulated instruments that provide important opportunities for sustainable economic development [39], both through attracting funds and efficient economic management for the benefit of both people and nature.

3.4. Financial Performance

The initial investment was calculated as €13,767, and this represents the initial cost of all the system components (photovoltaic panels, batteries, and ancillary components), as well as the initial costs of execution, installation, and commissioning.
The levelized cost of energy, defined as the ratio between the total annual cost of the electricity generation system and the total annual electricity generated by the system, was 0.17 €/kWh. The final price for 1 kWh of electricity provided by the national distribution network in Romania was 0.11 €/kWh, being one of the lowest prices in the European Union, where a maximum of 0.30 €/kWh has been recorded in Denmark, 0.29 €/kWh in Germany, and an average in France of 0.15 €/kWh [45].
Notably, the unit price of energy in the photovoltaic energy system was 35.30% higher than the Romanian national energy system, respectively by 43.33% lower than the maximum value perceived by Denmark and 11.76% higher than the average final price for 1 kWh paid at EU level.
Power-generating technologies based on alternative energies are constantly being researched and developed. A number of pilot projects are currently underway in this field, so these systems will be validated and then implemented on a large scale, including energy storage solutions, so these costs are expected to decline in the near future. In addition, the government supports clean energy through a generous system of subsidies, with a number of rules being implemented at the national level that encourages the installation of small green energy production capacities [46] with renewable energy producers receiving these subsidies through the mandatory green certificates quota system.
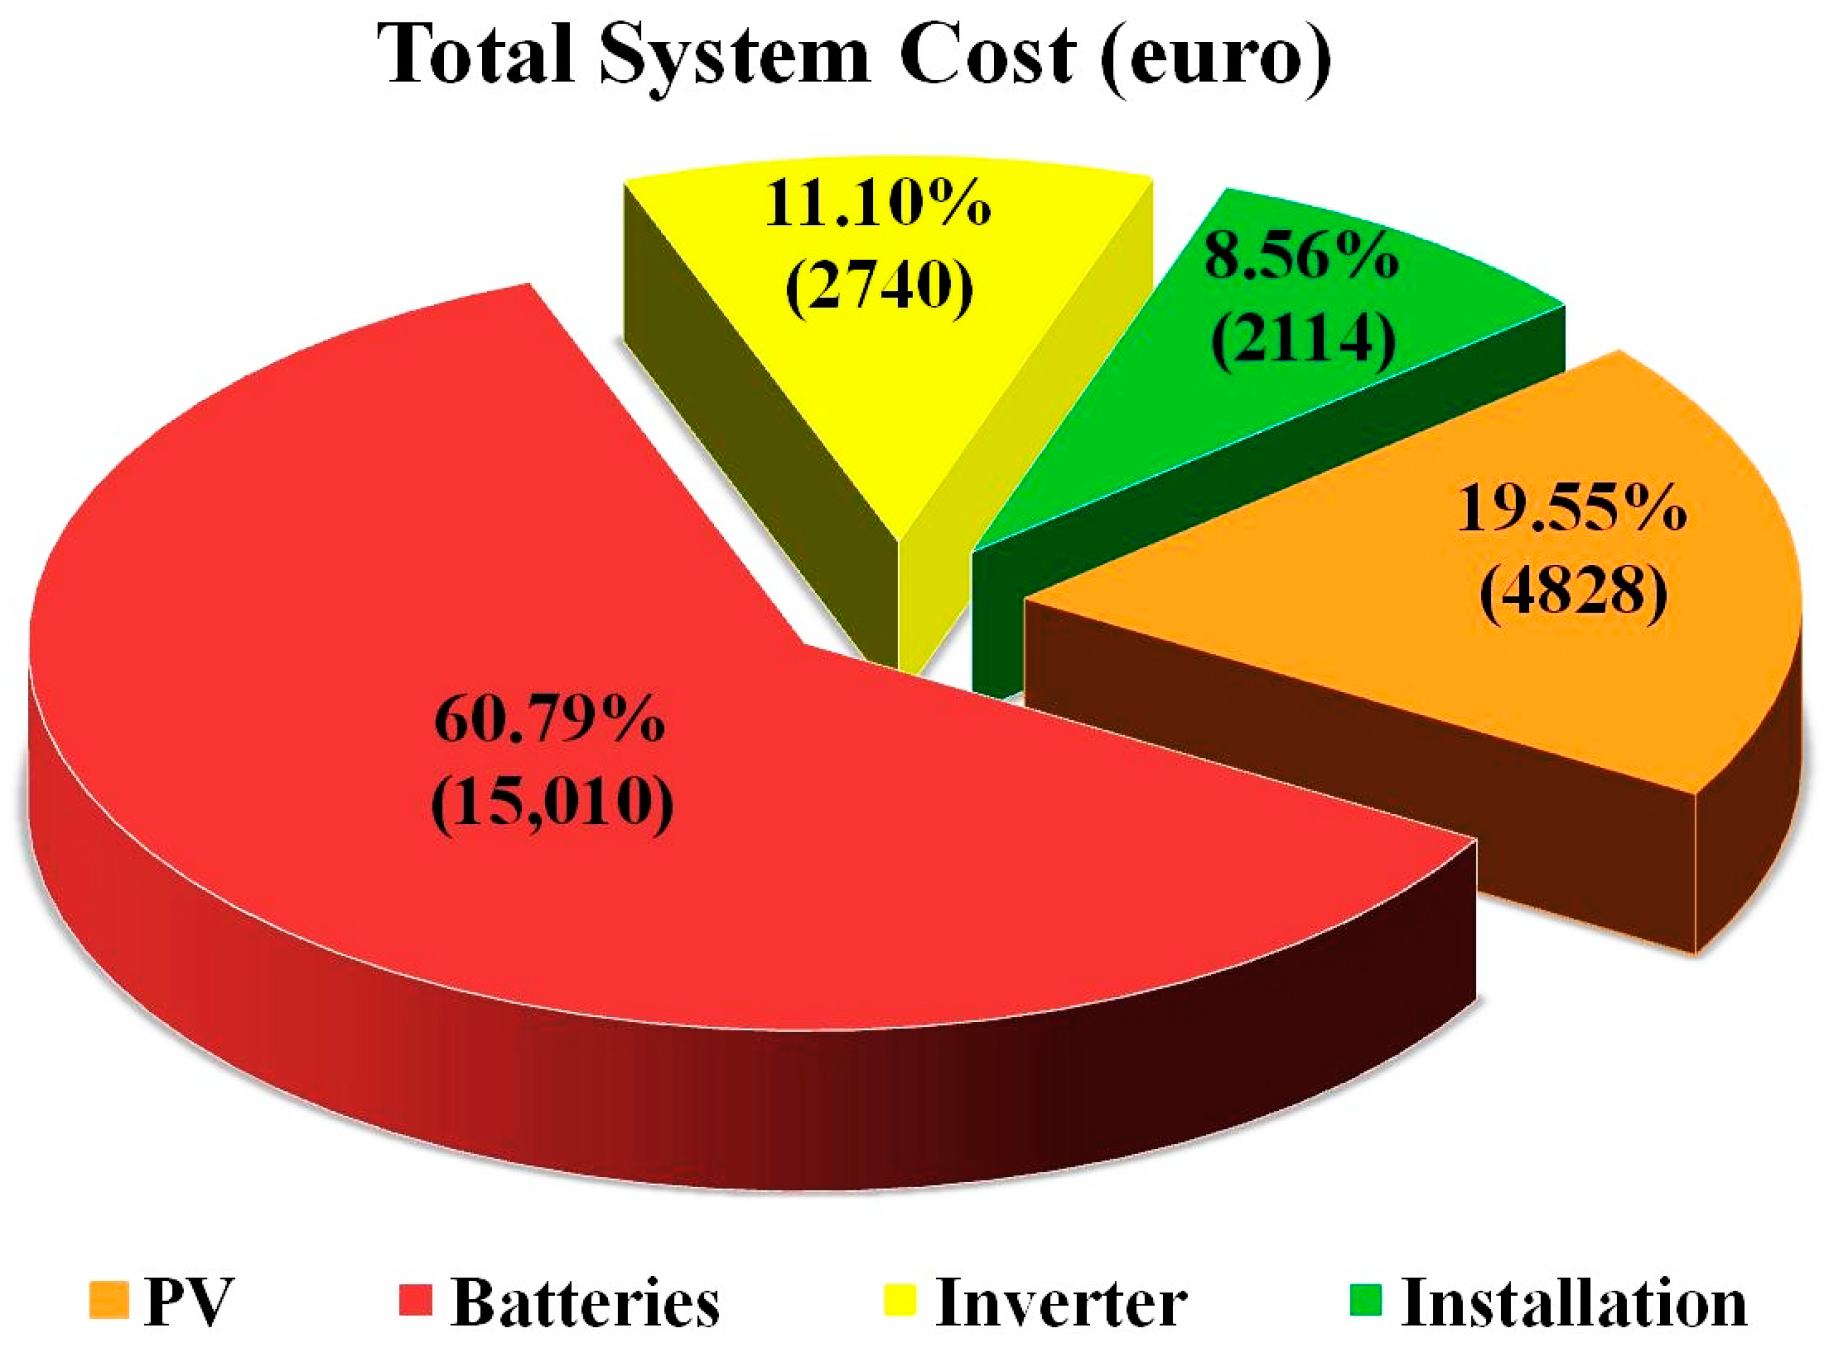
Total cost (Net Present Cost; NPC) is a global indicator that includes the initial cost, operating costs, maintenance and replacement of component equipment costs, and other costs that occur for the entire 25-year lifespan of the system. Therefore, a total cost of €24,692 for the photovoltaic system of the EV charging station was calculated.
From Figure 11, the biggest share of the costs was the battery bank, which accounted for 60.79% of the total cost; followed by the solar energy conversion technology (PV generator), which represented 19.55% of the total cost; the inverter represented 11.10%; and the installation costs accounted for 7% of the NPCs.

4. Conclusions

We examined the possibility of using solar energy resources to provide energy support for an EV charging station, as a starting point to demonstrate the usefulness of the technology presented in mobile applications (electromobility), both for areas with a connection to the public electricity supply network, as well as for isolated areas without a connection to the electricity distribution network.
The simulations were conducted using iHOGA 2.4. [30] software (improved hybrid optimization by using genetic algorithms) for the simulation and optimization of standalone electric power generation systems based on renewable energies.
The solar system of the EV charging station presented in this paper can operate in an isolated mode using 100% renewable energy. The total surface occupied by the installed solar panels was 45.65 m2. A simulation was performed, considering that several vehicles are charged consecutively using the photovoltaic station at its full capacity for the whole day. The photovoltaic panels generated a total of 5789 kWh/year, and 55.47% of the energy was used for charging the station and 44.53% was the excess energy and the loss of the energy system.
The most advantageous month for output power was August, with a monthly average power value of 843 W and the worst month for output power was December, with a monthly average power value of 416 W. The rest of the months had an intermediate average power value of 657 W.
The environmental performance evaluation, in this situation, refers to the CO2 emissions due to the process of obtaining electricity. The emissions from the photovoltaic system were 67.04% lower than the electricity produced by classical methods.
Financial performances refer to the following parameters: An initial cost of 13,767 Euros, a net present cost of 24,692 Euros and the levelized cost of 0.17 Euro/kWh.
The results obtained from this study may be useful on a large scale, highlighting the premises and tools for sizing and designing the EV charging station infrastructure powered by solar resources in Romania or other parts of the world, given that solar renewable energy is virtually an inexhaustible source of energy.

Author Contributions

The following statements should be used “Conceptualization, G.B. and C.F.; Methodology, M.S.R.; Software, R.-A.F.; Validation, G.B., R.-A.F. and M.S.R.; Formal Analysis, M.C.; Investigation, M.I.; Resources, C.F.; Data Curation, C.F.; Writing-Original Draft Preparation, R.-A.F.; Writing-Review & Editing, M.V.; Visualization, M.V.; Supervision, G.B.; Project Administration, R.-A.F.; Funding Acquisition, M.S.R.

Acknowledgments

This work was supported by a grant from the Romanian Ministry of Research and Innovation, CCCDI-UEFISCDI, project number PN-III-P1-1.2-PCCDI-2017-0776/No. 36 PCCDI/15.03.2018, within PNCDI III.

Conflicts of Interest

The authors declare no conflicts of interest.

Nomenclature

AbbreviationDefinition
ACAlternating current
APVStandard size of photovoltaic panel unit
APV_totalSize of the photovoltaic panels generator
CBCapacity of storage battery pack
CnNominal capacity
CO2Carbon dioxide
CsAverage solar constant
DCDirect current
DODiBattery depth of discharge
ECEuropean Commission
Ecycled_averageAverage cycled energy for batteries
Ecycled_iCycled energy throughout battery lifetime
EUEuropean Union
EVElectric vehicle
FpFactor of losses compensation by power due to shading
GiHourly solar irradiation
iHOGAimproved Hybrid Optimization by Genetic Algorithms
ISCShort–circuit current
LmaxMaximum load demand
NdaysNumber of days in the worst month
Neq_cyclesNumber of equivalent cycles for batteries
NPCNet Present Cost
NPVNumber of photovoltaic panels modules needed to obtain the energy ensuring full load coverage during the worst month
PHEVPlug-in hybrid electric vehicle
Pmax_renMaximum input power from the photovoltaic generator
PPVPower generated by photovoltaic panels
PVPhotovoltaic panel
SOCBattery state of charge
TTime of autonomy needed
UDCVoltage DC generated by photovoltaic panels
VDCVoltage Sourced Converter
VSCVoltage Sourced Converter
VnNominal voltage
VsBus nominal voltage

References

  1. Acordul de la Paris privind schimbările climatice a intrat în vigoare Cititi mai multe pe. Available online: http://www.investenergy.ro/acordul-de-la-paris-privind-schimbarile-climatice-intrat-vigoare/ (accessed on 26 December 2018).
  2. Strategia Energetică a României 2016–2030, cu perspectiva anului 2050. Available online: http://www.mmediu.gov.ro/app/webroot/uploads/files/2017-03-02_Strategia-Energetica-a-Romaniei-2016-2030.pdf (accessed on 26 December 2018).
  3. European Commission. Clean Energy for All. 30 November 2016. Available online: https://eur-lex.europa.eu/legal-content/EN/TXT/?qid=1512481277484&uri=CELEX:52016DC0860 (accessed on 26 December 2018).
  4. Biresselioglu, M.E.; Kaplan, M.D.; Yilmaz, B.K. Electric mobility in Europe: A comprehensive review of motivators and barriers in decision making processes. Transp. Res. Part A Policy Pract. 2018, 109, 1–13. [Google Scholar] [CrossRef]
  5. Shareef, H.; Islam, M.M.; Mohamed, A. A review of the stage-of-the-art charging technologies, placement methodologies, and impacts of electric vehicles. Renew. Sustain. Energy Rev. 2016, 64, 403–420. [Google Scholar] [CrossRef]
  6. Aschilean, I.; Varlam, M.; Culcer, M.; Iliescu, M.; Raceanu, M.; Enache, A.; Raboaca, M.S.; Rasoi, G.; Filote, C. Hybrid Electric Powertrain with Fuel Cells for a Series Vehicle. Energies 2018, 11, 1294. [Google Scholar] [CrossRef]
  7. Loisel, R.; Pasaoglu, G.; Thiel, C. Large-scale deployment of electric vehicles in Germany by 2030: An analysis of grid-to-vehicle and vehicle-to-grid concepts. Energy Policy 2014, 65, 432–443. [Google Scholar] [CrossRef]
  8. Tie, S.F.; Tan, C.W. A review of energy sources and energy management system in electric vehicles. Renew. Sustain. Energy Rev. 2013, 20, 82–102. [Google Scholar] [CrossRef]
  9. Oda, T.; Aziz, M.; Mitani, T.; Watanabe, Z.; Kashiwagi, T. Mitigation of congestion related to quick charging of electric vehicles based on waiting time and cost–benefit analyses: A japanese case study. Sustain. Cities Soc. 2018, 36, 99–106. [Google Scholar] [CrossRef]
  10. Sujitha, N.; Krithiga, S. RES based EV battery charging system: A review. J. Renew. Sustain. Energy Rev. 2017, 75, 978–988. [Google Scholar] [CrossRef]
  11. Deb, S.; Tammi, K.; Kalita, K.; Mahanta, P. Impact of Electric Vehicle Charging Station Load on Distribution Network. Energies 2018, 11, 178. [Google Scholar] [CrossRef]
  12. Zhang, W.; Zhang, D.; Mu, B.; Wang, L.Y.; Bao, Y.; Jiang, J.; Morais, H. Decentralized Electric Vehicle Charging Strategies for Reduced Load Variation and Guaranteed Charge Completion in Regional Distribution Grids. Energies 2017, 10, 147. [Google Scholar] [CrossRef]
  13. Ministry of Energy. The National Market Policy Framework for Alternative Fuels in the Transport Sector and the Installation of Relevant Infrastructure in Romania. Available online: http://www.mmediu.ro/app/webroot/uploads/files/Cadrul-National-de-Politica_Combustibilii-Alternativi-in-Sectorul%20Transporturilor%281%29.pdf (accessed on 26 December 2018).
  14. Miljanic, Z.; Radulovic, V.; Lutovac, B. Efficient Placement of Electric Vehicles Charging Stations using Integer Linear Programming. Adv. Electr. Comput. Eng. 2018, 18, 11–16. [Google Scholar] [CrossRef]
  15. Nicolaica, M.O.; Tarniceriu, D. Analysis Platform for Energy Efficiency Enhancement in Hybrid and Full Electric Vehicles. Adv. Electr. Comput. Eng. 2016, 16, 47–52. [Google Scholar] [CrossRef]
  16. Erickson, L.E.; Robinson, J.; Brase, G.; Cutsor, J. Solar Powered Charging Infrastructure for Electric Vehicles: A Sustainable Development; CRC Press, Taylor&Francis Group: Boca Raton, FL, USA, 2017. [Google Scholar]
  17. Yao, L.; Damiran, Z.; Lim, W.H. Optimal Charging and Discharging Scheduling for Electric Vehicles in a Parking Station with Photovoltaic System and Energy Storage System. Energies 2017, 10, 550. [Google Scholar] [CrossRef]
  18. UEFISCDI, Project Number PN-III-P1-1.2-PCCDI-2017-0776/No. 36 PCCDI/15.03.2018, within PNCDI III, Grant from the Romanian Ministry of Research and Innovation, CCCDI. Available online: www.smile-ev.usv.ro (accessed on 27 December 2018).
  19. Naghiu, G.S.; Giurca, I.; Aschilean, I.; Badea, G. Comparative analysis on the solutions of hydrogen production using solar energy with and without connection to the power network. Procedia Technol. 2016, 22, 781–788. [Google Scholar] [CrossRef]
  20. Naghiu, G.S.; Badea, G.; Aschilean, I.; Giurca, I. Selecting the right photovoltaic system using the Entropy method. In Proceedings of the 9th International Management Conference “Management and Innovation for Competitive Advantage”, Bucharest, Romania, 5–6 November 2015; pp. 976–989. [Google Scholar]
  21. Felseghi, R.A.; Soimosan, T.M.; Safirescu, C.O.; Aschilean, I.; Roman, M.D.; Corsiuc, G.D. Estimation of hydrogen and electrical energy production by using solar and wind resources for a residential building from Romania. Appl. Mech. Mater. 2014, 656, 542–551. [Google Scholar] [CrossRef]
  22. Chandra, G.R.; Bauer, P.; Zeman, M. System design for a solar powered electric vehicle charging station for workplaces. Appl. Energy 2016, 168, 434–443. [Google Scholar] [CrossRef]
  23. Ye, B.; Jiang, J.; Miao, L.; Yang, P.; Li, J.; Shen, B. Feasibility Study of a Solar-Powered Electric Vehicle Charging Station Model. Energies 2015, 8, 13265–13283. [Google Scholar] [CrossRef] [Green Version]
  24. Goli, P.; Shireen, W. PV powered smart charging station for PHEVs. Renew. Energy 2014, 66, 280–287. [Google Scholar] [CrossRef]
  25. NASA Surface Meteorology and Solar Energy: RETScreen Data. Available online: https://gc21.giz.de/ibt/var/app/wp385P/2624/wp-content/uploads/bp-attachments/73044/NASA_Surface_meteorology_and_Solar_Energy__RETScreen_Data.pdf (accessed on 27 December 2018).
  26. Ashique, R.H.; Salam, Z.; Aziz, M.J.B.A.; Bhatti, A.R. Integrated photovoltaic-grid DC fast charging system for electric vehicle: A review of the architecture and control. Renew. Sustain. Energy Rev. 2017, 69, 1243–1257. [Google Scholar] [CrossRef]
  27. Petreus, D.; Daraban, S.; Cirstea, M. Modular Hybrid Energy Concept Employing a Novel Control Structure Based on a Simple Analog System. Adv. Electr. Comput. Eng. 2016, 16, 3–10. [Google Scholar] [CrossRef]
  28. Fathabadi, H. Novel solar powered electric vehicle charging station with the capability of vehicle-to-grid. Sol. Energy 2017, 142, 136–143. [Google Scholar] [CrossRef]
  29. The A-280P Ultra PV Module Data Sheet. Available online: http://atersa.com/en/products-services/photovoltaic-modules/ultra-line/ (accessed on 18 February 2018).
  30. Dufo-López, R.; Bernal-Agustín, J.L. iHOGA Software Version 2.4; Electrical Engineering Department, University of Zaragoza: Zaragoza, Spain, 2017. [Google Scholar]
  31. Naghiu, G.S.; Giurca, I.; Aşchilean, I.; Badea, G. Multicriterial analysis on selecting solar radiation concentration ration for photovoltaic panels using Electre-Boldur method. Procedia Technol. 2016, 22, 773–780. [Google Scholar] [CrossRef]
  32. Battery Trojan 12V:J185P of 189Ah Data Sheet. Available online: http://www.trojanbattery.com/products/deep-cycle-flooded/premium-line-flooded-2/ (accessed on 18 February 2018).
  33. Dufo-López, R. iHOGA Software Version 2.4.—User’s Manual; Electrical Engineering Department, University of Zaragoza: Zaragoza, Spain, 2017. [Google Scholar]
  34. Dufo-López, R.; Bernal-Augustin, J.L. Multi-objective design of PV-wind-diesel-hydrogen-battery systems. Renew. Energy 2008, 33, 2559–2572. [Google Scholar] [CrossRef]
  35. Vermaak, H.J.; Kusakana, K. Design of a photovoltaic-wind charging station for small electric Tuk-tuk in D. R. Congo. Renew. Energy 2014, 67, 40–45. [Google Scholar] [CrossRef]
  36. Zhou, W.; Lou, C.; Li, Y.; Lu, L.; Yang, H. Current status of research on optimum sizing of stand-alone hybrid solar-wind power generation systems. Appl. Energy 2010, 87, 380–389. [Google Scholar] [CrossRef]
  37. Hafez, O.; Bhattacharya, K. Optimal design of electric vehicle charging stations considering various energy resources. Renew. Energy 2017, 107, 576–589. [Google Scholar] [CrossRef]
  38. Felseghi, R.A.; Papp, A. Considerations regarding hybrid systems of power generator from renewable energy sources. Studia Universitatis Babes-Bolyai Ambientum 2014, 59, 27–40. [Google Scholar]
  39. Chokkalingam, B.; Padmanaban, S.; Siano, P.; Krishnamoorthy, R.; Selvaraj, R. Real-Time Forecasting of EV Charging Station Scheduling for Smart Energy Systems. Energies 2017, 10, 377. [Google Scholar] [CrossRef]
  40. Grande, L.S.A.; Yahyaoui, I.; Gómez, S.A. Energetic, economic and environmental viability of off-grid PV-BESS for charging electric vehicles: Case study of Spain. Sustain. Cities Soc. 2018, 37, 519–529. [Google Scholar] [CrossRef]
  41. Marza, C.; Corsiuc, G.D.; Pop, A. Case study regarding the efficiency of electricity generation using photovoltaic panels. In Proceedings of the International Multidisciplinary Scientific Geo Conference SGEM 2018, Albena, Bulgaria, 30 June–9 July 2018. [Google Scholar]
  42. Aschilean, I.; Rasoi, G.; Raboaca, M.S.; Filote, C.; Culcer, M. Design and Concept of an Energy System Based on Renewable Sources for Greenhouse Sustainable Agriculture. Energies 2018, 11, 1201. [Google Scholar] [CrossRef]
  43. Pentiuc, R.D.; Popa, C.D.; Dascalu, A. The Influence of LED Street Lighting Upon Power Quality in Electrical Networks. In Proceedings of the 8th International Conference and Exposition on Electrical and Power Engineering (EPE), Iași, Romania, 16–18 October 2014. [Google Scholar] [CrossRef]
  44. National Regulatory Authority for Energy. Raport Anual Privind Activitatea Autorităţii Naţionale de Reglementare în Domeniul Energiei. February 2017. Available online: https://www.anre.ro/ro/despre-anre/rapoarte-anuale (accessed on 27 December 2018).
  45. Wu, H.; Niu, D. Study on Influence Factors of Electric Vehicles Charging Station Location Based on ISM and FMICMAC. Sustainability 2017, 9, 484. [Google Scholar] [CrossRef]
  46. Pentiuc, R.D.; Vlad, V.; Lucache, D.D. Street Lighting Power Quality. In Proceedings of the 8th International Conference and Exposition on Electrical and Power Engineering (EPE), Iași, Romania, 16–18 October 2014. [Google Scholar] [CrossRef]
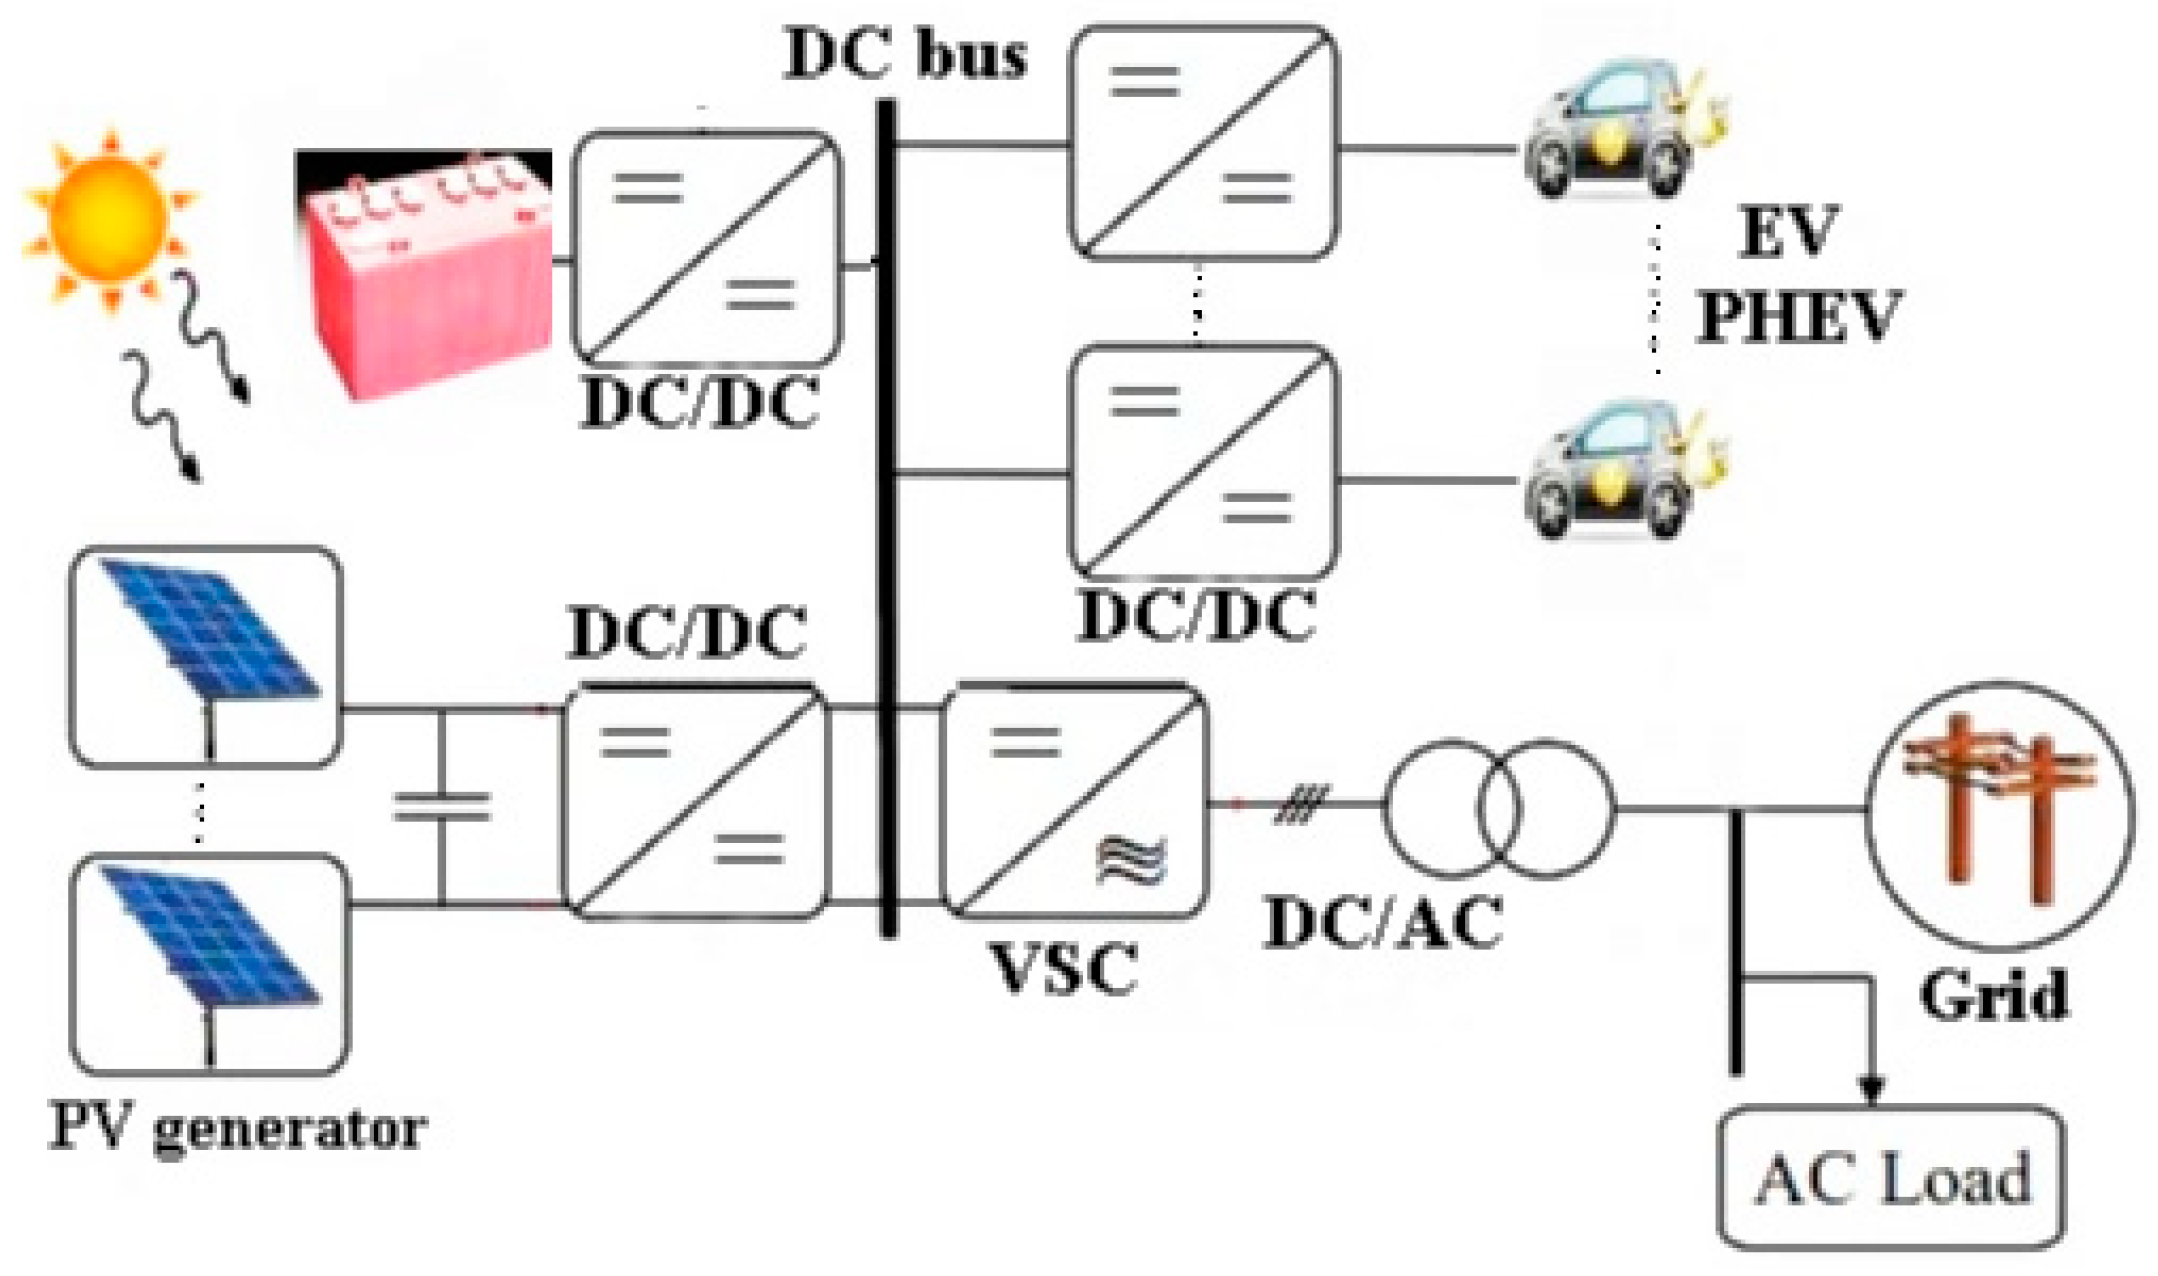
Figure 1. Daily solar irradiation [25].
Energies 12 00074 g001
Figure 2. Schematic diagram of the solar energy system. PV: Photovoltaic, EV: Electric vehicle, VSC: Voltage Sourced Converter, PHEV: Plug-in hybrid electric vehicles, DC: Direct current and AC: Alternating current.
Energies 12 00074 g002
Figure 3. Cycles to failure vs. depth of discharge for a battery.
Energies 12 00074 g003
Figure 4. Diagram of inverter efficiency [30].
Energies 12 00074 g004
Figure 5. Energy balance for one year of operation of an EV charging station.
Energies 12 00074 g005
Figure 6. Monthly and annual average power.
Energies 12 00074 g006
Figure 7. Hourly results for the most favorable day of system operating.
Energies 12 00074 g007
Figure 8. Hourly results for the worst day of system operating.
Energies 12 00074 g008
Figure 9. Monthly energy used by the EV charging station.
Energies 12 00074 g009
Figure 10. Carbon dioxide emissions.
Energies 12 00074 g010
Figure 11. Total system cost breakdown.
Energies 12 00074 g011
Table 1. Average monthly sunshine duration [25].
Month123456789101112
Average value (hours)66.2377.87131.63120.07202.35183.26190.77232.93136.6399.5062.6042.80
Table 2. Characteristics of photovoltaic (PV) panels [29,30].
ItemValueUnit
Nominal voltage24V
Shortcut current8.39A
Nominal power280Wp
Acquisition cost126
Operation and maintenance cost 52€/year
Expected lifespan25year
CO2 emissions in manufacturing800kg CO2 equiv/kWp
Weight24.2kg
Dimensions1645 × 990 × 40mm
Area1.63m2
Operating temperature−40 to 85°C
Temperature coefficient ISC (α)0.03%/°C
Temperature coefficient VOC (β)−0.34%/°C
Temperature coefficient P (γ)−0.43%/°C
Maximum wind speed2400 (219.40)Pa (km/h)
Table 3. Battery characteristics [32,33].
ItemValueUnit
Nominal Capacity189Ah
Voltage12V
Acquisition cost227.5
Operation and maintenance cost 18€/year
Expected lifespan12year
CO2 emissions in manufacturing55kg CO2 equiv/kWh
Weight57kg
SOC minimum20%
Self discharging5%/month
Intensity max.37.8A
Global efficiency80%
Table 4. Inverter characteristics.
ItemValueUnit
Continuous power900VA
VDCmin42V
VDCmax64V
Pmax_ren1015W
Power 30 min1100VA
Acquisition cost845
Operation and maintenance cost 42€/year
Expected lifespan10year
Weight9kg