Abstract
This article utilized a multicriterial quantitative and qualitative analysis of the influence of eco-friendly methods in reducing emissions over the life cycle of automotive products. The new proposed multicriterial method is applicable where preferential criteria are independent of each other, and where uncertainty has not been incorporated into a formal model. The linear model showed how the values of several criteria related to the options could be combined into an overall value. The main objective of this research was to apply a multicriterial methodology to improve the accuracy of existing approaches in identifying the influence of eco-friendly methods to reduce emissions over the product life cycle, and to assist decision makers in the manufacturing process. The research questions were as follows: Which one of two automotive products (“Bus” or “Truck”) has the best environmental performance (EPP)? Which one of two automotive products (“Bus” or “Truck”) has the best overall environmental performance (EPAPL)? This research provided a detailed comparative analysis of a “Crosstown bus” and a “Tractor truck”, both made at the Industrial Park Romania Brasov, Romania, using a multicriterial analysis. This article provided an answer to the first research question, whilst only presenting the results for the second question. The results of the proposed multicriterial method applications provide a decision support base for environmental managerial decisions in the field of automotive production processes.
1. Introduction
This paper uses multicriterial analysis as a new proactive environmental method in the automotive product development process, which aims to minimize the environmental impacts over the life cycles of automotive industry products’, thereby improving its environmental performance. According to Parisi et al. [1] (p. 1) “in order to meet the consumers demand of eco-friendly products, more sustainable production processes are under investigation in order to reduce the environmental burdens”. In our study, environmental burdens are the emissions from automotive products. The way to reduce emissions is well explained by Gan et al. [2] (p. 7). The authors suggested that: “Optimizing the process efficiency of aggregate production, improving the efficiency of the heavy equipment, or replacing the old machineries can reduce the carbon emissions due to power consumption.” Morgadinho et al. [3] (p. 1) concluded that “there is a strong focus on lowering the greenhouse gas and carbon dioxide emissions in the automotive sector and related industries concerning innovation process.”
Pollution prevention (PS) within the Romanian automotive industry could be solved using the ideas of Bhupendra et al. [4] (p. 3): “PS depends on steps taken to enhance current operations’ efficiency by reducing pollutants, emissions and wastage at source resulting in cost reduction due to relative decrement in cost heads of input raw materials and wastage disposal.”
Barberio et al. [5] (p. 1) presented a framework for combining the life cycle assessment (LCA) and the Risk Assessment (RA) to support the sustainability assessment of emerging technologies. The goals of the study were to analyze the hotspots and highlight possible trade-offs between the results of the LCA, which identifies the processes having the best environmental performance, and the results of the RA, which identifies the scenarios having the highest risk for workers. Additionally, Issa et al. [6] (p. 3) presented a remarkable approach to increase knowledge on the leading product-related Environmental performance indicators. Zhifang Zhou et al. [7] (p. 1) presented a model which described the “efficient multiplication of resources, economic efficiency, and environmental efficiency as its core objectives and give an in-depth analysis on the mutual logical relationship of product performance, value, resource consumption, and environmental load to reveal the symptoms and potentials in different dimensions.”
The literature review presented herein shows that most of the available sustainability frameworks are qualitative in nature and are limited to identifying and reducing emissions over the automotive product life cycle. A review of the current literature on the application of multicriterial methods reveals a significant knowledge gap between current approaches focused on the optimization of urban transportation means and our proposed new eco-friendly method that is focused on the comparison between the environmental indicators of two automotive products. To fill the scientific gap, our study provides a different approach to calculate the Environmental Performance of Romanian automotive industry products. This paper presents a new conceptual framework for the use of a multicriterial methodology to improve the accuracy of existing approaches in identifying the environmental impacts caused over the life cycle of an automotive industry product.
Our new eco-friendly method is named “eco-friendly” because it is used to calculate, compare, and improve the environmental impacts caused during an automotive industry product’s life cycle. The outcomes of the new eco-friendly method can be used by automotive industry managers to make decisions on improving the environmental performance of products.
An eco-friendly method is considered important by Ciotlaus, M., et al. [8] (p. 1) who note that a “Multi-Criteria Analysis is increasingly used for decision making in transport projects, as a complex appraisal method, with advantages and disadvantages, the main fact remaining that the decision maker understands the whole methodological approach.” The authors focused on the use of Multiple-Criteria Analysis in decision-making, to find the correct approach to meet the requirements of a new ecologically friendly public transportation line in the city of Bistrita Nasaud, Romania. Conversely, the current study was focused on a specific transport vehicle manufacturer (Roman SA Company), and not on a public transport company. The new multicriterial method is applicable where preferential criteria are independent of each other, and where uncertainty has not been incorporated into the formal model. The linear model showed how the values of several criteria related to the options can be combined into an overall value. The main objective of the current research was to apply an algorithm for a new comparative, multicriterial eco-friendly method to provide a decision support base for more environmentally sustainable and eco-friendly managerial decisions in the automotive production process.
In our case, an eco-friendly method is a method that considers the Environmental Performance of the Product (EPP) as a function of three environmental performance indicators: (Product Quality (Q); Product Cost (C); Product Ecological Performance (E)). Using this method, the study considered that the selection of green industrial products could be made by considering the logical relationship and reciprocal weighted significance between the criterion score (Scj), influence factor (Xij), and the life cycle stage score (Secvi). This paper presented a conceptual comparative framework for assessing eco-friendly manufacturing using a multicriterial method (named “eco-friendly”) and illustrates its application in the automotive industry. The calculations of the environmental performance (EPP and EPPR) of automotive industry products were made for two automotive products, i.e., a Truck and a Bus.
The overall Environmental Performance of the Automotive Enterprise Production Line (EPAPL) is calculated as follows: EPAPL = EPP (environmental performance) + EPPR (environmental performance on product risks).
The research questions were:
- Which one of two automotive products (“Bus” or “Truck”) has the best environmental performance (EPP)?
- Which one of two automotive products (“Bus” or “Truck”) has the best overall environmental performance (EPAPL)?
This research is a very detailed comparative analysis of the environmental performances (EPP and EPPR) of the “Crosstown bus” and the “Tractor truck”, both made by the Roman SA Company, using a multicriterial analysis.
2. A Short Presentation of the Plant and Products
The increase in the number of public and private vehicles in the city of Brasov is the result of economic development and transportation demand, which can lead to side effects like traffic congestion and air pollution caused by the excessive use of vehicles with a negative impact on the population.
The Industrial Park Brasov is located in the southern part of Brasov on an area covering approximately 115 ha. The truck factory has been in existence for over 90 years and it has a very tumultuous history.
The industrial restructuration carried out between 1990 and 2006 was accompanied by a social crisis provoked by a significant growth in the unemployment rate in large industrial centers, as well as in small mono-industrial centers [9].
During the period 2004–2010, the plant achieved significant economic performance, evidenced by the quality of products manufactured in Brasov by the Roman SA Company, citing the performance of civilian or military trucks to comfortable urban or interurban buses. The “Tractor Truck” has a EURO 5 MAN type engine, a saddle load of 10.7 tons, and a total net weight of 40 tons. The “Tractor Truck” superstructure uses a semi-trailer for transporting fuel of 30,000 L and it could also use other types of semi-trailers (general, refrigerated, etc.). The “Urban Crosstown Bus” has a EURO 5 MAN engine, a fully lowered floor, a self-supporting body, technical devices designed to facilitate access for people with reduced mobility, and a safety system that does not allow the bus to take off with open doors. It has a total capacity of 91 people on seats, and it reaches a maximum speed of 80 km/h.
In 2016, 23 trucks and 10 buses were produced and sold. The trucks were of two types: 11 of the trucks had a containerized transport truck configuration, and the remaining 12 had a medium capacity transport truck configuration. All the trucks had 6x6 traction and were equipped with EURO 5 MAN type engines and AdBlue catalytic systems. The main reason for the spread of AdBlue catalytic systems was compliance with the environmental standards of the European Union (EURO 6, since 2009). AdBlue fluid makes exhaust fumes that are less pollutive.
Between 2004 and 2010, the Roman SA Company was kept operational through a huge contract with the Pentagon, where it delivered more than 1000 military transport trucks folded into the conflict zones in Iraq and Afghanistan. The Urban Crosstown, the Roman bus model, was a project launched in 2008 to take part in the auctions organized by the city transport hubs. Such auctions have not been held, except in Bucharest, where the competing model, the Mercedes Citaro, was preferred. Now the Urban Crosstown bus needs another homologation and another production line for the engine, as it is subject to the EURO 6 rules. The Urban Crosstown will not be released in serial production because the project has already expired. Owing to additional forecasting costs, the Roman SA company management dropped the idea of buying and implementing AdBlue catalytic systems to align the bus with the environmental standards of the European Union. The catalog price of the Urban Crosstown bus is 120,000 euros and the catalog price of the “Tractor Truck” is 104,000 euros. The Roman SA company managed to sell 300 Urban Crosstown chassis, virtually only $15 million of the bus skeleton, to a Columbian company. The factory sold 300 pieces at a price of $50,000 per piece. Evidence showed that the damage of transport emissions to the environment and the worsening of living conditions due to population growth and limitless resource consumption needed urgent attention. With reference to exhaust gases emitted by urban transportation, this encompasses a wide range of effects on human health [10,11,12]. Literature suggests that urban traffic is responsible for 40% of CO2 emissions and 70% of the emission of other pollutants arising from transport [13].
According to Vasile, E. et al. [14], “The most important effects are those related to harm exhaust gas containing NOx, CO, SO2, CO2, VOCs, particulates loaded with heavy metals (lead, cadmium, copper, chromium, nickel, selenium, zinc), pollutants, dust involved with the road, which can cause acute and chronic respiratory problems and other diseases worse”. Regarding greenhouse gas emissions, Romania reported a good situation due to reduced economic activity because of the transition from a centralized economy to a market economy, and a demographic decline. To maintain the downward trend in the emissions of greenhouse gases, Romania took steps to comply with the EU rules [15]. In the case of the Roman SA Company, the main exhaust gases emitted, per each type of machinery examined, were as follows: carbon dioxide (CO2), carbon monoxide (CO), nitrogen oxides (NOx), hydrocarbons (HC), and particulate matter (PM). The EU Emission Standards for HD Diesel Engines are shown in Table 1 [16].

Table 1.
European Union (EU) Emission Standards for HD Diesel Engines.
These standards utilize the following tests: European Stationary Cycle (ESC); European Load Response (ELR); and the World Harmonized Stationary Cycle (WHSC). As shown in Table 1, the “Tractor Truck” (equipped with the EURO 6) has lower emissions levels compared to the “Urban Crosstown” bus (equipped with the EURO 5). For the Brasov city industry, the authors considered the “AUTOTRACTOR 18.5 tons” (the truck) and the “Urban Crosstown Bus” automotive products for this comparative study, because these products were (at the time of the study) the main products manufactured by the Roman SA Company (SA abbreviation in Romanian language is Joint-Stock).
2.1. Product Lifecycle and Product Selection Criteria for Green Industrial Products
2.1.1. Product Lifecycle Stages
According to ISO 14001:2015, the Eco-industrial product management system has the following objectives: compliance with environmental requirements, minimization of financial risks, continuous improvement of environmental performance, creation of a positive image on the market and gaining advantages over the competition. To illustrate the research, the life cycle stages of an industrial product were addressed. The basic criteria that make up the life cycle matrix of green products will be explored with a wider perspective on ecological products in the Romanian automotive industry. Using this approach, the study will determine the overall score and the weighted score of the basic criteria for the choice of green industrial products, within the products’ life cycle stages, giving priority to customer assessments at the different stages of the product development process and considering the most likely changes which will improve the process.
2.1.2. The Methodology Section with Multicriteria Steps
Environmental decision makers rely on many experimental tests, computational models, and tools to assess human health and the ecological risks associated with environmental stressors and the impact of remedial and abatement strategies on risk reduction. The methodological foundation of the framework is multi-criteria decision analysis (MCDA), which integrates complex criteria to evaluate alternative decisions [17]. MCDA provides a method to score these alternatives based on the relative importance of various stakeholder preferences and measurable performance data. To execute the MCDA model, all criteria and sub-criteria must have associated weights and scores. Each implementation of the model has its own series of importance weights. MCDA approaches typically require input scores across several dimensions associated with different alternatives and outcomes. The weights are related to trade-offs across these dimensions. The role of the eco-friendly matrix method was to qualitatively and quantitatively assess the environmental performance of the automotive products and help us to identify the specific functions and properties that need to be optimized.
Using this new proposed multicriterial method, six basic criteria for choosing green industrial products were identified and evaluated, which determined the selection of environmentally friendly industrial products. These criteria were: Rethinking green products and their functions; Reducing the consumption of materials and energy; Replacing hazardous substances; Recycling; Reuse; and Repair.
According to the literature [18,19,20,21,22,23], these six basic criteria for choosing green industrial products are the key principles of the circular economy. The circular economy is restorative and regenerative by design, and it aims to keep products, components, and materials at their highest utility and value at all times (ISO 20400:2017). Based on these criteria, we developed and analyzed a direct-relation matrix where every value represents a level of mutual influence between two elements, i.e., the Product Life Cycle Stages and the Basic Criteria for Choosing Green Industrial Products.
2.1.3. The New Proposed Eco-Friendly Method is Based on the Product Life Cycle Stages and Six Basic Criteria for Choosing Green Industrial Products (Cj) and Consists of Ten Steps, as Follows
1. Realization of the direct-relation matrix of two elements (Product Life Cycle Stages and Basic Criteria for Choosing Green Industrial Products).
2. Determination of the criterion score (Scj) for each of the six basic criteria (Cj, j = 1, …, 6): Rethinking green products and their function; Reducing the consumption of materials and energy; Replacing hazardous substances; Recycling; Reuse; and Repair.
3. Determination of the life cycle stage score (Secvi) for each of the 12 life cycle stages of the product.
4. Determination of the weighting coefficient (Cp) for each of the six basic criteria.
5. Identification and setting of the three environmental performance indicators (Q, C, E), depending on the six basic criteria (Cj, j = 1, …, 6).
6. Organization of the data, where the scores for the Nj criteria (Njq, Njc, Nje) have the following values (based on consultations with specialists in the field): Maximum performance—3; Average performance—2; Low performance—1.
7. Realization of the Table “Criteria and scores for the choices of green industrial products”.
8. Determination of the sum of scores for SQ, SC, SE, for each performance indicator (Q, C, E), according to the data and relations from the Table 2.
Table 2.
Determination of green industrial performance of the “Tractor Truck 18.5 tons”.
9. Determination of the performance indicators total score ST according to the weighting coefficients of the criteria Cpcj and the scores assigned to the indicators (data and relations from the Table 2).
10. Determination of the product ecological performance (PEP). The algorithm for the new proposed methodology for determination of the ecological performance (PEP) of the “Tractor truck 18.5 tons” and “Urban Crosstown Bus” is presented in Figure 1.
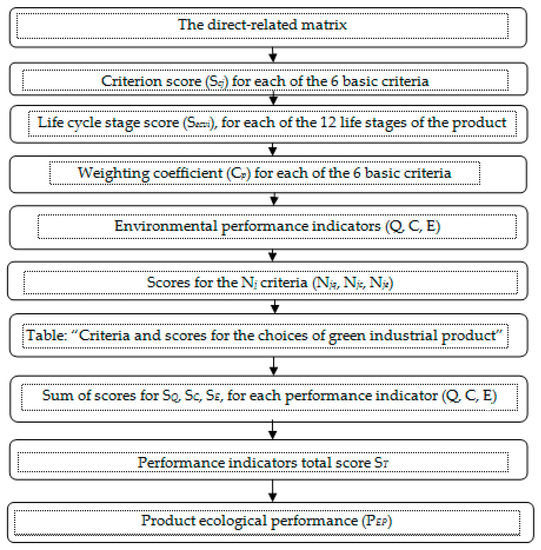
Figure 1.
The algorithm for the new proposed eco-friendly method for determination of the ecological performance (PEP) of the “Tractor truck 18.5 tons” and “Urban Crosstown Bus”.
3. Determination of the “Tractor Truck 18.5 tons” Green Industrial Performance
Green industrial performance determination of the “Tractor Truck 18.5 tons” starts with the data in Table 2.
Based on the circular economy key principles, we identified and set six Basic Criteria for Choosing Green Industrial Products (Cj). Depending on the criteria (Cj, j = 1, …, 6) for the choice of green industrial performance, scores were set for 12 Product Life Cycle Stages.
The data was organized as shown in Table 2 (the direct-relation matrix), where all values (1 or zero) were to be derived from expert elicitation and indicate the level of mutual influence between two elements: Basic Criteria for Choosing Green Industrial Products (Cj) and Product Life Cycle Stages. The Basic Criteria for Choosing Green Industrial Products (Cj) were transparent and logically reasoned, with realistic assumptions for all automotive companies.
All experts were independently provided with the background and were required to make judgments on the relative weights of the factors, as well as the relationships among them.
Expert Judgment (for estimation) is a value estimation that is developed solely based on a person’s experience and knowledge of the process or product being estimated.
The level of mutual influence could have a value of 1 (strong mutual influence) or zero (no mutual influence).
As shown in the last row of Table 2, it is evident that “Recycling” ranks first in the criteria level, with an evaluation score of 11. An evaluation score of 10 (close to the value for “Recycling”), was found for two other criteria: “Rethinking green products and their functions” and “Reducing the consumption of materials and energy”. The lowest score was assigned to the criterion “Reuse”, which has a value of 3. All these scores are expected to help managers at the Roman SA Company to identify competitive priorities for truck production, to determine the key process components in strategy formulation, and to monitor the execution of strategies in their organization.
3.1. The Basic Criteria in the Selection of Green Industrial Products
According to Suhaiza Zailani et al. [24], “environmental regulations, marketing demands, and firm internal initiatives are the major factors that positively affect the adoption of green innovation.”
3.1.1. Calculation of Scj (Criterion Score), Life Cycle Stage Score (Secvi), and the Weighting Coefficient (Cp) for the “Tractor truck 18.5 tons” and “Urban Crosstown Bus”
For each of the six basic criteria for choosing green industrial products, we determined the criterion score (Scj) using the following relation:
where:
n—Product Life Cycle Stages number (12, in our case)
Xij—The influence factor
According its influence over the Product Life Cycle Stages, the influence factor Xij could have two values:
1—if criteria Cj influences the Product Life Cycle Stages;
0—if criteria Cj does not influence the Product Life Cycle Stages;
If all the criteria Cj influence the Product Life Cycle Stages, then Scj will have the maximum value of 12.
Therefore, (according to Table 2, for the “Tractor Truck 18.5 tons”), the criterion score (Scj) is calculated as follows:
For each of the 12 life stages of the product “Tractor truck 18.5 tons”, the life cycle stage score (Secvi) is calculated as follows:
Secvi is a sum influenced by the influence factor Xij values and has a maximum possible value of 6.
Thus, it follows that:
Secv1 = (1 + 1 + 1 + 1 + 1 + 1) = 6
Secv2 = (1 + 1 + 1 + 1 + 1 + 0) = 5
Secv3 = (1 + 1 + 1 + 1 + 0 + 0) = 4
Secv4 = (1 + 1 + 1 + 1 + 1 + 0) = 5
Secv5 = (1 + 1 + 1 + 1 + 0 + 0) = 4
Secv6 = (1 + 1 + 0 + 1 + 0 + 0) = 3
Secv7 = (1 + 1 + 0 + 1 + 0 + 0) = 3
Secv8 = (1 + 1 + 0 + 1 + 0 + 0) = 3
Secv9 = (1 + 0 + 0 + 0 + 0 + 0) = 1
Secv10 = (0 + 1 + 0 + 1 + 0 + 1) = 3
Secv11 = (0 + 0 + 1 + 1 + 0 + 1) = 3
Secv12 = (1 + 1 + 0 + 1 + 0 + 1) = 4
3.1.2. The Reciprocal Weighted Significance among the Coefficients of Scj, Xij, Secvj, and Cpj
Empirically, the integrated factor analysis model (weighting coefficient Cp for each of the six basic criteria) can improve the selection of green industrial products by considering the logic relationship and reciprocal weighted significance between the criterion score (Scj), influence factor (Xij), and the life cycle stage score (Secvi).
However, product environmental performance requires a balance between three dimensions (indicators): Product Quality (Q); Product Cost (C); and Product Ecological Performance (E).
The reciprocal weighted significance amongst the coefficients of Cpj is based on Equation (3).
The weighting coefficients (Cp) for each of the six basic criteria were determined by the relation:
Following the replacements from the relation, the following results were obtained:
We identified and set three environmental performance indicators for the product “Tractor Truck 18.5 tons” as follows: Product Quality (Q); Product Cost (C); and Product Ecological Performance (E). Depending on the criteria (Cj, j = 1, …, 6) for the choice of green industrial products, the scores were set for the three performance indicators (Q, C, E).
The data is shown in Table 3, where the scores for Nj criteria (Njq, Njc, Nje) have values from the table. In this framework, all weights were derived from expert elicitation and indicated the relative importance of each criterion: 3—maximum performance; 2—average performance; and 1—low performance.
Table 3.
Criteria and scores for the choices of green industrial product “Tractor Truck 18.5 tons”.
By defining a weight for each criterion, the experts were able to assign a controlled level of importance for each criterion, as shown in the first column of Table 3.
The scores assigned to the indicators NjQ, NjC, NjE are shown in the last three columns of Table 3. For each performance indicator (Q, C, E), we determined the SQ, SC, SE, according to the data and relations from Table 3. Determinations of the performance indicators total score ST, based on the weighting coefficients of the criteria Cpcj and the scores assigned to the indicators, were realized based on the data and relations from Table 4.
Table 4.
Determination of the performance indicators total score based on the weighting coefficients of the criteria Cpcj and the scores assigned to the indicators NjQ, NjC, NjE.
In Table 4 we used the following notations:
- ST = Performance indicators total score for “Tractor Truck 18.5 tons;”
- SQC = Total Score for “Product Quality” (Q);
- SCC = Total Value for the “Product Cost” indicator (C);
- SEC = Total score for the “Product Ecological Performance” indicator (E);
The weights for each performance indicator were defined as follows:
- pQ = weight of the “Product Quality” indicator;
- pC = weight of the “Product Cost” indicator;
- pE = weight of the “Product Ecological Performance” indicator;
The weights were determined according to the relations:
pQ = SQC/St, pC = SCC/St, pE = SEC/St,
The relations resulted in:
The ecological performance of the product (PEP) was given by:
PEP = pQ × SQC + pC × SCC + pE × SEC
The relations resulted in:
PEP = 0.23 × 147.5 + 0.32 × 203.24 + 0.45 × 286.22 = 33.92 + 65.03 + 128.80 = 227.75
The ecological performance of the “Tractor truck 18.5 tons,” PEP = 227.75
4. Determination of the “Urban Crosstown Bus” Environmental Performance
Green industrial performance determination of the “Urban Crosstown Bus” started from the data in Table 5. Based on the circular economy key principles, we identified and set six Basic Criteria for Choosing Green Industrial Products (Cj). Depending on the criteria (Cj, j = 1, …, 6) for the choice of green industrial performance, scores were set for 12 Product Life Cycle Stages. The data was shown in Table 5 (the direct-relation matrix), where all values (1 or zero) were derived from expert elicitation and indicated the level of mutual influence between two elements: Basic Criteria for Choosing Green Industrial Products (Cj) and Product Life Cycle Stages. The Basic Criteria for Choosing Green Industrial Products (Cj) were transparent and logically reasoned with realistic assumptions for all automotive companies. All experts were independently provided with the background and were required to make judgments on the relative weights of the factors, as well as the relationships among them. Expert Judgment (for estimation) is a value estimation that is developed solely based on a person’s experience and knowledge of the process or product being estimated. The level of mutual influence could have a value of 1 (strong mutual influence) or zero (no mutual influence).
Table 5.
Determination of the green industrial performance of the “Urban Crosstown Bus”.
As shown in the last row of Table 5, it was evident that “Recycling” ranked first in the criteria level, with an evaluation score of 10. An evaluation score of 7 (closed to the value for “Recycling”), was found for the criteria: “Rethinking green products and their functions”. The lowest score was 4, for the criteria: “Repair.” All these scores are expected to help management of the Roman SA Company to identify competitive priorities for bus production, to determine key process components in strategy formulation, and to monitor the execution of strategies in their organization.
4.1. The Basic Criteria in the Selection of Green Industrial Products
In our case, it was shown that the product life cycle stages used an integrative approach. Therefore, it should “encourage executives, designers and engineers to think about the life cycles of their products and support interfunctional collaboration” [25].
For each of the six basic criteria for choosing green industrial products, we determined the criterion score (Scj) with the relation in Equation (6):
Thus, (according to Table 5, for the “Urban Crosstown Bus”) the criterion score (Scj) was calculated as follows:
For each of the 12 life stages of the product “Urban Crosstown Bus”, the life cycle stage score (Secvi) was determined with the following relation in Equation (7):
Thus, it followed that:
Secv1 = (1 + 1 + 1 + 1 + 1 + 1) = 6
Secv2 = (1 + 1 + 1 + 1 + 0 + 0) = 4
Secv3 = (1 + 1 + 0 + 1 + 0 + 0) = 3
Secv4 = (0 + 1 + 1 + 1 + 1 + 1) = 5
Secv5 = (1 + 0 + 1 + 1 + 0 + 0) = 3
Secv6 = (0 + 0 + 0 + 1 + 1 + 1) = 3
Secv7 = (1 + 0 + 0 + 1 + 1 + 0) = 3
Secv8 = (0 + 0 + 0 + 1 + 0 + 0) = 1
Secv9 = (1 + 0 + 0 + 0 + 0 + 0) = 1
Secv10 = (0 + 1 + 0 + 1 + 0 + 0) = 2
Secv11 = (0 + 0 + 1 + 0 + 0 + 0) = 1
Secv12 = (1 + 1 + 0 + 1 + 1 + 1) = 5
The weighting coefficients (Cp) for the six criteria, were determined using the relation in Equation (8):
Following replacements in the relation, it follows that:
We identified and set three environmental performance indicators for the product “Urban Crosstown Bus” as follows: Product Quality (Q); Product Cost(C); and Product Ecological Performance (E). Depending on the criteria (Cj, j = 1, …, 6) for the choice of green industrial products, scores were set for the three performance indicators (Q, C, E). The data is shown in Table 6, where the scores for the Nj criteria (Njq, Njc, Nje) have values from the table. In this framework, all weights were derived from expert elicitation and indicated the relative importance of each criterion: 3—maximum performance; 2—average performance; and 1—low performance. By defining a weight for each criterion, the experts were able to assign a controlled level of importance for each criterion, as shown in the first column of Table 6.
Table 6.
Criteria and scores for the choices of the green industrial product “Urban Crosstown Bus”.
For each performance indicator (Q, C, E), we determined the SQ, SC, SE, according to the data and relations from Table 6. Determination of the performance indicators total score ST, based on the weighting coefficients of the criteria Cpcj and the scores assigned to the indicators, were realized based on the data and relations in Table 7.
Table 7.
Determination of the performance indicators total score based on the weighting coefficients of the criteria Cpcj and the scores assigned to the indicators NjQ, NjC, NjE.
In Table 7 were used the next notations:
- ST = Performance indicators total score for the “Urban Crosstown Bus;”
- SQC = Total Score for “Product Quality” (Q);
- SCC = Total Value for the “Product Cost” indicator (C);
- SEC = Total score for the “Product Ecological Performance” indicator (E);
The weights for each performance indicator, namely:
- pQ = weight of the “Product Quality” indicator;
- pC = weight of the “Product Cost” indicator;
- pE = weight of the “Product Ecological Performance” indicator;
These weights were determined based on the relation in Equation (9):
pQ = SQC/St, pC = SCC/St, pE = SEC/St,
The relations resulted in:
The ecological performance of the product (PEP) was given by Equation (11):
PEP = pQ × SQC + pC × SCC + pE × SEC
The relations resulted in:
PEP = 0.19 × 93.3 + 0.40 × 195.02 + 0.41 × 203.2 = 17.73 + 78 + 83.31 = 179.04
The ecological performance of the “Urban Crosstown Bus,” PEP = 179.04
Our conclusion was: PEP TRUCK > PEP BUS, because”Tractor truck 18.5 tons” PEP = 227.75 > “Urban Crosstown Bus” PEP = 179.04. With this new eco-friendly method, the ecological performance of the “Tractor Truck 18.5 tons” and the “Urban Crosstown Bus” products could be measured and ranked. The steps were transparent and logically reasoned with realistic assumptions for automobile companies.
In Table 8, we synthesized the indicators of the two products.
Table 8.
The synthetic indicators of the “Tractor Truck 18.5 tons” and “Urban Crosstown Bus” products.
Following the analysis in Table 8, it could be concluded that the “Tractor Truck 18.5 tons” was superior to the “Urban Crosstown Bus” in terms of environmental performance.
The synthetic indicators of the “Tractor Truck 18.5 tons” and the “Urban Crosstown Bus” products are shown in Figure 2.
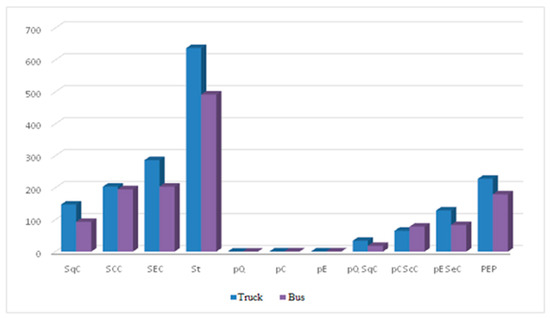
Figure 2.
The synthetic indicators of the “Tractor Truck 18. 5 tons” and “Urban Crosstown Bus”.
As can be seen in Figure 2, the product “Tractor Truck 18.5 tons” had synthetic environmental indicators that were higher than the “Urban Crosstown Bus,” except for the indicators pC∙SCC (pC = weight of “Product Cost” indicator and SCC = Total Value for the “Product Cost” indicator (C).
This meant that the cost of the “Urban Crosstown Bus” was too high, and therefore, the Roman S.A. Company had difficulties in promoting and selling the product.
4.2. Determination of the Environmental Risk Performance (PER)
Attempts to determine company Environmental Risk Performance (PER) need to start from the definition and evaluation of the four risk indicators, namely, the Environmental risk indicator (IRM), Quality risk indicator (IRQ), Cost risk indicator (IRC), and the Occupational Safety risk indicator (IRS).
4.2.1. The Environmental Risk Indicator (IRM)
The Environmental Risk Indicator (IRM) is determined by calculating the comparison indices specific to each economic unit.
4.2.2. Grouping of Hazardous Substances
The hazardous substances listed in the previous steps were grouped according to the new provisions of Directive 2003/105/EC, as well as based on the substances intrinsic properties into four groups (Annex 8, the clarification rules and the grouping of dangerous substances in Romanian Government Decision 95/2003) as follows:
- -
- Category group 1 to 2, consisting of hazardous substances labelled as very toxic (category 1) and toxic (category 2);
- -
- Category group 3 to 8, consisting of highly flammable (category 7a and 7b) and highly flammable (category 8), hazardous substances labelled as oxidizing (category 3), explosive (categories 4 and 5), and flammable (category 6);
- -
- Category group 9, consisting of substances labelled as hazardous to aquatic flora and fauna (categories 9 (i) and 9 (ii)); and
- -
- Category group 10, consisting of hazardous substances not belonging to any of the above-named categories and having the risk phases R14, R14/15 or R29 (categories 10 (i) and 10 (ii)).
Applying the aggregation rule in the calculation of comparison indices; the comparison indices specific to each economic unit were determined by applying the following aggregation rule:
where:
R = the comparison indices of the economic unit calculated at the lower or upper limit;
qi = the total amount of dangerous and existing substances on the economic unit site, expressed in tons;
QIi = the relevant quantity of the dangerous substance and/or the category of dangerous substances i, as specified in column 2 of the tables in Annex II of the Romanian Government Decision, expressed in tons;
QSi = the relevant quantity of the dangerous substance and/or the category of dangerous substances i, as specified in column 3 of the tables in Annex II of the Romanian Government Decision, expressed in tons.
The aggregation rule applied separately for each of the groups of hazardous substances listed and present on the site of the economic unit. That is why we calculated the following indices:
- -
- Two comparison indices for category group 1 to 2;
- -
- Two comparison indices for category group 3 to 8;
- -
- Two benchmark indices for the 9th category group;
- -
- Two benchmark indices for the 10th category group.
The comparison indices were entered in a specific form.
Following the application rule for aggregation of hazardous substances identified groups, the inferior R-risk indicators were compared, superior with superior, and the type of economic unit was concluded.
4.2.3. The Classification of Economic Units
From the risk point of view, the economic units could be classified as follows:
- -
- Units with no risk of major accidents involving dangerous substances, characterized by sub-unit values of all the comparison indices obtained from the calculation, both at the inferior limit and at the superior limit(R inferior limit < 1 and R superior limit < 1);
- -
- Units with a minor risk of accidents caused by dangerous substances, characterized by values greater than or equal to the unit 1, obtained for one of the comparison indices calculated at the inferior limit, and sub-unit values of the comparison indices calculated at the superior limit (R inferior limit ≥ 1 and R superior limit < 1);
- -
- Units with a major risk of accidents caused by dangerous substances, characterized by values greater than or equal to the unit 1, obtained for one of the comparison indices calculated at the superior limit (R inferior limit < = > 1 and R superior limit ≥ 1).
- -
- Given the calculations, the two risk indices R inferior limit ≥ 1 and R superior limit < 1, respectively, the economic unit could be classified as follows:
- -
- Unit with no risk;
- -
- Unit with a minor risk;
- -
- Unit with a major risk.
The proposed measures for economic unit management are useful for preventing potential future risks. These measures can provide an improvement in the quality of planning and decision-making.
The Quality Risk Indicator (IRQ) has the following variants:
- (a)
- Low risk (problems in the manufacturing phase, exceeding the product development time);
- (b)
- Medium risk (introduction of new technologies, technical characteristics of the product do not meet the expectations of the customers);
- (c)
- High risk (complicated product design, design errors).
The Cost Risk Indicator (IRC) has the following variants:
- (a)
- Low risk (product complexity increases the production cost, cost exceeds market expectations);
- (b)
- Medium risk (financial resources needed to develop the product are not available on time);
- (c)
- High risk (product development costs have exceeded the budget forecasts).
The Occupational Safety Risk Indicator (IRS) has the following variants:
- (a)
- Acceptable risk (no action required);
- (b)
- Tolerable risk (risks must be mitigated within a reasonable time);
- (c)
- Unacceptable risk (risks must be mitigated as soon as possible).
For the IRM, IRQ, IRC, IRS risk indicators, the weighting coefficients were determined based on the data set out in Table 9:
Table 9.
Determination of the weighting coefficients for risk indicators.
The “yij” values in the table can take the following values:
The total score is:
ST = SRM + SRQ + SRC + SRS
The weighting coefficients are determined with the relations:
Next, the scores for the four risk indicators are as follows:
Using the relationships shown in Equations (15)–(22), the Environmental Risk Performance PER becomes:
PER = pRM·NRM + pRQ·NRQ + pRC·NRC + pRS·NRS
In conclusion, the total ecological performance (PET) of an economic unit (in our case, the Roman SA Company from Brasov, Romania) can be defined as follows:
PET = (pQ·SQ + pC·SC + pE·SE)·(pRM·NRM + pRQ·NRQ + pRC·NRC + pRS·NRS)
The relationship in Equation (24) allows both the assessment and comparison of the environmental performance of an economic unit within it (between compartments, the previous activity, etc.), and the evaluation and comparison of two or more economic units.
The following is an example of the calculation of the Environmental Risk Performance PER for the “Tractor Truck 18.5 tons.” For the risk indicators, the weighting coefficients were determined according to the data shown in Table 10.
Table 10.
Environmental risk performance indicators.
The “yij” values in the table can take the following values:
The total score is: ST = SRM + SRQ + SRC + SRS = 3 + 1.5 + 1 + 3 = 8.5
For the aforementioned risk indicators, the weighting coefficients were determined according to the following relations:
The following calculations were based on data obtained from the Roman SA Company scores for the four risk indicators.
These scores are highlighted in Table 11.
Table 11.
Scores of the four risk indicators for the product “Tractor Truck 18.5 tons”.
Using the previous data (in Table 10 and Table 11), the Environmental Risk Performance PER was calculated as:
By replacement using the values obtained above, it follows that:
PER truck = 2.29
Below is an example of the calculation of the Environmental Risk Performance PER for the product “Urban Crosstown Bus.” For the risk indicators, the weighting coefficients were determined according to the data shown in Table 12.
Table 12.
Environmental performance risk indicators.
The “yij” values in the table can take the following values:
The total score is: ST = SRM + SRQ + SRC + SRS = 3 + 1.5 + 1 + 3 = 8.5
For the aforementioned risk indicators, the weighting coefficients were determined according to the following relations:
The following calculations were based on data obtained from the Roman SA Company scores for the four risk indicators. These scores are highlighted in Table 13.
Table 13.
Scores of the four risk indicators for the product “Urban Crosstown Bus”.
Using the previous data (in Table 12 and Table 13), the Environmental Risk Performance PER was calculated as:
By replacement using the values obtained above, it follows that:
PER bus = 0.7 + 0.36 + 0.24 + 0.7 = 2
PER bus = 2
The Total Environmental Performance (PET) of the two products was:
PET truck = PEP truck·PER truck
PET truck = 227.75 × 2.29 = 521.54
PET bus = PEP bus·PER bus
PET bus = 179.04 × 2.0 = 358.08
The results from both calculations indicated that the truck product “AUTOTRACTOR 18.5 tons” was more efficient in terms of ecological performance than the product “Urban Crosstown Bus” as follows:
PET truck (521.54) ˃ PET bus(358.08).
5. Discussions
Within the automotive industry, there are increases in fuel and resource costs, as well as societal demand for responsible manufacturing, which drive the constant improvement and innovation of the automotive industry citing its significant fuel consumption, resource usage, and greenhouse gas (GHG) emissions. Yijie Liu et al. [23] estimate that the automotive industry “significantly reduce the demands for various auto materials and pollutant emissions to produce a unit automobile.” Despite the fact that exhaust emission regulations for European passenger cars have been in force for more than 20 years, the desired improvements in air quality have not yet materialized [24]. The designers of Romanian automotive products must consider environmental issues when creating eco-friendly and socially acceptable solutions, viewing sustainability as a matter of optimization in the efficient use of available resources along the entire product lifecycle. Resource efficiency means using the Earth’s limited resources in a sustainable manner, whilst minimizing impacts on the environment. The demand for transportation fuels has continued to grow due to rapid increases in the number of vehicles on the road worldwide. Owing to the overwhelming use of petroleum as the fuel of choice, these vehicles not only reduce petroleum resources, but they also release a significant amount of exhaust, which can cause global warming, harm the environment, and impact human health [25].
From the viewpoint of energy resources, the depletion of fossil fuel resources has resulted in a sudden rise in petroleum prices and limits on the oil reserves. Moreover, environmental restrictions on exhaust emissions from motor vehicles have been strengthening. To meet the restrictions, various methods to reduce the generation of NOx and PM during the combustion period in a diesel engine have been developed by several researchers [26]. In the automotive industry, the environmental issue is even more critical and urgent due to the enormous and diverse influence that the industry has on other business sectors, society, and nature, bringing economic and social advantages; but at the same time, it poses critical challenges and negative externalities, such as the deterioration of air quality in Romanian urban areas and a contribution to global warming.
Even if diesel engines produced lower partially burned hydrocarbons in comparison with gasoline engines, NOx and particulate matter are significant pollutants that require proper control strategies because of their impact on health and the environment [27]. The transportation sector is responsible for the emission of large quantities of pollutants to the atmosphere, which has local, regional, or global effects on environmental receptors (people, materials, agriculture, ecosystems, climate, etc.) [28]. The increasing use of natural resources and the pollution it causes calls for new ways of addressing automotive customer needs. Owing to the associated complexities and uncertainties, decision makers and planners are facing increased pressure to respond more effectively to several energy-related issues and conflicts, as well as GHG (Greenhouse Gas) emission mitigation within the multiple scales of energy management systems [29,30,31,32].
This study was important because the results of the new proposed eco-friendly method can provide a decision support base for more environmentally sustainable and eco-friendly managerial decisions in the automotive production process. Our results confirm previous findings, mainly that Romanian automotive companies use ad hoc methods that answer better to their needs, and that an effort for closer collaboration between customers and industry could be beneficial.
The environmental performance of certain products was calculated using the following formula: EPP = f (Q, C, E). We also calculated the environmental performance on product risks (EPPR) for two automotive products, i.e., a truck and a bus. The overall environmental performance of the automotive enterprise production line EPAPL shown as a sum, was follows: EPAPL = EPP + EPPR
Using an algorithm for the new proposed comparative method, the authors found out that the “AUTOTRACTOR 18.5 tons” product (the truck) was more efficient in terms of ecological performance than the product “Urban Crosstown Bus.” Our work demonstrated that the questions “Which one of two automotive products (“Bus” or “Truck”) has the best environmental performance (EPP)? and Which one of two automotive products (“Bus” or “Truck”) has the best overall environmental performance (EPAPL)?” were difficult to answer, and therefore, required our univocal methodology that allowed an evaluation of the environmental performance of the two road vehicles (i.e., the bus and the truck) using a pragmatic approach. Future research could be focused on the application of this proposed multicriterial method within the Romanian automotive industry, to provide a decision support base for more environmental managerial decisions in the automotive production process.
6. Conclusions
Current practices show that the support framework used by management in automotive companies needs to consider several factors for it to be useful, for example, the ecofriendly vision of the company, the participation of potential users of the support framework and everyday production operations, among other characteristics.
Regarding environmental concerns, this eco-friendly methodology creates a new managerial approach in automotive companies based on three environmental performance indicators: Product Quality (Q); Product Cost (C); and Product Ecological Performance (E).
As heavy duty automotive firms evolve around meeting environmental requirements, the companies should transform the responses from potential users and stakeholders orientation to a market orientation, by developing strategies that extend potential users and stakeholders requirements into exploiting new eco-friendly methods to create a competitive advantage on real transportation and environment-driven conditions.
Potential users and stakeholders could offer valuable inputs and resources to help the Roman SA Company achieve sustainability and Total Environmental Performance.
Graphical representation of the application of the new eco-friendly method at the Roman SA Company, as shown in Figure 3.
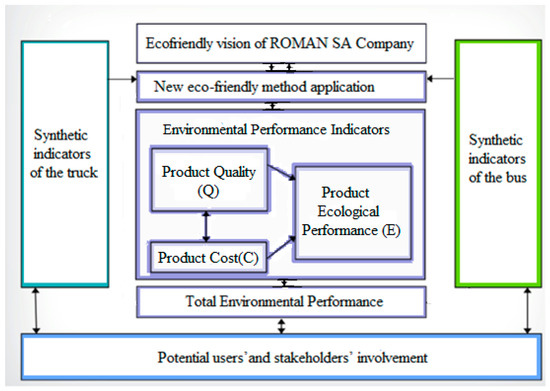
Figure 3.
Graphical representation of the application of the new eco-friendly method at the Roman SA Company.
The graphical representation of the application of the new eco-friendly method at Roman SA Company is expected to help managers to identify competitive priorities, determine key environmental production process components, formulate strategic transportation planning, and monitor the execution of strategies in the automotive organizations.
After analyzing the results of comparisons between the synthetic indicators of the automotive products (i.e., the truck and bus), it could be concluded that the “truck” product (Figure 4) was superior to the “bus” product (Figure 5) in terms of environmental performance EPP.
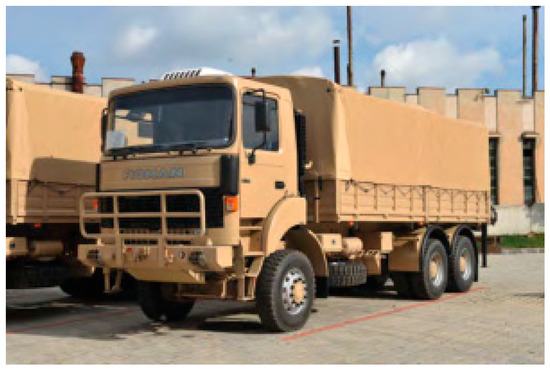
Figure 4.
Tractor Truck 18.5 tons.
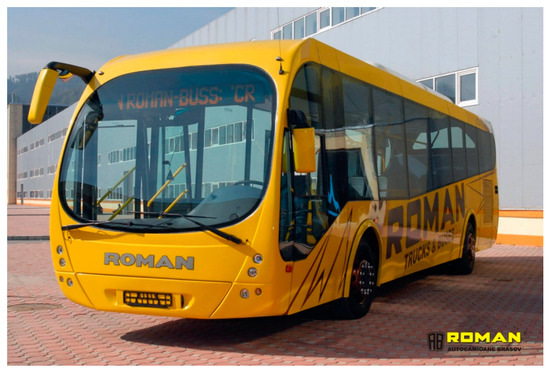
Figure 5.
Urban Crosstown Bus.
In terms of overall environmental performance of the automotive enterprise production line EPAPL, the truck production line was more advanced than the bus production line.
Author Contributions
The authors have contributed equally to the study.
Funding
This research received no external funding.
Conflicts of Interest
The authors declare no conflict of interest.
References
- Parisi, M.L.; Fatarella, E.; Spinelli, D.; Pogni, R.; Basosi, R. Environmental impact assessment of an eco-efficient production for coloured textiles. J. Clean. Prod. 2015, 108, 514–524. [Google Scholar] [CrossRef]
- Gan, V.J.L.; Cheng, J.C.P.; Lo, I.M.C. Integrating life cycle assessment and multi-objective optimization for economical and environmentally sustainable supply of aggregate. J. Clean. Prod. 2016, 113, 76–85. [Google Scholar] [CrossRef]
- Morgadinho, L.; Oliveira, C.; Martinho, A. A qualitative study about perceptions of European automotive sector’s contribution to lower greenhouse gas emissions. J. Clean. Prod. 2015, 106, 644–653. [Google Scholar] [CrossRef]
- Bhupendra, K.V.; Sangle, S. Pollution prevention strategy: A study of Indian firms. J. Clean. Prod. 2016, 133, 795–802. [Google Scholar] [CrossRef]
- Barberio, G.; Scalbi, S.; Buttol, P.; Masoni, P.; Righi, S. Combining life cycle assessment and qualitative risk assessment: The case study of alumina nanofluid production. Sci. Total Environ. 2014, 496, 122–131. Available online: https://www.researchgate.net/publication/264298210 (accessed on 17 August 2018). [CrossRef] [PubMed]
- Issa, I.I.; Pigosso, D.C.A.; McAloone, T.C.; Rozenfeld, H. Leading Product-related Environmental Performance Indicators: A selection guide and database. J. Clean. Prod. 2015, 108, 321–330. [Google Scholar] [CrossRef]
- Zhou, Z.; Xiao, T.; Li, D. An Integrated Factor Analysis Model for Product Eco-Design Based on Full Life Cycle Assessment. J. Ind. Eng. Manag. 2016, 9, 90–109. Available online: https://upcommons.upc.edu/bitstream/handle/2117/85243/1558-8591-1-PB.pdf (accessed on 12 August 2018). [CrossRef]
- Ciotlaus, M.; Moldovan, D.; Clitan, A.; Muntean, L. Choosing an Environmentally-Friendly Public Transportation System Using Multiple Criteria Analysis. Case Study: Bistrita Nasaud, Romania. Procedia Eng. 2017, 181, 396–403. [Google Scholar] [CrossRef]
- Iaţu, C.; Munteanu, A.; Boghinciuc, M.; Cernescu, R.; Ibǎnescu, B. The effects of transportation system on the urban sprawl process for the city of Iasi, Romania. WIT Trans. Built Environ. 2011, 116, 291–301. [Google Scholar] [CrossRef]
- Stan, V.; Fîntîneru, G.; Ion, V. Increase of biofuel crop production in Romania over the last decades-possible impacts on environment, greenhouse gas emissions and land use. Notulae Botanicae Horti Agrobotanici Cluj-Napoca 2014, 42, 325–332. [Google Scholar] [CrossRef]
- Matei, M.; Matei, L.; Stanca, A.; Grigoras, R.; Salisteanu, C.; Udroiu, I. Greenhouse gases emission trading and green certificates market-Instruments of the liberalized electricity market in Romania. In Proceedings of the 3rd IASTED Asian Conference on Power and Energy Systems, Phuket, Thailand, 2–4 April 2007; pp. 140–146. [Google Scholar]
- Popa, M.; Popa, D.; Varvara, S. Aspects of greenhouse gas emissions in the Alba county (Romania). J. Environ. Prot. Ecol. 2008, 9, 737–742. [Google Scholar]
- Rǎdulescu, V.; Strǎinescu, I.; Moroianu, L.; Tudor, E.; Gheorghe, S.; Goia, C. Urban electrical vehicles as the solution for public transportation in the cities of Romania. WIT Trans. Built Environ. 2011, 116, 449–458. [Google Scholar]
- Vasile, E.; Balan, M.; Balan, G.-S.; Grabara, I. Measures to reduce transportation greenhouse gas emissions in Romania. Pol. J. Manag. Stud. 2012, 6, 215–223. [Google Scholar]
- Bocean, C.G. Greenhouse gas emission trends in Romania. Qual. Access Success 2011, 12 (Suppl. 2), 439–446. [Google Scholar]
- Transport Policy Net; EU: Heavy-Duty: Emissions. Available online: https://www.transportpolicy.net/standard/eu-heavy-duty-emissions/ (accessed on 29 September 2018).
- Linkov, I.; Moberg, E. Multi-Criteria Decision Analysis: Environmental Applications and Case Studies; CRC Press: Boca Raton, FL, USA, 2011; ISBN 978143985318. Available online: https://www.transportpolicy.net/standard/eu-heavy-duty-emissions/ (accessed on 19 August 2018).
- Butterworth, J.; Morlet, A.; Nguyen, H.P.; Oppenheim, J.; Stuchtey, M. Towards the circular economy. Economic and business rationale for an accelerated transition. Ellen MacArthur Found. 2013, 1, 98. [Google Scholar]
- MacArthur Foundation. Rethink the Future. Towards the Circular Economy. Opportunities for the Consumers Goods Sector. 2013, Volume 2. Available online: https://www.mckinsey.com/~/media/mckinsey/dotcom/client_service/sustainability/pdfs/towards_the_circular_economy.ashx (accessed on 18 August 2018).
- Kirchherr, J.; Reike, D.; Hekkert, M. Conceptualizing the circular economy: An analysis of 114 definitions. Resour. Conserv. Recycl. 2017, 127, 221–232. [Google Scholar] [CrossRef]
- Popa, V.; Popa, L. Applying circular economy innovation theory in business process modeling and analysis. In IOP Conference Series: Materials Science and Engineering; IOP Publishing: Bristol, UK, 2017; Volume 227. [Google Scholar] [CrossRef]
- Iuga, A.; Popa, V.; Popa, L. Industrial product life cycle stages and lifecycle eco-design. In International Conference on Advanced Manufacturing Engineering and Technologies; Springer: Cham, Switzerland, 2017; pp. 365–374. [Google Scholar] [CrossRef]
- Popa, V.N.; Popa, L.I. Green Acquisitions and Lifecycle Management of Industrial Products in the Circular Economy. In IOP Conference Series: Materials Science and Engineering; IOP Publishing: Bristol, UK, 2016; Volume 161. [Google Scholar] [CrossRef]
- Zailani, S.; Govindan, K.; Iranmanesh, M.; Shaharudin, M.R.; Chong, Y.S. Green Innovation Adoption in Automotive Supply Chain: The Malaysian case. J. Clean. Prod. 2015, 108, 1115–1122. [Google Scholar] [CrossRef]
- Schöggl, J.P.; Baumgartner, R.J.; Hofer, D. Improving sustainability performance in early phases of product design: A checklist for sustainable product development tested in the automotive industry. J. Clean. Prod. 2017, 140, 1602–1617. [Google Scholar] [CrossRef]
- Liu, Y.; Liu, Y.; Chen, J. The Impact of the Chinese Automotive Industry: Scenarios based on the National Environmental Goals. J. Clean. Prod. 2015, 96, 102–109. [Google Scholar] [CrossRef]
- Hooftman, N.; Oliveira, L.; Messagie, M.; Coosemans, T.; Mierlo, J.V. Environmental Analysis of Petrol, Diesel and Electric Passenger Cars in a Belgian Urban Setting. Energies 2016, 9, 84. [Google Scholar] [CrossRef]
- Gao, L.; Winfield, Z. Life Cycle Assessment of Environmental and Economic Impacts of Advanced Vehicles. Energies 2012, 5, 605–620. [Google Scholar] [CrossRef]
- Yoon, S.H.; Han, S.C.; Lee, C.S. Effects of High EGR Rate on Dimethyl Ether (DME) Combustion and Pollutant Emission Characteristics in a Direct Injection Diesel Engine. Energies 2013, 6, 5157–5167. [Google Scholar] [CrossRef]
- Meloni, R.; Naso, V. An Insight into the Effect of Advanced Injection Strategies on Pollutant Emissions of a Heavy-Duty Diesel Engine. Energies 2013, 6, 4331–4351. [Google Scholar] [CrossRef]
- Messagie, M.; Boureima, F.-S.; Coosemans, T.; Macharis, C.; Mierlo, J.V. A Range-Based Vehicle Life Cycle Assessment Incorporating Variability in the Environmental Assessment of Different Vehicle Technologies and Fuels. Energies 2014, 7, 1467–1482. [Google Scholar] [CrossRef]
- Zeng, Y.; Cai, Y.; Huang, G.; Dai, J. A Review on Optimization Modeling of Energy Systems Planning and GHG Emission Mitigation under Uncertainty. Energies 2011, 4, 1624–1656. [Google Scholar] [CrossRef]
© 2018 by the authors. Licensee MDPI, Basel, Switzerland. This article is an open access article distributed under the terms and conditions of the Creative Commons Attribution (CC BY) license (http://creativecommons.org/licenses/by/4.0/).