Article

Reliability Monitoring Based on Higher-Order Statistics: A Scalable Proposal for the Smart Grid

by
Olivia Florencias-Oliveros
,
Juan-José González-de-la-Rosa
*,†,
Agustín Agüera-Pérez
and
José-Carlos Palomares-Salas
Research Group PAIDI-TIC-168, Computational Instrumentation and Industrial Electronics (ICEI), Area of Electronics, University of Cádiz, Higher Polytechnic School, Av. Ramón Puyol S/N, E-11202 Algeciras, Spain
*
Author to whom correspondence should be addressed.
These authors contributed equally to this work.
Energies 2019, 12(1), 55; https://doi.org/10.3390/en12010055
Submission received: 18 November 2018 / Revised: 14 December 2018 / Accepted: 20 December 2018 / Published: 25 December 2018
(This article belongs to the Special Issue Analysis for Power Quality Monitoring)

Abstract

:
The increasing development of the smart grid demands reliable monitoring of the power quality at different levels, introducing more and more measurement points. In this framework, the advanced metering infrastructure must deal with this large amount of data, storage capabilities, improving visualization, and introducing customer-oriented interfaces. This work proposes a method that optimizes the smart grid data, monitoring the real voltage supplied based on higher order statistics. The method proposes monitoring the network from a scalable point of view and offers a two-fold perspective based on the duality utility-prosumer as a function of the measurement time. A global PQ index and 2D graphs are introduced in order to compress the time domain information and quantify the deviations of the waveform shape by means of three parameters. Time-scalability allows two extra features: long-term supply reliability and power quality in the short term. As a case study, the work illustrates a real-life monitoring in a building connection point, offering 2D diagrams, which show time and space compression capabilities, as well.

1. Introduction

Power quality monitoring (PQM) has become a major concern in recent years due to the increasing complexity of modern power systems within the integration of distributed energy resources in the electrical network [1]. The latest advances related to communication technologies, monitoring devices, and multiple data processing algorithms constitute significant changes that make it possible to introduce more monitoring points as part of the advanced metering infrastructure [2] at all voltage levels [3,4]. Consequently, the number of fixed PQ analyzers has increased, and the large amount of data is managed according to different measurement strategies, depending on the European country [5].
In this scenario, the methods to inform about the reliability of the system need to be updated and adapted to monitor both the reliability and the quality of the power supply in a large-scale context [6]. Nevertheless, the analysis is not easy if data lack organization and the appropriate format to be processed and the rules to be turned into knowledge [7]. Flexible and optimal representation is demanded in order to introduce methods at different scales such as the monitored area, site, the connection point under test, and the duration of the monitoring period in time (long and short term) [8]. The power quality triangle represents a unified result that outlines the different layers involved in different measurement campaigns [7] in order to extract conclusions within data information and make the correct decisions as a result of monitoring. As a consequence, companies could manage their assets more effectively by combining enterprise application integration (EAI) and PQ data [8,9].
In addition, the smart grid (SG) demands the empowerment of individual customers and prosumers taking part in the decisions in a new market model [10], where new energy profiles are appearing [11] and learning-based systems help empower customers to select companies according to the price and electricity fulfillment [12]. In this sense, it is crucial to fill in the gap between the energy delivered by utilities and how end users assess the quality of the energy. Indeed, the strategies to inform customers about reliability and PQ are crucial and therefore need to be considered by companies, even more when actual standards include contractual features related to power quality [2,13].
Regarding the time scale that best fits the requirements, the majority of the measurement systems cannot cope with all time intervals. Furthermore, not all instruments are suitable for all measurement location sites. For this reason, a variety of site and disturbance indices has been developed according to different thresholds. However, there is a lack of indices that account for waveform information, voltage, and current. Each index has a different purpose, which ranges from location to event type; consequently, it is difficult to established an objective comparison among all the indices.
Not very many tools enable navigation between reliability and power quality with relative ease. For this reason, scalable methods are breaking through in this new scenario; scalability allows representing different operating conditions ranging from short time to long time windows, providing a more comprehensive representation of the network status.
All in all, the present paper proposes a method to monitor the supplied voltage waveform (sinusoidal, periodic, and stationary) based on time-compression using higher-order statistics (HOS). The method translates the time domain information to the statistical plane, therefore proposing a new way to represent data in advanced metering infrastructure. HOS was previously used in power quality studies characterizing the waveform shape according to the deviations that arise from the non-stationary nature of data. Most of the literature shows that HOS has been applied efficiently to event detection [14,15]. Nevertheless, the aim of the present contribution is to explore the analytical capabilities of HOS in order to characterize the normal operating conditions of the network within a minimum period of a week. In this sense, the present work proposes three individual statistics (variance, skewness, and kurtosis) and a global PQ index to be combined so as to improve power quality assessment and graphical representation. The subsequent idea is to monitor the waveform shape by means of bi-dimensional scalable graphs, which, depending on the time interval, provide different insights into the point under test and the deviations with respect to the ideal supply. Additionally, the information characterizes reliability in the dual perspective of the utility-consumer. The proposed methodology has been applied in a monitoring campaign developed during a week and considering a single building connection point.
The paper is structured as follows: Section 2 reviews the trends in reliability and PQ monitoring, covering the challenges in future distribution networks. Section 3 describes the measurement method based on an example that illustrates the behavior of the voltage dynamics in the graphs, each of which are associated with the PQ index. The method is exposed in Section 3 through a real-life case-study, which performs a complete analysis of PQ during the whole week. Finally, conclusions and future work are drawn in Section 5.

2. Reliability and PQ Monitoring in Industry Practice

Technological advances both in architecture and communications in the SG, the EAI frame, and the regulatory aspects that trigger the requirements and recommendations regarding PQ monitoring are changing the methods and measurement equipment in the industry practice. This section summarizes the issues for PQ monitoring, including recommendations on how big data should be managed and organized.

2.1. Instruments and Communication

During the last three decades, instruments have incorporated new functionalities in order to perform advanced PQ measurements. The most relevant aspects associated with the instrumentation for reliability and PQ are summarized below.
Fixed instruments have been spread throughout the entire network thanks to the full- reliable last mile communication systems. In addition, the introduction of robust wireless communication protocols has led to the development of feasible AMR (automated meter readers) and DMS (demand side management). Current instruments incorporate communication interfaces, intelligent algorithms to process data, and storage capabilities.
Considering reliability, instruments measure system availability, outage frequency, and time responses under weather phenomena, overloading, wildlife effects, and other features. In addition, PQ measurements are being introduced in smart meters. Within this context, it has been reported in [16] that utilities and TSOs (transmission system operators) mainly use fixed PQ monitors, while DSOs (distributed system operators) handle portable analyzers. However, from the customer’s point of view, the instrument should be more flexible, as the branch of customers’ needs is wide. In this sense, it is expected that PQ functionalities can help the customer monitor power supply more dynamically [17]. Nevertheless, the flexible capabilities are a choice, without considering the customer requirements, and not a requirementwhen a measurement campaign is deployed [5].
Therefore, the criteria to select the instruments are based on the performance regarding the specific standards more than any other issues such as the support after purchase [16] and the customers’ objectives. Indeed, new types of customers (prosumers) are appearing that require the introduction of friendly interfaces and practical representations of the network status that enable making prompt decisions and demands for supply breaches.

2.2. PQ Data Organization Tendencies: The Need for Compression

As a consequence of the increase in the number of measurement locations and the introduction of communication technologies in the SG, data management is a relevant issue in order to improve EAI [8,18].
The time-intensive activities of handling big data require more specific analysis techniques based on the introduction of automatic procedures capable of representing data in a compact way. Current instruments cannot provide the final user with this flexibility due to the lack of compression functionalities. In this sense, a mix of research goals between electrical power systems and signal processing methods that optimize electrical signal waveform compression is needed. Numerous efforts have been made during the last decade to shorten long time-series into a unique number as a result of post-processing and information sharing [19,20]. Extracting some relevant features capable of describing amplitude, frequency, and phase changes facilitates data storage and monitoring in the SG.
The main compression techniques used in electric signals have been accurately described in [20] and are divided into lossless and lossy techniques. The former includes image compression techniques, and the latter gathers discrete transformations and parametric coding and mixed solutions. Lossless compression algorithms (LCA) of archives in the smart grid and PQ data series are focused on solving the aggregation resulting from a continuous monitoring [21]. Among some works, we remark about the use of 2D representations for compact energy coefficients and avoiding data redundancy in the work [22]. Furthermore, based on wavelets, the work in [19,20] is remarkable, where an adaptive approach estimates the fundamental sinusoidal component and separates it from the transients. In these works, the limitations are based on the computational burden and the noise effects. These limitations can be solved using HOS [14].
Utilities can introduce this flexibility and navigate within the former reporting levels, which enables analyzing PQ data at the site level, adopting mitigation measures from the network perspective, or reporting PQ compliance if the focus is on the utility performance [8,16]. In this scenario, it has been claimed that both time and space compression are key aspects for all PQ reporting levels based on the PQ triangle [8]. Three types of PQ reports have been distinguished, namely, site, network, and utility, which involve time and space compression concepts. As will be seen hereinafter, compression is a concept to bear in mind in the goal of designing a PQ index.

2.3. PQ Global Indices

Dealing with global indices implies a series of issues to be borne in mind. First is scalability. Scalable indicators must deal with the time domain duality reliability and power quality assessments. Also important are the existing strategies to present monitoring results related to the network state in the normal condition and under the influence of electrical perturbations [2]. The main difference between these approaches is within the measurement interval: reliability deals with interruptions of more than five minutes, while PQ events concern short events of less than three minutes.
Secondly, global PQ indices were initially conceived to meet utilities needs (AMR, data processing, and monitoring) and were not customer oriented [23]. Thus, these concepts need to be reformulated, as the customer is acquiring an important role in power quality assessment within the framework of the SG. In this sense, researchers have proposed customer dissatisfaction indices (CDI), which are usually conceived of for network planning and defined as the probability of not having fulfilled the contractual conditions regarding the power supply, when a level of security is overcome [16,24,25]. A recent example of the customer-based reliability approach consists of a solution proposed for Finish distribution companies [26]. However, the perspective settling on PQ is lost within this conception, as the time instances are not really monitored, as a consequence of not having taken into account the time scalability concept and the compression strategies. This is the idea in the work [7], which separates disturbance indices used in standards, combining them in order to provide a unified PQ insight. However, the customer approach is not considered in monitoring issues.
Furthermore, it is worth mentioning a tendency to propose more intuitive indicators. The deviation index based on principal curves proposed in [27] is a generic index that can be used for any type of disturbance; it quantifies the deviation from the contractual conditions by making use of two time scales (reliability and power quality lengths) and new diagrams that avoid the time variable. However, this index has been tested only under the influence of short PQ events, and no disquisitions have been made regarding reliability.
Previous authors’ contributions propose time-compression of the sinusoidal waveform of 50 Hz [14], in which the potential of HOS was shown. HOS are capable of mapping a stable triplet of values associated with each electrical disturbance type.
More work involving the trajectories of real HOS estimators and their deviations from the ideal 50-Hz sinusoidal waveform has been developed in [28], which proposes a method that computes deviations of the supplied energy in more intuitive graphs. That contribution was focused on specific PQ event detection such as sags and swells in short monitoring periods. Once again this is evidence of the fact that current systems neither include the possibility of navigation between different time scales, nor have they been tested in sessions where power quality and reliability are involved, i.e., it would be desirable to have an instrument capable of storing (compressed) data that will enable browsing from short to long time-scales.
In order to achieve the condition to provide a global index, the authors consider that it must enable navigation between different monitoring time-series, proving to be applicable to both long-term and short-term monitoring sessions, and this must lead to reliability and disturbance detection monitoring.
All in all, the PQ analysis tools lack temporal scalability, and there is no agreement regarding data processing and the whole measurement procedure. Consequently, there is a premier need for developing flexible methods to be deployed in instruments capable of adapting not only to the measurement points, but also presenting data using new concepts that are more understandable and valid through the entire chain of the electrical network and enhancing the EAI for the utility. In this sense, the proposed method is a time compression method conceived of to provide flexibility to the instruments that introduce PQ functionalities. Their main difference related to previous works [14,28] resides in the possibility to inform about the normal operating conditions by measuring the voltage waveform both in the long term and short term. A scalable and global PQ index is introduced and related to the bi-dimensional graphs that store the voltage information of the network status.

3. The Scalable Method Using HOS

The method based on HOS uses a global indicator of the quality of the waveform shape in the time domain. Based on a set of three 2D-HOS diagrams, which compare pairs of statistics (the measurands), it quantifies the non-ideal waveform characteristics (features) for a given time analysis window (measurement time), i.e., variance vs. skewness, variance vs. kurtosis, and skewness vs. kurtosis. Additionally, it is worth mentioning that the 2D-HOS traces provide complementary information that goes beyond the mere second-order values, like the RMS (root-mean square).
The main difference with respect to the existing indicators is that it gathers information related to the waveform shape, which has not been computed yet in former works. Indeed, while the current indices provide information regarding specific disturbances, this global index characterizes amplitude, frequency, and phase changes. The PQ index provides an average measurement of the voltage quality in the point under test, for a given time interval. Thus, for a given time frame, graphs complement the numerical information provided by the index, making it easy to relate the index value to the waveform shape. Furthermore, the scalability of the method can measure the voltage waveform ranging from 0.02 s (a cycle) to a week-long temporalwindow.
The current procedure of analysis is described as follows. As the time analyzing window sweeps the signal under test, the 2D diagrams are generated, and the following points are considered. Each point in a 2D-HOS diagram (a pair or coordinates) corresponds to one cycle in the time-domain; this is precisely the temporal resolution of the measurement method and the N:1 time compression.
The stable ideal (steady state) triplet is given by: variance = 0.5; skewness = 0.0; kurtosis = 1.5; and it describes the non-disturbed ideal sine wave of the power supply. These ideal values are located in the origin of each coordinate in the three 2D-HOS diagrams.
In order to describe the PQ index, the following magnitudes have to be previously defined:
Δt:
measurement interval.
sij:
jth statistic associated with the ith period.
s ^ j :
nominal jth statistic.
M:
number of periods contained in Δ t .
N:
number of statistics for characterization.
Given a measurement points in the SG, the realization of the unified PQ index is initially conceived as a function of the specific deviations of each individual statistic with respect to its nominal value and is given by the generic expression in Equation (1):
P Q Δ t = f | s 11 s ^ 1 | , , | s i j s ^ j | , , | s M N s ^ N | .
In this paper, a version based on the sum of the deviations has been implemented; it is given by Equation (2):
P Q Δ t = i = 1 M j = 1 N | s i j s ^ j | M .
Certainly, the deviations of each statistic from its ideal values assess and quantify the waveform shape. The present research uses three deviation terms in Equation (2). Variance deviations are related to the amplitude; symmetry is associated with the skewness; and the kurtosis assesses the sinusoid aspect. Thus, more than paying attention to a certain type of electrical disturbance, or their trajectory in time, the method proposes an examination of the contractual waveform and lays down a monitoring procedure of the deviations from the ideal value and the measured statistic. The final expression for the index is described in Equation (3):
P Q Δ t = i = 1 M | v a r i v a r ^ | + | s k i s k ^ | + | k u r i k u r ^ | M .
Figure 1 illustrates the measurement procedure. The acquired signal, u ( t ) , is normalized to the maximum amplitude, providing u e ( t ) , then the statistics are computed and located in the 2D trace. The 2D graph in Figure 1 shows how the diagram is traced as the time analysis window sweeps the whole time-domain register. In the end, N points are depicted (N signal periods), associated with the statistics pairs ( s j , s h ) with j and h [ 1 , , M ] .
Hereinafter, the former concepts, associated with the method, are explained through Figure 2 with the aid of a real-life voltage-supply waveform (50 Hz, 230 V r m s ) supposed to fulfill the compliance requirements, which was surveyed during one week (as part of a monitoring campaign) in the Polytechnic School of Algeciras (Spain). The temporal analysis has been segmented into six main intervals or observation periods (from left to right), each of which includes the previous one (overlapped) Figure 2. In the very first period of the series, it can be appreciated that the sinusoid waveform is not ideal at all. In the following ten cycles, the defects begin to be hidden, then it is followed by the sequences: 20-s, 1-h, 1-day, and 1-week segments. The complete one-week record is located at the top of Figure 2; just below the variance, the skewness and the kurtosis evolution during the surveyed week are depicted. The bottom three rows (fourth, fifth, and sixth) contain the variance versus skewness, variance versus kurtosis, and skewness versus kurtosis traces for each or the former time windows and aligned in these intervals. The ith-cycle is processed and generates a triplet (var i , skw i , kur i ); a pair of values corresponds to a point for each 2D graph; the origin of the coordinates represents the ideal situation; e.g., in the variance vs. skewness, the center is located in the coordinates (0.500, 0.000).
The span of the measurement is set to 0.07, according to the interval 0.45–0.52, inside which the variance fluctuations are well observed, so as to delve into the 2D graphs in Figure 2. The number of precision digits in the PQ has been set empirically to four, as it was observed that the fifth digit did not exhibit significant changes.
The first period shows that the shape is not sinusoidal at all (Figure 2). In fact, the normalized power supply signal does not reach the top normalized values (flat-top) (±1); a fact that is reflected in the variance, which keeps under the ideal reference of 0.500. The skewness is almost zero as the signal is equilibrated, and the kurtosis is slightly over 1.500, showing again a loss in the sinusoidal shape. The coordinates (x,y) of each pair of values quantify each of the PQ index terms.
During the next nine periods, the situation is very similar, with the exception of little variance and few kurtosis fluctuations, which show a dispersion in the probability 2D graphs. The next 20 s and the successive measurements are scattered round the first-cycle triplet values. In the next hour, the differences in variance are much more noticeable, the probability cloud being displaced towards the ideal values. A zone of this probability cloud corresponds to the 20 s analyzed in the previous graphs, since they are included in the represented hour. This fact can be observed in the probability cloud (cluster), which has moved to the right in the var. vs. kur. plane. This displacement is general for the rest of the elapsed time intervals.
During the following day, two different, and clearly marked, nuclei were observed, eliciting different behaviors Figure 2. The first one was characterized by a low variance, and its associated kurtosis was located above the ideal value, which is indicative of a shape degradation. The lower cloud centroid was nearer the ideal voltage supply state; the previously-analyzed hour was included in the first nucleus.
Looking at the time-series for the variance and the kurtosis, it can be seen that when the variance was above its ideal value, the same happened to kurtosis in general (Figure 2). During the last stretches of the day, the power supply voltage was recovered, a fact which is reflected in the second cluster of measurements. This part is associated with the night period, when the building is closed and the energy demand is minimum. It can be said that during the last intervals in this day, some measurement cycles would have reached the ideal values of variance and kurtosis (0.5; 1.5).
Finally, and concerning the whole analysis of the week, again, the profile of the behavior is confirmed; making it clear that the analyzed segments usually were much worse than the general behavior in the week. In summary, the proposed tool was able to provide characterizations of the waveform state in a similar framework, independently of the time interval.
A PQ index was defined on this basis, which gathered the deviations observed in these graphs, so that information could be compressed into a single value. However, some interesting remarks are inferred from the study of the time intervals. As the time interval length increased, the PQ value decreased. This was due to the averaging effect and the selection of a low quality starting point for explanation purposes; e.g., P Q w e e k = 0.0116 was much better than P Q 0.02 s = 0.0216 and P Q 0.2 s = 0.0223 . The introduction of the advanced index in PQ analyzers should consider the time evolution line in order to compare current measurements to historical ones that has been registered at the same time in different days. The PQ index compression to a single value can be convenient in simple instruments or applications that do not demand high storage.
The next section analyzes the temporal structure of the supply trace by exploiting the proposed visualization tool and its associated index.

4. Results

This section goes into the PQ analysis regarding the previously-monitored week, from which we show that depending on the windows’ length, the focus changes from reliability (wide windows) to PQ (shorter windows). Figure 3 shows the 2D voltage traces corresponding to the whole week, from which two relevant days, the best and the worst, have been selected so as to compare the trace evolution from the one-day frame to the 0.02-s frame (equivalent to ten cycles). The first column corresponds to the one-week results; then, the trace evolution from one day to 0.2 s is shown.
Indeed, this Figure 3 shows the detail of the PQ temporal organization. This tree structure can be easily followed from left to right as the temporal width decreases, from reliability (one week surveyed) to PQ indications (0.2 s monitored). Thus, it can be said that reliability patterns (long width time windows) can be confirmed as the aggregation of different PQ states (shorter windows). Therefore, as the monitoring scale decreases, the focus goes from the concept of reliability to the PQ event detection strategy. This fact illustrates one of the contributions of this measurement strategy: several analyses can be performed in a unified framework, allowing post comparisons among different time-scales. For instance, from the pattern in the one-week monitoring period, the worst and the best day can be distinguished, top and bottom 3 × 3 matrix block of 2D-HOS graphs, which exhibit extremely different behaviors. The general week pattern, resulting from the aggregation of shorter-time states, allows exploring the whole PQ history (from week to 0.2 s) following multiple sequences of frames, also enabling direct comparisons between frames of the same or different time scales, which provide information regarding deviations experimented in raw power supply data in the surveyed intervals.
Making quantitative remarks, for the worst day (the upper graph), the PQ increased as the time window was shortened. Paying attention to the heart of the figures, first of all, it is shown that the HOS plane allowed extracting details in the voltage signal supplied by the contract.
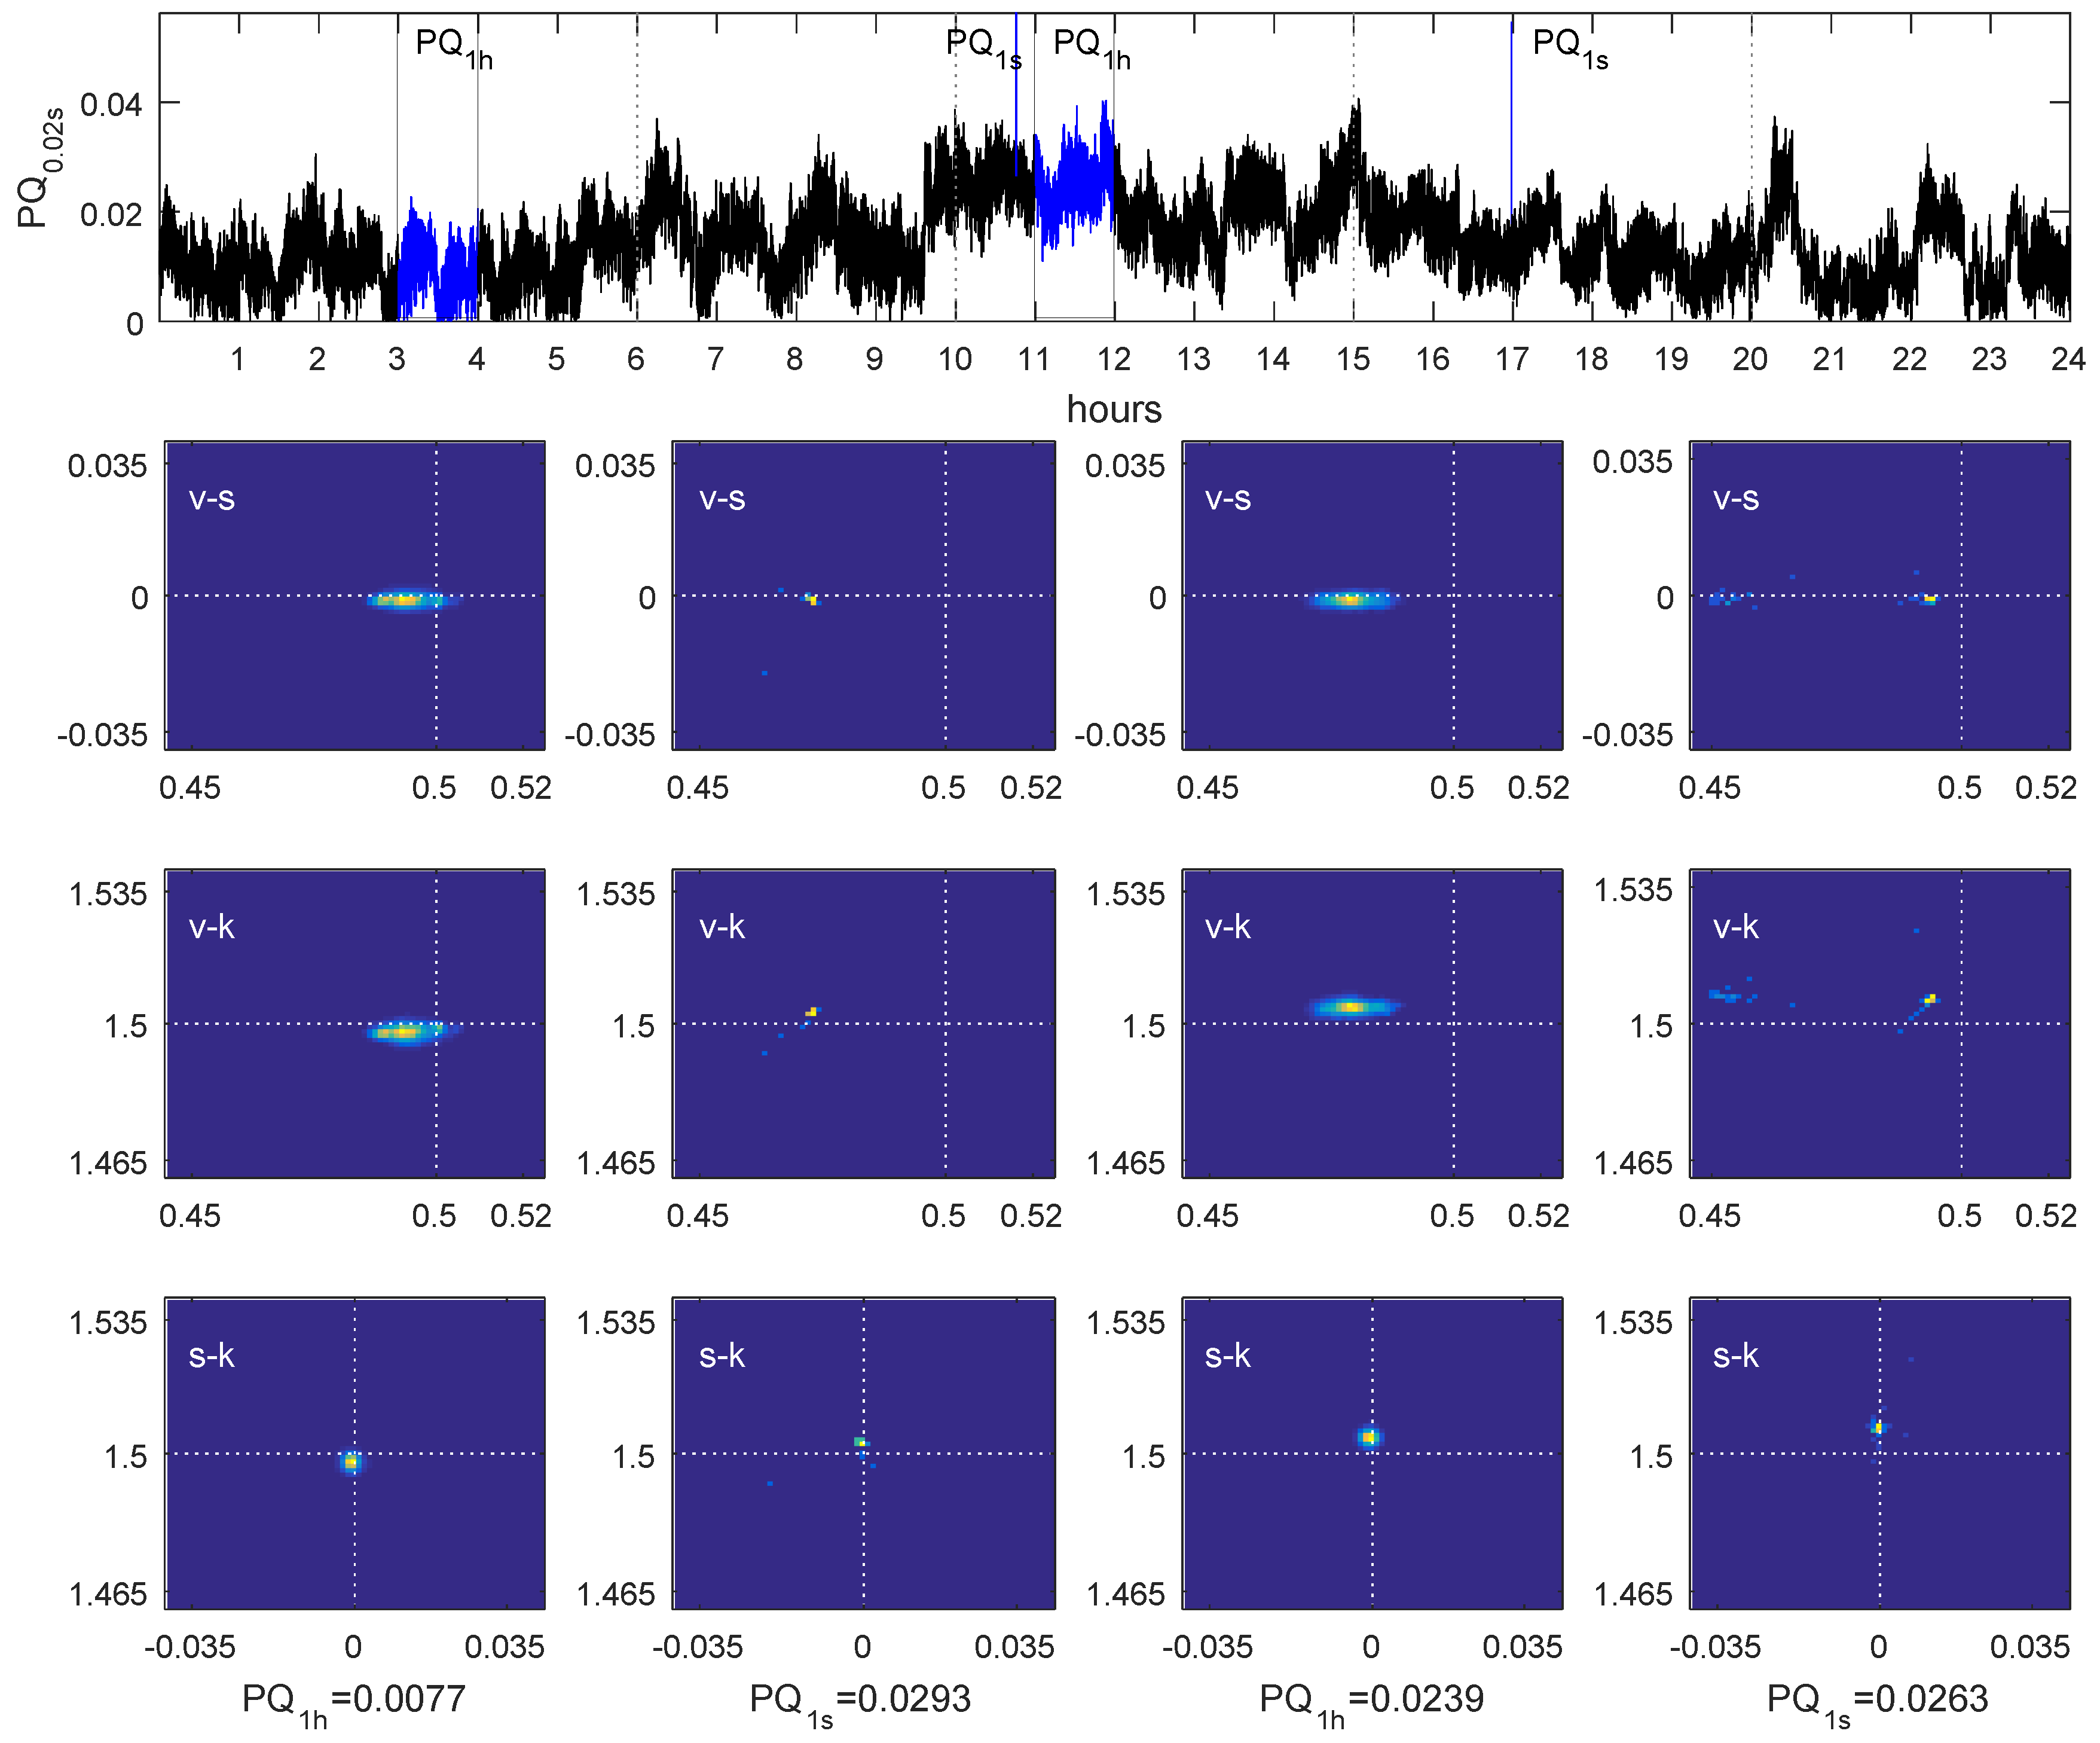
Figure 4 shows the non-stationary evolution of the PQ index during a day, with an average value of P Q d a y = 0.0138 . As a general remark, it is shown that the PQ depends on the period of the day.
Hereinafter, the analysis of the top PQ series in Figure 4 begins. First of all, a general analysis regarding the tendency of the curve was performed. Between 00H00 and 06H00, oscillations occurred just above the ideal value of zero, with an average of P Q 6 h = 0.0094 . Then, in the interval 06H00 and 10H00, the average value increased with the electricity demand, P Q 4 h = 0.0148 . Within the time stretch 10H00–15H00, the quality became worse with a P Q 5 h = 0.0205 , which were the central hours of the observed day. Then, in the interval 15H00–20H00, a soft decrease took place as a direct consequence of activity ceasing. The same was observed in the period 20H00–24H00.
Secondly, four time stretches have been selected to illustrate more specific behaviors: two relevant hours and two relevant seconds. For each one, its associated triplet of 2D-HOS graphs is drawn just below. The two-hour periods (03H04 and 11H12) enable explaining the dynamic of the trace through the day, making use of the PQ time series and the 2D HOS traces. The P Q 1 h was far different between the selected hours: P Q 1 h = 0.0073 vs. P Q 1 h = 0.0237 , respectively; more stable (near the ideal zero value) in the first and significantly worse (above zero) in the second hour under test.
The maximum PQ 0 . 02 s value was reached at PQ 0.02 s = 0.05 , within the analyzed second, between 10H00 and 11H00. This maximum may indicate the presence of at least one event. Thus, the statistical parameters deviated from the ideal values, even out of the tendency within this time interval. A singular event was detected in the HOS plane and was part of a series of events that marked a tendency of a high PQ.
The same maximum was reached within the second interval 15H00–20H00. This time, it seemed as if the PQ evolved closer to the ideal value. This can be observed in the v-k graph, where two clouds can be differentiated; the one in the left associated with the event group and the second one nearer the origin, where the ideal values are located. The demand intervals 06H00–14H00 and 15H00–20H00 can be extracted from the HOS graphs. They are also reflected in a 24-h monitoring solution based on the PQ index Figure 5.
As a general remark, this paper has proven that the PQ index gathered in a single value the formal behavior of a signal and that the HOS space offered much more information about the events’ occurrence. The combined use of the index and the 2D graphs improved the cycle-by-cycle detection. In addition, different monitoring objectives could be planned (e.g., testing PQ with different events, detecting only events that overpass a threshold or triggering the analysis before instructions or critical moments).
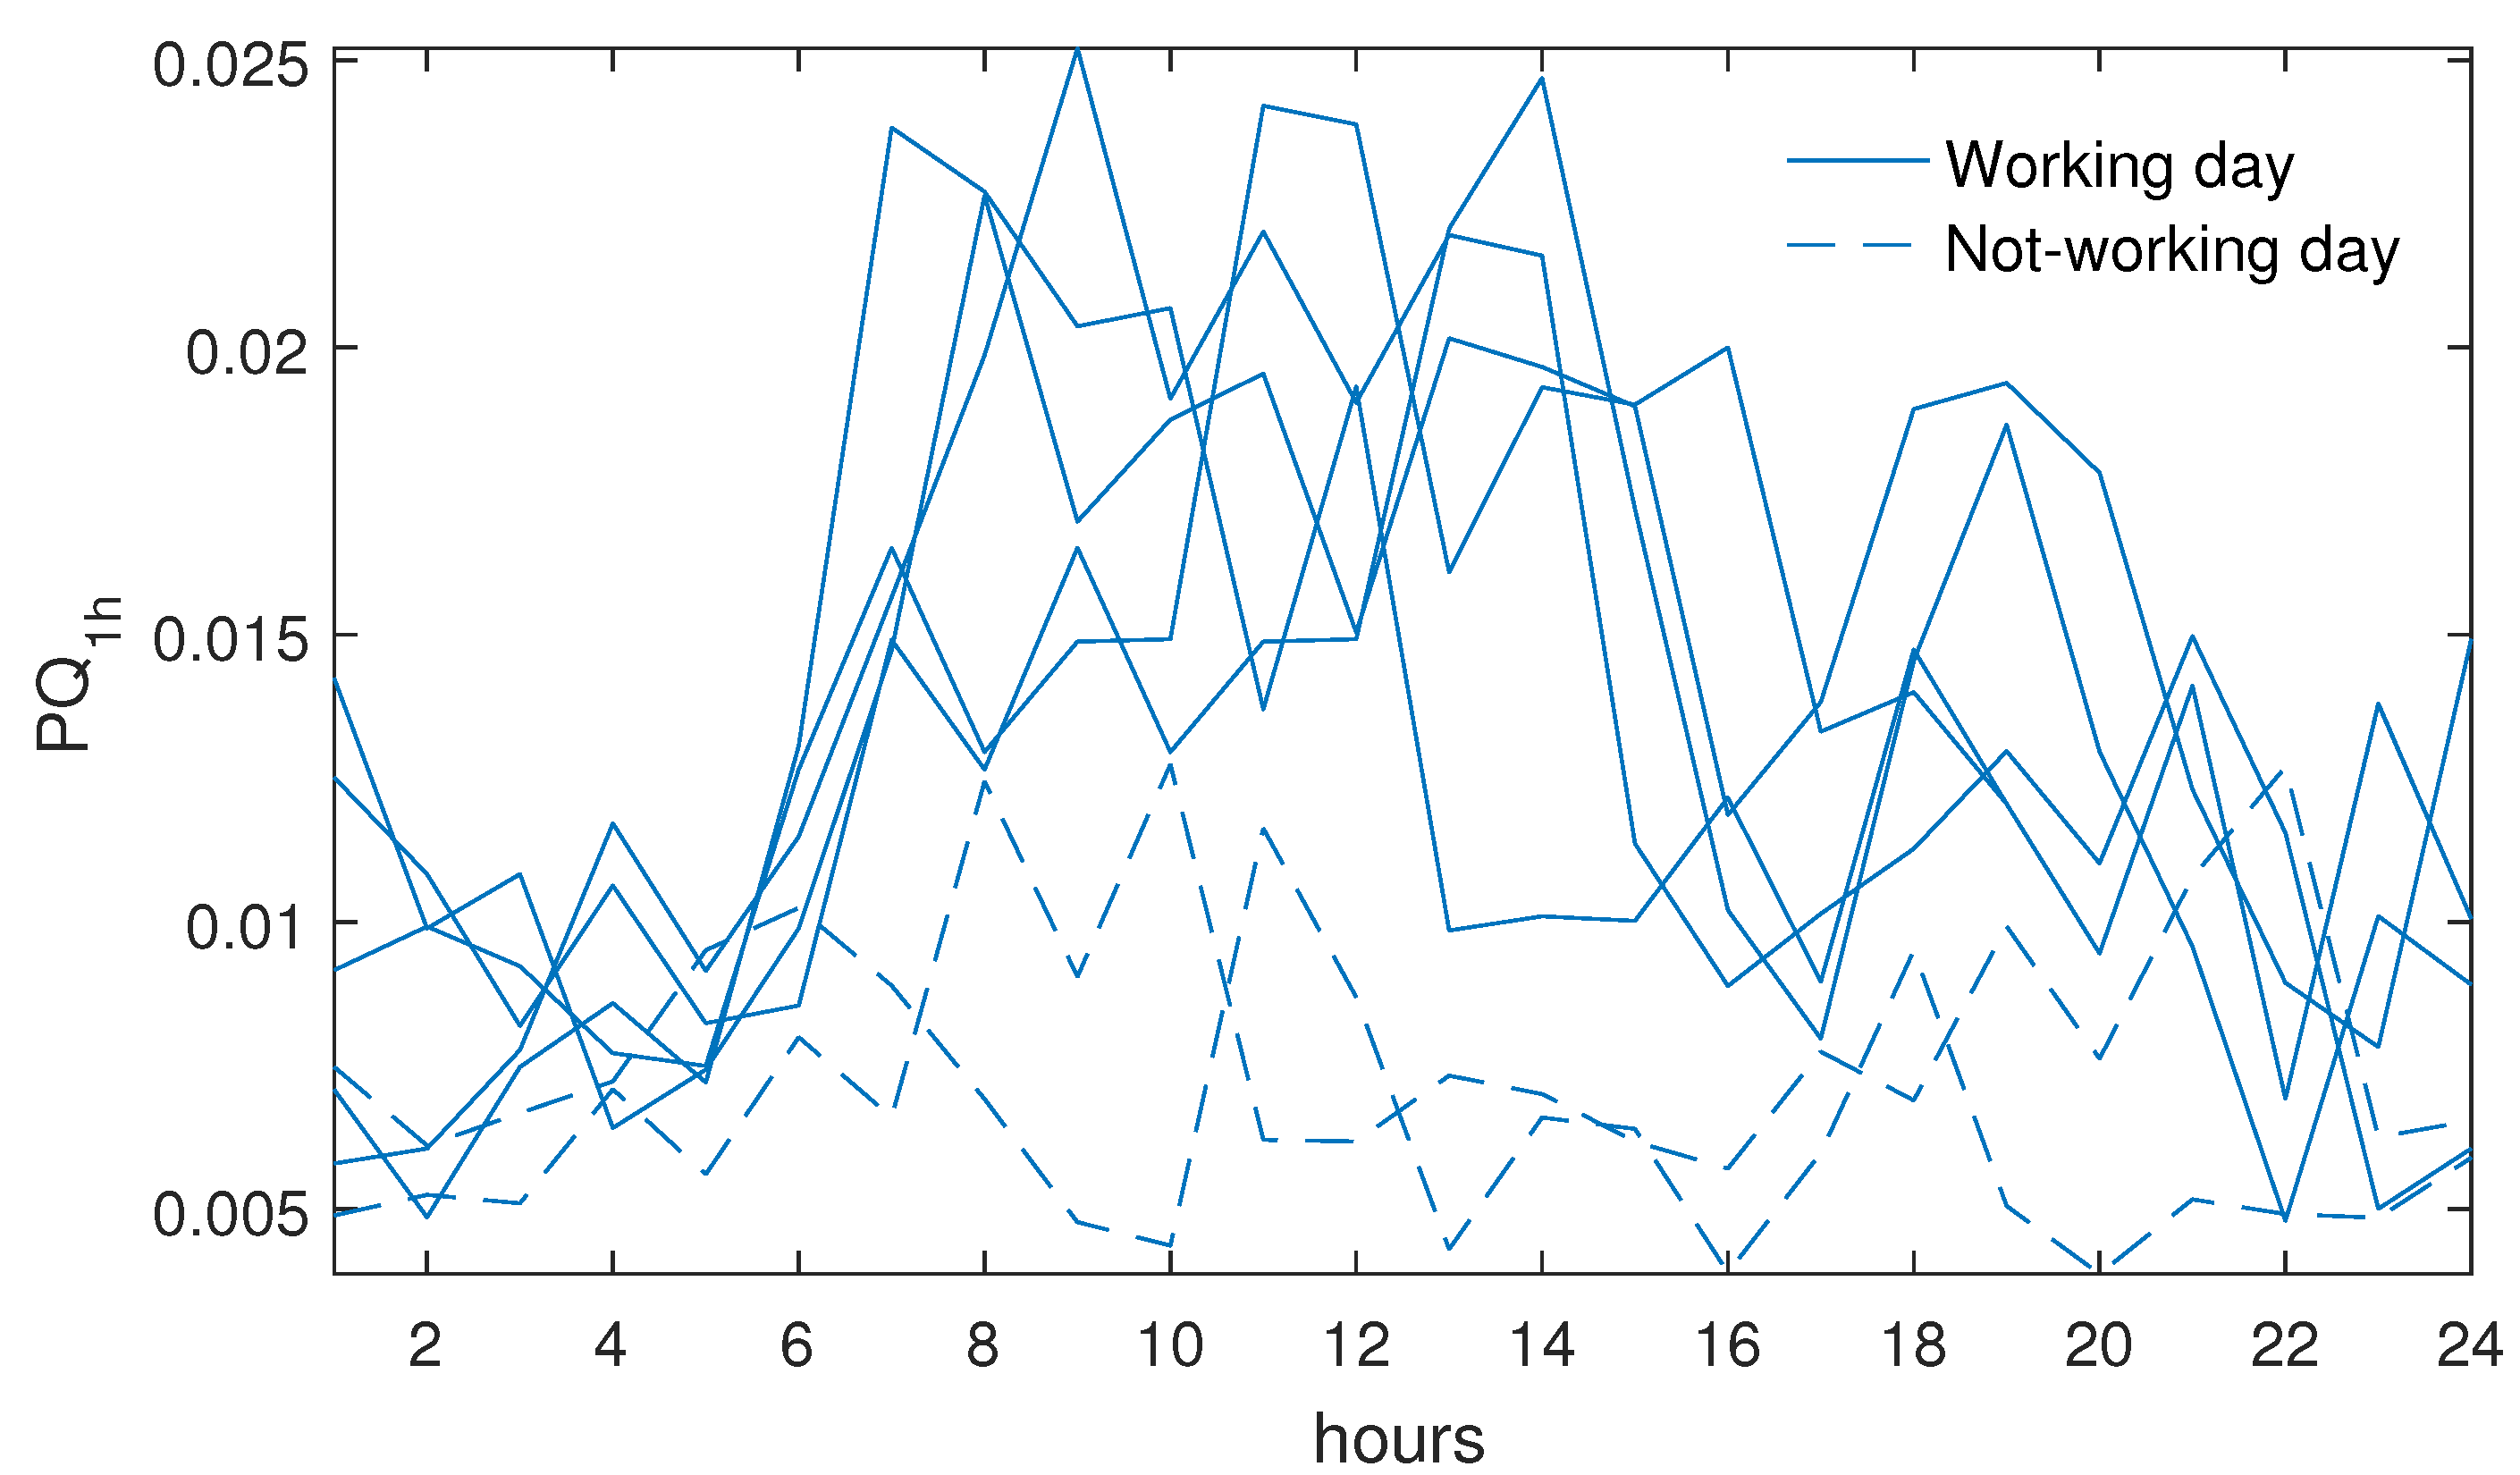
Finally, in order to show a strategy extracted from the whole of the raw data, Figure 5 represents the hourly trend of the index, during several days in the whole week. It is seen that while for a non-working day, the PQ value was always near zero, the five working days exhibited a quite different behavior, reaching maximum values.

5. Conclusions and Future Work

The HOS-based method characterizes the voltage waveform shape under normal operating conditions during long-term monitoring sessions. The statistics help compress the waveform information into three parameters that inform about the quality of the waveform in the point under test.
The main novelty of this method lies in its capability of time compression. Scalability allows browsing between reliability and power quality monitoring objectives, which is a desired property in the SG context. Furthermore, the method improves the visualization of the network status based on new graphs that help report the waveform information.
The validation of the method during one week (within a wider monitoring campaign), is aligned to the minimum measurement period according to the norm IEC 61000-4-30:2015. Indeed, differences can be found between working and non-working days and are clearly outlined in the graphs, along with the probability of PQ events. In this line, the authors propose the use of the PQ index and 2D graphs as a complementary tool to the existing ones as part of the advanced metering infrastructure.
The method is valuable for both the utility and the customer sides. Once the network operates outside the contractual operating conditions, the PQ index can establish a threshold that sets the limits for normal operations and triggers any further analysis or data storage.
The proposed method not only allows the temporal characterization of PQ, but also would enable PQ prediction, which is certainly one of the objectives within the current SG research scenario.
Future work consists of three main lines: first, to develop a power index forecasting unit that could be integrated with energy management systems, adding valuable information to that provided by the existing indices; secondly, to broaden our method, including more terms in the index and more 2D graphs, derived eventually from the new advances in the analysis of power quality monitoring; finally, machine learning techniques could be applied in order to estimate the grid state, the space compression of several supply points, and the three-phase behavior in the point under test when some events propagate.
References

Supplementary Materials

Supplementary File 1

Author Contributions

Funding acquisition, J.-J.G.-d.-l.-R.; methodology, A.A.-P. and O.F.-O.; project administration, J.-J.G.-d.-l.-R.; supervision, A.A.-P., J.-J.G.-d.-l.-R., and J.-C.P.-S.; visualization, A.A.-P. and O.F.-O.; writing, original draft, O.F.-O. and J.-J.G.-d.-l.-R.; writing, review and editing, O.F.-O. and J.-J.G.-d.-l.-R.

Funding

This research was funded by the Spanish Ministry of Economy, Industry and Competitiveness and the EU (AEI/FEDER/UE) via the research project TEC2016-77632-C3-3-R.

Acknowledgments

This research is supported by the Spanish Ministry of Economy, Industry and Competitiveness and the EU (AEI/FEDER/UE) in the workflow of the State Plan of Excellency and Challenges for Research, via the project TEC2016-77632-C3-3-R-COntrol and Management of Isolable NanoGrids: Smart Instruments for Solar forecasting and Energy Monitoring (COMING-SISEM), which involves the development of new measurement techniques applied to monitoring the PQ in micro-grids. Furthermore, we express our gratitude to the Andalusian Government for funding the Research Group PAIDI-TIC-168 in Computational Instrumentation and Industrial Electronics (ICEI.)

Conflicts of Interest

The authors declare no conflict of interest.

References

  1. Bollen, M.; Bahramirad, S. Is there a place for Power Quality in the Smart Grid? In Proceedings of the 16th IEEE International Conference on Harmonics and Quality of Power(ICHQP), Bucharest, Romania, 25–28 May 2014; pp. 713–717. [Google Scholar]
  2. Kilter, J.; Meyer, J.; Elphick, S.; Milanović, J.V. Guidelines for Power Quality Monitoring—Results from CIGRE/CIRED JWG C4.112. In Proceedings of the 16th IEEE International Conference on Harmonics and Quality of Power (ICHQP), Bucharest, Romania, 25–28 May 2014; Volume 1, pp. 703–707. [Google Scholar]
  3. Bollen, M.; Baumann, P.; Beyer, Y.; Castel, R.; Esteves, J.; Fajas, S.; Friedl, W.; Larzeni, S.; Trhulj, J.; Villa, F.; et al. Guidelines for good practice on Voltage Quality monitoring. In Proceedings of the 22nd IEEE International Conference on Electricity Distribution (CIRED), Stockholm, Sweden, 10–13 June 2013; Volume 1, pp. 1–4. [Google Scholar]
  4. Kilter, J.; Meyer, J.; Howe, B.; Zavoda, F.; Tenti, L.; Milanovic, J.; Bollen, M.; Ribeiro, P.; Doyle, P.; Gordon, J. Current practice and future challenges for power quality monitoring-CIGRE WG C4.112 perspective. In Proceedings of the IEEE 15th International Conference on Harmonics and Quality of Power, Hong Kong, China, 17–20 June 2012. [Google Scholar]
  5. McDaniel, J.; Friedl, W. Benchmarking of Reliability: North American and European Experience. In Proceedings of the 23th International Conference on Electricity Distribution, Lyon, France, 15–18 June 2015; pp. 15–18. [Google Scholar]
  6. Meyer, J.; Klatt, M.; Schegner, P. Power quality challenges in future distribution networks. In Proceedings of the 2nd IEEE PES International Conference and Exhibition on Innovative Smart Grid Technologies, Manchester, UK, 5–7 December 2011; Volume 1, pp. 1–6. [Google Scholar]
  7. Gosbell, V.J.; Perera, B.; Herath, H. Unified Power Quality Index (UPQI) for Continuous Disturbances. In Proceedings of the 10th IEEE International Conference on Harmonics and Quality of Power (ICHQP). Proceedings (Cat. No.02EX630), Rio de Janeiro, Brazil, 6–9 October 2002; Volume 1, pp. 316–321. [Google Scholar]
  8. Braun, J.; Gosbell, V.J.; Robinson, D. XML Schema for Power Quality Data. In Proceedings of the 17th IEEE International Conference on Electricity Distribution (CIRED), Barcelona, Spain, 12–15 May 2003; Volume 1, pp. 1–5. [Google Scholar]
  9. Kenner, S.; Thaler, R.; Kucera, M.; Volbert, K.; Waas, T. Comparison of smart grid architectures for monitoring and analyzing power grid data via Modbus and REST. EURASIP J. Embed. Syst. 2017, 2016, 1–13. [Google Scholar] [CrossRef]
  10. Li, N.; Chen, L.; Dahlen, M.A. Demand Response Using Linear Supply Funtion Bidding. IEEE Trans. Smart Grid 2015, 6, 1827–1838. [Google Scholar] [CrossRef]
  11. Rathnayaka, A.J.D.; Potdar, V.M.; Dillon, T.; Hussain, O.; Kuruppu, S. Analysis of energy behaviour profiles of prosumers. In Proceedings of the IEEE International Conference on Industrial Informatics, Beijing, China, 25–27 July 2012. [Google Scholar]
  12. Apostolopoulos, P.; Tsiropoulou, E.; Papavassiliou, S. Demand Response Management in Smart Grid Networks: A Two-Stage Game-Theoretic Learning-Based Approach. Mob. Netw. Appl. 2018, 23, 1–14. [Google Scholar] [CrossRef]
  13. IEC. IEC 61000-4-30. Electromagnetic Compatibility (EMC), Part 4: Testing and Measurement Techniques. Section 30: Power Quality Measurement Methods. Available online: https://webstore.iec.ch/publication/21844 (accessed on 20 December 2018).
  14. Agüera-Pérez, A.; Palomares-Salas, J.C.; De-la Rosa, J.J.G.; Sierra-Fernández, J.M.; Ayora-Sedeño, D.; Moreno-Muñoz, A. Characterization of electrical sags and swells using higher-order statistical estimators. Measurement 2011, 44, 1453–1460. [Google Scholar] [CrossRef]
  15. De-la Rosa, J.J.G.; Agüera-Pérez, A.; Salas, J.C.P.; Sierra-Fernández, J.M.; Moreno-Muñoz, A. A novel virtual instrument for power quality surveillance based in higher-order statistics and case-based reasoning. Measurement 2012, 45, 1824–1835. [Google Scholar]
  16. Milanović, J.; Meyer, J.; Ball, R.; Howe, W.; Preece, R.; Bollen, M.H.; Elphick, S.; Čukalevski, N. International Industry Practice on Power-Quality Monitoring. IEEE Trans. Power Deliv. 2014, 29, 934–941. [Google Scholar] [CrossRef]
  17. Alam, S.M.S.; Natarajan, B.; Pahwa, A. Distribution Grid State Estimation from Compressed Measurements. IEEE Trans. Smart Grid 2014, 5, 1631–1642. [Google Scholar] [CrossRef]
  18. Zhang, J.; Zheng, X.; Wang, Z.; Guan, L.; Chung, C.Y. Power System Sensitivity Identification-Inherent System Properties and Data Quality. IEEE Trans. Power Syst. 2017, 32, 2756–2766. [Google Scholar] [CrossRef]
  19. Ribeiro, M.V.; Romano, J.M.T.; Duque, C.A. An Improved Method for Signal Processing and Compression in Power Quality Evaluation. IEEE Trans. Power Deliv. 2004, 19, 464–471. [Google Scholar] [CrossRef]
  20. Tcheou, M.P.; Lovisolo, L.; Ribeiro, M.V.; da Silva, E.A.B.; Rodrigues, M.A.M.; Romano, J.M.T.; Diniz, P.S.R. The Compression of Electric Signal Waveforms for Smart Grids: State of the Art and Future Trends. IEEE Trans. Smart Grid 2014, 5, 291–302. [Google Scholar] [CrossRef]
  21. Kraus, J.; Stepan, P.; Kukacka, L. Optimal data compression techniques for Smart Grid and power quality trend data. In Proceedings of the IEEE 15th International Conference in Harmonics and Quality of Power(ICHQP), Hong Kong, China, 17–20 June 2012. [Google Scholar]
  22. Gerek, O.N.; Ece, D.G. Compression of power quality event data using 2D representation. Electr. Power Syst. Res. 2008, 78, 1047–1052. [Google Scholar] [CrossRef] [Green Version]
  23. Florencias-Oliveros, O.; De-la Rosa, J.J.G.; Agüera-Pérez, A.; Palomares-Salas, J.C. Discussion on Reliability and Power Quality in the Smart Grid: A prosumer approach of a time-scalable index. In Proceedings of the International Conference on Renewable Energies and Power Quality (ICREPQ18), Salamanca, Spain, 21–23 March 2018. [Google Scholar]
  24. Bollen, M.; Holm, A.; He, Y.; Owe, P. A customer-oriented approach towards reliability indices. In Proceedings of the 19th IEEE International Conference on Electricity Distribution (CIRED), Vienna, Austria, 21–24 May 2007; Volume 1, pp. 1–4. [Google Scholar]
  25. Holm, A.; Pyvänäinen, J.; Owe, P.; Paananen, H.; Bollen, M.H. Customer dissatisfaction index (CDI): Pilot use in network planning. In Proceedings of the 20th IEEE International Conference on Electricity Distribution (CIRED), Prague, Czech Republic, 8–11 June 2009; Volume 1, pp. 1–4. [Google Scholar]
  26. Lassila, J.; Kaipia, T.; Haakana, J.; Partanen, J.; Bollen, M. Customer-based reliability monitoring criteria for Finnish distribution companies. In Proceedings of the 7th International Conference Electric Power Quality and Supply Reliability (PQ2010), Lyngby, Denmark, 26–27 September 2010. [Google Scholar]
  27. Ferreira, D.D.; de Seixas, J.M.; Cerqueira, A.S.; Duque, C.A.; Bollen, M.H.; Ribeiro, P.F. A new power quality deviation index based on principal curves. Electr. Power Syst. Res. 2015, 125, 8–14. [Google Scholar] [CrossRef]
  28. Florencias-Oliveros, O.; De-la Rosa, J.J.G.; Agüera-Pérez, A.; Palomares-Salas, J.C. Power quality event dynamics characterization via 2D trajectories using deviations of higher-order statistics. Measurement 2018, 125, 350–359. [Google Scholar] [CrossRef]
Figure 1. Measurement procedure along with the outputs: PQ index and 2D traces.
Energies 12 00055 g001
Figure 2. Monitoring of one week using the method based on HOS with a minimum resolution of one cycle. From top to bottom: complete power supply time-series; variance evolution, skewness evolution; kurtosis evolution; variance-to-skewness graph family; variance vs. kurtosis 2D graphs; skewness vs. kurtosis set of graphs. Each time interval is characterized by its associated PQ index.
Energies 12 00055 g002
Figure 3. Scalability of the proposed method: two singular days within the analyzed week. The 3 × 3 2D-HOS graph matrix corresponding to the best (worst) day is located below (above). Within the worst (best) day, the worst (best) hour and the worst (best) 0.02 s are selected.
Energies 12 00055 g003
Figure 4. PQ 0.02 s values during 24 h, from which different intervals can be analyzed.
Energies 12 00055 g004
Figure 5. PQ tendency during 24 h, considering the whole week. Each PQ value is the result of an averaging of individual PQ-cycle measurements during one hour.
Energies 12 00055 g005

