Experimental and CFD Modelling: Impact of the Inlet Slug Flow on the Horizontal Gas–Liquid Separator


 , and
, and
Abstract
:1. Introduction
2. Experimental Work
2.1. Experimental Methodology
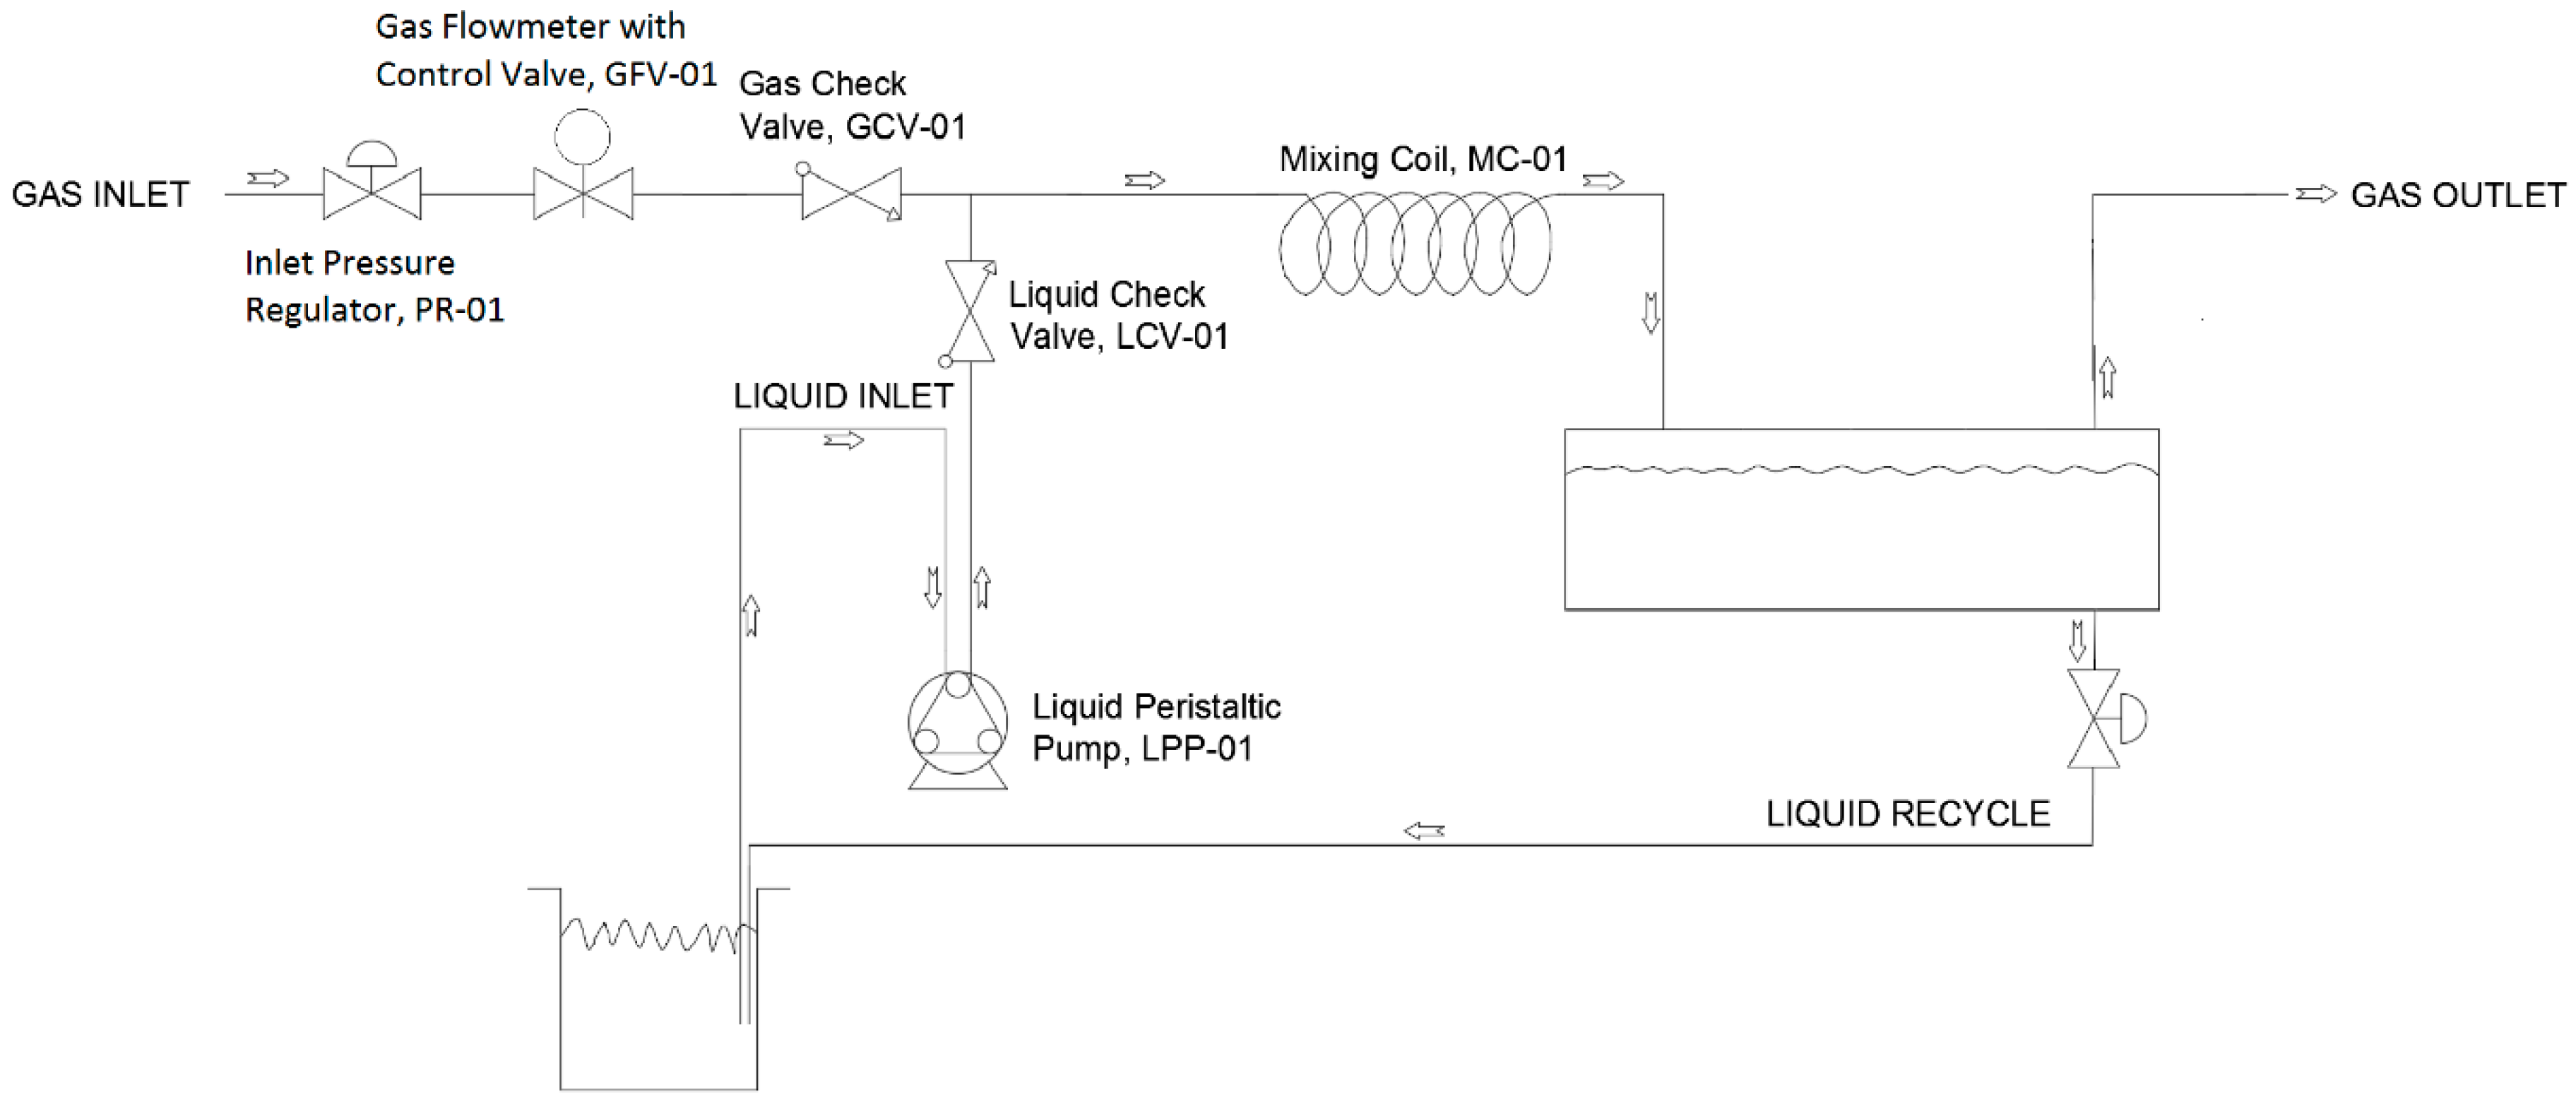
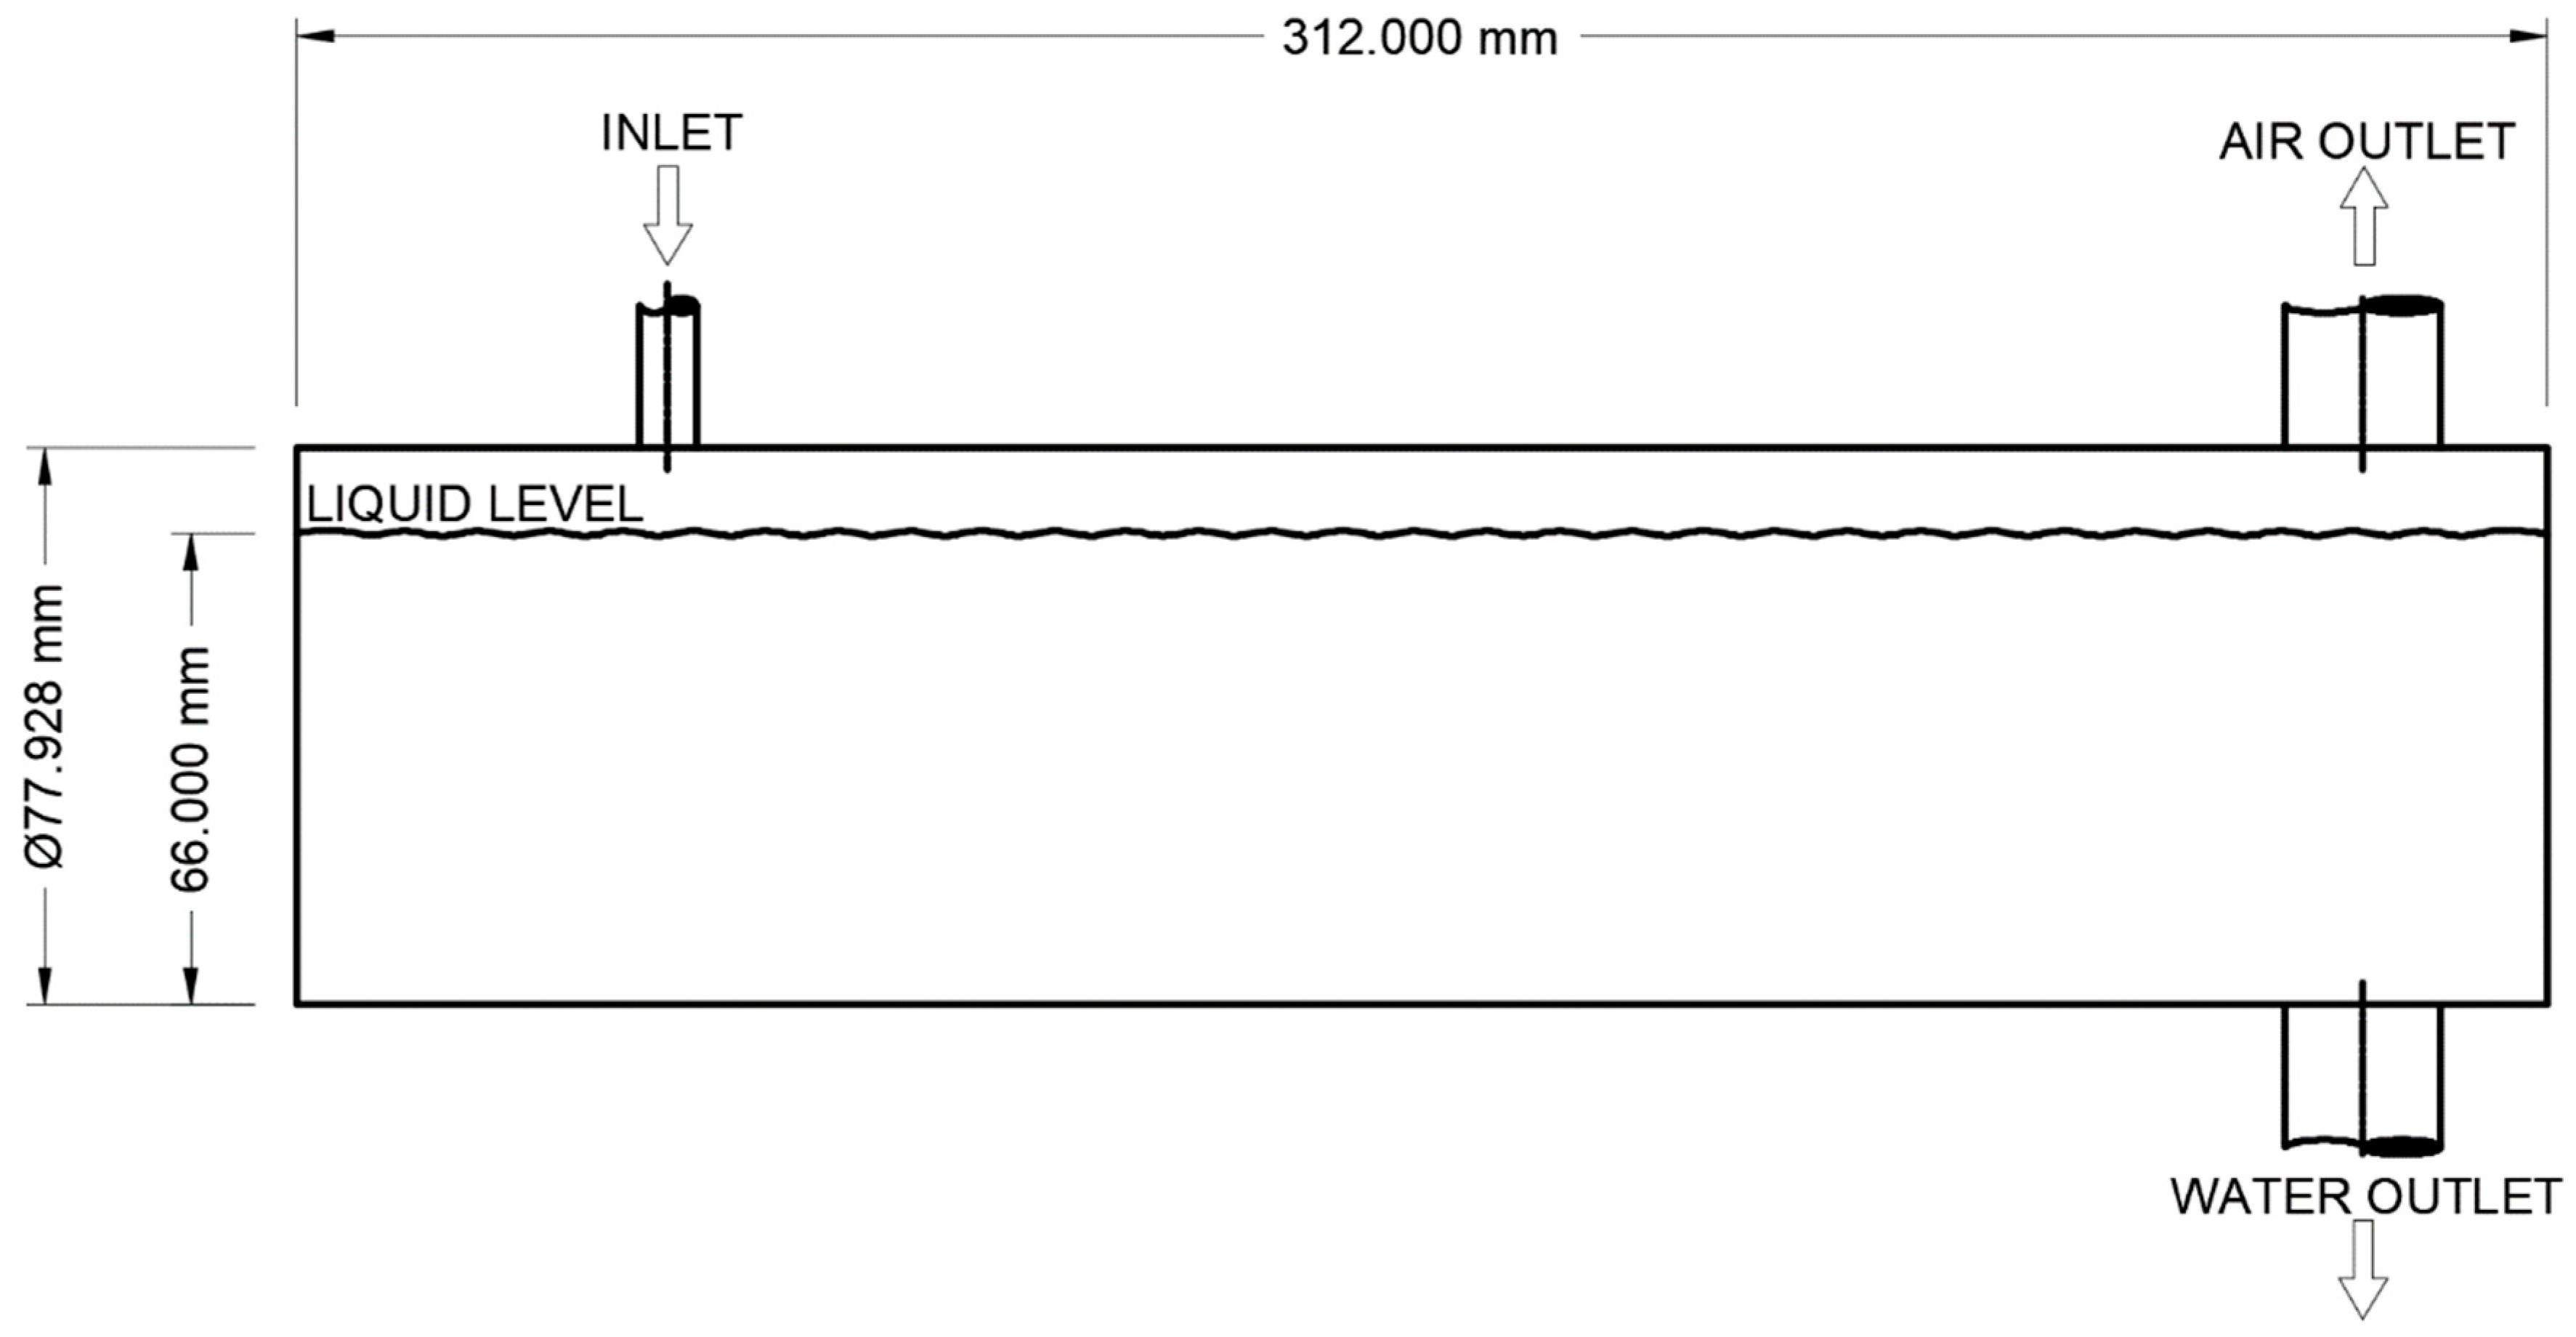
Experimental Setup
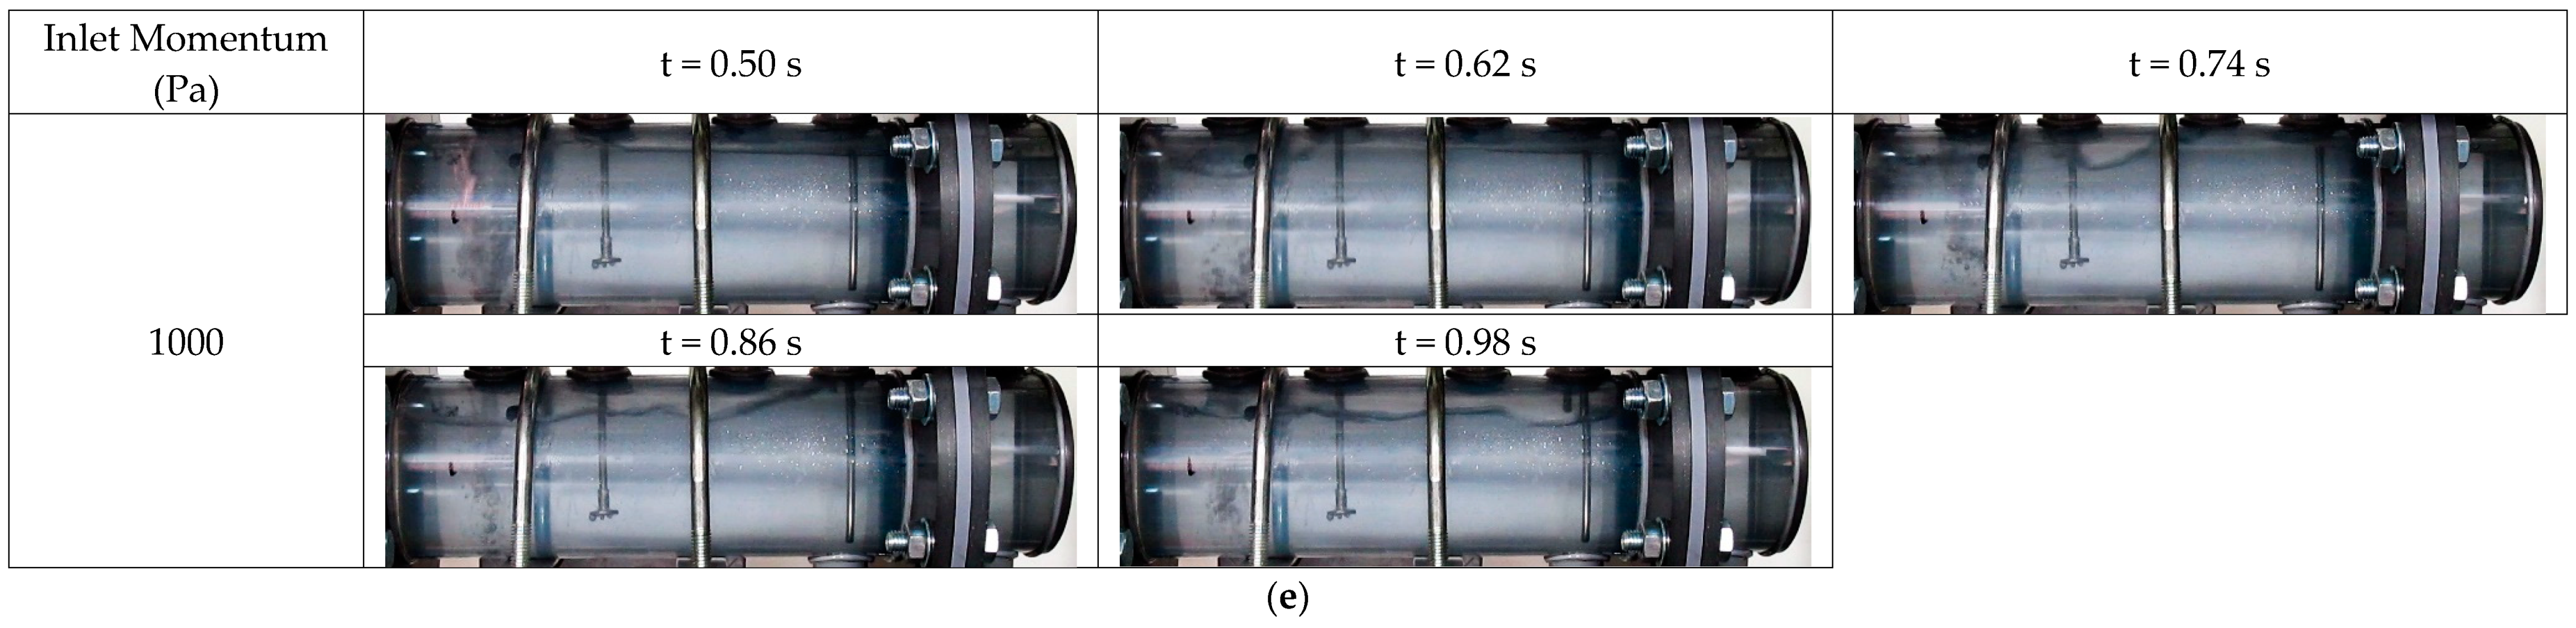
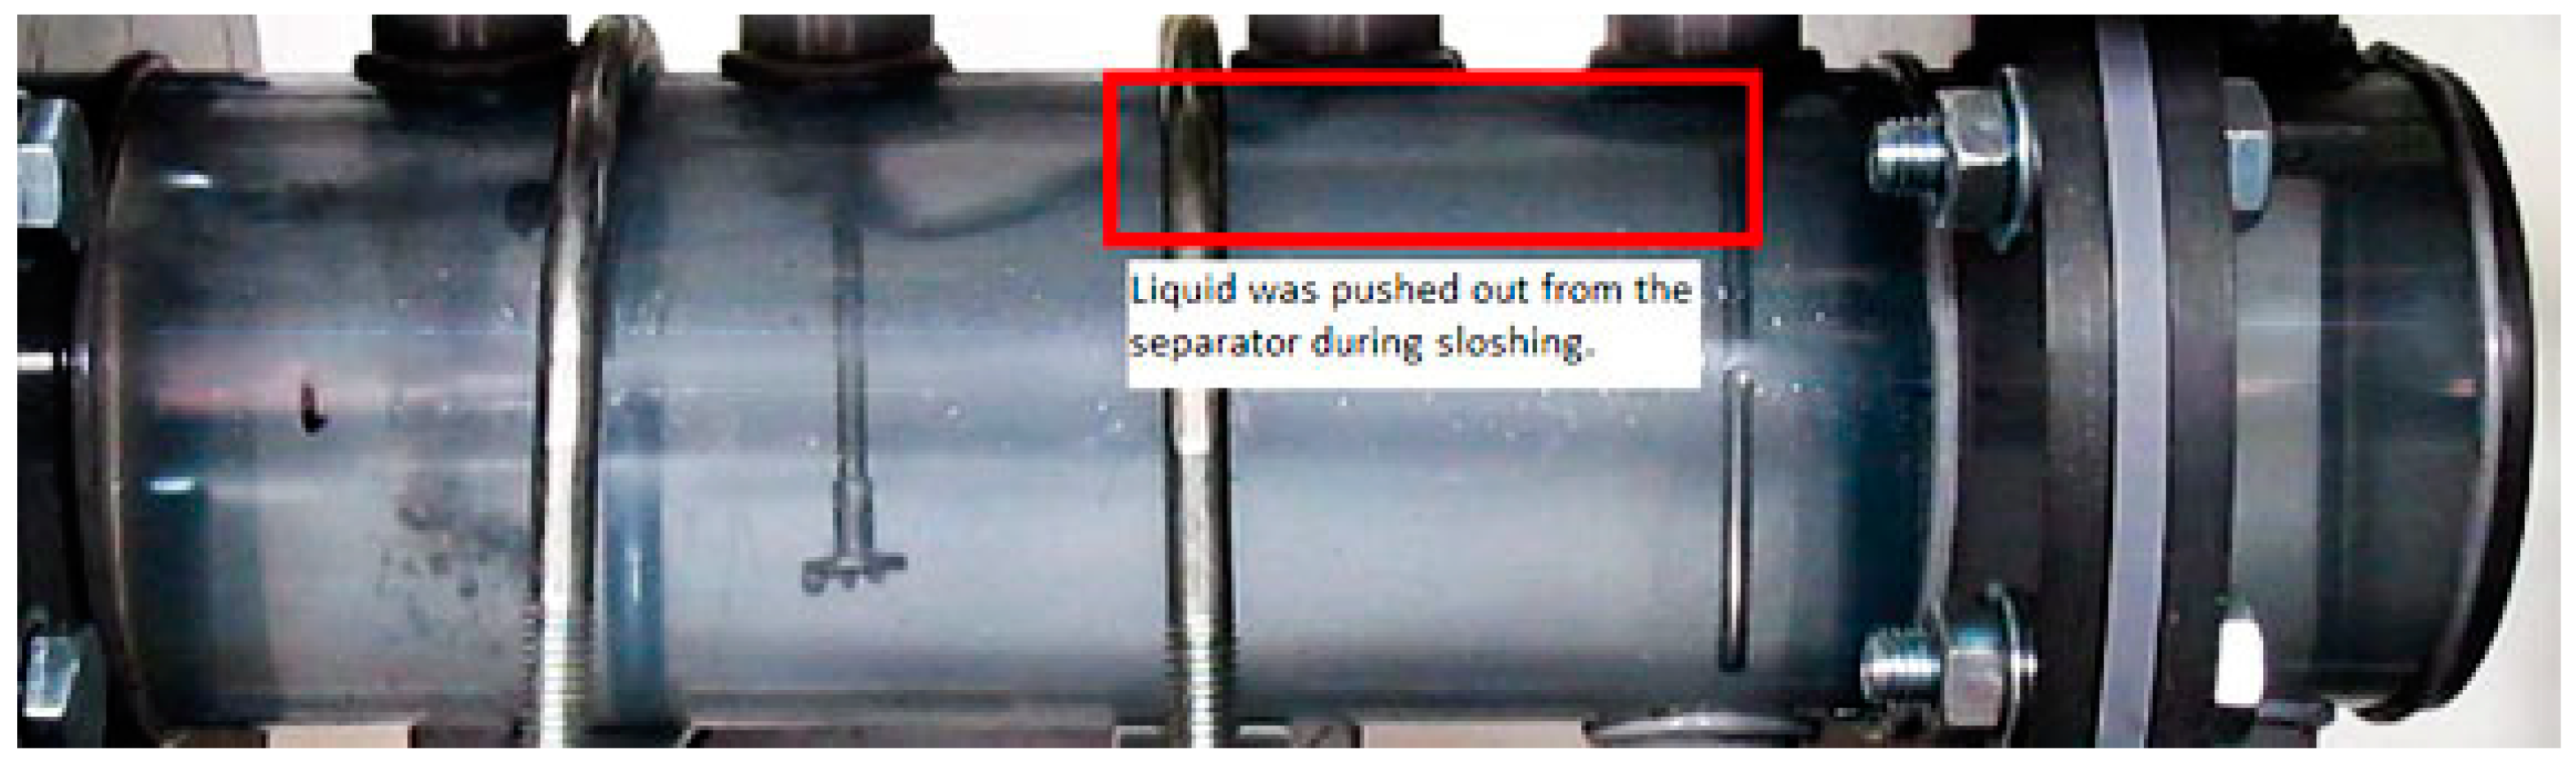
2.2. Result and Discussion of Experimental Work
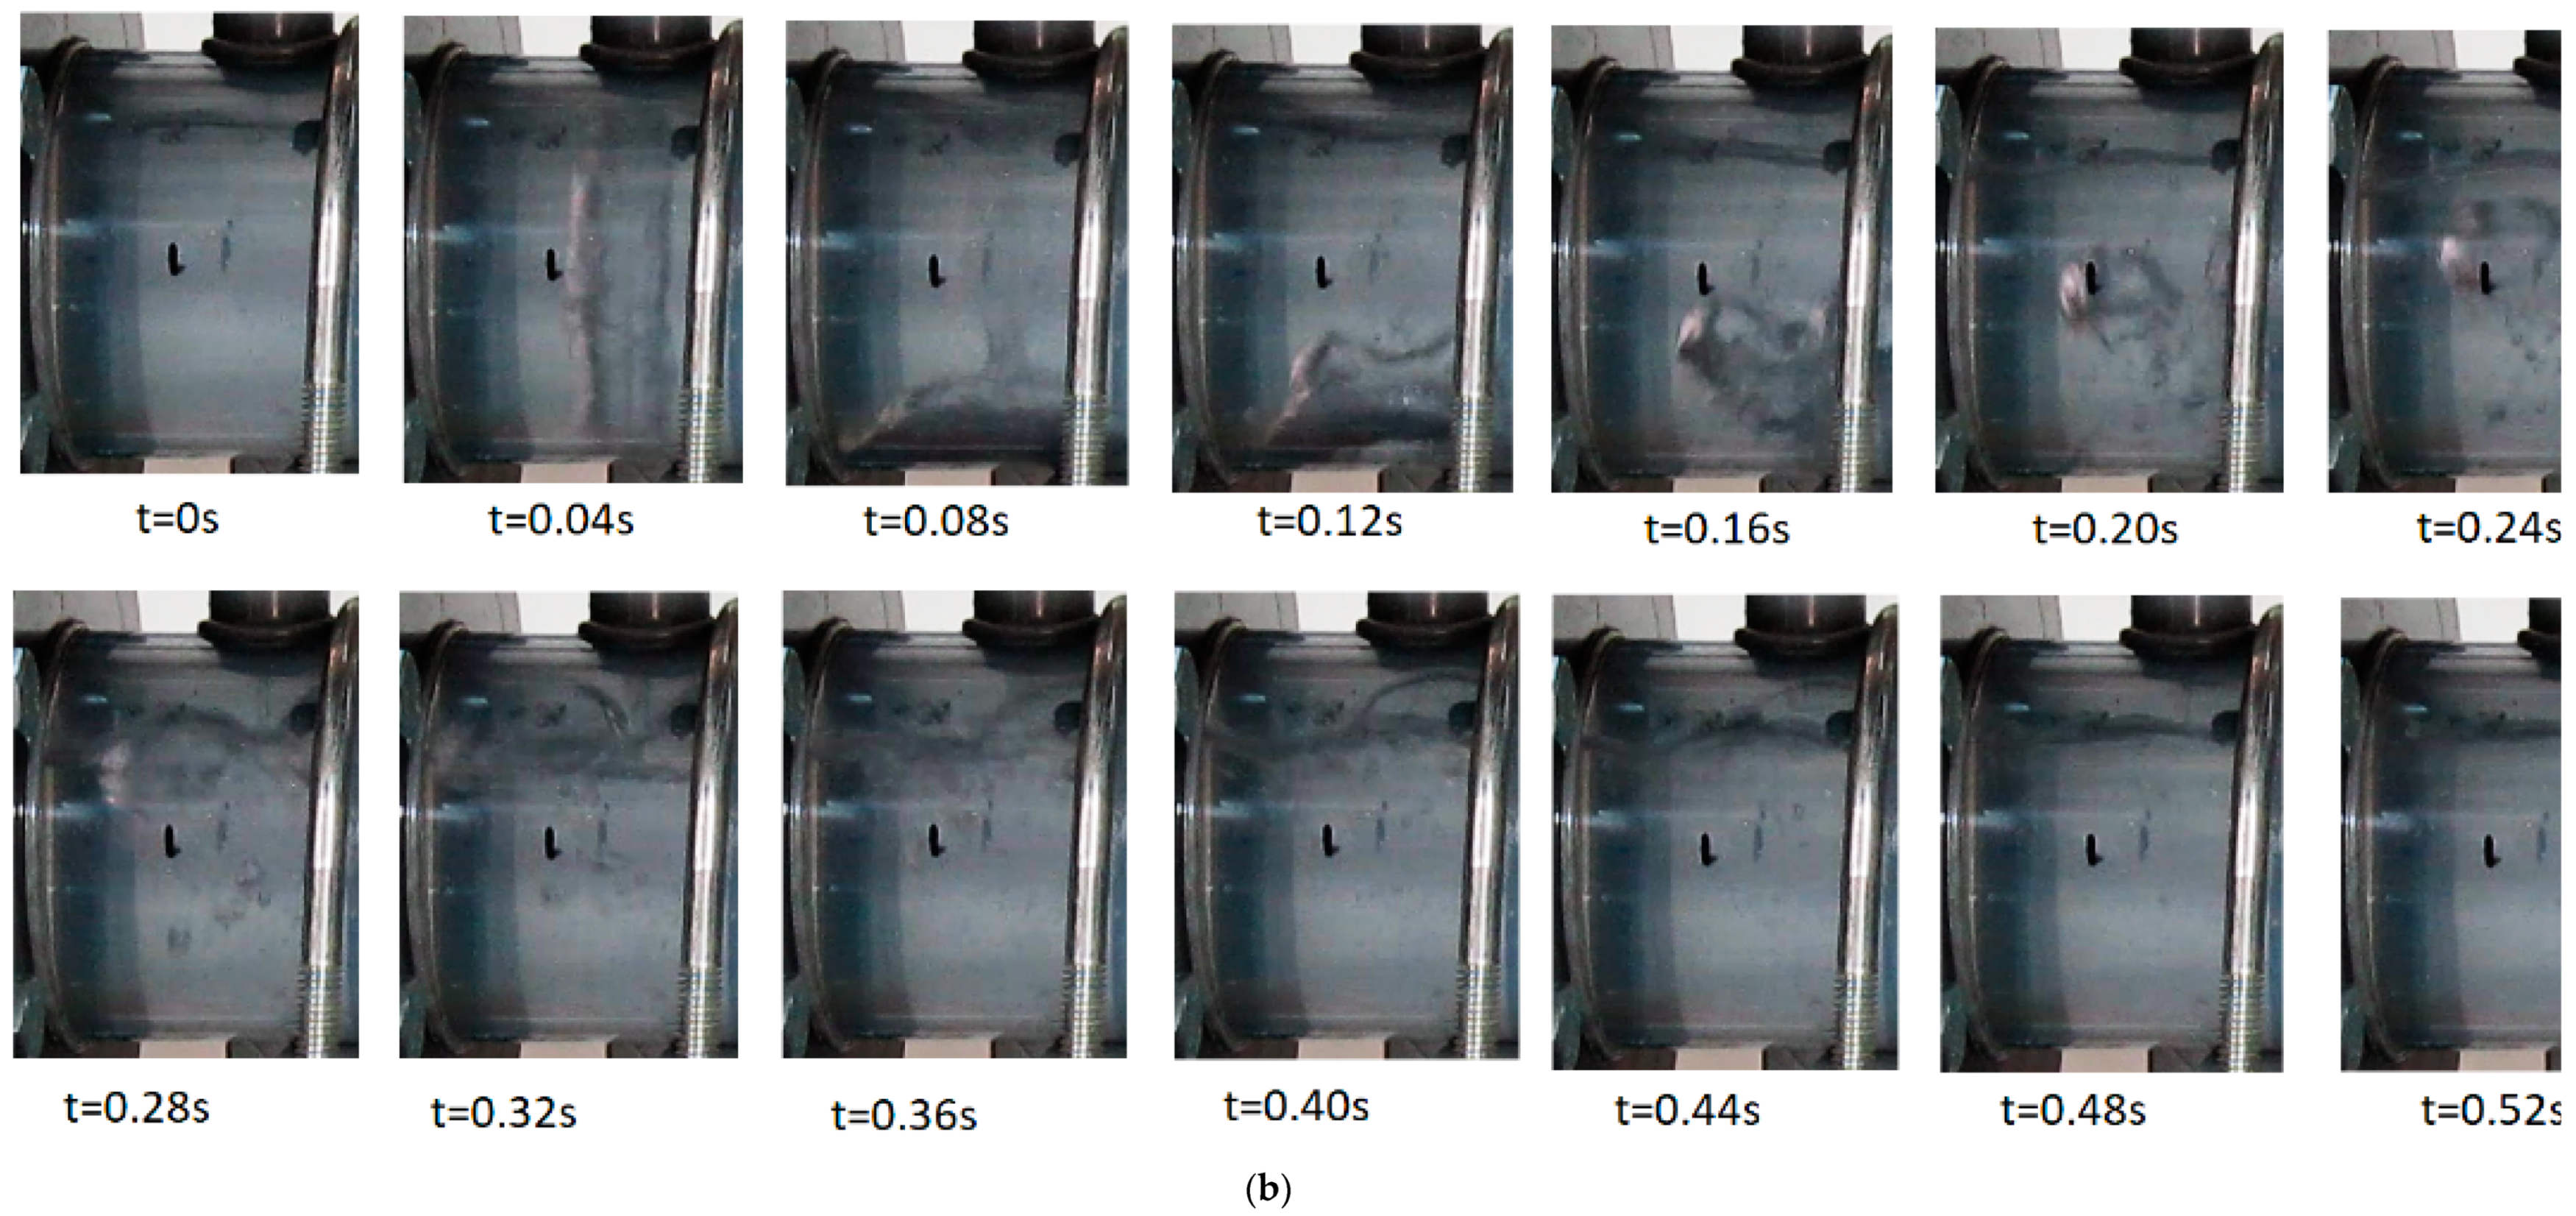
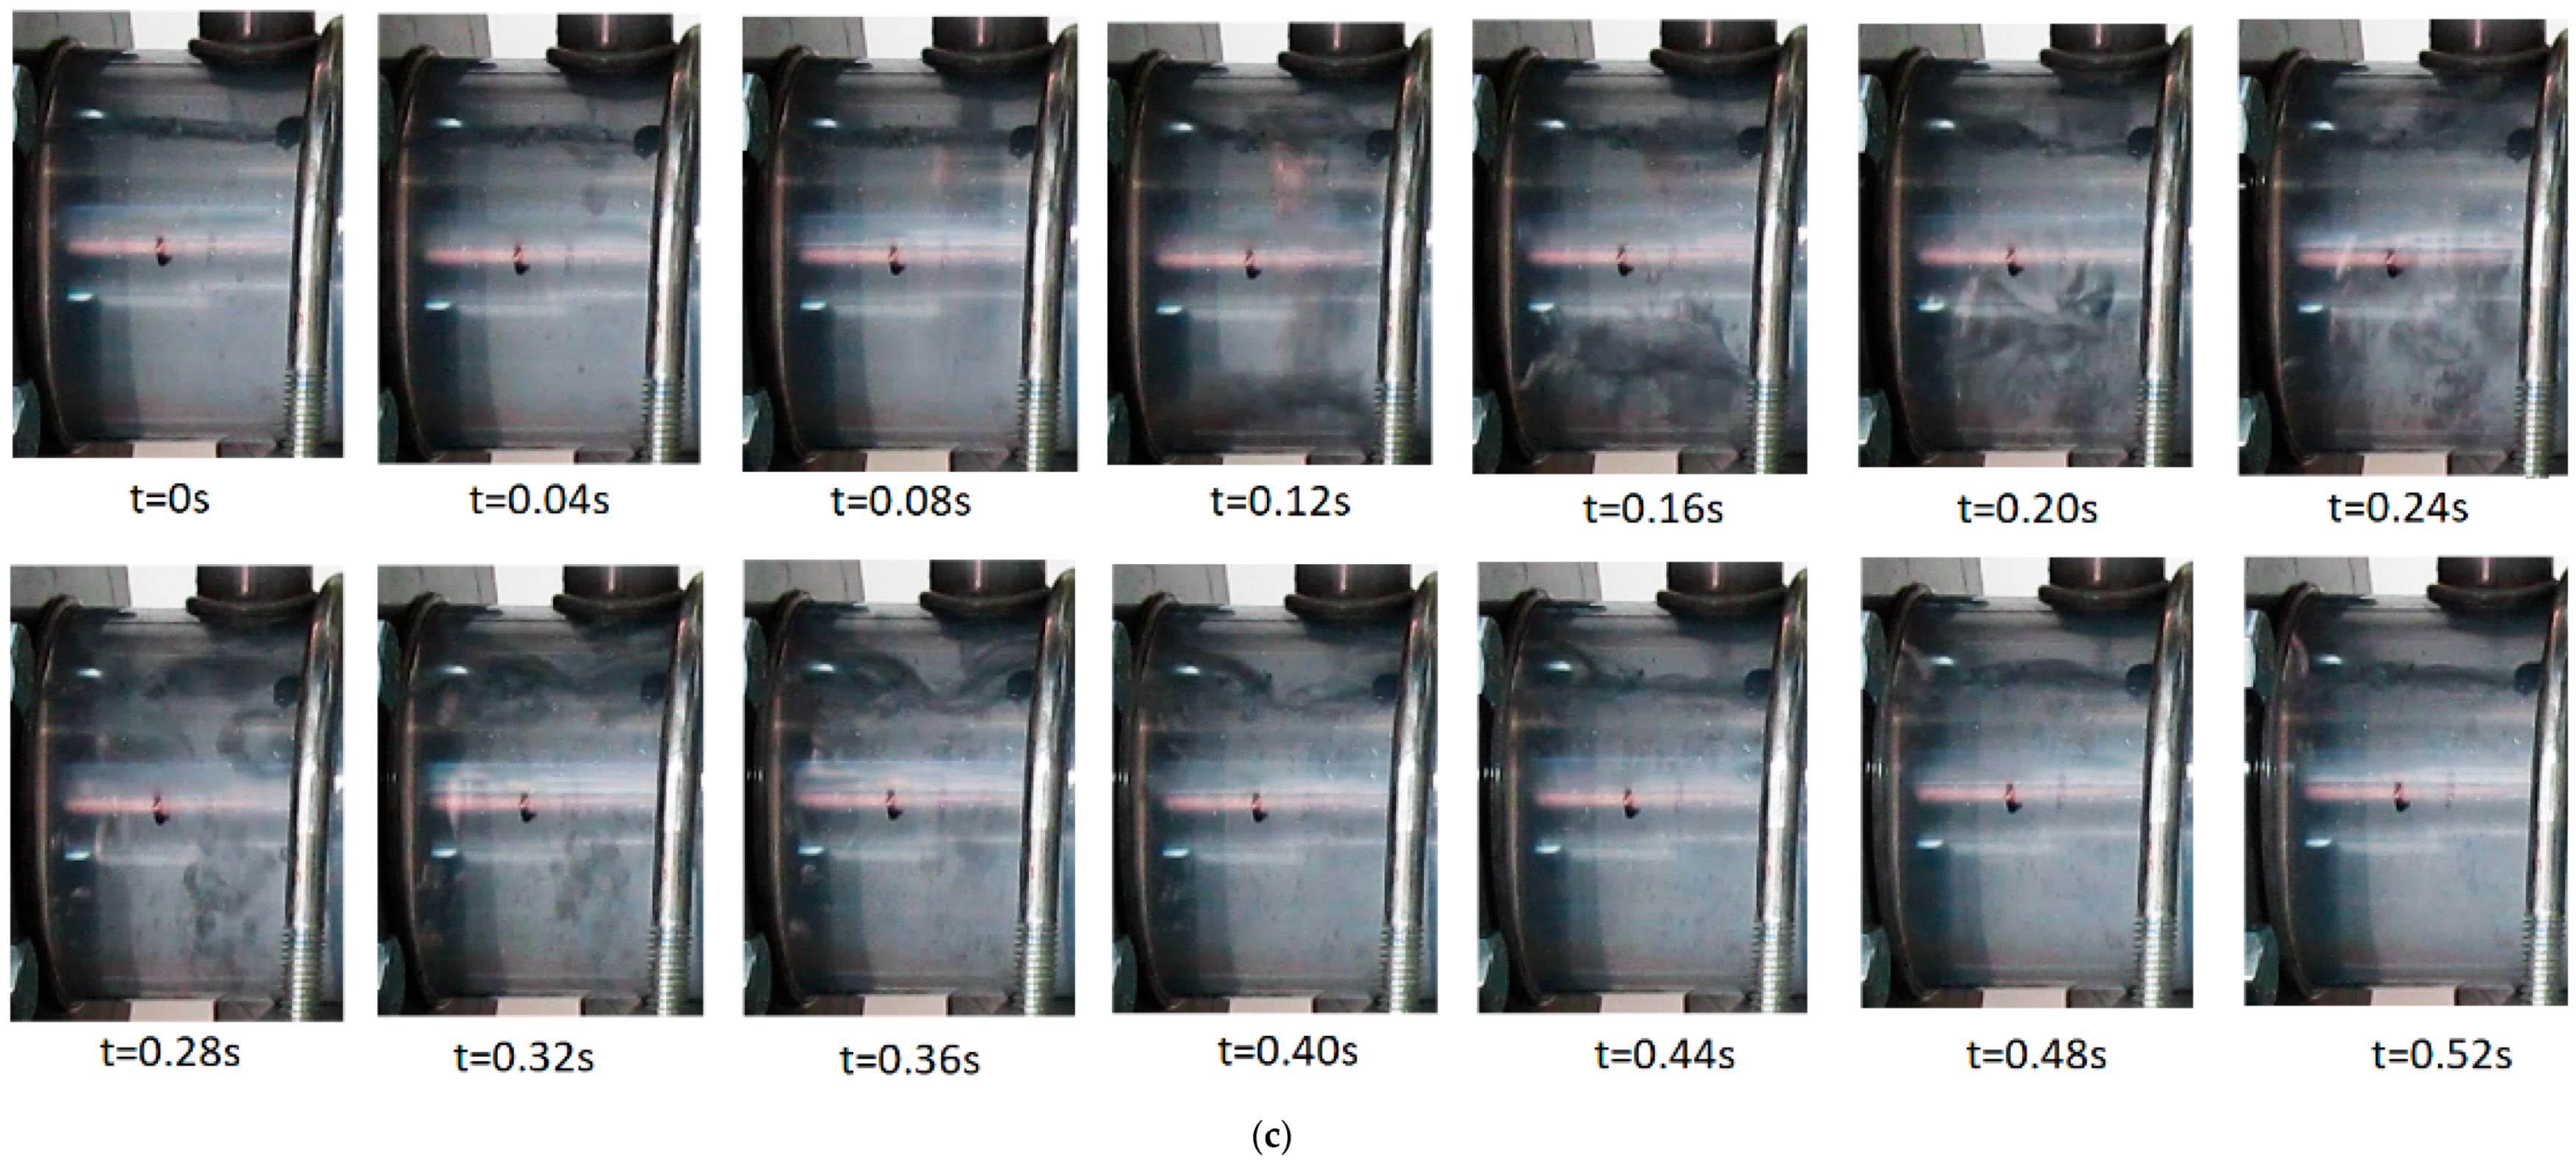
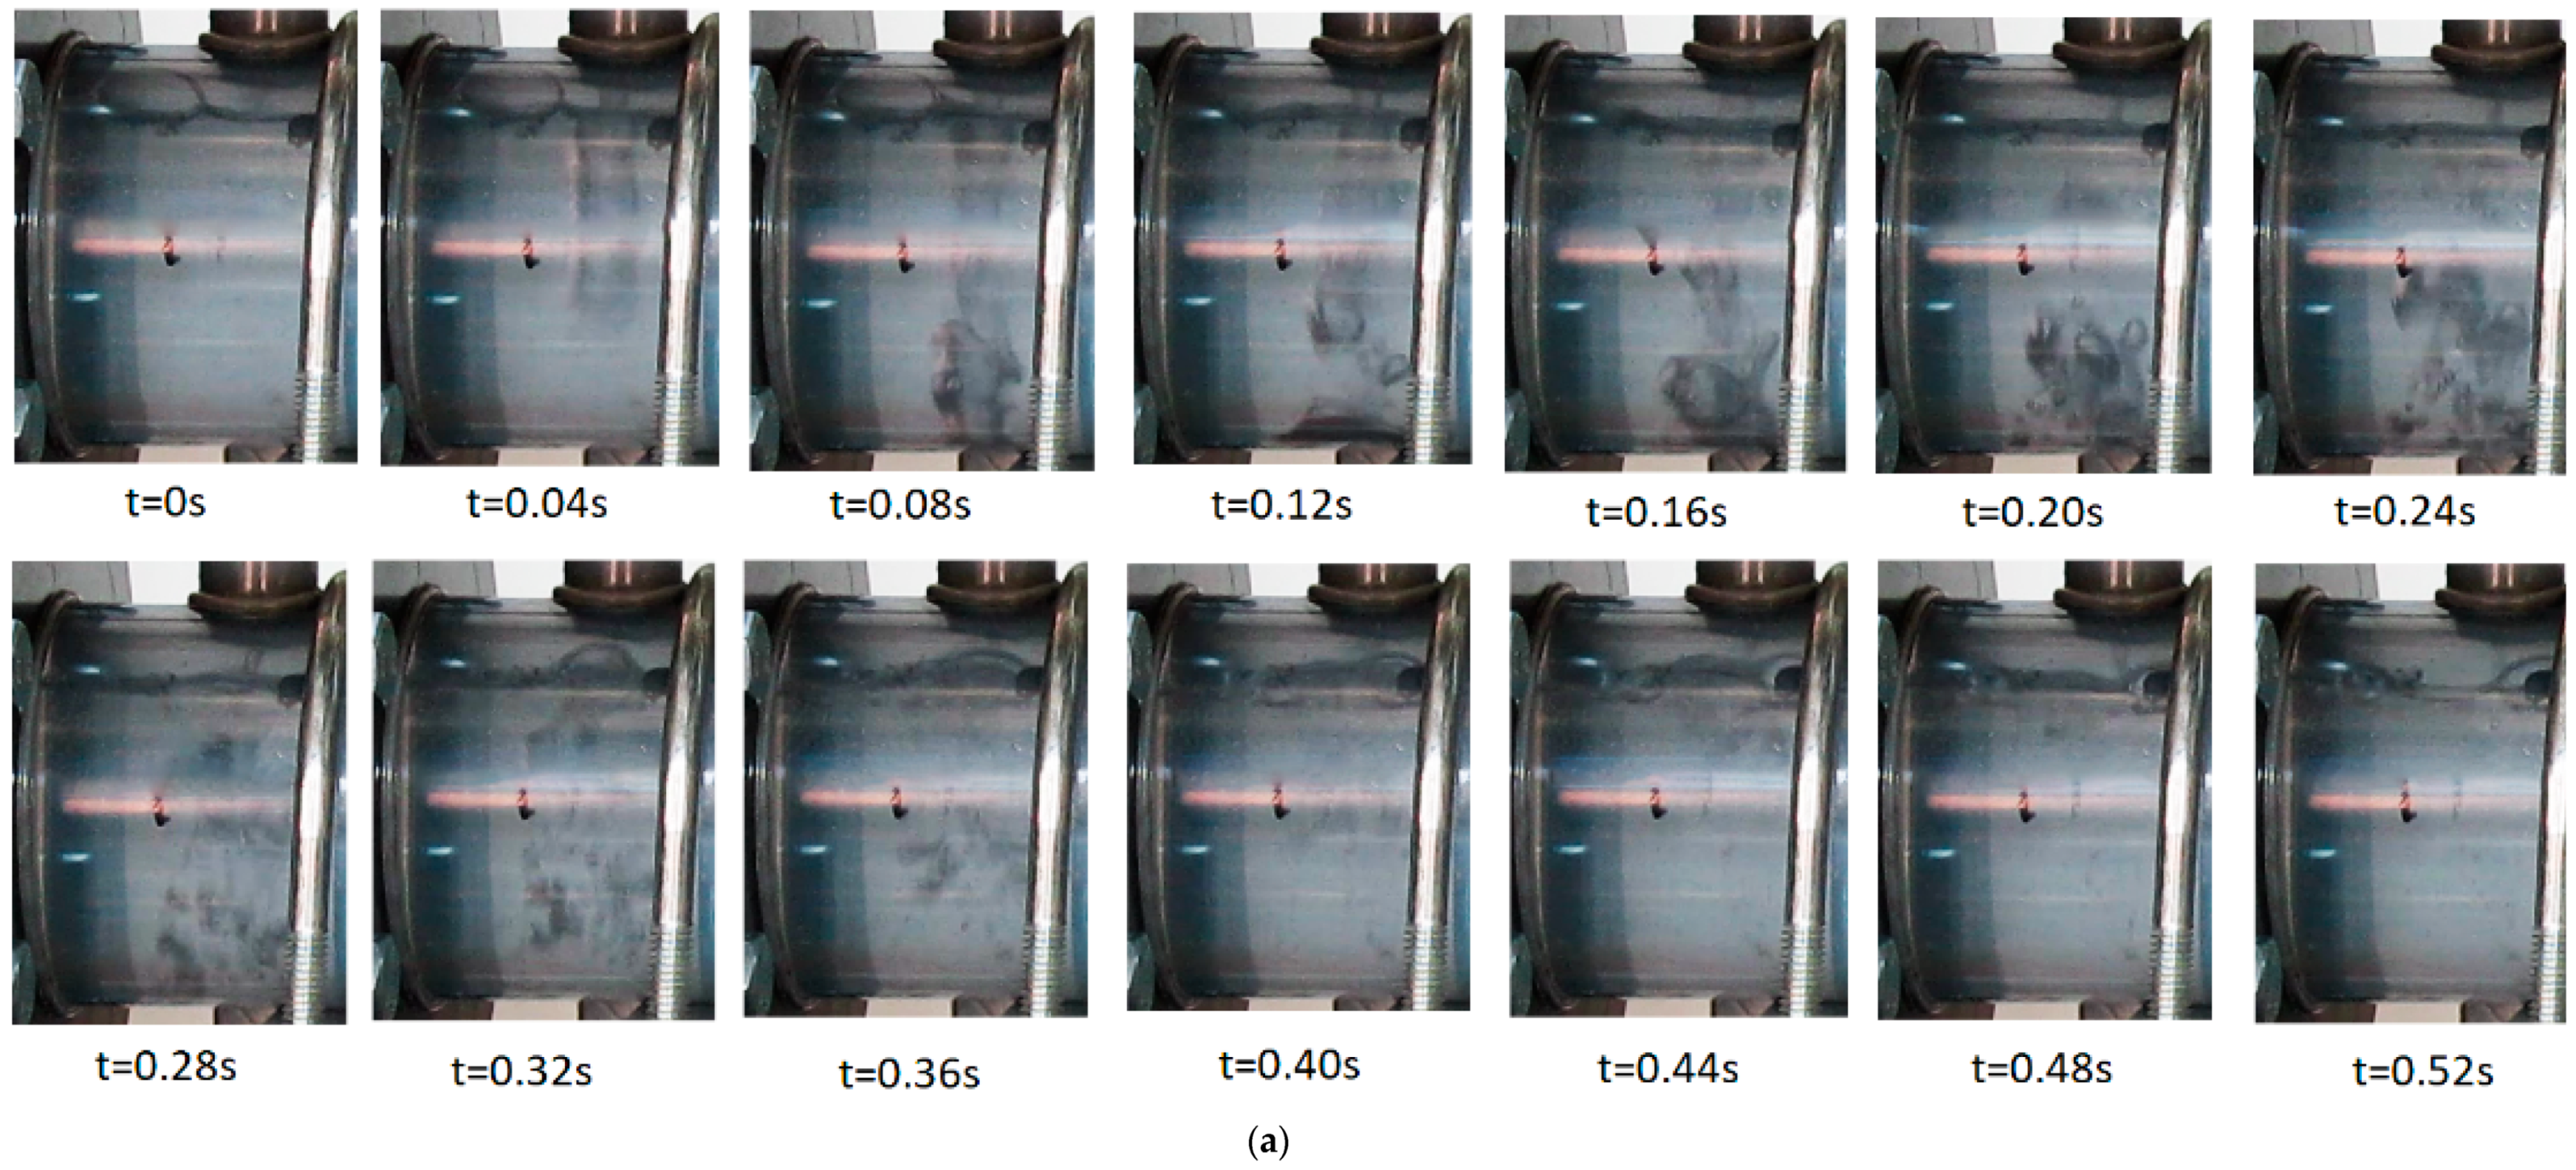
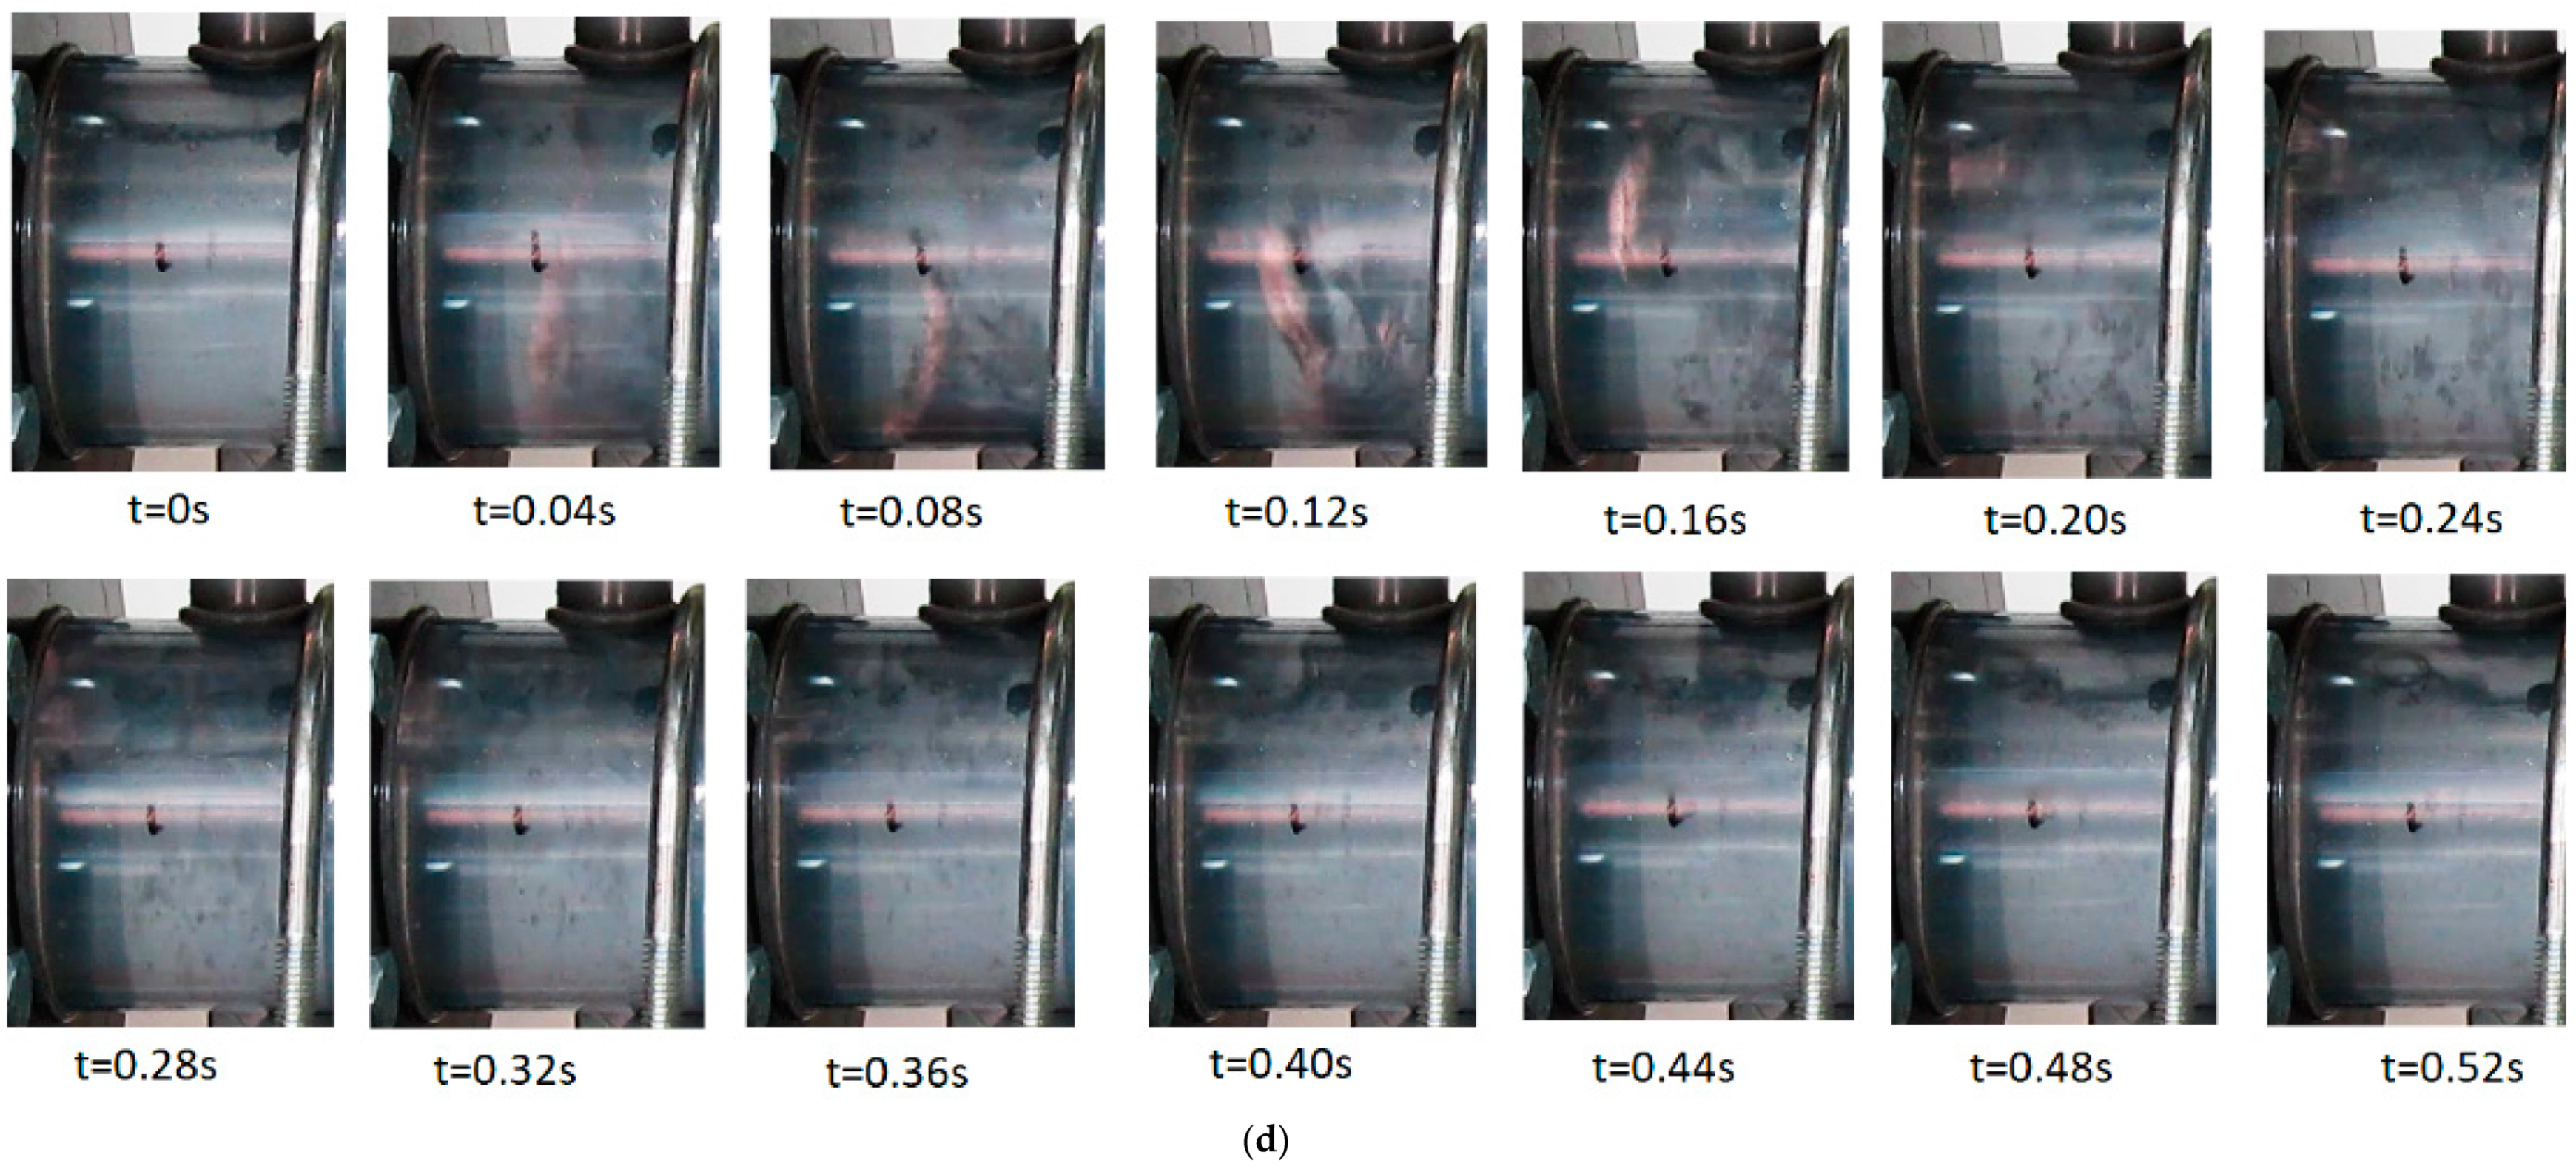
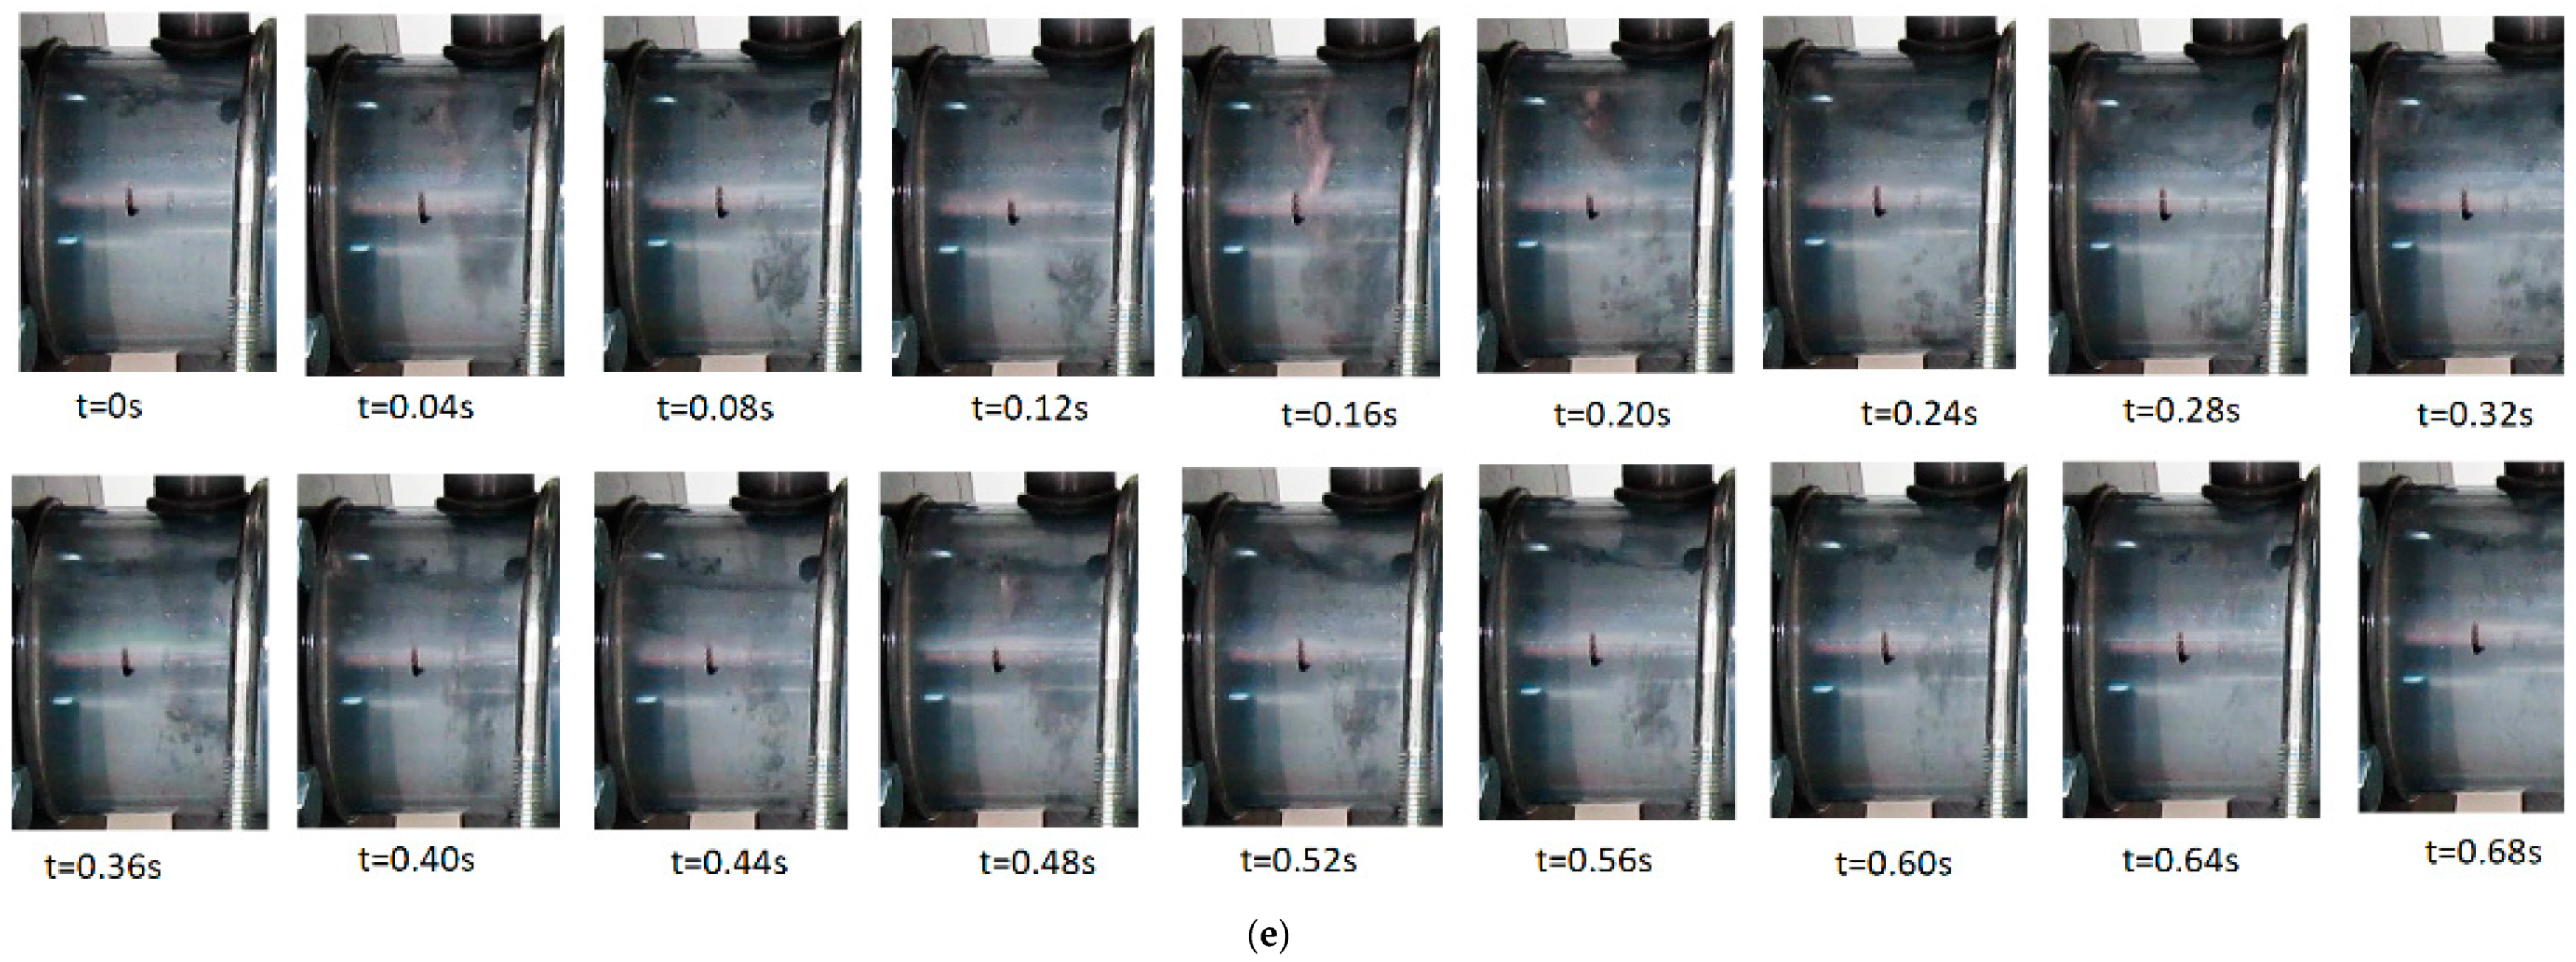
2.2.1. Cavity Formation
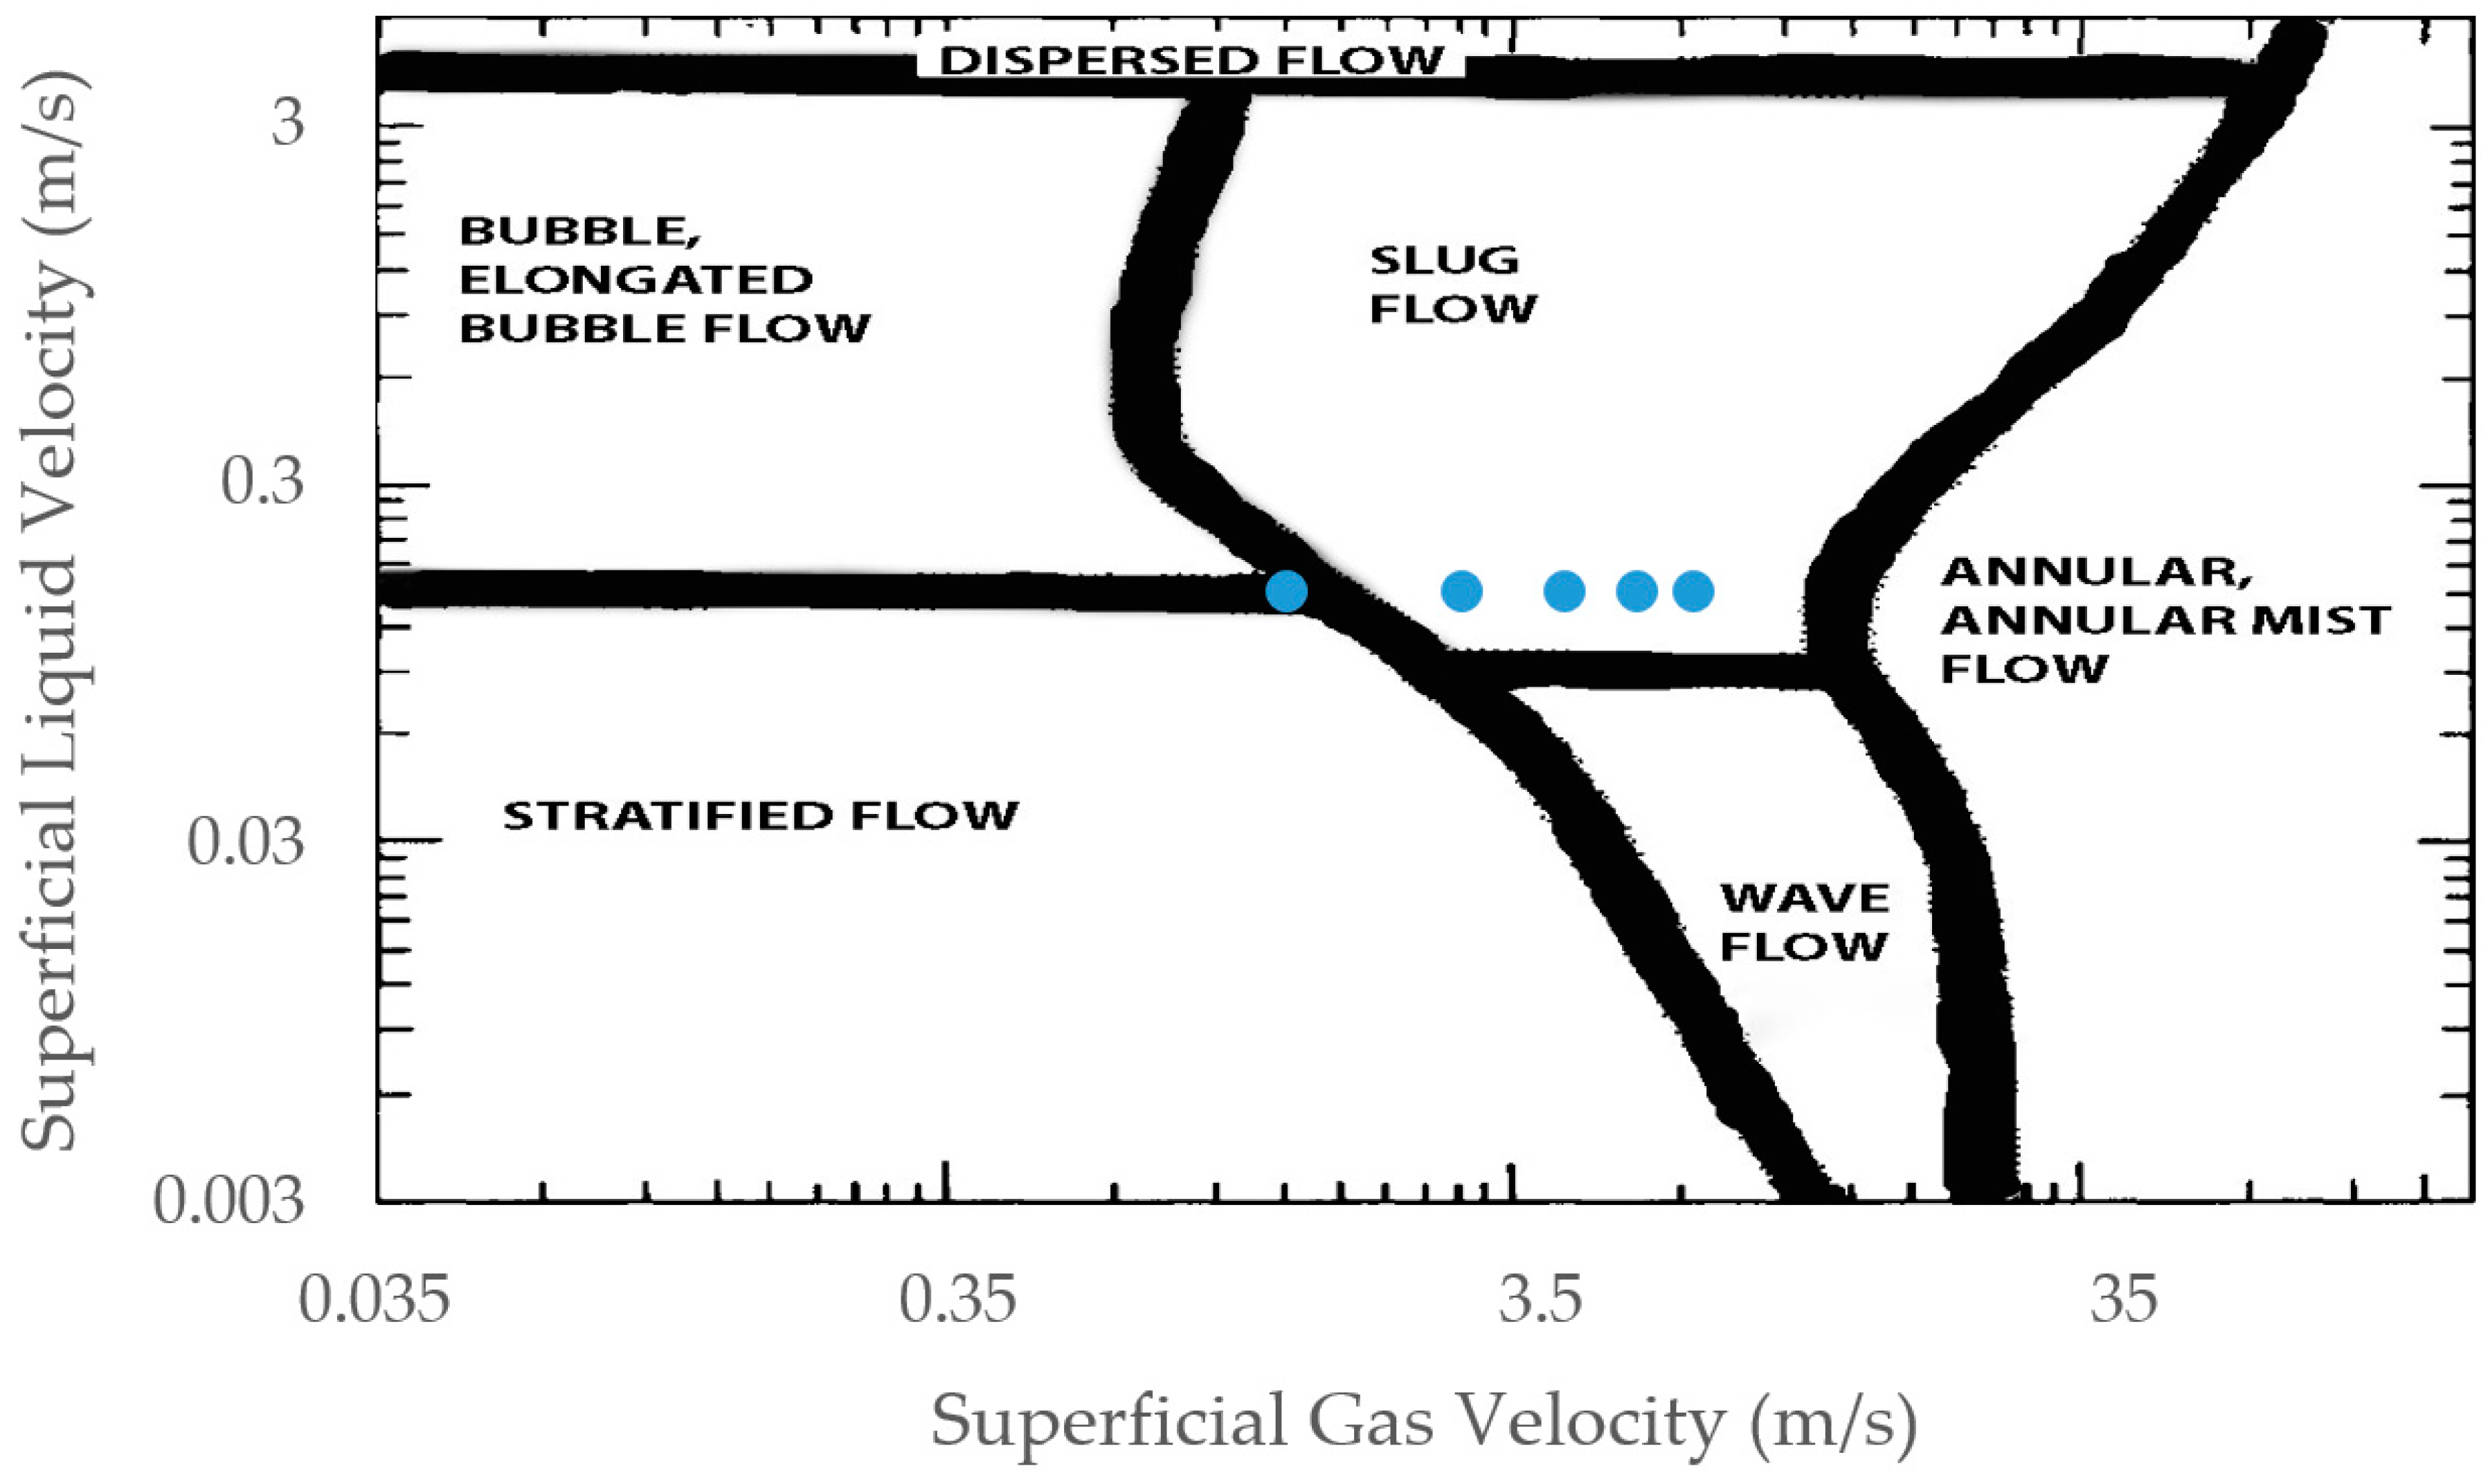
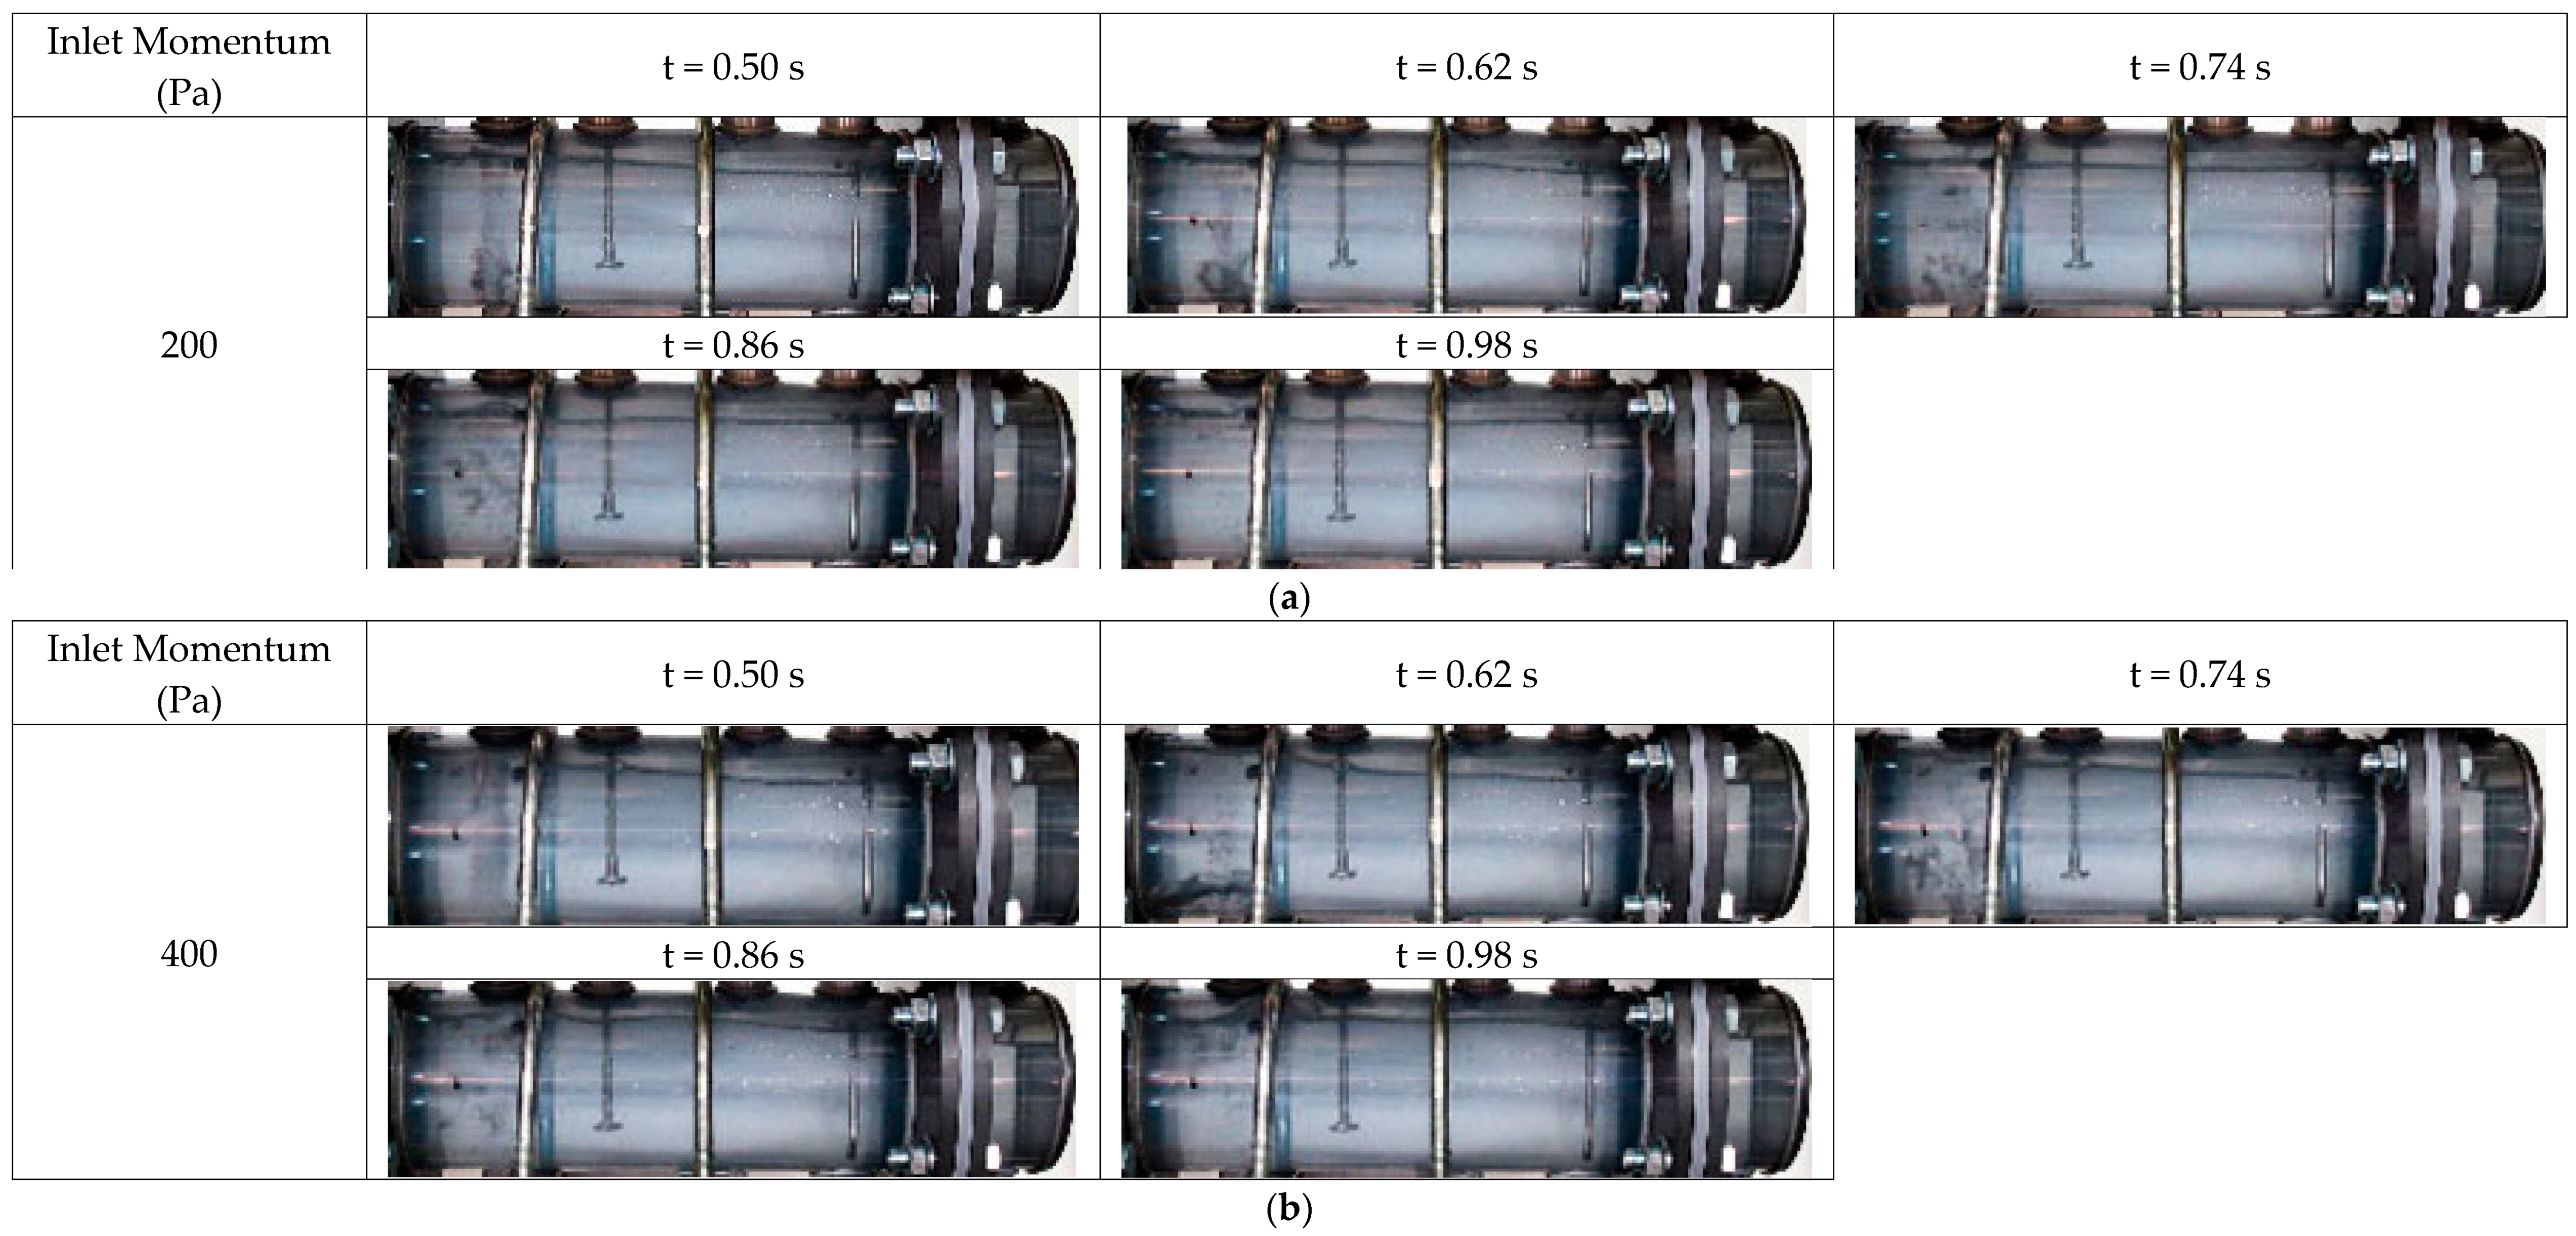
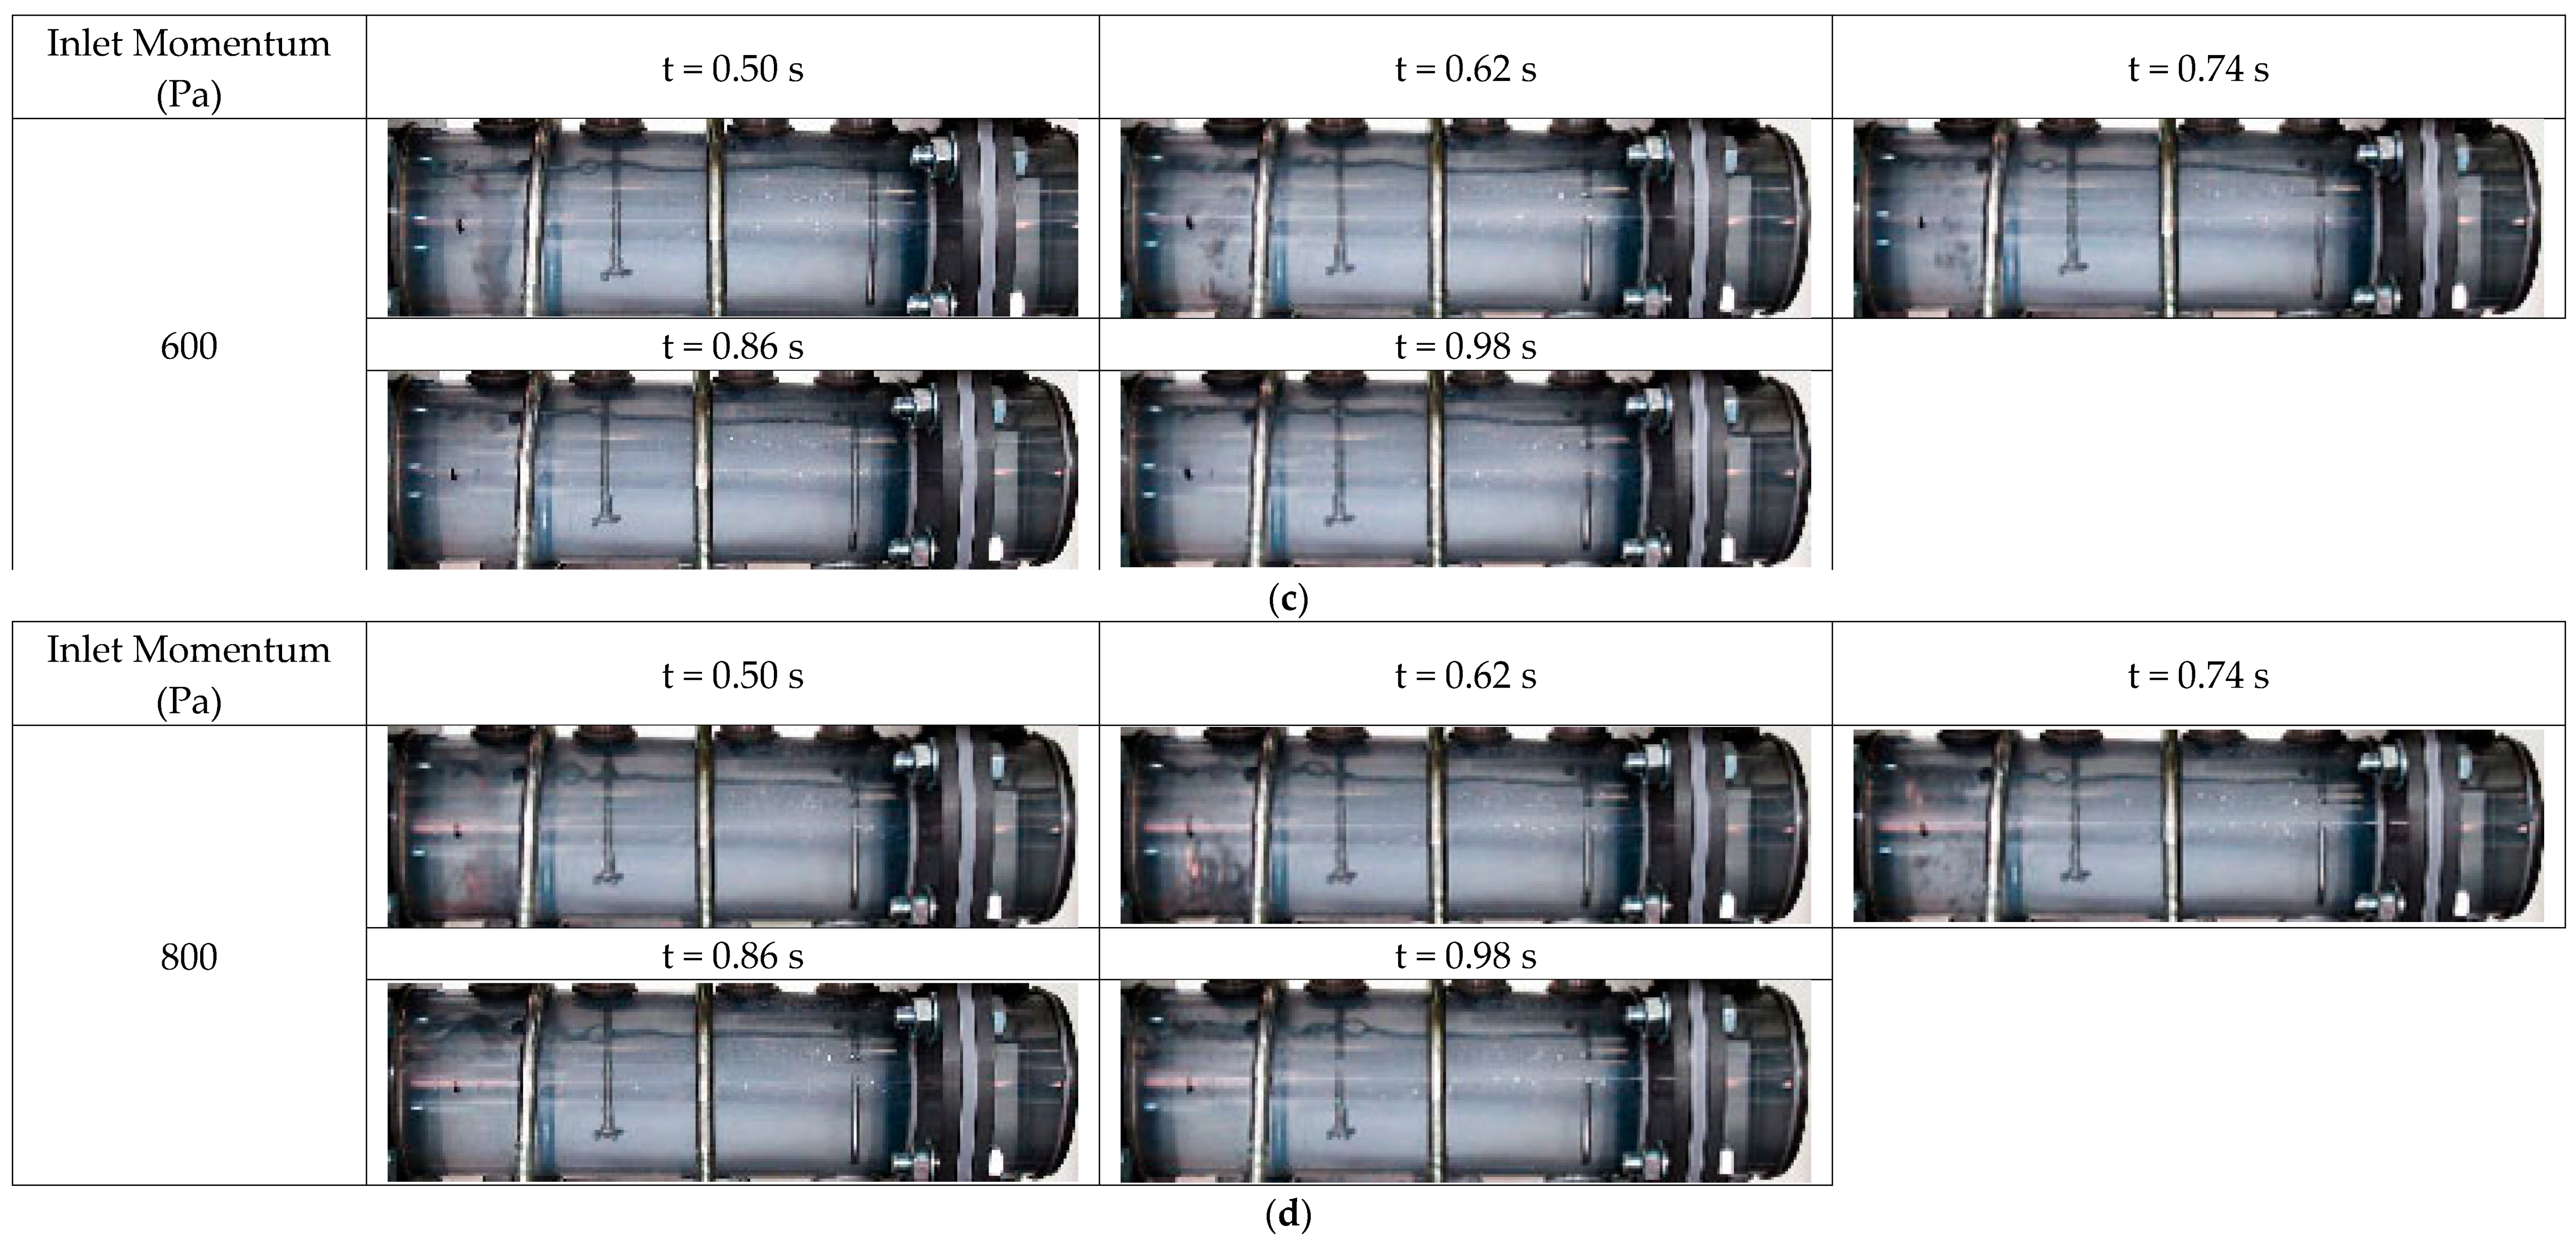
2.2.2. Hydrodynamics in Separator
3. Computational Fluid Dynamics Work
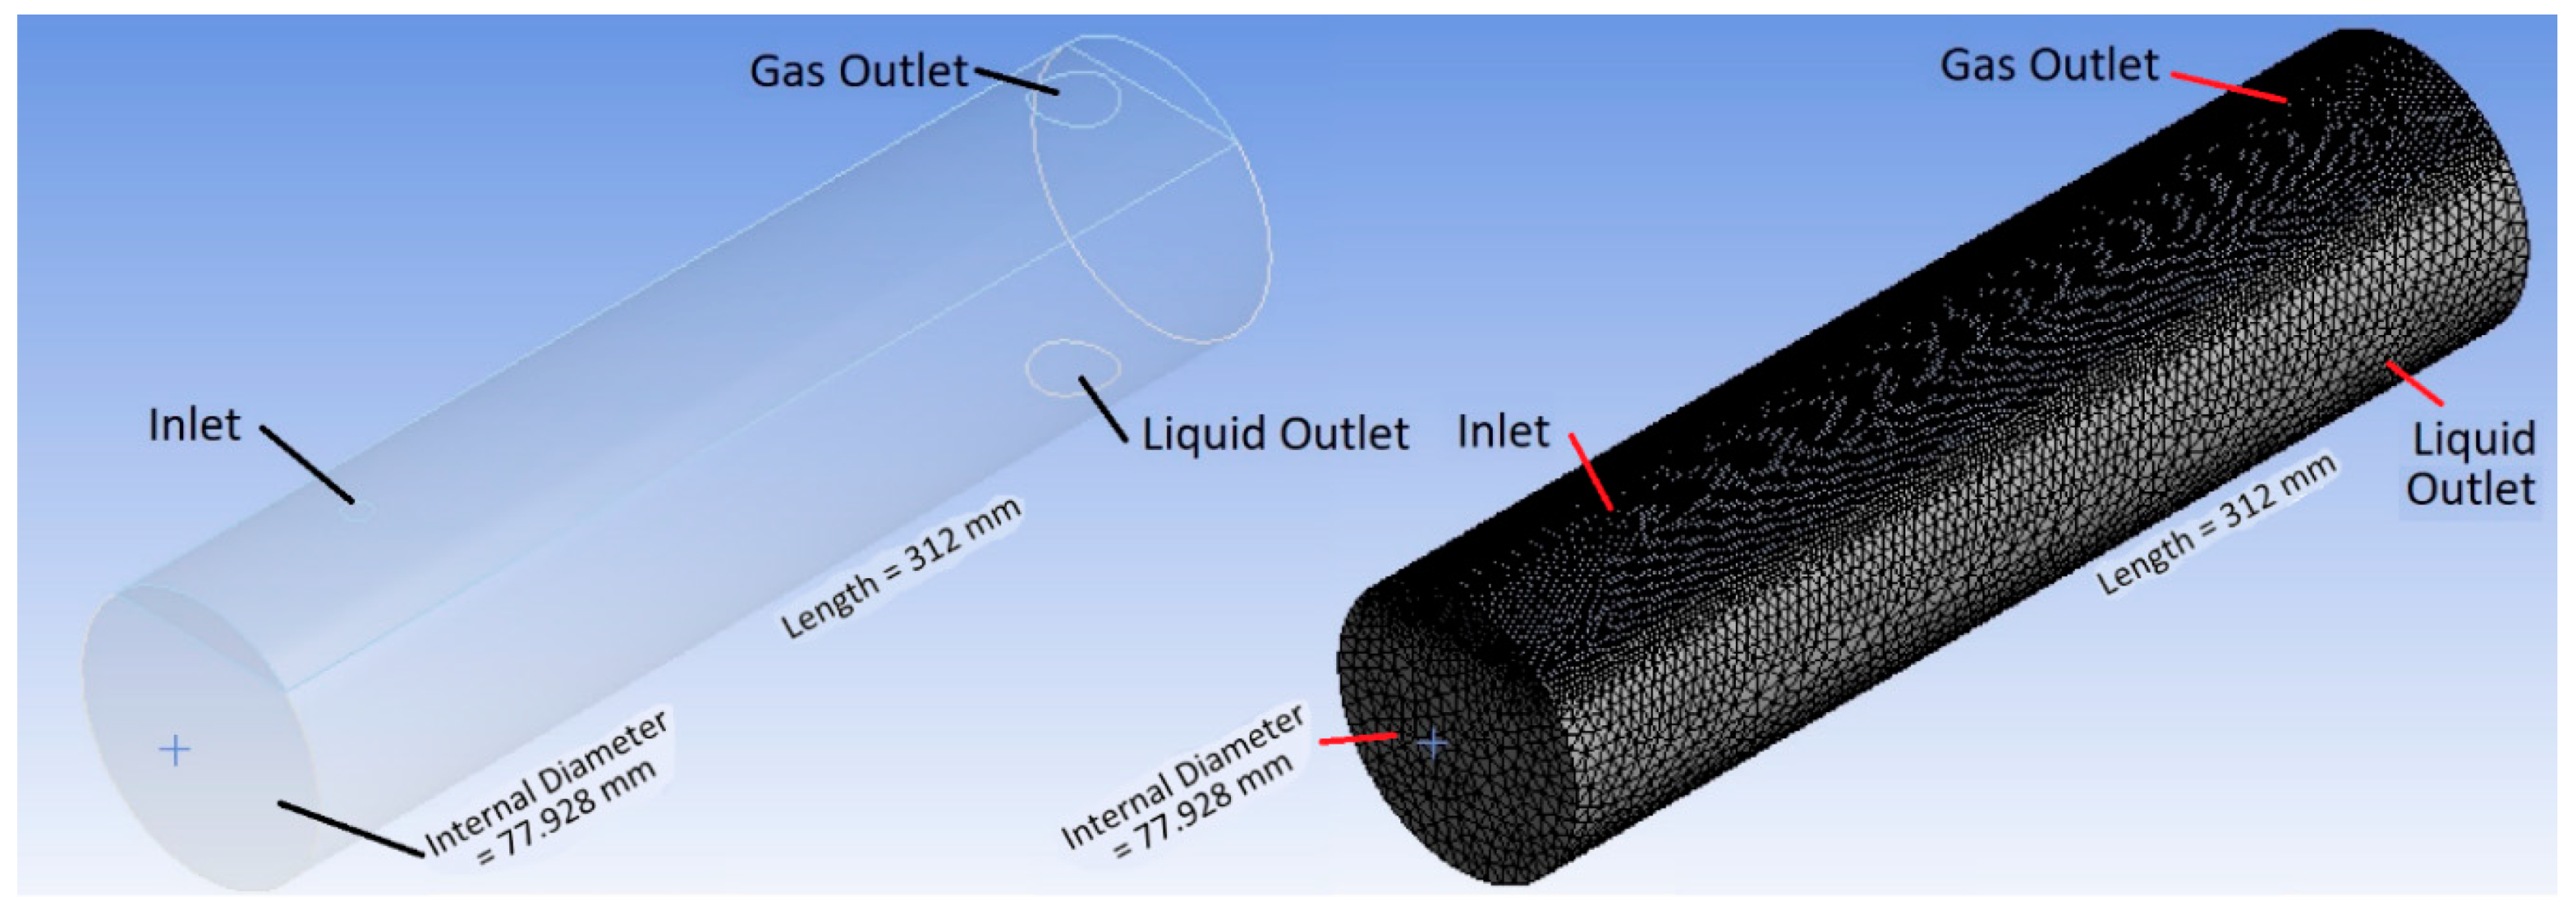
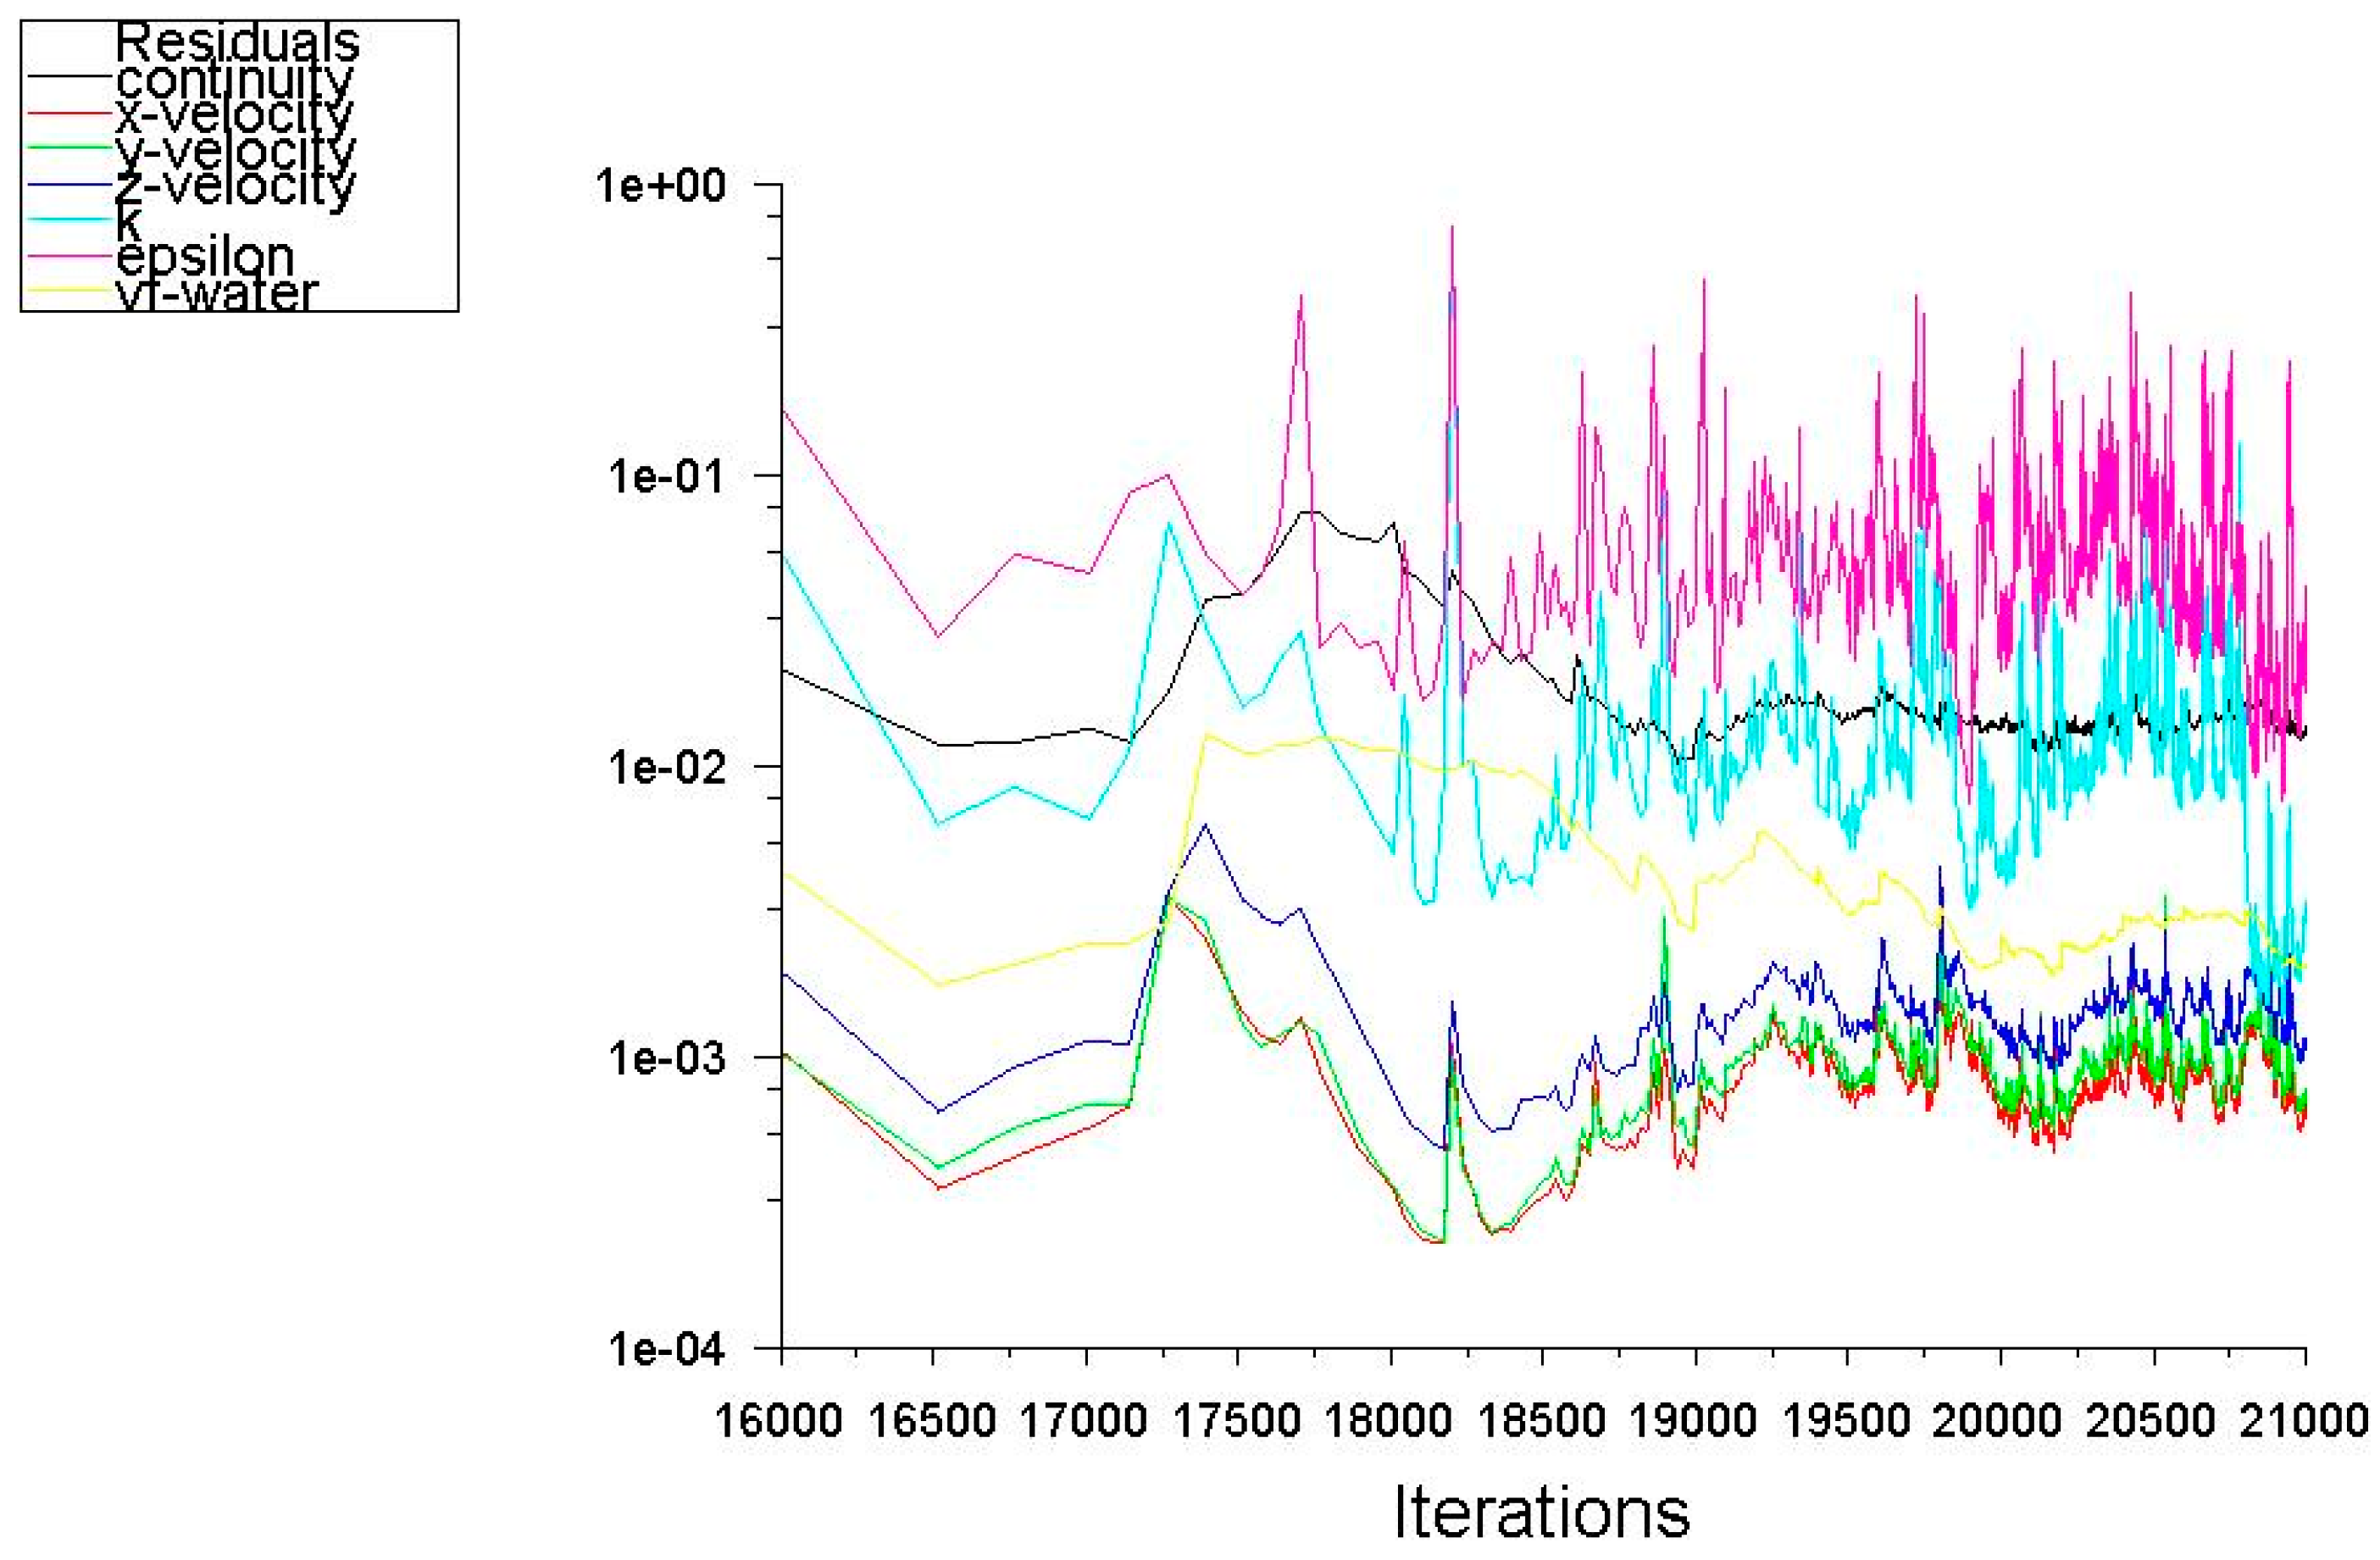
3.1. Computational Fluid Dynamics Methodology
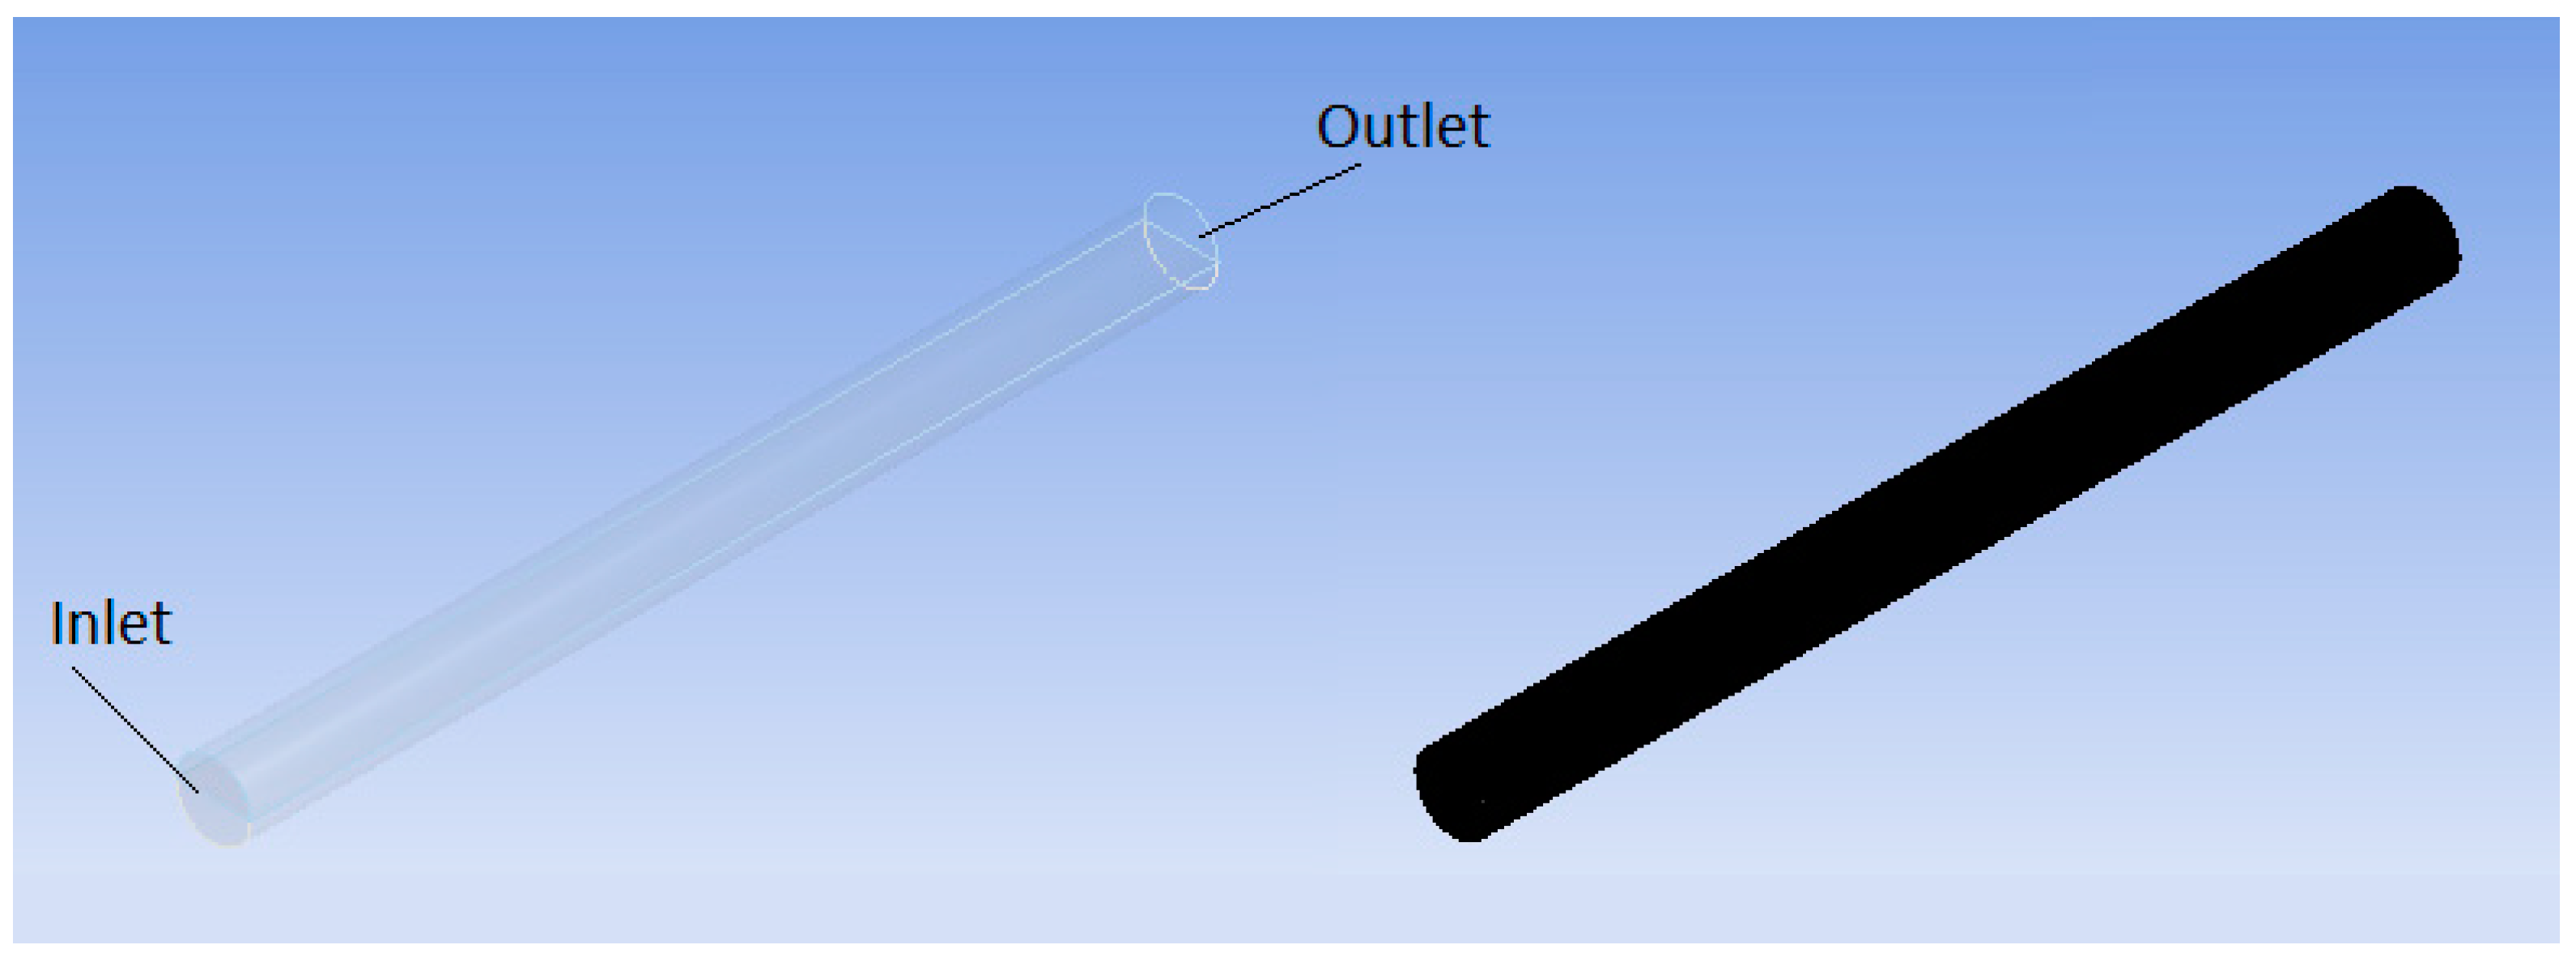
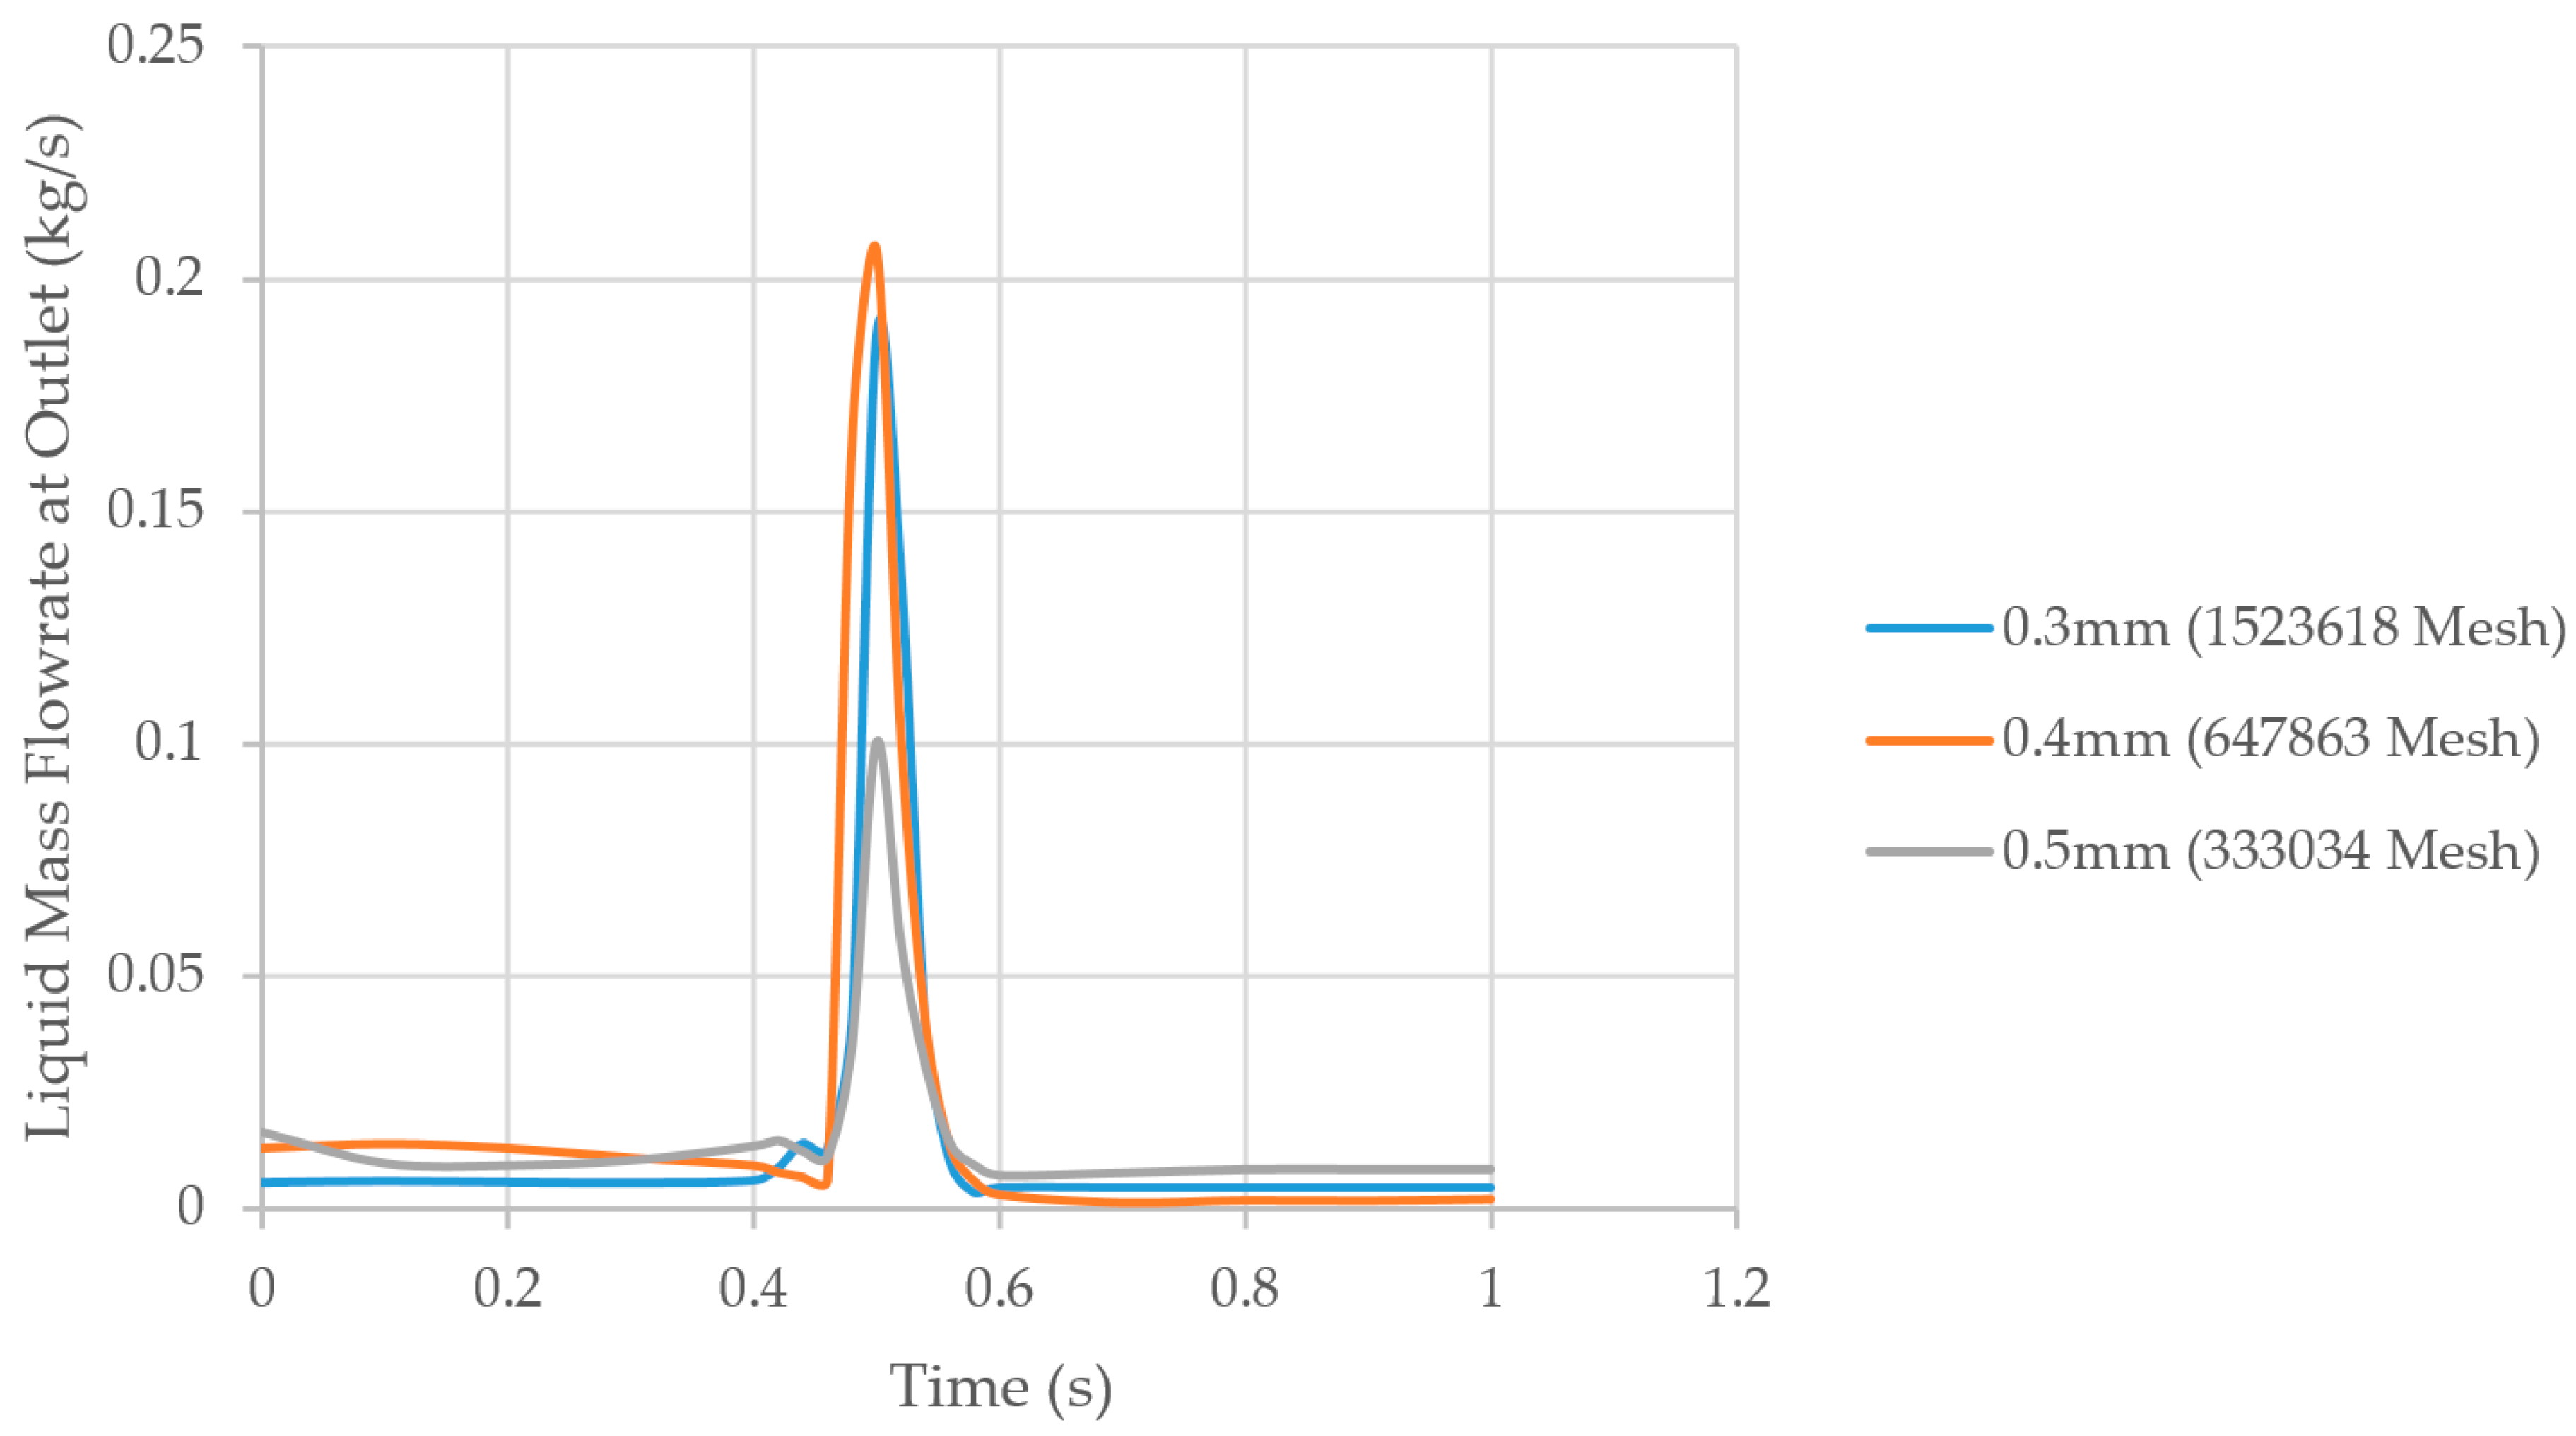
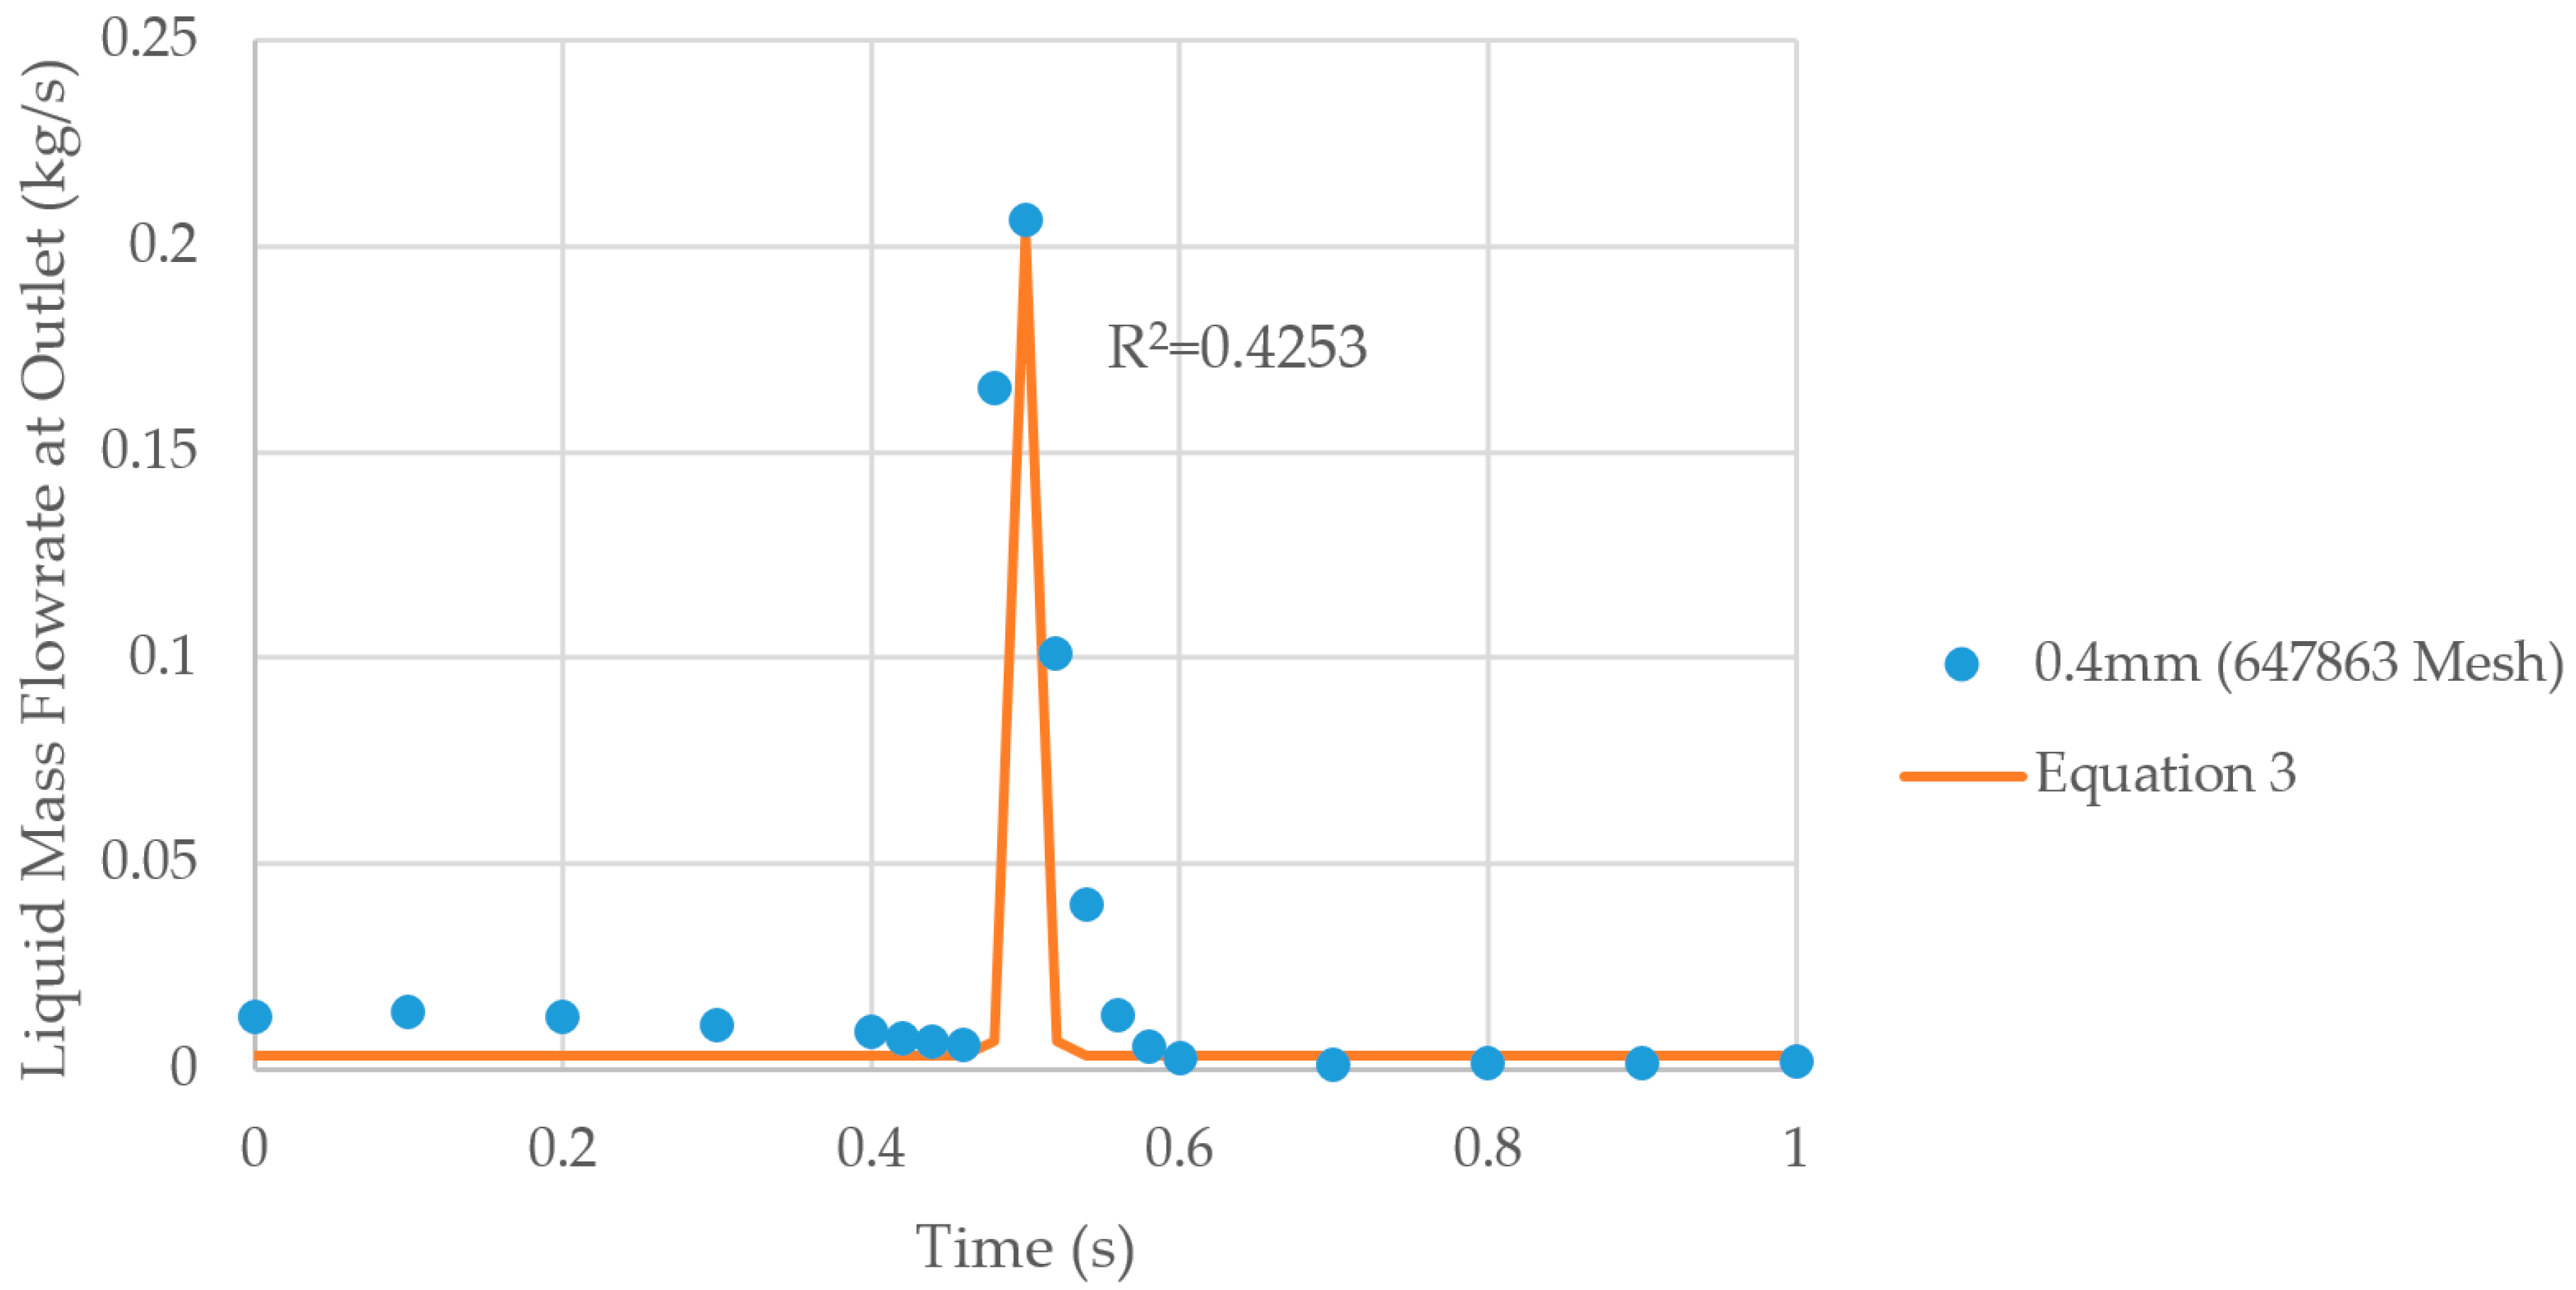
3.1.1. Computational Fluids Dynamics Setup
3.1.2. Boundary Conditions
3.2. Result and Discussion of Computational Fluid Dynamics Work
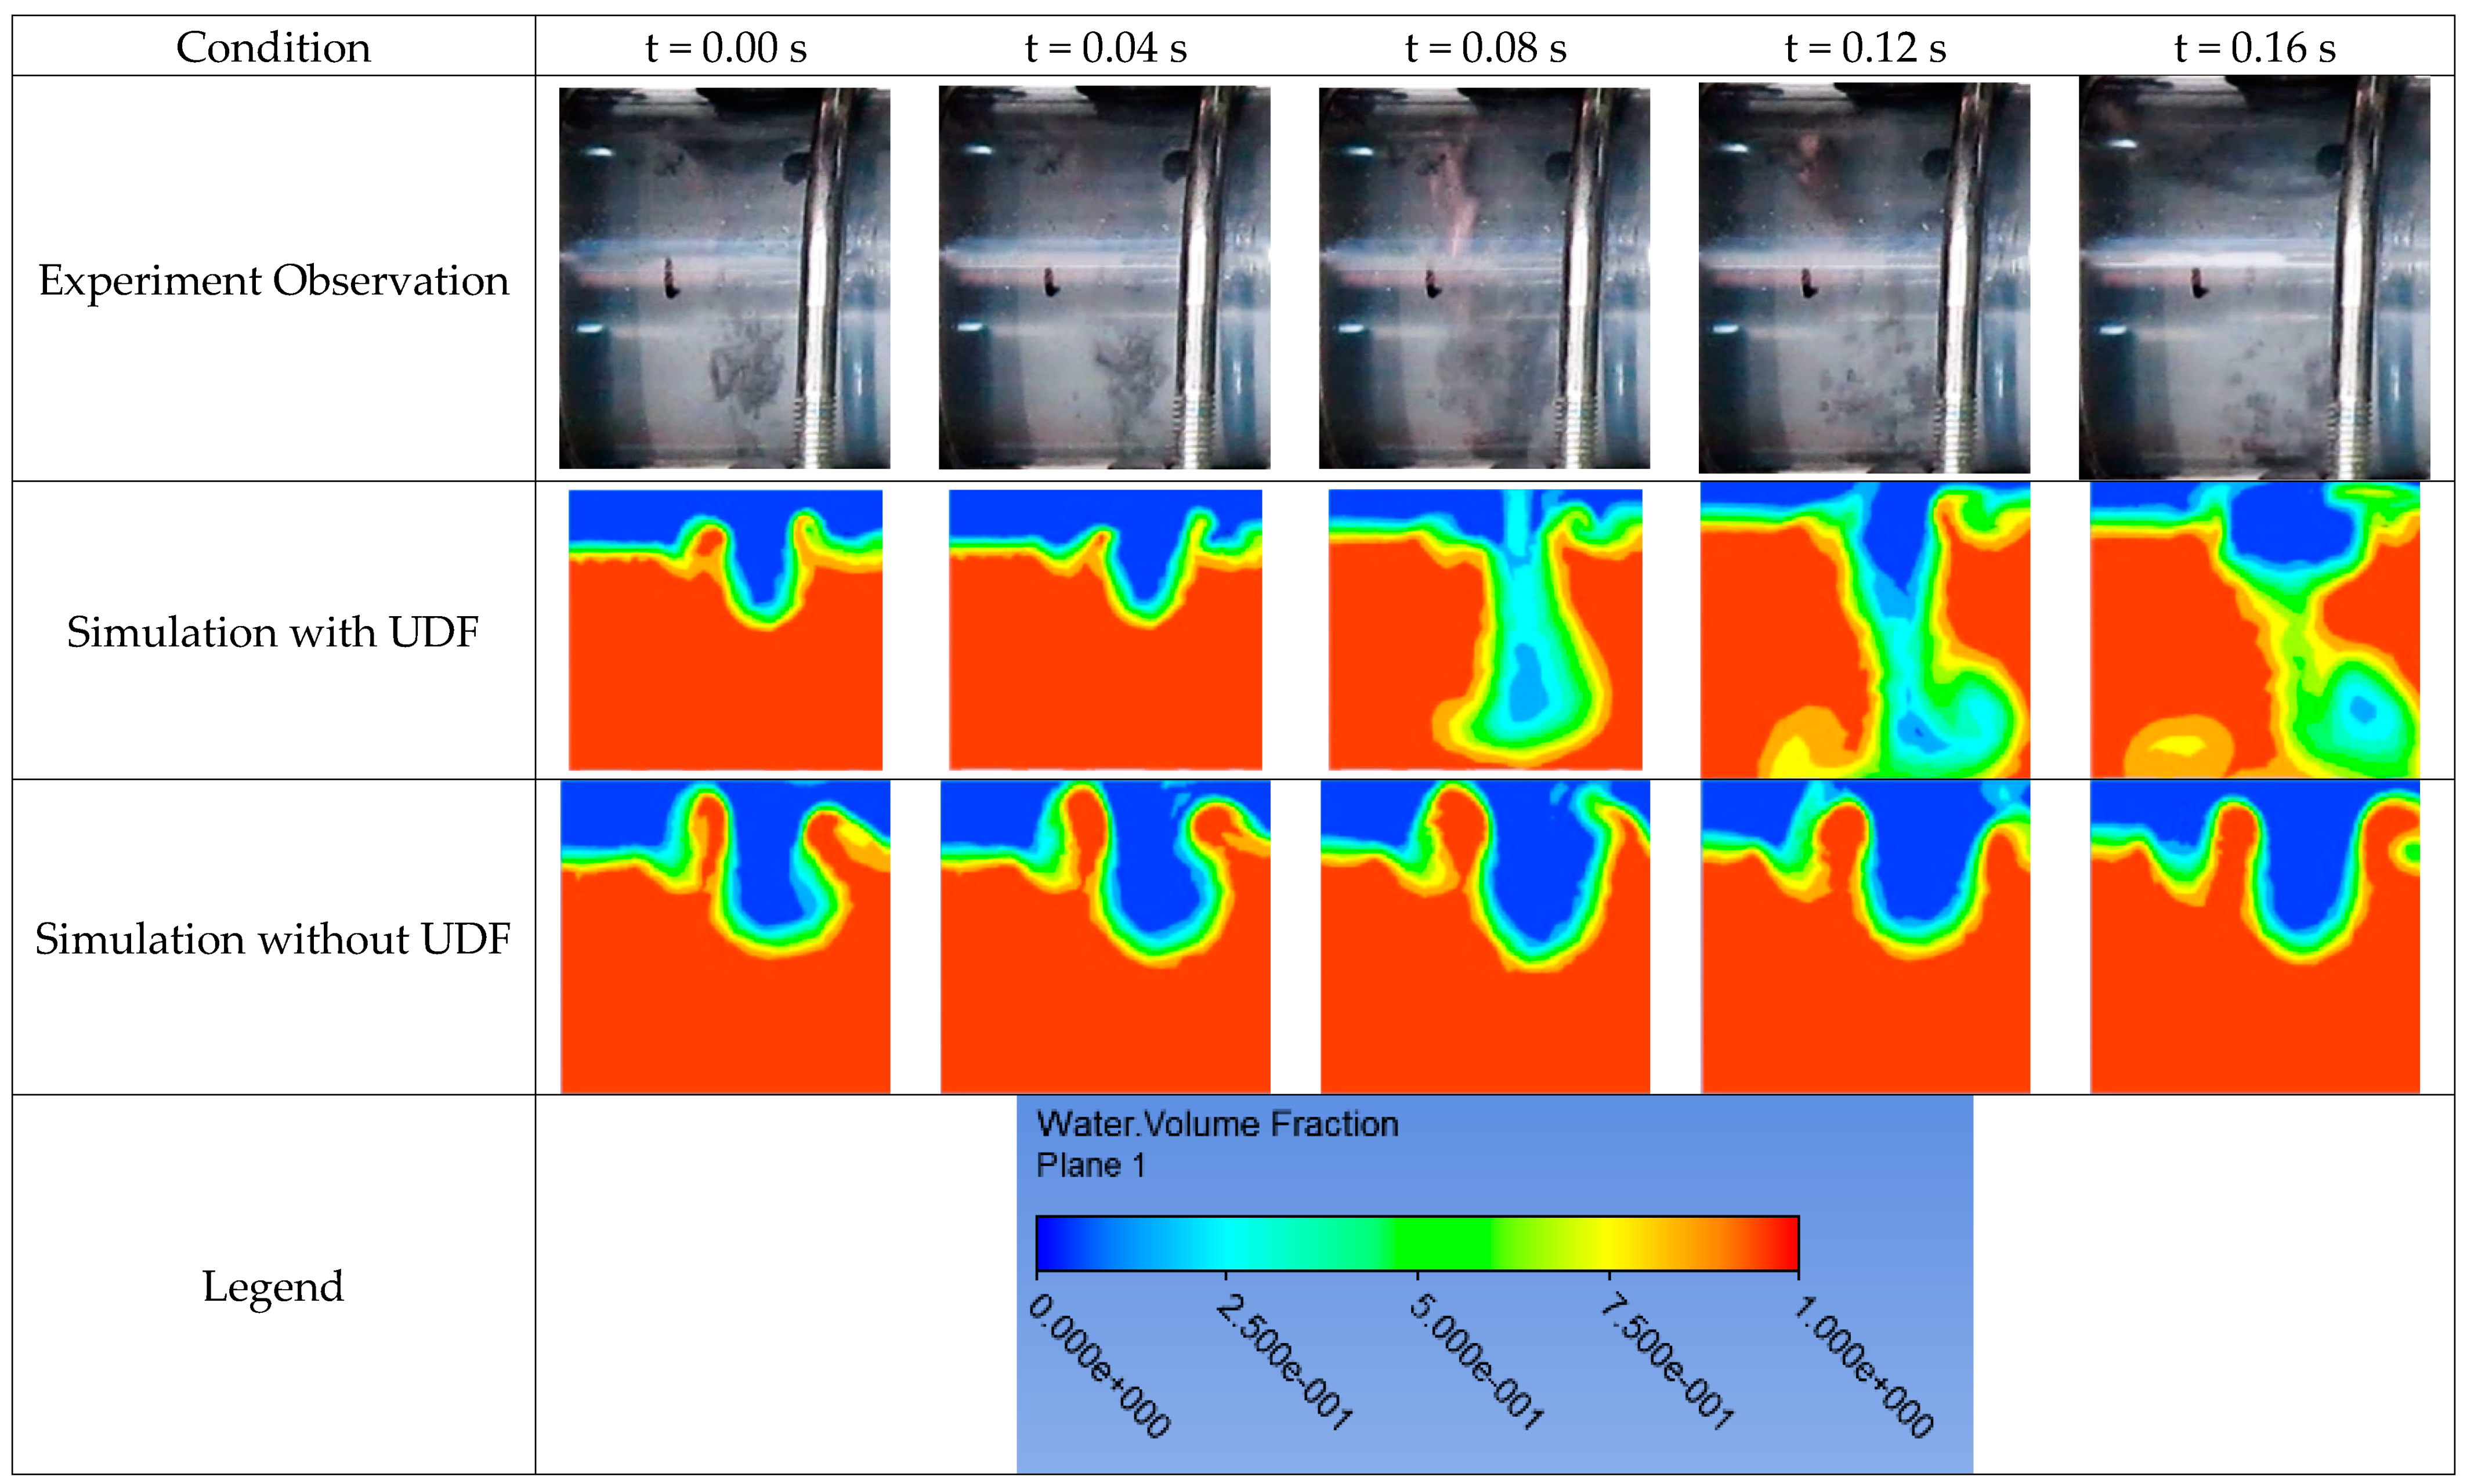
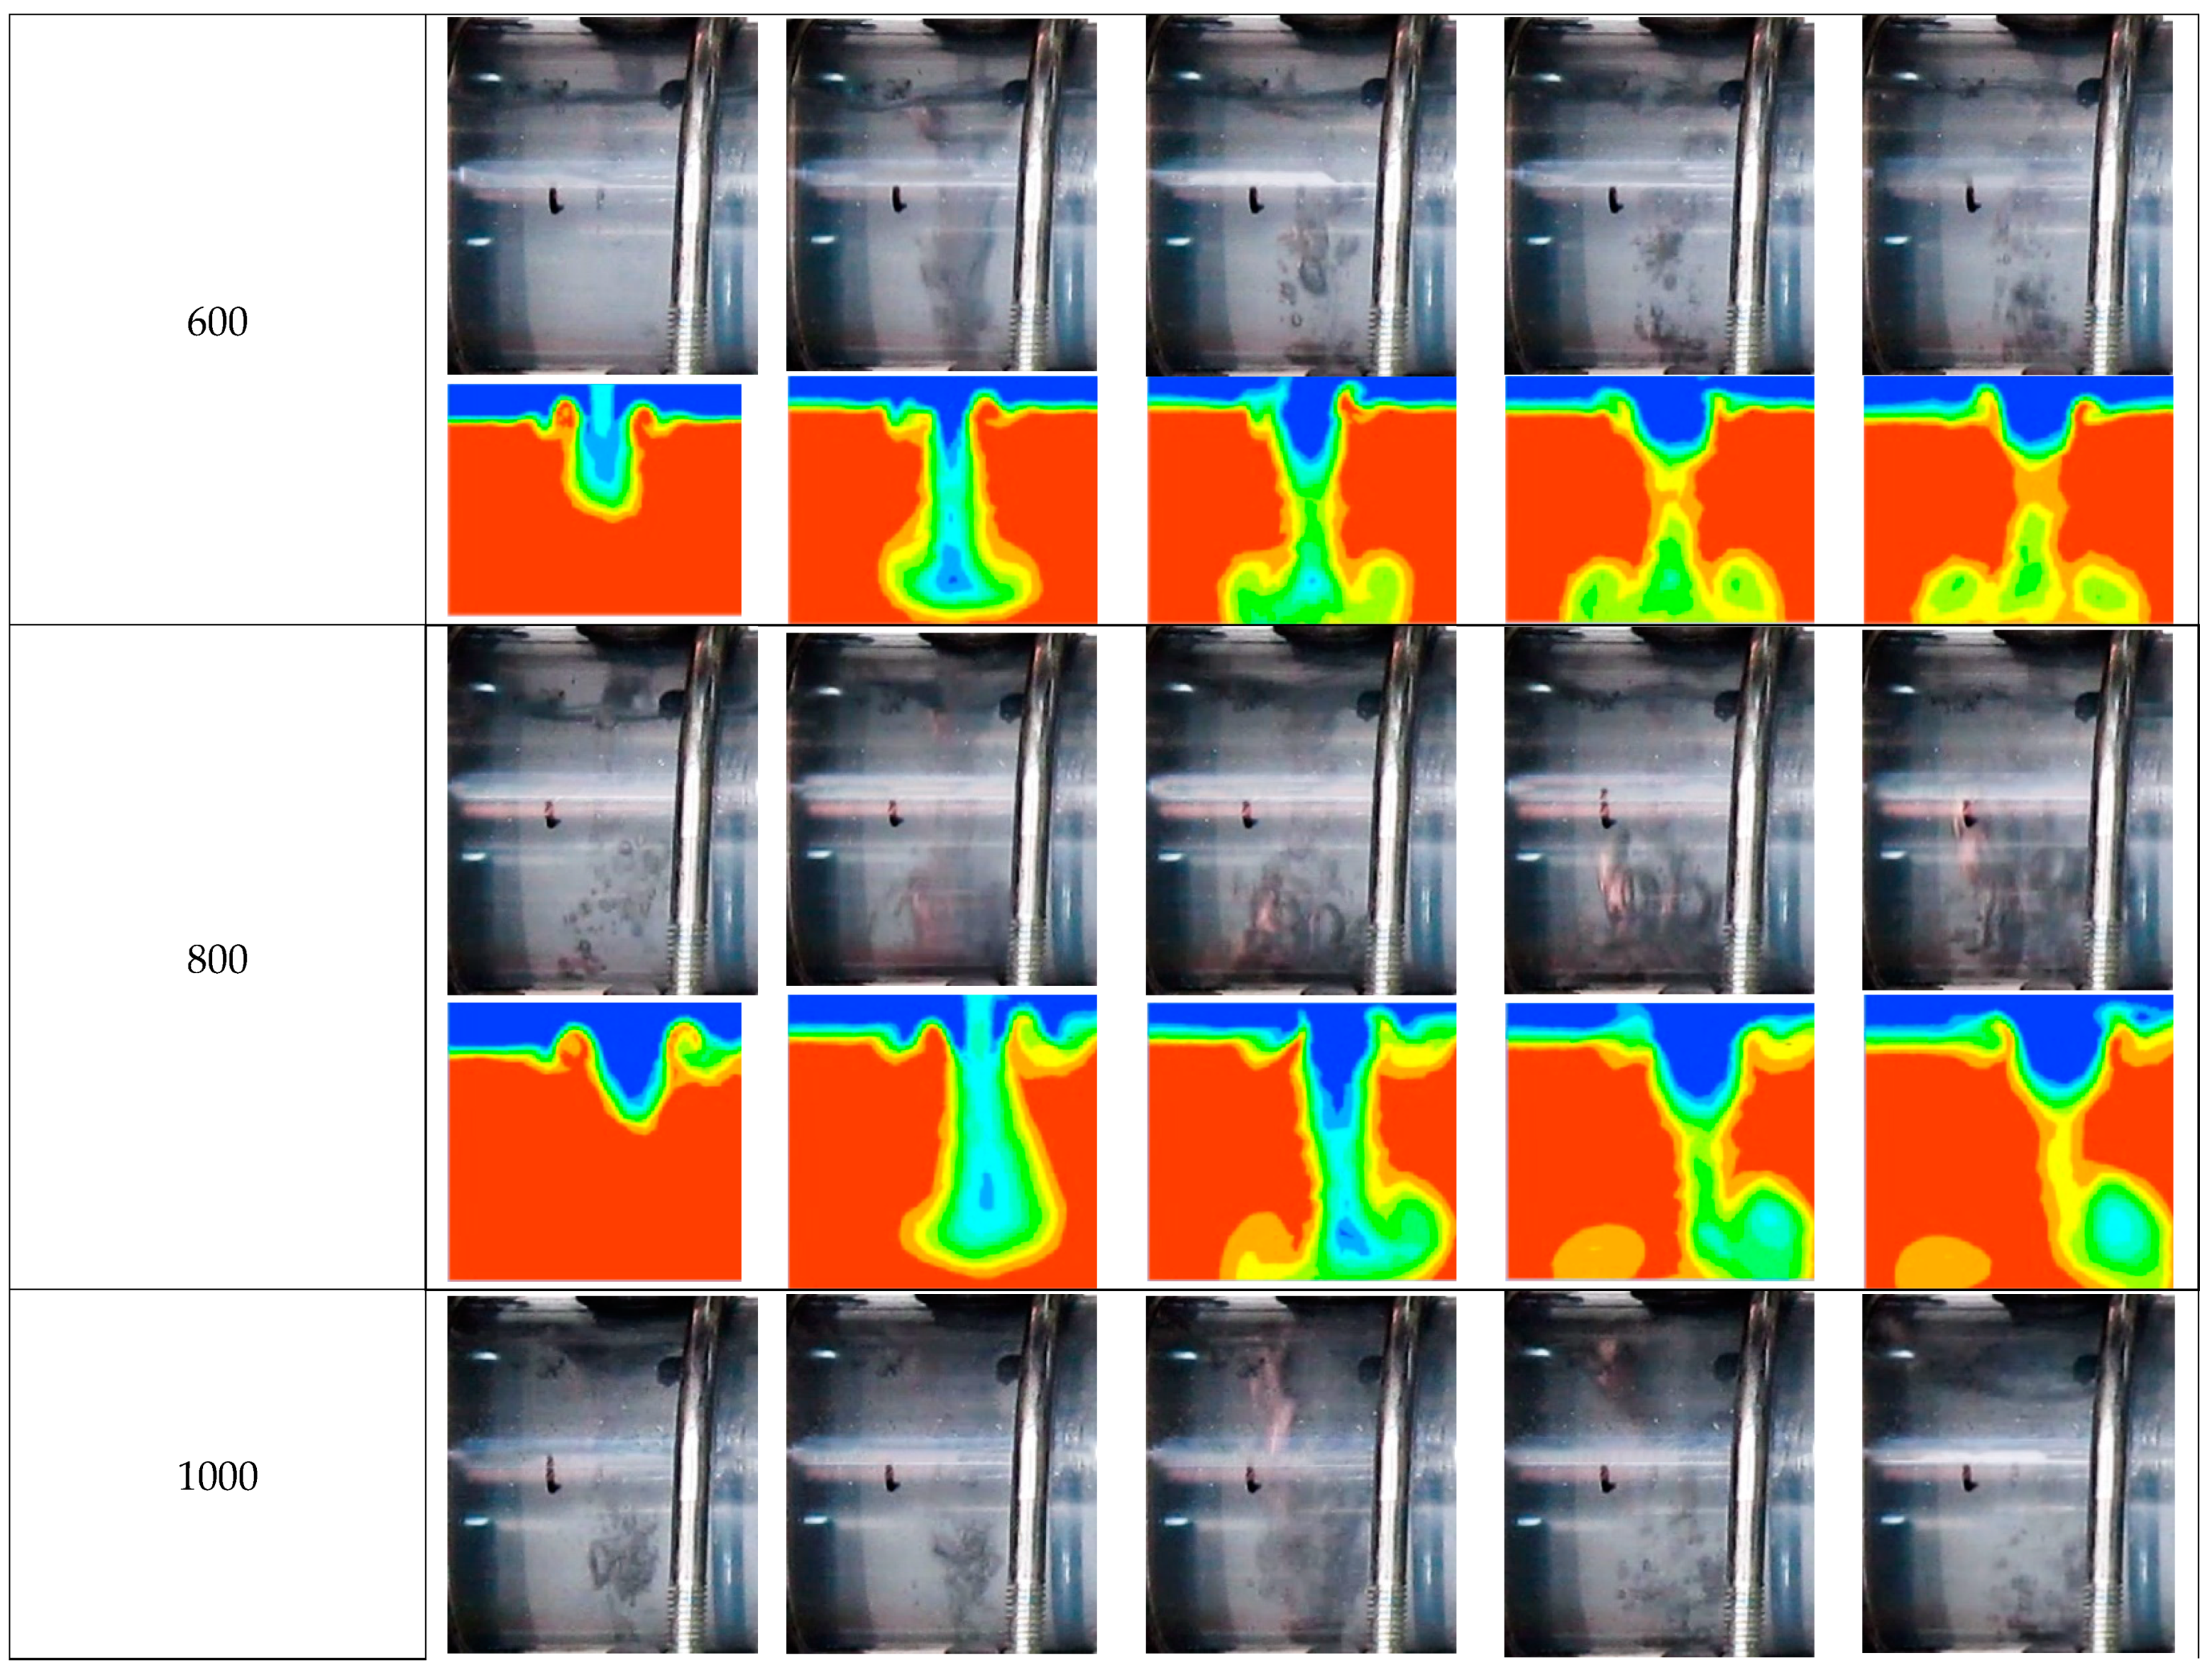
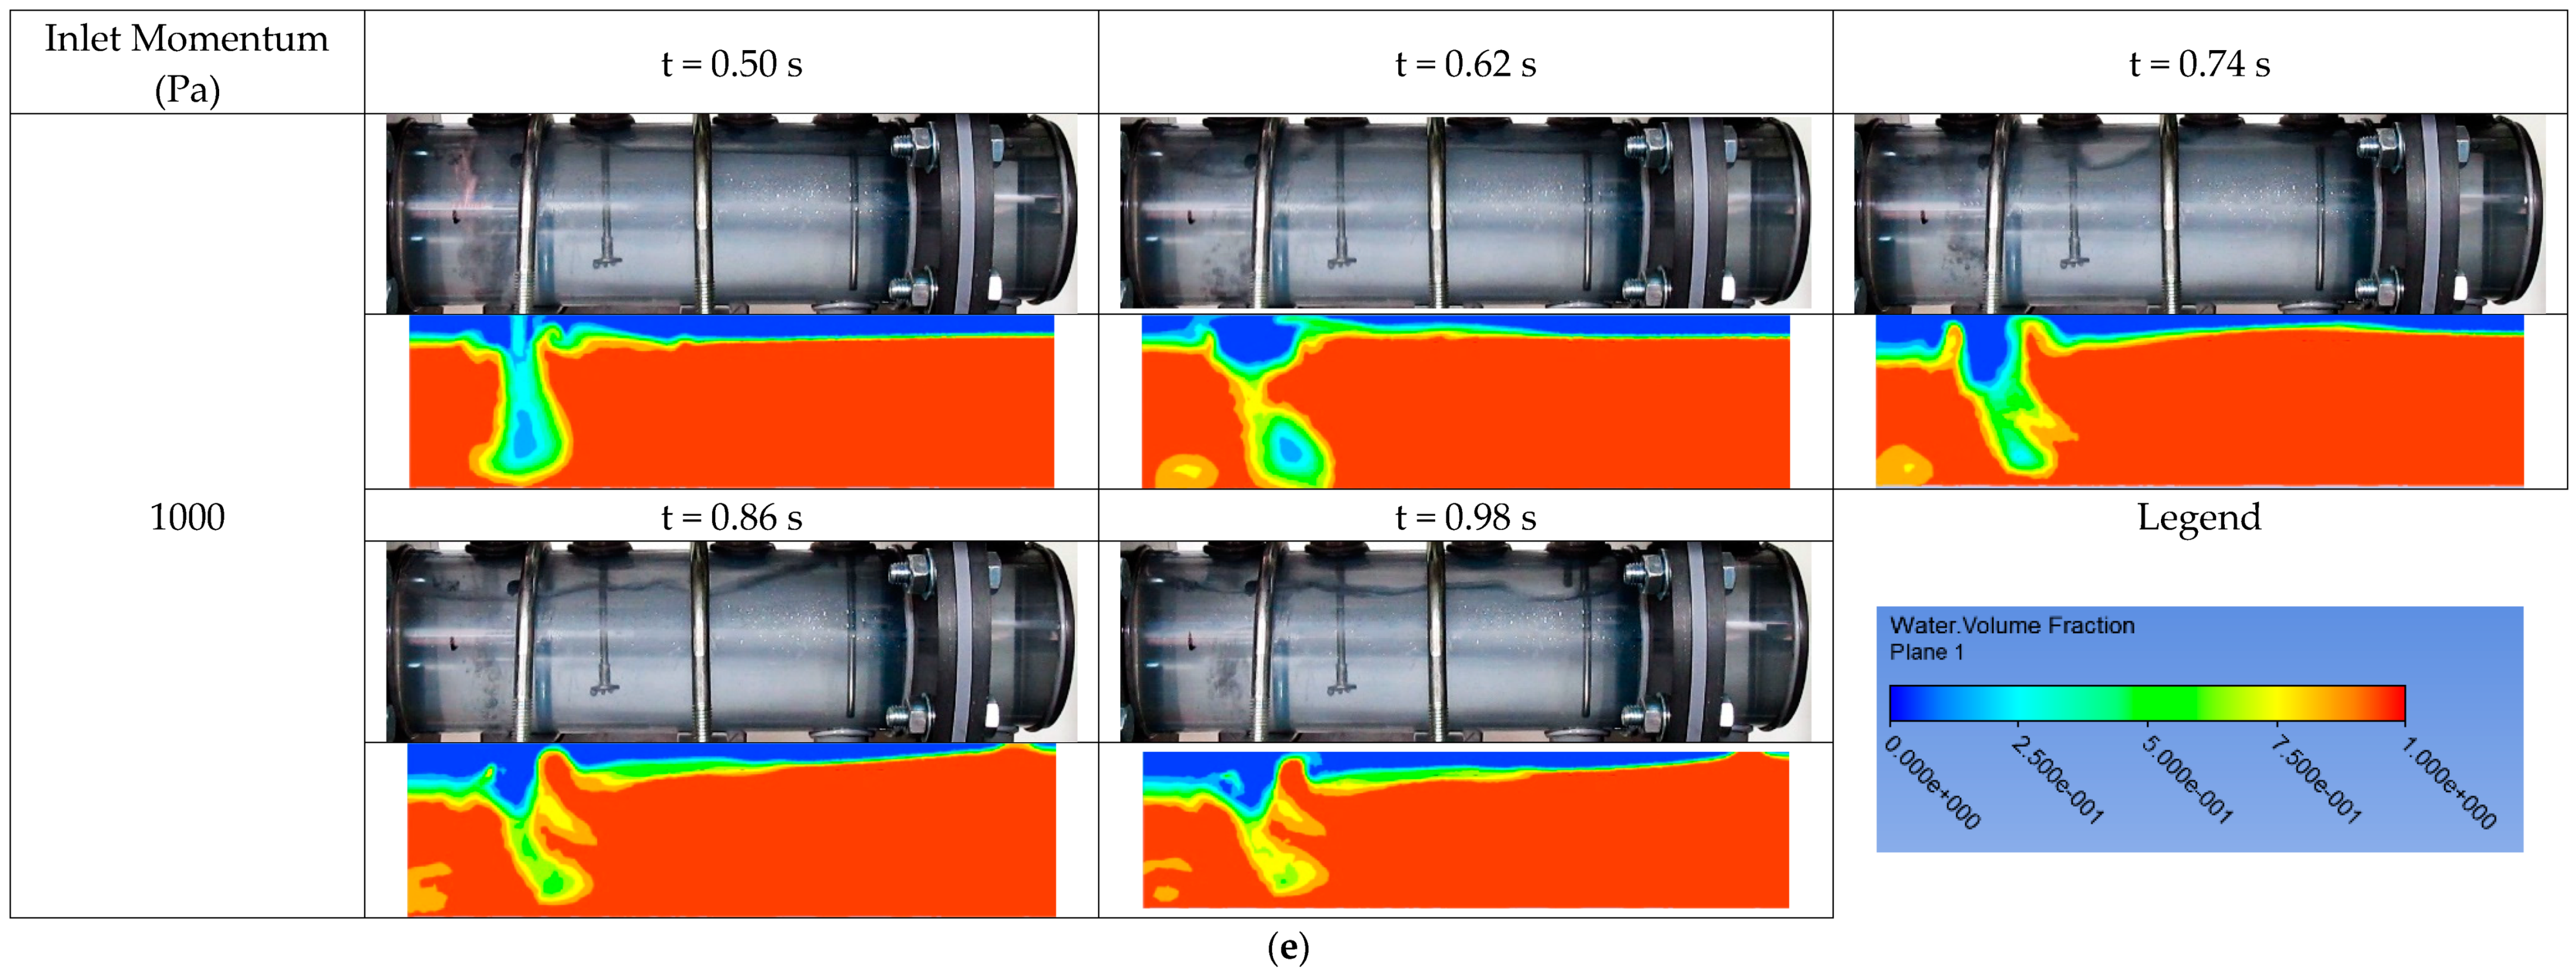
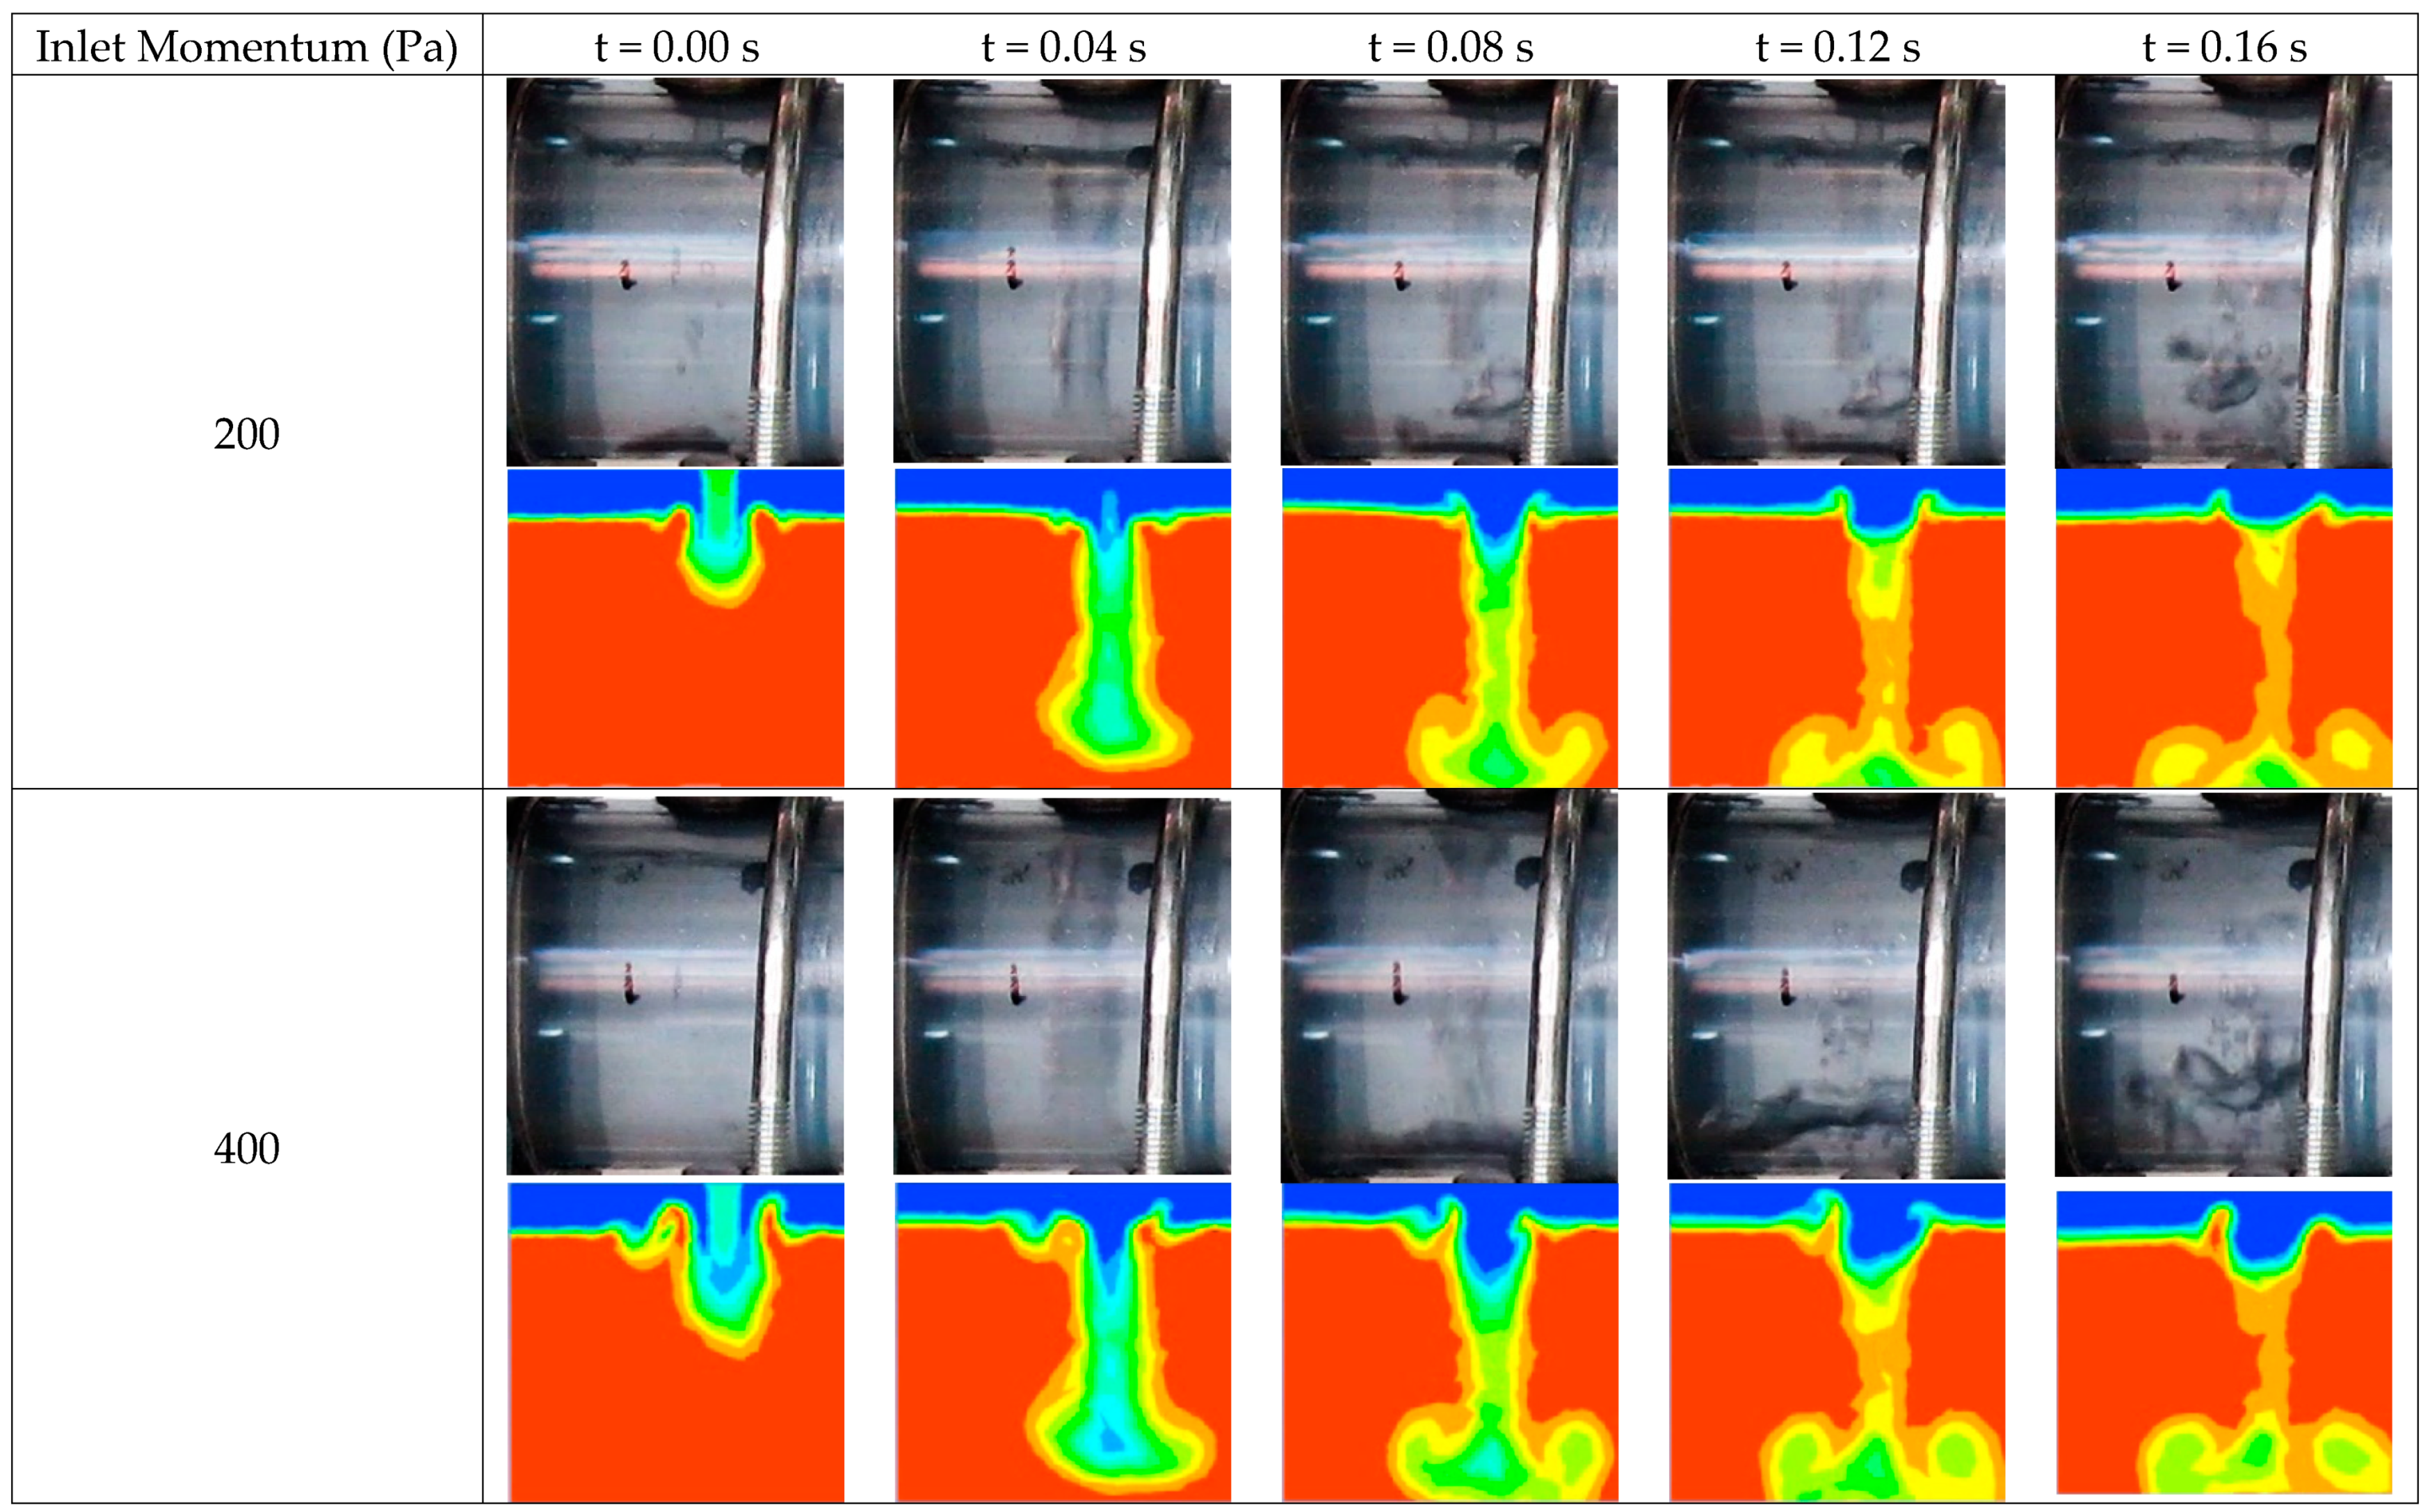
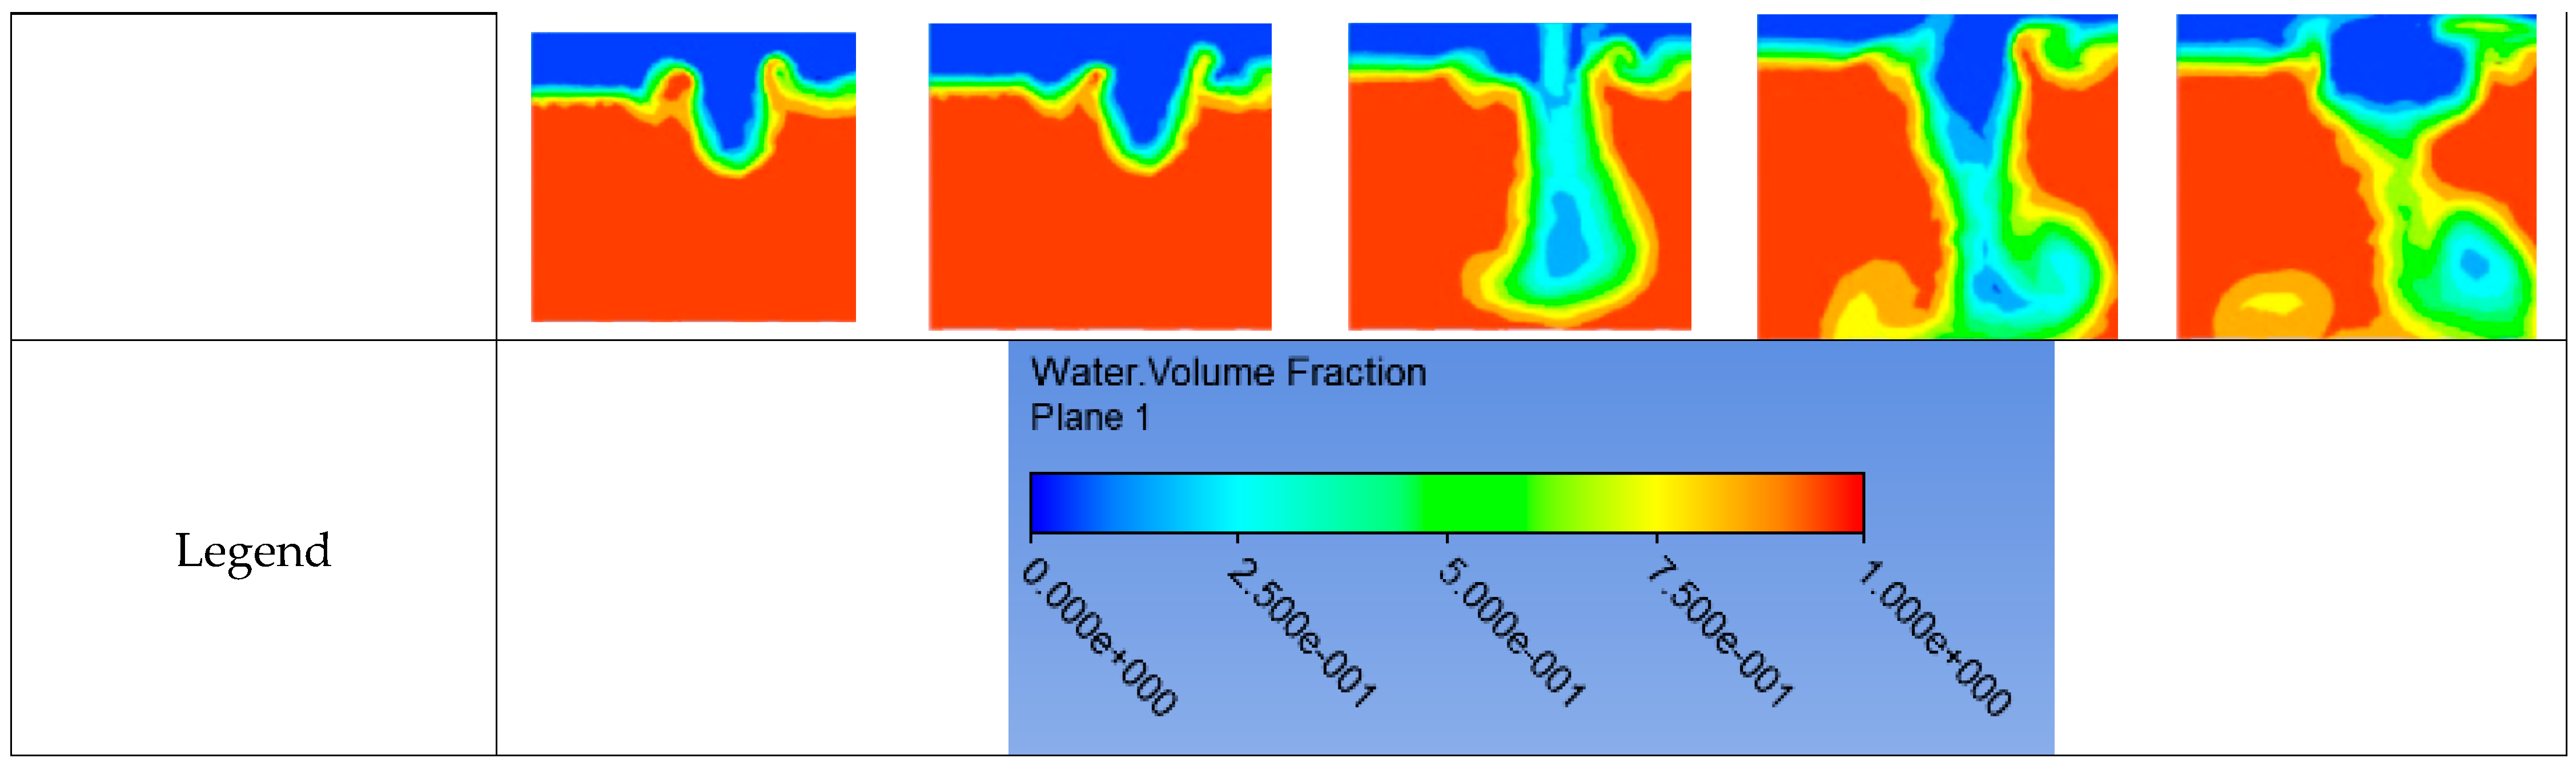
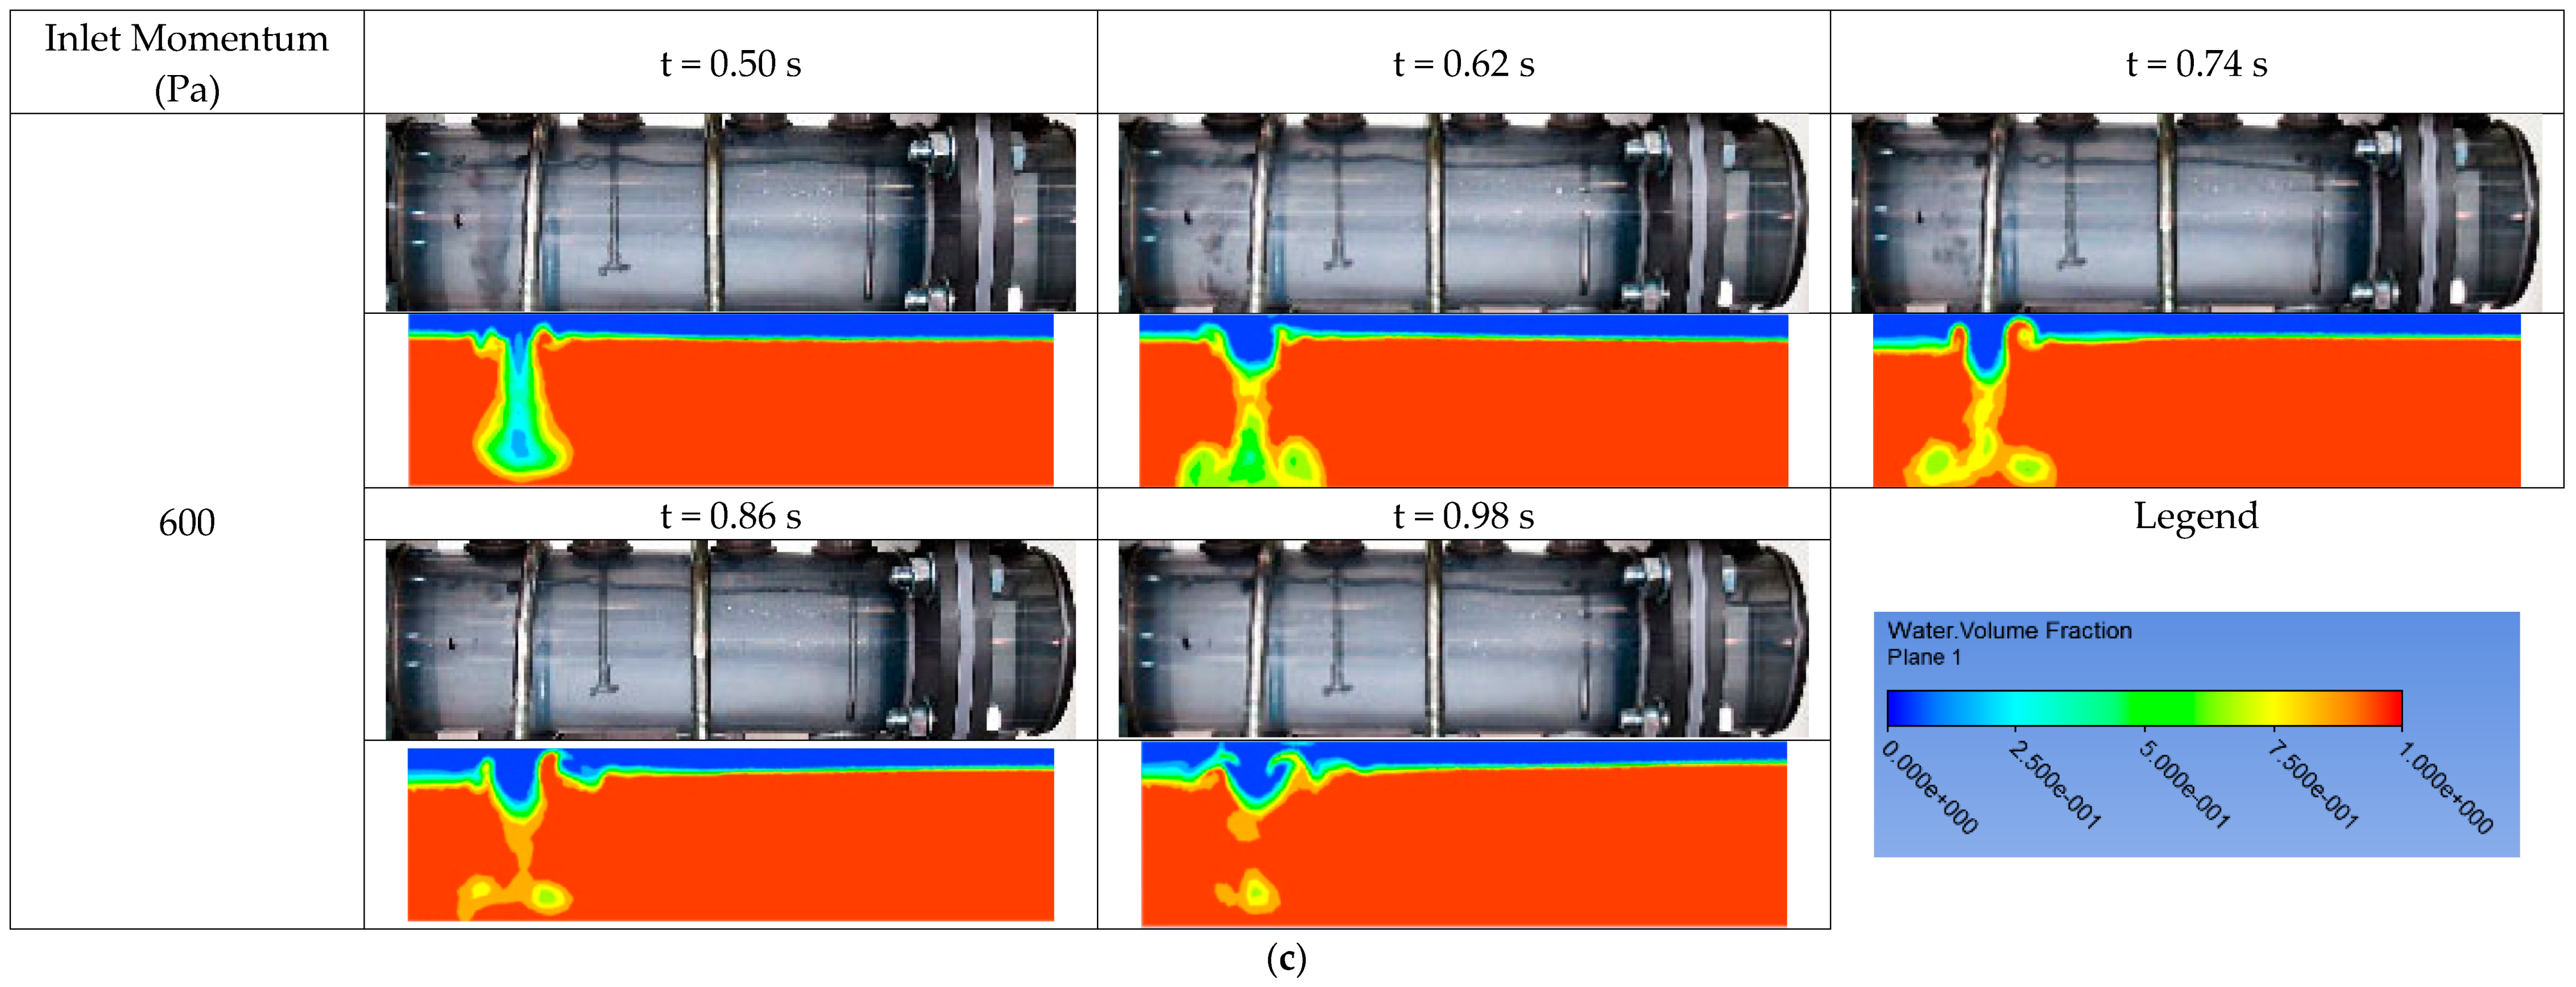
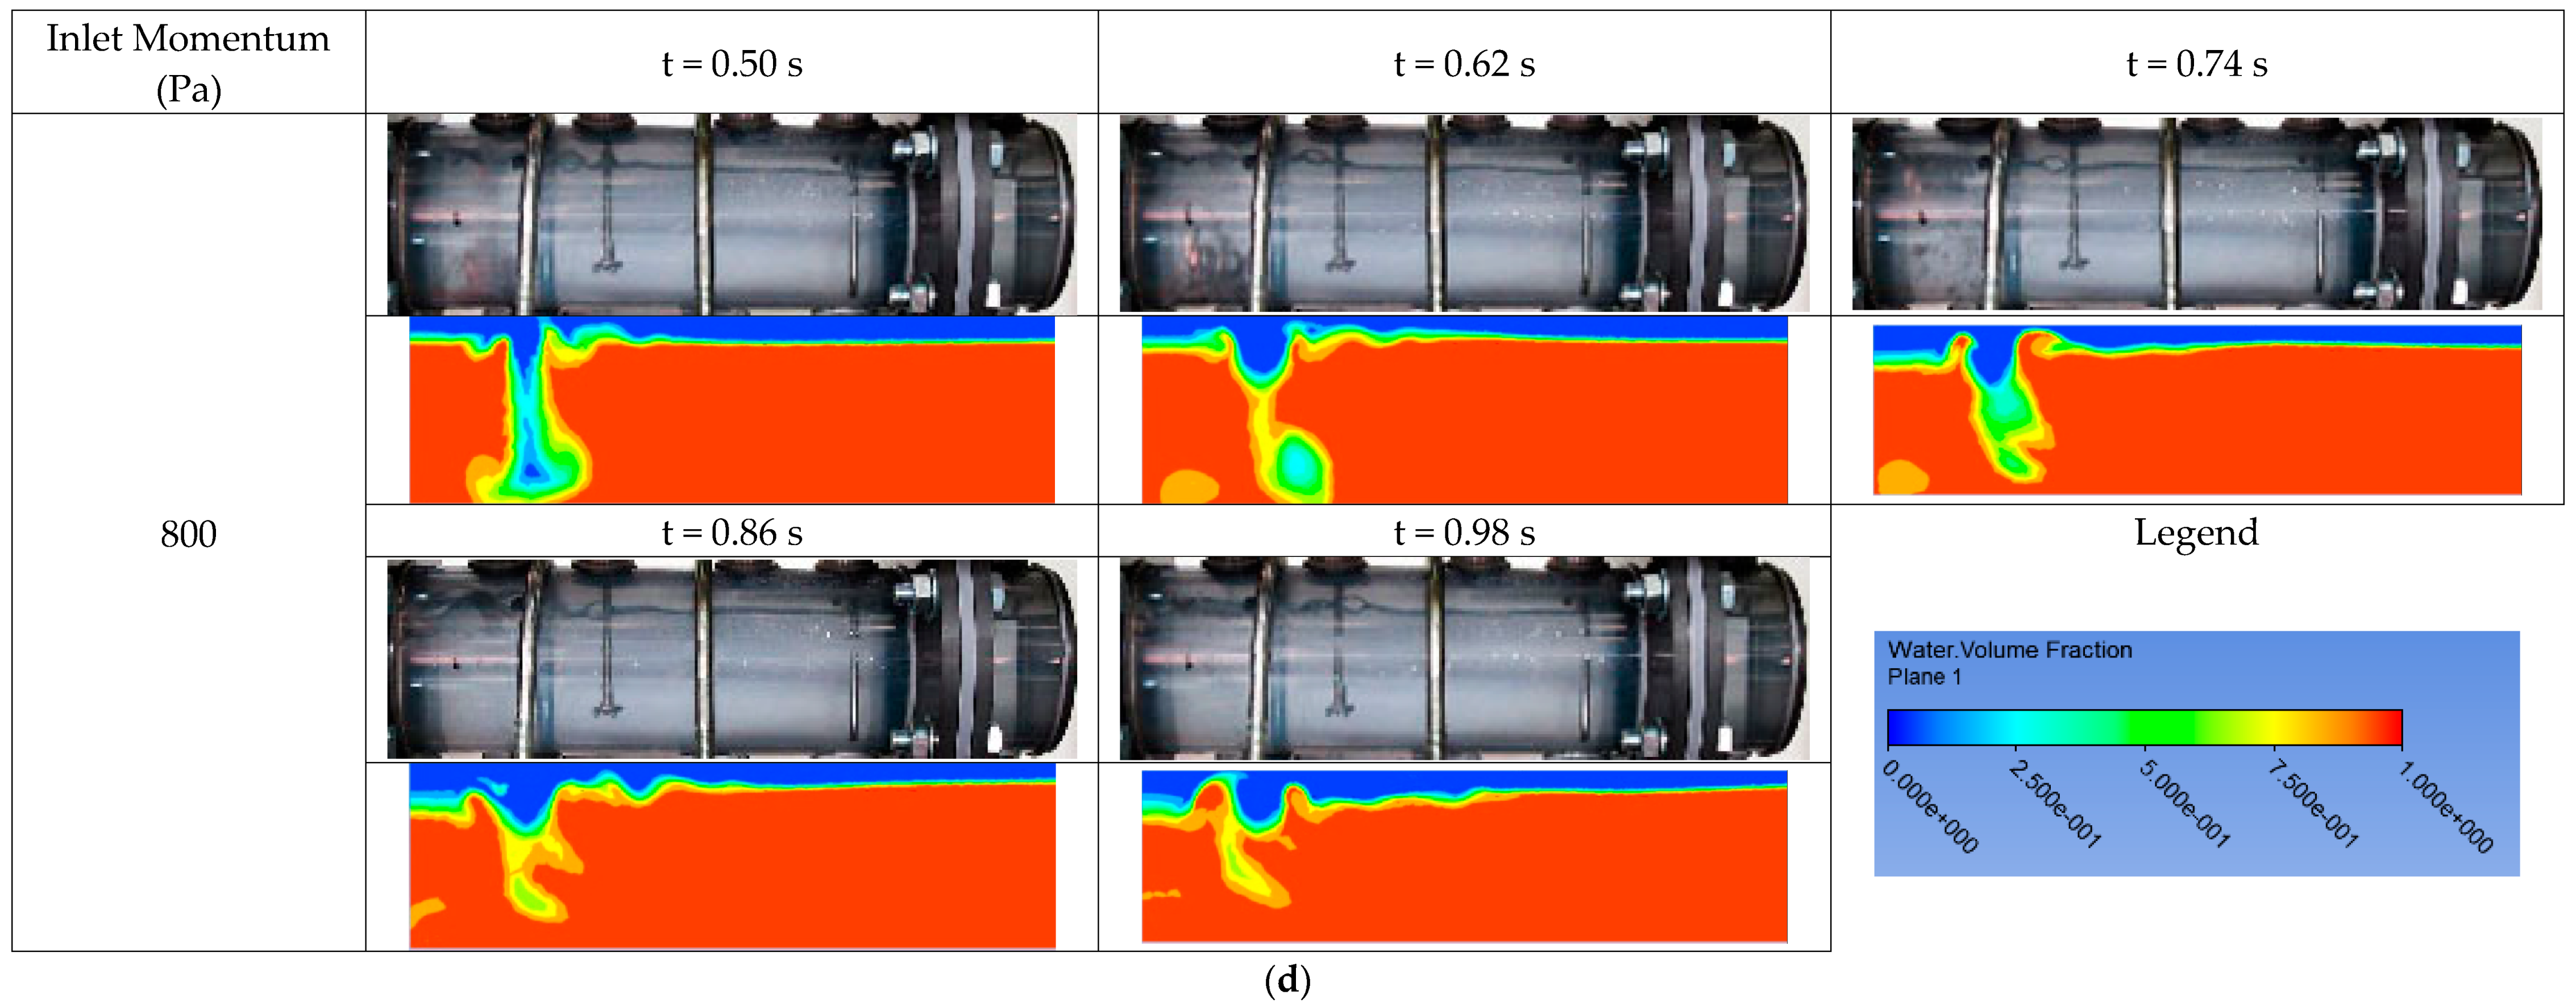
3.2.1. Cavity Formation
3.2.2. Hydrodynamics in Separator
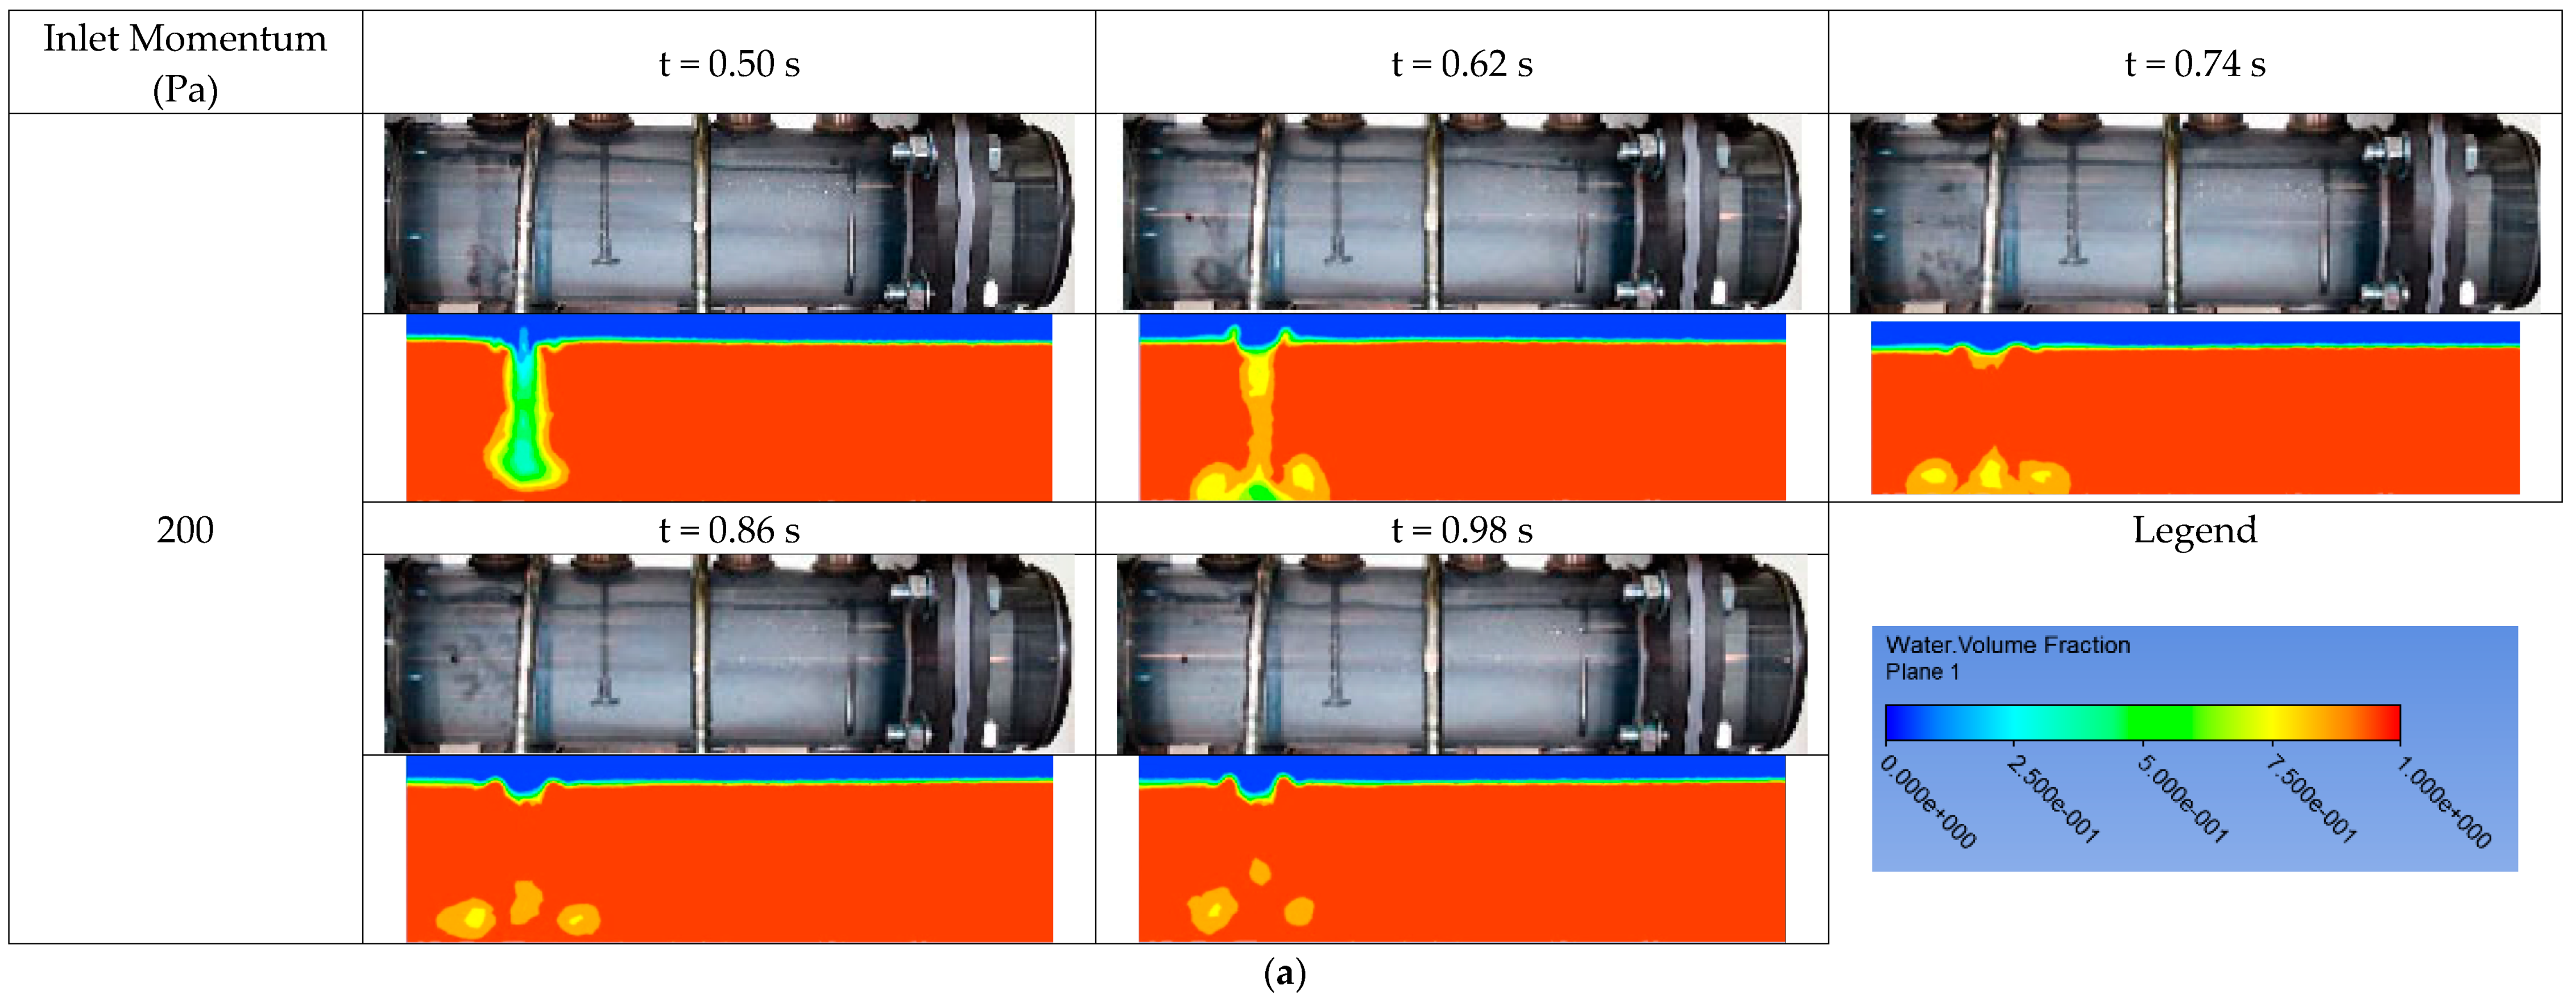
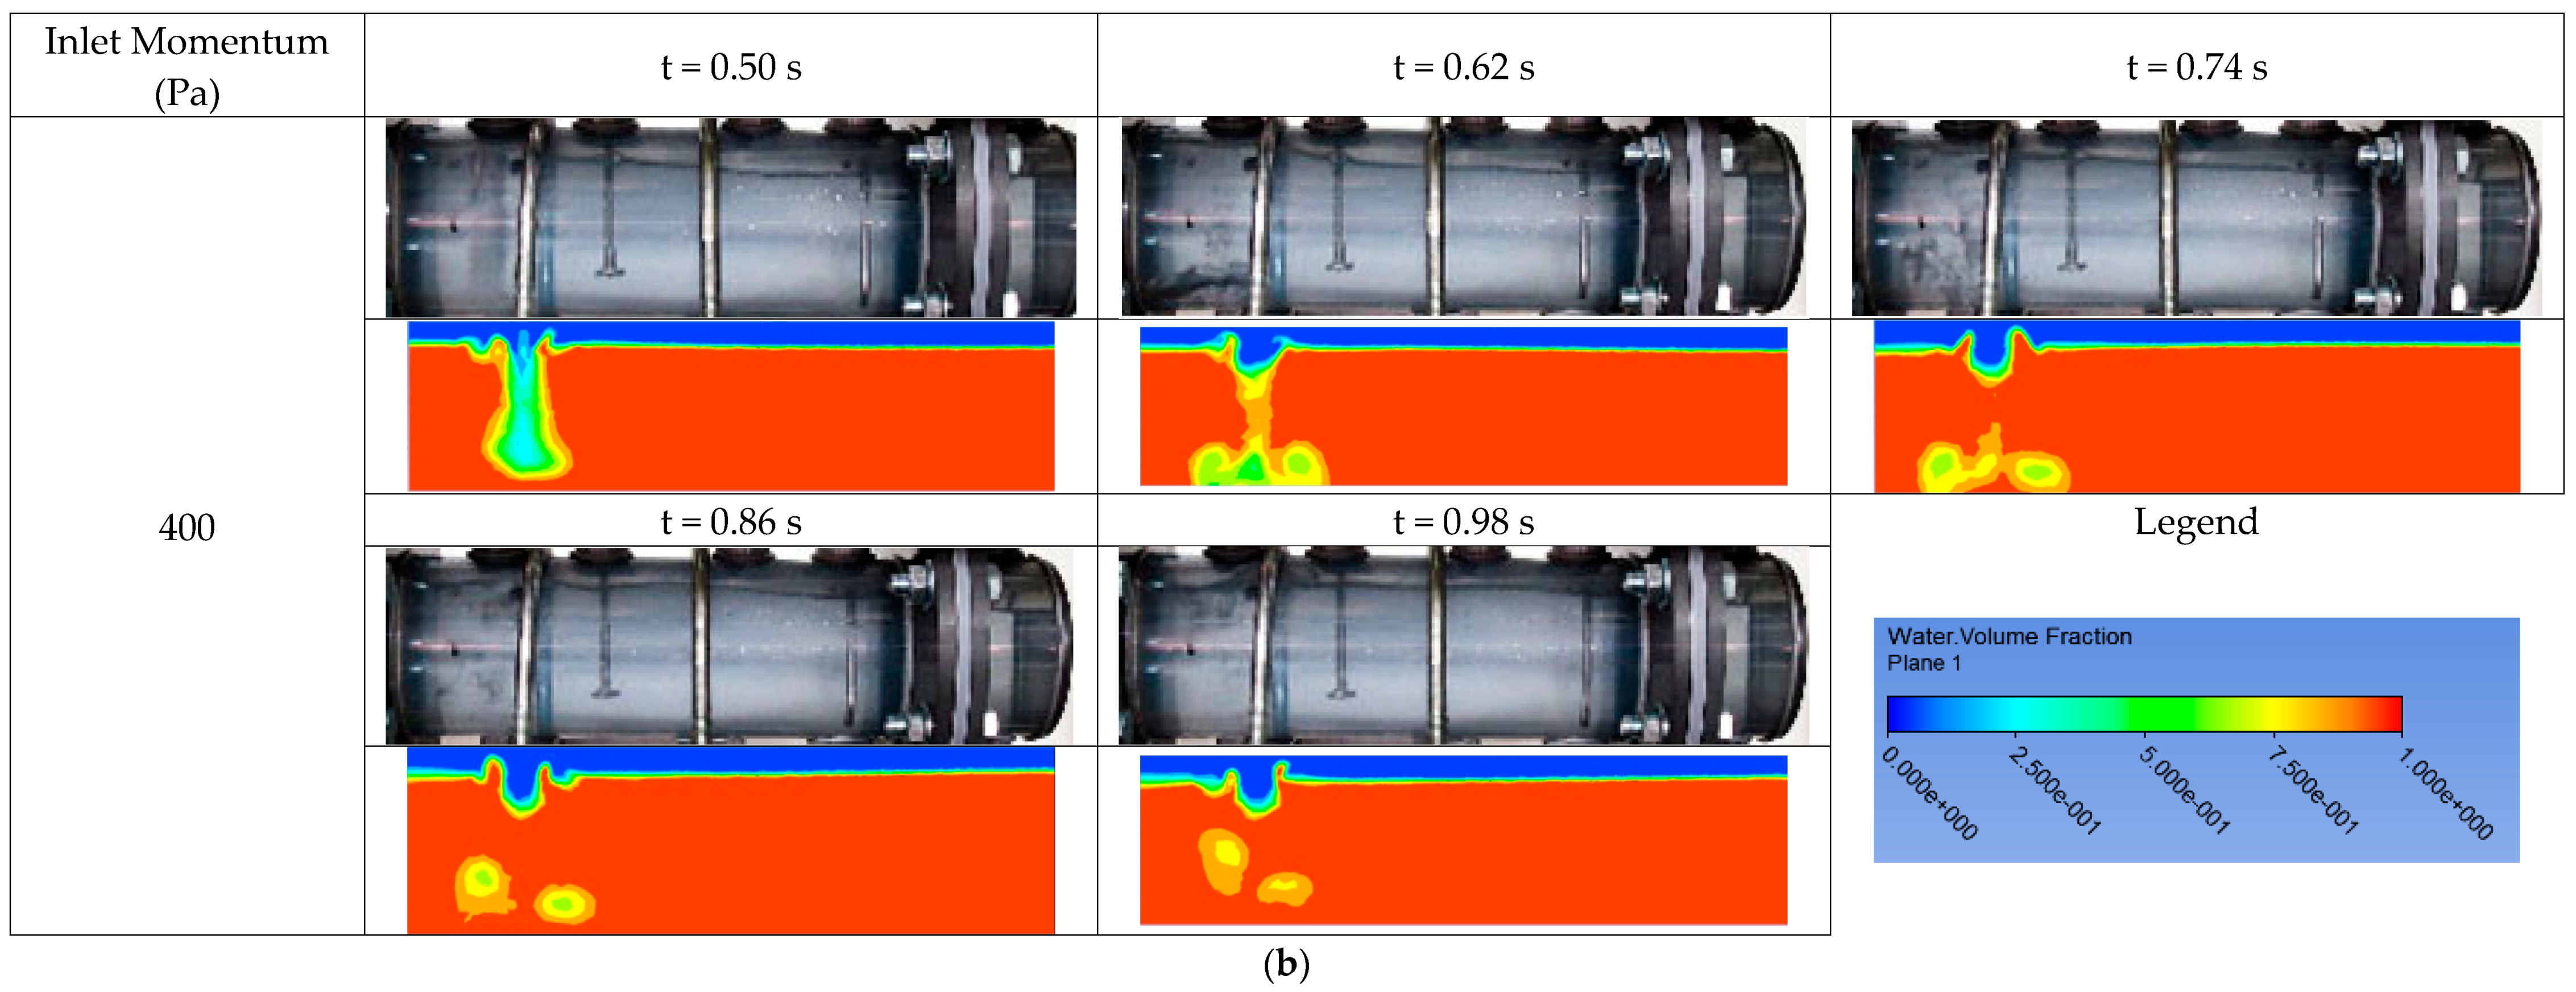
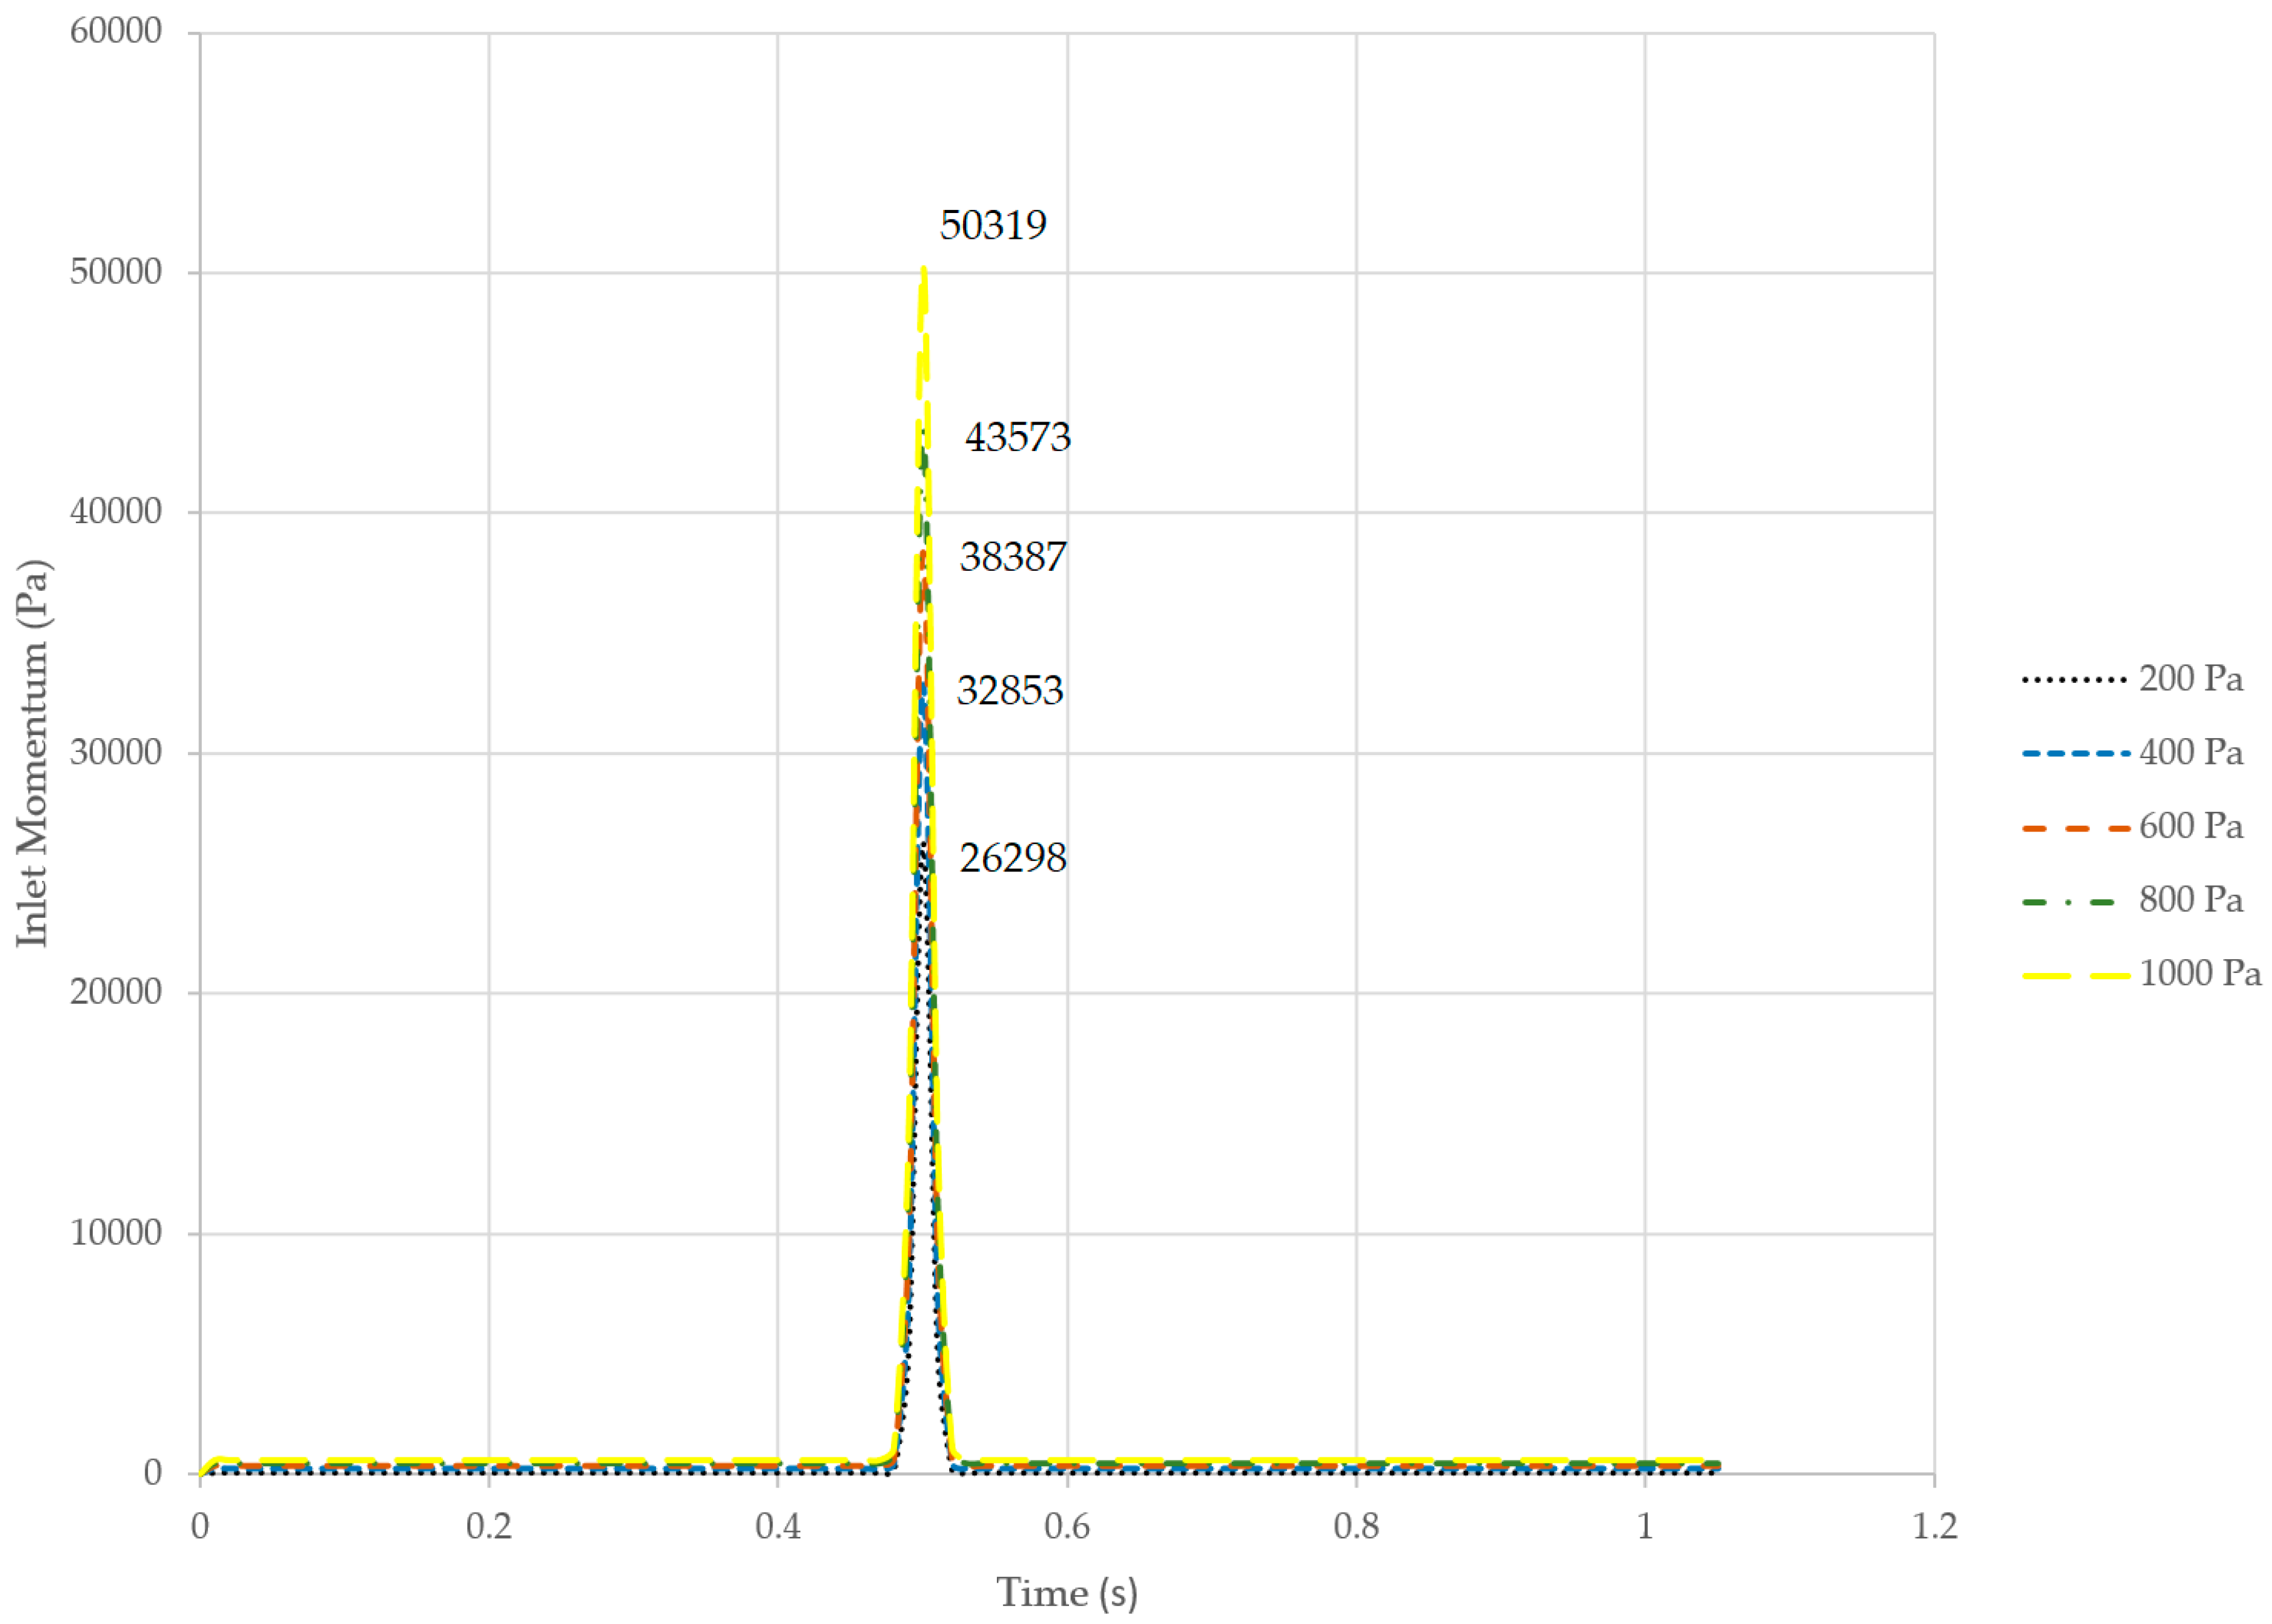
3.2.3. Amplification of Inlet Momentum
4. Conclusions
Author Contributions
Funding
Conflicts of Interest
Nomenclature
| mixture density (kg/m3) | |
| mixture mean volume flow velocity (m/s) | |
| liquid mass flowrate (kg/s) | |
| amplitude | |
| mean | |
| standard deviation | |
| API | American Petroleum Institute |
| CFD | Computational Fluid Dynamics |
| PISO | Pressure-Implicit with Splitting of Operators |
| PRESTO! | Pressure Staggering Option |
| PVC | Polyvinyl Chloride |
| VOF | Volume of Fluid |
| UDF | User-Defined Function |
References
- Katapodis, L. Oil and Gas Separation Theory, Application and Design; Society of Petroleum Engineers: Richardson, TX, USA, 1977; pp. 85–89. [Google Scholar]
- Hansen, E.W.M. Phenomenological Modelling and Simulation of Fluid Flow and Separation Behaviour in Offshore Gravity Separators. Emerg. Technol. Fluids Struct. Fluid-Struct. Interact. 2001, 431, 23–29. [Google Scholar]
- Bothamley, M. Gas/Liquid Separator: Quantifying Separation Performance. Oil Gas Facil. 2013, 2, 21–29. [Google Scholar] [CrossRef]
- Chin, R. The Savvy Separator Series: Part 4—The Ghosts of Separators: Past, Present and Future. Oil Gas Facil. 2015, 4, 18–23. [Google Scholar]
- Miyoshi, M.; Doty, D.R.; Schmidt, Z. Slug-Catcher Design for Dynamic Slugging in an Offshore Production Facility. SPE Prod. Eng. 1988, 3, 563–573. [Google Scholar] [CrossRef]
- Vallee, C.; Lucas, D.; Beyer, M.; Pietruske, H.; Schutz, P.; Carl, H. Experimental CFD Grade Data for Stratified Two-Phase Flows. Nuclear Eng. Des. 2010, 240, 2347–2356. [Google Scholar] [CrossRef]
- Andreussi, P.; Minervini, A.; Paglianti, A. Mechanistic Model of Slug Flow in Near-Horizontal Pipes. AIChE J. 1993, 39, 1281–1291. [Google Scholar] [CrossRef]
- Bonzanini, A.; Picchi, D.; Ferrari, M.; Poesio, P. Velocity Profiles Description and Shape Factors Inclusion in a Hyperbolic, One-Dimensional, Transient Two-Fluid Model for Stratified and Slug Flow Simulations in Pipes. Petroleum 2018. [Google Scholar] [CrossRef]
- Wai, L.L.; Valente, H.; Nguyen, D.T.; Thiam, T.W.; Zhao, Y.; Vivek, K.P. Experimental Study of the Effect of Pressure and Gas Density on the Transition from Stratified to Slug Flow in a Horizontal Pipe. Int. J. Multiph. Flow 2016, 85, 196–208. [Google Scholar]
- American Petroleum Institute. Specification for Oil and Gas Separators, 8th ed.; American Petroleum Institute: Washington, DC, USA, 2008; p. 14. [Google Scholar]
- Banks, R.B.; Chandrasekhara, D.V. Experimental Investigation of the Penetration of a High-Velocity Gas Jet Through a Liquid Surface. J. Fluid Mech. 1963, 15, 13–34. [Google Scholar] [CrossRef]
- Cheslak, F.R.; Nicholls, A.J.; Sichel, M. Cavities Formed on Liquid Surfaces by Impinging Gaseous Jets. J. Fluid Mech. 1969, 36, 55–63. [Google Scholar] [CrossRef]
- Mandhane, J.M.; Gregory, G.A.; Aziz, K. A Flow Pattern Map for Gas-Liquid Flow in Horizontal Pipes. Int. J. Multiph. Flow 1974, 1, 537–553. [Google Scholar] [CrossRef]
- Sidi-Ali, K.; Gatignol, R. Interfacial Friction Factor Determination Using CFD Simulations in a Horizontal Stratified Two-Phase Flow. Chem. Eng. Sci. 2010, 65, 5160–5169. [Google Scholar] [CrossRef]
- Lin, S.; Chin, Y.; Wu, C.; Lin, J.; Chen, Y. A Pressure Correction-Volume of Fluid Method for Simulation of Two-Phase Flows. Int. J. Numer. Methods Fluids 2012, 68, 181–195. [Google Scholar] [CrossRef]
- Park, I.R.; Kim, K.S.; Kim, J.; Van, S.H. A Volume-of-Fluid Method for Incompressible Free Surface Flows. Int. J. Numer. Methods Fluids 2009, 61, 1331–1362. [Google Scholar] [CrossRef]
- Shih, T.H.; Liou, W.W.; Shabbir, A.; Yang, Z.; Zhu, J. A New k − ε Eddy-Viscosity Model for High Reynolds Number Turbulent Flows—Model Development and Validation. Comput. Fluids 1995, 24, 227–238. [Google Scholar] [CrossRef]
- Ozan, A.Y.; Yüksel, Y. Simulation of a 3D Submerged Jet Flow Around a Pile. Ocean Eng. 2010, 37, 819–832. [Google Scholar] [CrossRef]
- Farzad, B.T.; Hamed, Z. Presumed PDF Modeling of a Reactive Two-Phase Flow in a Three Dimensional Jet-Stabilized Model Combustor. Energy Convers. Manag. 2010, 51, 225–234. [Google Scholar]
- Höhne, T.; Hänsch, S. A Droplet Entrainment Model for Horizontal Segregated Flows. Nuclear Eng. Des. 2015, 286, 18–26. [Google Scholar] [CrossRef]


| Type of Inlet Device | Inlet Momentum, kg/ms2 or Pa or N/m2 |
|---|---|
| No Inlet Device | 1043 |
| Diverter Plate | 1415 |
| Half Open Pipe | 2085 |
| Inlet Vane | 8043 |
| Inlet Cyclone | 14,895 |
| Parameter | Description | Value or Settings |
|---|---|---|
| Quality of Mesh | Skewness | Max: 0.81369 Average: 0.22268 |
| Discretization Scheme | Gradient | Least Square Cell-Based |
| Pressure | Pressure Staggering Option (PRESTO!) | |
| Momentum | Second Order Upwind | |
| Volume Fraction | Compressive | |
| Turbulent Kinetic Energy | Second Order Upwind | |
| Turbulent Dissipation Rate | Second Order Upwind | |
| Solver Configuration | Pressure–Velocity Coupling | Pressure-Implicit with Splitting of Operators (PISO) |
| Time Step | Number of Time Steps | 105 s |
| Time Step Size | 0.01 s | |
| Maximum Iterations/Time Step | 200 | |
| Convergence Criteria | - | Less than 0.001 |
| Parameter | Description | Value or Settings |
|---|---|---|
| Quality of Mesh | Skewness | Max: 0.84995 Average: 0.22238 |
| Discretization Scheme | Gradient | Least Square Cell-Based |
| Pressure | Pressure Staggering Option (PRESTO!) | |
| Momentum | Second Order Upwind | |
| Volume Fraction | Compressive | |
| Turbulent Kinetic Energy | Second Order Upwind | |
| Turbulent Dissipation Rate | Second Order Upwind | |
| Solver Configuration | Pressure-Velocity Coupling | Pressure-Implicit with Splitting of Operators (PISO) |
| Time Step | Number of Time Steps | 105 s |
| Time Step Size | 0.01 s | |
| Maximum Iterations/Time Step | 200 | |
| Convergence Criteria | - | Less than 0.001 |
| Inlet Momentum (Pa) | Maximum Velocity (m/s) | Average Velocity (m/s) | Maximum Velocity (m/s) |
|---|---|---|---|
| 200 |  | 1.43 | 5.90 |
| 400 |  | 2.71 | 7.25 |
| 600 |  | 3.99 | 8.61 |
| 800 |  | 5.27 | 9.77 |
| 1000 |  | 6.55 | 11.28 |
| Legend | 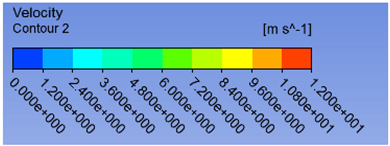 | ||
© 2018 by the authors. Licensee MDPI, Basel, Switzerland. This article is an open access article distributed under the terms and conditions of the Creative Commons Attribution (CC BY) license (http://creativecommons.org/licenses/by/4.0/).
Share and Cite
Lee, S.H.; Choong, T.S.Y.; Abdullah, L.C.; Abdul Razak, M.; Ban, Z.H. Experimental and CFD Modelling: Impact of the Inlet Slug Flow on the Horizontal Gas–Liquid Separator. Energies 2019, 12, 41. https://doi.org/10.3390/en12010041
Lee SH, Choong TSY, Abdullah LC, Abdul Razak M, Ban ZH. Experimental and CFD Modelling: Impact of the Inlet Slug Flow on the Horizontal Gas–Liquid Separator. Energies. 2019; 12(1):41. https://doi.org/10.3390/en12010041
Chicago/Turabian StyleLee, Siong Hoong, Thomas S. Y. Choong, Luqman Chuah Abdullah, Mus’ab Abdul Razak, and Zhen Hong Ban. 2019. "Experimental and CFD Modelling: Impact of the Inlet Slug Flow on the Horizontal Gas–Liquid Separator" Energies 12, no. 1: 41. https://doi.org/10.3390/en12010041
APA StyleLee, S. H., Choong, T. S. Y., Abdullah, L. C., Abdul Razak, M., & Ban, Z. H. (2019). Experimental and CFD Modelling: Impact of the Inlet Slug Flow on the Horizontal Gas–Liquid Separator. Energies, 12(1), 41. https://doi.org/10.3390/en12010041