Article

Evaluation of Biochemical Methane Potential and Kinetics on the Anaerobic Digestion of Vegetable Crop Residues

1
Department of Agriculture Biological Environment and Energy Engineering, School of Engineering, Northeast Agriculture University, Harbin 150030, China
2
Key Laboratory of Renewable Resources Utilization Technology and Equipment for Cold Region Agriculture, Northeast Agriculture University, Harbin 150030, China
*
Author to whom correspondence should be addressed.
Energies 2019, 12(1), 26; https://doi.org/10.3390/en12010026
Submission received: 1 December 2018 / Revised: 15 December 2018 / Accepted: 17 December 2018 / Published: 22 December 2018

Abstract

:
There is a lack of literature reporting the measurement and prediction of biochemical methane potential (BMP) of vegetable crop residues (VCRs) and similarly, the kinetic assessment on the anaerobic digestion process of VCR is rarely investigated. In this paper, the BMP tests of five different vegetable (snap bean, capsicum, cucumber, eggplant, and tomato) crop residues were conducted at feed to inoculum ratio (F/I) of 2.0 under mesophilic (36 ± 1 °C) conditions. A series of single-variable and multiple-variable regression models were built based on organic components (hemicellulose, cellulose, lignin, total fat, total sugar, and crude protein) for BMP prediction. Three kinetic models, including the first-order kinetic model, the Chen and Hashimoto model, and the modified Gompertz model, were used to simulate the methane yield results of VCR and obtain valuable model parameters simultaneously. As a result, the BMPs and volatile solids (VS) degradation degree of different VCRs were respectively in the range of 94.2–146.8 mL g−1 VS and 40.4–49.9%; the regression prediction models with variables lignin (R2 = 0.704, p = 0.076), variables crude protein and lignin (R2 = 0.976, p = 0.048), and variables total fat, hemicellulose, and lignin (R2 = 0.999, p = 0.027) showed the best performance on BMP prediction among the single-factor, two-factor, and three-factor models, respectively. In addition, compared to the other two kinetic models, the modified Gompertz model could be excellently fitted (R2 = 0.986–0.998) to the results of BMP experiment, verification deviations within 0.3%.

1. Introduction

In recent years, attributable to the vigorous implementation of the “vegetable basket project” by local governments at various levels, the vegetable industry has developed rapidly and prosperously in China [1]. Vegetable crop residues (VCRs), including stalks, leaves, vines, and roots of plants, refer to the parts of the vegetable crop that remain after obtaining the main agricultural products [2,3]. In 2016, the total output of VCR in China was approximately 40 million tons that were mainly generated during the harvest of vegetable fruits and the renovation of greenhouses [4,5,6]. Compared to other vegetables species, the Solanaceae (eggplant, tomato, and chili, etc.), Leguminosae (green bean, etc.), and Cucurbitaceae (cucumber, pumpkin, etc.) crops tend to contribute most of the production of VCR due to the huge plant residues, the dense vines, and the enormous demand of supplies [6,7,8]. The distinct characteristics of VCR (high water content, perishable, and eutrophic) cause it to produce odor and a large amount of leachate in a short time during stacking or landfilling [9,10]. Thus it is imperative to promote research to find a feasible method for treating VCR from those vegetable varieties with a high residues-produced ratio.
Anaerobic digestion (AD) can be used to convert biomass materials into methane for energy recovery and achieve waste stabilization and environment stress reduction [11,12]. Currently, the literature on methane production from VCR is sparse. Wang et al. investigated the performance of codigesting cucumber crop residues, corn stover, and pig manure at different ratios for methane production, and significantly improved methane yields 1.27–3.46 times higher than monofeedstock [13]. Bi et al. used chili stalks as the raw material to study the physiochemical properties and biogas production potentials of different parts of chili stalks during AD, and as a result, the methane yields of leaves (185.2 mL g−1 VS), stem (104.2 mL g−1 VS), and root (68.9 mL g−1 VS) were obtained [14]. Similarly, Luo et al. tested the feasibility and efficiency of biogas production from five different typical, protected horticulture residues (cucumber vine, tomato stem and leaves, pakchoi, watermelon vine, and grass) under a warm fermentation condition (38 °C) [7]. These studies have convincingly demonstrated the enormous biogas production potential of VCR but the AD research on crop residues from specific vegetable species, namely, certain vegetable varieties with high crop-residues-produced yield, have not been reported.
The potential biogas production assay of the feeding organic mixture, also known as biochemical methane potential (BMP), is the main indicator for characterizing waste and simultaneously the significant parameter for process optimization and variables management of anaerobic digestion [15,16]. This parameter can provide preliminary analysis and suggestion for specific biomass, however, since the traditional measuring methods of BMP are excessively time-consuming and expensive, economical and convenient techniques for predicting BMP are of great attraction [17]. In the past decades, numerous studies have succeeded in correlating BMP with component composition (proteins, lipids, sugars, hemicellulose, cellulose, and lignin) of organic substrates by developing regression predictive models. For instance, Kafle et al. evaluated the BMP of different livestock manures (dairy manure, horse manure, goat manure, chicken manure, and swine manure), and via mathematical regression analysis, the single-variable and multivariate predictive models were established for livestock manures with satisfying performances (R2 = 0.851–0.998) [18]. Gunaseelan V.N. confirmed that the BMP of fruit and vegetable solid wastes, sorghum, and napiergrass can be predicted through regression models based on main chemical constituents, which account for 90% (R2 ≥ 90%) of the variation in methane production at least [19]. Likewise, Triolo et al. researched the influence of fibrous fractions containing cellulose, hemicelluloses, and lignin of energy crops and animal manures on its BMP and found a good negative correlation (R2 = 0.763–0.908) between BMP and lignin, when lignin as the single variable exists in prediction models [17]. Furthermore, several studies have focused on some fresh lignocellulosic wastes such as sunflowers, giant reed, spent edible mushroom substrates, and Chinese herb-extraction residues and fitted their own BMP regression models. [16,20,21]. However, to the best of our knowledge, no literature has investigated the relationships between chemical composition of VCR and its BMP by establishing a regression model.
According to the literature, the modeling of methane production was generally based on the kinetic models [19]. Kinetic evaluation of the AD process is critical for anaerobic reactor design and evaluation [22]. Due to the microbial role in the anaerobic process, the first-order kinetic model is commonly applied to simulate the anaerobic biodegradation [23]. In addition, the Chen and Hashimoto model is efficaciously used to predict the volumetric methane production rate in the AD process [24], and likewise, exponential rise to maximum as well as modified Gompertz equations could accurately simulate accumulation of biogas from AD [21,25]. Nevertheless, the study of the kinetic evaluation of the VCR anaerobic fermentation process using the above three models has not been carried out so far.
In summary, the objectives of this paper were (1) to characterize the compositional features of several different VCRs from Solanaceae, Leguminosae, and Cucurbitaceae; (2) to compare their BMP from the mesophilic batch fermentation test; (3) to establish single-variable and multivariate regression models based on compositional features for BMP prediction; and, using the BMP test results, (4) to evaluate the batch fermentation process via simulation of different kinetic models for determining kinetic parameters.

2. Materials and Methods

2.1. Feedstock and Inoculum Used

Five common types of VCR (all parts above-ground including stems, leaves, vines, and residual fruit) including snap bean (Phaseolus vulgaris) crop residues (SBR), capsicum (Capsicum annuum L.) crop residues (CAR), cucumber (Cucumis sativus L.) crop residues (CUR), eggplant (Solanum melongena L.) crop residues (EGR), and tomato (Lycopersicon esculentum Mill.) crop residues (TOR) were used in our experiment. These VCRs were obtained from a local vegetable greenhouse (Xiangfang District, Harbin City, Heilongjiang Province, China) in October 2017. After moisture content measurement, the substrates were dried at 105 °C to constant weight and then crushed to 50–200 mesh using a multifunctional electric shredding apparatus (motor speed was 30,000 r min−1 and rated power was 1800 W) prior to measurement. The characteristic data (total fat, total sugar, total protein, hemicellulose, cellulose, and lignin) of each VCR were determined following the methods described in Section 2.4, and results are shown in Table 1.
The anaerobic sludge used for inoculation was taken from a 400 m3 size anaerobic digestion tank in a biogas plant (Heilongjiang, China) that digested straw and cattle manure at 37 °C. The TS, VS, and pH of inoculum were 1.02%, 0.58%, and 7.61, respectively. The inoculum was stored at 4 °C, and 72 h before use, it was activated at 36 ± 1 °C with a constant temperature shaker.

2.2. Test Setup and Design

In the BMP test, 5 VCRs substrates were digested anaerobically in duplicate using 15 Erlenmeyer flasks (0.5 L) with a working volume of 0.35 L. The feed-to-inoculum ratio (F/I) was maintained at 2.0 (based on dry matter) in all the batch digesters. A certain amount of dry substrates, which was calculated from the inoculation ratio, 4 mL of macroelement and oligoelement solution (based on the methods described by Monlau et al.), and inoculum were precisely and successively added to each flask while ensuring that the volume was equal to 0.35 L [16]. After the mixture was shaken evenly by hand, the headspace of bottles was flushed with pure N2 to obtain an anaerobic environment. Flasks were immediately closed by rubber plugs with a gas channel; the channel had been connected in advance with a 0.5 L aluminum gas bag (Dalian Hede Technologies Ltd., Dalian, China) using a rubber tube. Three blanks only containing inoculum and elemental replenishment solution were used to correct biogas production. All flasks were incubated in a 36 ± 1 °C incubator.

2.3. Biogas Measurement and Calculations

The biogas volumes in collection bags were measured via the water displacement method, and then the measured wet biogas volumes were converted to the volumes at standard dry state (273 K, 1.00 atm) using Equation (1) uniformly [22]. A gas chromatograph (GC-6800N, Agilent Inc., Santa Clara, CA, USA) equipped with a thermal conductivity detector (TCD) and a stainless steel column (1 m × 3 mm i.d. carbon molecular sieve TDX-01: 1.5 to 2.0 nm) was used to determine the methane and carbon dioxide concentrations from the biogas. The carrier gas was argon with a flow rate of 40 mL min−1; the gas measurement time was 2.5 min; temperatures of injector, oven, and detector were set to 120 °C, 155 °C, and 220 °C, respectively. The gas composition was measured daily at the initial stage of AD and gradually increased to larger time intervals.
V STP = V T × 273 × ( 760 - p w ) ( 273 + T ) × 760
where VSTP is volume of gas measured at standard temperature and pressure (mL), VT is volume of gas measured at temperature T (mL), T is temperature of the laboratory ambient space (°C), and pw represents the saturated vapor pressure at the ambient temperature (mm Hg).

2.4. Analytical Methods

Parameters such as total solids (TS), volatile solids (VS), and total Kjeldahl nitrogen (TKN) were determined according to the standard methods described by American Public Health Association (APHA), and the crude protein (CP) was obtained as TKN × 6.25 [26]. The pH of VCR was determined by soaking extracting method (Sartorius basic pH meter PB-10, Germany). Fehling reagent method was applied to the determination of total sugars (TSug), and total fat (TF) was measured via Soxhlet extraction method [27,28]. The hemi-cellulose (Hem), cellulose (Cel), and lignin (Lig) were measured using an automatic fiber analyzer (ANKOM A2000i. ANKOM Technology, Macedon, NY, USA) according to the method adapted from Soest et al. [29]. For accuracy, all tests were repeated three times and averaged.
The variance analysis (ANOVA) and least significant difference (LSD) analysis were performed by Design-Expert 8.0.6 software, and the SPSS 17.0 was used for single and multiple regression analysis for BMP data. Origin 8.0 software was used to perform nonlinear regression analysis to determine all the parameters of the three kinetic models, and the coefficient of determination (R2) and relative root mean square error (rRMSE) were obtained synchronously.

2.5. Kinetic Models

2.5.1. First-Order Kinetic Model

Hydrolysis in anaerobic digestion was usually assumed to be a rate-limiting step and based on this, a first-order kinetic model could provide an accurate representation of BMP results [30]. It is assumed that the degradation of each VCR follows a first-order decay rate. Therefore, the production of methane was assumed to follow Equation (2):
G ( t ) = G 0 × ( 1 - e ( - Kt ) )
where G(t) is the cumulative methane yield at time t (mL g−1 VS), G0 is methane potential of the feedstock (mL g−1 VS), K is first-order disintegration rate constant as well as methane production rate constant (day−1), which is determined by taking the reciprocal of the time from the start of the BMP assay until when G(t) equaled 0.632 G0, and t is anaerobic digestion time (day).

2.5.2. Chen and Hashimoto Model

The Chen and Hashimoto model has been satisfactorily used for both the continuous and batch anaerobic digestion processes [18,24]. The model parameters, and especially critical retention time (HRTcritical), are of great significance for the evaluation of anaerobic fermentation reactions. The Chen and Hashimoto model is described in Equation (3):
G ( t ) = G 0 × ( 1 - K CH HRT × μ m + K CH - 1 )
where hydraulic retention time (HRT) is digestion time (when equation is applied to batch fermentation experiments) (day), KCH is Chen and Hashimoto kinetic constant (dimensionless), μm is maximum specific growth rate of microorganisms (day−1). Equation (3) can be converted to Equation (4):
HRT = 1 μ m + K CH μ M G ( t ) G 0 - G ( t )
A straight line with the slope KCHm and the intercept 1/μm is obtained. When taking G(t)/G0−G(t) as the independent variable and HRT as the dependent variable, HRTcritical is determined using Equation (5). The shorter the HRTcritical is, the better the reactor will operate [18].
HRT critical = 1 μ m

2.5.3. Modified Gompertz Model

The modified Gompertz equations have a wide range of applications in the field of methane production, and it can be presented as Equation (6):
G ( t ) = G 0 × exp { - exp [ R max × e G 0 ( λ - t ) + 1 ] }
where Rmax is the maximal methane production rate (mL g−1 VS day) and λ is the duration of lag phase (day), while t is the time over the fermentation period and e is equivalent to exp(1), or 2.718282. The curve simulated via this equation has the following characteristics: (1) it matches the S type curve model, (2) the growth rate is positive, and (3) the inflection point and horizontal asymptote are unique. These Gompertz parameters, especially lag phase (λ), are also an important factor in determining the efficiency of anaerobic digestion [25].

3. Results and Discussion

3.1. Compositional Characteristics of VCR

The characteristics of substrates and inoculum used for the test are shown in Table 1. The TS and VS content in fresh VCR were found to be in the range of 17.52–21.87% and 14.53–18.30%, respectively. Liu et al. obtained an analogous result of moisture content (80.32%) and VS content (12.52%) in tomato stalks compared to our study [10]. Except for cucumber crop residues (CUR), all types of VCR possessed weak acidity (pH ranged from 4.96 to 6.04), which were in accordance with the pH average range of VCR (4.53–8.50) suggested by Han et al. [6]. Compared to the average of 17.47% from the other four crop residues, CUR showed a significantly (p < 0.05) lower crude protein content of 8.84%. Low total fat contents (1.67–3.54%) were found in VCR. As a contrast, the total sugar contents (19.33–26.88%) were found to be relatively high, which means that VCR was rich in readily degradable carbohydrate compounds. Concerning the holocelluloses fraction, hemicellulose contents ranged from 10.27% to 18.63%, cellulose contents ranged from 23.39% to 31.26%, and lignin contents ranged from 5.1% to 11.25%. According to Gunaseelan V.N., significantly (p < 0.05) lower cellulose contents were present in fruit and vegetable waste (Solanum tuberosum L. peels, Brassica oleracea L. leaves, etc.) compared to VCR, which was typically about 20% (based on dry matter) [19]. The carbon/nitrogen (C/N) ratio of VCR ranged from 11.65 to 22.76. The C/N ratio of 20–30 was generally defined as the most suitable ratio for the anaerobic fermentation process, although Wang et al. suggested that the optimal C/N ratio for AD was not within a fixed range but depended on the types of biogas substrates [31]. For instance, Romano and Zhang proposed that the C/N ratio should be maintained at 15 for codigestion of digested sludge and juice [32]. In addition, the results of the Paired-Samples t test (data not shown) indicated that no significant difference was found between the concentrations of CF and Hem, but concentrations of all other components were significantly different from each other (p < 0.05).

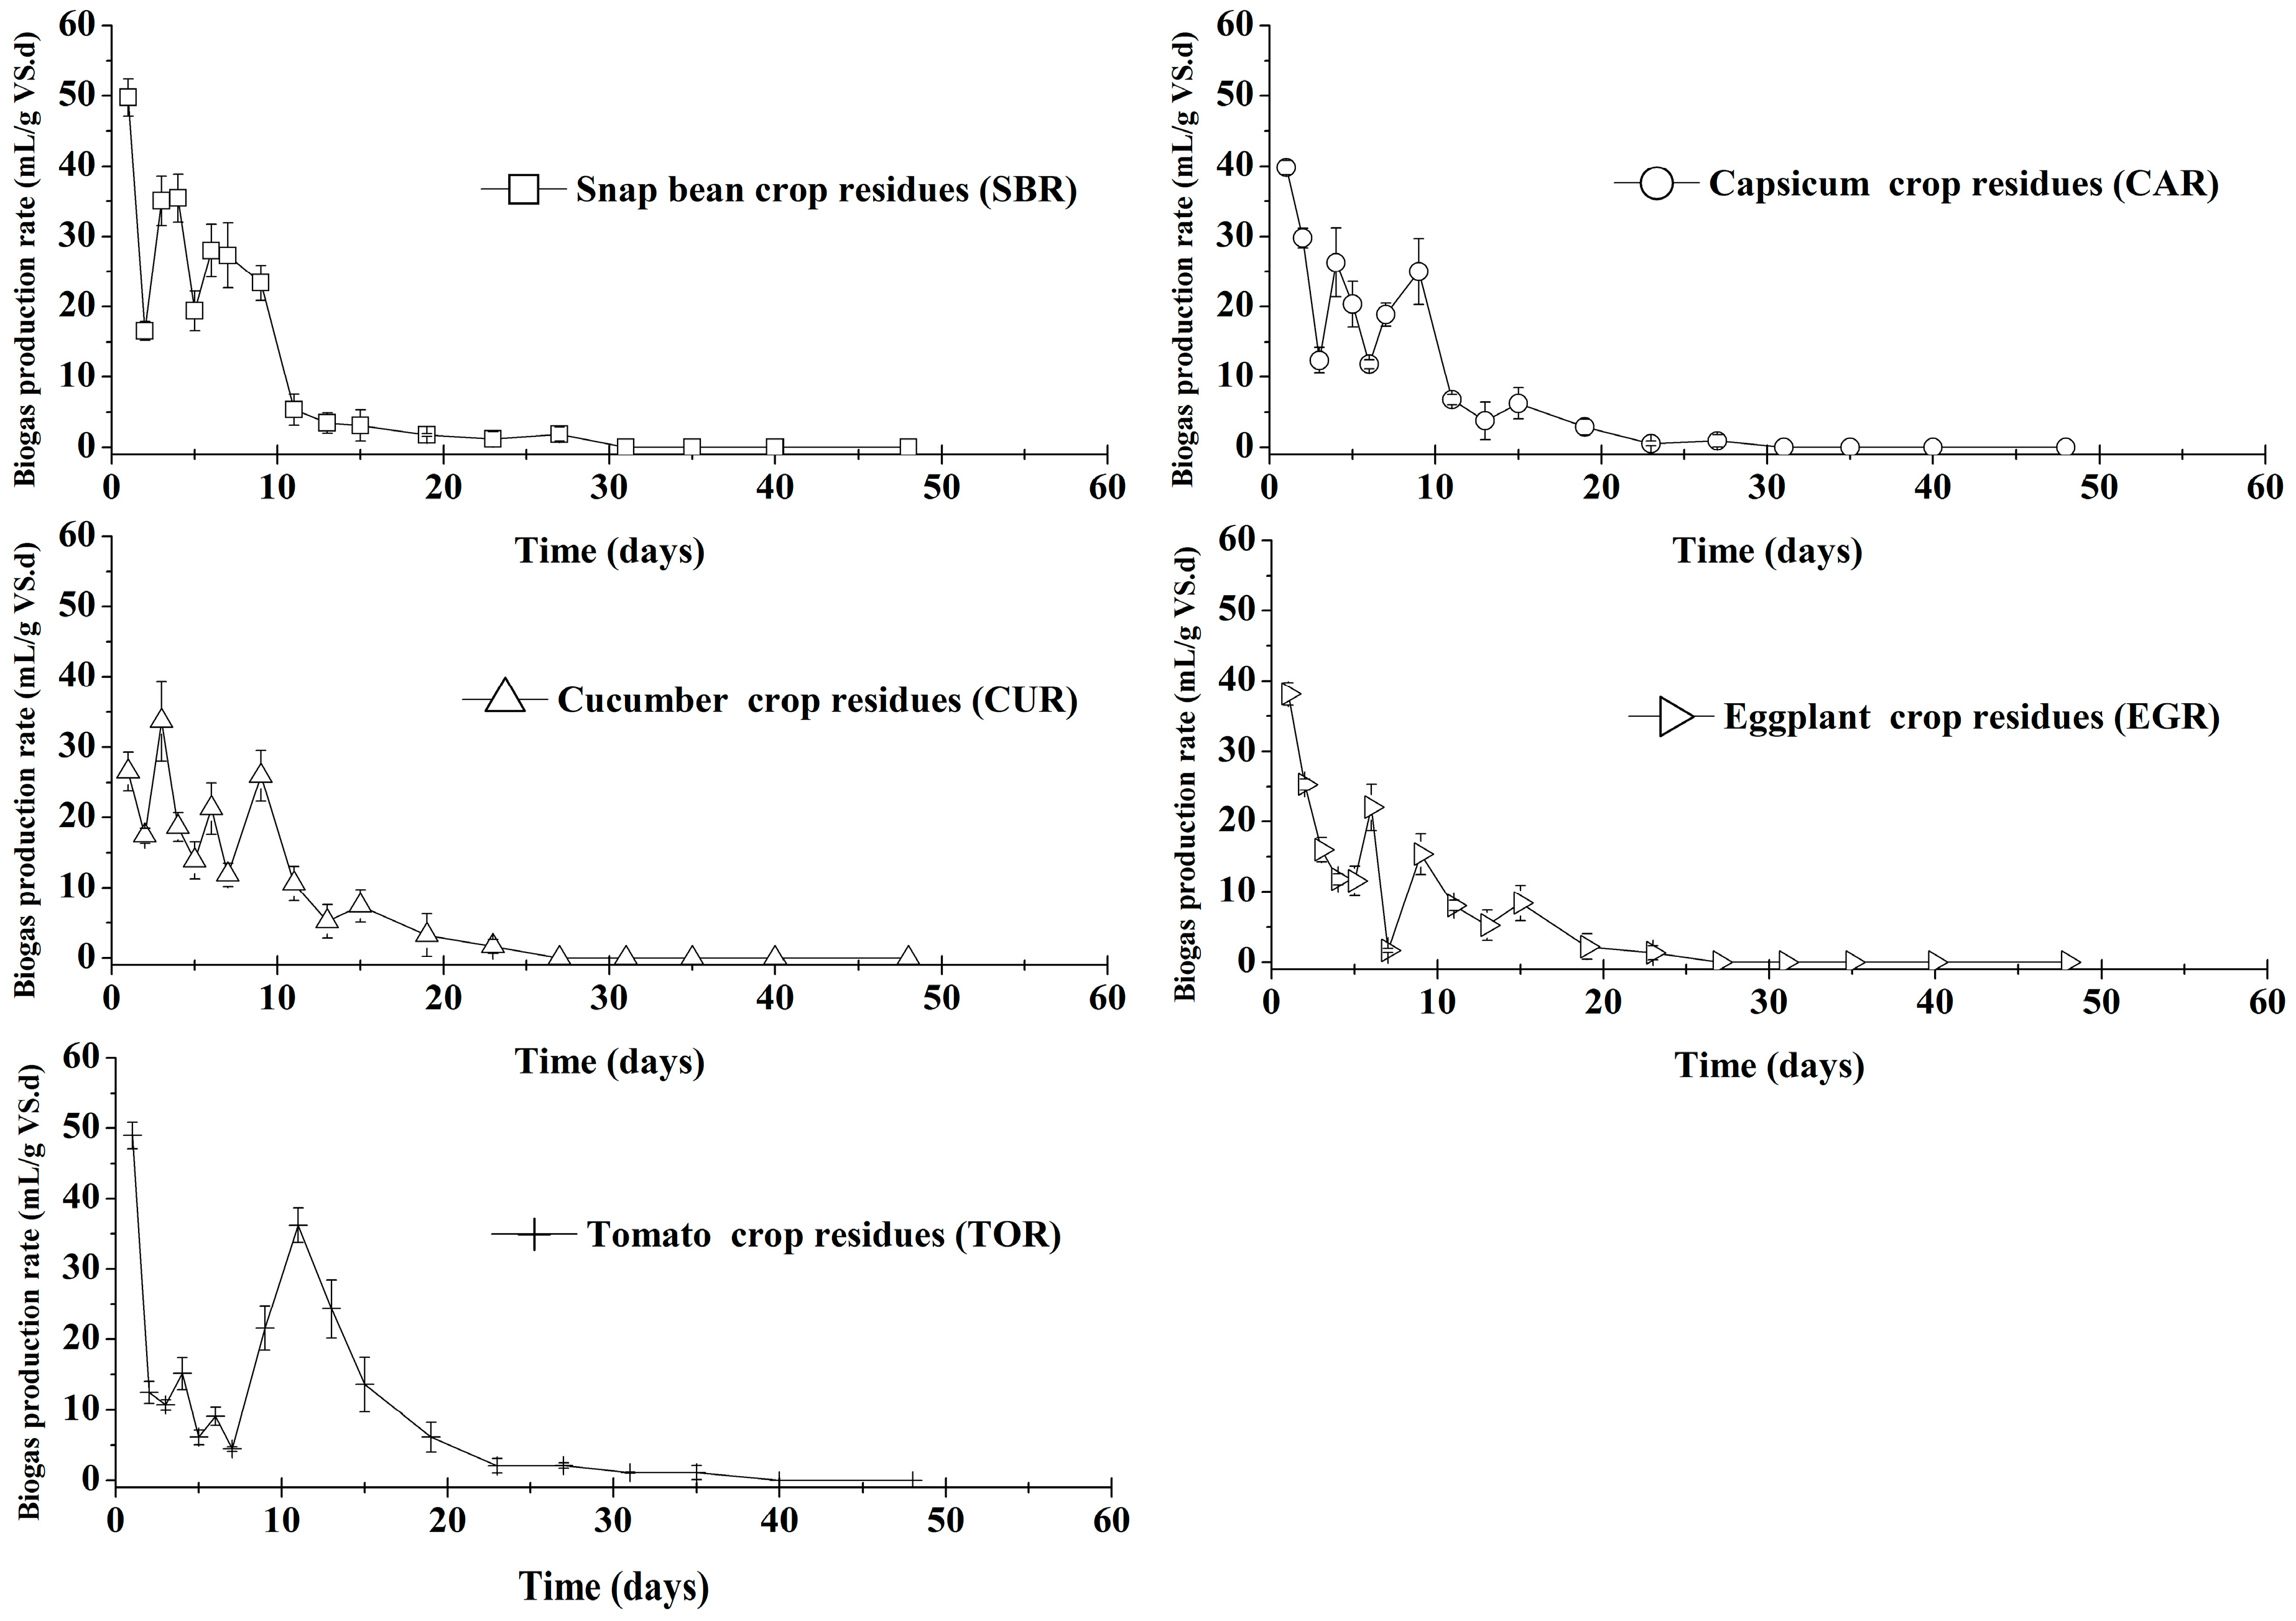
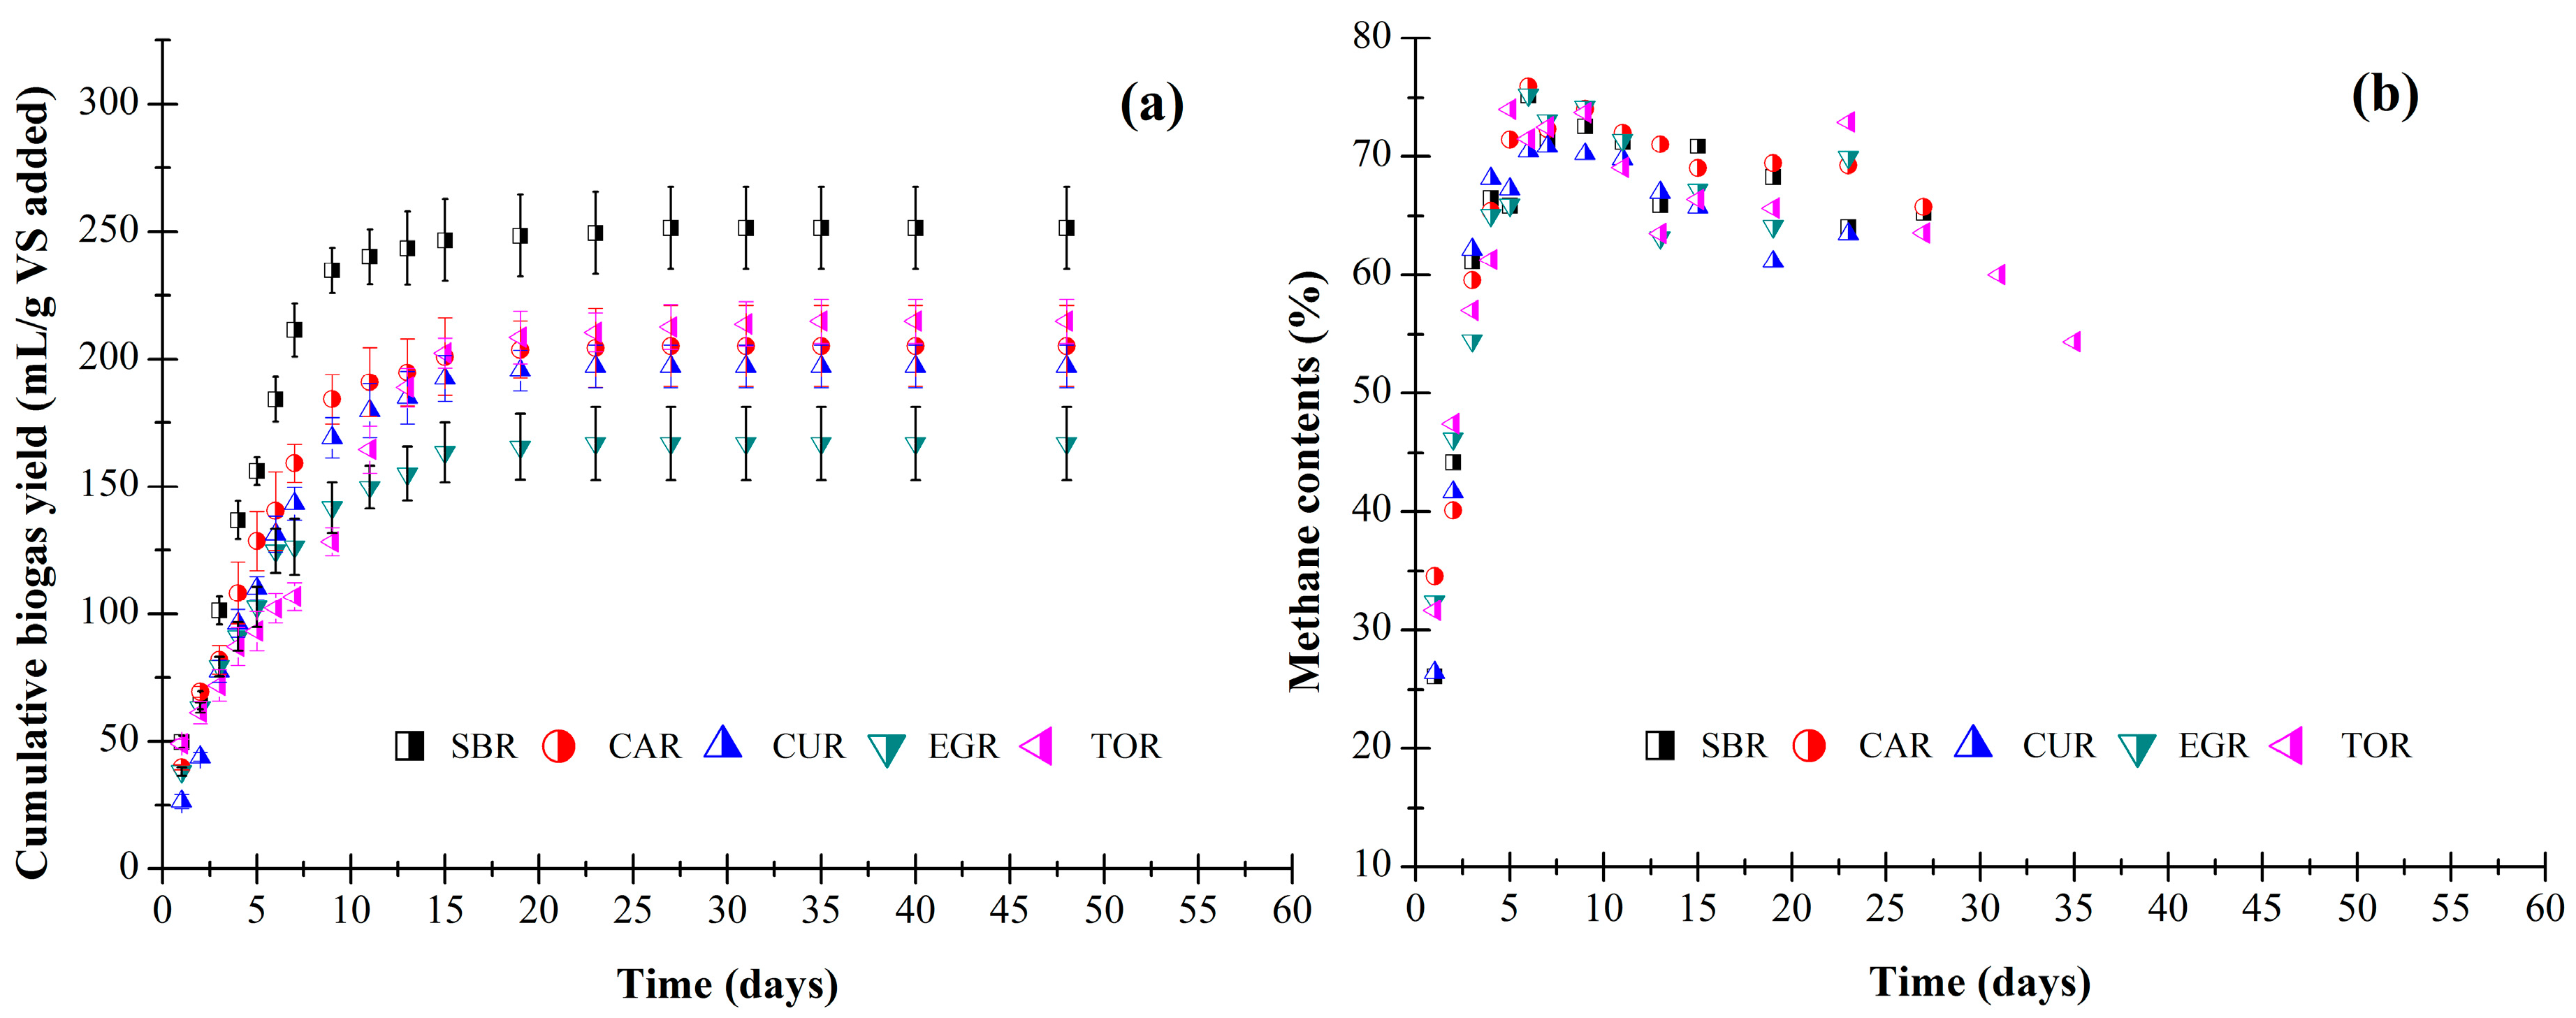
3.2. Batch Anaerobic Digestion Test Results

Figure 1 shows the biogas production rates for five different VCRs. The five curves in the figure had similar trends: (1) in all 15 reactors, anaerobic fermentation started immediately on the first day; (2) the highest peak appeared before the 5th day; (3) maintained high reaction efficiency before the 15th day; and (4) biogas production rate dropped significantly after the 20th day. The peak values of daily biogas production rates were calculated to be 49.7, 39.8, 33.7, 38.1, and 49.0 mL g−1 VS days after 1, 1, 3, 1, and 1 days of digestion from SBR, CAR, CUR, EGR, and TOR, respectively. Fast start-up and rapid production rate are associated with higher total sugar (TSug) content in VCR [31].
The cumulative biogas yields (mL g−1 VS) and methane contents in the period of biogas produced from different VCRs are presented in Figure 2. At the end of batch AD, the average biogas yields from the reactors were calculated to be 251.3, 205.2, 197.2, 166.9, and 214.8 mL g−1 VS for SBR, CAR, CUR, EGR, and TOR, respectively (as shown in Figure 2a). The time period for 80–90% of the ultimate biogas production from substrate, known as the technical digestion time (T80–90), is usually recommended as a suitable HRT for continuous fermentation of identical substrate [18]. The T80–90 was calculated to be in the range of 7–9, 7–11, 9–11, 9–13, and 11–15 days for SBR, CAR, CUR, EGR, and TOR (Table 2), respectively. Mathematically, no significant difference was found between the biogas production rates of CAR and CUR, but those from all the other VCRs were significantly different from each other (p < 0.05).
The methane content (%) rose rapidly during the first eight days of AD and thereafter, it decreased slightly and stabilized to almost constant (as illustrated in Figure 2b). The weighted average methane contents of the biogas production were 58.4%, 58.8%, 59.6%, 56.4%, and 57.9% from the SBR, CAR, CUR, EGR, and TOR, respectively. As a matter of course, the average methane yield from SBR, CAR, CUR, EGR, and TOR respectively were 146.8, 120.6, 117.5, 94.2, and 124.4 mL g−1 VS, which were calculated based on methane contents and biogas yield. Such results are in agreement with literature data as Bi et al. found methane potential of 104.2 mL g−1 VS for chili stalks [14]. According to Mussatto et al., the cellulose was encapsulated by lignin and hemicellulose that made it difficult to be hydrolyzed by extracellular enzymes, thereby reducing the methane yield of lignocellulosic materials [33]. Similarly, Triolo et al. found that the lignin content in energy crops and livestock manure was significantly negatively correlated with its methane yield [17]. Thus higher lignin contents in CUR and EGR may be the reason for lower methane yield compared with other VCRs. In addition, Li et al. found that total sugar (TSug) content in spent edible mushroom substrates had an enhanced effect on methane yields, which may partly account for the highest methane yield from SBR in this experiment [21].
The TS, VS, and acid detergent fiber (ADF) degradation degree at the end of the AD period are shown in Table 2. The VS degradation degree shows good correlation with methane potential (as illustrated in Equation (7)). Similar to our study results, Kafle et al. found a good correlation (R2 > 0.800) between VS removal and G0 [18]. The ADF degradation degrees were calculated to be 42.8%, 43.4%, 31.2%, 27.1%, and 25.9% for the SBR, CAR, CUR, EGR, and TOR, respectively. A weak negative correlation existed between ADF degradation degree and lignin content (R2 = 0.305), which indicates that in addition to the crystallization of cellulose, the shielding effect of lignin composition reduced the degradation degree of ADF to some extent synchronously [16]. The pH of effluence from different reactors were in the range of 7.48–7.68, indicating that the AD of VCR was stable running under the selected inoculation ratio (2:1 based on TS) conditions.
VS degradation degree (%) = 24.831 + 0.178G0
(R2 = 0.898, Adj. R2 = 0.864, p = 0.014)

3.3. Results of Linear Regression Analysis

The simple and multiple linear regression models based on chemical composition (TP, TF, TSug, Hem, Cel, and Lig) of VCR were developed to predict methane potential. As illustrated in Table 3, poor regression (R2 < 0.369) and lower significance levels (p > 0.277) were found in all single-factor linear regression models except for the model with lignin as a single independent variable (R2 = 0.704, p = 0.076). Triolo et al. obtained an almost identical R2 value (0.763) between lignin and the G0 of energy crops (grass, maize, etc.) [17]. Such results also confirm that lignin controls VS destruction most significantly compared to other variables, and thus has a fine correlation with G0. In our experiment, G0 is negatively correlated with lignin and the correlation coefficient (slope) is −6.416. The slope of G0 to lignin, also known as lignin dependency, is generally used to characterize the extent to which methane yield of special substrate is affected by lignin composition. Triolo et al. reported a lower slope of −2.58 for energy crops, which suggested that lignin affects G0 more significantly in VCR than in energy crops [17]. In contrast to our experimental results, a substantially lower R2 value (0.265) between lignin and ultimate methane yield (G0) from Jatropha curcus and Morus indica was reported by Gunaseelan V.N. [34].
The R2 values of the models are significantly improved when two or three variables are used in combination for regression analysis and the standard error between the predicted and measured value decreases simultaneously compared to the single regression models. This result indicates that AD was carried out under the synergistic action of microorganisms and various organic ingredients in the substrates, namely, the BMP results are simultaneously affected to varying degrees by all organic constituents of the substrate rather than being affected by only one component. Considering the R2 and p values, the model with the combination of two explanatory variables of CP and Lig showed the best performance (R2 = 0.976 and p = 0.048) among the two-variable models, namely, CP and Lig explained 97.6% of variation in G0. Similarly, in all the three-variable regression models, the highest R2 value (0.999) was obtained when TF, Hem, and Lig were used in combination. Moreover, the model with the combination of CP, TF, Hem, and TSug showed the maximum performance with R2 infinitely close to 1.000 and p value less than 0.001.
In these three preferred multivariate regression models, G0 was inversely proportional to CP, TF, and Hem, which differed from previous theories [18]. It is probably due to the varied distribution of organic components in VCRs used in this assay. For example, the total sugar content ranging from 19.33% to 26.88% occupied a large proportion, while the total fat content was only 1.67–3.54% with a slight proportion. As a result, the change of total sugar showed a larger influence on the VCR methane yield than that of total fat when the regression analysis was conducted. Moreover, the content rangeability of one organic component had a larger difference in VCR compared to other organic components. In theory, the greater change of one component contained in different substrates will also cause a greater effect on the response value (G0) [21]. Therefore, if one component has a lower content or a smaller variation degree between the specific samples, it will probably show a slight effect on the response value (G0). It is also worth mentioning that the prediction models reported by previous literatures have widely extensive variability as the used test materials changed [18,20]. Likewise, the prediction model developed in this study has a lack of universal applicability and is only suitable for BMP determination of VCR. In summary, in the case of the pursuit of convenience when the accuracy requirements are not very strict, the simple linear regression model with lignin as a variable can be used to predict the BMP of VCR, while the multiple linear regression models should be considered when the accuracy of BMP prediction is highly valued.

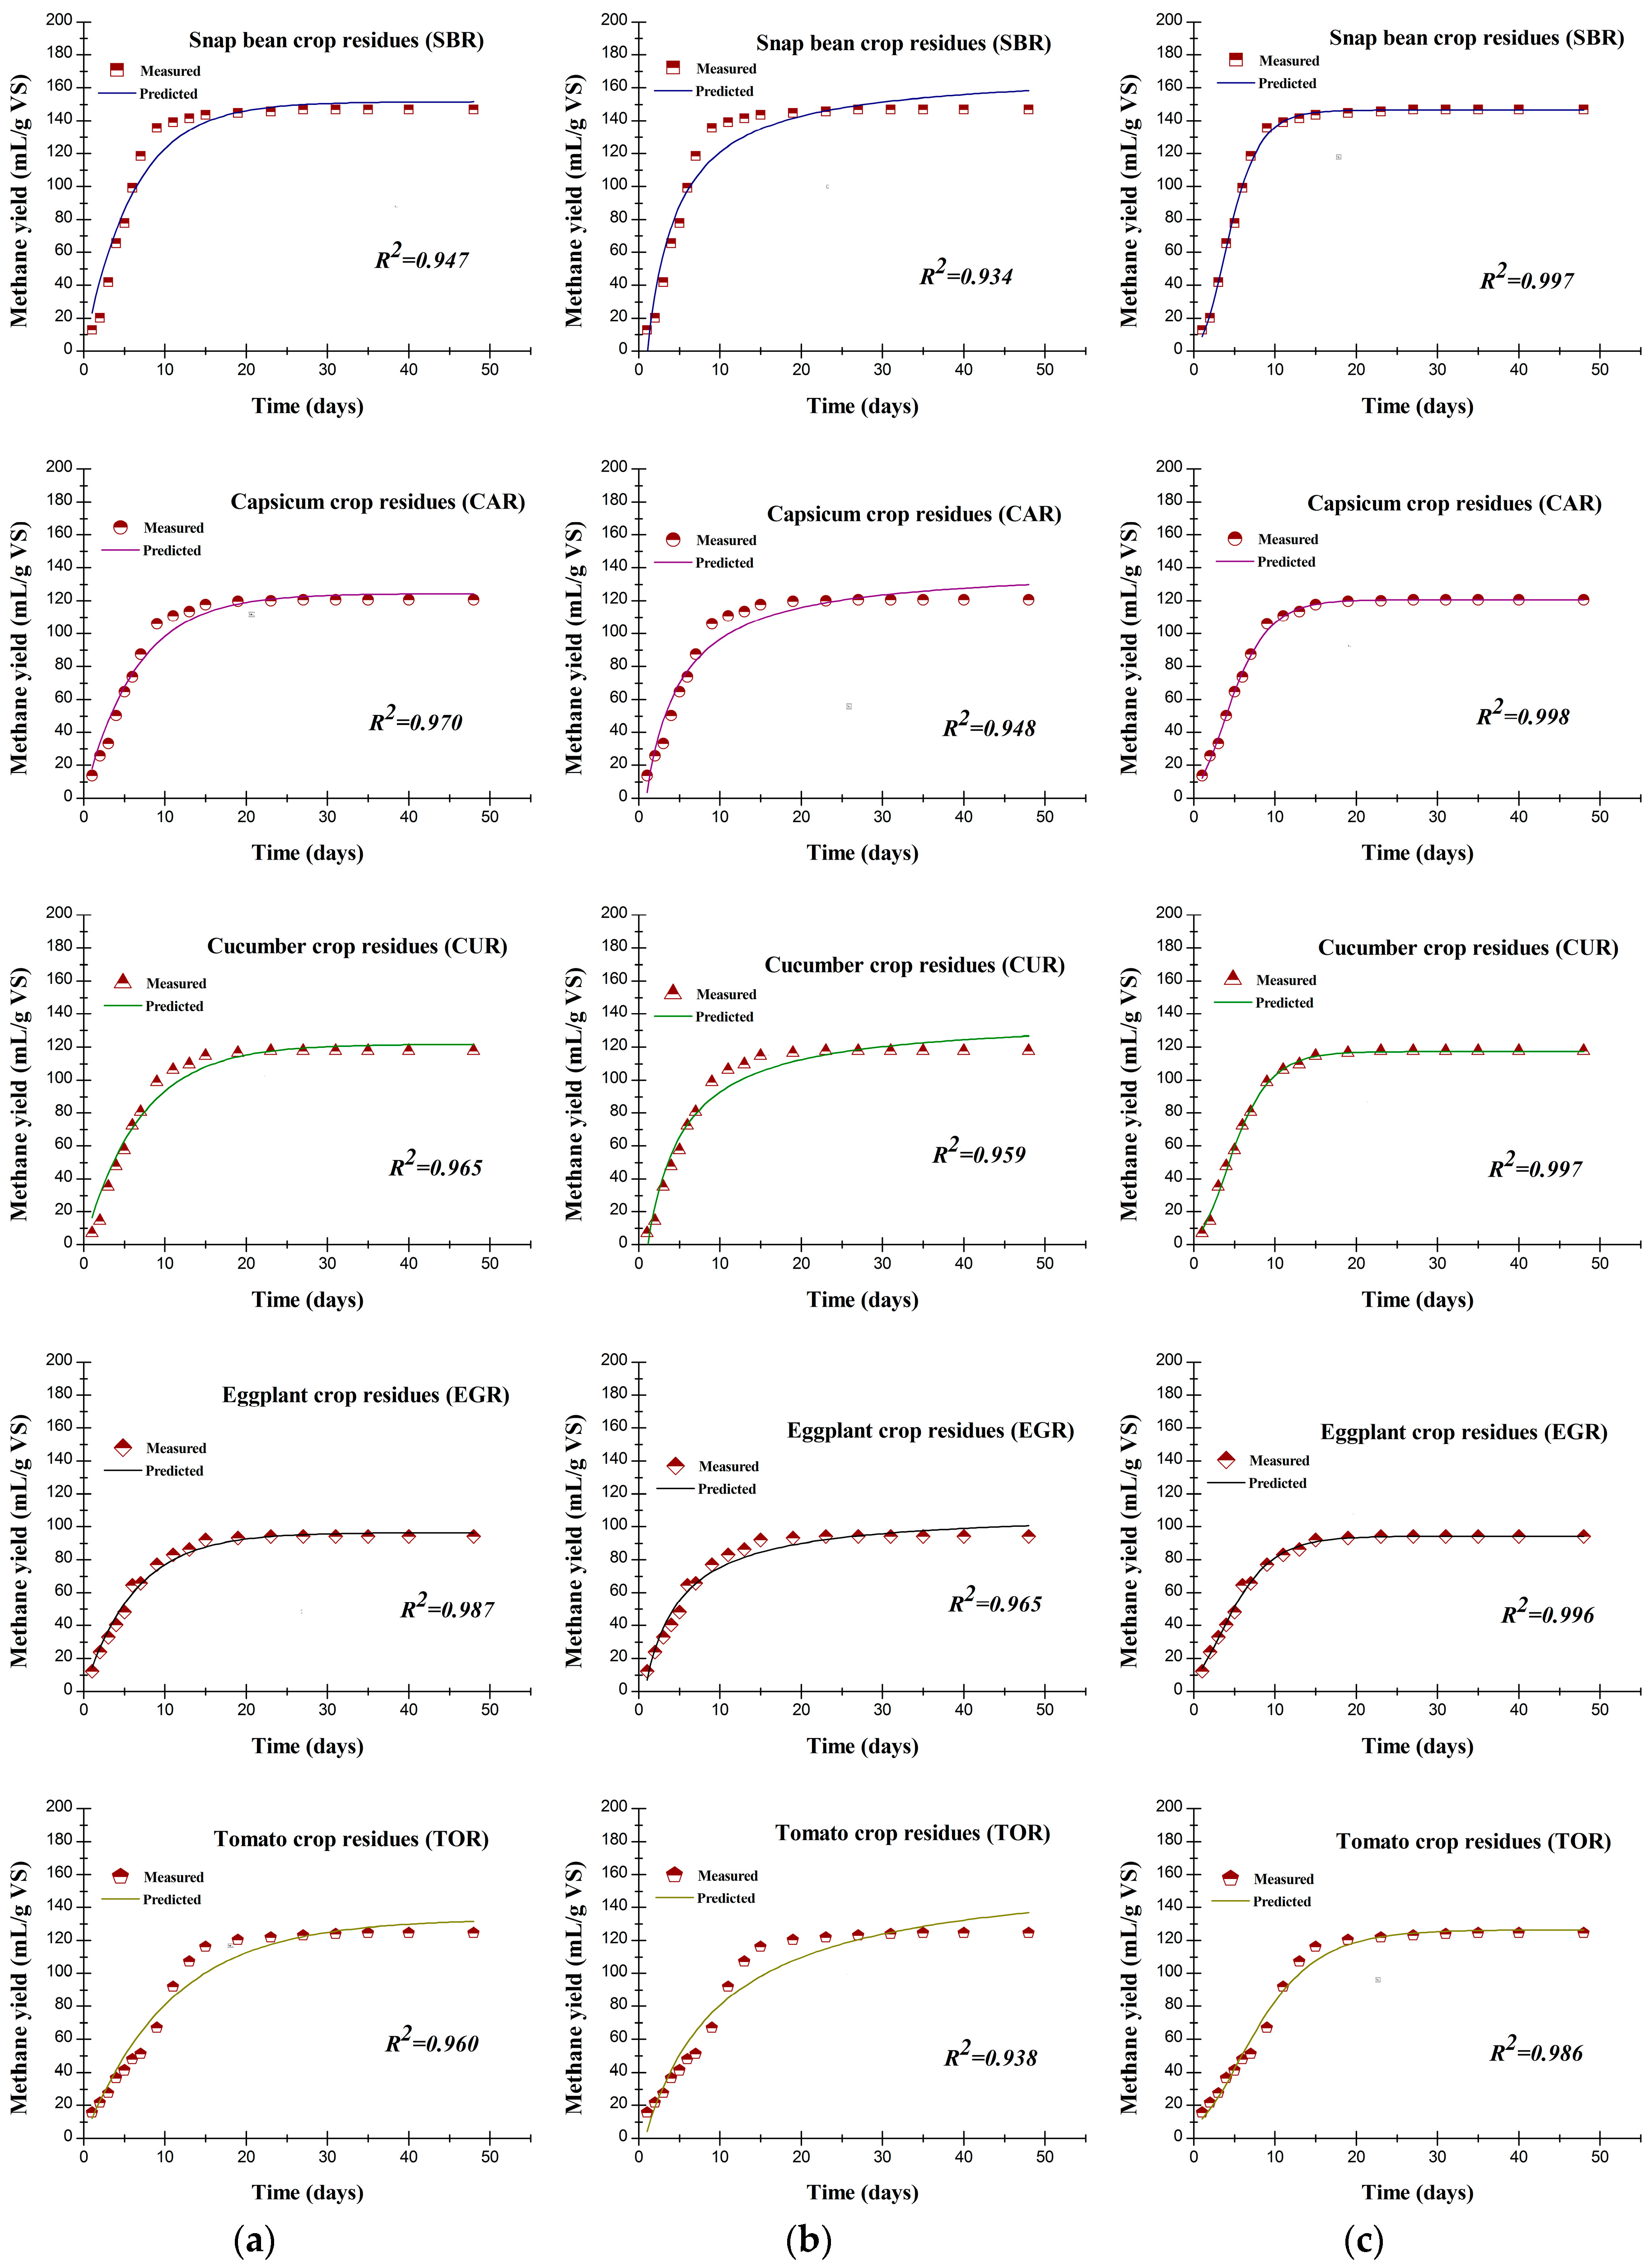
3.4. Results of Kinetic Analysis

Table 4 summarizes the fitting results of the dynamic models parameters. Among the three kinetic models used in this experiment, the modified Gompertz model presents the lowest difference (0.0–0.3%) between the predicted and measured methane yield (G0) followed by the first-order kinetic model (2.3–5.1%), while the highest difference (12.1–17.8%) between the predicted and measured methane yield is obtained in the Chen and Hashimoto model. Obviously, the modified Gompertz model matches the AD experimental results of VCR more closely than the other two models. The lag phase (λ) of five VCRs was within the range of 0–1.109 days. Yang et al. reported a longer lag phase (0.7–35.7 days) for codigestion of corn stalk and straw depolymerization wastewater [35]. Theoretically, the inoculum activity, the amount of readily degradable components in the substrate, and the initial pH of the inffluent have a marked impact on the AD start-up time [18]. Thus higher total sugar (TSug) content in VCR can be the reason for a shorter lag phase in our tests. The HRTcritical of VCR ranged from 0.721 to 1.108 days, which suggested that the HRT should be greater than 1.108 days to prevent the biomass washout when running continuous digesters using such VCRs under mesophilic conditions [22]. Similarly, Tosun et al. reported shorter critical HRT (0.507–0.958 days) for batch digestion of rose residues and almost the same critical HRT (0.86 days) for wastewater treatment plant was proposed by Zhao et al. [24,36]. The K, KCH, μm, and Rmax parameters of different models varied within the range of 0.094–0.167 day−1, 3.5–12.8, 0.902–1.329 day−1, and 9.0–21.9 mL CH4 g−1 VS day, respectively. The highest Rmax value was estimated for the SBR followed by the CAR, and the lowest was for the TOR.
Figure 3 depicts the results of nonlinear fitting of measured methane yield for five different VCRs using (a) first-order kinetic model, (b) Chen and Hashimoto model, and (c) modified Gompertz model. The determination coefficients (R2) are also shown in the respective figures. The highest R2 values (0.986–0.998) were calculated for the modified Gompertz model, followed by the first-order kinetic model (R2 = 0.947–0.987), and the lowest R2 values (0.934–0.965) were obtained in the Chen and Hashimoto model. Such good performance (R2 > = 0.934) demonstrates that all three proposed equations can accurately describe the variation of VCR methane yield curves. Furthermore, based on kinetic analysis results (difference between the predicted and the measured methane yield value, correlation coefficient of nonlinear fitting), the modified Gompertz model is recommended as the most suitable model for fitting VCR methane yield in our tests. The curves obtained by the modified Gompertz model are typically S-shaped, namely, there is a relatively slow upward trend (lag phase) presenting at the beginning of the curve. Therefore, the existence of lag phase time for all the VCRs may be one of the main reasons why the modified Gompertz model is better in estimated performance than the other two models. As proof, the first-order kinetic model is more suitable for the fitting of BMP than the modified Gompertz model under the condition that the AD lag phase time of livestock manure is zero [18].

4. Conclusions

As a common feature, the lignocellulose content of different VCRs approximately were 50% of TS and the total sugar (TSug) content detected varied in the range of 19.33–26.88% (based on TS). Batch anaerobic digestion of VCRs was able to be conducted stably under the condition of inoculation ratio of 2:1, and their specific methane yields ranged from 94.2 to 146.8 mL CH4 g−1 VS. The highest and lowest BMPs were measured for the SBR and the EGR, respectively. The VS and ADF degradation degrees for five different VCRs were measured in the ranges of 40.4–49.9% and 25.90–43.4%, respectively. The HRTs for continuous fermentation of VCR substrate under mesophilic temperatures were suggested in the ranges 7–9, 7–11, 9–11, 9–13, and 11–15 days for SBR, CAR, CUR, EGR, and TOR, respectively. In regard to the regression prediction models of VCR, the Lig-based model showed the best efficiency among the single-variable models for predicting BMP; the model with CP and Lig as variables was the best two- factor model, and the TF, Hem, and Lig-based model was the best three-factor model in terms of BMP prediction; when CP, TF, TSug, and Hem were used in combination for regression analysis, the model achieved the highest performance. The modified Gompertz model better fitted the experimental results than the first-order kinetic model and the Chen and Hashimoto model, with the highest R2 (0.986–0.998) and the lowest difference (<0.3%) between the predicted and measured BMP of VCR.

Author Contributions

P.L. and W.L. conceived and designed the experiments; P.L., M.S., X.X., and B.Z. performed the experiments; Y.S. contributed reagents/materials/analysis tools; P.L. analyzed the data and wrote the paper.

Funding

This research was funded by the Harbin special fund for scientific and technological innovation talents research project (2016RAXXJ009), and the Youth Science Foundation of Heilongjiang Province (QC2016033).

Conflicts of Interest

The authors declare no conflict of interest.

References

  1. Lin, J.; Zuo, J.; Gan, L.; Li, P.; Liu, F.; Wang, K.; Chen, L.; Gan, H. Effects of mixture ratio on anaerobic co-digestion with fruit and vegetable waste and food waste of China. J. Environ. Sci. (China) 2011, 23, 1403–1408. [Google Scholar] [CrossRef]
  2. Majhi, B.K.; Jash, T. Two-phase anaerobic digestion of vegetable market waste fraction of municipal solid waste and development of improved technology for phase separation in two-phase reactor. Waste Manag. 2016, 58, 152–159. [Google Scholar] [CrossRef] [PubMed]
  3. Gunaseelan, V.N. Biochemical methane potential of fruits and vegetable solid waste feedstocks. Biomass Bioenergy 2004, 26, 389–399. [Google Scholar] [CrossRef]
  4. FAO. Agricultural and Food Organization of the United Nations. Available online: http://www.fao.org/faostat/en/#data/QC (accessed on 27 November 2018).
  5. Biswas, J.; Chowdhury, R.; Bhattacharya, P. Mathematical modeling for the prediction of biogas generation characteristics of an anaerobic digester based on food/vegetable residues. Biomass Bioenergy 2007, 31, 80–86. [Google Scholar] [CrossRef]
  6. Xue, H.; Chang, R.; Du, P.; Ji, L.; Li, Y. Straw Coefficient and Properties of Different Vegetable Wastes. J. Agric. Resour. Environ. 2015, 32, 377–382. [Google Scholar]
  7. Luo, J.; Tian, Y.; Chen, L.; Song, C.; Qi, Y.; Li, X.; Zhao, L. Biogas-producing characteristics of anaerobic digestion of protected horticulture residues. Trans. Chin. Soc. Agric. Eng. 2014, 30, 256–263. [Google Scholar]
  8. Sitorus, B.; Sukandar; Panjaitan, S.D. Biogas recovery from anaerobic digestion process of mixed fruit-vegetable wastes. Energy Procedia 2013, 32, 176–182. [Google Scholar] [CrossRef]
  9. Jiang, Y.; Heaven, S.; Banks, C.J. Strategies for stable anaerobic digestion of vegetable waste. Renew. Energy 2012, 44, 206–214. [Google Scholar] [CrossRef] [Green Version]
  10. Wei, L.; Wang, S.; Jin, Z.; Tong, X. Biochar influences the microbial community structure during tomato stalk composting with chicken manure. Bioresour. Technol. 2014, 154, 148–154. [Google Scholar] [CrossRef]
  11. Nabin, A.; Torben, K.; Fariza, A.; Pant, D.; Ottosen, L.D. An overview of microbial biogas enrichment. Bioresour. Technol. 2018, 264, 359–369. [Google Scholar]
  12. Milledge, J.; Nielsen, B.; Sadek, M.; Harvey, P. Effect of freshwater washing pretreatment on Sargassum muticum as a feedstock for biogas production. Energies 2018, 11, 1771. [Google Scholar] [CrossRef]
  13. Wang, Y.; Li, G.; Chi, M.; Sun, Y.; Zhang, J.; Jiang, S.; Cui, Z. Effects of co-digestion of cucumber residues to corn stover and pig manure ratio on methane production in solid state anaerobic digestion. Bioresour. Technol. 2018, 250, 328–336. [Google Scholar] [CrossRef] [PubMed]
  14. Bi, J.H.; Cheng, G.Y.; Chen, L.; Li, Y.; Hei, K.; Zhang, Y.; Huo, L.; Chang, Z. Chemical composition of different parts of chili stalks and their biogas production potentials during anaerobic fermentation. China Environ. Sci. 2016, 36, 2073–2078. [Google Scholar]
  15. Rincón, B.; Banks, C.J.; Heaven, S. Biochemical methane potential of winter wheat (Triticum aestivum L.): Influence of growth stage and storage practice. Bioresour. Technol. 2010, 101, 8179–8184. [Google Scholar] [CrossRef] [PubMed]
  16. Monlau, F.; Sambusiti, C.; Barakat, A.; Guo, X.M.; Latrille, E.; Trably, E.; Steyer, J.-P.; Carrere, H. Predictive models of biohydrogen and biomethane production based on the compositional and structural features of lignocellulosic materials. Environ. Sci. Technol. 2012, 46, 12217–12225. [Google Scholar] [CrossRef]
  17. Triolo, J.M.; Sommer, S.G.; Møller, H.B.; Weisbjerg, M.R.; Jiang, X.Y. A new algorithm to characterize biodegradability of biomass during anaerobic digestion: Influence of lignin concentration on methane production potential. Bioresour. Technol. 2011, 102, 9395–9402. [Google Scholar] [CrossRef] [PubMed]
  18. Kafle, G.K.; Chen, L. Comparison on batch anaerobic digestion of five different livestock manures and prediction of biochemical methane potential (bmp) using different statistical models. Waste Manag. 2016, 48, 492–502. [Google Scholar] [CrossRef]
  19. Gunaseelan, V.N. Regression models of ultimate methane yields of fruits and vegetable solid wastes, sorghum and napiergrass on chemical composition. Bioresour. Technol. 2007, 98, 1270–1277. [Google Scholar] [CrossRef]
  20. Wang, M.; Li, W.; Liu, S.; Liu, D.; Yin, L.; Yuan, H. Biogas production from chinese herb-extraction residues: Influence of biomass composition on methane yield. BioResources 2013, 8, 3732–3740. [Google Scholar] [CrossRef]
  21. Li, P.; Li, W.; Yang, F.; Yin, L. Predictive Model of Methane Production Based on the Compositional Features of Spent Edible Mushroom Substrate. J. Biobased Mater. Bioenergy 2017, 11, 291–297. [Google Scholar] [CrossRef]
  22. Kafle, G.K.; Kim, S.-H. Kinetic study of the anaerobic digestion of swine manure at mesophilic temperature: A lab scale batch operation. J. Biosyst. Eng. 2012, 37, 233–244. [Google Scholar] [CrossRef]
  23. Gioannis, G.D.; Muntoni, A.; Cappai, G.; Milia, S. Landfill gas generation after mechanical biological treatment of municipal solid waste. Estimation of gas generation rate constants. Waste Manag. 2009, 29, 1026–1034. [Google Scholar] [CrossRef] [PubMed]
  24. Zhao, H.W.; Viraraghavan, T. Analysis of the performance of an anaerobic digestion system at the Regina wastewater treatment plant. Bioresour. Technol. 2004, 95, 301–307. [Google Scholar] [CrossRef] [PubMed]
  25. Kafle, G.K.; Kim, S.H. Anaerobic treatment of apple waste with swine manure for biogas production: Batch and continuous operation. Appl. Energy 2013, 103, 61–72. [Google Scholar] [CrossRef]
  26. Gilcreas, F.W. Standard methods for the examination of water and waste water. Am. J. Public Health Nat. Health 1966, 56, 387–388. [Google Scholar] [CrossRef]
  27. Lane, J.H.; Eynon, L. Estimation of sugar in urine by means of Fehling’s solution with methylene blue as internal indicator. Analyst 1924, 49, 366–371. [Google Scholar] [CrossRef]
  28. Luque-García, J.L.; Castro, L.D. Ultrasound-assisted Soxhlet extraction: An expeditive approach for solid sample treatment. Application to the extraction of total fat from oleaginous seeds. J. Chromatogr. 2004, 1034, 237–242. [Google Scholar] [CrossRef]
  29. Van Soest, P.J.; Robertson, J.B.; Lewis, B.A. Methods for dietary fiber, neutral detergent fiber, and nonstarch polysaccharides in relation to animal nutrition. J. Dairy Sci. 1991, 74, 3583–3597. [Google Scholar] [CrossRef]
  30. Parameswaran, P.; Rittmann, B.E. Feasibility of anaerobic co-digestion of pig waste and paper sludge. Bioresour. Technol. 2012, 124, 163–168. [Google Scholar] [CrossRef]
  31. Wang, M.; Li, W.; Li, P.; Yan, S.; Zhang, Y. An alternative parameter to characterize biogas materials: Available carbon-nitrogen ratio. Waste Manag. 2017, 62, 76–83. [Google Scholar] [CrossRef]
  32. Romano, R.T.; Zhang, R. Co-digestion of onion juice and wastewater sludge using an anaerobic mixed biofilm reactor. Bioresour. Technol. 2008, 99, 631–637. [Google Scholar] [CrossRef] [PubMed]
  33. Mussatto, S.I.; Fernandes, M.; Milagres, A.M.F. Effect of hemicellulose and lignin on enzymatic hydrolysis of cellulose from brewer’s spent grain. Enzym. Microb. Technol. 2008, 43, 124–129. [Google Scholar] [CrossRef]
  34. Gunaseelan, V.N. Predicting ultimate methane yields of Jatropha curcus and Morus indica from their chemical composition. Bioresour. Technol. 2009, 100, 3426–3429. [Google Scholar] [CrossRef] [PubMed]
  35. Yang, F.; Li, W.; Sun, M.; Li, Q.; Wang, M.; Sun, Y. Improved Buffering Capacity and Methane Production by Anaerobic Co-Digestion of Corn Stalk and Straw Depolymerization Wastewater. Energies 2018, 11, 1751. [Google Scholar] [CrossRef]
  36. İsmailTosun, M.; TalhaGönüllü, A. Anaerobic Digestion and Methane Generation Potential of Rose Residue in Batch Reactors. Environ. Lett. 2004, 39, 915–925. [Google Scholar]
Figure 1. Daily biogas production from different VCRs. The values are means ± standard deviations (vertical bars, n = 3 deviations).
Energies 12 00026 g001
Figure 2. (a) Cumulative biogas yield; (b) methane contents for biogas produced from different VCRs. The values are means ± standard deviations (vertical bars, n = 3 deviations).
Energies 12 00026 g002
Figure 3. VCR methane yield plotted with methane predicted using (a) first-order kinetic model; (b) Chen and Hashimoto model, and (c) modified Gompertz model; R2 represents determination coefficient.
Energies 12 00026 g003
Table 1. Characteristics of five different VCRs and inoculum.
FeedUnitsTypes of VCR
SBRCARCUREGRTORInoculum
Total solids (TS)%21.08(0.08)20.35(<0.01)21.87(0.13)19.40(0.23)17.52(0.11)1.02(0.07)
Volatile soilds (VS)%18.30(0.19)16.41(0.24)16.56(0.57)16.66(0.06)14.53(0.25)0.58(0.04)
pH--5.45(0.01)4.96(0.03)7.91(0.01)6.04(0.02)5.35(0.01)7.61(0.01)
Crude protein (CP)%TS21.24(1.24)15.13(0.88)8.84(0.25)14.93(0.06)18.56(0.61)-
Total fat (TF)%TS3.40(0.13)1.67(0.10)2.02(0.12)3.54(0.24)2.44(0.05)-
Total sugar (TSug)%TS26.88(0.21)24.81(1.22)20.52(2.01)21.14(0.25)19.33(0.96)-
Hemicellulose (Hem)%TS10.27(0.91)18.63(1.22)11.60(0.59)16.25(1.01)16.91(0.15)-
Cellulose (Cel)%TS31.01(1.63)23.39(0.25)31.26(0.48)30.10(1.66)28.41(0.50)-
Lignin (Lig)%TS5.10(0.05)8.31(0.31)11.25(0.15)10.52(0.02)7.58(0.38)-
C/N--11.65(1.01)15.45 (1.46)22.76(0.53)16.10 (1.27)11.99 (0.95)-
Note: values in parenthesis represent standard deviation (n = 3).
Table 2. Measured biogas and methane potential, TS, VS, and ADF degradation degree, effluence pH, and technical digestion time for different VCRs.
ParametersUnitsVCR
SBRCARCUREGRTOR
Biogas potentialmL g−1 VS251.3 (16.1)205.2 (15.8)197.2 (8.5)166.9 (14.3)214.8 (8.7)
Methane potentialmL g−1 VS146.8 (10.1)120.6 (9.7)117.5 (5.1)94.2 (8.7)124.4 (5.6)
Methane content%58.4 (1.1)58.8 (0.8)59.6 (1.2)56.4 (0.4)57.9 (0.9)
TS degradation degree%40.0 (0.7)37.2 (1.2)33.7 (0.6)31.7 (0.3)34.6 (0.4)
VS degradation degree%49.9 (1.1)46.9 (0.8)47.2 (0.7)40.4 (0.5)47.1 (0.3)
ADF degradation degree%42.8 (3.7)43.4 (1.8)31.2 (1.1)27.1 (2.2)25.9 (1.0)
Effluence pH-7.68 (0.02)7.66 (0.01)7.56 (0.01)7.61 (0.00)7.48 (0.01)
T80days7 (1)7 (1)9 (2)9 (1)11 (1)
T90days9 (1)11 (1)11 (2)13 (2)15 (2)
Notes: ADF is acid detergent fiber; T80 is duration for approximately 80% of biogas production; T90 is duration for approximately 90% of biogas production; values in parenthesis represent standard deviation (n = 3).
Table 3. Regression of methane potential (G0) of VCR using explanatory variables.
Explanatory VariablesR2Adj. R2SEp-ValueEquation
Simple Linear Regression
CP0.3190.09317.90.321G0 = 84.92 + 2.275CP
TSug0.3690.15917.20.277G0 = 39.83 + 3.588TSug
Lig0.7040.60611.70.076G0 = 175.57 − 6.416Lig
Multiple Linear Regression
CP, Lig0.9760.9035.80.048G0 = 326.56 − 4.936CP − 14.986Lig
TF, Lig0.7760.55212.60.224G0 = 196.666 − 6.28TF − 6.963Lig
TSug, Lig0.7090.41814.30.291G0 = 159.18 + 0.549TSug−5.946Lig
Hem, Lig0.8320.66410.90.168G0 = 198.886 − 5.874Hem − 1.897Lig
CP, TF, Hem0.9970.9901.90.065G0 = 169.173 + 3.91CP − 18.55TF − 4.18Hem
CP, TF, Lig0.9800.8437.40.251G0 = 343.18 − 5.81CP + 3.05TF − 16.25Lig
CP, TSug, Lig0.9720.8896.20.211G0 = 382.9 − 5.57CP − 1.24TSug − 17.15Lig
CP, Hem, Lig0.9770.9075.70.194G0 = 314.99 − 4.18CP − 0.93Hem − 13.41Lig
CP, Cel, Lig0.9870.9464.30.147G0 = 300.97 − 5.09CP − 15.4Lig + 1.09Cel
TF, Hem, Lig0.9990.9981.70.027G0 = 241.96 − 10.01TF − 2.64Hem − 6.54Lig
TF, Cel, Lig0.9700.8796.50.220G0 = 132.43 − 15.62TF + 3.45Cel − 8.24Lig
Hem, Cel, Lig0.9160.66310.90.364G0 = 315.18 − 4.76Lig − 3.13Cel − 4.31Hem
CP, TF, TSug, Hem0.9990.9990.50.000G0 = 160.15 − 4.05Hem + 0.38TSug − 18.13TF + 3.75CP
Notes: CP: crude protein; TF: total fat; TSug: total sugar; Hem: hemicellulose; Cel: cellulose; Lig: lignin. Part of the lower R2 model’s data is not displayed; most significant regression models for the prediction of methane potential are represented with bold letters.
Table 4. Summary of results of kinetic study using three different models.
Equations and ParametersUnitsVCR
SBRCARCUREGRTOR
First-order kinetic model
KDay−10.1670.1570.1460.1610.094
G0mL CH4 g1 VS151.5124.3121.796.3132.8
Difference *%3.23.03.52.35.1
Chen and Hashimoto model
KCH3.54.73.95.812.8
μmDay−10.9471.1210.9021.3881.329
HRTcriticalday1.0560.8921.1080.7210.752
G0mL CH4 g−1 VS170.6141.4138.4109.5144.5
Difference *%16.217.217.816.412.1
Modified Gompertz model
RmaxmL CH4 g1 VS day21.914.414.39.89.0
λday1.1090.5120.8450.0000.330
G0mL CH4 g1 VS146.5120.7117.294.1126.4
Difference *%0.20.00.30.00.0
Notes: * means the difference between the predicted value and the measured value; the value of HRTcritical is calculated by Equation (5).

