1. Introduction
Awareness regarding the use of renewable energy is increasing nowadays worldwide, including Suriname. This is due to the continuously increasing energy demand, environmental concerns about climate change and a need for less dependency on fossil fuels. A renewable energy technology such as solar photovoltaics (PV) can therefore play an important role in the sustainable energy transition in Suriname. In this scope a country study will be presented which is conducted in Suriname. This is the first paper about the electricity sector of Suriname which will give an overview of this sector and the current status of photovoltaic systems in Suriname. So far there have been only a few international publications regarding electricity generation in Suriname. Before and during this research, it was therefore very difficult to find research publications which could be used as references. To fill this knowledge gap, it was decided to present an overview of the electricity sector of Suriname, before presenting the current status of Photovoltaics (PV) systems in Suriname. The final goal of our study was to investigate which role PV systems can play in this country’s future energy transition. These topics have never been published internationally in manuscripts. This manuscript will, therefore, be beneficial for researchers, decision- and policy makers and for students, by who it can be used as a reference for (further) research works and for decision-making processes. In this paper, the potential of PV energy production has been explored from the context of available irradiance in Suriname and energy targets of Suriname. This paper is, therefore, the first energy scenario study for Suriname on PV power production in the future. For this country study, prior studies conducted for another country, namely Indonesia, by Veldhuis, A. (2015) [
1] and Kunaifi and Reinders, A. (2018) [
2] have been consulted and used as references.
Suriname, a country along the northeast coast of South America, has an area of approximately 163,821 km
2 and an estimated inhabitants of 567,000 [
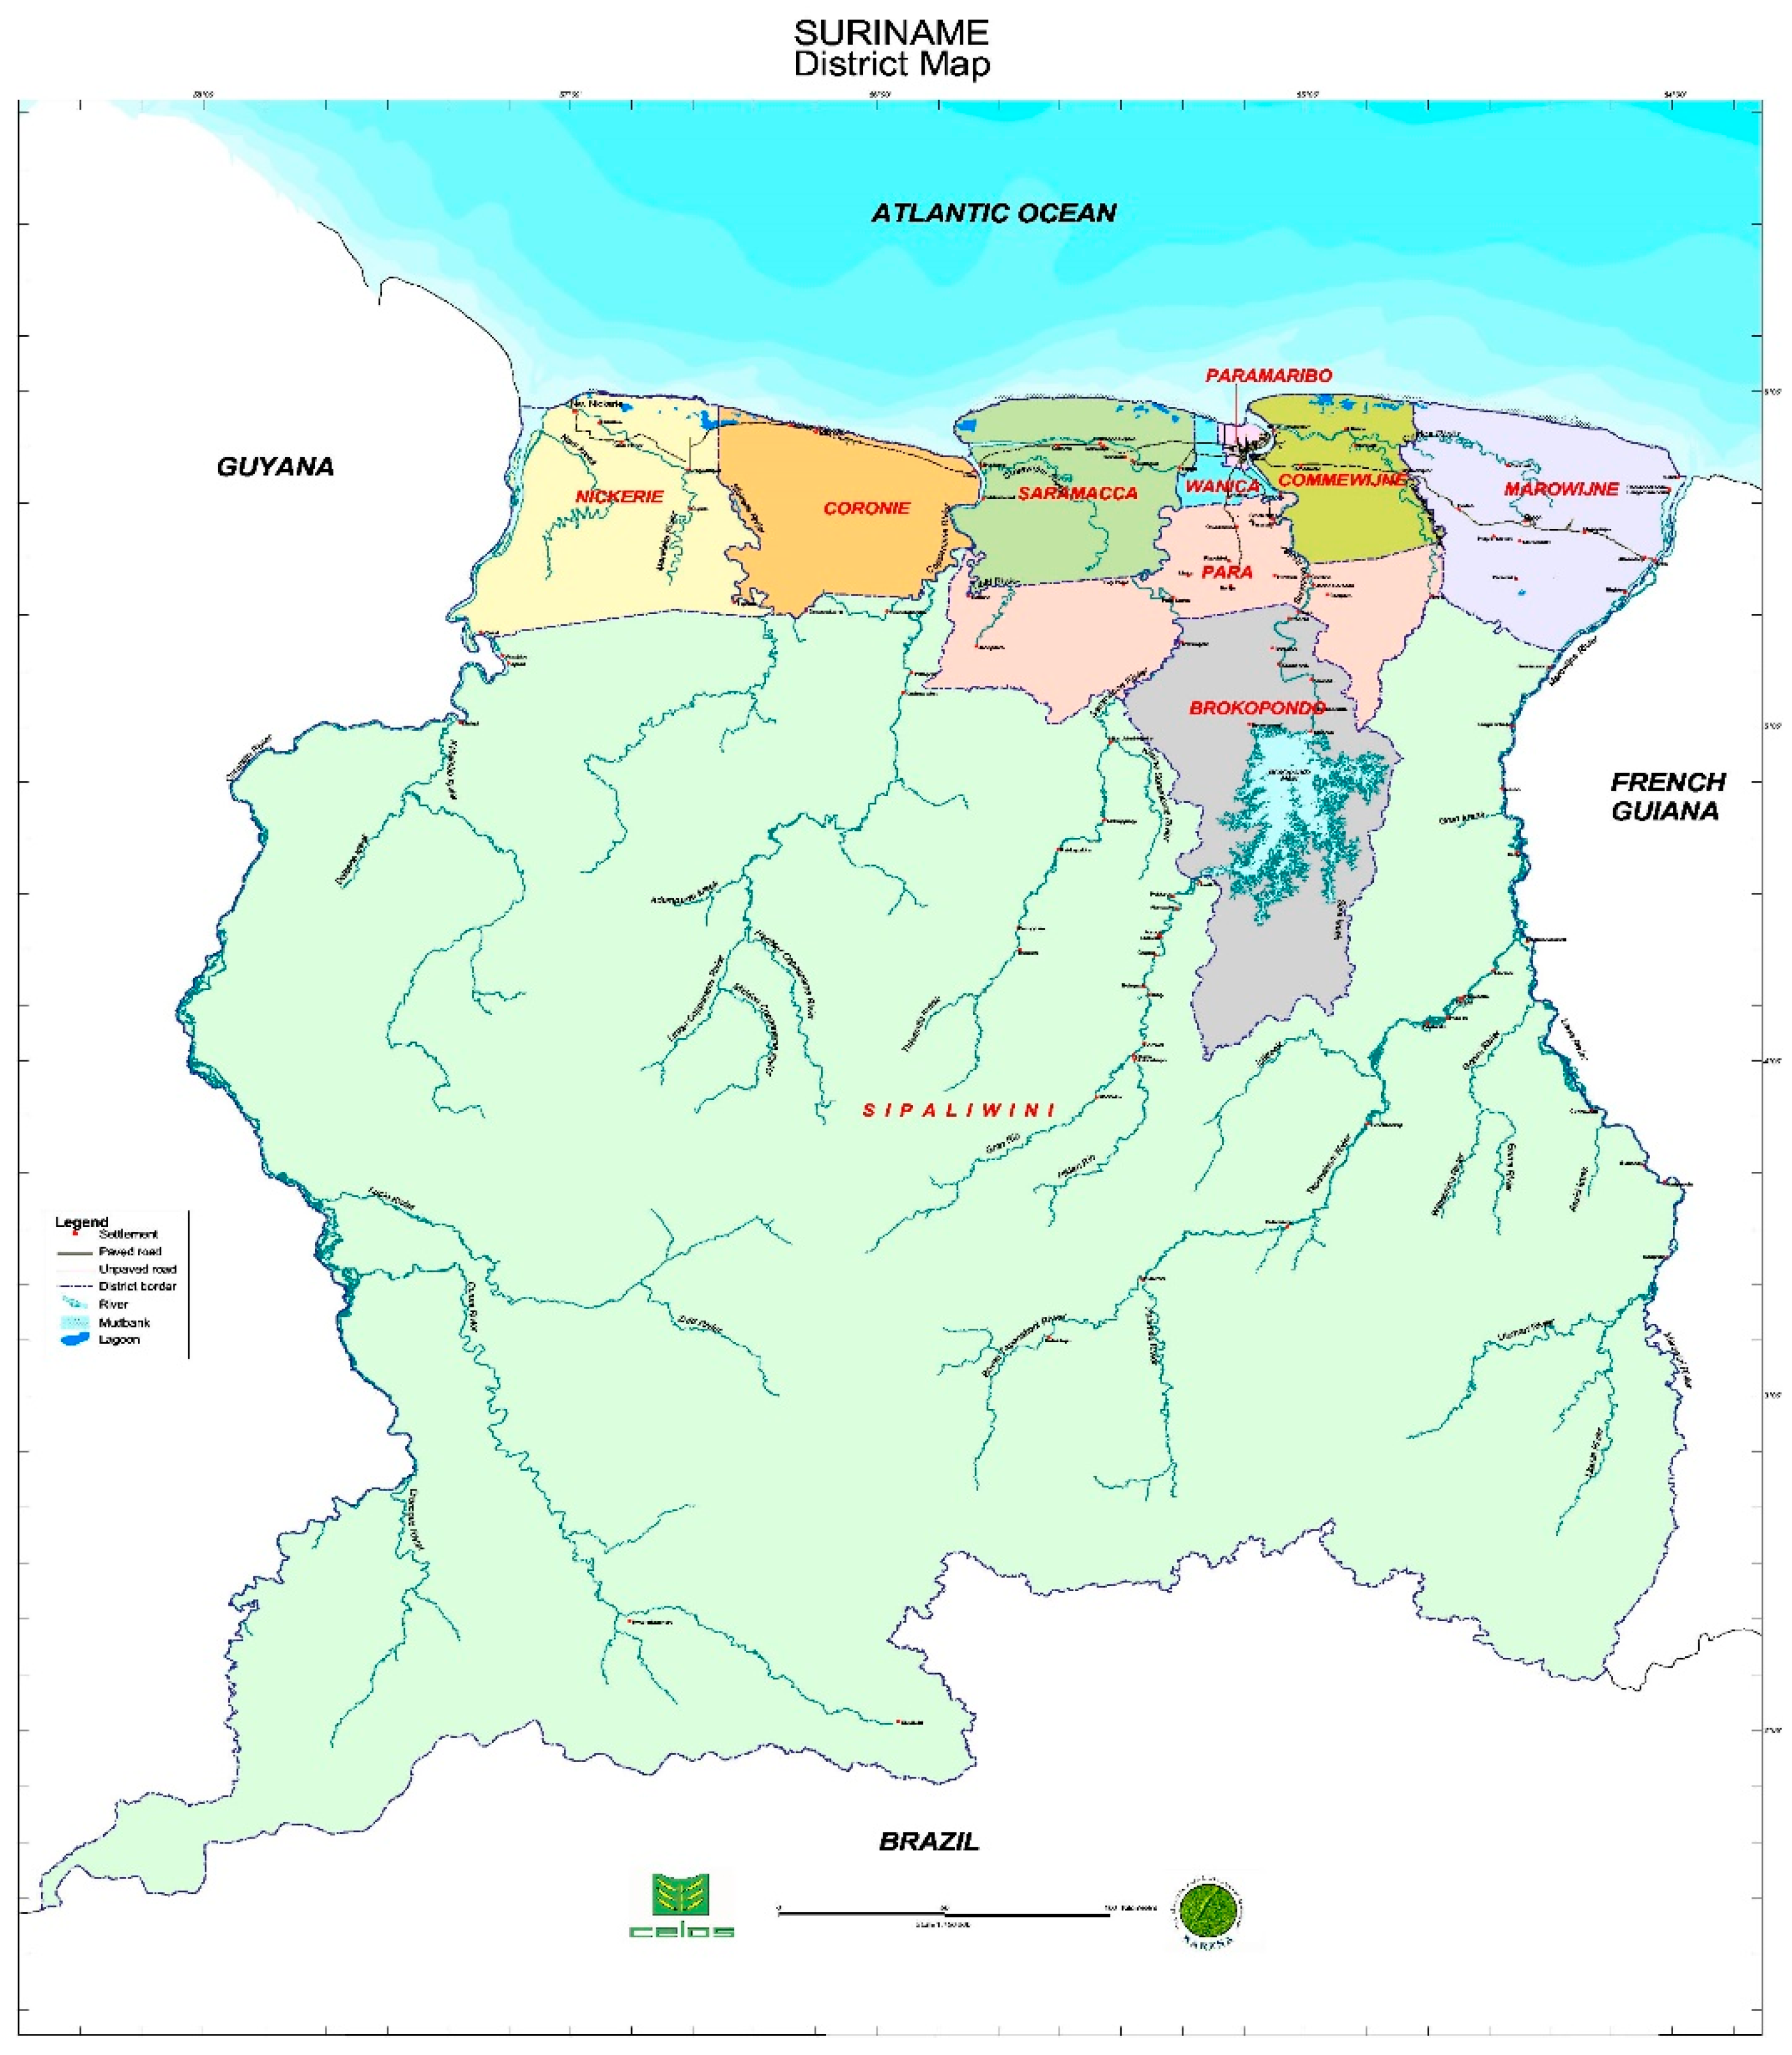
3]. Approximately 90% of the population lives in the coastal region while 10% lives in the interior (the Hinterland). Suriname has 10 districts of which district Sipaliwini in the interior of Suriname (
Figure 1) is sparsely populated. The people in the interior are living in villages and a lot of them can be accessed only by boat or plane.
Suriname has a humid tropical climate with a low variation of the ambient temperature (21 °C–32 °C). In this country, four seasons are experienced namely: the short dry season, long dry season, the short wet season and long wet season.
The gross domestic product (GDP) per capita in Suriname was
$5900 in 2017 [
4] which is low compared to few selected OECD countries like Austria (
$47,290), Belgium (
$43,323), Canada (
$45,032), Chile (
$15,246) and the Netherlands (
$38,148).
The electricity sector in Suriname covers the electrical energy demand of all economic activities for example, mining, agriculture, transport, industry, fishery, electricity for households. According to International Energy Agency (IEA) and the World Bank, approximately 15% of the population in Suriname does not have access to electricity [
5,
6]. Most people in the interior do not have access to electricity due to the absence of proper infrastructures and hence, lack of access to the national grid.
Given the situation sketched above in this paper it will be explored, how the current electricity sector of Suriname is structured and which role PV can play in the energy transition of Suriname in the future. This paper is structured as follows. An overview of the Surinamese electricity sector will be given in
Section 2, in which the status of renewable energy in Suriname will also be presented. In
Section 3 the regulations within the electricity sector and the RE targets will be elaborated, followed by
Section 4 and
Section 5 which will present the historical and future electricity demand and the electricity prices. Further, in
Section 6 the possible energy transition with PV systems and hydro in Suriname will be elaborated. The paper will be completed by a conclusion in
Section 7.
2. Electricity Sector in Suriname
2.1. Electricity System Operators
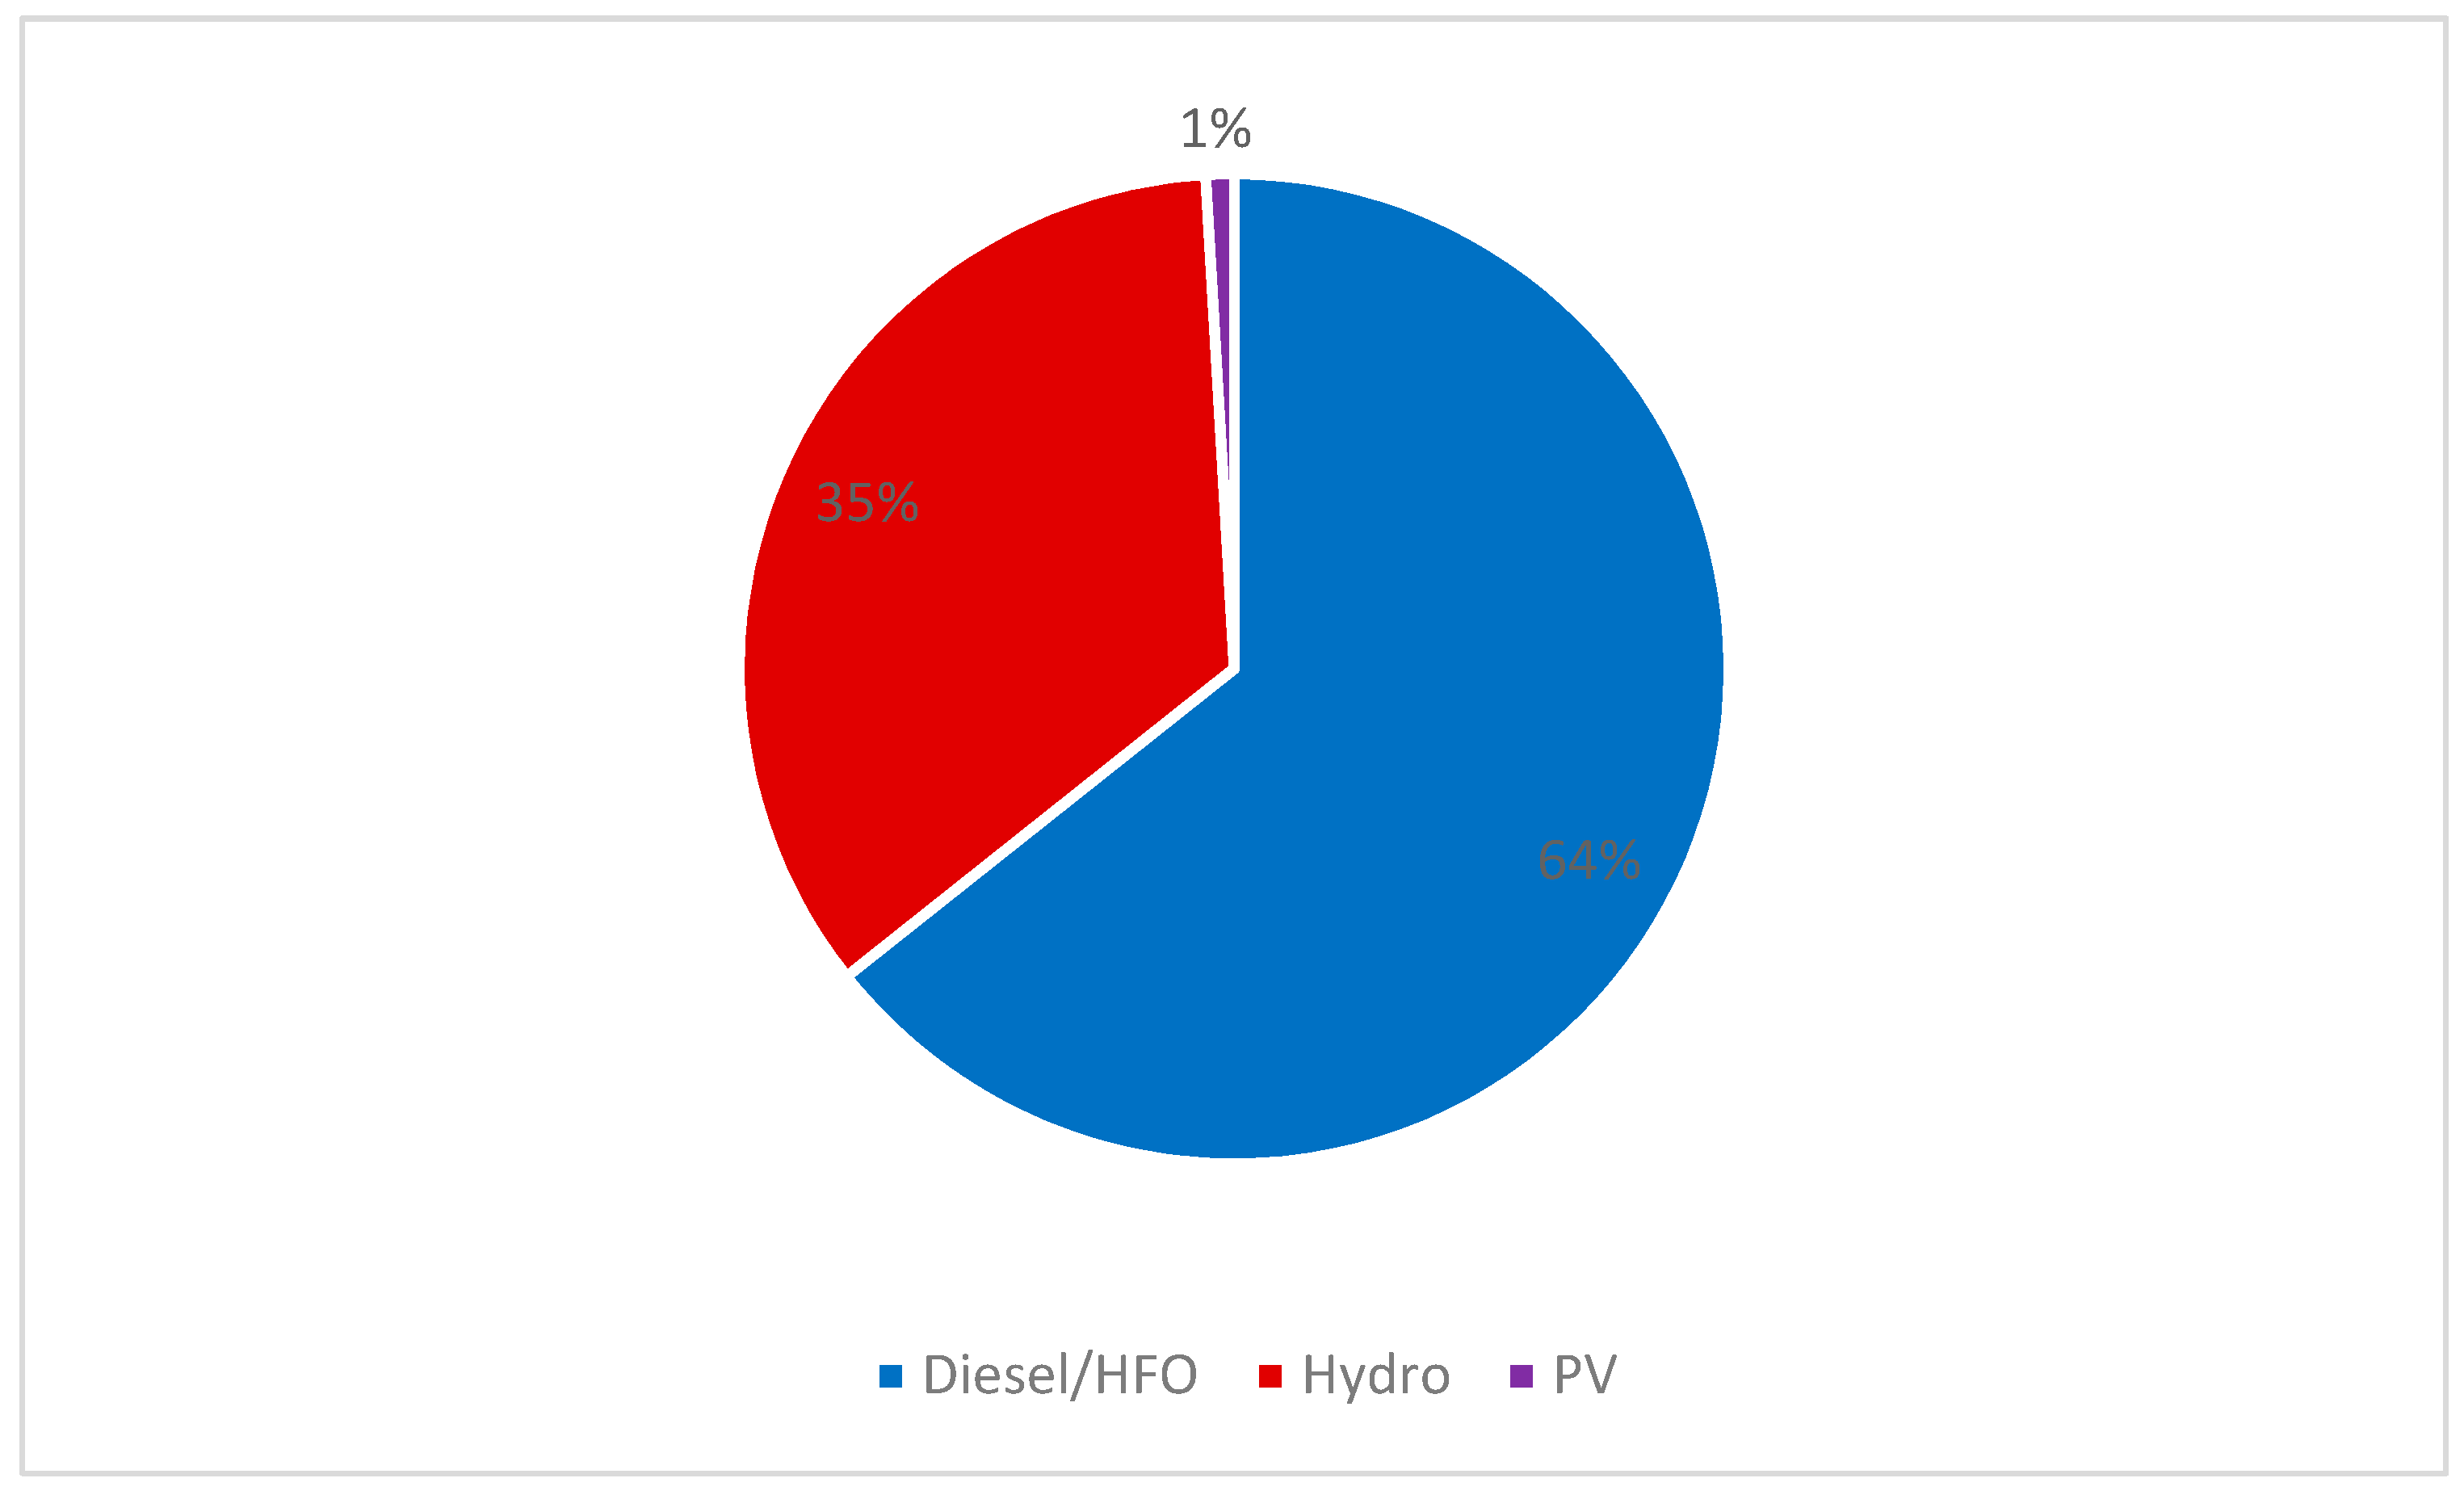
The only electricity utility service company in Suriname—“N.V. Energiebedrijven Suriname” (NV EBS)—is a 100% government owned utility company and supplies electricity to end users in the coastal area and in some parts of the interior. The electrical energy generated in Suriname is produced by centralized power plants using diesel/Heavy Fuel Oil (HFO) engine gensets, a hydropower plant and PV systems, with electrical energy transmitted over long distances to consumers. Sixty four percent of the total capacity installed in Suriname and which is under management of NV EBS, is generated using Diesel or HFO engine gensets (
Figure 2). However, 36% is generated with renewable energy namely hydropower (35%) and PV systems (1%) (
Figure 2). In these numbers, the electricity generation in the interior is not included because it is very low compared to the other more populated areas.
The major electricity grid is the ‘Electricity Supply Paramaribo and Surroundings’ (EPAR grid), covering Paramaribo and some other districts in Suriname and is owned by NV EBS. There are also several independent electricity grids in different districts besides the EPAR which are not interconnected (
Figure 3). High voltage transmission lines of 161 kV are used to transmit the electrical energy over long distances while the distribution takes place over 33 kV, 12.6 kV and 6.3 kV transmission lines. The operating frequency is 60 Hz. The voltage supplied to the households, for the electrical systems are 127 V or 220 V. There are also mini-grids in some villages in the interior of Suriname.
Eighty five percent (85%) of the population has access to electricity in Suriname, of which 79% are connected to the national grid and 6%, who live in the interior, are reliant on diesel gensets units installed by the Department for Rural Energy (“Dienst Electriciteits Voorziening” (DEV)).
On behalf of the Government of Suriname, the Ministry of Natural Resources (NH) has the responsibility to supply electricity to the society. The Ministry of Natural Resources has a special division Department for Rural Energy (“Dienst Electriciteits Voorziening” (DEV)) [
8] which is responsible for bringing the development into the interior through supplying power in the interior. Approximately 130 villages are provided with diesel generators (gensets) with a total capacity of approximately 4.5 MW while most of them runs for 4–6 h during the evening hours [
1]. The fuel is delivered regularly by the DEV to the relevant areas. In addition, small stand-alone PV systems, wind turbines and micro-hydro systems provide electricity in some villages in the interior of Suriname [
9]. The energy sector, with an emission of 3788.15 CO
2, is the largest GHG source of Suriname, contributing over 59% of the total GHG emission [
8]. This is, because of the use of diesel and heavy fuel oil for combustion in the gensets.
2.2. Electricity Production Using Renewable Energy Sources in Suriname
The major renewable energy system in Suriname is the Afobakka hydro dam which is owned by Alcoa (Suralco) with a capacity of 189 MW, which covers also 35% of the electricity supply of the EPAR. There are several ground-mounted and rooftop PV systems in the urban areas and interior of Suriname. The second largest RE system is the 5 MWp grid-connected PV system, owned by the Rosebel Gold Mine Company. The electricity generated with this system is used by the company for gold mining purposes. Other PV systems are the 27 kWp grid-connected PV system at the headquarters of the State Oil Company Suriname and 500 kW hybrid system (Diesel and PV) at Atjoni (a village in the interior). Besides these systems, there are a limited number of small PV systems which are installed in different places in Suriname, including the Hinterland of Suriname. Some examples are:
3 kWp PV system at a school in Botopasi village in the interior (Boven Suriname).
20 kWp PV system in Pelelutepu (Tepu) village in the southern part of Suriname.
4 kWp rooftop PV system at an elementary school in Gujaba village in the interior of Suriname.
There are also stand-alone PV systems in use by the telecommunication companies to power their telecommunication towers in the interior. Further, the “Medische Zending,” who is responsible for the health care, also uses PV systems to power their cooling systems in the offices in the interior. The generated electricity is used to keep the medicines and vaccines cool. Besides companies and schools, citizens in the urban areas and in the interior have also privately owned PV systems. In the past decade, there has been an increasing demand for small home PV systems with a power of several 100 Wp, because the existing EPAR grid does not expand to the interior due to the remote locations which are difficult to access and because of the absence of proper infrastructure.
Solar boilers are also used in Suriname, especially in the coastal region, to provide warm water in homes but this happens only at a small scale. Warm water is used for showers and sometimes for cooking.
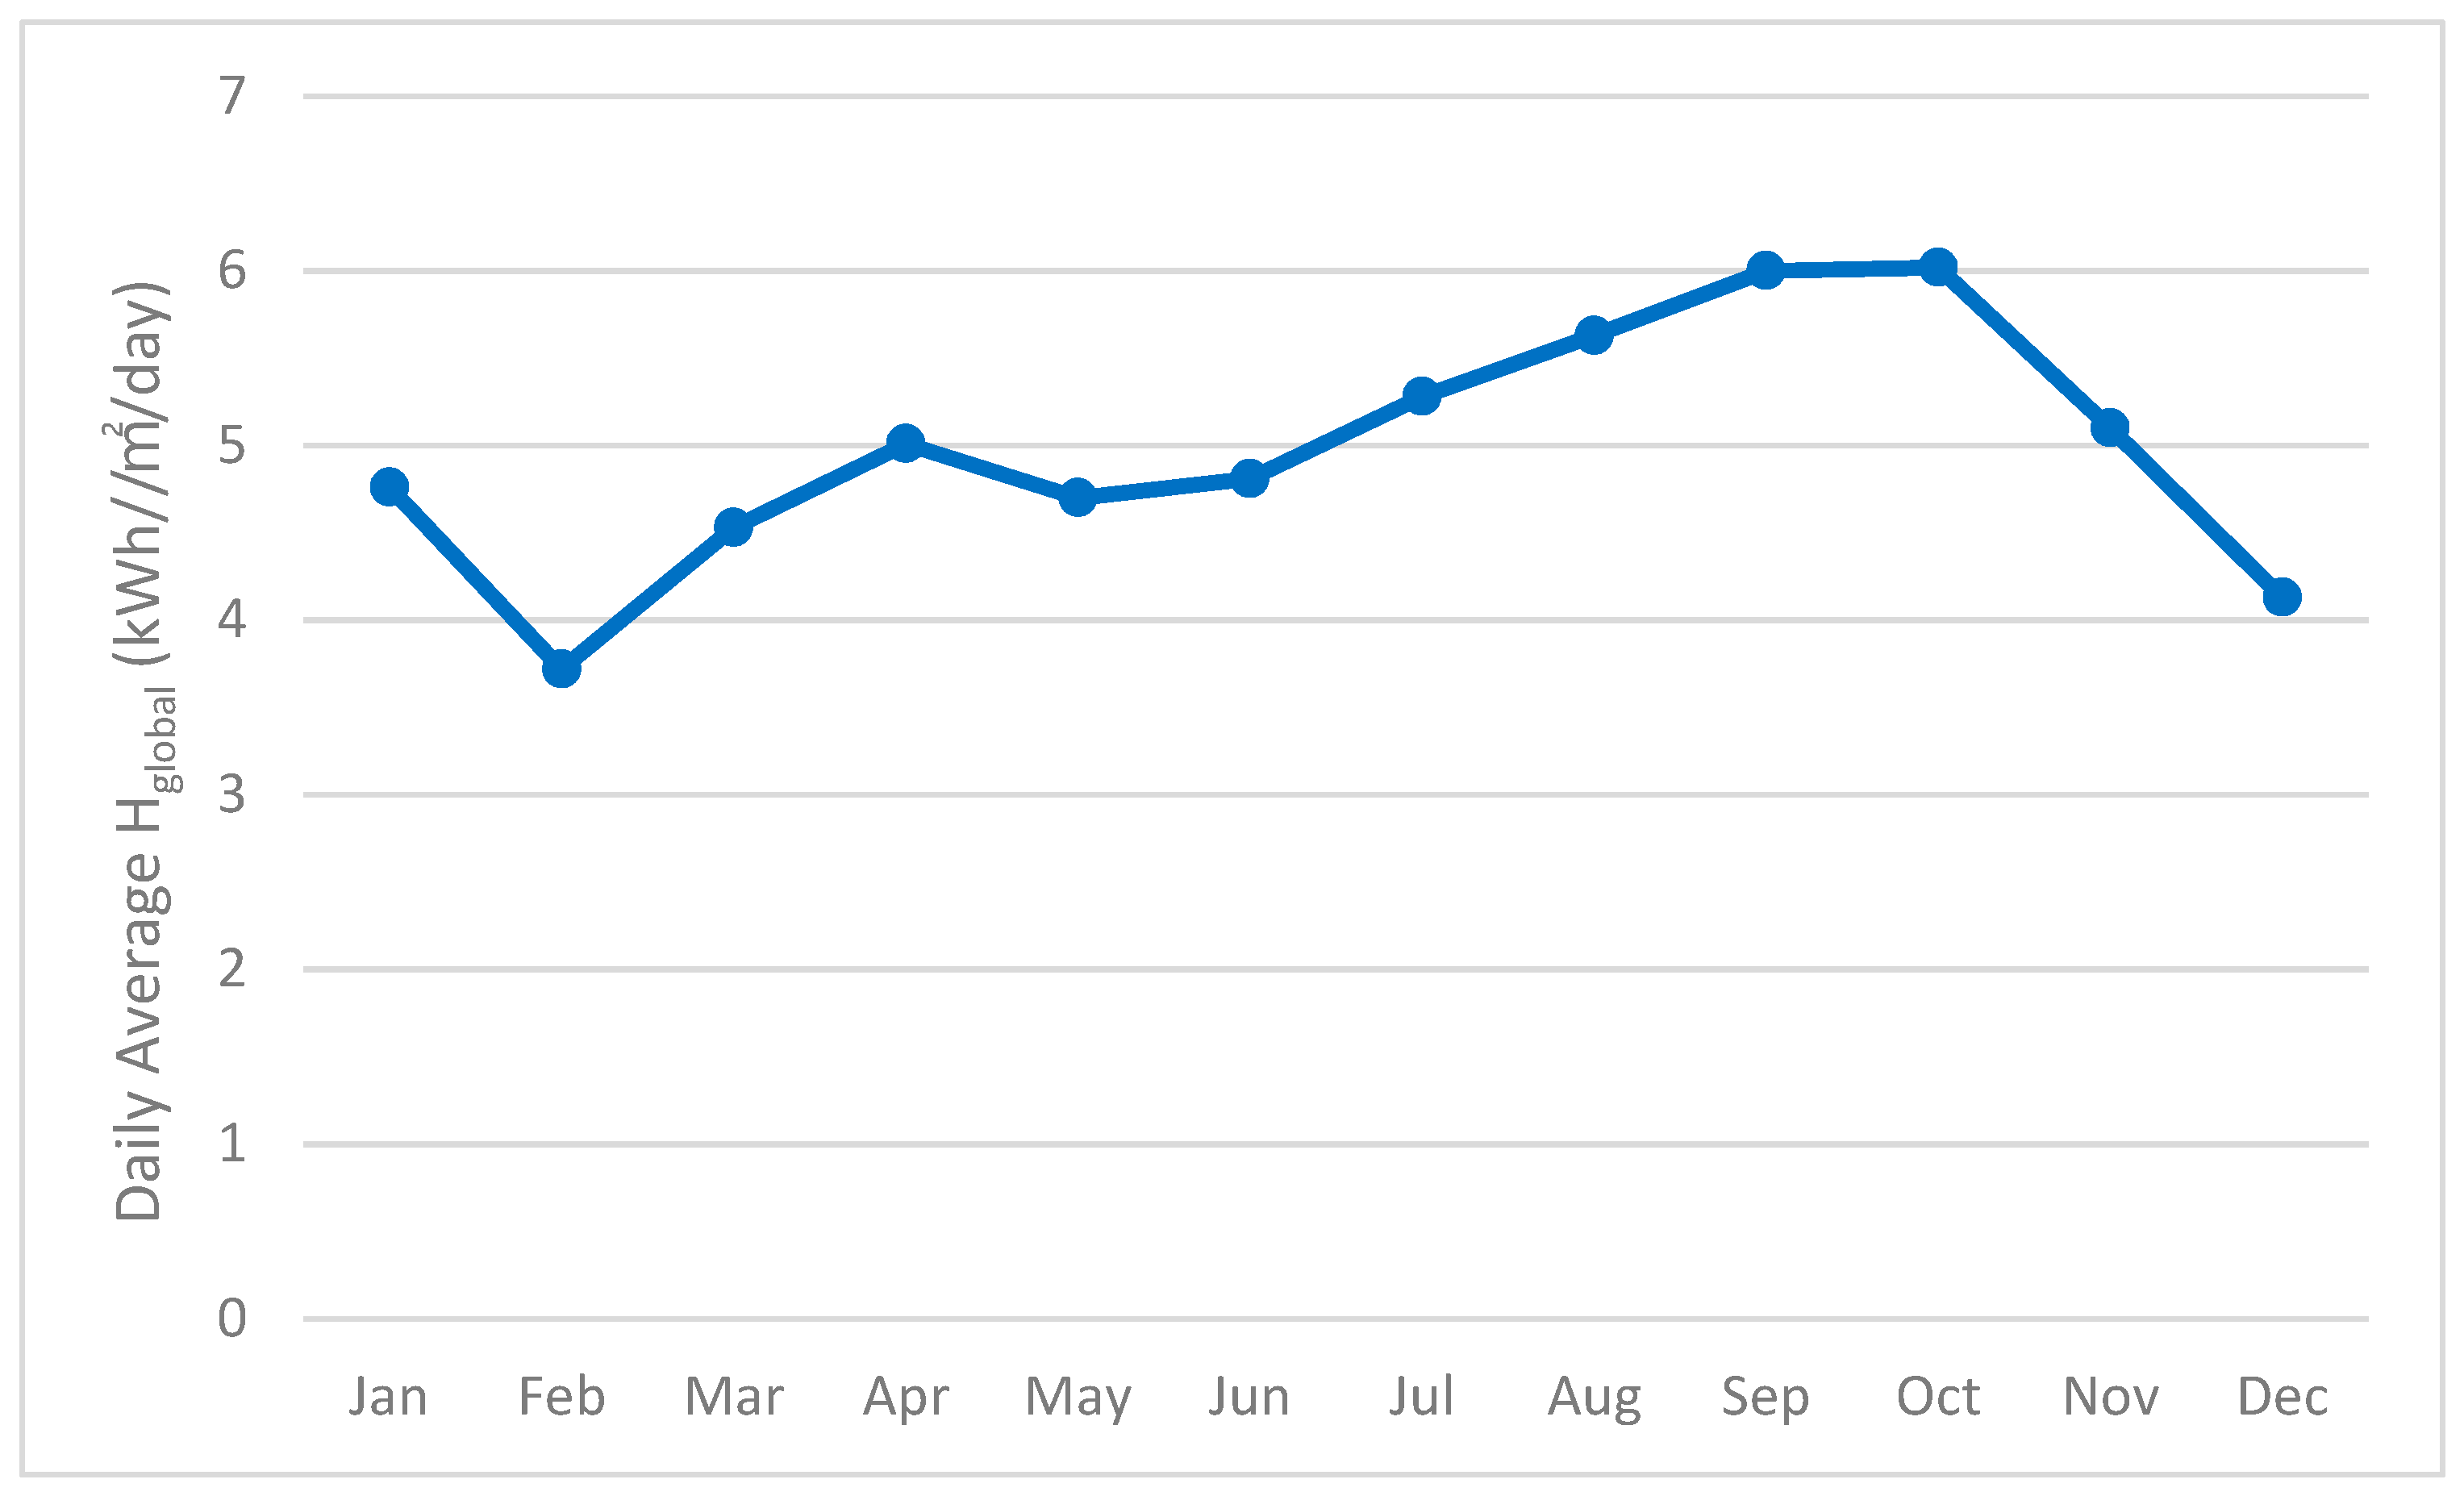
The solar global horizontal irradiation (H
global) in Suriname is given in
Figure 4. The daily average H
global per month varies from 3.72 kWh/m
2/day (Feb.) to 6.02 kWh/m
2/day (Oct.). The annual H
global is 1791.85 kWh/m
2/year. The lower values of H
global coincides with wet season while the higher measured values coincides with the dry season in Suriname.
Other RE sources used in Suriname are wind energy and biomass energy but these sources are used on small scale.
3. Electricity Sector Regulations in Suriname
3.1. Electricity Act of Suriname
Since 1 March 2016, the electricity sector in Suriname is regulated due to the new Electricity Act which has been passed by the parliament of Suriname [
11]. Previously, there was no act and regulations regarding the electricity production, generation and distribution. The 3 main focus points in this law are:
Safeguarding the electricity supply for social and economic development of Suriname;
Promote the supply of electricity that is available, affordable, sustainable and enhances the quality of the environment; and
Implementation of institutional and technical policy measures to realize policy objective [
12].
Together with this law, an Energy Authority Suriname (EAS) has been established. The EAS monitors compliance of the national electricity strategy and the electricity sector plan, including the reasonableness and fairness of the electricity tariffs. The supervisory board of the EAS has been installed in 2018.
A restructuring of the electricity utility service company (NV EBS) is in progress which is also due to the new Act (2016). Previously, NV EBS was the only utility company in Suriname with the rights to generate, distribute and transmit electricity over the national grid but now, the Act gives the local people and others the possibility to generate own electricity [
13]. The maximum power that can be installed using PV systems, by citizens and companies is unknown at this moment.
This act promotes also RE by giving the customers the opportunity to generate its own electricity by using solar—or wind energy (self-generator). In case of over–production, the generated electricity can be sent to the grid of NV EBS. The electricity producer (in this case the citizens) must produce less electricity compared to his annual energy consumption, which has been taken from the national grid, on annual basis. In this case, the citizens can make use of the regulation of netting (net billing) on annual basis [
14].
After this law has been in force, an Energy Sector Plan is being developed which will provide a 5-year vision and strategy for a modern, efficient and affordable electricity sector.
In the National Development plan 2017–2021 of Suriname it is also written that the government of Suriname wants to stimulate the use of renewable energy and wants to work on the development of Renewable energy in Suriname. There are also plans to conduct several studies regarding Renewable energy and several RE projects are proposed for the coming years [
15].
3.2. Renewable Energy Targets in Suriname
As a member of the CARICOM, Suriname has agreed with the CARICOM RE & EE targets which were approved during the 41st Special Meeting of COTED based on the Caribbean Sustainable Energy Roadmap and Strategy (C-SERMS). The targets that must be achieved are:
20% renewable power capacity by 2017,
28% renewable power capacity by 2022,
47% renewable power capacity by 2027,
33% reduction in energy intensity by 2027,
Power sector CO2 emission reductions of 18% by 2017,
Power sector CO2 emission reductions of 32 percent by 2022 and
Power sector CO
2 emission reductions of 36 percent by 2027 [
16].
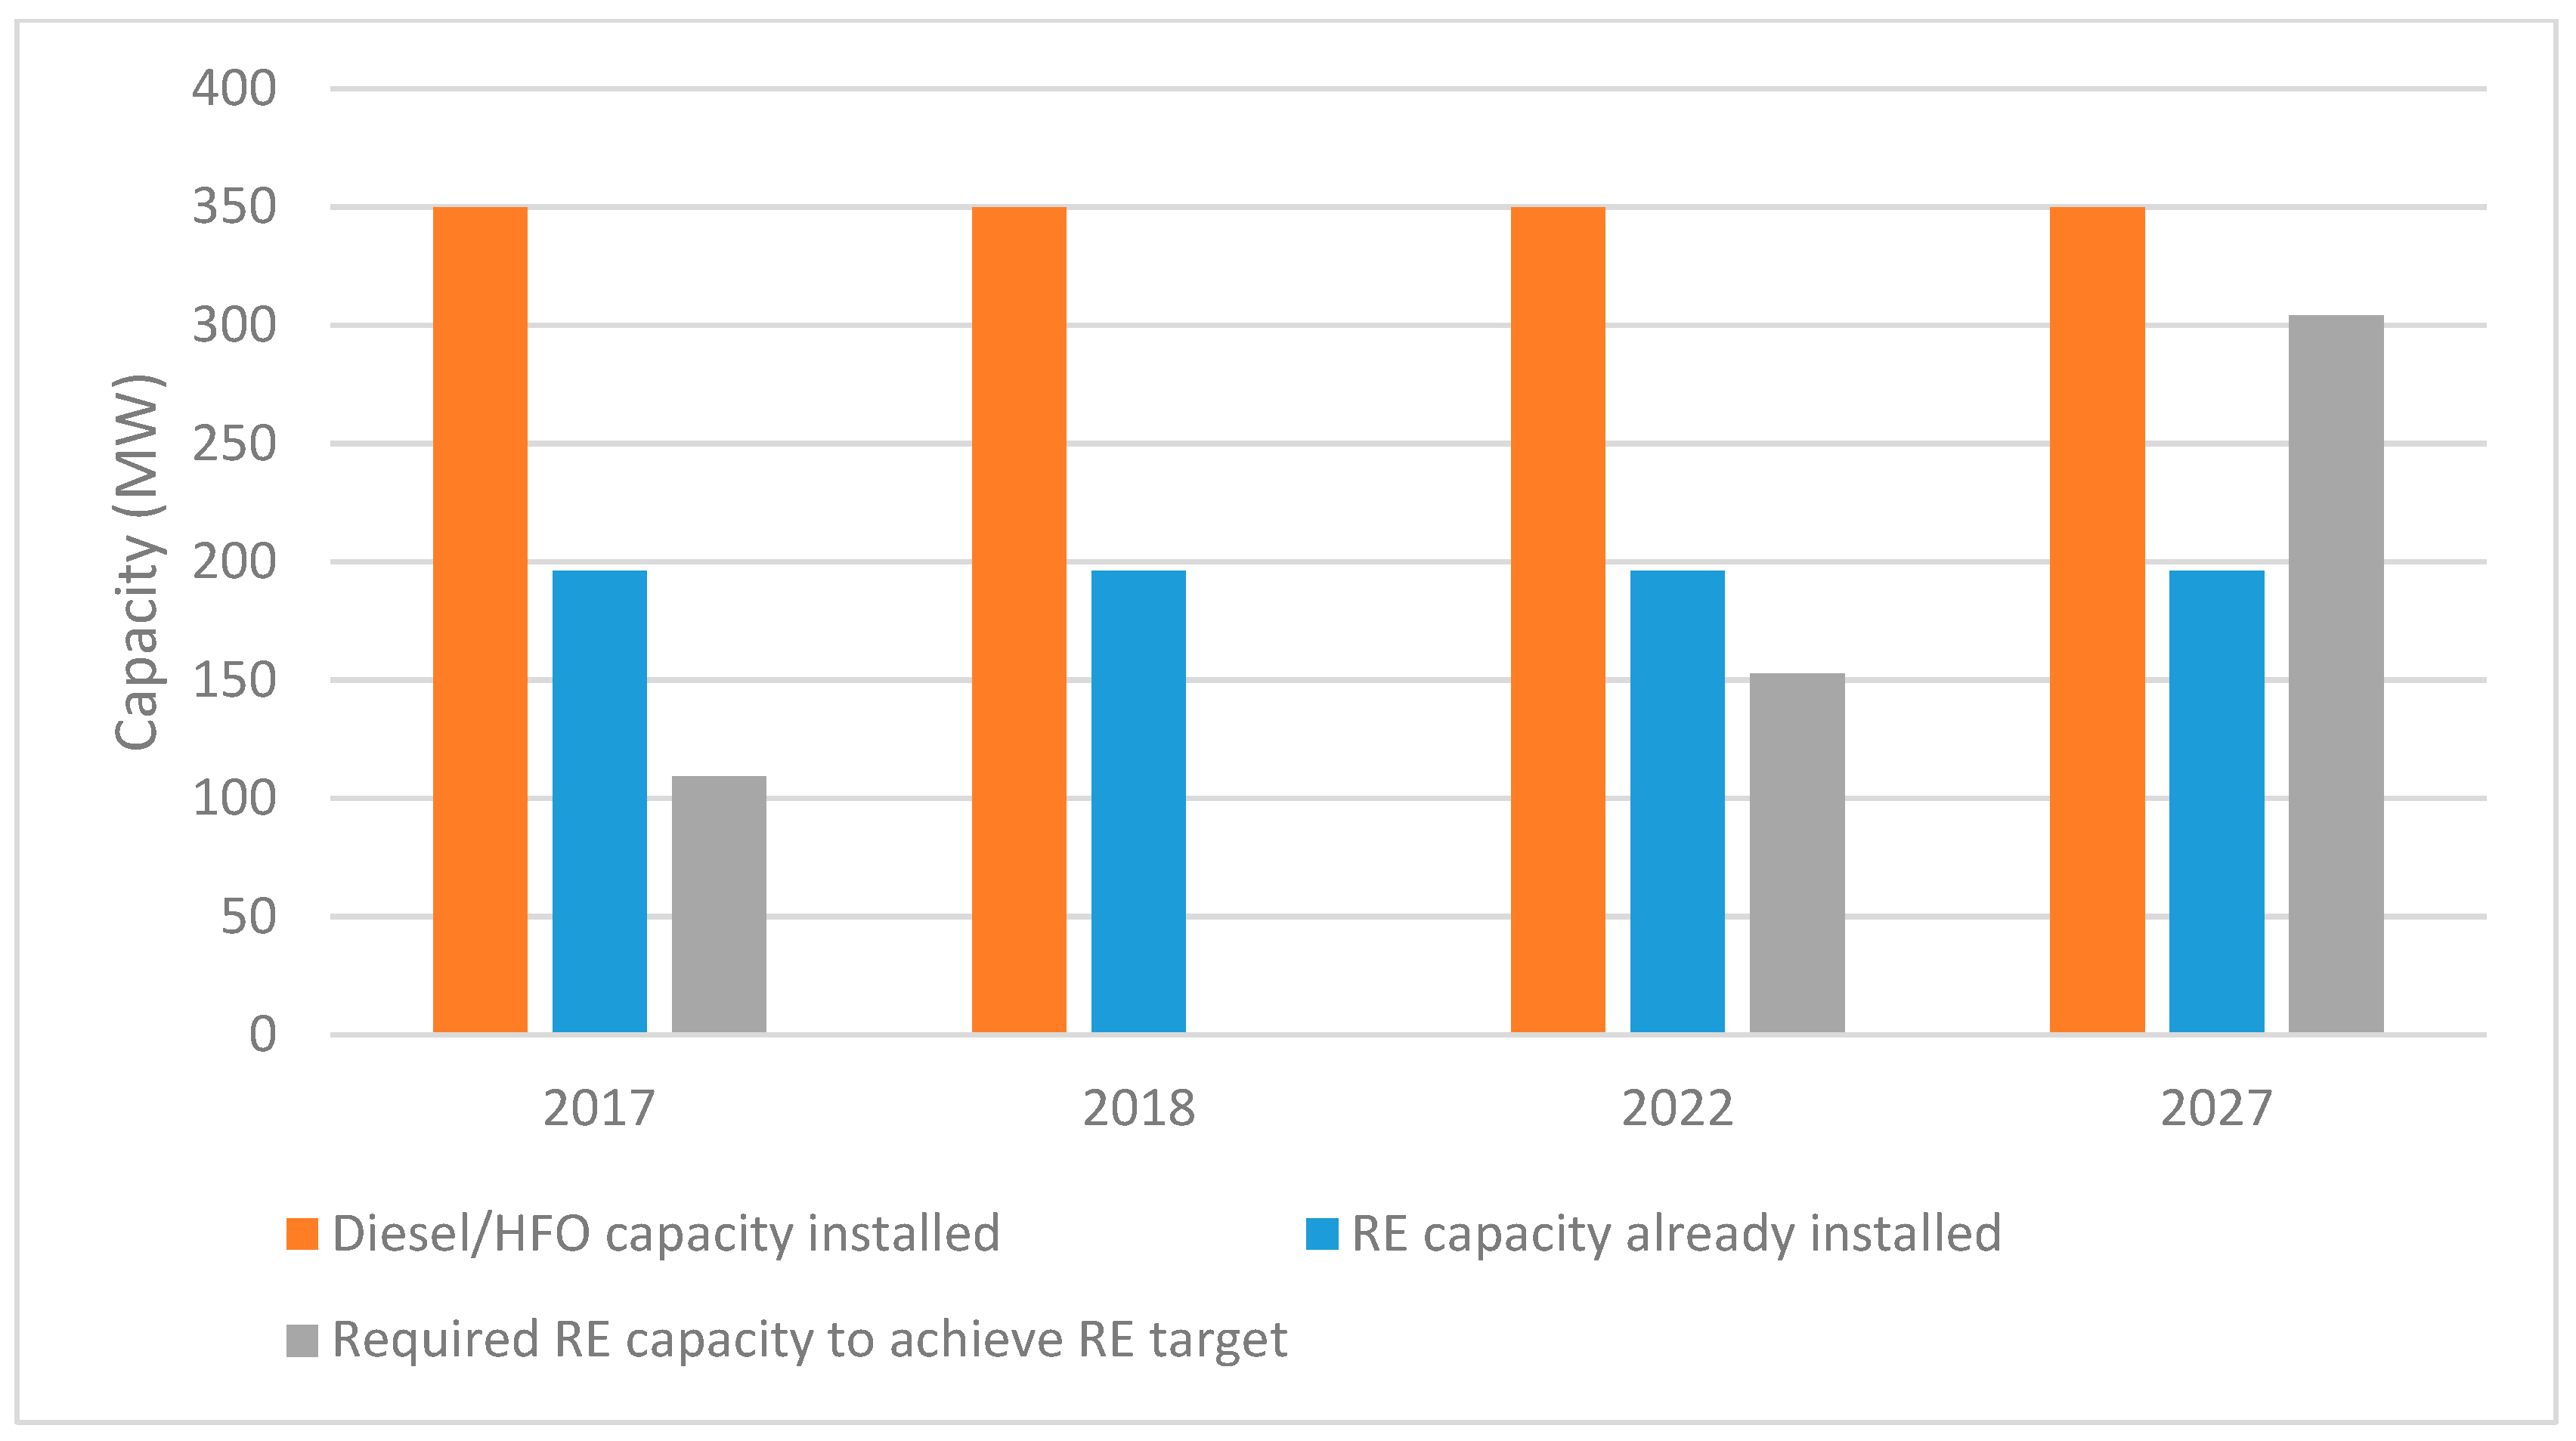
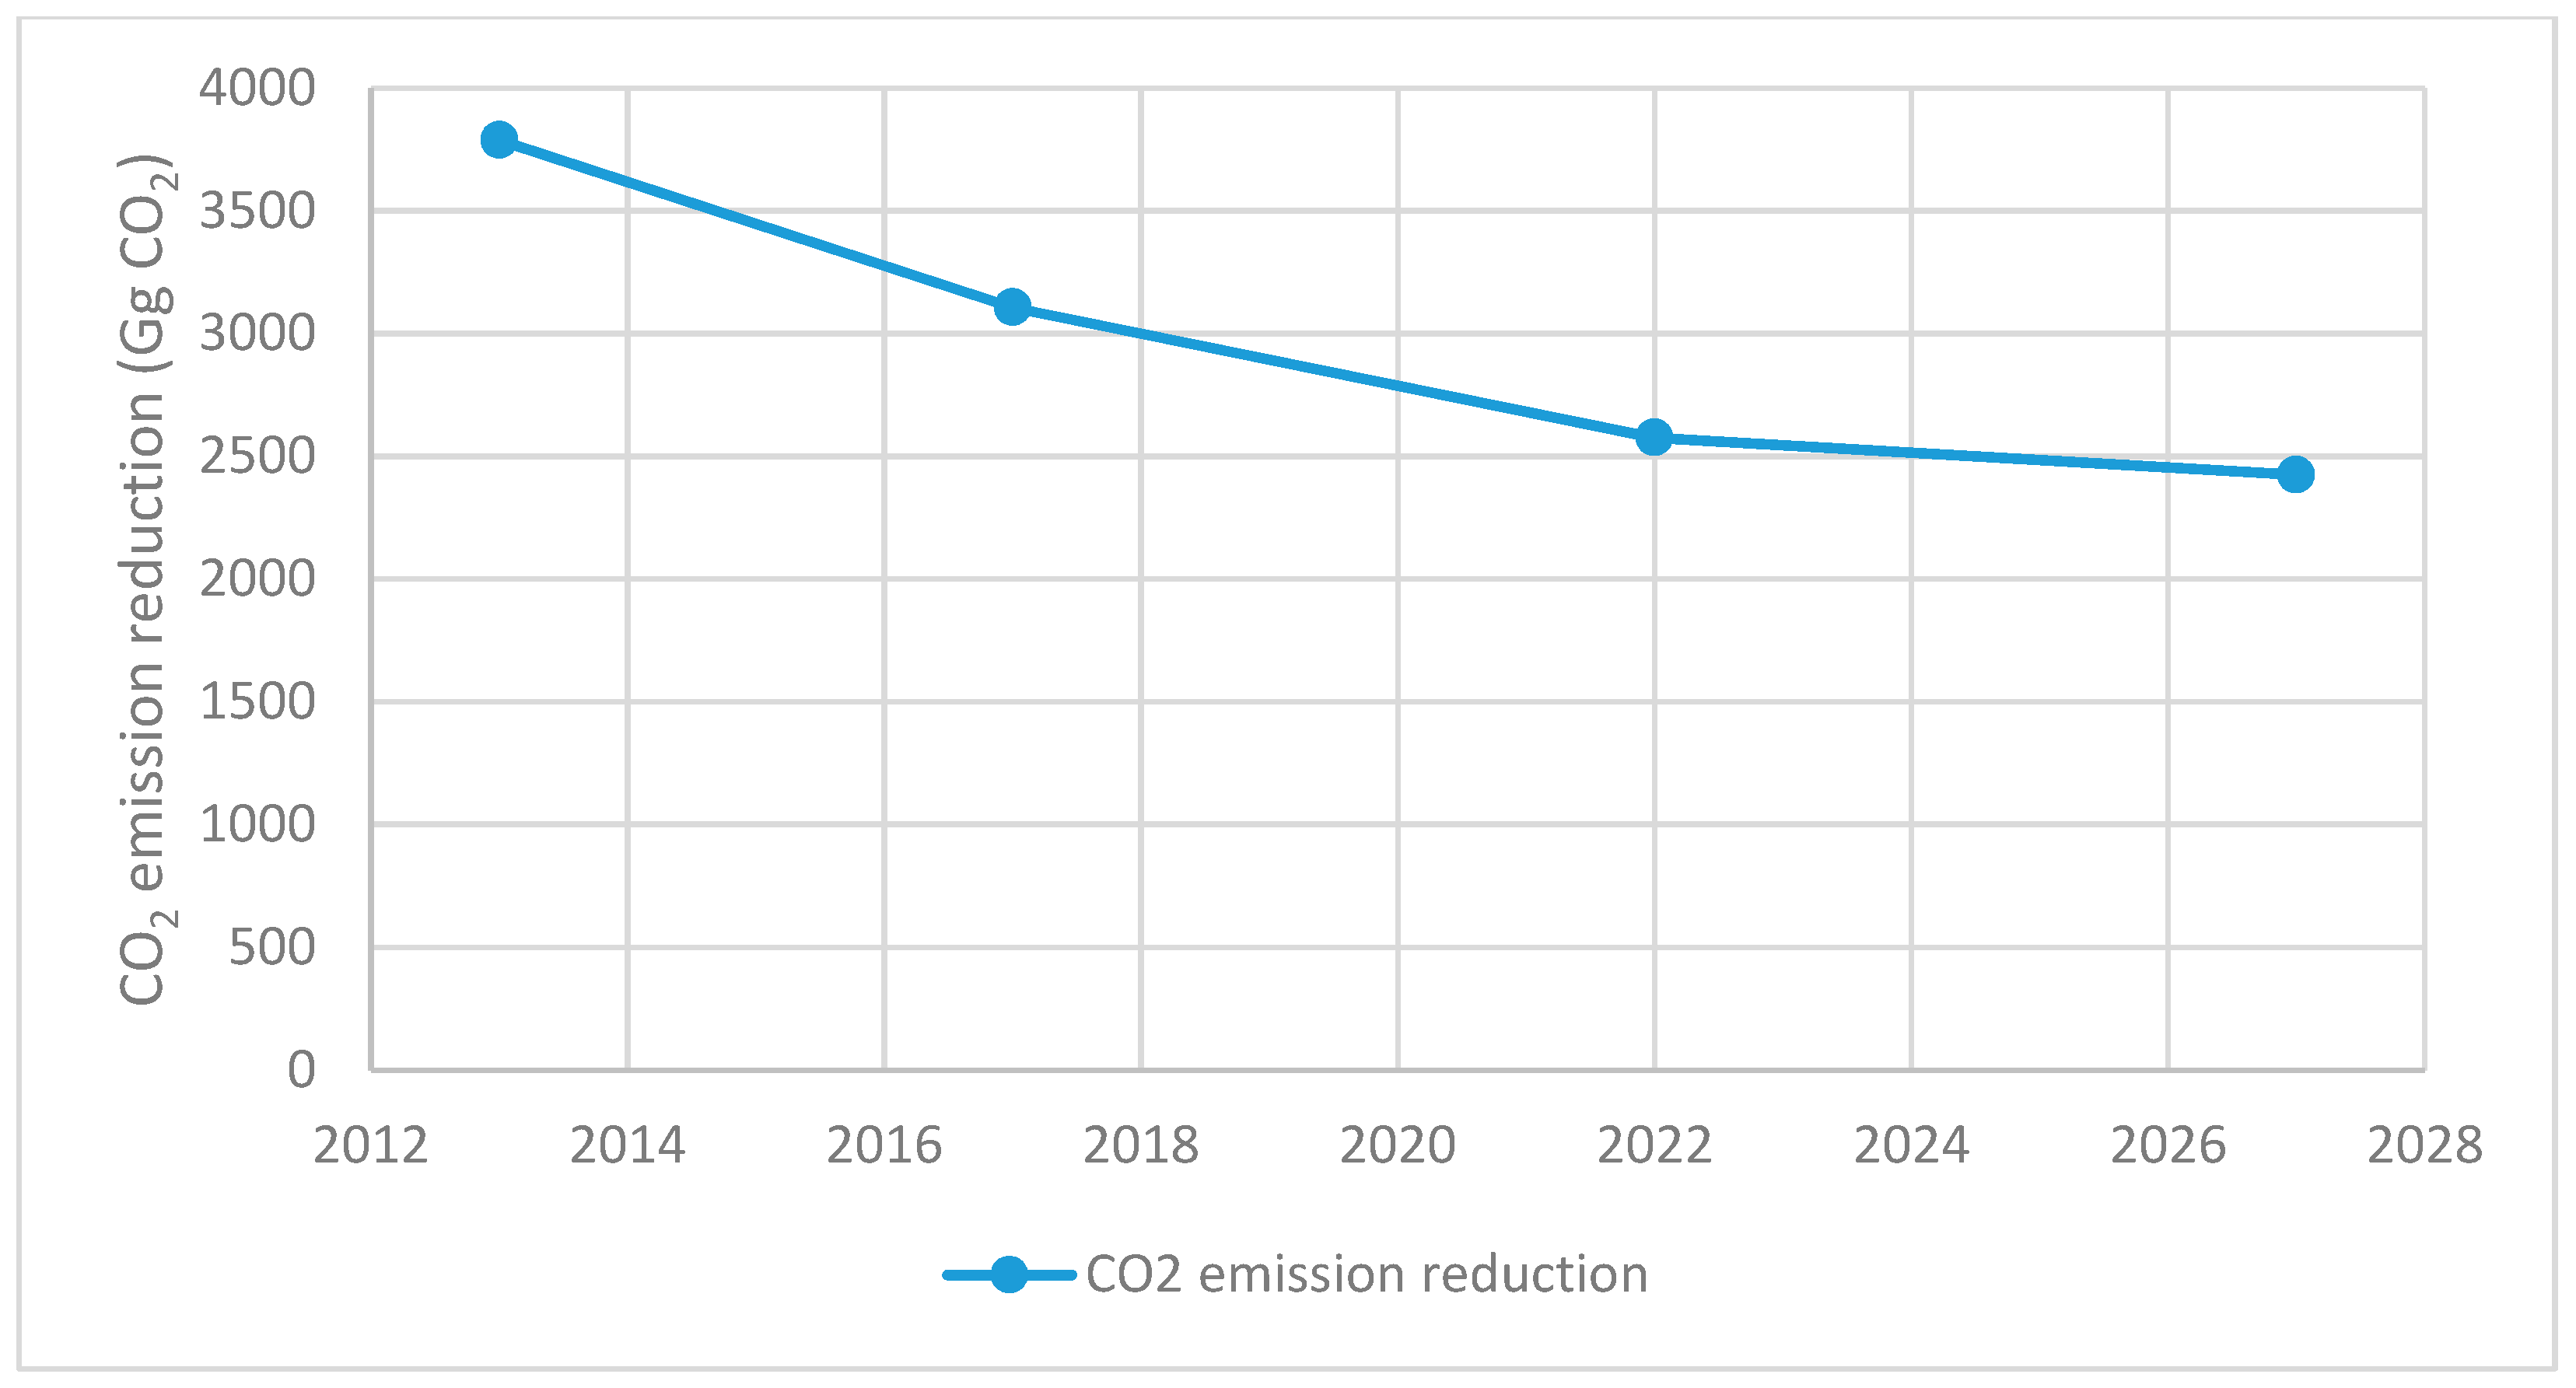
The required power capacities to achieve for each target and the CO
2 reduction to achieve for each target is given in the
Figure 5 and
Figure 6.
According to
Figure 2, Suriname has already 36% share of renewable energy compared to the total installed capacity. From
Figure 5, it can also be seen that Suriname has already achieved its RE target of 2017 (20%) and 2022 (28%), mainly by a large installed capacity of hydroelectric power plants of 189 MW. But the target of 2027 has not been achieved yet and to achieve this 11% increment in the RE share is required compared to installed capacity in 2018.
Currently, the CO
2 emission is approximately 3788.15 Gg CO
2 of the power sector. This must be reduced to 2600 Gg CO
2 in 2022 and to 2425 Gg CO
2 till 2027 (
Figure 6).
Besides these targets, Suriname has also signed the Paris agreement but it has not been ratified yet. Suriname is in process of writing an intended Nationally Determined Contributions (INDC) document, in which RE targets for Suriname will be included. The target date to publish the INDC is unknown yet.
According to an interview held with a solar energy company in Suriname, the state gives 10% tax reduction when PV panels are imported from foreign countries (private communication, 31 May 2017). But according to a second interview held with another company who also sells and installs PV systems, incentive is not being given by the Government for the import and installation of PV equipment (private communication, 21 August 2018).
4. Electricity Demand in Suriname
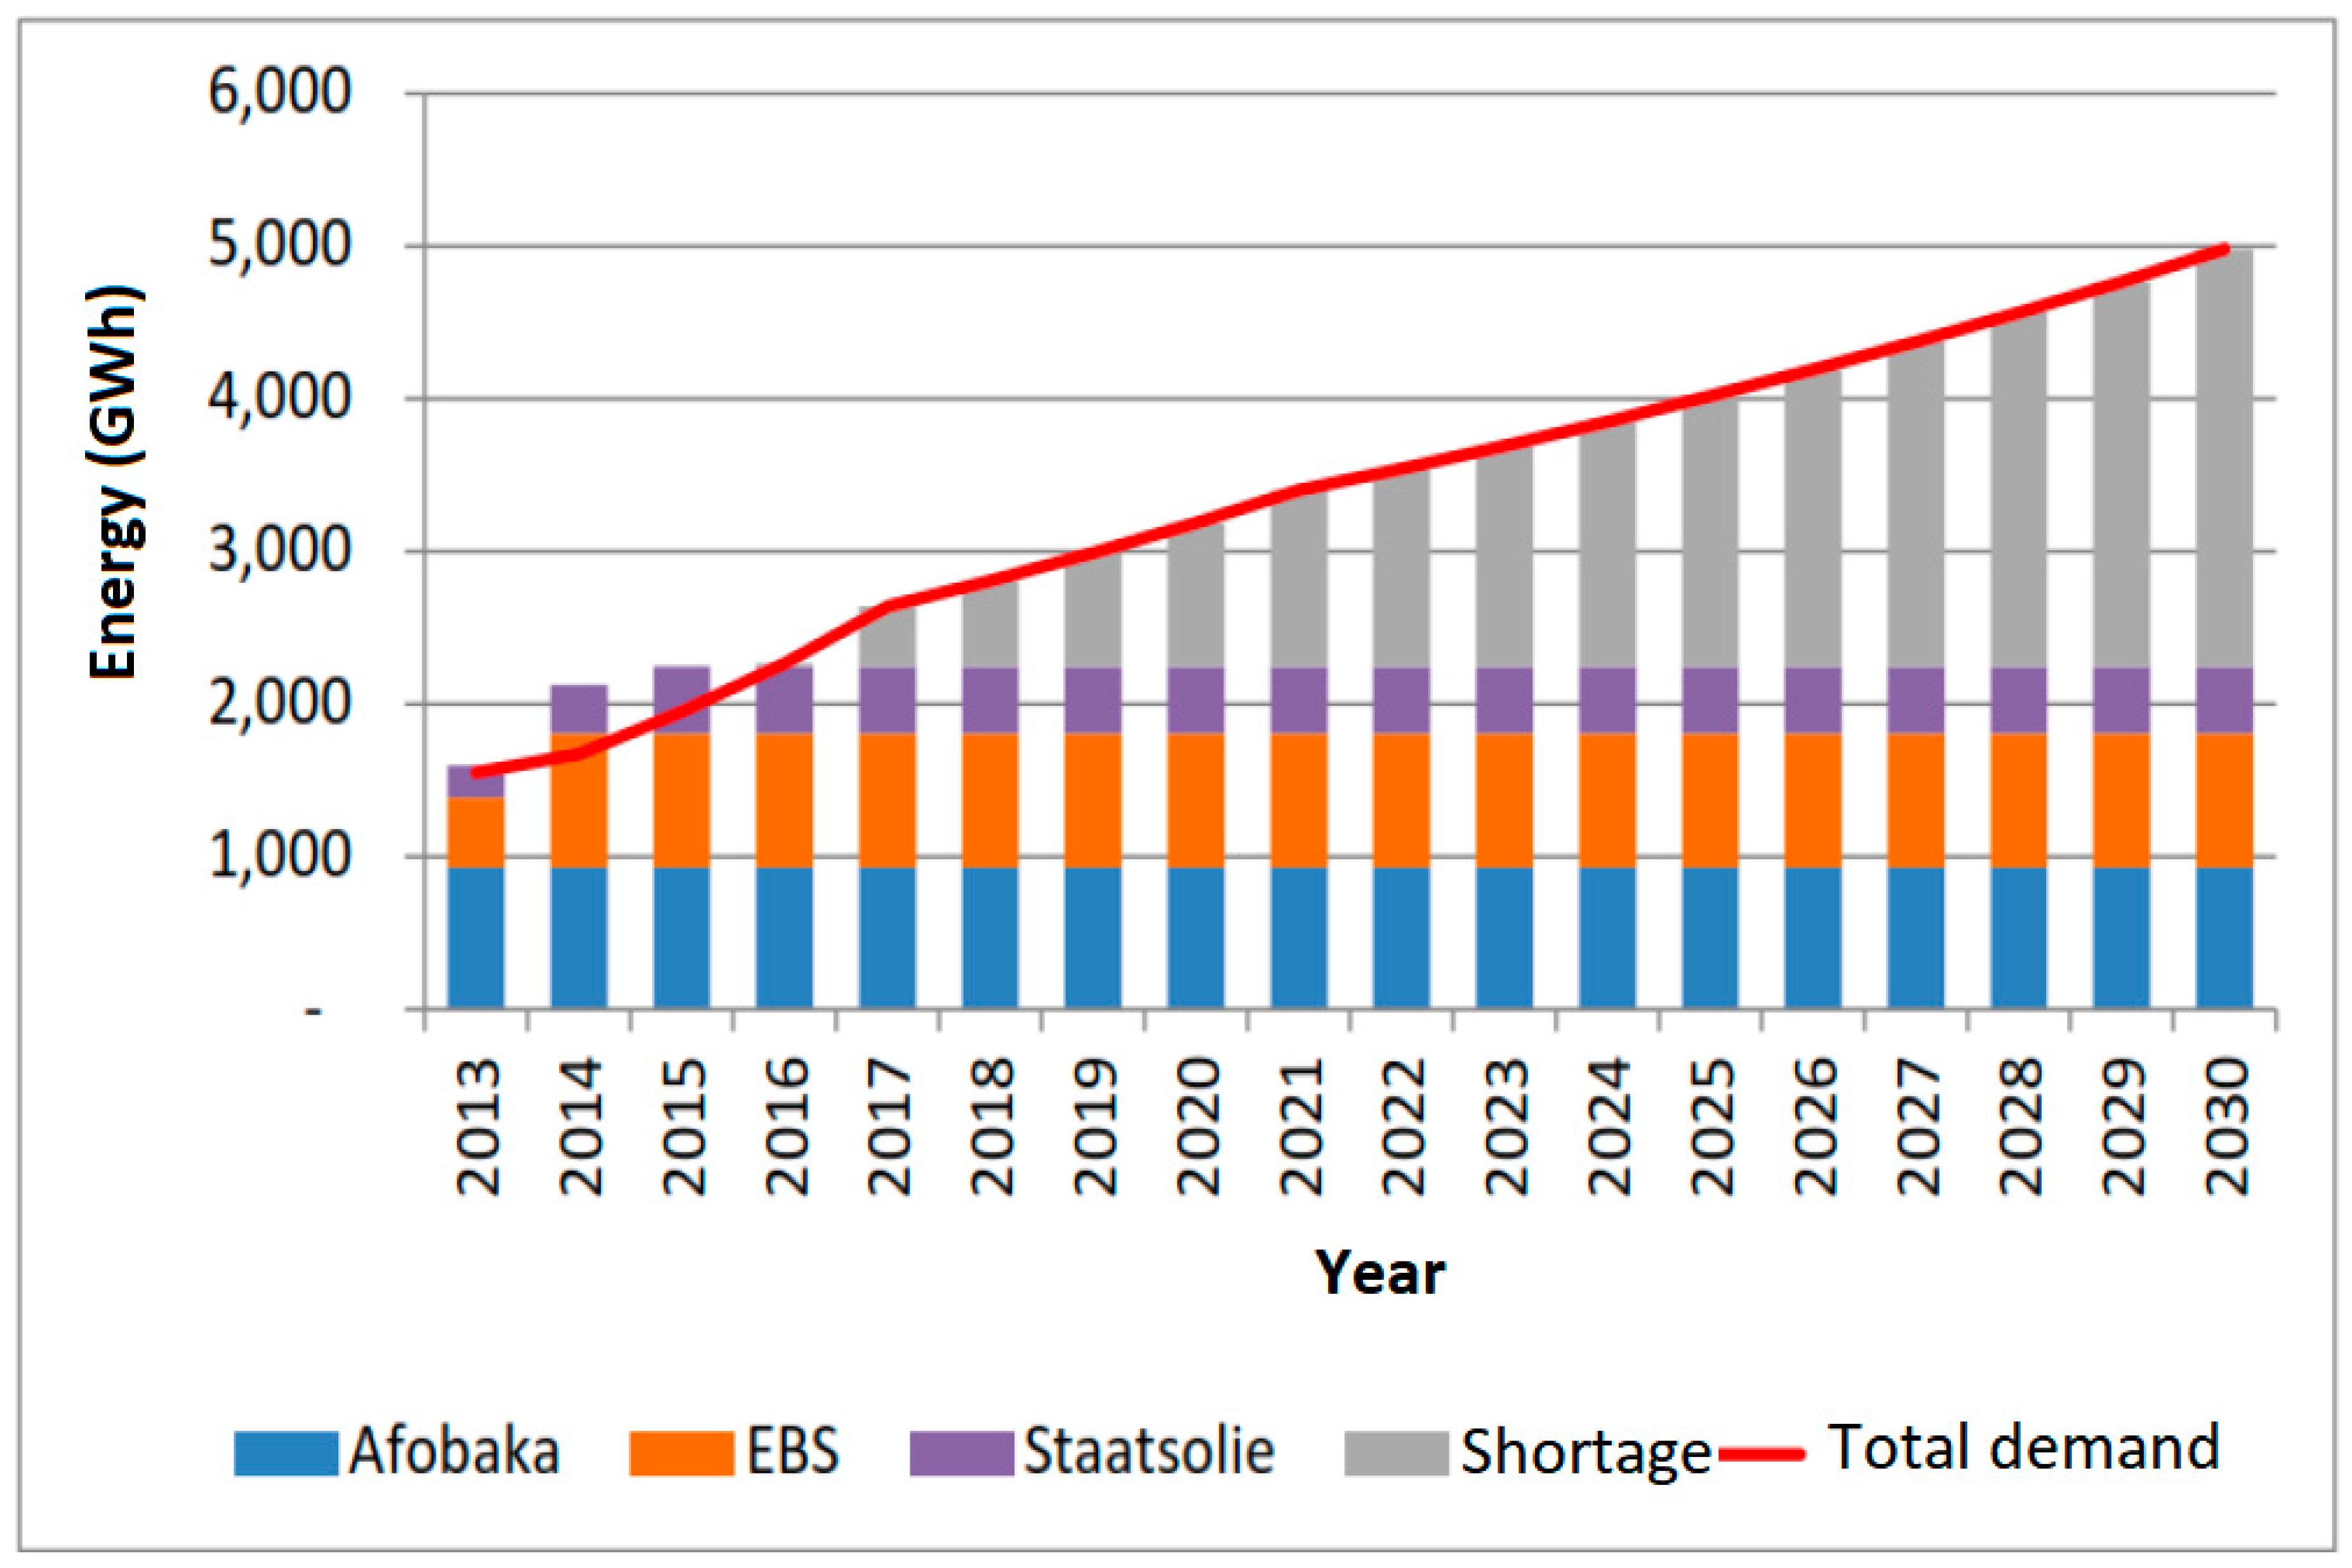
The electrical energy demand increases in Suriname 6% to 10% per year [
17] due to increasing economic activities and population growth. It is estimated that the power demand will increase by approximately 500 MW in 2022 [
18]. The peak demand of the EPAR grid was approximately 200 MW and 1170 GWh was sold to the end-users in 2016 [
7]. The historical electricity demand and future electricity demand can be seen in
Figure 7.
5. Electricity Prices in Suriname
The electricity price in most of the countries, in the Caribbean region, lies between USD 0.30–USD 0.40 per kWh which fluctuates with the prevailing oil prices [
19]. Whilst, this is not the case in Trinidad and Tobago and Suriname. The cost of electricity in Trinidad & Tobago is steady at around
$0.05 per kWh. Depending on the energy consumption, the electricity price vary between USD 0.02–USD 0.17 per kWh (Surinamese Dollars (SRD) 0.15 and SRD 1.31 per kWh [
20]) in Suriname (
Table 1 and
Table 2).
The electricity prices per kWh depends on the type of customer in Suriname. The 4 types of customers according to NV EBS are:
Residential
Commercial
Industrial
Social institutions
The electricity tariff structure is given in
Table 1 and
Table 2. This prices are paid by customers who are connected on the EPAR grid and on the independent electricity grids in other districts.
According to NV EBS, the actual electricity generation cost in Suriname is USD 0.13/kWh for the EPAR grid which includes electricity generation by several power plants. This price includes all costs like generation cost, transmission cost, operational and maintenance cost, oil costs and so forth. The price at which the government is buying the generated electricity by the hydro dam (owned by Suralco) is 0.004 USD/kWh. This is regulated through a power purchase agreement (PPA) contract between Alcoa and Suriname. A PPA is an agreement between the seller and buyer of the electricity. Although, the actual electricity generation cost by the hydro power plants is approximately USD 0.06/kWh, exclusive all other costs.
The generation cost by power plants using diesel/HFO engine gensets, in other districts (the independent electricity grids) is approximately USD 0.20/kWh.
In Suriname, the electricity generation cost including transmission costs, operational and maintenance costs, is higher compared to the electricity prices (per kWh) which are paid by the customers. This is due to the fact that the electricity sector is heavy subsidized by the Government and the citizens are paying a subsidized electricity tariff.
In 2016 the Government reduced the subsidy on the electricity prices and as a result of this, the electricity prices increased twice in 2016 (February and July) in Suriname. The Government announced also that the subsidy will be reduced further, which means that the price per kWh will increase in the near future. However, the citizens of the interior have waived electricity bills because electricity supply in the interior is fully subsidized by the Government.
6. Energy Transition with Renewable Energy Sources in Suriname
6.1. Energy Transition with PV Systems in Suriname
The potential future developments in the electricity sector of Suriname will be described in this section based on the electricity demand, RE targets in Suriname and the historical data of the total installed capacity. Analyses have been conducted in order to find out the share which PV systems can have in the future regarding the electricity generation and transition. For this, four cases (scenarios) have been elaborated. In these scenarios, it will be investigated how much PV capacity is required and how much electricity generated must be in order to achieve the RE targets and to fulfil the future electrical energy demand in Suriname. Besides this, there are also prospective PV projects that are planned by NV EBS, Solar reserve and CleanTech in Suriname [
7,
21,
22]. The installed capacities of these power plants vary between 300 kWp to 400 MWp and some of them will be executed in phases. As such, the PV capacity available from the projects and the generated PV electricity will be assessed. In these scenarios it is assumed that the present (2018) hydro and diesel/HFO installed capacity will remain the same in the future. Since the focus is to find out the share of PV in the future, the scenarios will only deal with PV and its share. These scenarios have been elaborated till 2027 because the RE targets are known till 2027 and the information regarding the projects are available only till 2025. The scenarios are as follows:
Base case scenario: hereby the additional required PV electricity has been determined for the coming years (till 2027) based on the RE targets of Suriname. The installed capacity of diesel/HFO engine gensets and hydro power plant have been taken constant, as it is in 2018. No other energy source will be installed in the future besides PV systems in order to achieve the remaining RE target of 47% in 2027.
Worst case scenario: hereby the installed capacity of the PV power plants has been taken constant, as it is in 2018. So, there will not be any increment in the installed capacity in the near future (till 2027), as no more PV systems will be installed in Suriname.
Project based scenario: for this scenario, the projects that are planned for execution, for the next coming years (till 2025), have been taken into account to determine the future growth of the installed PV capacity in Suriname.
The capacities of the PV power plants of the projects are given but the generated electricity is not given by the project developers. So, the PV capacities were required to be converted to generated electrical energy. This is done using the final yield (
Yf) (Equation (1)) which is 1368.8 kWh/kW in Suriname [
10].
Yf is the ratio of final AC output power generated (
Eac) to the rated nominal PV power as specified by the manufacturer at standard temperature conditions.
Demand based scenario: this scenario is based on
Figure 7 which gives the future electricity energy demand in Suriname. For each year the electrical energy demand is determined from
Figure 7 and it is assumed that the future electricity demand in Suriname will be covered only with PV. The additional required PV electricity for the next coming years is determined for the next coming years.
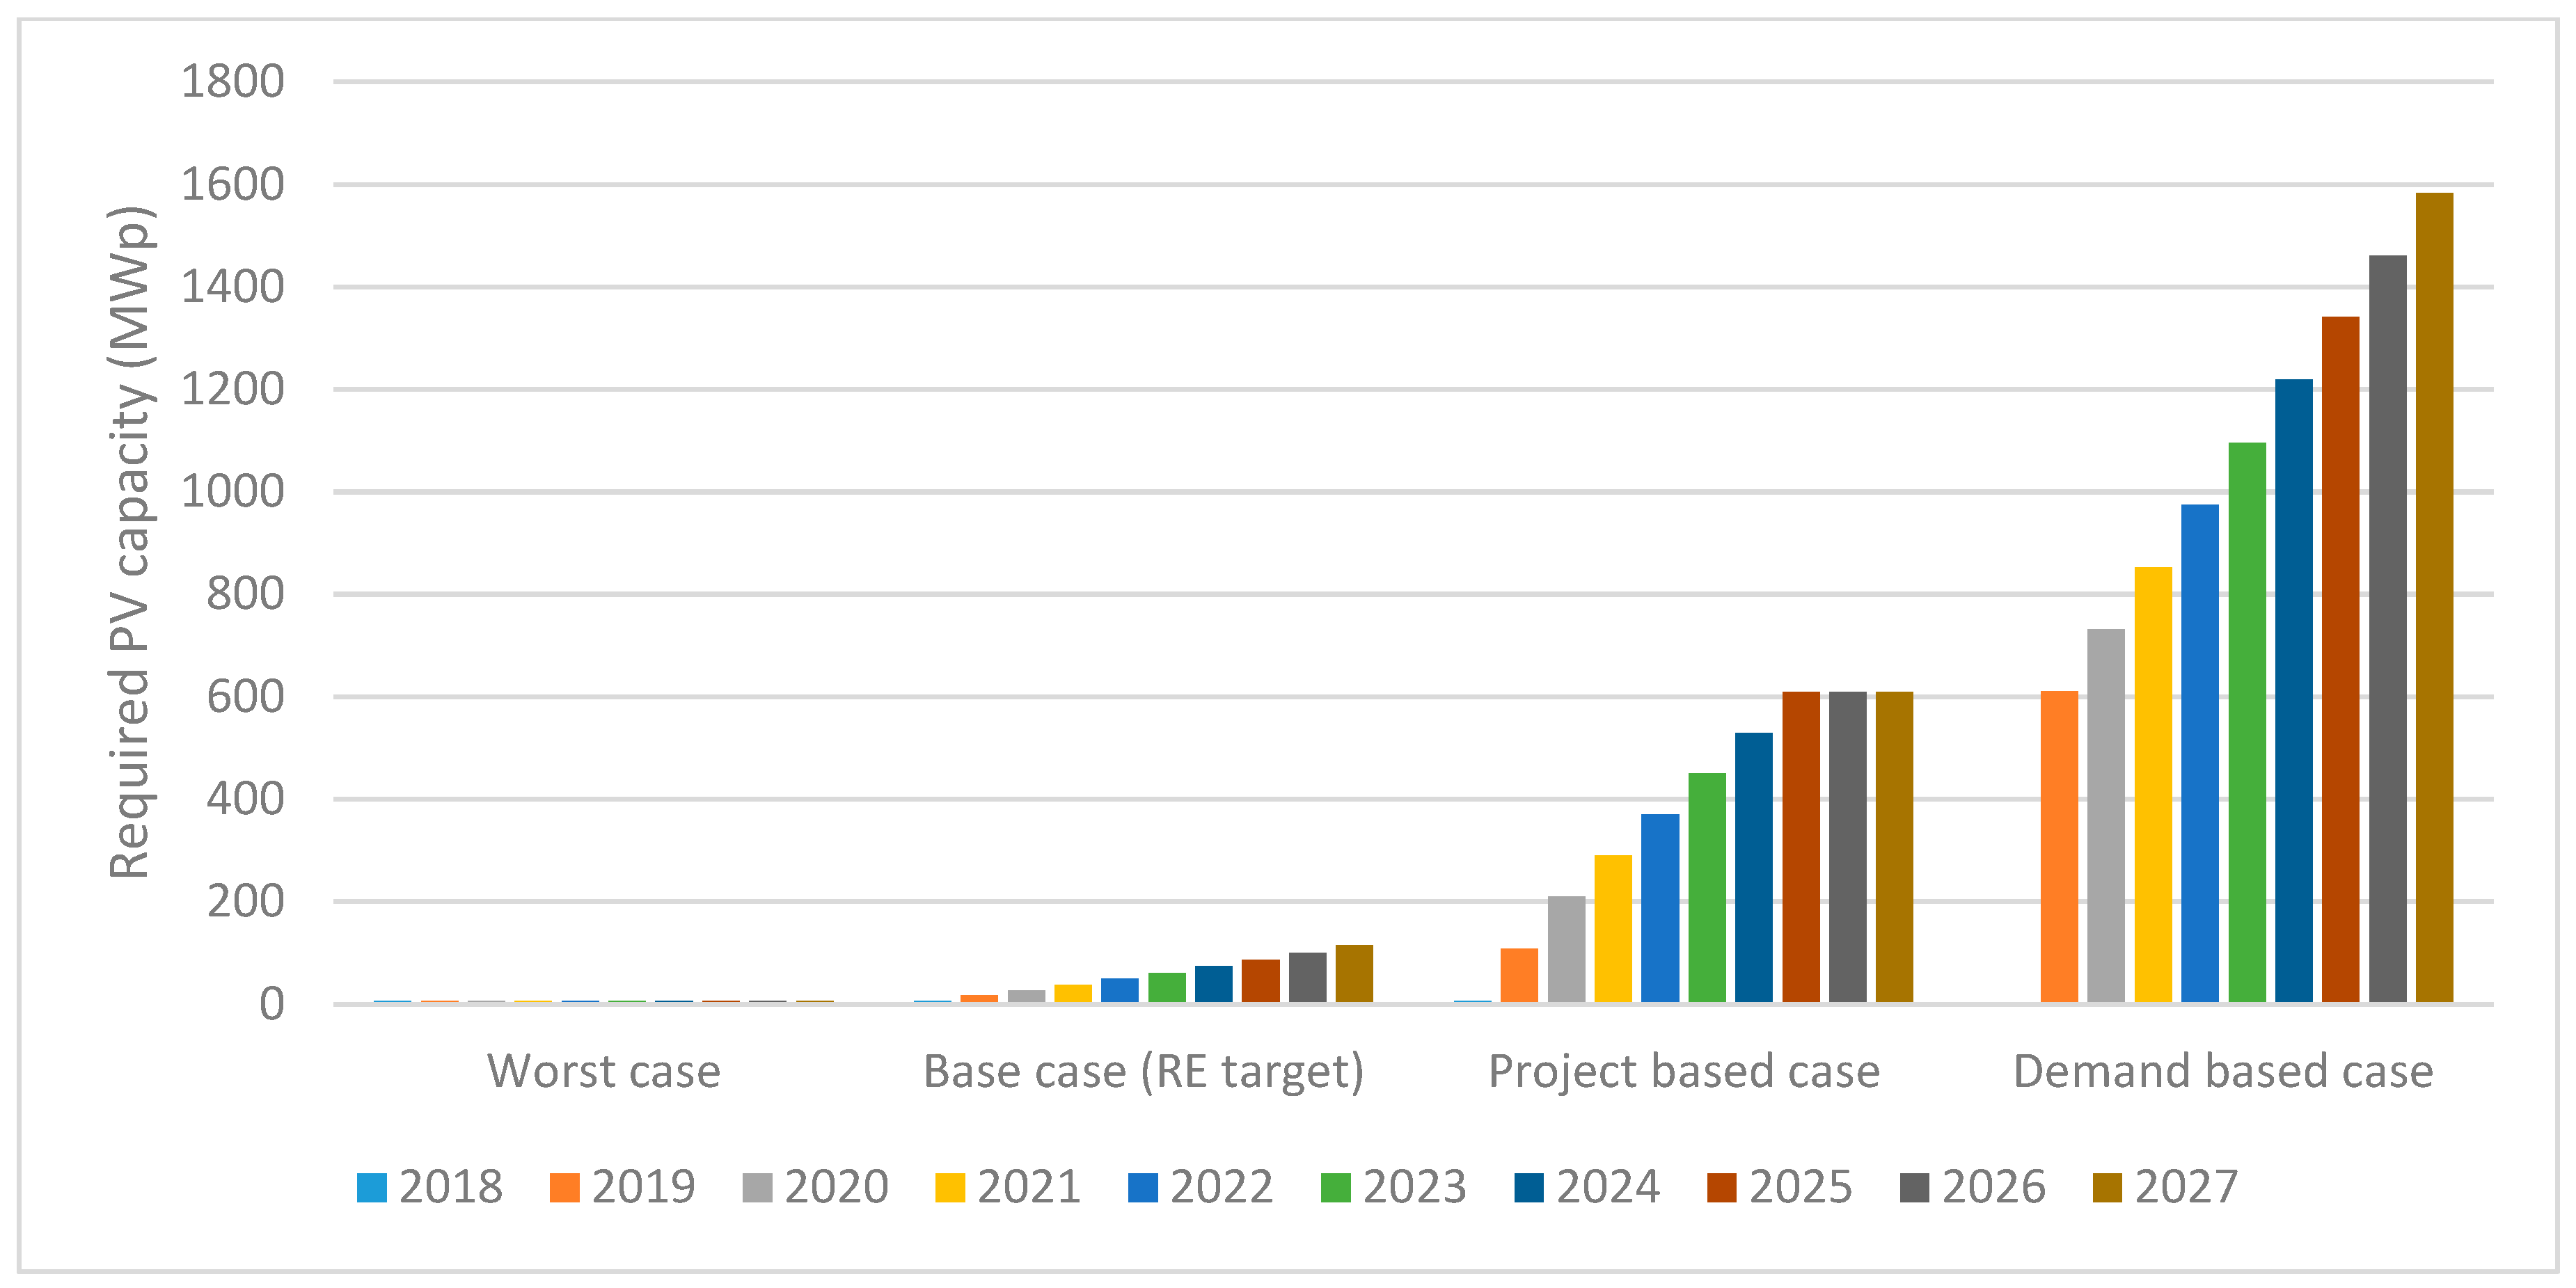
The current installed PV capacity and generated PV electricity, which is approximately 10 GWh annually (7 MWp in 2018) and the future potential of PV, based on the 4 scenarios can be seen in
Figure 8 and
Figure 9.
As mentioned earlier, the RE target till 2022 has already been achieved. To achieve the RE target of 2027, 47% of the total power capacity must be generated through RE sources. In order to achieve this, only with PV system installations, approximately 110 MWp more PV capacity must be installed till 2027, compared to the installed PV capacity at this moment (2018). With this, an additional PV electrical energy of approximately 160 GWh (in 2027), annually, must be generated compared to 2018. In case, all the planned PV projects will be executed in the near future, PV will have a great share in electricity generation in Suriname. Till 2027, there will be approximately 0.8 TWh annually available of PV electricity (project based case). The additional PV capacity will be around 600 MW in 2027 according to the project based case.
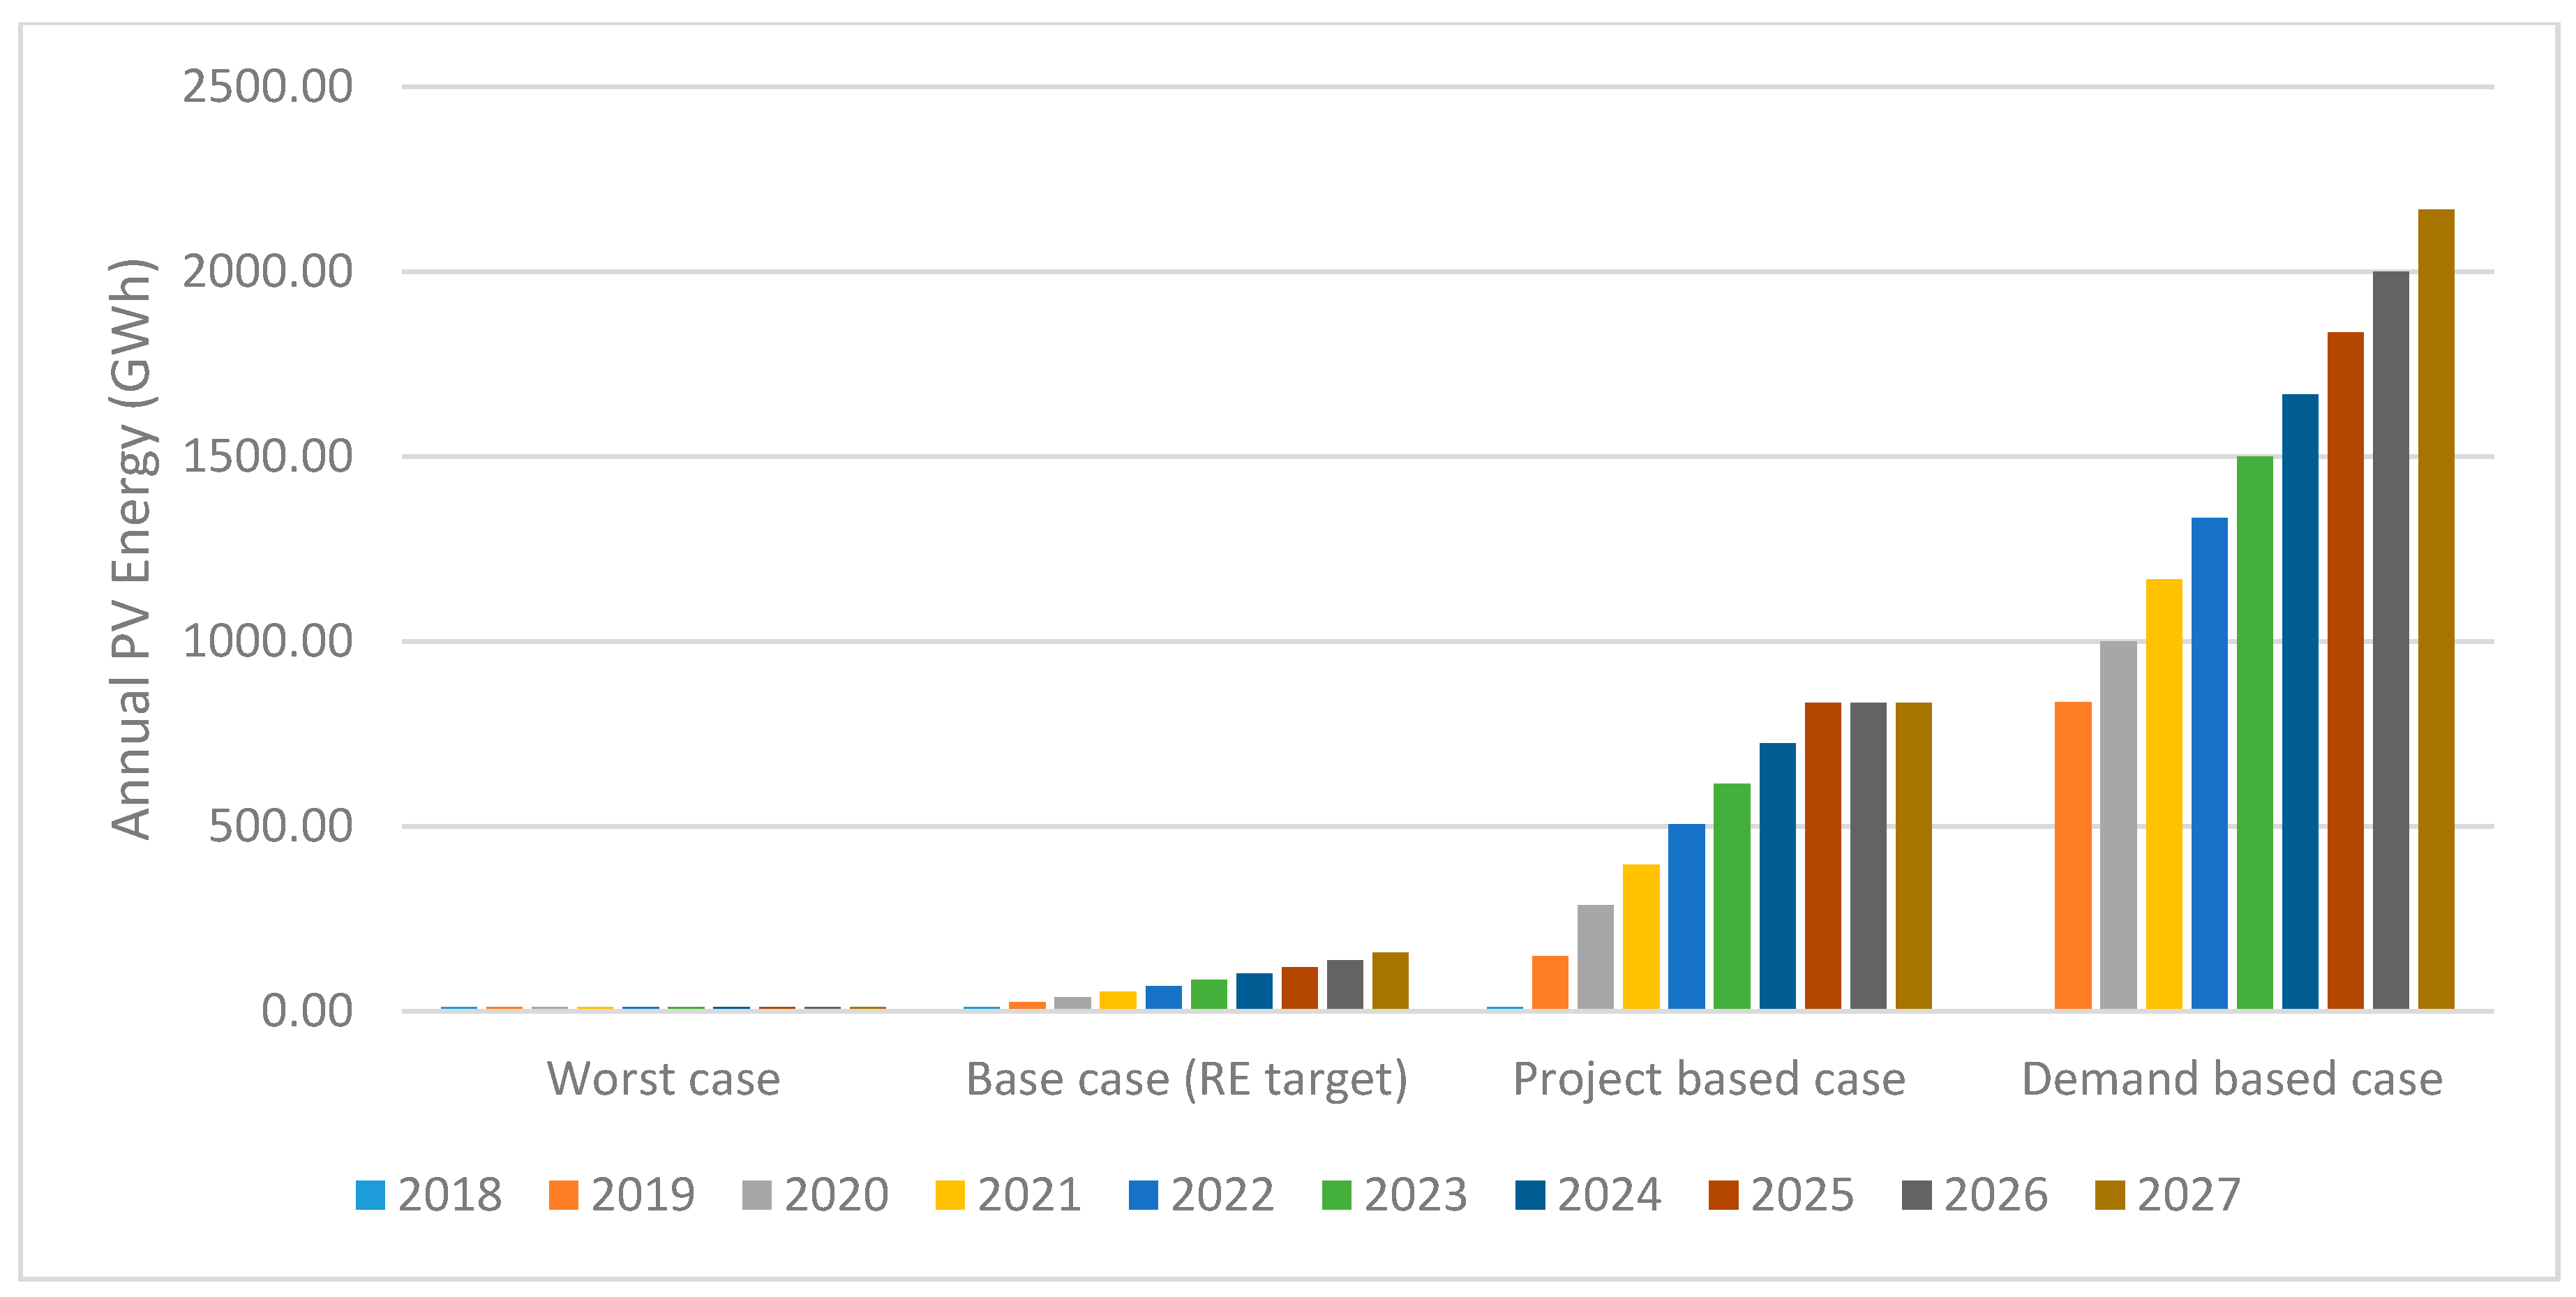
From
Figure 7 and
Figure 9 it can be seen that in 2027 and additional of approximately 2.2 TWh will be required to meet the electricity demand. With the project based case 0.8 TWh PV electrical energy annually will be available while with the base case only 165 GWh will be available. So, with this scenarios the future energy demands will not be covered. To meet the total electricity demand in Suriname till 2027 with only PV, 2.2 TWh must be generated using PV systems. This means that about 1.6 GW new PV capacity must be installed to meet the demand (demand based scenario).
It is also estimated that the power demand will increase by approximately 500 MW in 2022. With the project based scenario around 360 MWp will be added in 2022 compared to 2018. With the base case, only 40 MWp PV capacity will be added. While, with the demand scenario 0.97 GW additional PV capacity will be added in 2022. So, to meet the demand of 2022 and 2027, the demand scenario (scenario 4) needs to be executed in Suriname. If the base case or project based scenario are executed than the PV capacity will not be enough to meet the demand. Though, more PV systems with more capacity or other RE power plants will be required to be implemented in Suriname.
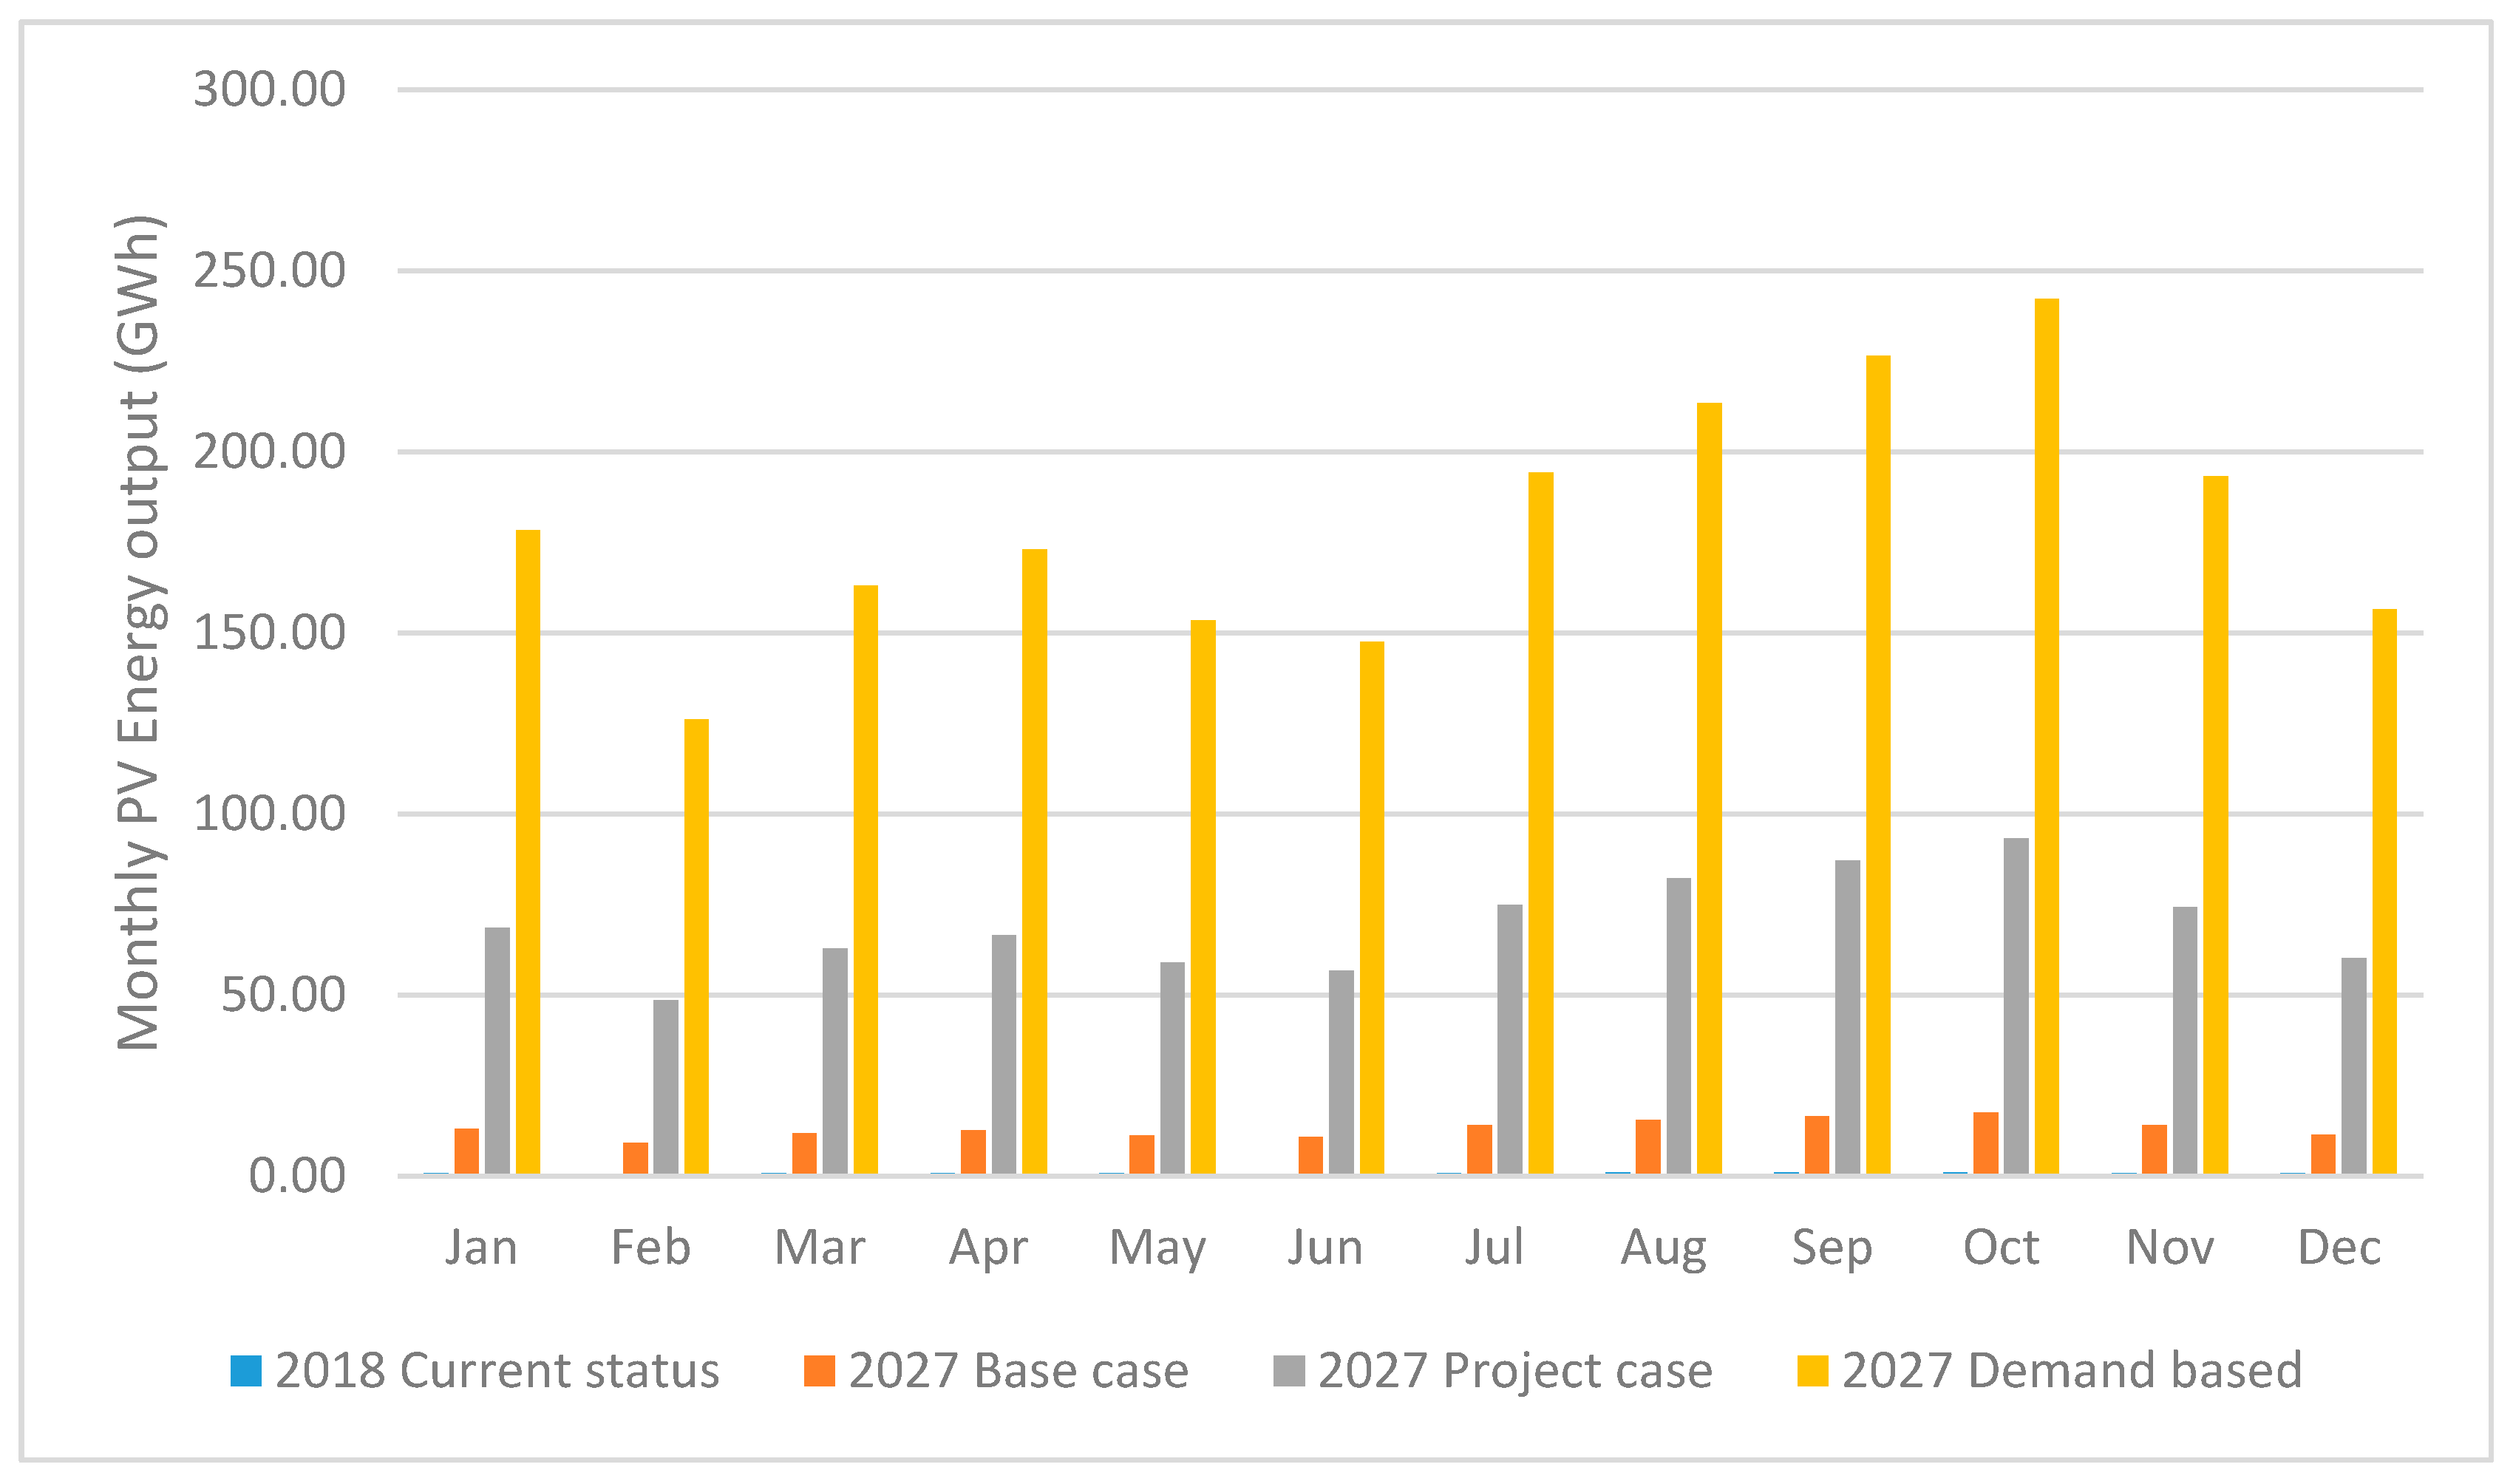
The monthly generated electrical energy for respectively 2018 and 2027, has also been calculated for the four scenarios (
Figure 10). For the worst case scenario which is the same as the current situation (2018), the monthly generated PV electrical energy varies between 0.5 GWh and 1 GWh per month. For the base case in 2027, the generated PV electrical energy will vary between 9 GWh (in Feb) and 18 GWh (in Oct) per month while for the project based case it will vary between 48 GWh to 93 GWh in 2027. With the demand scenario, it will vary between 126 GWh (Feb) and 242 GWh (Oct).
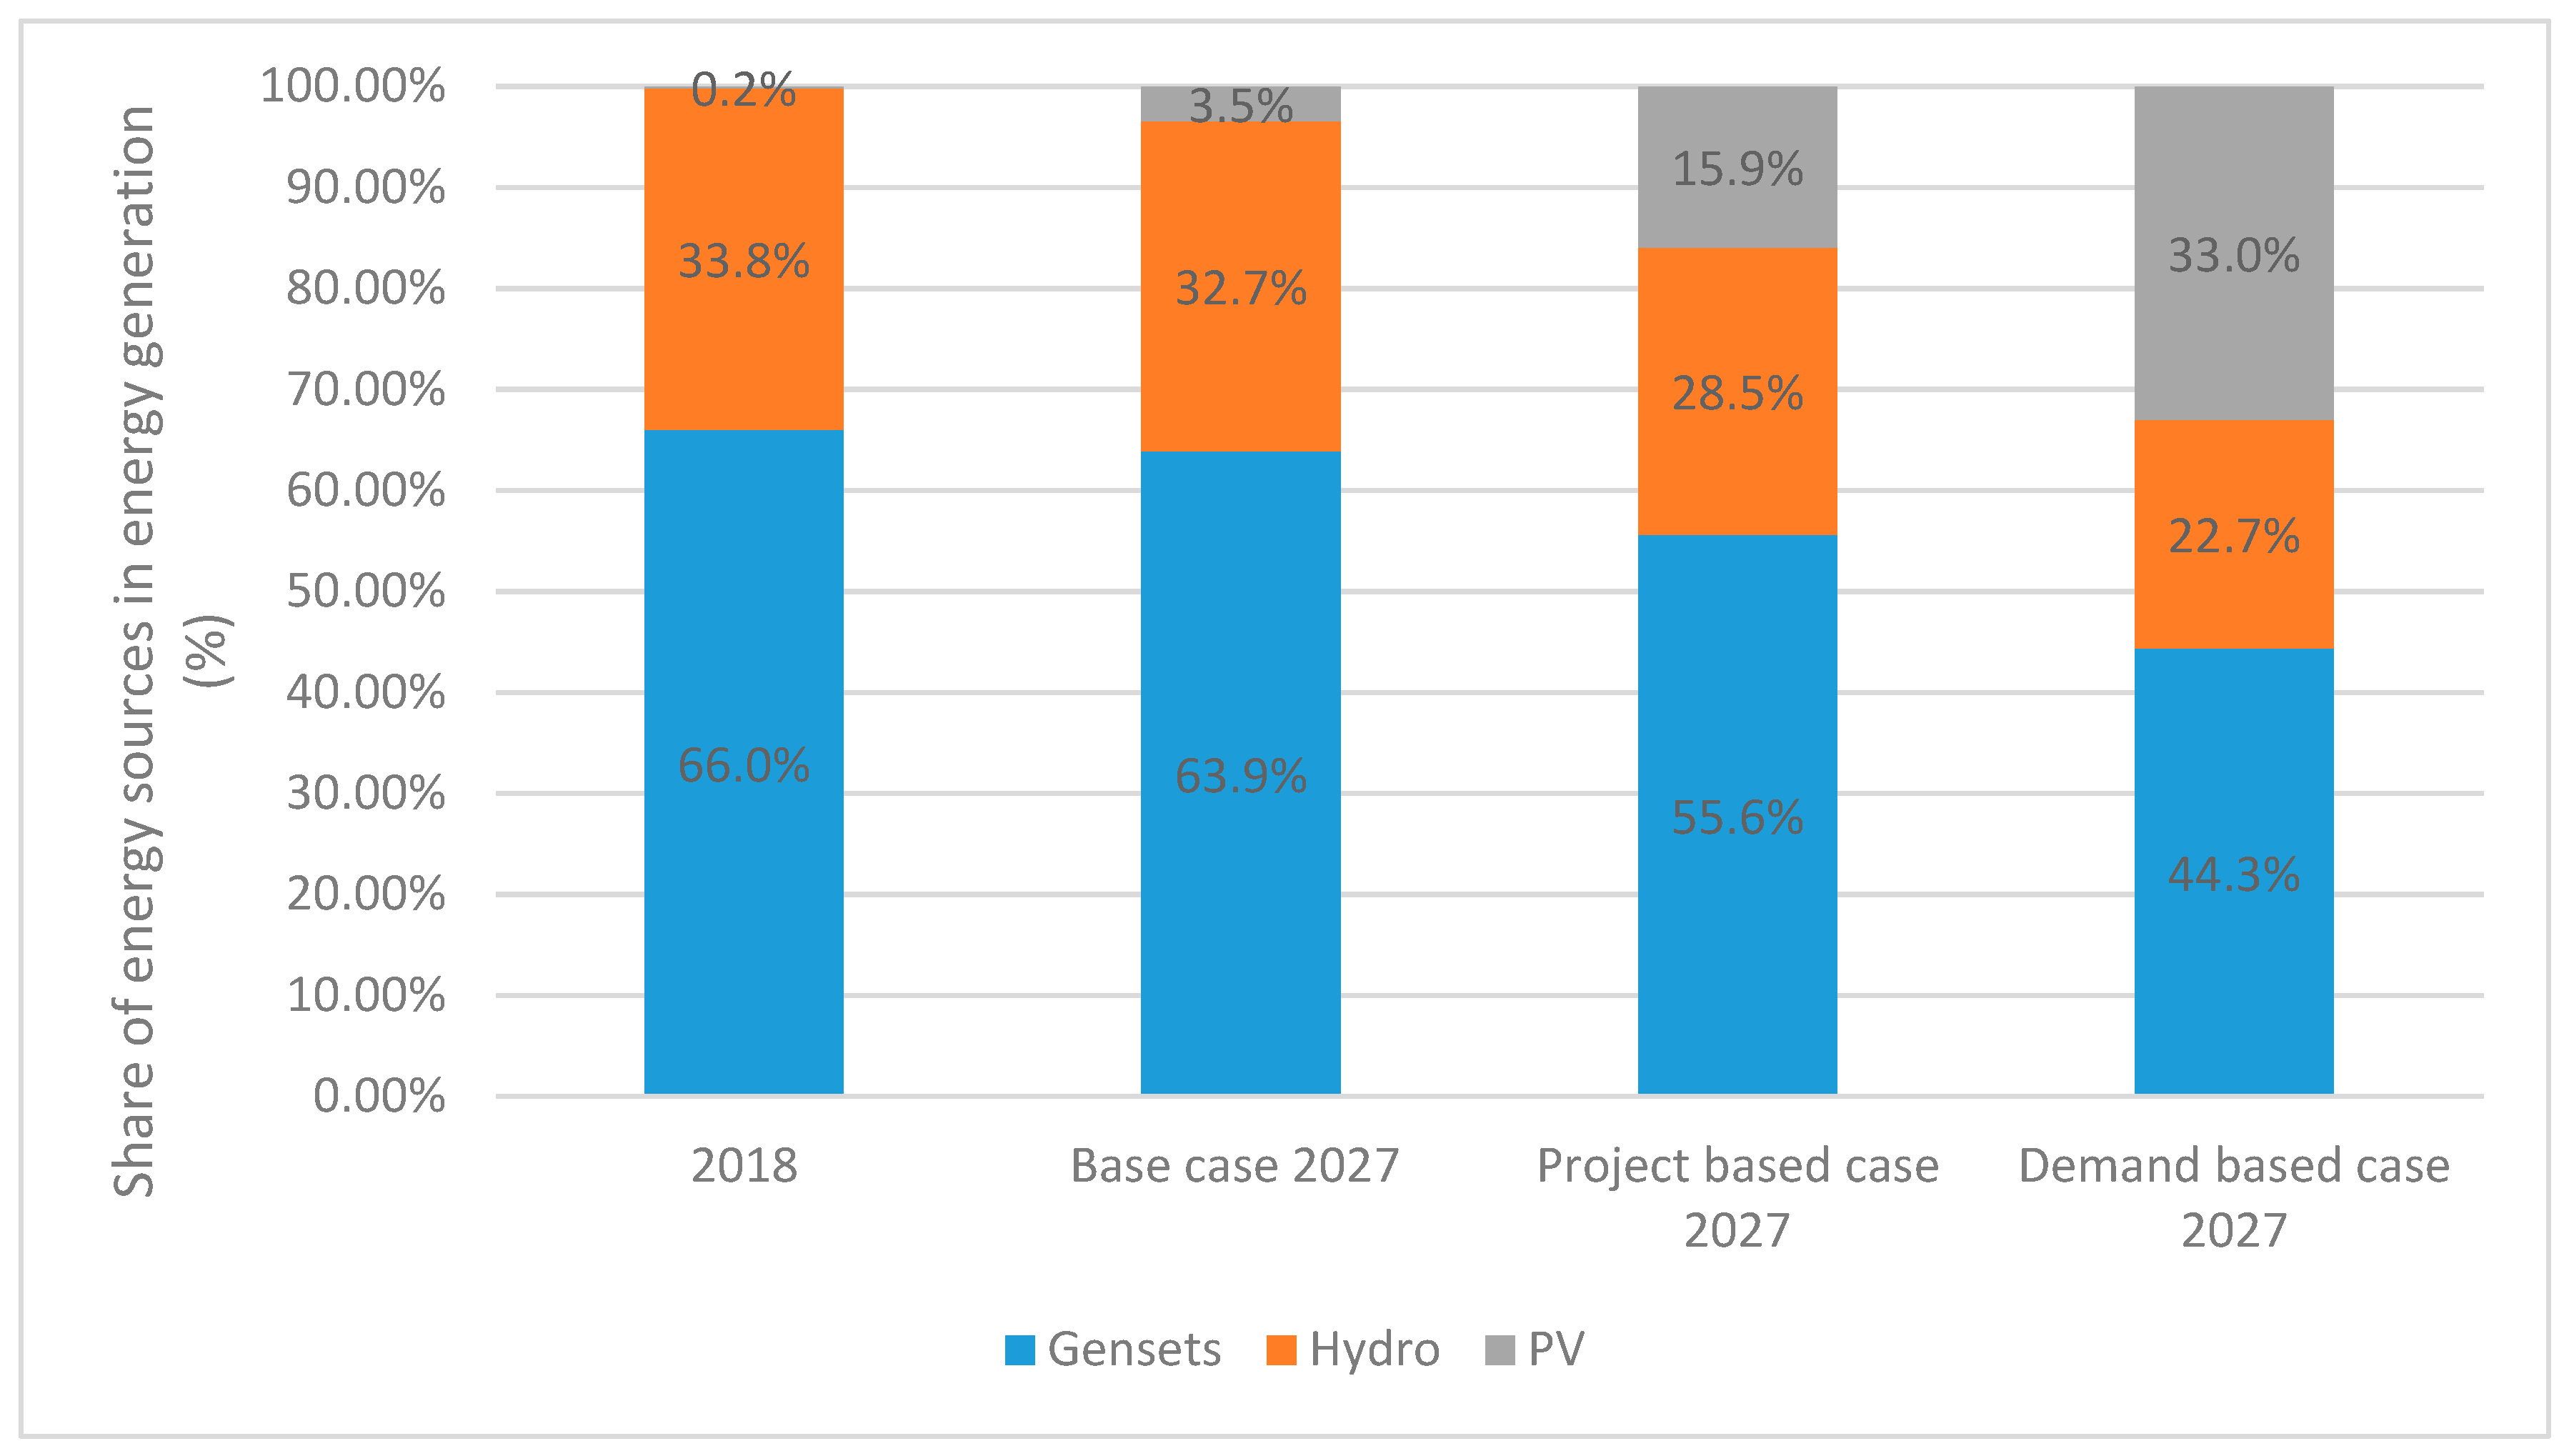
Suppose if one of the scenarios (1, 3 or 4) will be executed in the future than PV will have a great share in the electricity generation and the future energy demand can be met partly (scenarios 1 and 3) or fully (scenario 4). If the installed capacity of diesel/HFO and hydro remains the same as in 2018, while the base-, project- or demand case scenario will be executed in Suriname, than the share of each energy source can be seen in
Figure 11. The calculated annual PV energy output (GWh) of 2018 and 2027, given in
Figure 9, has been used to calculate the percentages. The annual generated electricity (GWh) by the gensets and hydro has been taken the same as in 2018 (this is one of the assumptions for the analysis of the scenarios). The share of PV will increase from nearly 0% to 3% if the base case is executed while it will increase with 16% (in 2027) if the project based scenario is executed. With the demand scenario, the share of PV will increase with 33% while RE will have a share of 56% (2027) in the electricity generation. The share of diesel/HFO will decrease from 66% to 64% for the base case and will further reduce to 44% (2027) if the demand scenario will be executed. With all the scenarios the share of renewable energy will be increased accordingly while the share of diesel/HFO will decrease.
6.2. Energy Transition with PV and Hydro in Suriname
The energy transition in Suriname is also possible with a combination of different RE sources namely PV and hydro. These two RE sources have already been successfully implemented in Suriname. Governmental- and non-governmental institutes have also plans to deploy these RE sources in the near future through several prospective projects. A forecast for the electrical energy potential has been made using the prospective hydro and PV projects, taking into account the following assumptions:
The total installed capacity of the power plants using Diesel/HFO engine gensets will remain the same in the near future, as in 2018.
The total installed capacity of PV and hydro will increase in accordance to the projects that are planned within the next coming years.
The selected RE sources with planned projects are [
15,
17,
23]:
Using the above-mentioned information, a forecast has been done for the energy transition using selected RE sources from 2018 till 2027.
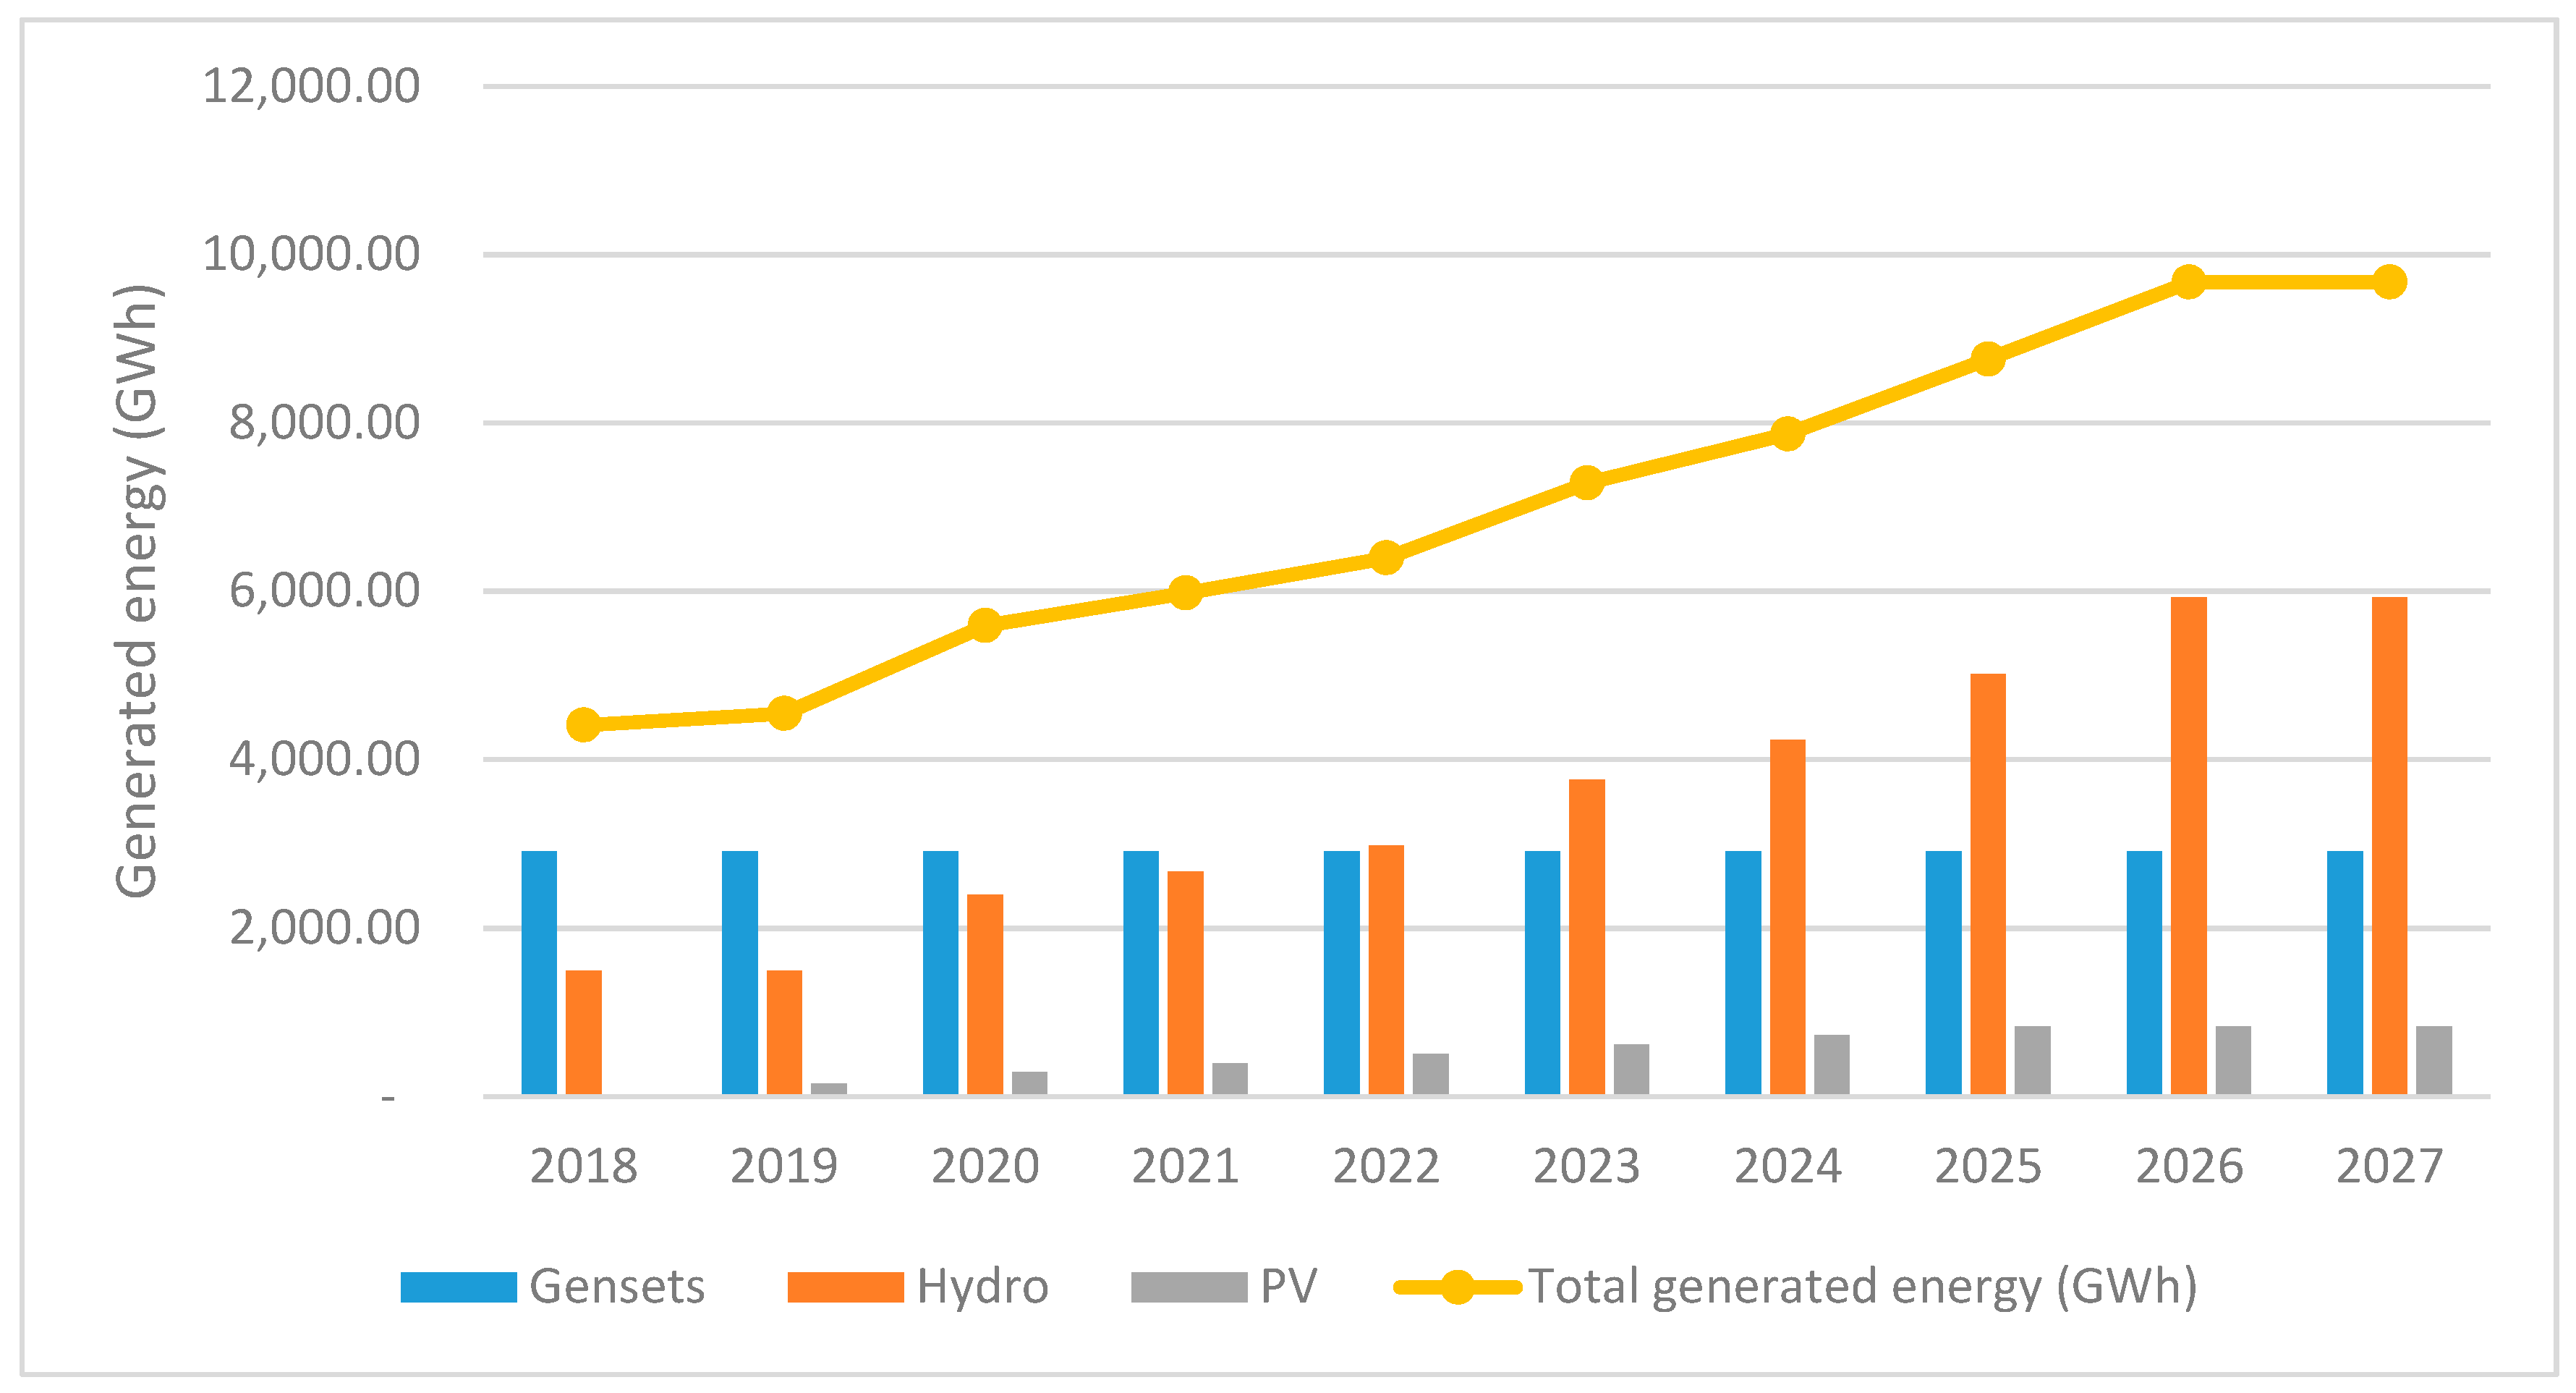
From
Figure 12 it can be seen that the share of the diesel/HFO will decrease from 66% (2018) to 30% (2027) if the PV and hydro projects are implemented in the near future. Hydro will have the biggest share in electricity generation (2027) followed by diesel/HFO power plants. If in the future the 3 hydro projects will be executed than nearly 560 MW extra hydro capacity will be available while through PV projects nearly 600 MWp will be available. The share of RE will be 70% in 2027, which is 36% more compared to 2018. The generated electrical energy will be around 9.7 TWh in Suriname with all the new RE projects, which means an additional of nearly 1160 MW capacity and 5.3 TWh additional electrical energy annually compared to 2018. With this, the electricity demand can be covered totally. Abundant electrical energy will be produced and available in Suriname, in case all planned projects of PV and hydro will be executed in the near future. But from previous studies it is known that hydro power plants have some negative impacts on the environment like displacement and loss of livelihood (especially fisheries), biodiversity loss, changes in water quality and greenhouse-gas emissions. It has also some negative social impacts like relocation of people [
26,
27]. However, these negative impacts are not found with PV power plants. From
Figure 4 it can be seen that Suriname has enough solar irradiance which makes it possible to execute PV projects on small and large scale to meet the energy demand in the coastal area as well as in the interior where there is no existing grid and no proper infrastructure.
As it can be seen from this study that PV and hydro have great potential in Suriname. Several PV and hydro power systems have already been installed and have been operating properly in Suriname in the past years. In Suriname, the energy transition to 100% renewable energy is possible especially using PV and hydro. While, the diesel/HFO engine gensets can be used for backup or for the base load or to cope with instabilities during the output fluctuations.
As all studies, this study has also some limitations. The estimations of the power capacities and the electricity generation can be improved if exact and up to date data is known and available. With this, the uncertainties can be removed and the accuracy can be improved when making predictions or forecasting. Also, for the project based PV and hydro scenario it is assumed that all the projects will be executed but in reality, those projects can take more time for implementation and it is also possible that some of them will not be executed at all. Besides these, power quality issues have not been considered in this study but this is an important research area which requires special attention and probably another extensive study, when injecting PV and hydro on large scale (in megawatts) into the existing grid.
7. Conclusions
In Suriname, fossil fuel (diesel/HFO) has a share of 64% while renewables has 36% share in the power capacity. The most commonly used renewable sources for electricity generation in Suriname are hydroelectric energy (35% share) and PV (1% share). The electricity tariffs in Suriname are low compared to other countries in the Caribbean region because of the heavy subsidy given by the Government. The energy demand increases in Suriname with 8% to 10% annually. It is expected that in 2022 an additional power of 500 MW and in 2027 an additional electrical energy of 2 TWh will be required to meet the energy demand in Suriname. Several scenarios has been explored in this study to investigate how to meet this demand and to achieve the renewable energy targets which has Suriname committed to as a CARICOM member. The focus of this study was on PV systems as there is enough irradiance in Suriname and several PV systems have been implemented successfully. The RE targets of 2017 and 2022 have already been achieved because thirty six percent (36%) of the power capacity is already being generated using renewables. However, the RE target of 2027 must be achieved yet, which implies that RE must have a share of 47% in the power generation. In order to achieve this with only PV systems, an additional of approximately 110 MWp PV capacity will be required till 2027. This will result in an additional electrical energy generation of around 160 GWh annually. Further, Governmental and non-governmental institutes have planned several PV projects with a total capacity of approximately 600 MWp, if these projects will be executed in the near future than an additional electrical energy of approximately 0.8 TWh will be available annually which will help to meet the energy demand in the future. But with the abovementioned additional PV capacities, the power demand of additional 500 MW in 2022 and the energy demand of 2.2 TWh in 2027 will not be met fully. To meet the power and energy demands of 2022 and 2027 additional PV projects or other RE projects need to be executed in Suriname. Therefore, the demand scenario must be executed in Suriname. Within the demand scenario, 0.97 GW of additional PV capacity will be added in 2022 and 2.2 TWh of annual PV energy (1.6 GWp PV capacity) will be added. As such the power and energy demand of 2022 and 2027 will be met with this scenario. Another option to meet the abovementioned demands is to add hydro power. If all planned PV and hydro projects are executed in the near future than around 9.7 TWh electricity can be generated annually, in Suriname. Which means an additional of nearly 1160 MW capacity and annually 5.3 TWh additional electrical energy will be available compared to 2018. With this, the electricity demand can be covered totally. PV can play an important role in the energy transition of Suriname and can be very beneficial for the people living in the interior as there is no existing grid and proper infrastructure.


