Improvement of Heat Dissipation Characteristics of Cu Bus-Bar in the Switchboards through Shape Modification and Surface Treatment

 ,
,
Abstract
:1. Introduction
2. Experimental Procedures
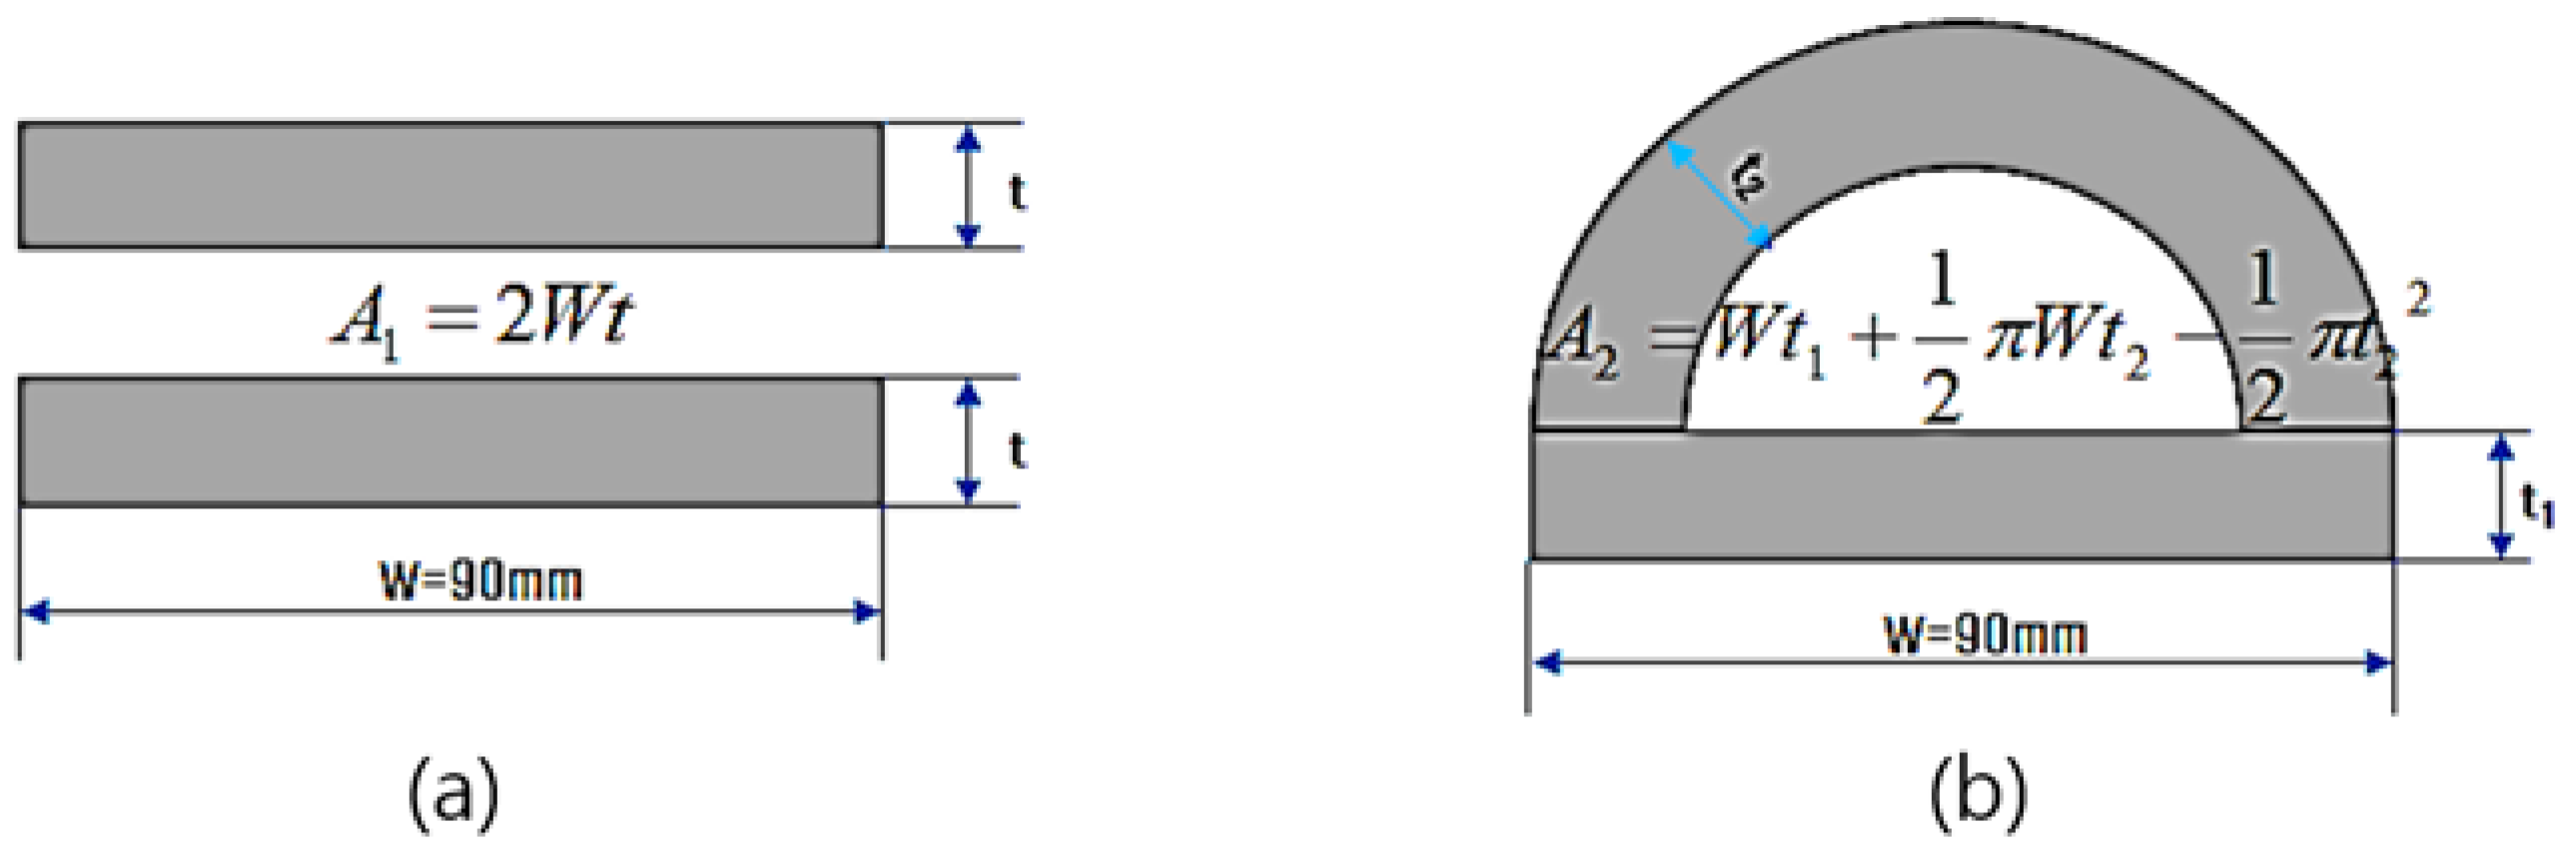
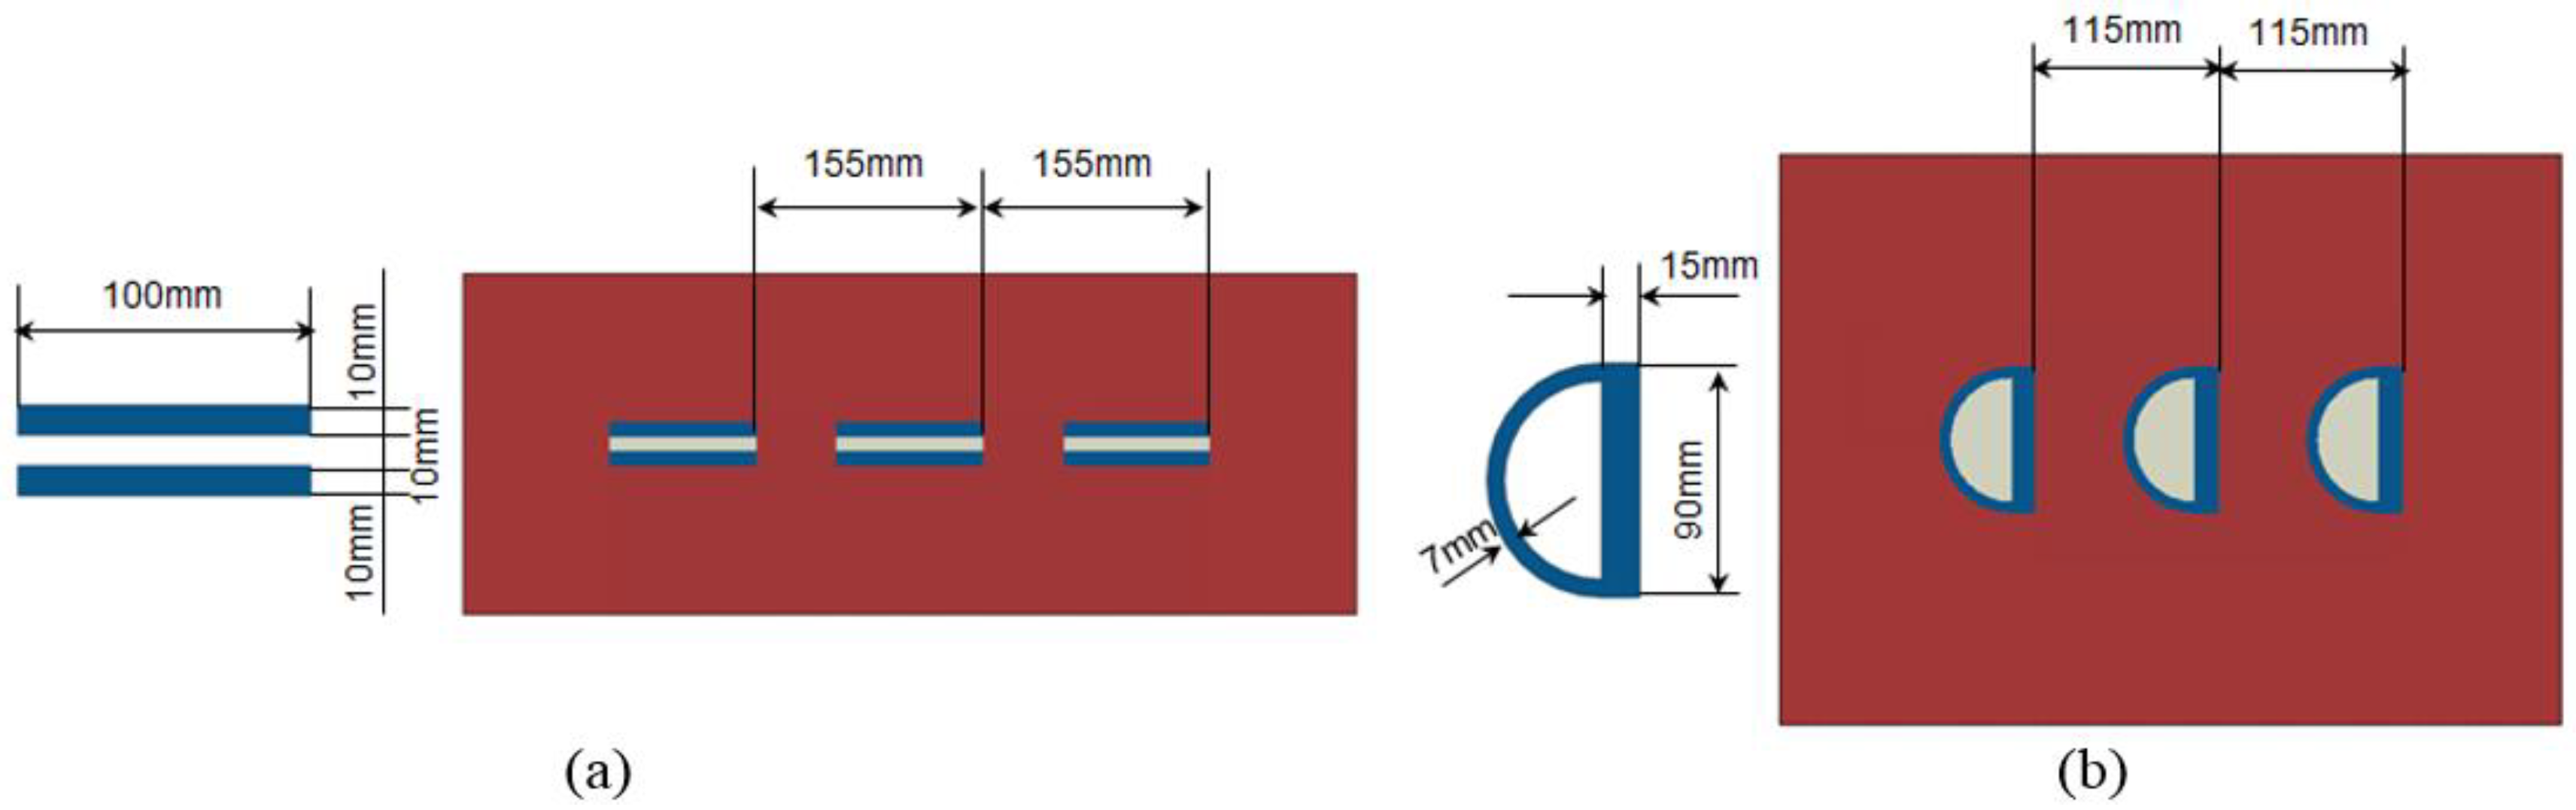
2.1. Electromagnetic and Thermal Analysis Conditions of the Bus-Bar
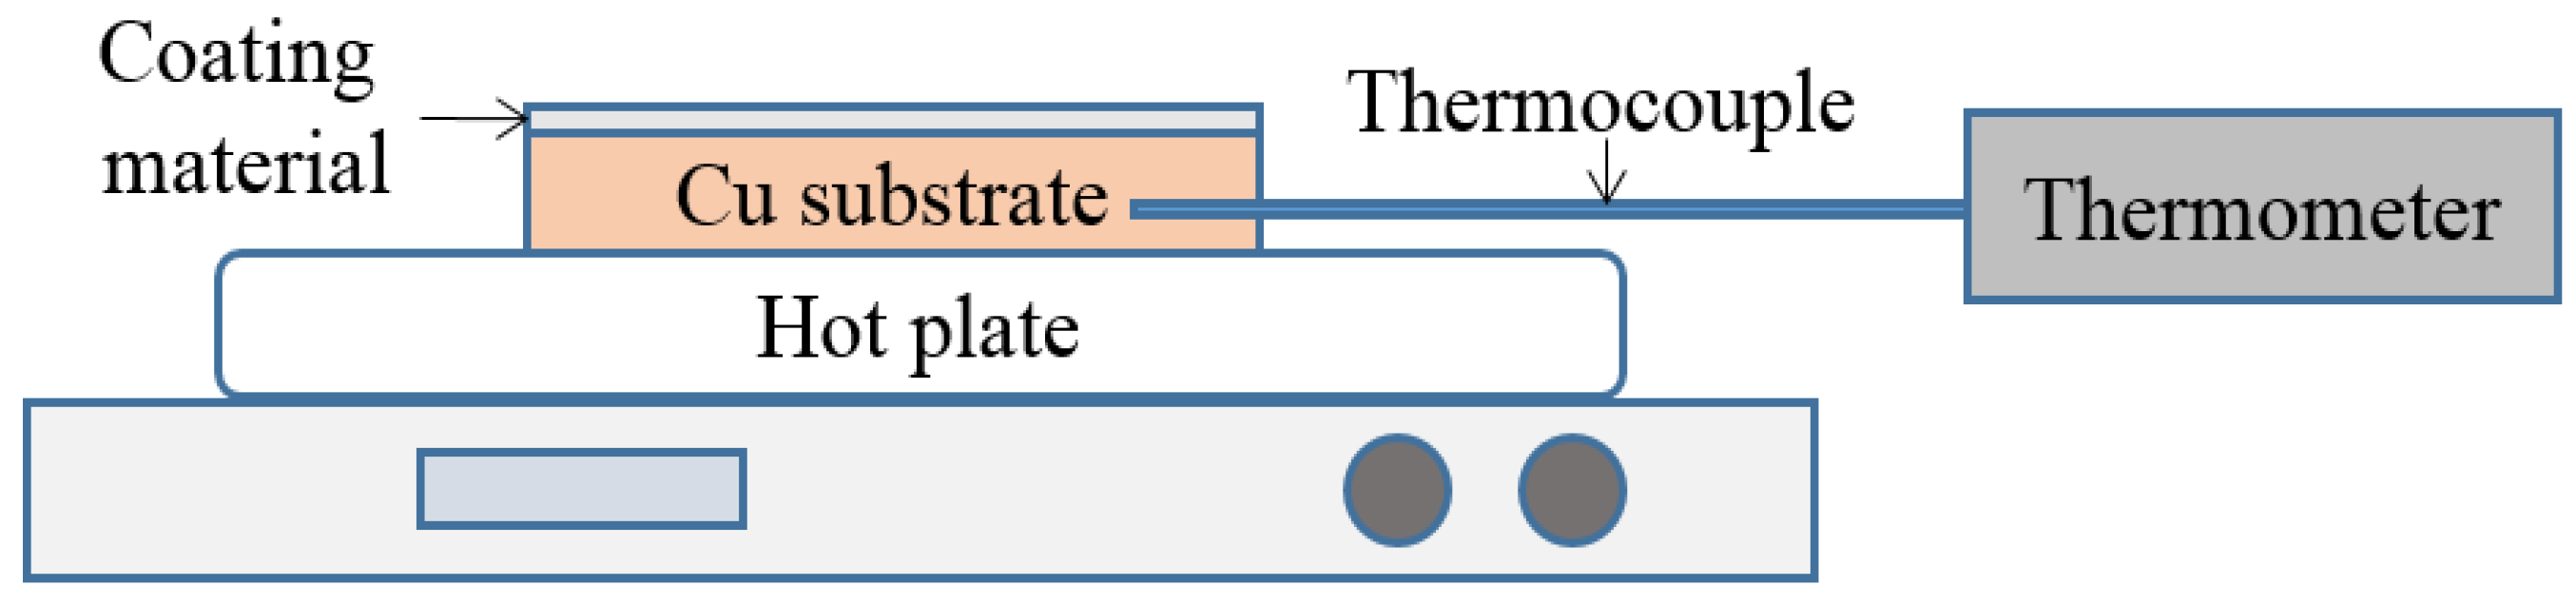
2.2. Evaluation of Properties of Coating for Heat Dissipation
3. Results and Discussion
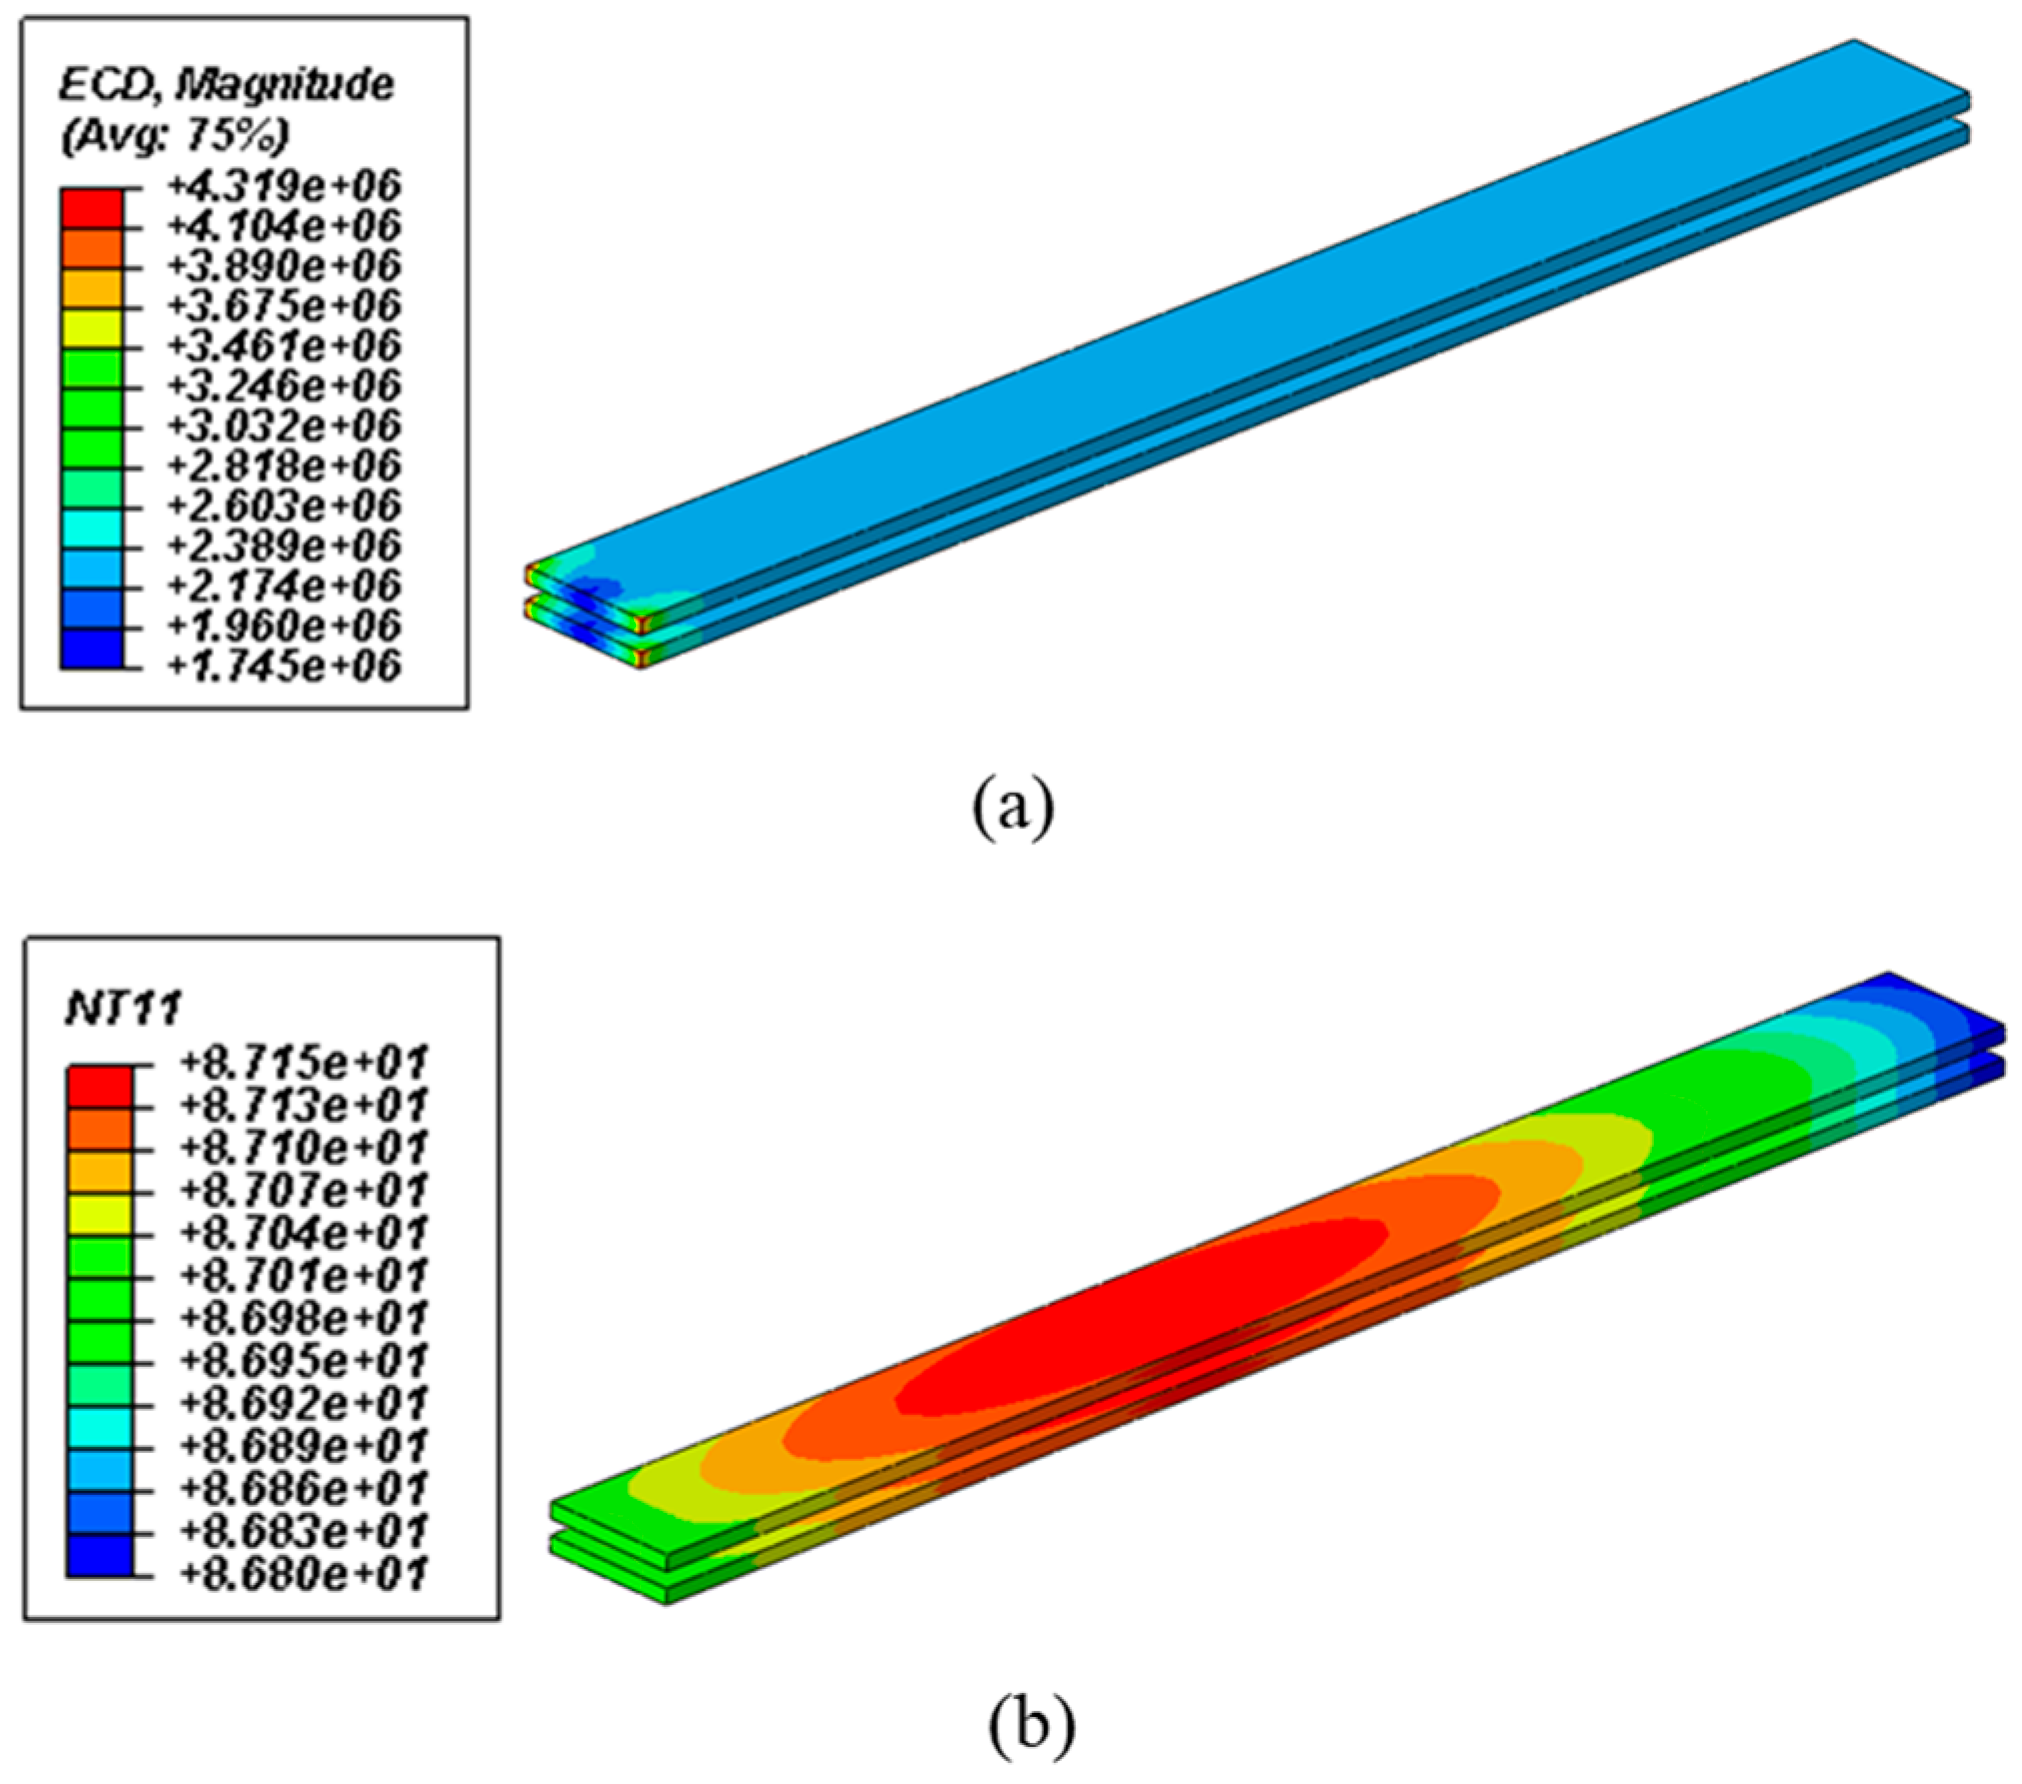
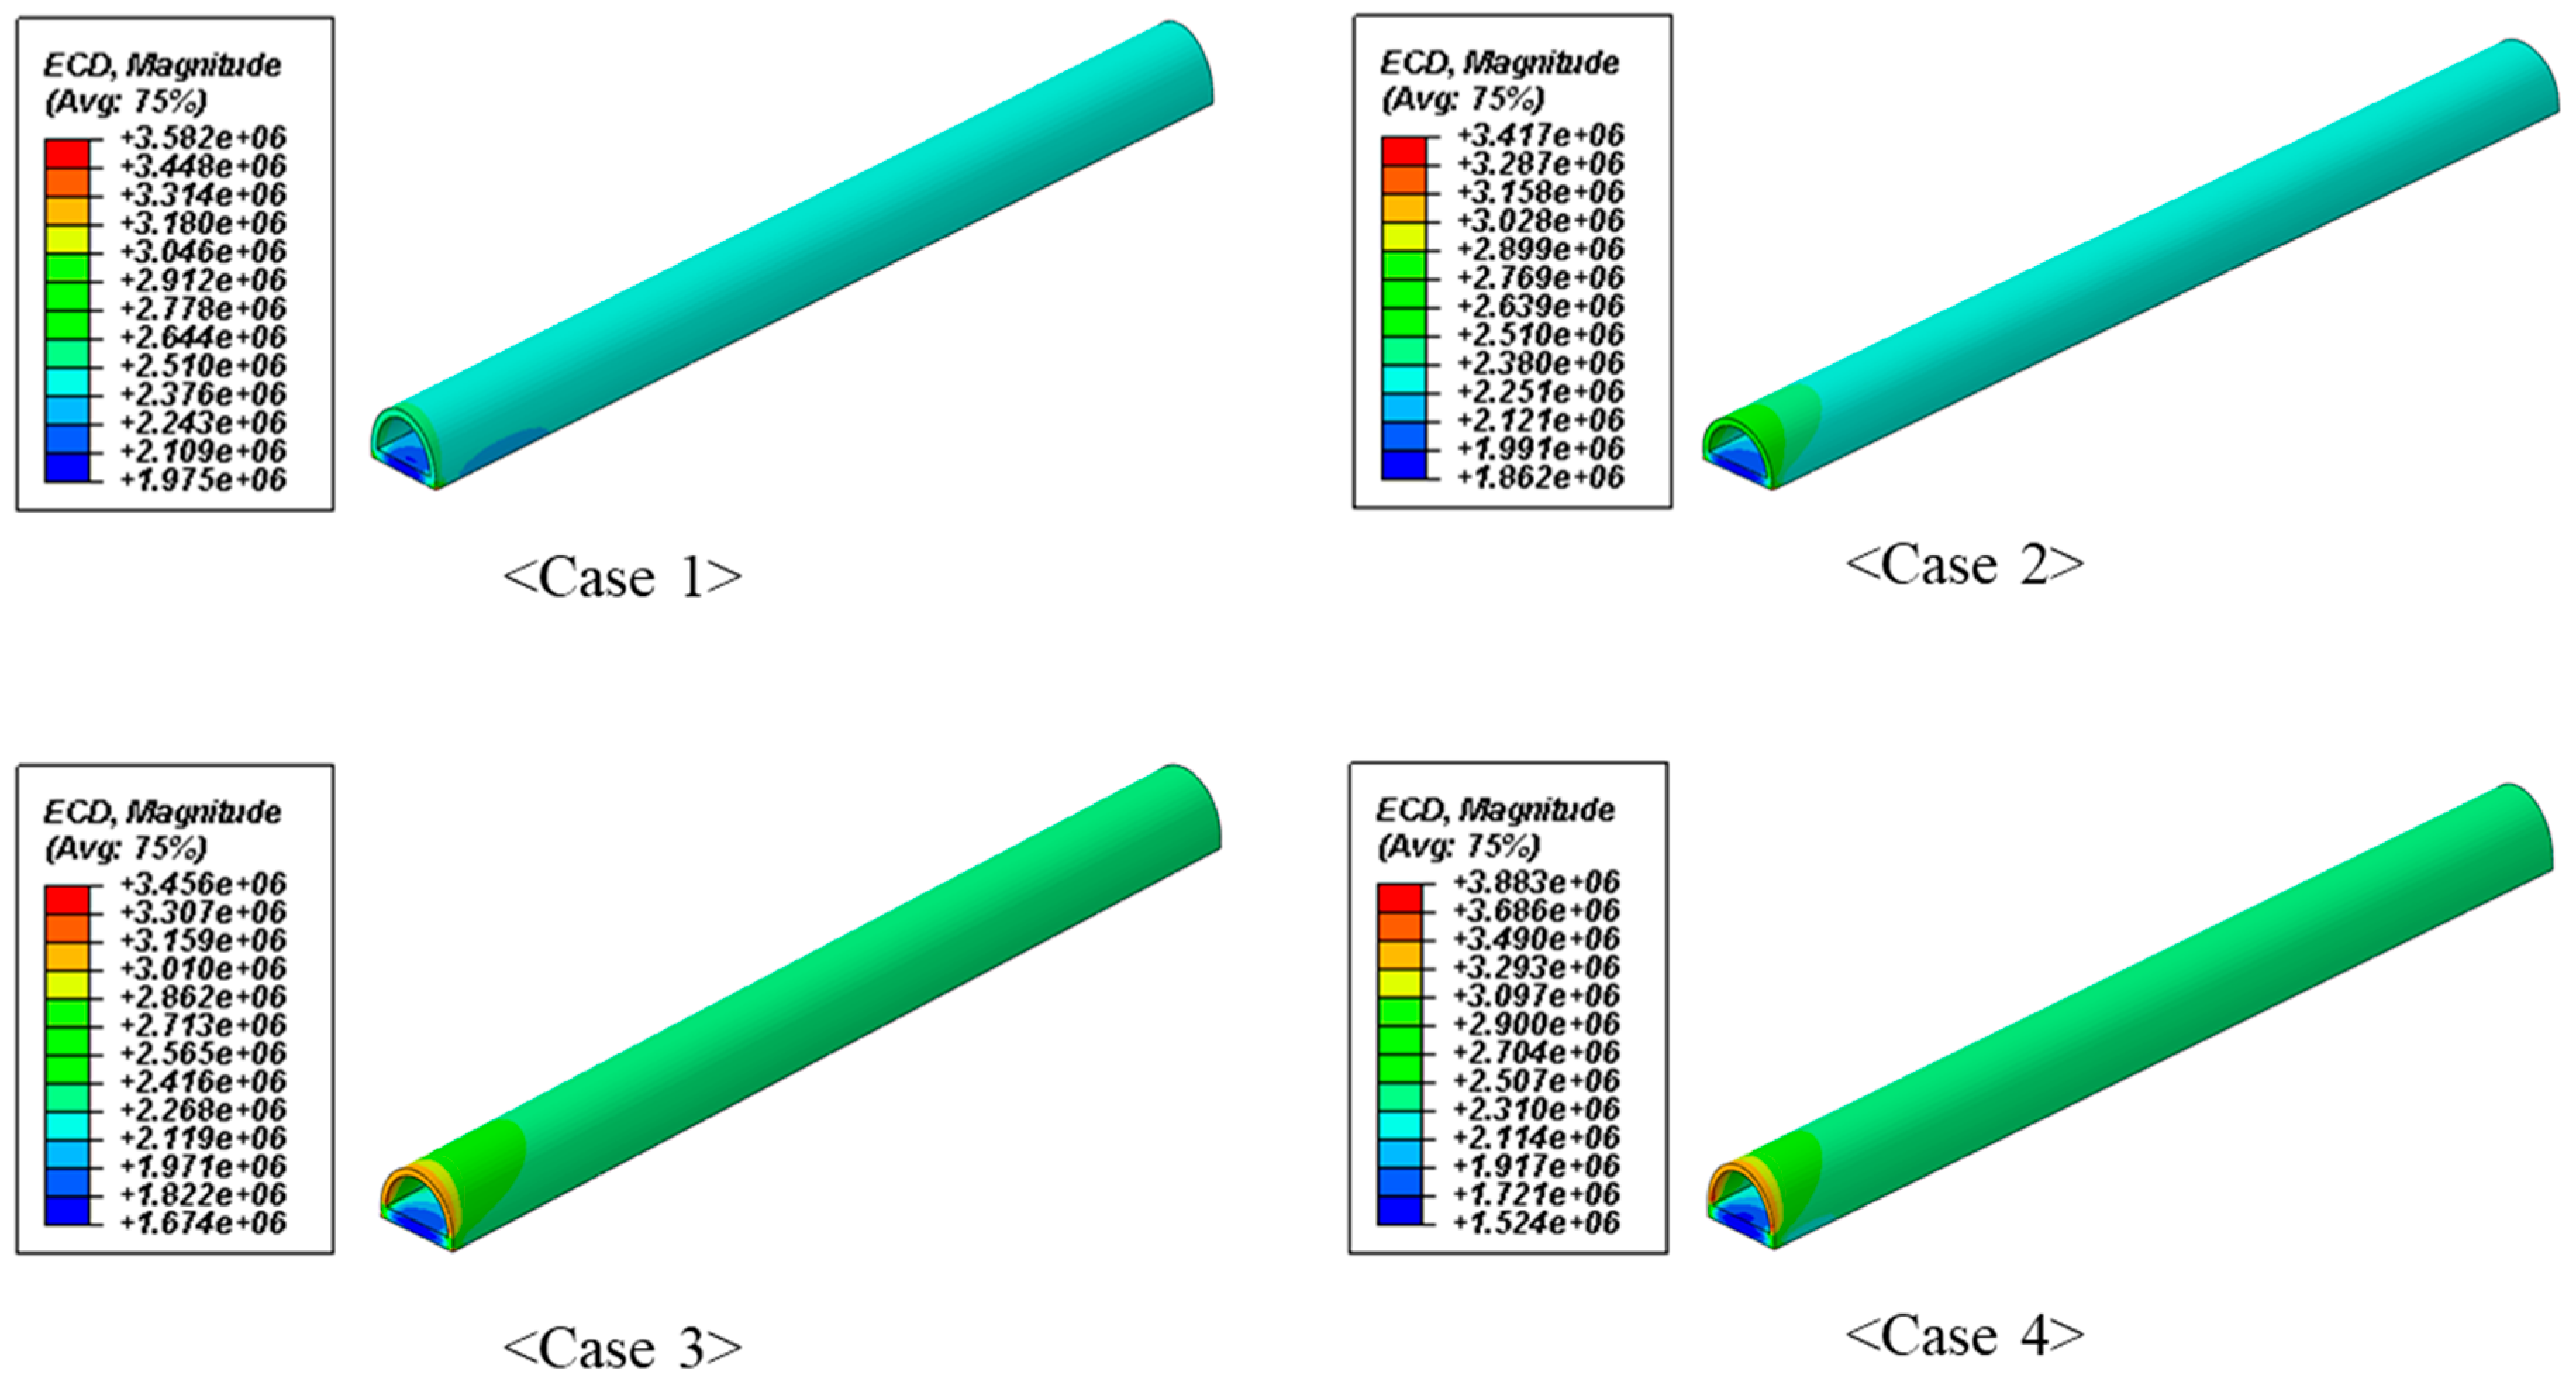
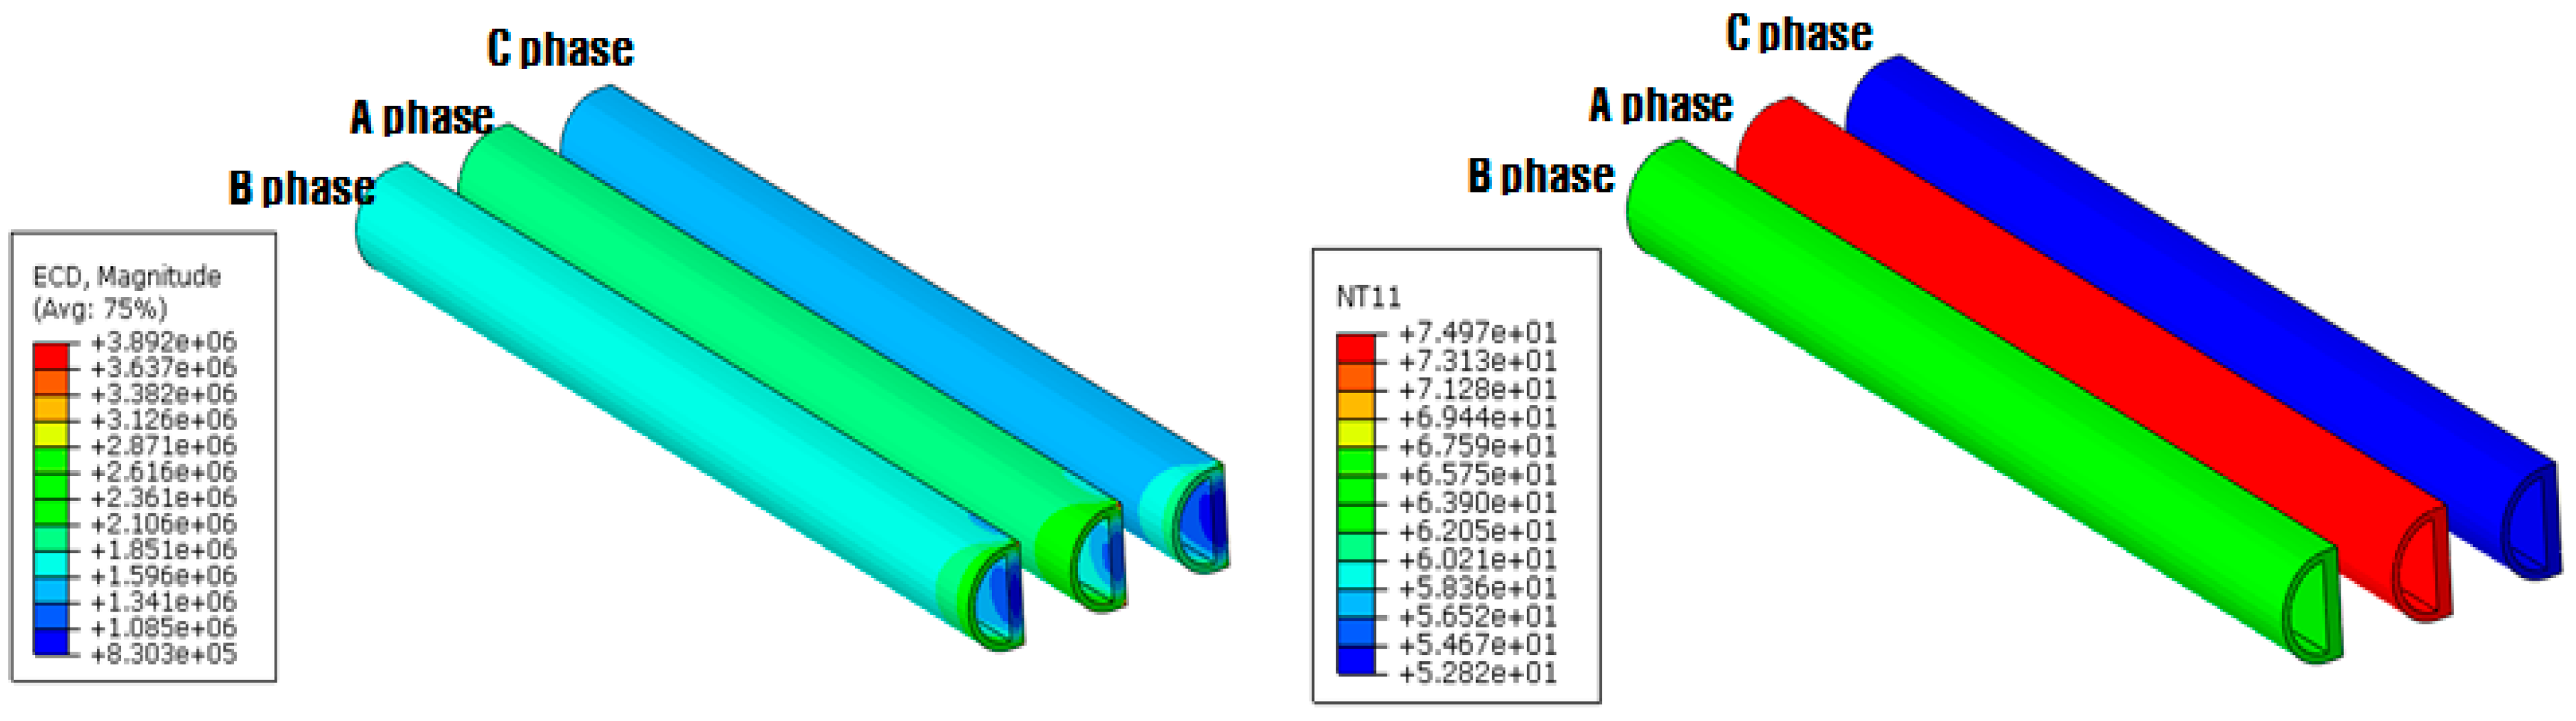
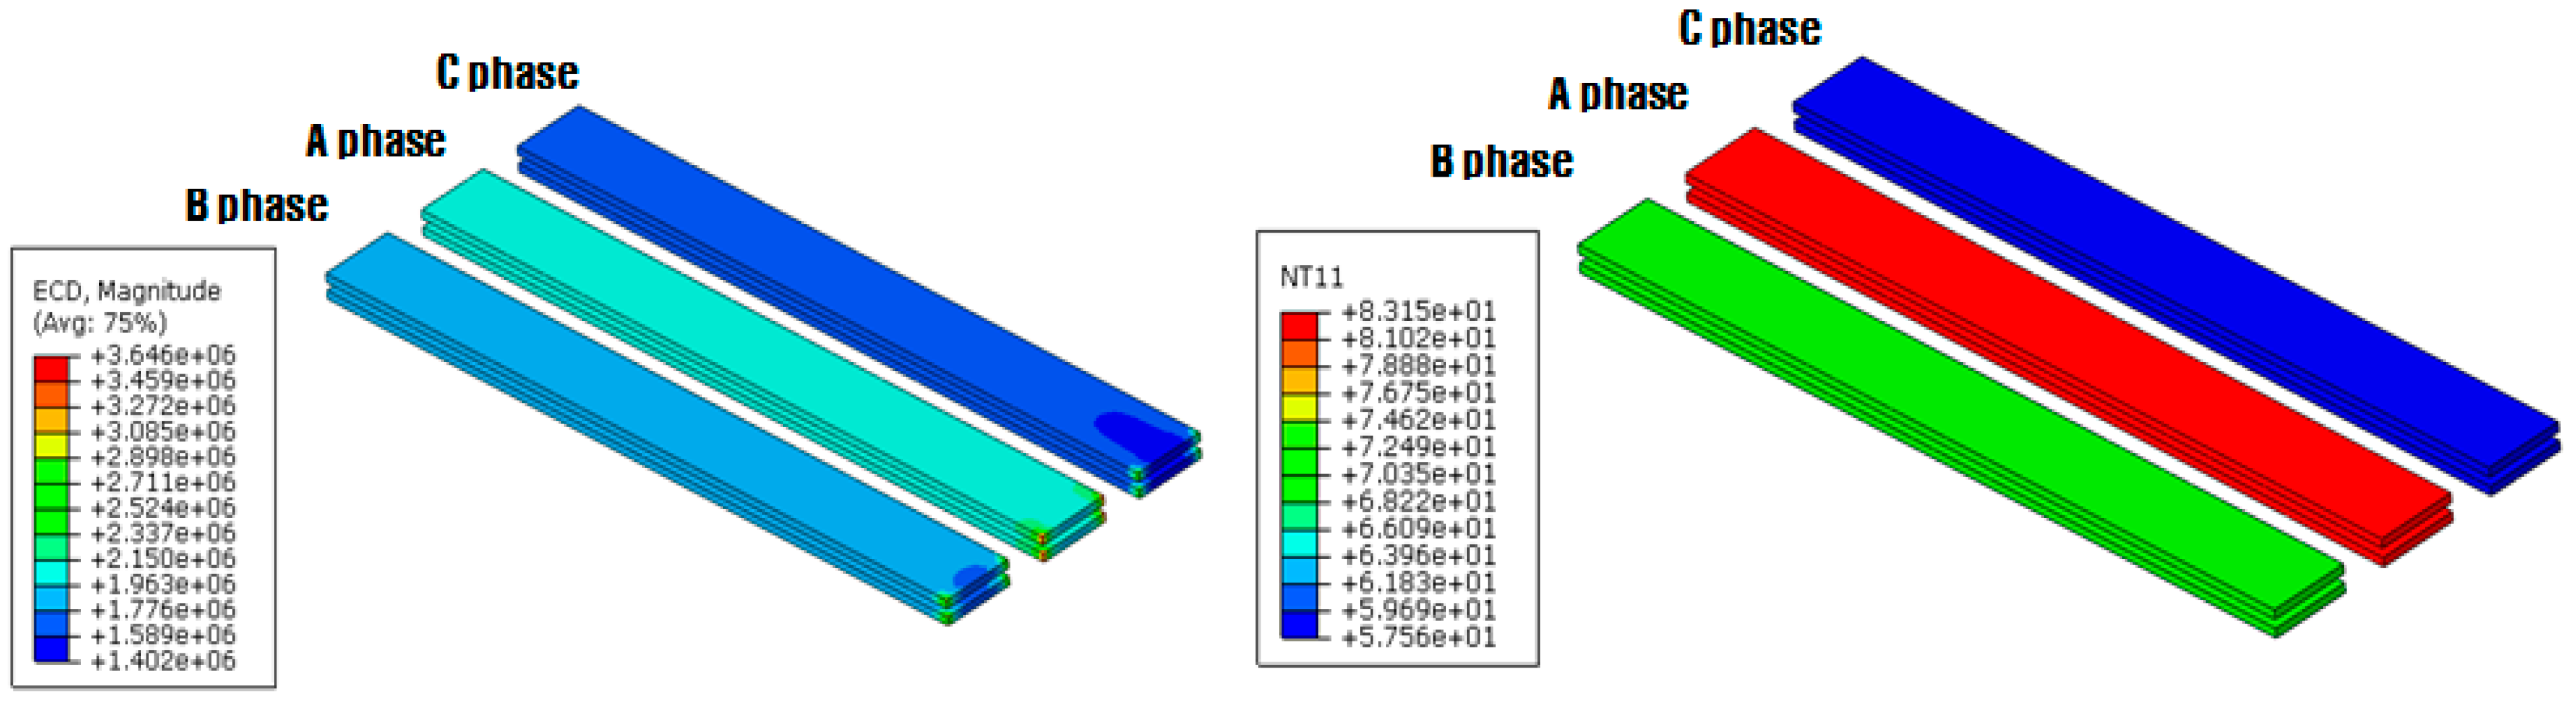
3.1. Electromagnetic and Thermal Analysis for Shape of Bus-Bar
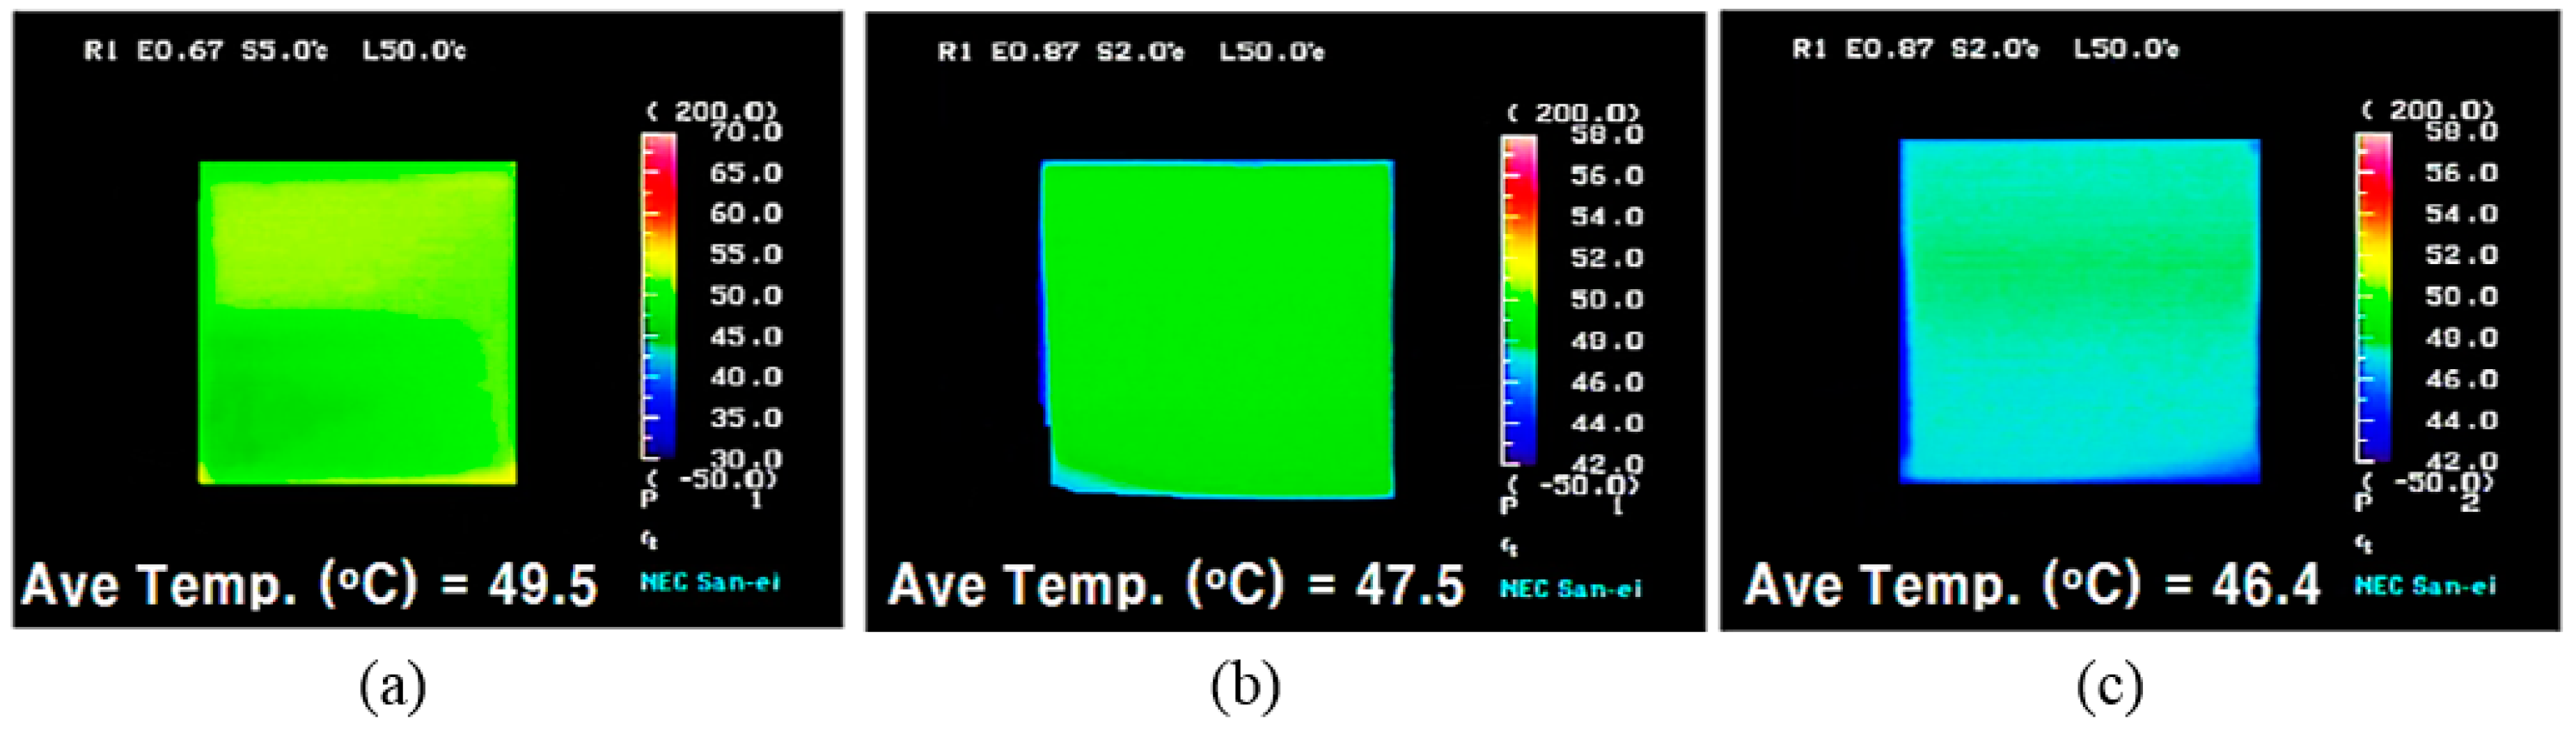
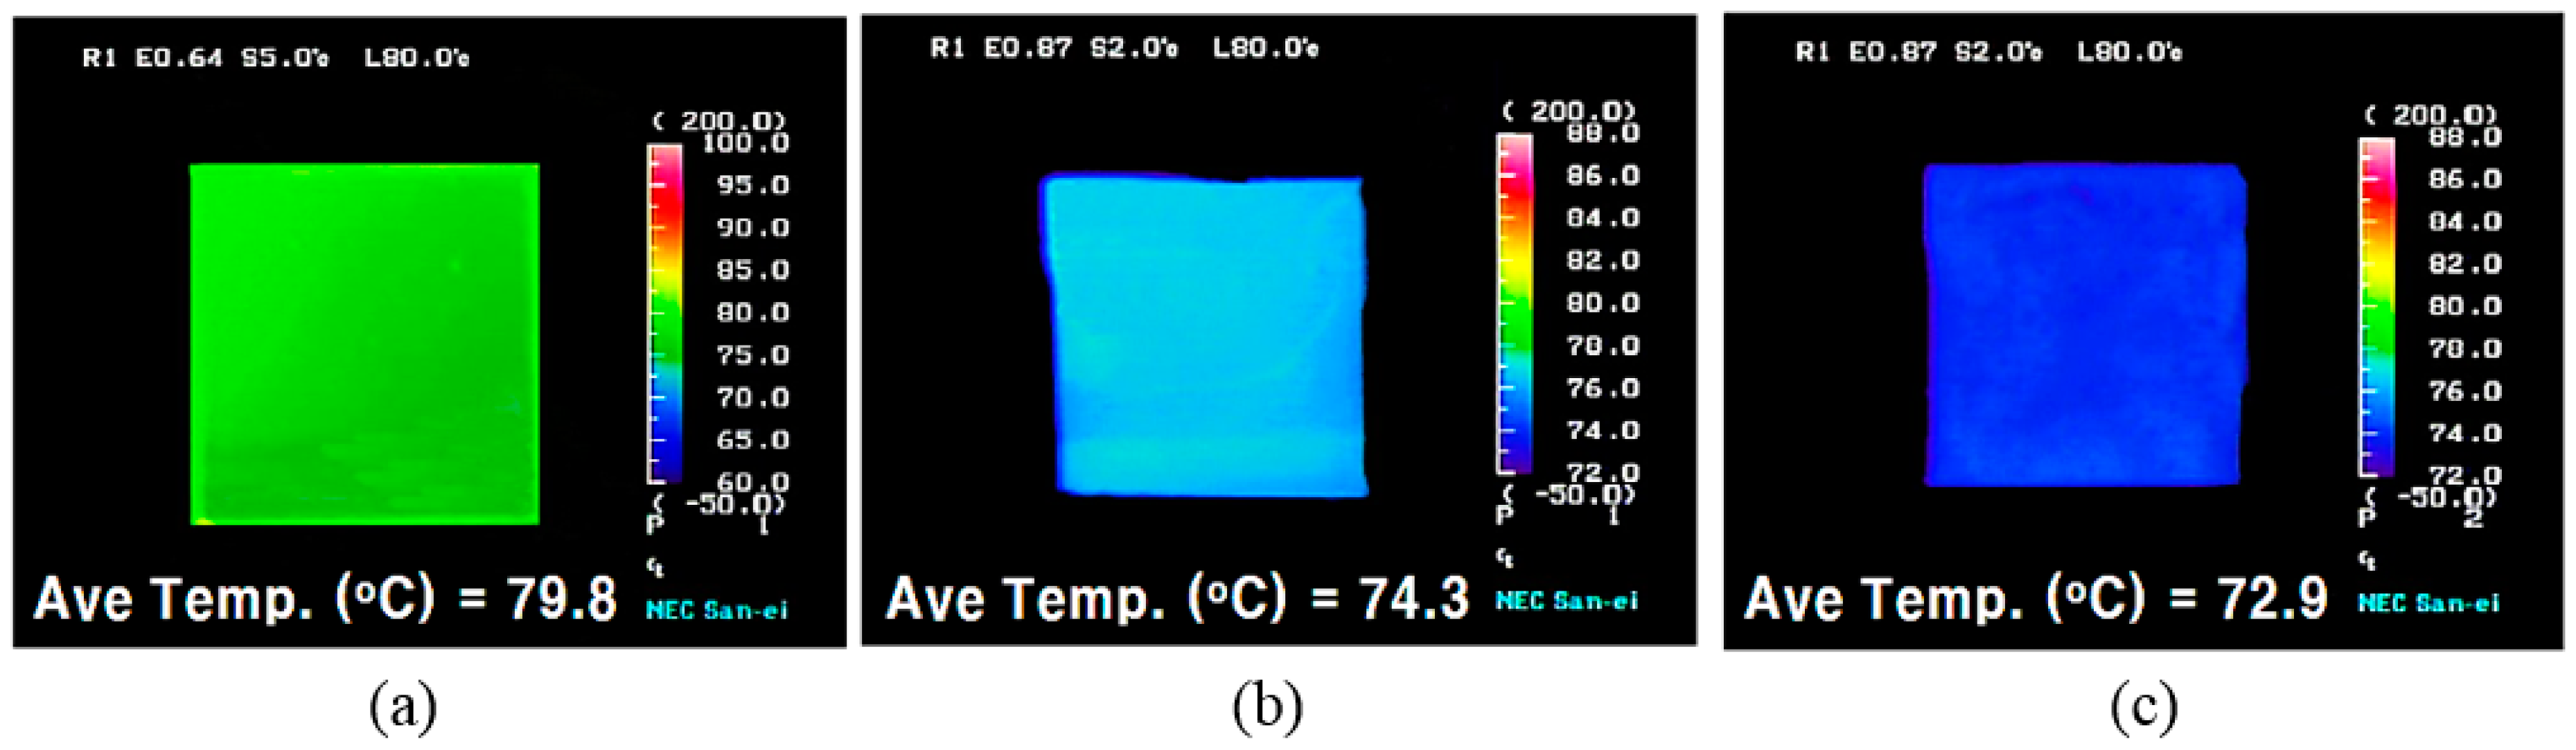
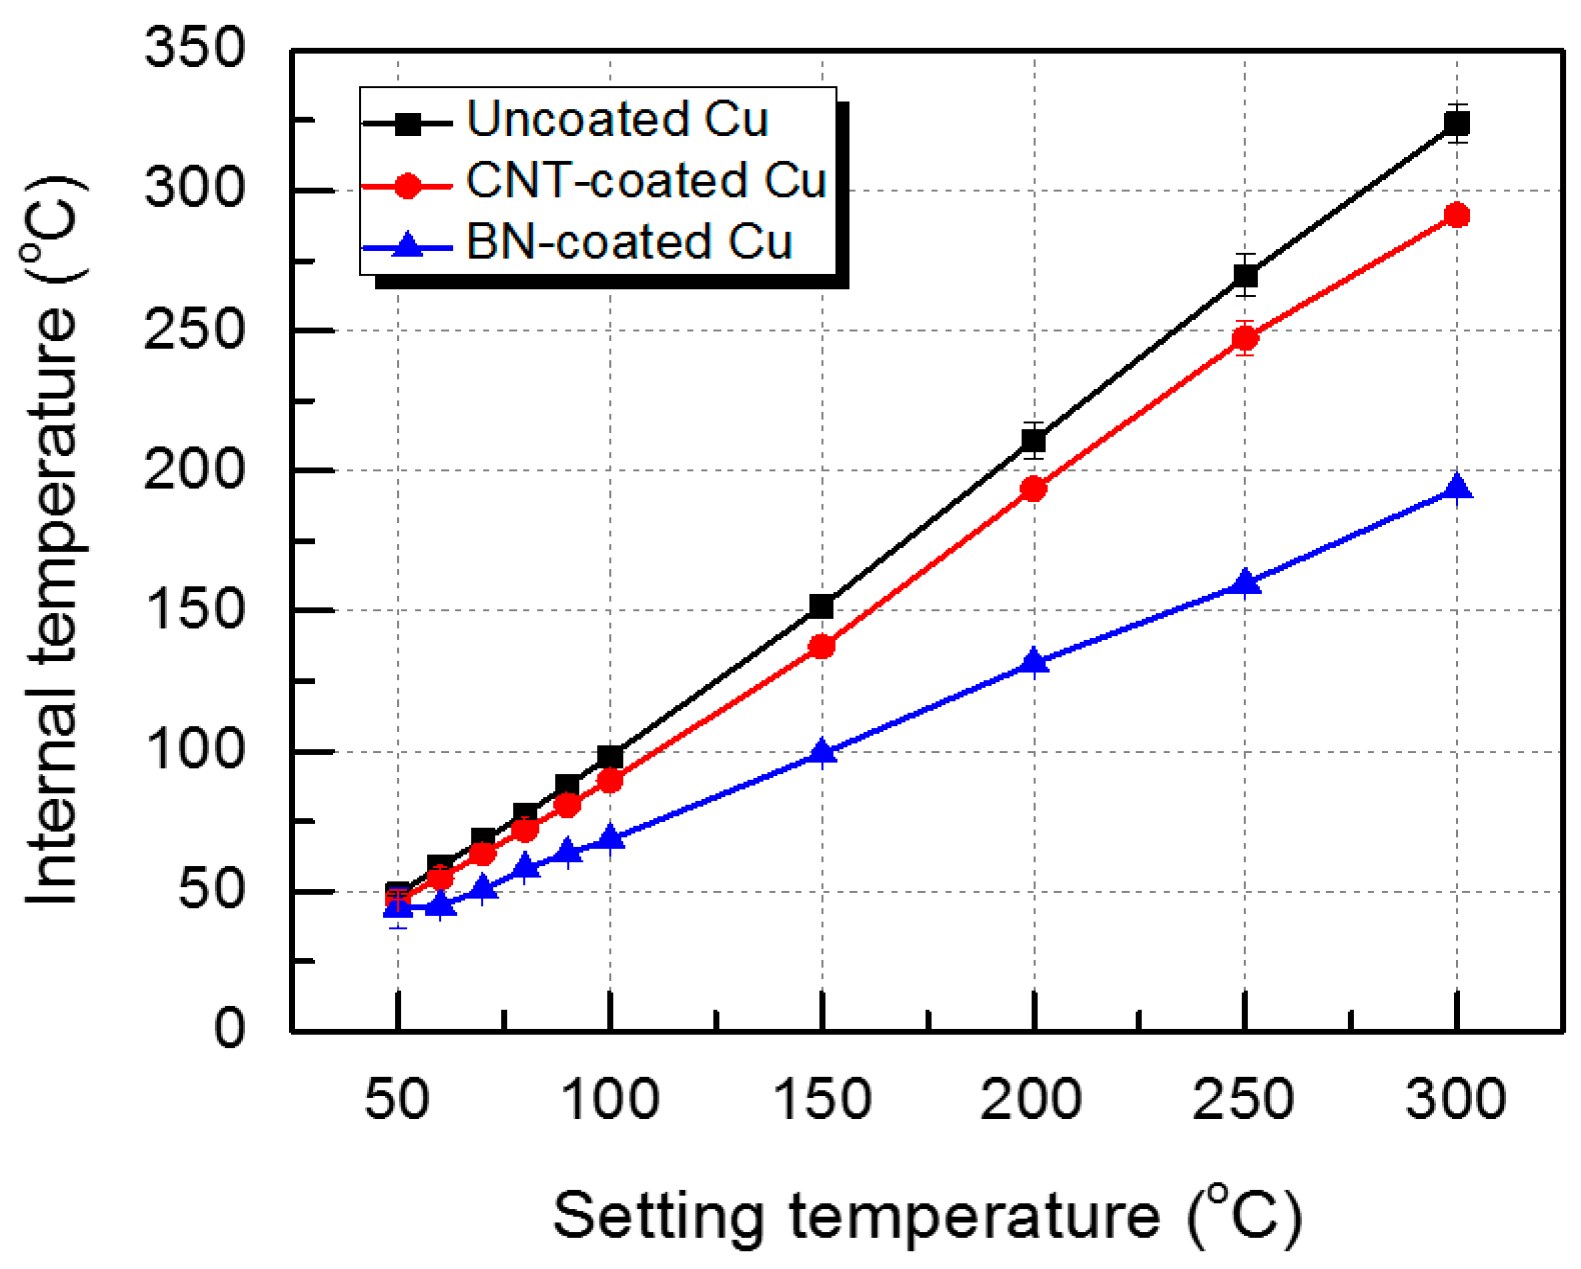
3.2. Heat Dissipation Characteristics of CNT and BN Coated Specimens
4. Conclusions
Author Contributions
Funding
Conflicts of Interest
References
- Caponet, M.C.; Profumo, F.; De Doncker, R.W.; Tenconi, A. Low stray inductance bus bar design and construction for good EMC performance in power electronic circuits. IEEE Trans. Power Electron. 2002, 17, 225–231. [Google Scholar] [CrossRef]
- Hahn, J.W.; Koch, J.K. Power Bus Bar for Providing a Low Impedance Connection between a First and Second Printed Circuit Board. U.S. Patent No. 6,024,589, 15 February 2000. [Google Scholar]
- Jung, H.S. Study for temperature rise on busbar of the switchgear and controlgear assemblies. Korea Inst. Inf. Commun. Eng. 2017, 21, 379–385. [Google Scholar]
- Lee, Y.D.; Jeong, S.H. A design and implementation of busbar joint and temperature measurement system. J. Korea Inst. Inf. Commun. Eng. 2017, 21, 379–385. [Google Scholar] [CrossRef]
- Kim, H.M.; Choi, J.Y. Study on the optimization of the fan position for cooling of the busbar of the enclosed switchboard. Trans. Korean Soc. Mech. Eng. B 2018, 42, 9–16. [Google Scholar] [CrossRef]
- Kim, J.W.; Park, J.Y.; Sohn, J.M.; Ahn, K.Y. A study on thermal characteristics for D.C. molded cased circuit breaker busbar. Korean Inst. Electric. Eng. 2014, 11, 252–254. [Google Scholar]
- Hedia, H.; Henrotte, F.; Meys, B.; Dular, P.; Legros, W. Arrangement of phases and heating constraints in a busbar. IEEE Trans. Magn. 1999, 35, 1274–1277. [Google Scholar] [CrossRef]
- Kim, C.K.; Park, Y.H.; Kim, J.Y. Busbar design of high power HVDC converter. Trans. Korean Inst. Electr. Eng. 2012, 61, 923–927. [Google Scholar] [CrossRef]
- Fuentes, C.D.; Rojas, C.A.; Renaudineau, H.; Kouro, S.; Perez, M.A.; Meynard, T. Experimental validation of a single DC bus cascaded H-bridge multilevel inverter for multistring photovoltaic systems. IEEE Trans. Ind. Electron. 2017, 64, 930–934. [Google Scholar] [CrossRef]
- Callegaro, A.D.; Guo, J.; Eull, M.; Danen, B.; Gibson, J.; Preindl, M.; Emadi, A. Bus bar design for high-power inverters. IEEE Trans. Power Electron. 2018, 33, 2354–2367. [Google Scholar] [CrossRef]
- Wang, L.; Chiang, H.D. Toward online bus-bar splitting for increasing load margins to static stability limit. IEEE Trans. Power Syst. 2017, 32, 3715–3725. [Google Scholar] [CrossRef]
- Geng, C.; He, F.; Zhang, J.; Hu, H. Partial stray inductance modeling and measuring of asymmetrical parallel branches on the bus-bar of electric vehicles. Energies 2017, 10, 1519. [Google Scholar] [CrossRef]
- Junior, M.F.; Bezerra, U.H.; Leite, J.C.; Moya, R.J.L. Maintenance tools applied to electric generators to improve energy efficiency and power quality of thermoelectric power plants. Energies 2017, 10, 1091. [Google Scholar] [CrossRef]
- Dawson, F.P.; Cao, M.; Jain, P.K. A simplified approach to calculating current distribution in paralleled power buses. IEEE Trans. Magn. 1990, 2, 971–974. [Google Scholar] [CrossRef]
- Bottauscio, O.; Carpaneto, E.; Chiampi, M.; Chiarabaglio, D.; Panaitescu, I. Numerical and experimental evaluation of magnetic field generated by power busbar system. IEE Proc.-Gener. Transm. Distrib. 1996, 143, 455–460. [Google Scholar] [CrossRef]
- Chiampi, M.; Chiarabaglio, D.; Tartaglia, M. A general approach for analyzing power busbars under a.c. conditions. IEEE Trans. Magn. 1993, 29, 2473–2475. [Google Scholar] [CrossRef]
- Labridis, D.P.; Dokopoulos, P.S. Electromagnetic forces in three-phase rigid busbars with rectangular cross-sections. IEEE Trans. Power Deliv. 1996, 11, 793–800. [Google Scholar] [CrossRef]
- Bottauscio, O.; Chiampi, M.; Chiarabaglio, D. Experimental validation of a numerical model of busbar systems. IEE Proc. C 1995, 142, 65–72. [Google Scholar] [CrossRef]
- Hwang, C.C.; Chang, J.J.; Jiang, Y.H. Analysis of electromagnetic and thermal fields for a bus duct system. Electr. Power Syst. Res. 1998, 45, 39–45. [Google Scholar] [CrossRef]
- Fominykh, Y.A.; Sokovishin, Y.A.; Osotov, V.N.; Maslennikov, D.S.; Konstantinov, A.G.; Parylis, M.E.; Greditor, A.M. Temperature distribution over the surface of rectangular busbars in electrical apparatus. Elektrichestvo 1992, 4, 53–56. [Google Scholar]
- Schoft, S. Joint resistance depending on joint force of high current aluminum joint. In Proceedings of the 50th IEEE Holm Conference on Electrical Contacts and the 22nd International Conference on Electrical Contacts, Seattle, WA, USA, 23–23 September 2004; pp. 502–510. [Google Scholar]
- Braunovic, M. Evaluation of different contact-aid compounds for aluminum-to-copper connections. In Proceedings of the 36th Annual Holm Conference on Electrical Contacts, Montreal, QC, Canada, 20–24 August 1990; pp. 509–517. [Google Scholar]
- Schlegel, S.; Großmann, S.; Lobl, H.; Hoidis, M.; Kaltenborn, U.; Magier, T. Joint resistance of bolted copper-copper busbar joints depending on joint force at temperatures beyong 105 °C. In Proceedings of the Annual Holm Conference on Electrical Contacts, Charleston, SC, USA, 4–17 October 2010; pp. 444–451. [Google Scholar]
- Chapman, D. Copper for Busbars: Guidance for Design and Installation; Copper Development Association: Hempstead, HP, UK, 1954; pp. 25–27. [Google Scholar]


| Material | Density (kg/m3) | Thermal Conductivity (W/m·K) | Specific Heat (J/kg·K) | Electric Conductivity (S/m) | Magnetic Permeability (H/m) |
|---|---|---|---|---|---|
| Copper | 8960 | 401 | 385 | 5.81 × 10⁷ | 1.256 × 10⁻⁶ |
| Air | 1.205 | 0.0257 | 1005 | 3.00 × 10⁻¹⁵ | 1.256 × 10⁻⁶ |
| Case | t1 (mm) | t2 (mm) | Cross-Sectional Area (mm2) |
|---|---|---|---|
| 1 | 9.0 | 7.65 | 1800 |
| 2 | 10.0 | 6.89 | |
| 3 | 11.0 | 6.15 | |
| 4 | 12.0 | 5.42 |
| Case | 1 | 2 | 3 | 4 |
|---|---|---|---|---|
| Elevated temperature (°C) | 81.1 | 79.7 | 79.4 | 78.7 |
| Sample | 50 °C | 80 °C | ||
|---|---|---|---|---|
| Emissivity | Radiation Energy (W/m2·μm) | Emissivity | Radiation Energy (W/m2·μm) | |
| Uncoated Cu | 0.535 | 2.48 × 10² | 0.524 | 3.57 × 10² |
| CNT-coated Cu | 0.872 | 4.04 × 10² | 0.867 | 5.91 × 10² |
| BN-coated Cu | 0.874 | 4.05 × 10² | 0.868 | 5.91 × 10² |
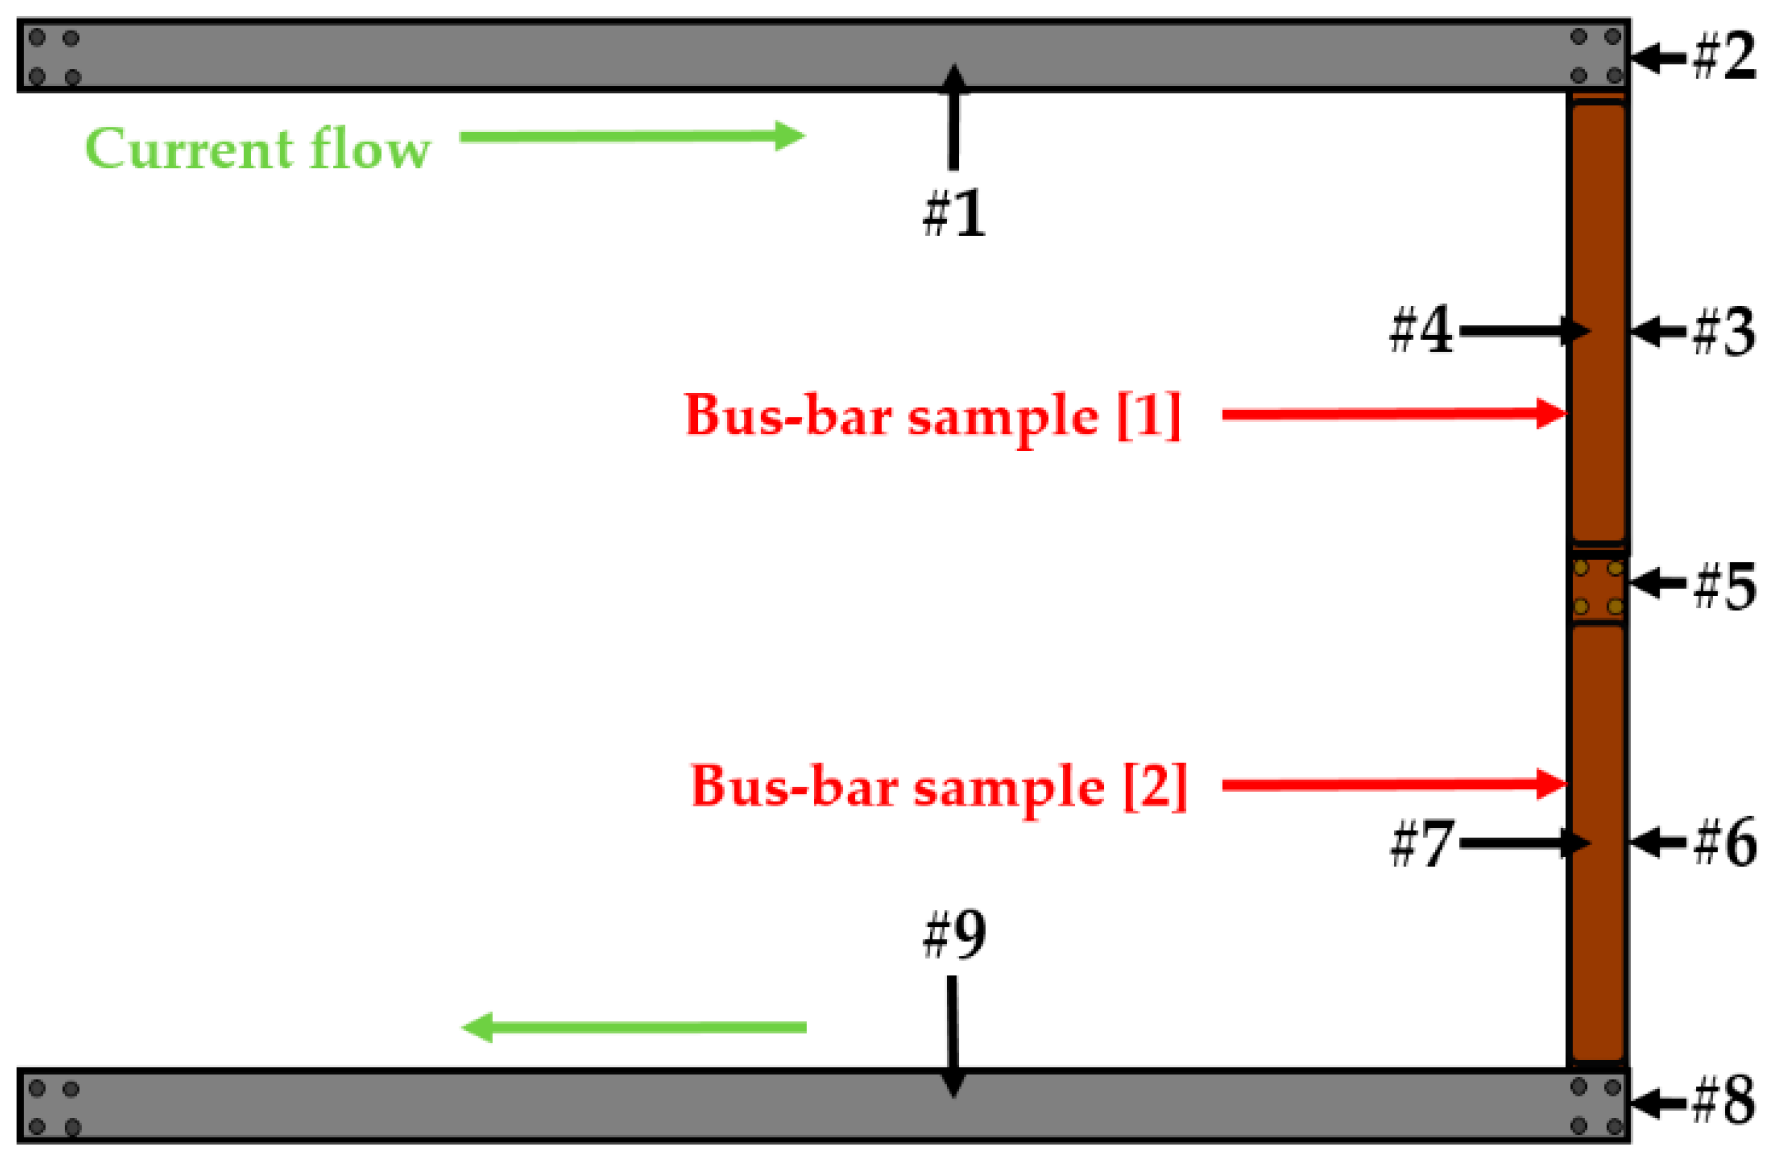
| Temperature Measuring Point | Position | Temperature Rise | ||
|---|---|---|---|---|
| Typical Bus-Bar | Uncoated Bus-Bar | BN-Coated Bus-Bar | ||
| Plate-Type | Tunnel-Type | Tunnel-Type | ||
| #1 | 1 m front of connection part of current draw | 36.2 | 47.3 | 43.4 |
| #2 | Connection part of current draw | 39.4 | 52.5 | 41.6 |
| #3 | Center of sample [1] (plate part) | 66.9 | 58.1 | 39.4 |
| #4 | Center of sample [1] (semi-pipe part) | 58.6 | 38.8 | |
| #5 | Connection part of sample [1] and [2] | 68.1 | 57.9 | 41.9 |
| #6 | Center of sample [2] (plate part) | 64.8 | 54.4 | 39.5 |
| #7 | Center of sample [2] (semi-pipe part) | 54.5 | 39.0 | |
| #8 | Connection part of current drain | 58.3 | 47.3 | 38.5 |
| #9 | 1 m rear of connection part of current drain | 43.1 | 44.8 | 42.1 |
© 2019 by the authors. Licensee MDPI, Basel, Switzerland. This article is an open access article distributed under the terms and conditions of the Creative Commons Attribution (CC BY) license (http://creativecommons.org/licenses/by/4.0/).
Share and Cite
Kim, M.-J.; Bak, S.-H.; Jung, W.-C.; Hur, D.-J.; Ko, D.-S.; Kong, M.-S. Improvement of Heat Dissipation Characteristics of Cu Bus-Bar in the Switchboards through Shape Modification and Surface Treatment. Energies 2019, 12, 146. https://doi.org/10.3390/en12010146
Kim M-J, Bak S-H, Jung W-C, Hur D-J, Ko D-S, Kong M-S. Improvement of Heat Dissipation Characteristics of Cu Bus-Bar in the Switchboards through Shape Modification and Surface Treatment. Energies. 2019; 12(1):146. https://doi.org/10.3390/en12010146
Chicago/Turabian StyleKim, Min-Jun, Sang-Hwan Bak, Woo-Chul Jung, Deog-Jae Hur, Dong-Shin Ko, and Man-Sik Kong. 2019. "Improvement of Heat Dissipation Characteristics of Cu Bus-Bar in the Switchboards through Shape Modification and Surface Treatment" Energies 12, no. 1: 146. https://doi.org/10.3390/en12010146
APA StyleKim, M.-J., Bak, S.-H., Jung, W.-C., Hur, D.-J., Ko, D.-S., & Kong, M.-S. (2019). Improvement of Heat Dissipation Characteristics of Cu Bus-Bar in the Switchboards through Shape Modification and Surface Treatment. Energies, 12(1), 146. https://doi.org/10.3390/en12010146