Article

Multi-Level Market Transaction Optimization Model for Electricity Sales Companies with Energy Storage Plant

School of Economics and Management, North China Electric Power University, Beijing 102206, China
*
Author to whom correspondence should be addressed.
Energies 2019, 12(1), 145; https://doi.org/10.3390/en12010145
Submission received: 10 December 2018 / Revised: 24 December 2018 / Accepted: 25 December 2018 / Published: 2 January 2019

Abstract

:
Due to market price uncertainty and volatility, electricity sales companies today are facing greater risks in regard to the day-ahead market and the real-time market. Along with introducing the Time of Use (TOU) price for the customer as a type of balancing resource to avoid market risk, electricity sales companies should adopt the market risk-aversion method to reduce the high cost of ancillary services in the real-time market by using multi-level market transactions, as well as to provide a reference for the profits of power companies. In this paper, we establish a non-linear mathematical model based on stochastic programming by using conditional value-at-risk (CVaR) to measure transaction strategy risk. For the market price and consumer electricity load as the uncertain factors of multi-level market transactions of electricity sales companies, the optimal objective was to maximize the revenue of electricity sales companies and minimize the peak-valley differences in the system, which is solved by using mixed-integer linear programming (MILP). Finally, we provide an example to analyze the effect of the fluctuation degree of customer load and market price on the profit of electricity sales companies under different confidence coefficients.

1. Introduction

From many countries’ experiences of electricity market construction, the electricity market reduces users’ electricity charges, optimizes the energy structure, and is beneficial to the operation of the power system. Thus, it is worth studying how electricity sales companies avoid risks and achieve sustainable and healthy operation in the market. Through reforms of the electricity market in China, the sales side will gradually be liberalized, and electricity sales companies’ strategies in regard to purchasing and selling electricity in the market will also be optimized.
On the basis of the current separation of plants and networks and free access to power generation, introducing competitive sales channels into market competition is the basic method for deepening the reform of the electricity market [1,2]. In [3], based on the opportunity-constrained programming method and the model of the optimal power purchasing decision of power supply companies, risk consideration was solved. In [4], the authors studied single electric energy suppliers to participate in the long-term contract market and short-term retail market transactions for the user to bear the risk of electricity price fluctuations in the electricity market, to provide users with a more stable power supply price, from which to earn the difference. The electricity market operation process is a dynamic process consisting of multi-party interactions and games. In this process, each power sales company has its own maximum profit [5].
The market participates in the purchase and sale of electricity optimization decisions [6] to achieve independent operation of energy trading institutions, forming a market situation of reasonable and effective competition [7]. The domestic market-oriented reform of the electricity-selling side started late. In [8], the authors proposed the organizational structure design and main market business of the electric energy trading institution from the perspective of the electric energy trading institution after the marketization of electricity sales. The market’s regulatory capabilities to promote competition among market members were used. In 2009, the main framework of power system reform in European Union (EU) countries was determined [9], and it was stated that the types of foreign power companies usually include three categories [10].
In [11], the authors proposed a new system structure and scheduling control algorithm with self-recovery capability, and mainly for the case of multiple microgrid access, lower-layer control in the structure was realized by the internal energy management system of each microgrid. In [12], the authors considered the increase of distributed electric energy resources’ penetration rates and the demand for electricity marketization in distribution networks, and designed a dual-auction power market for residential areas. In [13], the authors proposed a two-tier decision-making model for distribution companies to participate in the spot market, in which interruptible load and distributed generation were interrupted, which are additional power resources available to distribution companies. In [14], the authors studied the development mechanism of transmission network fees in the United Kingdom, introduced the composition of network fees, analyzed the distribution ratio of market members to transmission network fees, and pointed out that the network was set up by considering the characteristics of electricity consumption. The pricing method of fees is more suitable for the initial stage of marketization in China, and has reference significance for China’s transmission and distribution pricing. In [15], the authors studied the French power system reformation process, and gradually introduced competition to the sales side by gradually releasing user choices, strictly reviewing the access qualifications of new power sales companies, and clarifying the business scope of power sales companies. In [16], the authors studied and analyzed the classification of electricity sales companies and their purchase and sale channels under the background of market-oriented reform of electricity sales.
In [17], the authors established a model of power retailers with distributed generation. A two-stage hierarchical model was used to simulate the day-ahead market and real-time market. In [18], the authors used historical data of the Autoregressive moving average model (ARMA) model to forecast load and real-time electricity price, and an optimal purchase decision based on conditional value-at-risk (CVaR) was constructed. In [19], the authors introduced the historical simulation method for Value at Risk (VaR) computing. In [20], the authors deduced the calculating formula of VaR risk measurement under fractal distribution, and made a fitting analysis based on the electricity price data of the electricity market in California, U.S. In [21], the authors used the skewness angle of purchasing income function to analyze the value-at-risk and quantified the operational risk of retail companies. In [22], the authors calculated the power market risk value based on multifractal regression interval analysis and explored the optimization strategy of purchasing portfolio risk. In [23], the authors utilized price-sensitive electricity prices to effectively promote load response and reduce power-supply cost and risk. In [24], the authors analyzed the operation strategies of power retail companies from the perspective of options. In [25], the authors took the purchase option as the object, and analyzed the optimal option contract combination strategy of the power company when the real-time price and customer demand were random variables. In [26], the authors defined the meaning of a power-cut option and analyzed its role in the process of avoiding risks in power-selling companies. In [27,28], the authors simulated the reasonable allocation of power purchase risk in real-time electricity markets on the basis of the Time of Use (TOU) price, and evaluated the effectiveness of hedging contract optimization in risk mitigation by CVaR. At present, research on the optimization of electricity purchasers’ electricity purchases is mainly carried out from the aspects of market electricity price fluctuations, risk analysis methods, and types of combined electricity purchase markets. Variance and VaR are generally used to measure the uncertainty of earnings. In view of this, this paper focuses on the power purchase strategy of electricity sales companies, considering that the peak and valley electricity prices will affect the sales space of the sales company, as well as build a three-level market power purchase model including the contract market, the day market, and the real-time market, considering the user load and the day-ahead market. The volatility of prices through the risk measurement of different combinations of electricity purchases build a combined power purchase optimization model of the electricity sales company in the above market.
In this paper, taking electricity sales companies as the research object, load uncertainties and electricity prices were introduced to optimize the power purchase portfolio decision of electricity sales companies. To solve these problems, this paper introduces a risk assessment model and establishes a multi-level market trading strategy model to eliminate the risk of electricity sales companies, reduce the direct market transactions at bad prices, optimize their returns, and reduce risk losses. Considering the load and price uncertainties faced by electricity sales companies in the market, this paper takes the optimal trading return and the minimum peak-valley difference as the objective, and solves them by mixed-integer linear programming (MILP). Finally, the validity and rationality of the model is analyzed and verified with an example.

2. Multi-Level Market Risk Assessment and Energy Storage Station Output Model

Electricity sales companies act as intermediaries in the electricity market, buy electricity from generators of the wholesale market, and sell it to consumers in the retail market. Due to the inaccuracy of short-term and medium-term load forecasting, there are still some deviations between the contracts signed by electricity sales companies in the wholesale market and the actual electricity demand of consumers. For the electricity load forecasting deviations, electricity sales companies need to purchase ancillary services or energy storage plants to make up for them, so as to maintain the balance of the system.

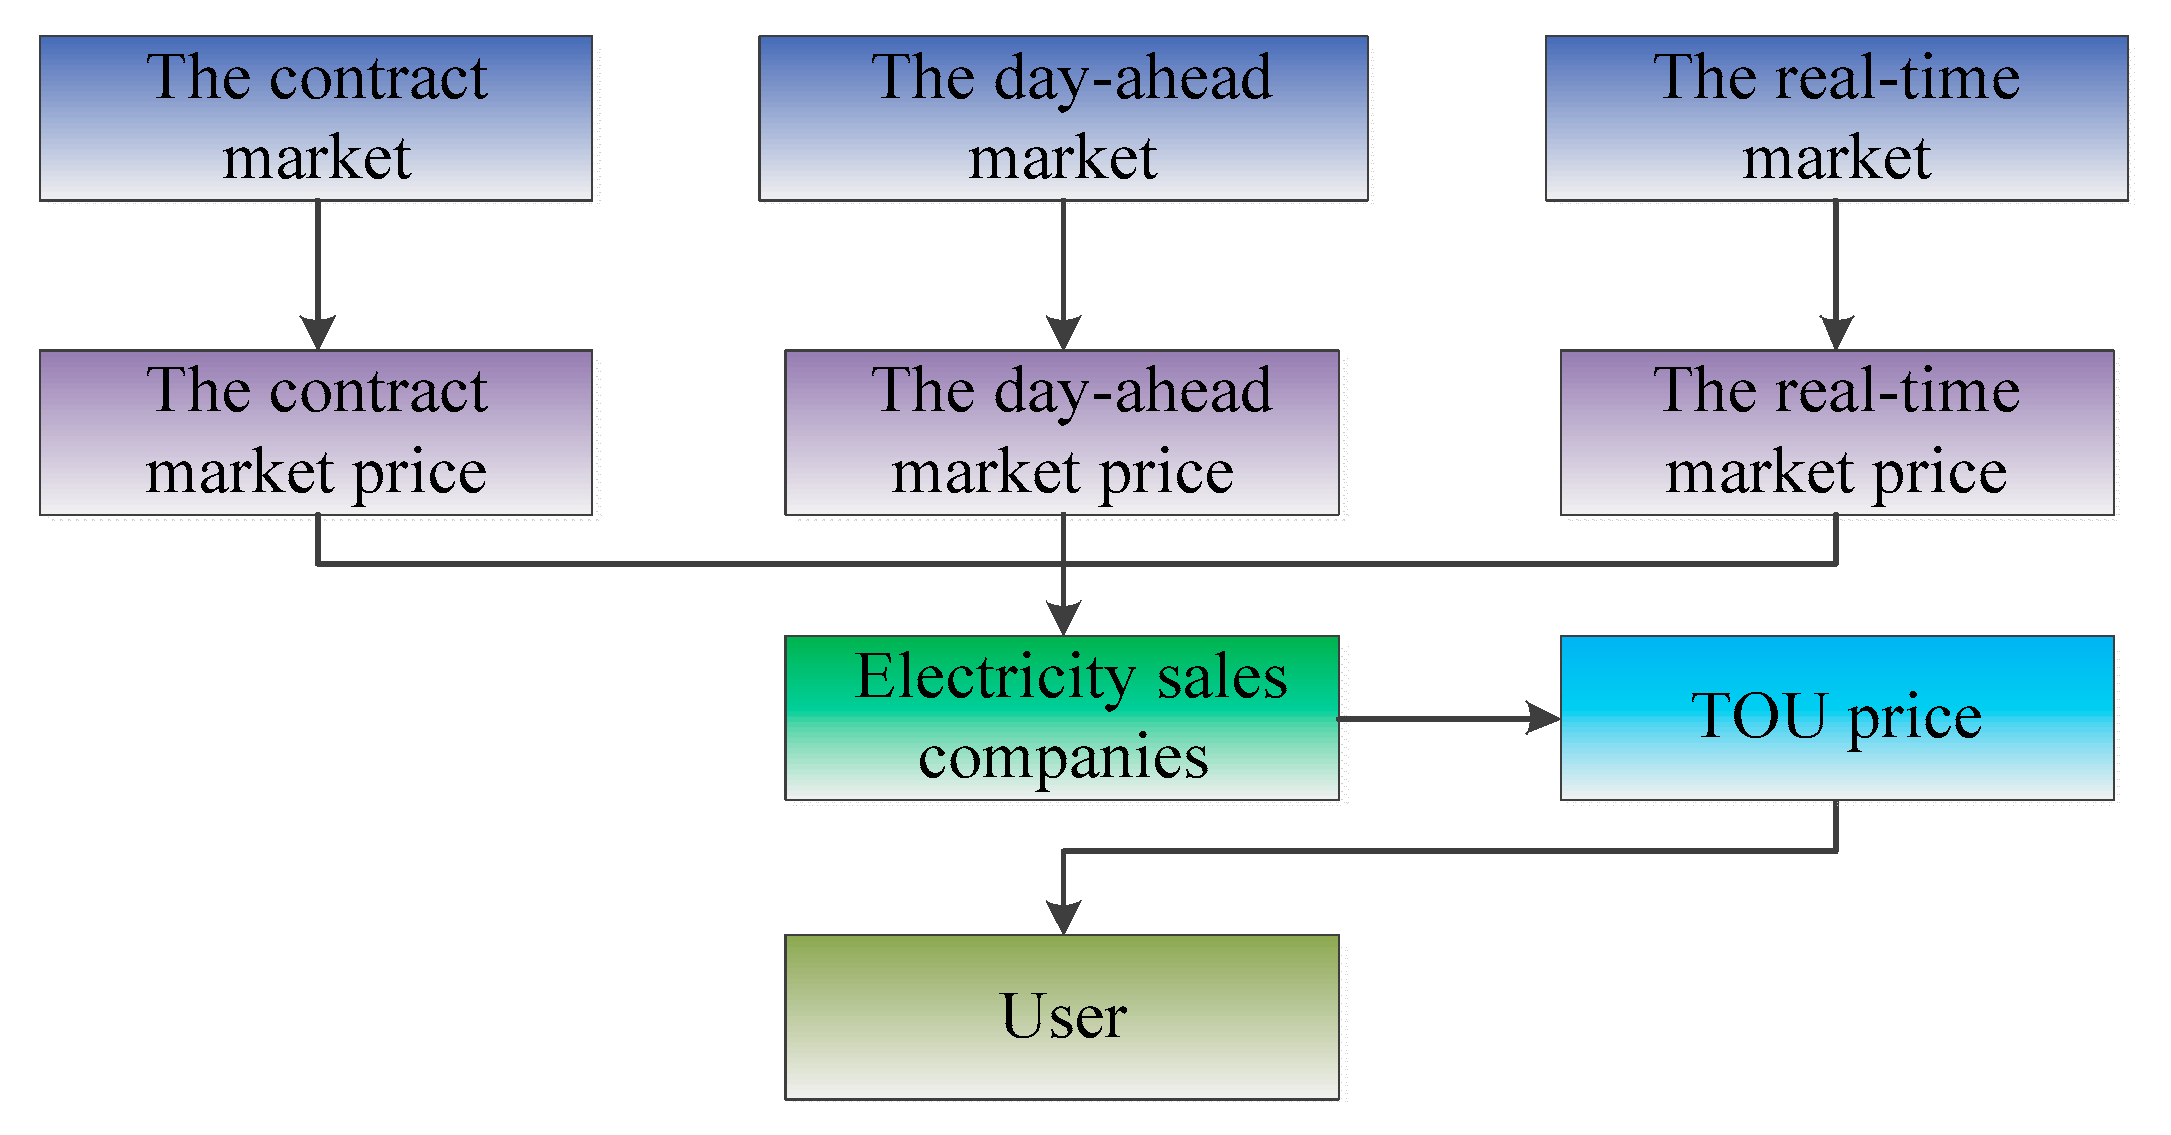
2.1. Multi-Level Power Market

The main purpose of a balanced market is to maintain the stable operation of the power system. However, there is a market risk related to balanced market transactions caused by the volatility and uncertainty of transaction prices. Due to this, electricity sales companies are facing the risk of excessive transaction costs, profit reduction, and even losses caused by the fluctuation of electricity prices in the market. How the problem of electricity balance and avoiding market risks will be solved is thus of critical importance to power sales companies. Figure 1 shows the structure of the multi-level power market:

2.2. Construction of Uncertain Sets

2.2.1. Load Uncertainty

At time t, the range of customer load Q ( t ) can be closed by interval (1):
Q d ( t ) Q ( t ) Q u ( t )
In this paper, the 1-norm is used to constrain the absolute forecasting error of the load, and the parameter Γ becomes the uncertainty coefficient:
t = 1 24 | Q ( t ) Q f ( t ) | Q f ( t ) Γ 1
wherein Γ 1 is the weighted average absolute load error in statistics, and Q d ( t ) and Q u ( t ) are the maximum and minimum loads for the user at time t. Q f ( t ) is the actual forecasting customer load.

2.2.2. Electricity Price Uncertainty

In the paper, p ( t ) is the day-ahead market price at time t; p u p ( t ) is the day-ahead market maximum price at time t; and p d o w n ( t ) is the day-ahead market minimum price at time t:
p d o w n ( t ) p ( t ) p u p ( t )
t = 1 24 | p ( t ) p f ( t ) | p ( t ) Γ 2
wherein Γ 2 is the weighted average absolute price error in statistics, and p f ( t ) is the actual electricity forecasting price.

2.3. Output Model of Energy Storage Power Station

In the mature power market, electricity sales companies with a large-scale energy storage plant control the charging and discharging strategy of batteries according to price differences in different periods. Thus, electricity sales companies charge when the price is low, store the energy of the energy storage plant, discharge when the price is high, and gain economic benefits from the price difference. The charging and discharging behavior of the energy storage plant will affect the load curve of the system. In this way, the price difference between different periods will be reduced, and the economic benefits of electricity sales companies will be affected. The specific output function of the energy storage power station is based on Reference [29].

3. Construction of Multi-Level Market Optimization Strategy

3.1. Pricing Scheme Design

3.1.1. Design of TOU Price Scheme

We introduced the TOU price scheme into the power sales plan of electricity sales companies. In the TOU price mode, the electricity sales company charges different electricity prices at different periods. Supposing the TOU price is γ ( t ) , the basic period is 1 h. From this, the TOU price will be as follows (5):
γ ( t ) = { γ 1 , 0 < t T 1 γ 2 , T 1 < t T 1 + T 2 γ ( t ) , l = 1 z 1 T l < t l = 1 z T l γ 24 , l = 1 Z 1 T l < t 24
Assuming that the TOU price parameters remain unchanged for a certain period of time, the relationship between the transferred load and price elasticity coefficient is as follows:
Q ( t ) = Q ( t ) [ 1 + k = 1 , k t 24 α ( k , t ) γ ( k ) γ ( t ) γ ( t ) ]
wherein Q ( t ) is the user load at time t; Q ( t ) is the user load after transferring at time t; γ ( k ) is the TOU price at time k; and α ( k , t ) is the price elastic coefficient transferred load from time k to time t, α ( k , t ) 0 . Through statistical analysis of the data, p p is the electricity price in the peak period, p f is the electricity price in the flat period, and p v is the electricity price in the valley period.

3.1.2. Design of Reserve Service Price Scheme

With advancements in electricity market reforms, the reserve capacity service market will be formed by interruptible prices on the selling side. The cost of real-time market electricity prices is closely related to the customer type, duration of blackout, blackout time, blackout ratio, and other factors. The real-time price is p a ($/MW·h); therefore, the detailed plan of real-time tariffs is as follows:
p a = { τ 1 , 0 < t T 1 τ 2 , T 1 < t T 1 + T 2 τ z , l = 1 z 1 T l < t l = 1 z T l τ 24 , l = 1 Z 1 T l < t 24

3.2. Construction of Objective Function

3.2.1. Multi-Level Market Purchase and Sale Model

Electricity sales companies purchase electricity in the contract market, the day-ahead market, and the real-time market. The proportion of electricity purchased is μ 1 , μ 2 , and μ 3 . The revenue of the electricity sales companies is as follows:
π = t = 1 p p p p × Q p p + t = 1 p f p f × Q p f + t = 1 p v p v × Q p v
wherein Q p p is the electricity in the peak period, Q p f is the electricity in the flat period, and Q p v is the electricity in the valley period. For the contract market, the day-ahead market, and the real-time market, the ratio of purchasing electricity is 1:
μ 1 + μ 2 + μ 3 = 1
wherein Q c ( t ) is the purchase of electricity in the contract market at time-period t, Q d ( t ) is the purchase of electricity in the day-ahead market at time-period t, Q a ( t ) is the purchase of electricity in the real time market at time-period t, p c is the purchase of price in the contract market at time-period t, p d is the purchase of price in the day-ahead market at time-period t, and p a is the purchase of price in the real-time market at time-period t. The cost of the electricity sales companies is as follows:
C = p c × Q c ( t ) + p d × Q d ( t ) + t = 1 m p a ( t ) × Q a ( t )
The profit of the electricity sales companies is as follows:
f 1 = R = max π C
wherein C is the cost of the electricity sales companies, and f 1 is the revenue of the electricity sales companies.

3.2.2. The Minimum Peak-Valley Difference

The peak-valley TOU price can reduce the peak load and increase the valley load so as to reduce the peak-valley difference and increase the stability of the power system. The objective function f 2 is assumed to be the minimum peak-valley difference. Q u ( t ) is the maximum load of the system, and Q d ( t ) is the minimum load of the system:
f 2 = Q u ( t ) Q d ( t )

3.3. Constraint Condition

The power balance constraints are as follows:
Q c ( t ) + Q d ( t ) + t = 1 m Q a ( t ) + g k , s ( t ) Q ( t )
wherein g k , s ( t ) is the power output of the energy storage plant. The electricity sellers buy electricity in the market and the real-time market by hour. The fluctuation range of the proportion of electricity purchases in the market and real-time market are:
μ 1 min μ 1 μ 1 max
μ 2 min μ 2 μ 2 max
μ 3 min μ 3 μ 3 max

4. Example Analysis

4.1. Scenario Setting

In this paper, four scenarios are set up and were simulated by the General Algebraic Modeling System (GAMS). The effects of electricity price and energy storage plant on the revenue and peak-to-valley difference of the electricity sellers are described. The scenario settings are shown in Table 1:
For a finite period of time, the robust measure Γ represents the maximum number of uncertainties that deviate from the nominal value, where the price or load demand cannot simultaneously exhibit worst-case random fluctuations in all time periods. If Γ 1 = Γ 2 = 0 , the electricity price and load demand do not randomly fluctuate, and the corresponding true value is equal to the nominal value, that is, the deterministic situation; if Γ 1 = Γ 2 = 5 , it indicates that the load and electricity price generate any 5 of 0 to T. The worst randomness occurs during this period. Similarly, the worst randomness occurs in any five periods from 0 to T. If Γ 1 = Γ 2 = 24 , it indicates that the price and load demand are the greatest in each period. In the case of bad randomness, the optimal solution at this time has the highest degree of conservation. By controlling the value of the robust measure, not only is the real description of the random scene realized, but the cost and conservativeness of the robust optimization are also adjusted. Therefore, the robust measure of electricity price and load demand is an important regulator of the conservative level of the electricity supplier’s operations.
In this paper, CPLEX software was used to solve the multi-level market transaction optimization model for electricity sales companies with energy storage plants based on CVaR. Figure 2 shows the algorithm flow-chart of this paper, as follows:

4.2. Basic Data

In this paper, one electricity sales company in the Pennsylvania-New Jersey-Maryland Interconnection (PJM) was selected as the research object, and the parameters of peak-valley price, day-ahead price, and real-time price were simulated. The TOU price on the sales side is shown in Table 2.
The mean day-ahead price of the PJM market is shown in Table 3.
Assuming the fluctuation interval radius of the Real-time, where the market energy price is ±15%, Table 4 is the mean real time price of the PJM electricity market.

4.3. Comparative Analysis

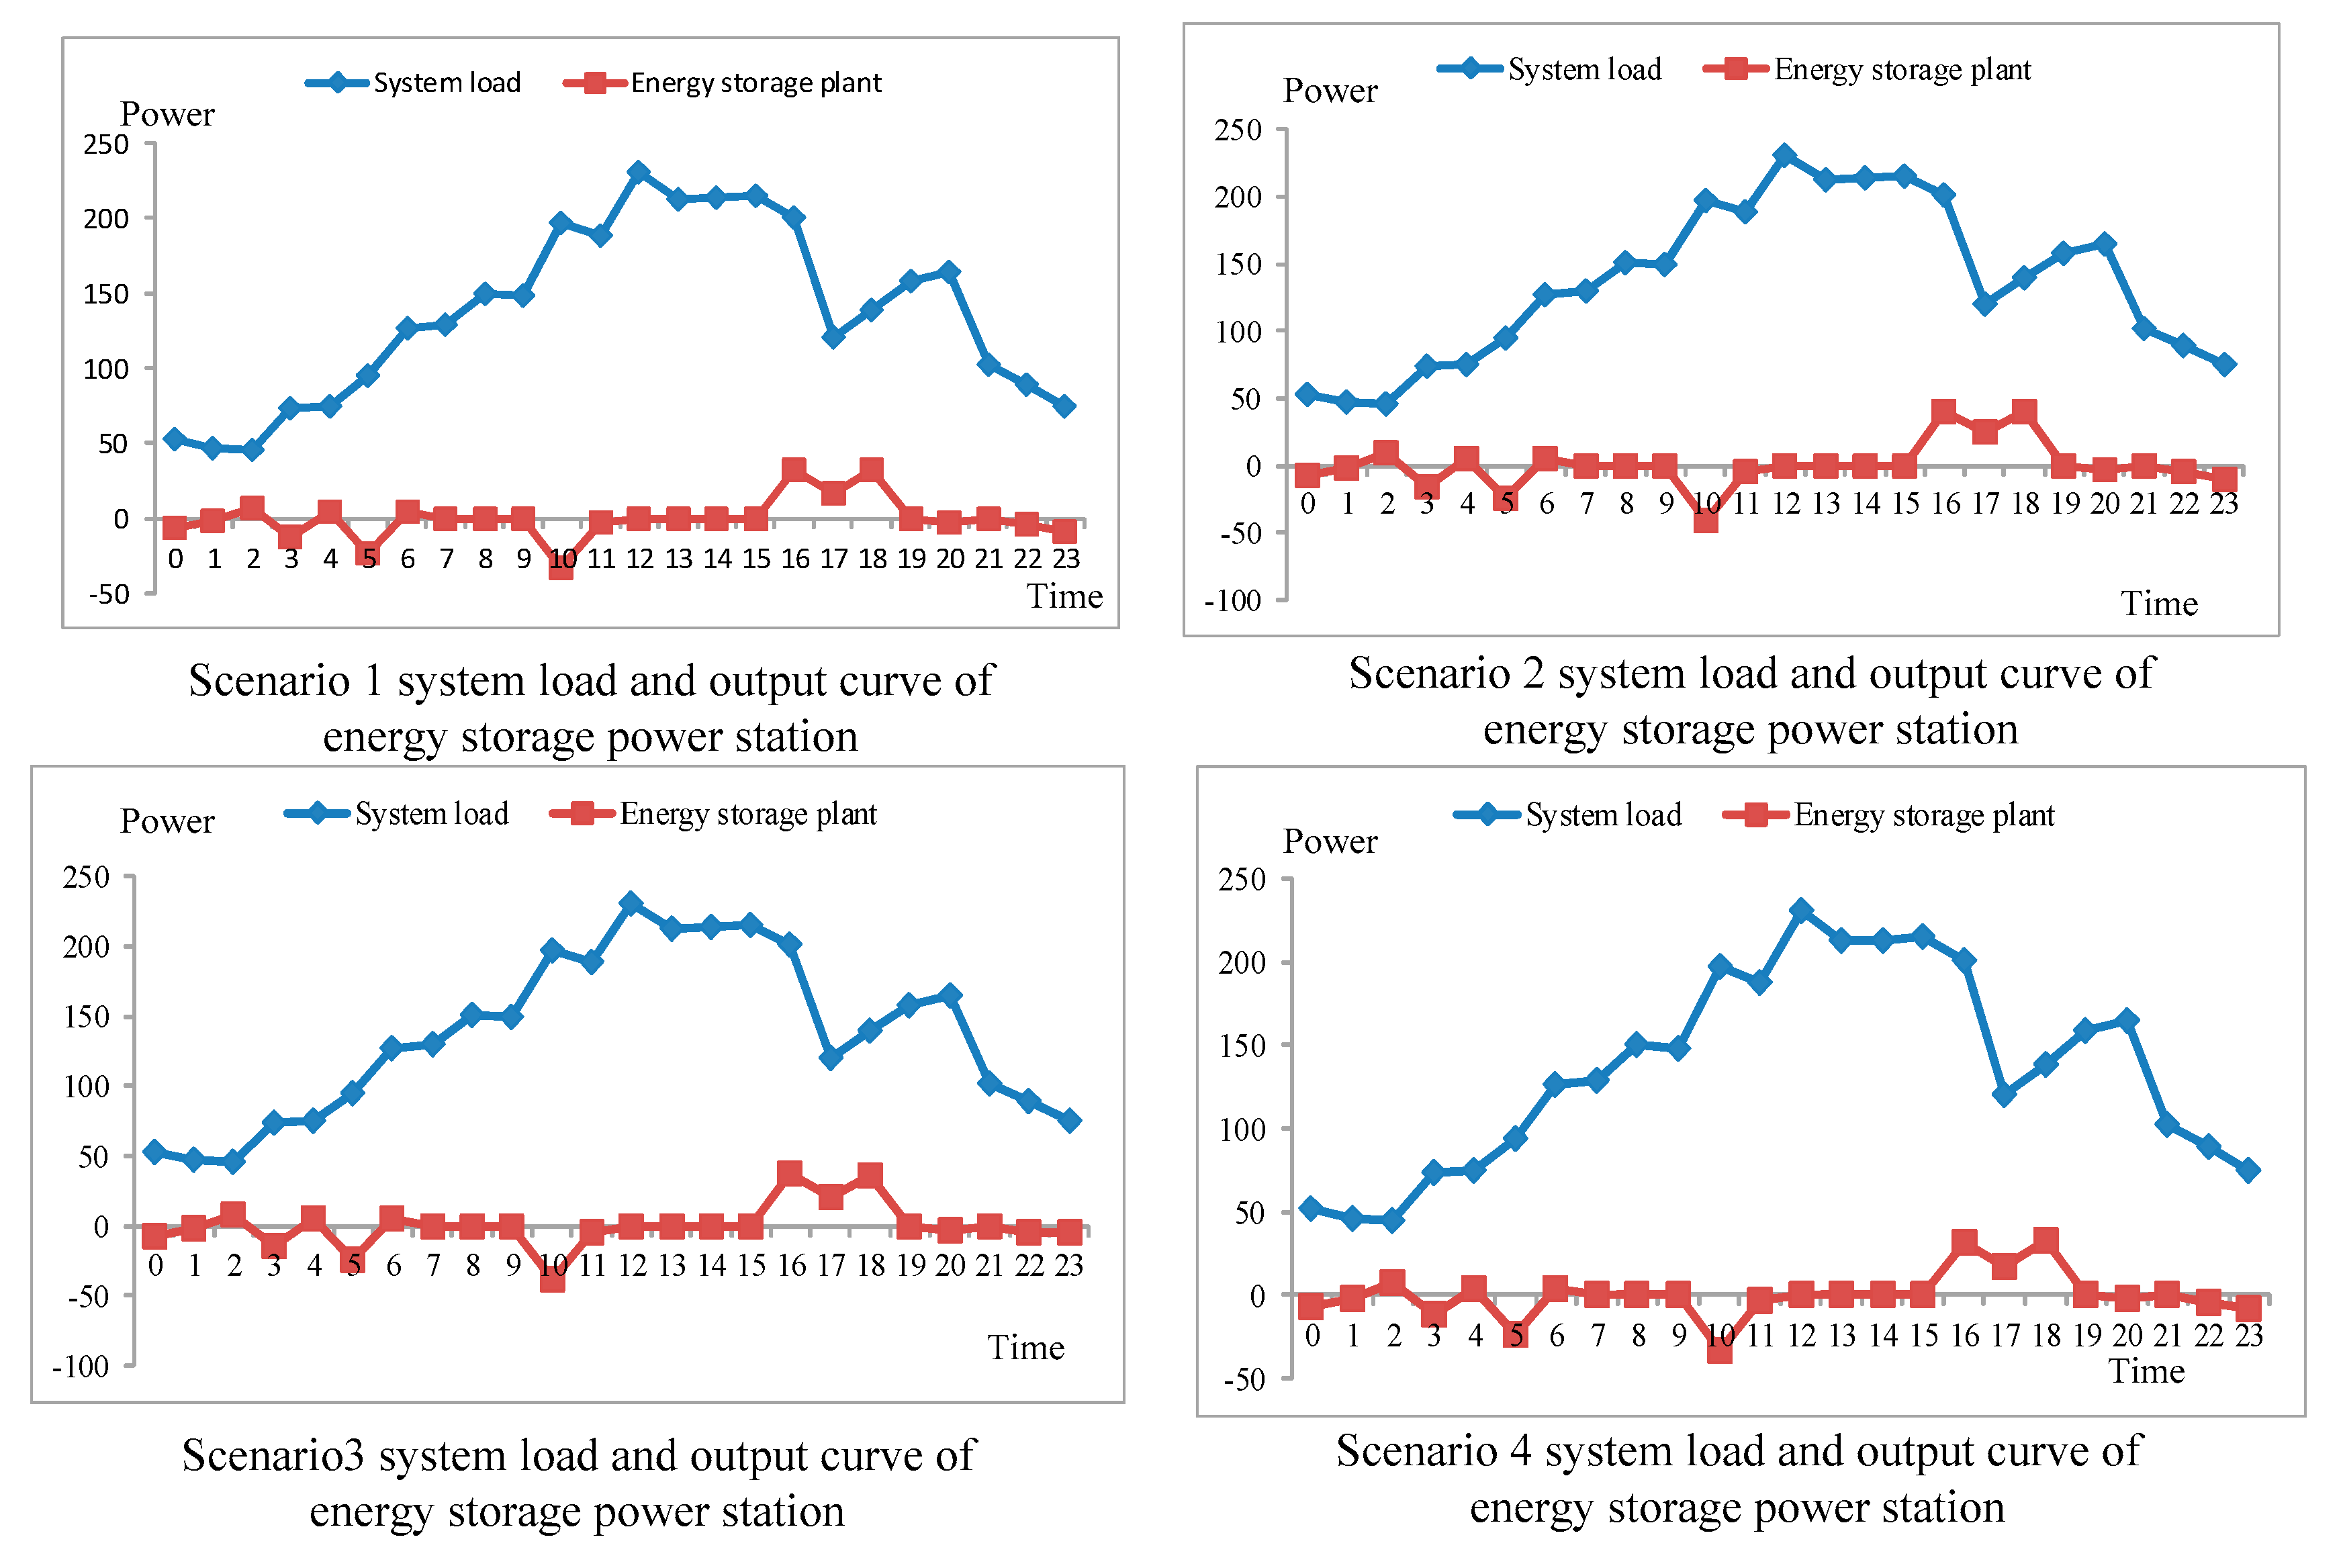
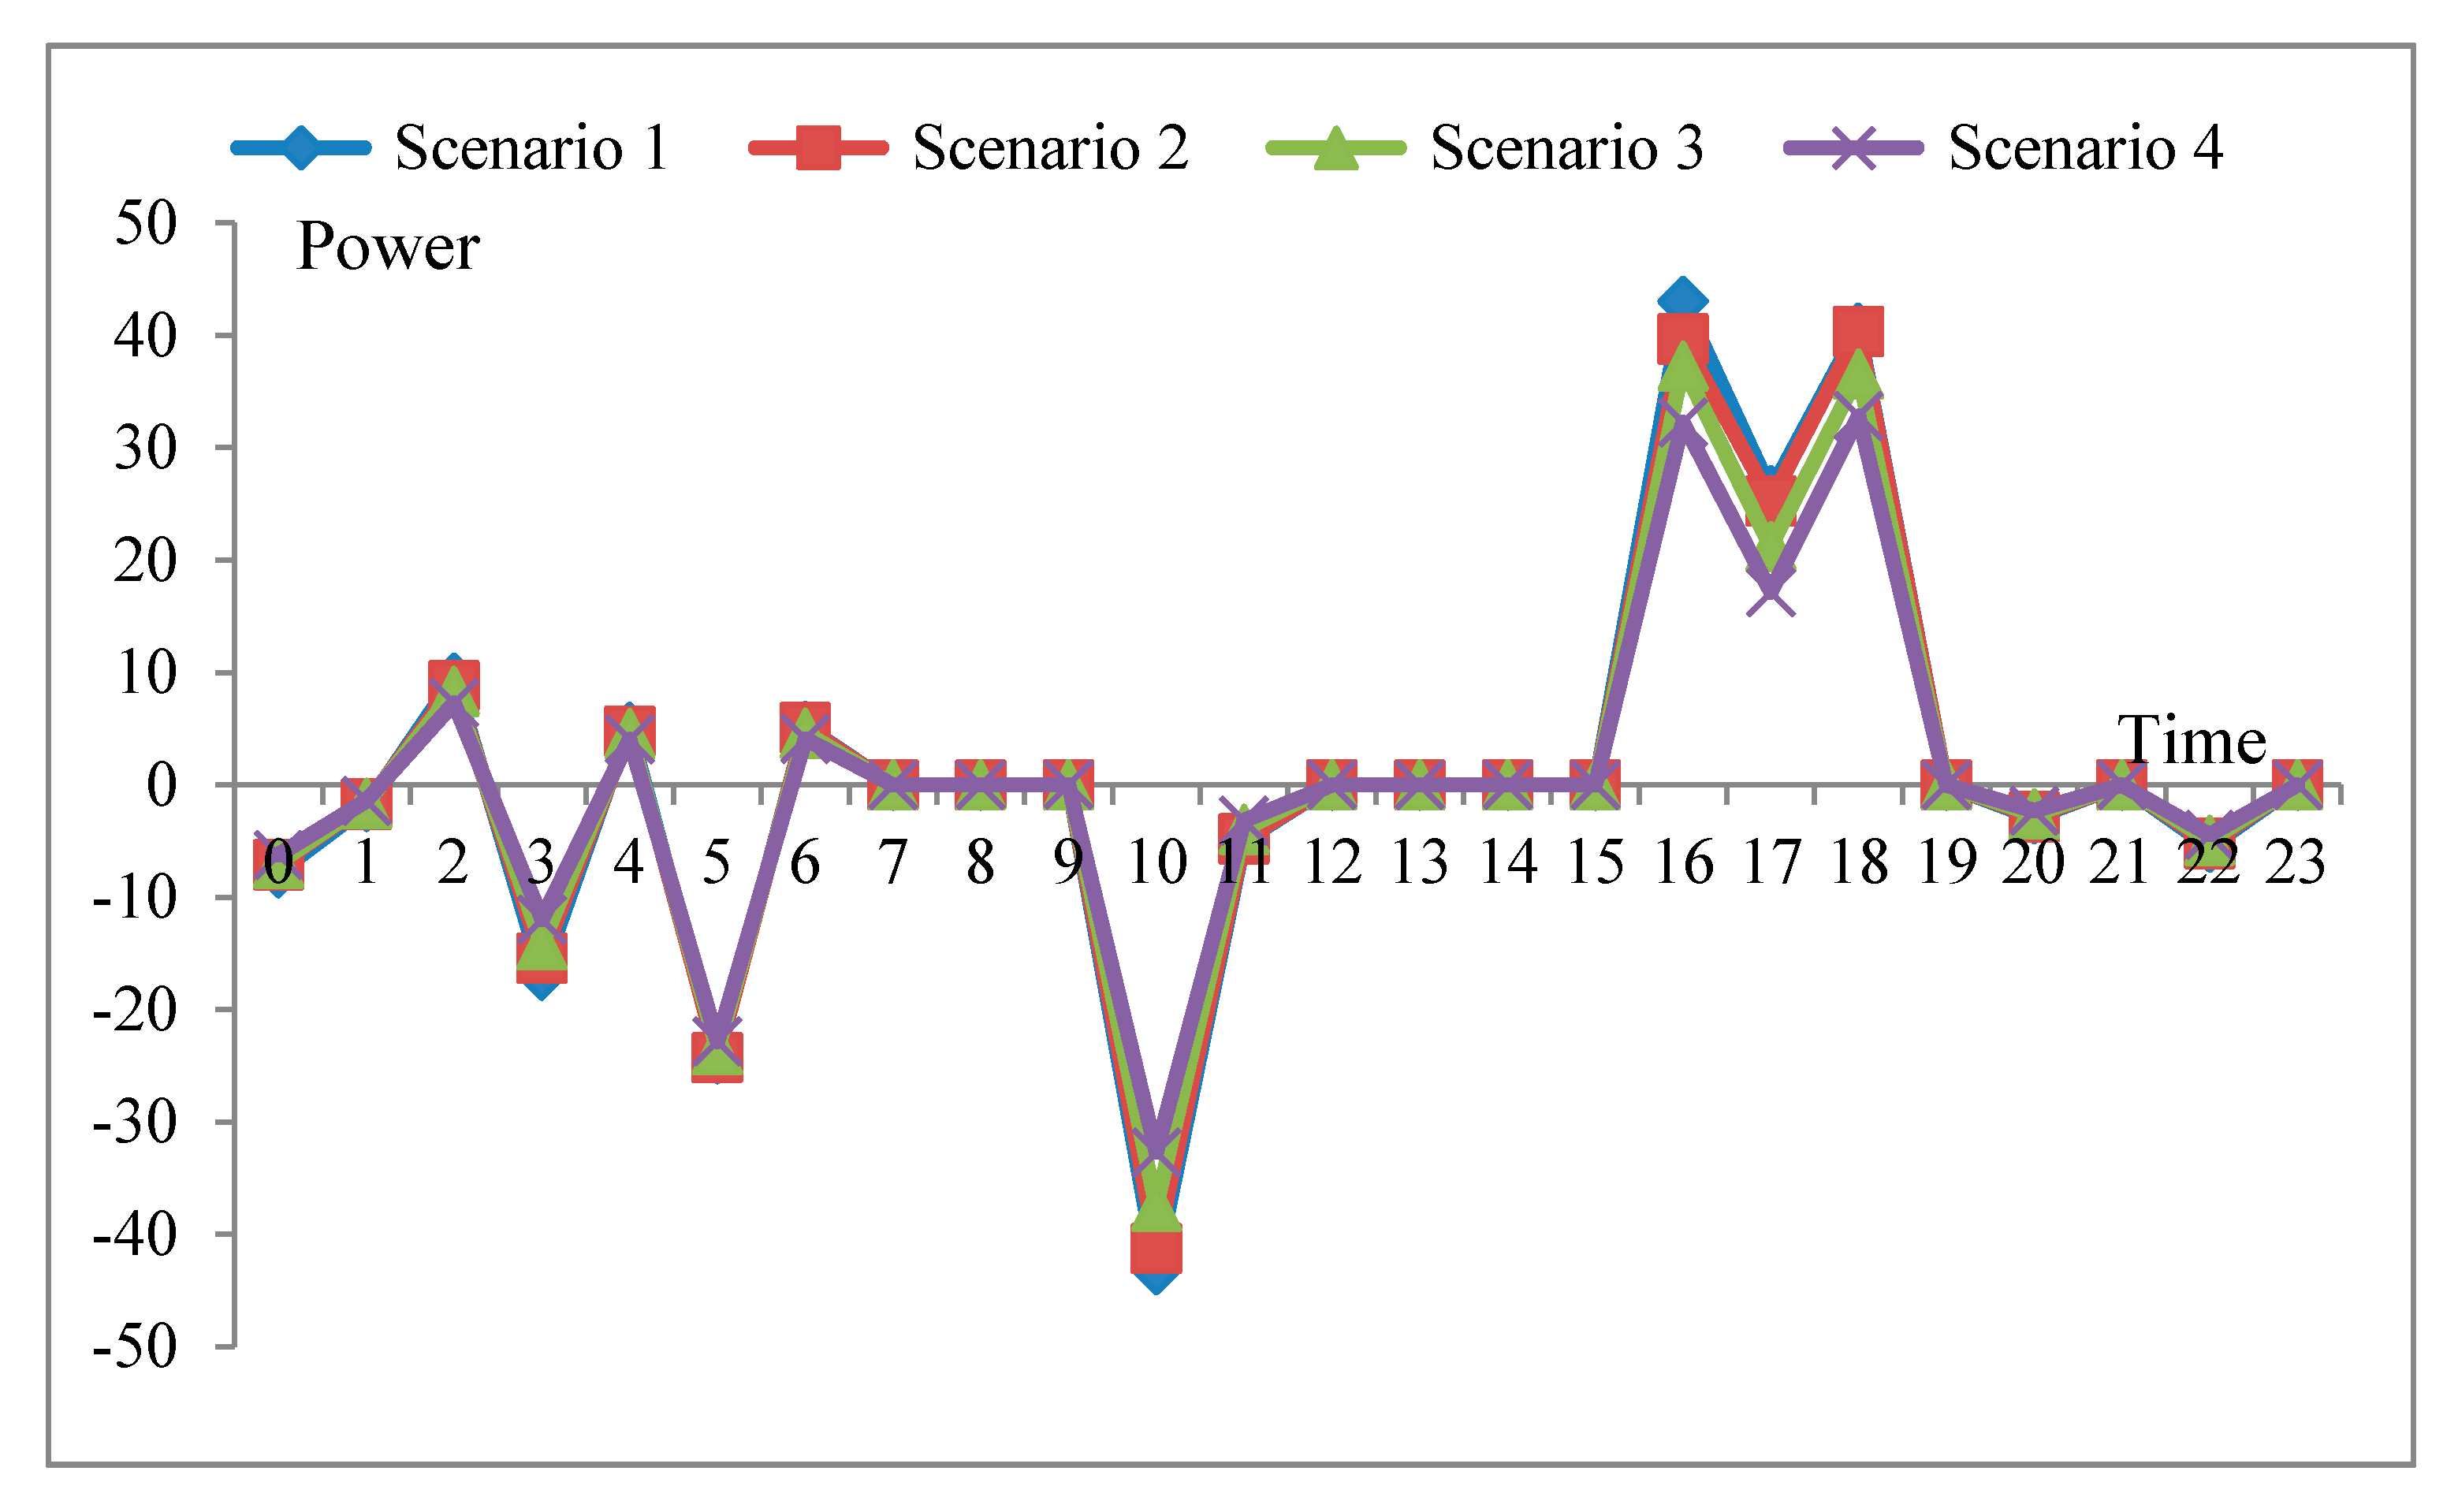
4.3.1. Analysis of System Load and Output of Storage Power Station under Different Scenarios

The above optimization model was solved by the CPLEX, which is an optimization engine in International Business Machines Corporation (IBM). In this paper, the optimal model of electricity purchase and sales in the multi-level market was established, and the parameters of chance constraints were selected according to the risk preference of the decision-makers. As can be seen from the user load curve in Figure 3, the reserve output provided by the energy storage plant for load fluctuation will increase as does the risk aversion of the decision-maker.
Different scenarios correspond to different risk preferences for decision-makers. From Scenario 1 to Scenario 4, it is evident that the probability of the constraint violation of uncertain coefficients decreases with the increase in robust control coefficients. Figure 4 depicts the change in electricity load before and after installing the energy storage plant. It can be seen here that the load curve has an obvious peak-shaving and valley-filling effect, where the user transfers the load during the period of higher electricity price to the period of lower electricity price. The user load calculation results of different scenarios are shown in Figure 4:
Different constraint violation probabilities correspond to different decision-making economic risks. The smaller the constraint violation probability, the smaller the economic risks that the policy makers bear. The energy storage plant has no obvious influence on the user’s power consumption mode, and will not reduce the user’s power consumption satisfaction. It can be seen from the calculation results of Figure 5 that the output of the energy storage plant will decrease with a decrease in constraint violation probability.
As the Γ increases, the costs of the electricity sales company increases accordingly. Because the increase of the Γ leads to an increase in the frequency of the uncertainty—that is, the randomness scenario of the electricity price—the load consumption becomes worse and worse, and an increase of the electricity price, as well as an increase in load-demand level may occur. Therefore, the decision-maker dispatches the energy storage equipment output and purchases electricity from the grid to suppress the random disturbance, thereby causing the cost to gradually increase.

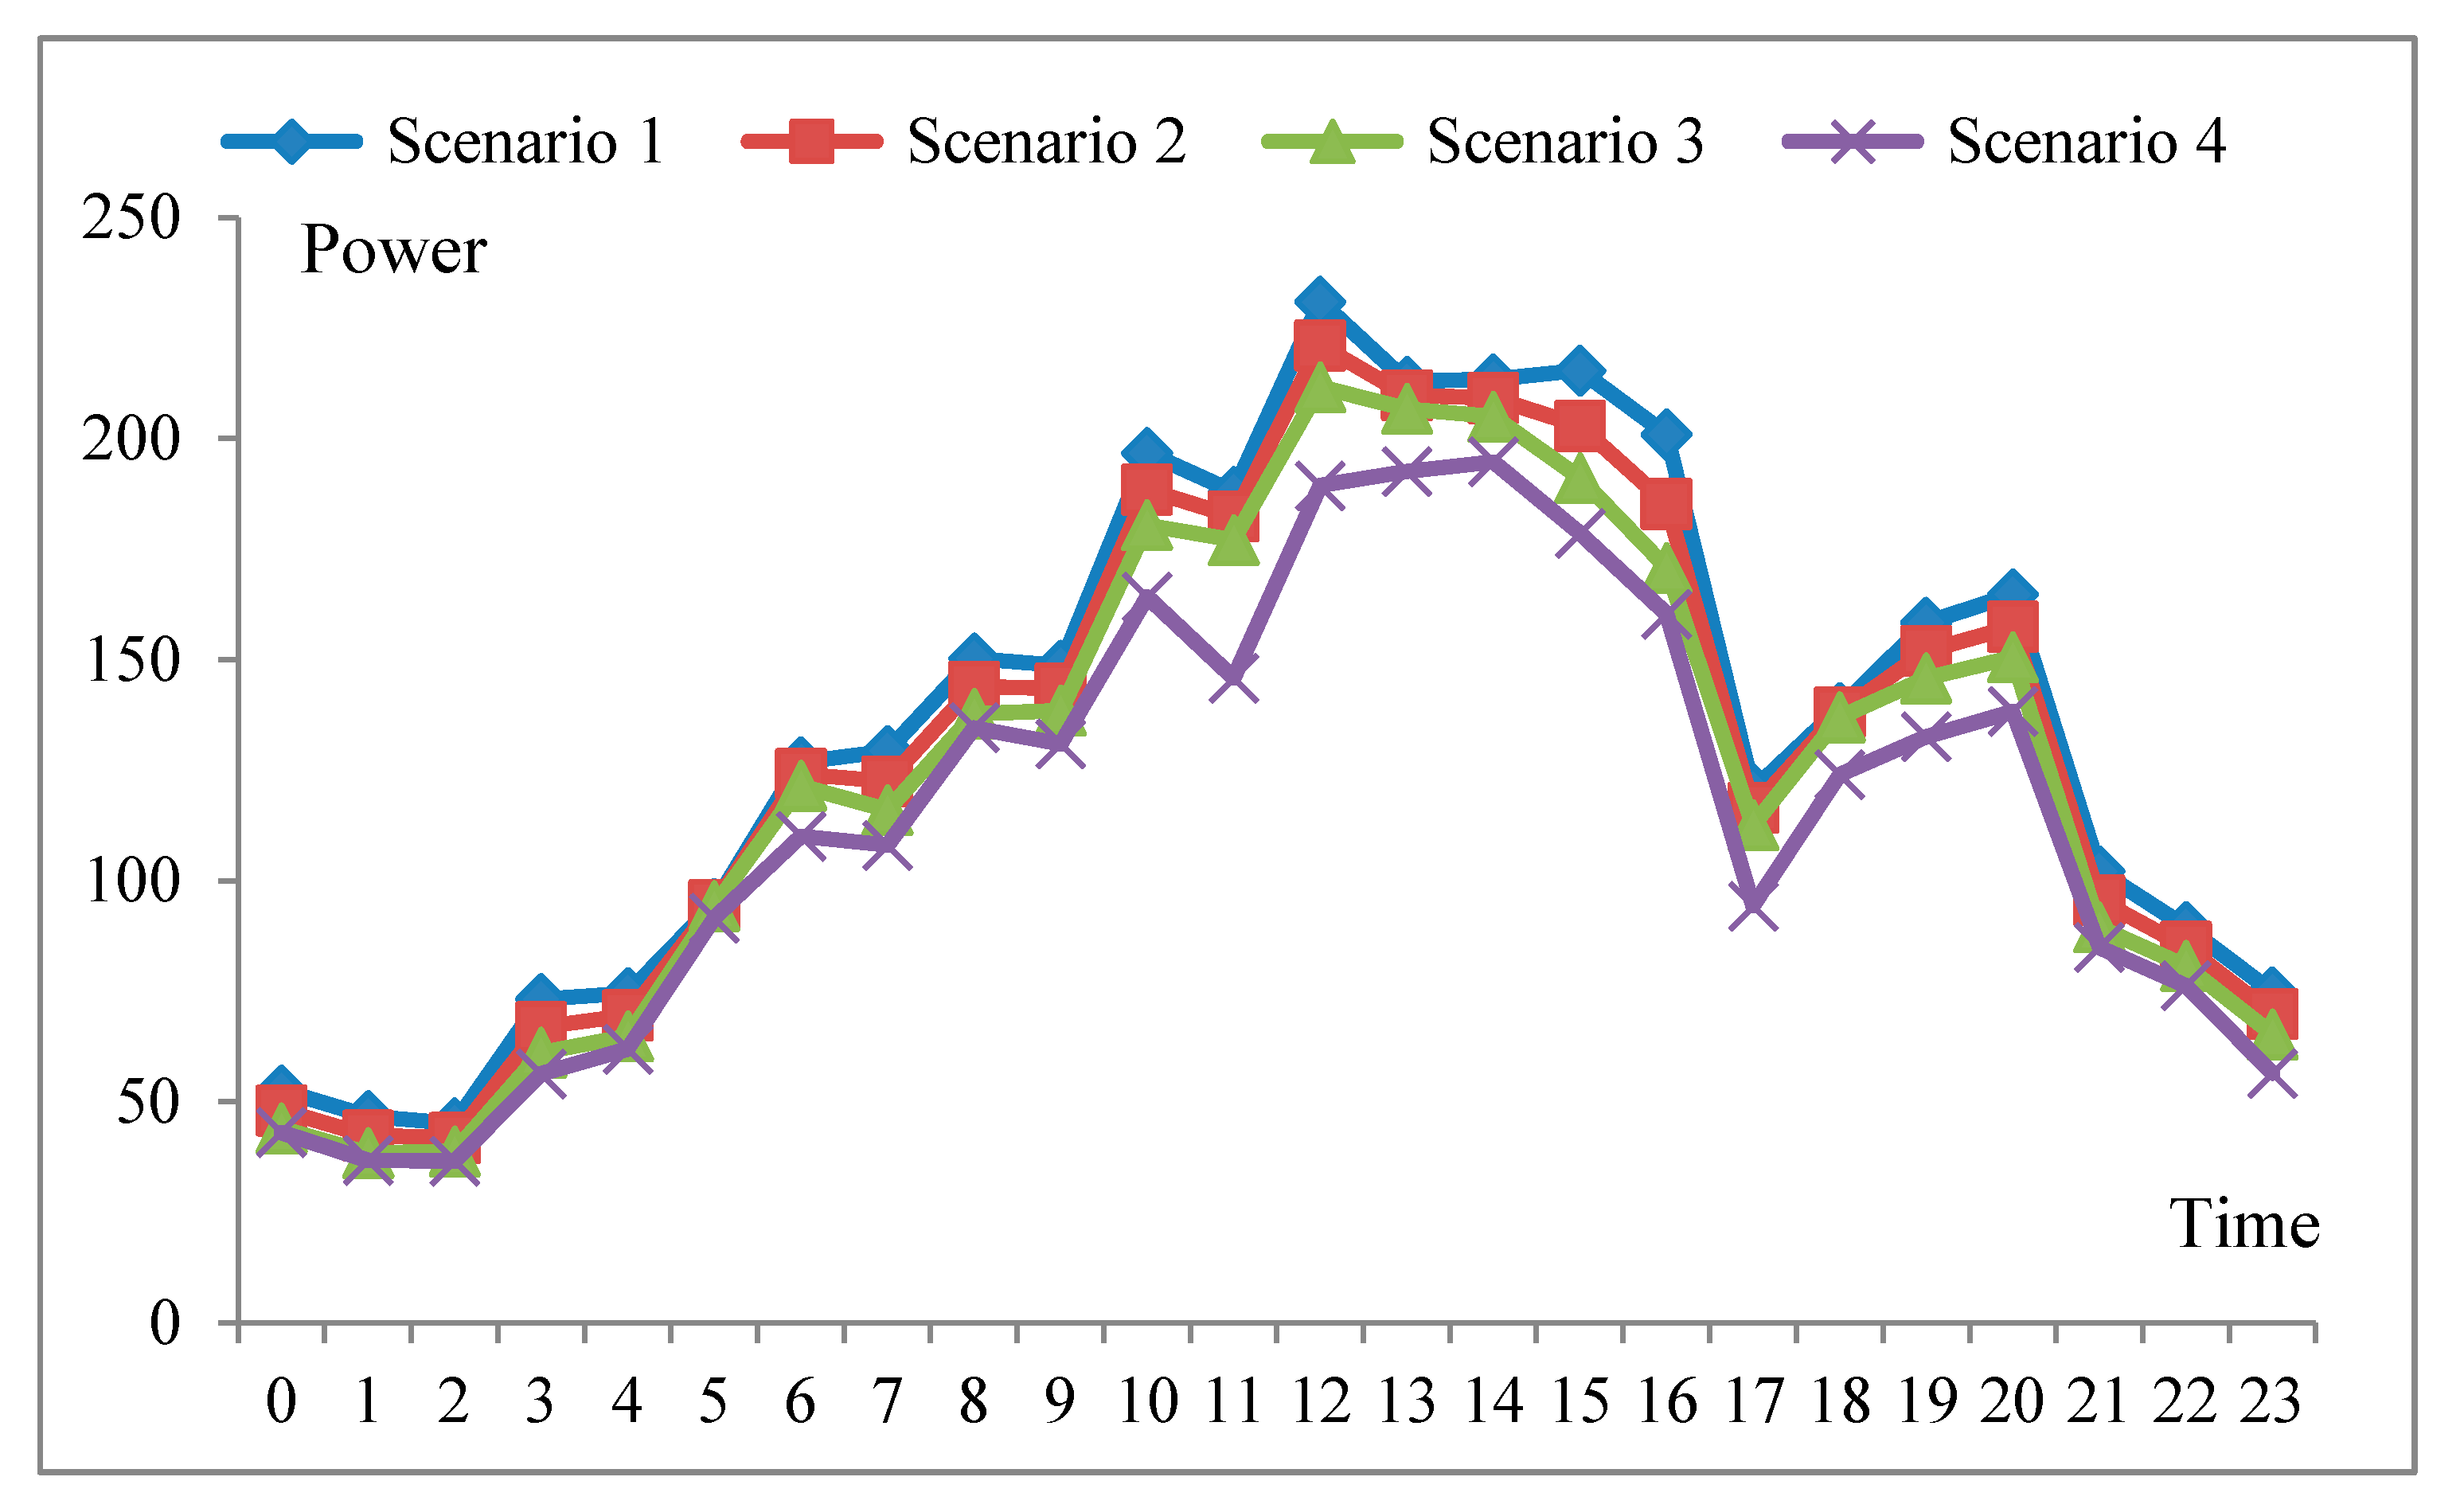
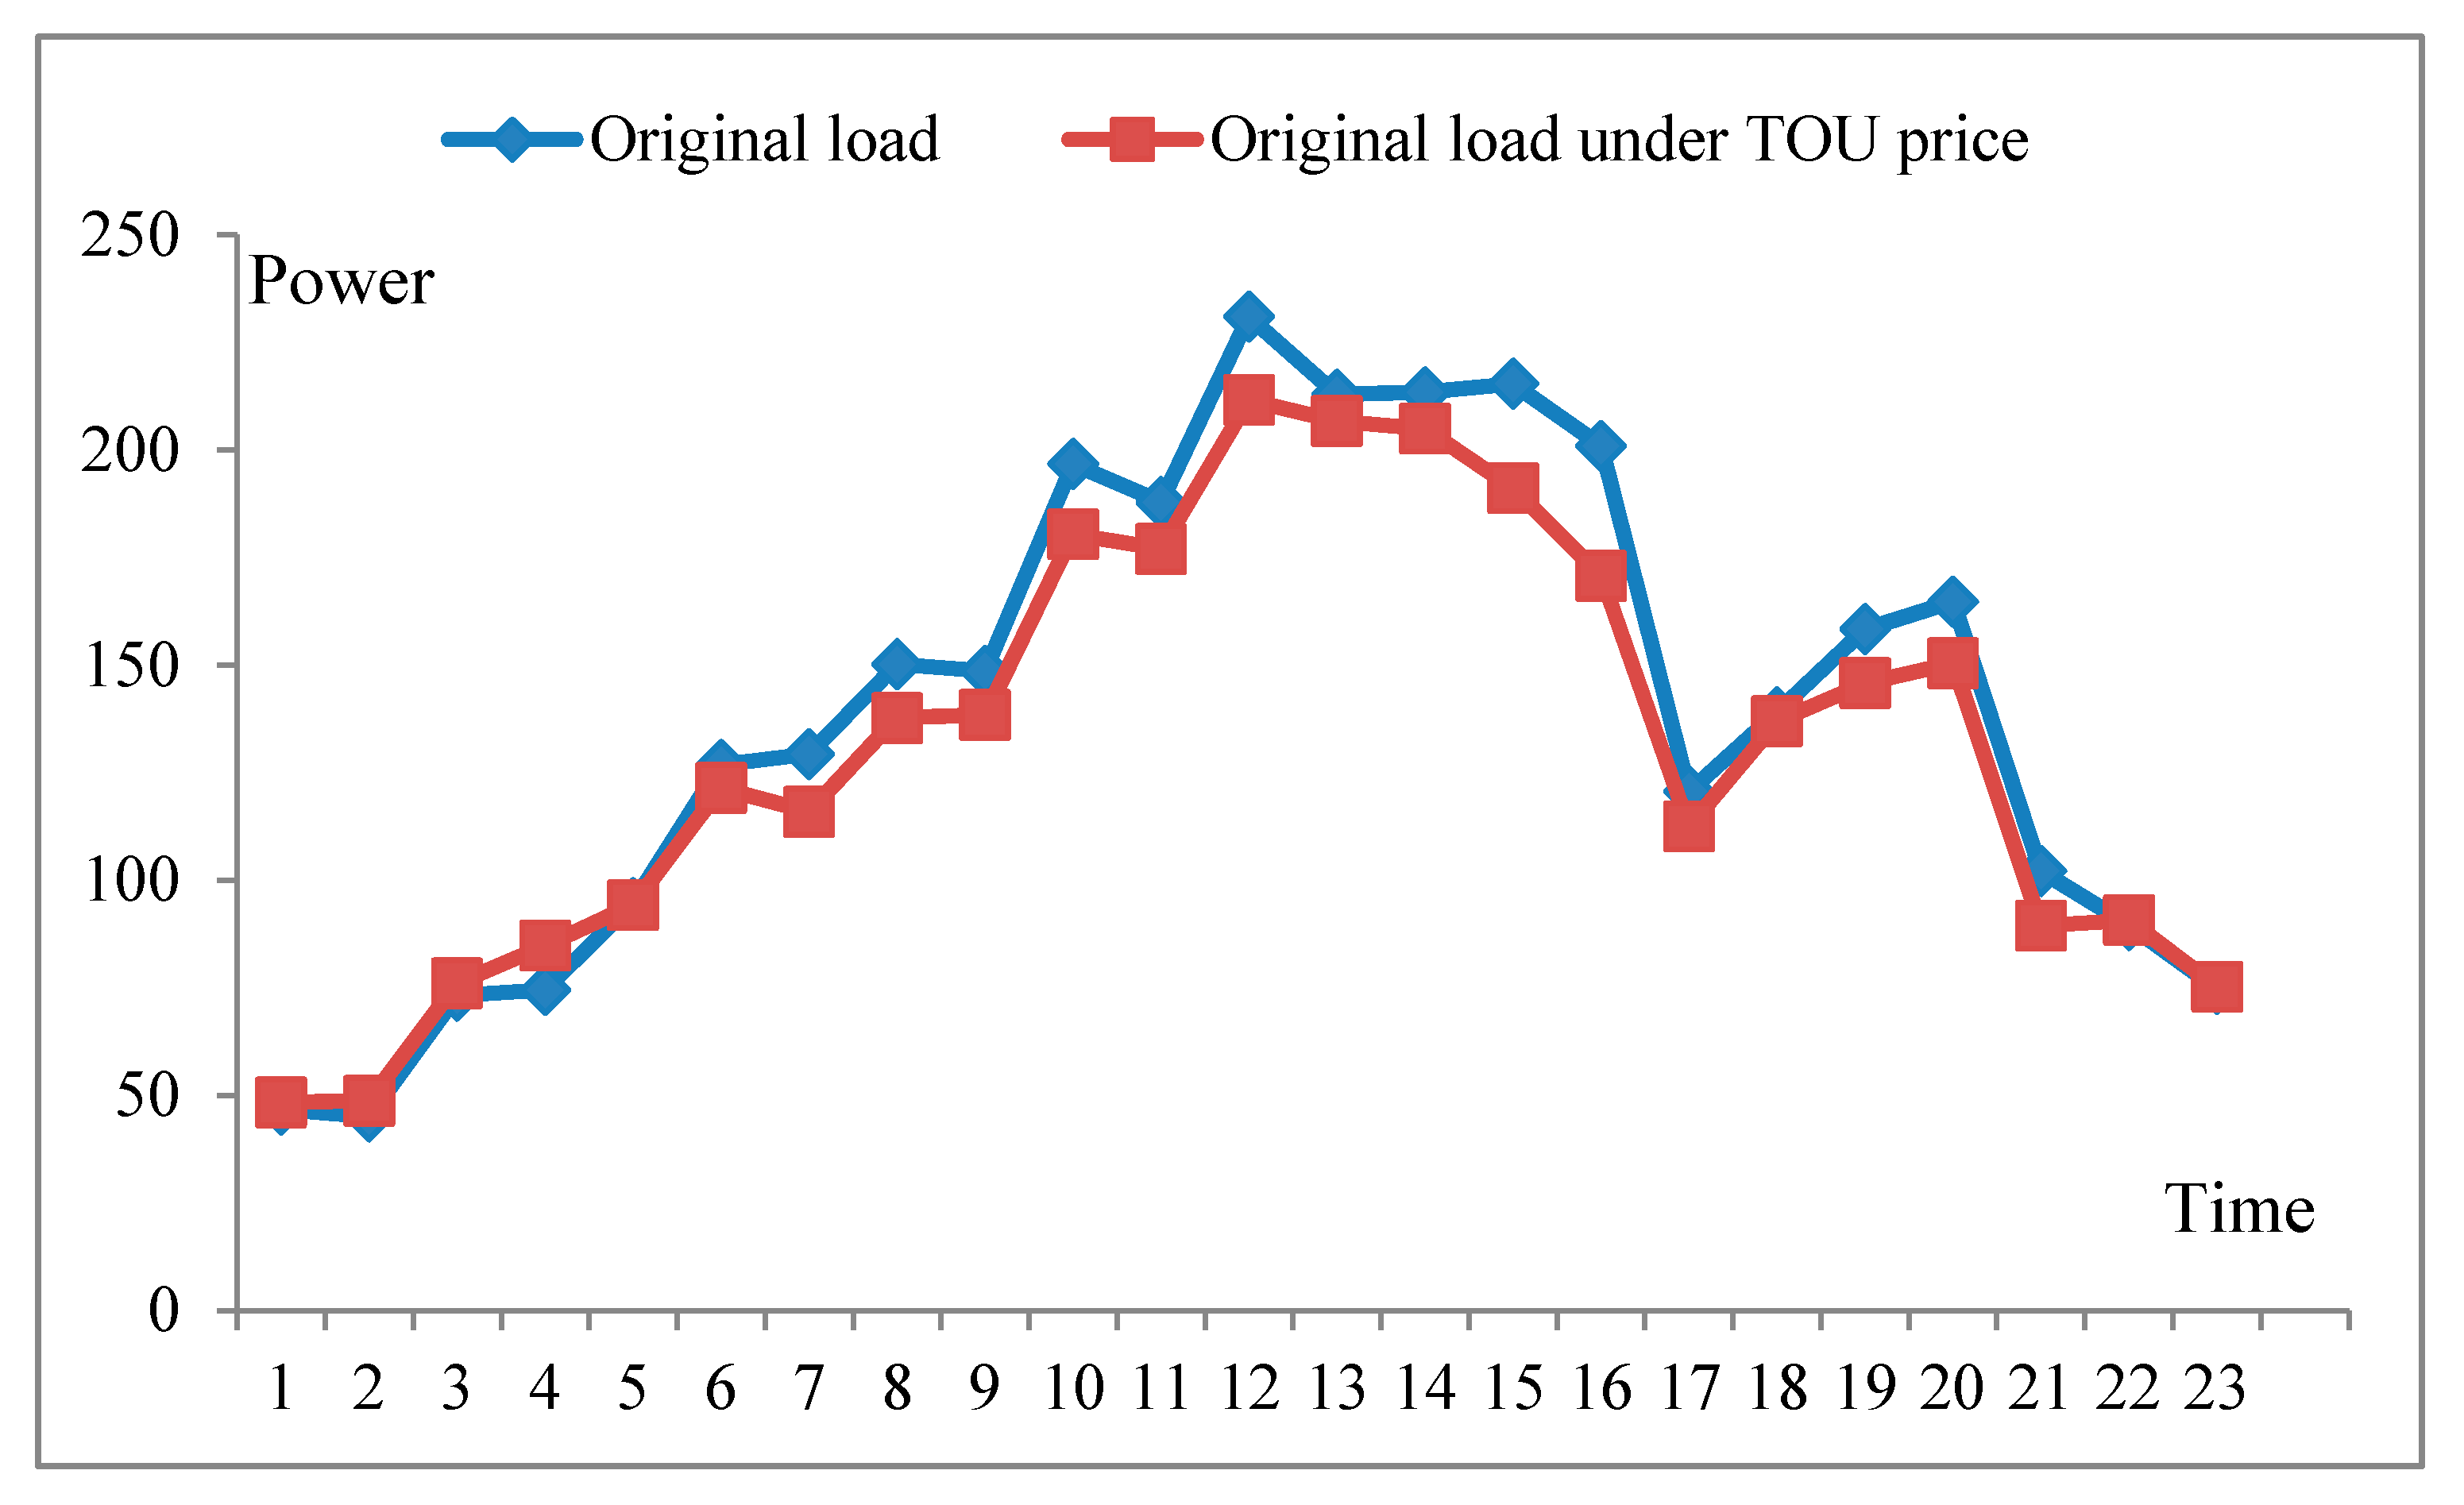
4.3.2. Analysis of Load under the Influence of TOU Price

The setting of an energy storage plant stabilized the load curve, reduced the cost of power generation and supply, and reduced the peak-valley difference. The selling company obtains economic benefits by controlling the battery-charging and discharging strategy. For users, after setting up the energy storage plant and TOU price, the average electricity price is reduced. Figure 6 shows the changes of load under the influence of the TOU price:

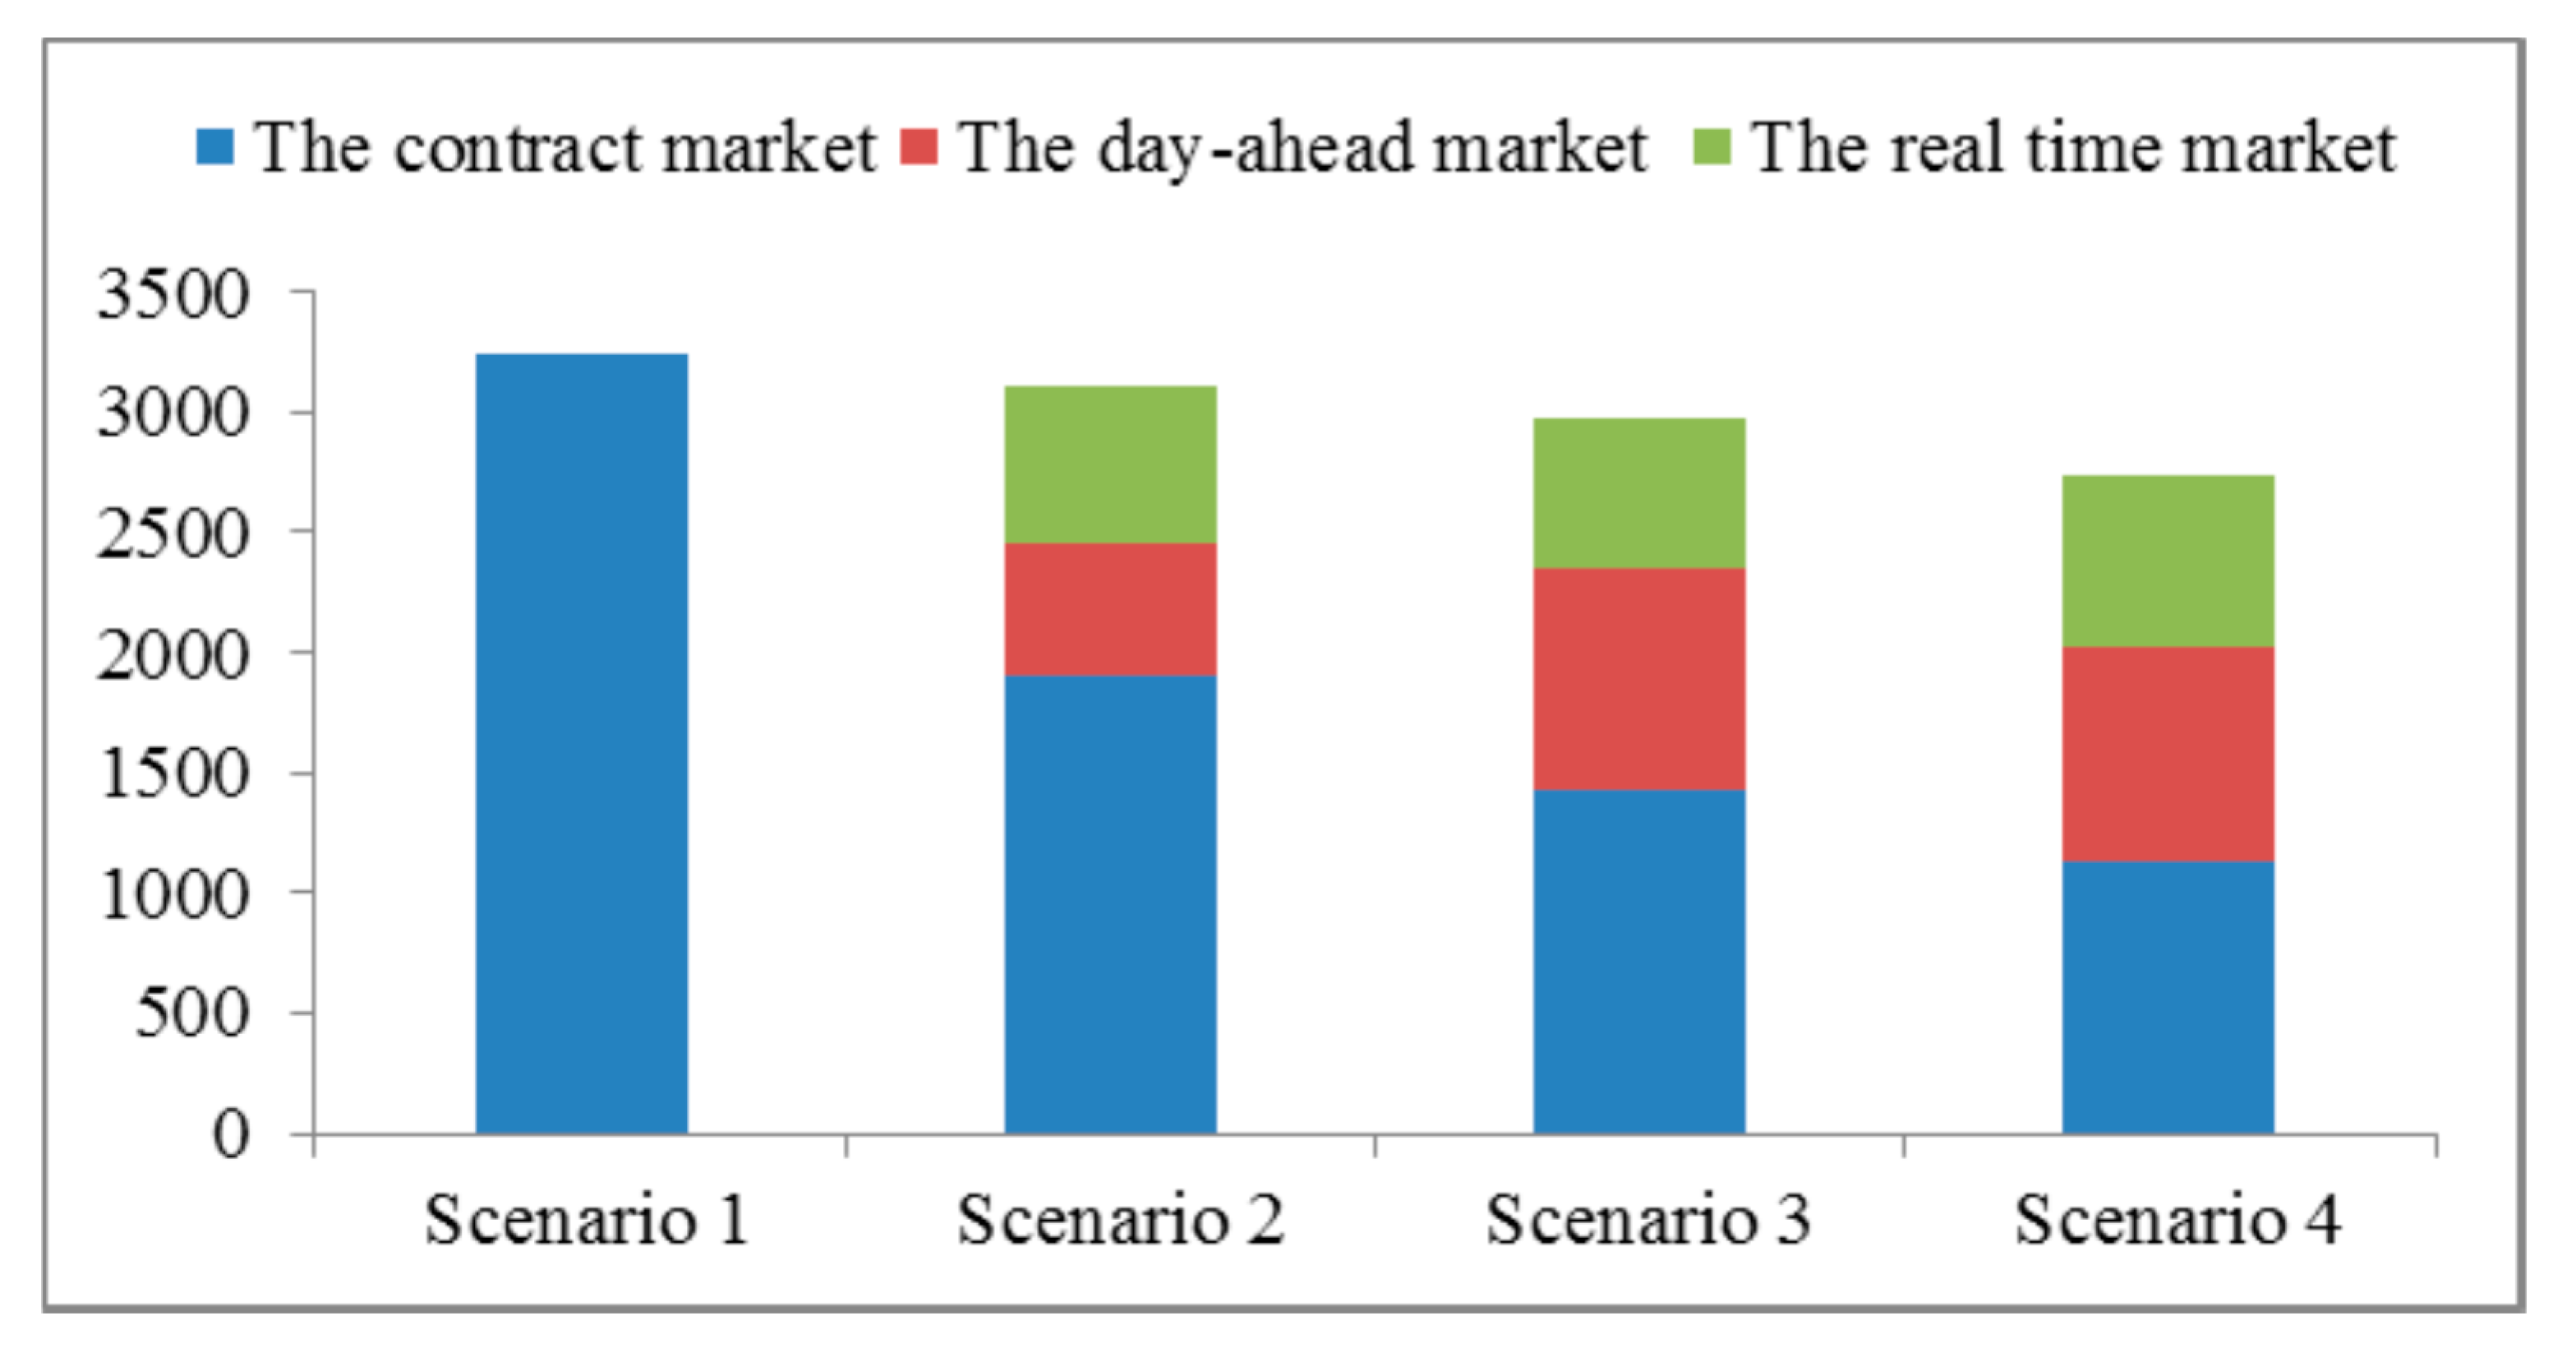
4.3.3. Analysis of Multi-Level Market Structure under Different Confidence Levels

The electricity distribution scenarios and benefits of the electricity market under different confidence levels are shown in Table 5.
From this Table, it can be seen that with an increase in the confidence level, the risk value is also increasing. Under the same conditions, if the confidence level is low, the risk aversion of investors will increase, indicating that the electricity sales companies are risk-oriented—that is, the electricity sales companies pursue high returns. When electricity sales companies are risk-averse, then electricity sales companies will increase the proportion of electricity purchases in the medium and long-term electricity market. Figure 7 shows the ratio of electricity purchases in the multi-level market under different scenarios.
Considering that the electricity price and load are risk factors, the sales company’s revenue increases with the increase in maximum risk constraint, which can be tolerated. Since the risks in the market and real-time market are greater than the risks in the contract market, considering the risk constraints, the risk can increase the revenue of the sales company; in addition, the peak-to-valley price can increase the sales revenue of the sales company.
As the market’s revenues are relatively large and the risks are also correspondingly large, power sales companies will increase the proportion of electricity purchased in the market in the past to gain greater profits. At the same time, when the price of electricity and load fluctuations are considered as risks, the proportion of electricity purchased by power-selling companies in the contract market is smaller than that of the other two cases, and the proportion of electricity purchased in the market is large. This shows that the implementation of peak and valley electricity prices on the demand side can affect the proportion of electricity purchased by power companies in various markets.

5. Conclusions

Uncertainties in purchase price and load bring certain risks to electricity sales companies. From this paper, we can draw the following conclusions:
(1) In this paper, the CVaR method was used to measure the risk faced by electricity sales companies in the multi-level market, which can accurately describe the uncertainty and provide a reference to the operation of electricity sales companies.
(2) The price of electricity purchased in different markets will affect the profit of electricity sales companies. The risk of electricity sales companies in different power markets mainly considers changes in cost. On this basis, this paper established a risk control model for the power purchasing strategy of electricity sales companies, and made use of the combination strategy of electricity sales companies under different confidence numbers.
(3) Energy storage power stations provide a new way to stabilize load fluctuation. In this paper, an exploratory study was made on the multi-market purchase and sale of electricity and storage power stations by electricity sales companies to participate in power market transactions. A multi-market optimal trading model of electricity sales companies with the participation of storage power stations was constructed. The results from an example showed that the proposed model and method was feasible and effective.
The optimal decision made by the deterministic model in solving the system with random variables tends to be poor in the random environment and may even be in a state where the decision is not feasible. Robust optimization has risk avoidance and conservation, and the optimization result is affected by the robustness coefficient and confidence level. The higher the confidence level, the smaller the change in the robustness factor will have a greater impact on the optimization results. The larger the robustness coefficient is, the more serious the actual value deviates from the predicted value, and the more conservative the optimization result.

Author Contributions

Z.T. guided the research; H.L., Q.T. and G.W. established the model, implemented the simulation and wrote this article; S.Y. collected references; L.J. and Z.R. revised the language of this article.

Funding

Project Supported by National Natural Science Foundation of China (71573084) and Beijing Municipal Social Science Foundation (16JDYJB044).

Conflicts of Interest

The authors declare no conflict of interest. It should be noted that the whole work was accomplished by the authors collaboratively. All authors read and approved the final manuscript.

Nomenclature

Γ 1 The weighted average absolute load error in statistics
Q d ( t ) The minimum load for user at time t
Q u ( t ) The minimum load for user at time t
Q ( t ) The customer load
Q f ( t ) The actual forecasting customer load
p ( t ) The day-ahead market price at time t
p u p ( t ) The day-ahead market maximum price at time t
p d o w n ( t ) The day-ahead market minimum price at time t
Γ 2 The weighted average absolute price error in statistics
p f ( t ) The actual electricity forecasting price
γ ( t ) The TOU price
Q ( t ) The user load after transferring at time t
α ( k , t ) The price elastic coefficient transferred load from time k to time t
γ ( k ) The TOU price at time k
p p The electricity price in peak period
p f The electricity price in flat period
p v The electricity price in valley period
p a The real time price
μ 1 , μ 2 , μ 3 The proportion of electricity purchased
Q p p The electricity in peak period
Q p f The electricity in flat period
Q p v The electricity in valley period
Q c ( t ) The purchase of electricity in the contract market at time t period
Q d ( t ) The purchase of electricity in the day-ahead market at time t period
Q a ( t ) The purchase of electricity in the real time market at time t period
p c The purchase of price in the contract market at time t period
p d The purchase of price in the day-ahead market at time t period
p a The purchase of price in the real time market at time t
C The cost of the electricity sales companies
f 1 The revenue of the electricity sales companies
f 2 The peak-valley difference
g k , s ( t ) power output of energy storage plant
p 0 The original power supply price

References

  1. O’Mahoney, A.; Denny, E. Electricity prices and generator behavior in gross pool electricity markets. Energy Policy 2013, 63, 628–637. [Google Scholar] [CrossRef]
  2. Imran, K.; Kockar, I. A technical comparison of wholesale electricity markets in North America and Europe. Electric Power Syst. Res. 2014, 108, 59–67. [Google Scholar] [CrossRef]
  3. Qin, Z.; Xifan, W.; Jianxue, W. Electricity purchasing and selling risk decision for power supplier under real-time pricing. Autom. Electric Power Syst. 2010, 34, 22–27. [Google Scholar]
  4. Gang, L.; Jichun, L.; Zhenbo, W.; Junyong, L.; Yang, L.; Dan, L.; Hu, T. Analysis of game among multi-agents in electrical power market with integration of distributed generation. Power Syst. Prot. Control 2016, 44, 1–9. [Google Scholar]
  5. Li, J.; Liu, J.; Xie, L.; Quan, H.; Liu, Y. Dynamic game linkage of TOU pricing between generating side and retailside. Electric Power Autom. Equip. 2012, 32, 16–19. [Google Scholar]
  6. Bompard, E.F.; Han, B. Market-based control in emerging distribution system operation. IEEE Trans. Power Deliv. 2013, 28, 2373–2382. [Google Scholar] [CrossRef]
  7. Xiaoshou, Z.; Song, X.; Su, Y. The open international experience of the power-selling market and its enlightenment. Autom. Electric Power Syst. 2016, 40, 1–8. [Google Scholar]
  8. Gang, L.; Zhongrong, W.; Zhanjun, M.; Yu, W. Electricity market based on the sale side Transaction Research. Manag. Obs. 2016, 630, 32–35. [Google Scholar]
  9. Xiaomeng, L.; Wei, L.; Jian, Z.; Jiehai, Y. Analysis of EU’s unified power marketization reform. Power Grid Technol. 2014, 38, 431–439. [Google Scholar]
  10. Arange, S.; Laraen, E. Cycles in deregulated electricity markets: Empirical evidence from two decades. Energy Policy 2011, 39, 2457–2466. [Google Scholar] [CrossRef]
  11. Wang, Z.; Chen, B.; Wang, J.; Chen, C. Networked Microgrids for Self-Healing Power Systems. IEEE Trans. Smart Grid 2016, 7, 310–319. [Google Scholar] [CrossRef]
  12. Ampatzis, M.; Nguyen, P.H.; Kling, W.L. Implementation and evaluation of an electricity market operated at district level. In Proceedings of the 2015 IEEE Eindhoven PowerTech, Eindhoven, The Netherlands, 29 June–2 July 2015; IEEE: Eindhoven, The Netherlands, 2015; pp. 1–6. [Google Scholar]
  13. Khazaei, H.; Vahidi, B.; Hosseinian, S.H.; Rastegar, H. Two-level decision-making model for a distribution company in day-ahead market. IET Gener. Transm. Distrib. 2015, 9, 1308–1315. [Google Scholar] [CrossRef]
  14. An, W.; Weifang, H.; Wei, Z. Analysis of the pricing mechanism of UK transmission network fees. Mingnan Power Grid Technol. 2015, 9, 3–8. [Google Scholar]
  15. Li, M.; Xiaodong, Z.; Zhe, W. Experience and Enlightenment of the Opening of the Electricity-selling Market in France. China South. Power Grid Technol. 2015, 9, 9–12. [Google Scholar]
  16. Chen, H.; Songhuai, D.; Juan, S. Discussion on the power purchase route and business model of China’s electricity sales companies under the background of new electricity reform. Power Syst. Technol. 2016, 40, 3293–9299. [Google Scholar]
  17. Algarni, A.A.; Bhattacharya, K. A Generic Operations Framework for Discos in Retail Electricity Markets. IEEE Trans. Power Syst. 2009, 24, 356–367. [Google Scholar] [CrossRef]
  18. Hatami, A.; Seifi, H.; Sheikh-El-Eslami, M.K. Stochastic-Based Decision-Making Framework for an Electricity Retailer: Time-of-Use Pricing and Electricity Portfolio Optimization. IEEE Trans. Power Syst. 2011, 26, 1808–1816. [Google Scholar] [CrossRef]
  19. Hao, Z.; Fuqiang, Z. Calculation of Short-Term Financial Risk in Electricity Market by VAR Historical Simulation Method. Autom. Electric Power Syst. 2004, 28, 14–18. [Google Scholar]
  20. Mianbin, W.; Zhongfu, T.; Rong, Z. Purchase Power Portfolio Model and an Empirical Analysis Based on Risk Measure with Fractal Value-at-Risk. Proc. CSUEPSA 2009, 21, 11–16. [Google Scholar]
  21. Chen, Y.; Zhao, J.; Wen, F.; Yang, S.; Fang, R. A Skewness-VaR Based Dynamic Electricity Purchasing Strategy for Power Supply Companies/Electricity sales company. Autom. Electric Power Syst. 2011, 35, 25–29. [Google Scholar]
  22. Liu, W.; Shang, J.; Zhou, W.; Wen, F.; Lin, Z. Evaluation of Value-at-Risk in Electricity Markets Based on Multifractal Theory. Autom. Electric Power Syst. 2013, 37, 48–54. [Google Scholar]
  23. Yang, W.; Yu, R.; Nambiar, M. Quantifying the Benefits to Consumers for Demand Response with a Statistical Elasticity Model. IET Gener. Transm. Distrib. 2014, 8, 503–515. [Google Scholar] [CrossRef]
  24. Fangzheng, S.; Jianhua, J. Optimal Purchasing Strategy of the Electricity Supply Company Under Multi-options. Autom. Electric Power Syst. 2007, 31, 36–39, 107. [Google Scholar]
  25. Zhang, Q.; Wang, X. Hedge Contract Characterization and Risk-Constrained Electricity Procurement. IEEE Trans. Power Syst. 2009, 24, 1547–1558. [Google Scholar] [CrossRef]
  26. Çelebi, E.; Fuller, J.D. A Model for Efficient Consumer Pricing Schemes in Electricity Markets. IEEE Trans. Power Syst. 2007, 22, 60–67. [Google Scholar] [CrossRef]
  27. Stanton, P.J.; Cummings, S.; Molesworth, J.; Sewell, T. Marketing Strategies of Australian Electricity Distributors in an Opening Market. J. Bus. Ind. Mark. 2001, 16, 81–93. [Google Scholar] [CrossRef]
  28. Müllera, M.; Sensfuß, F.; Wietschel, M. Simulation of Current Pricing Tendencies in the German Electricity Market for Private Consumption. Energy Policy 2007, 35, 4283–4294. [Google Scholar] [CrossRef]
  29. Tan, Z.; Tan, Q.; Wang, Y. Bidding Strategy of Virtual Power Plant with Energy Storage Power Station and Photovoltaic and Wind Power. J. Eng. 2018, 2018, 6139086. [Google Scholar] [CrossRef]
Figure 1. Structure of the multi-level power market.
Energies 12 00145 g001
Figure 2. Algorithm flow-chart of the paper.
Energies 12 00145 g002
Figure 3. System load and output curve of the energy storage plant under different scenarios million watt (MW).
Energies 12 00145 g003
Figure 4. System load curve under different scenarios (MW).
Energies 12 00145 g004
Figure 5. Output structure of the energy storage station under different scenarios (MW).
Energies 12 00145 g005
Figure 6. Changes of load under the influence of the Time of Use (TOU) price (MW).
Energies 12 00145 g006
Figure 7. Three-level market electricity purchase ratio under different scenarios.
Energies 12 00145 g007
Table 1. The scenario settings.
ScenarioConfidence Factor
Scenario 1 Γ 1 = 0, Γ 2 = 0
Scenario 2 Γ 1 = 1, Γ 2 = 1
Scenario 3 Γ 1 = 3, Γ 2 = 3
Scenario 4 Γ 1 = 5, Γ 2 = 5
Table 2. The Time of Use (TOU) price of an electricity sales company.
PeakFlatValley
Period8:30–11:30
18:00–23:00
07:00–8:30
11:30–18:00
23:00–07:00
Price ($/MW)192.5075126.014962.50746
Table 3. The day-ahead price of the Pennsylvania-New Jersey-Maryland Interconnection (PJM) market.
TimePriceTimePrice
020.361231.95
117.011333.01
215.011432.80
314.991530.97
417.911631.25
524.981731.01
629.441831.53
730.151932.91
830.512031.31
930.642131.37
1031.252232.23
1132.022329.01
Table 4. The real time price of the PJM market.
TimePriceTimePrice
014.671224.06
117.281324.14
215.841424.07
315.591524.02
415.921625.95
516.161728.05
617.161829.12
719.031931.99
824.062031.12
924.182131.97
1023.152230.40
1124.052327.11
Table 5. Profits of the electricity market under different confidence levels.
Γ 1 ,   Γ 2 Violation of Probability μ 1 μ 2 μ 3 Profits ($)Peak and Valley DifferenceMaximum Load (MW)
053.64100378,669.8268185.89231
1500.610.180.21363,149.0559179.28221.1
341.360.480.310.21348,412.9272173.28211.6
533.130.410.330.26320,199.1801158.19194.7

