Effect of the Orientation Schemes of the Energy Collection Element on the Optical Performance of a Parabolic Trough Concentrating Collector


Abstract
:1. Introduction
2. MCRT Simulation
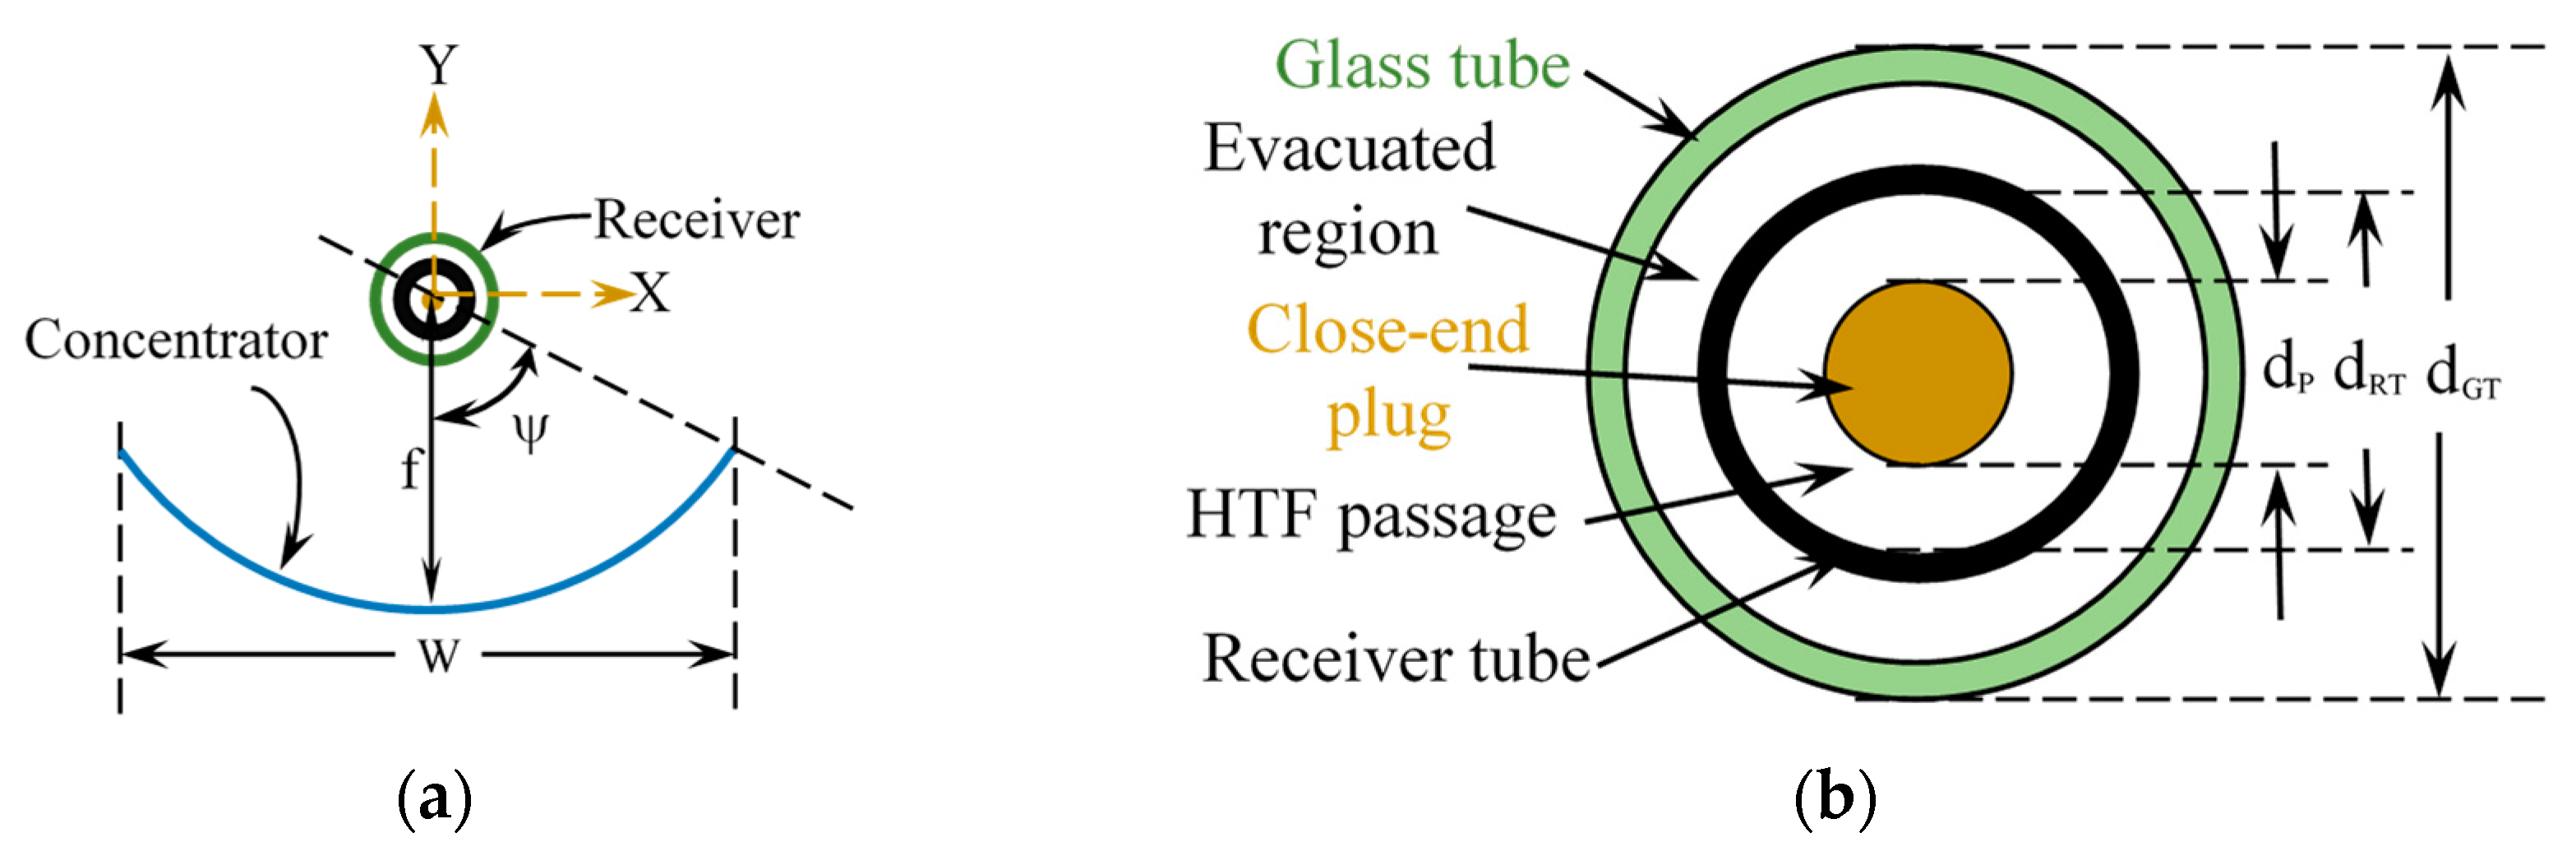
2.1. Physical Model
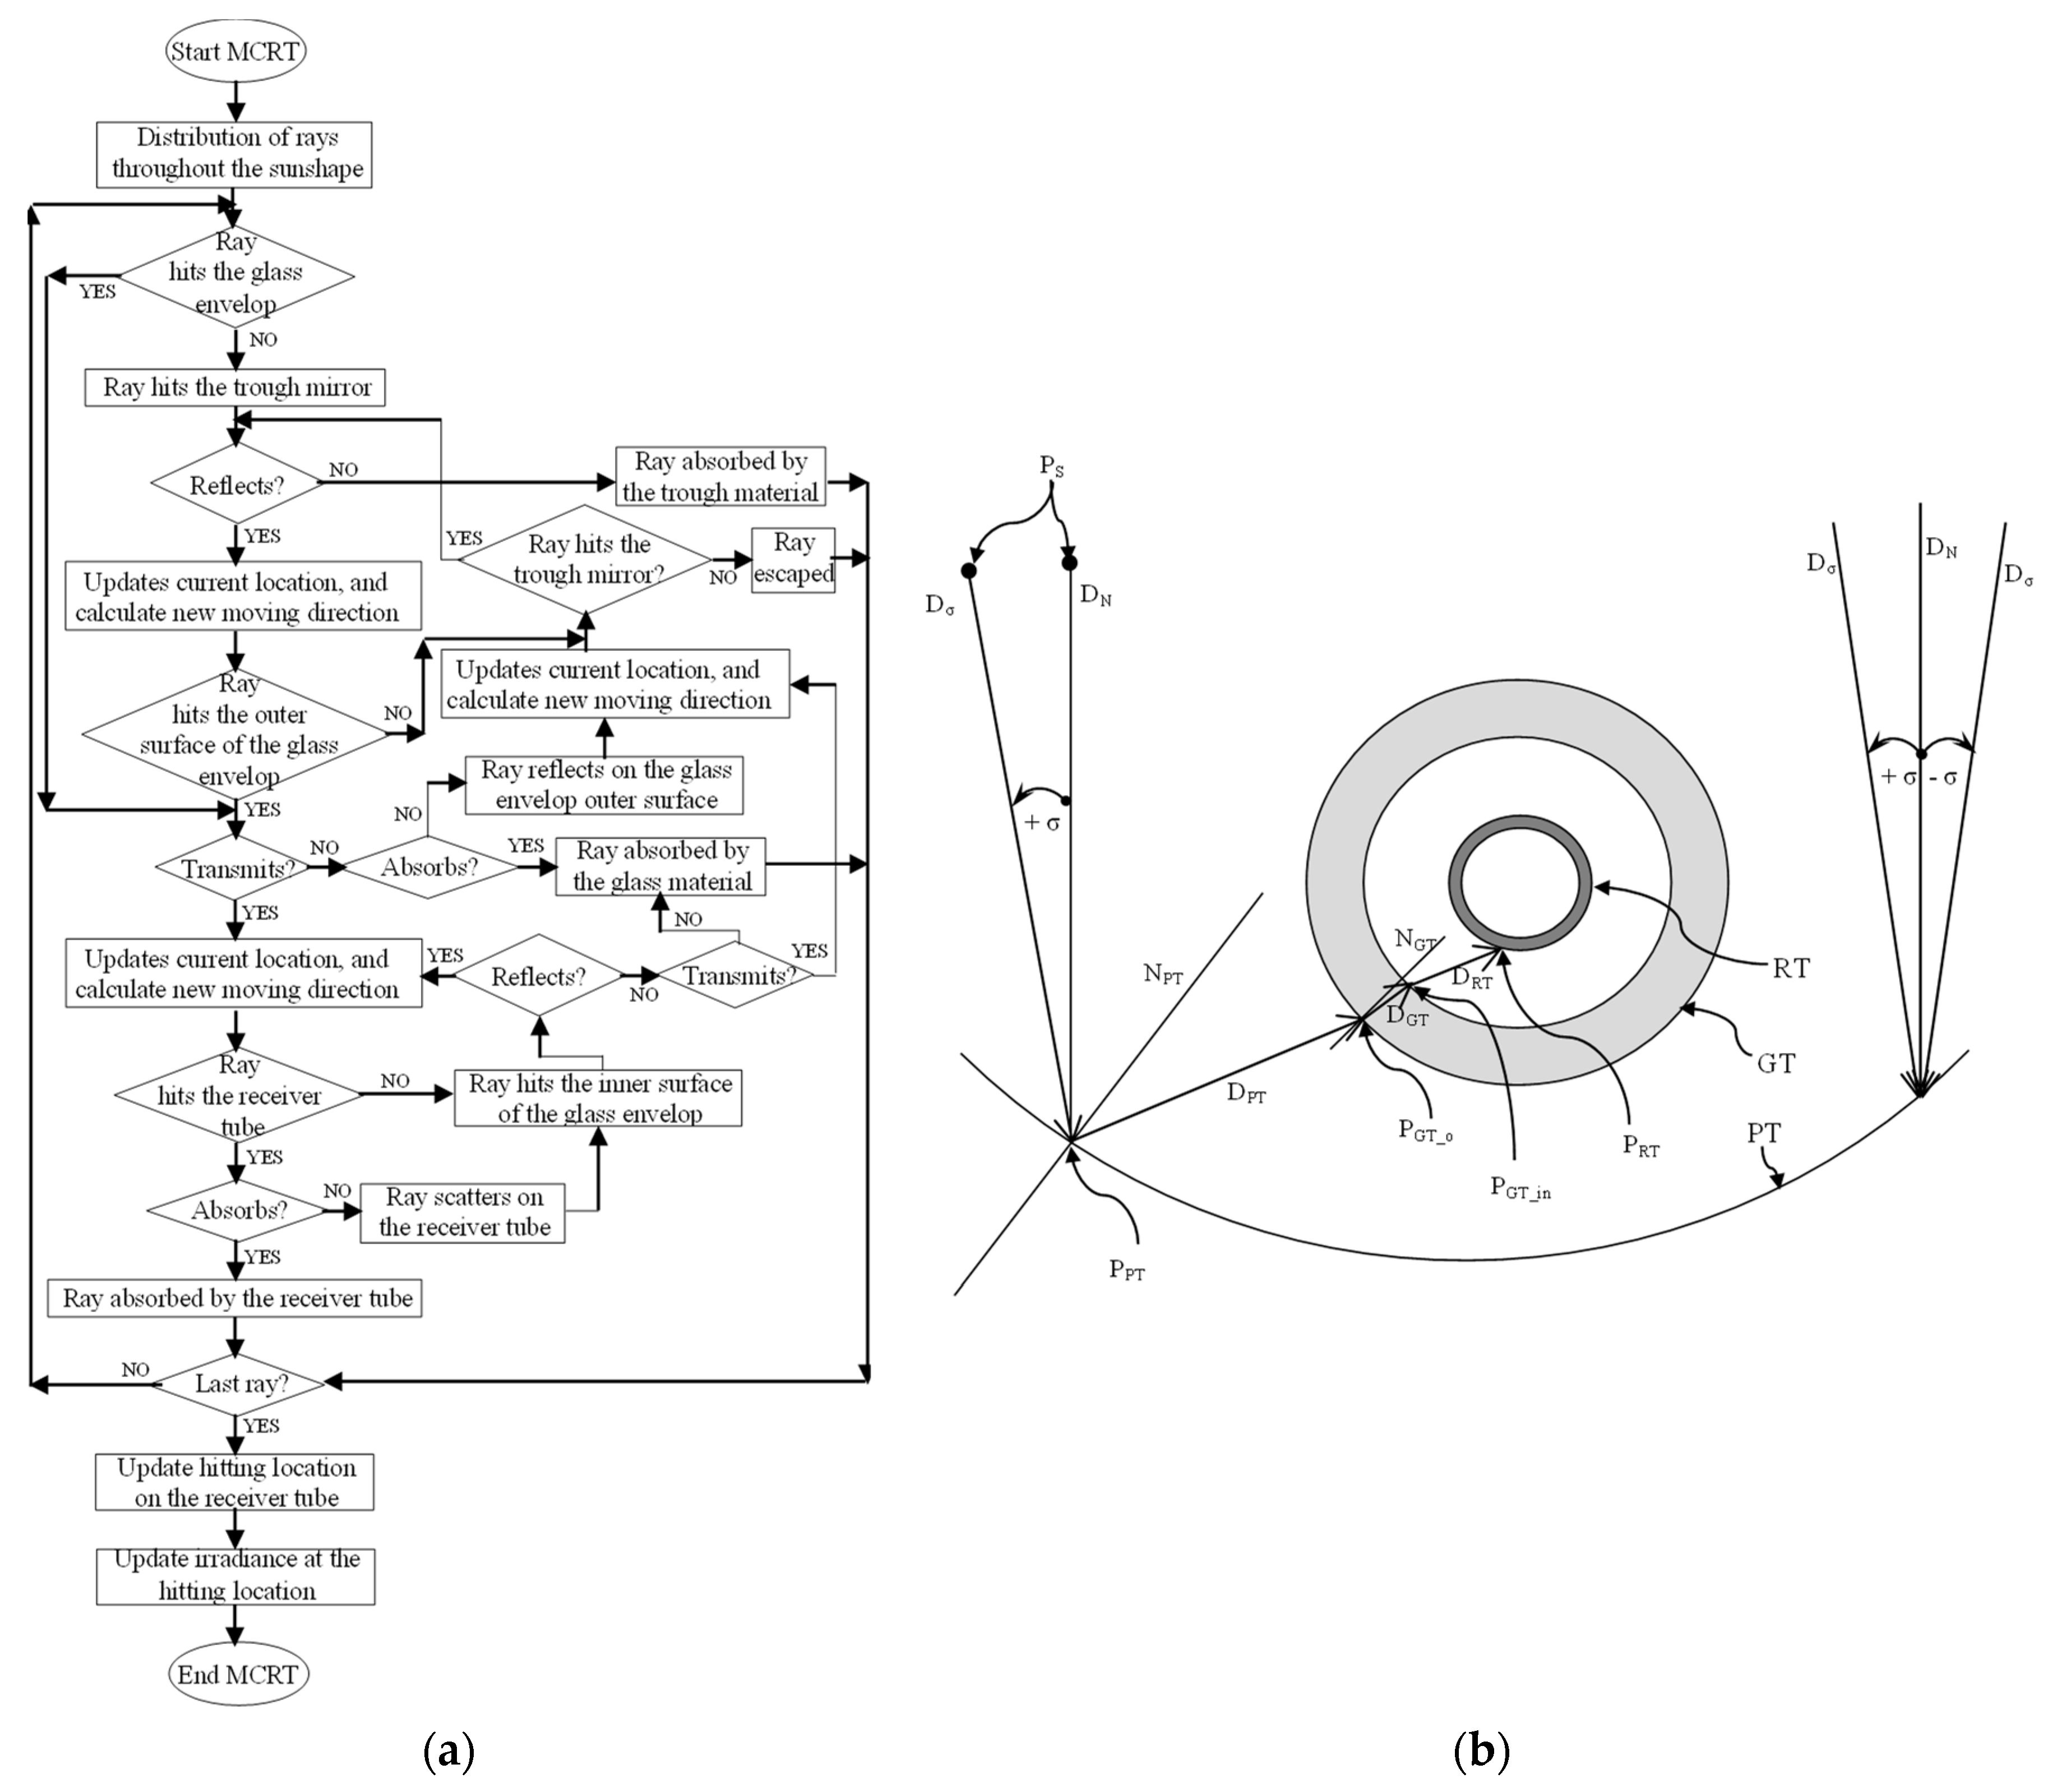
2.2. Ray Tracing Technique
- (a)
- The irradiance distribution varies across the axis and uniform along the axis of the ECE. Therefore, the length of the modelled collector was 50 cm.
- (b)
- The trough was locally specularly reflective, and the light incident was perpendicular on the trough aperture.
- (c)
- No shading from the frame and brackets.
- (d)
- No structural deformities in the trough and the receiver.
- (e)
- Diffuse light is negligible.
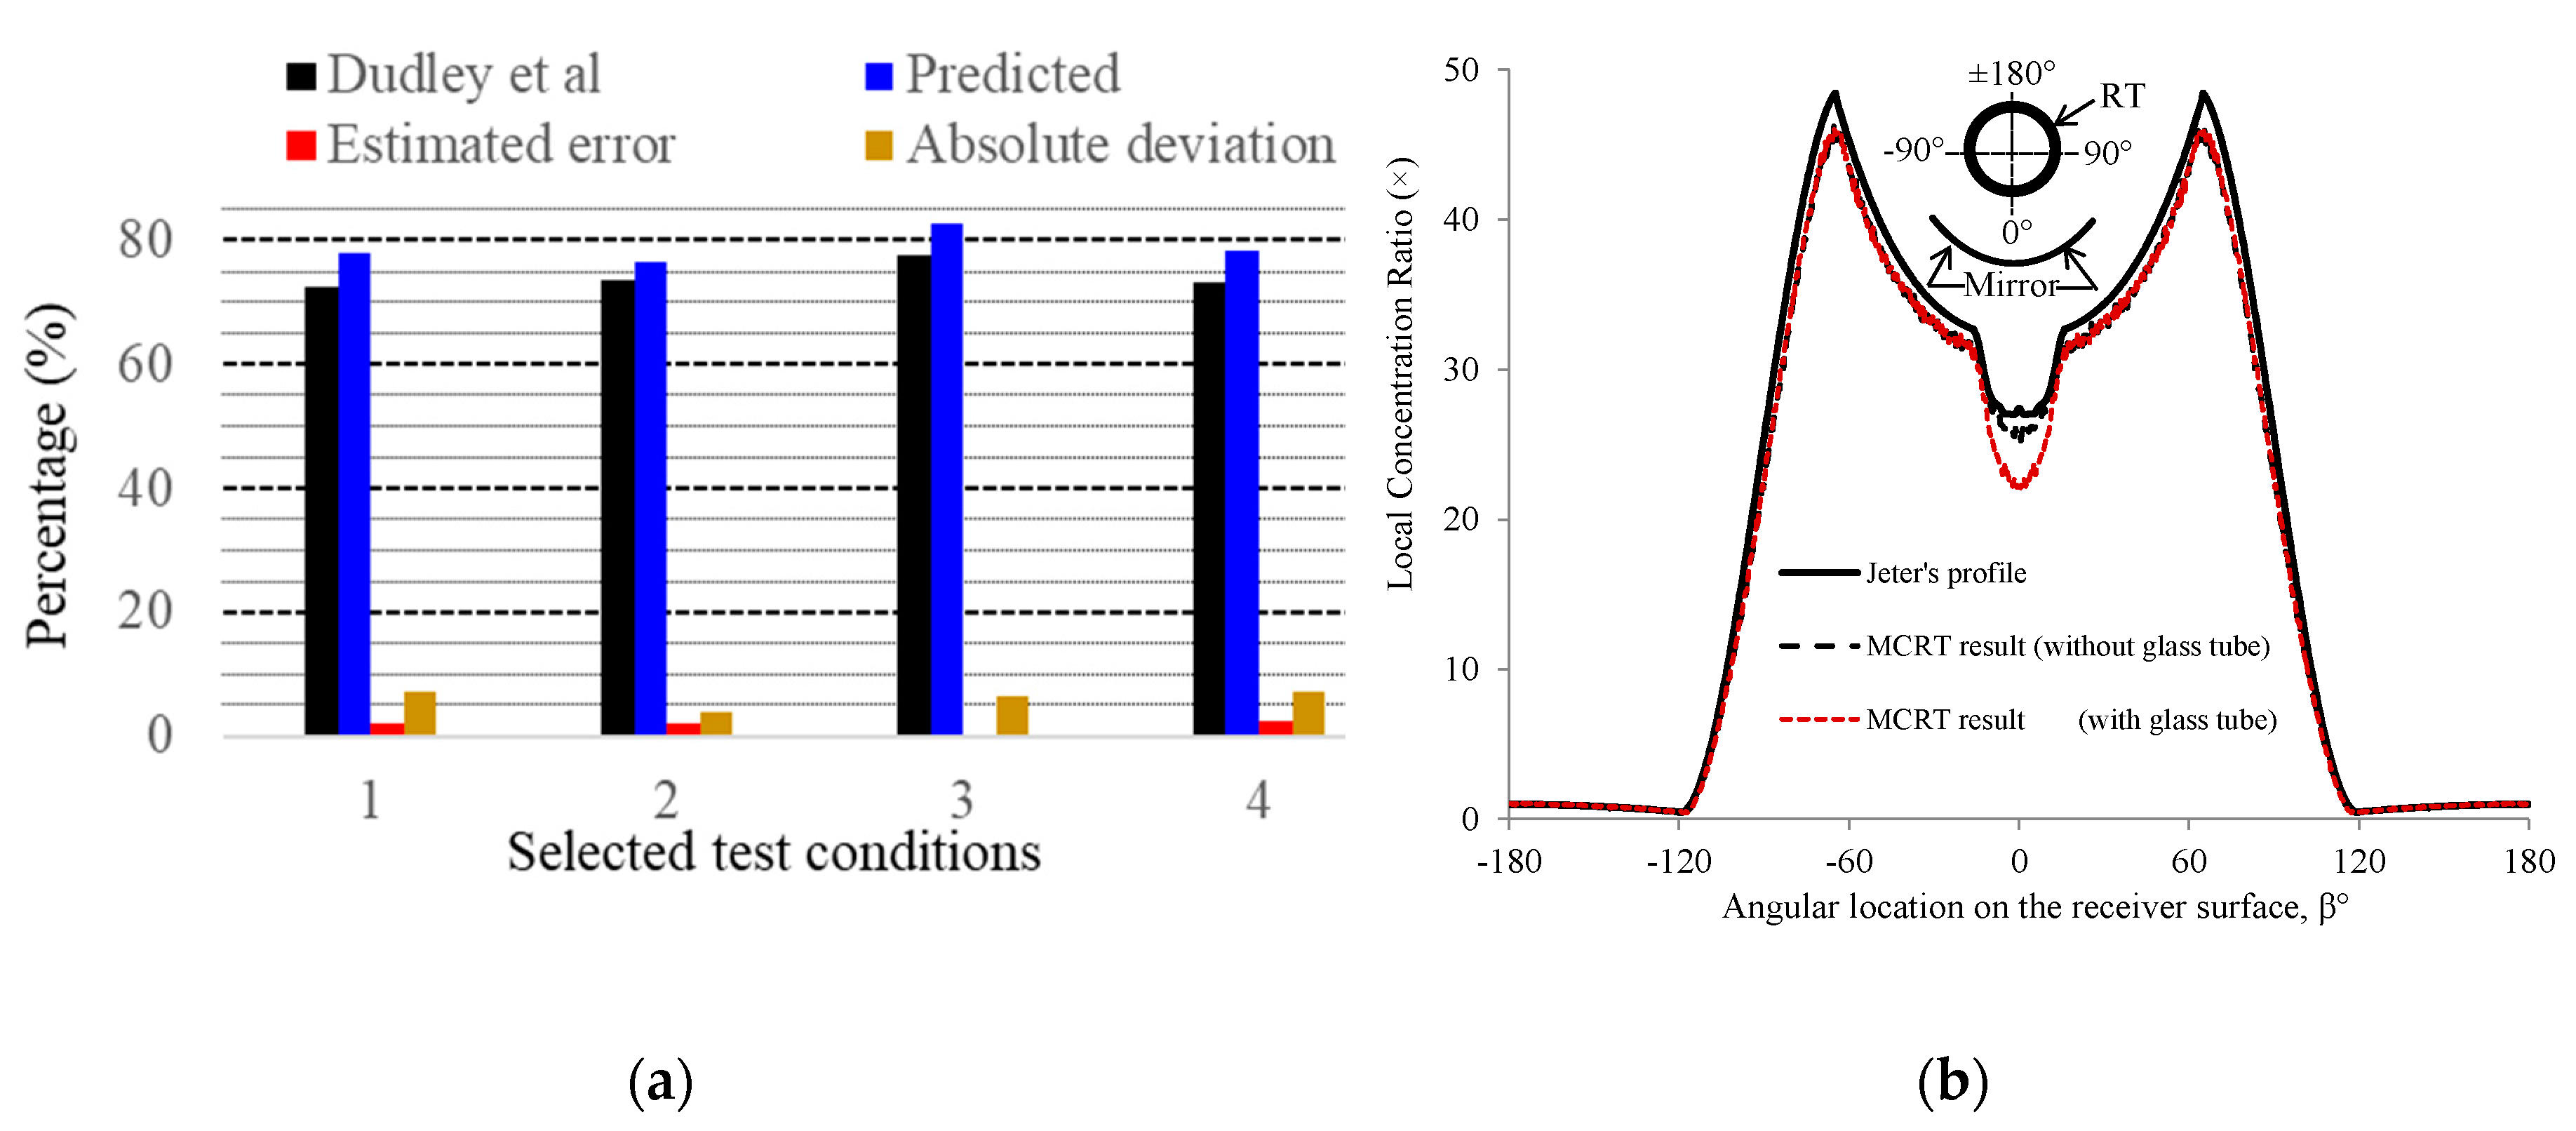
2.3. Validation of the Model
3. Geometry of the Studied ECE Orientation Schemes
4. Calculated LCR Profile around the ECEs and Respective Optical Efficiency
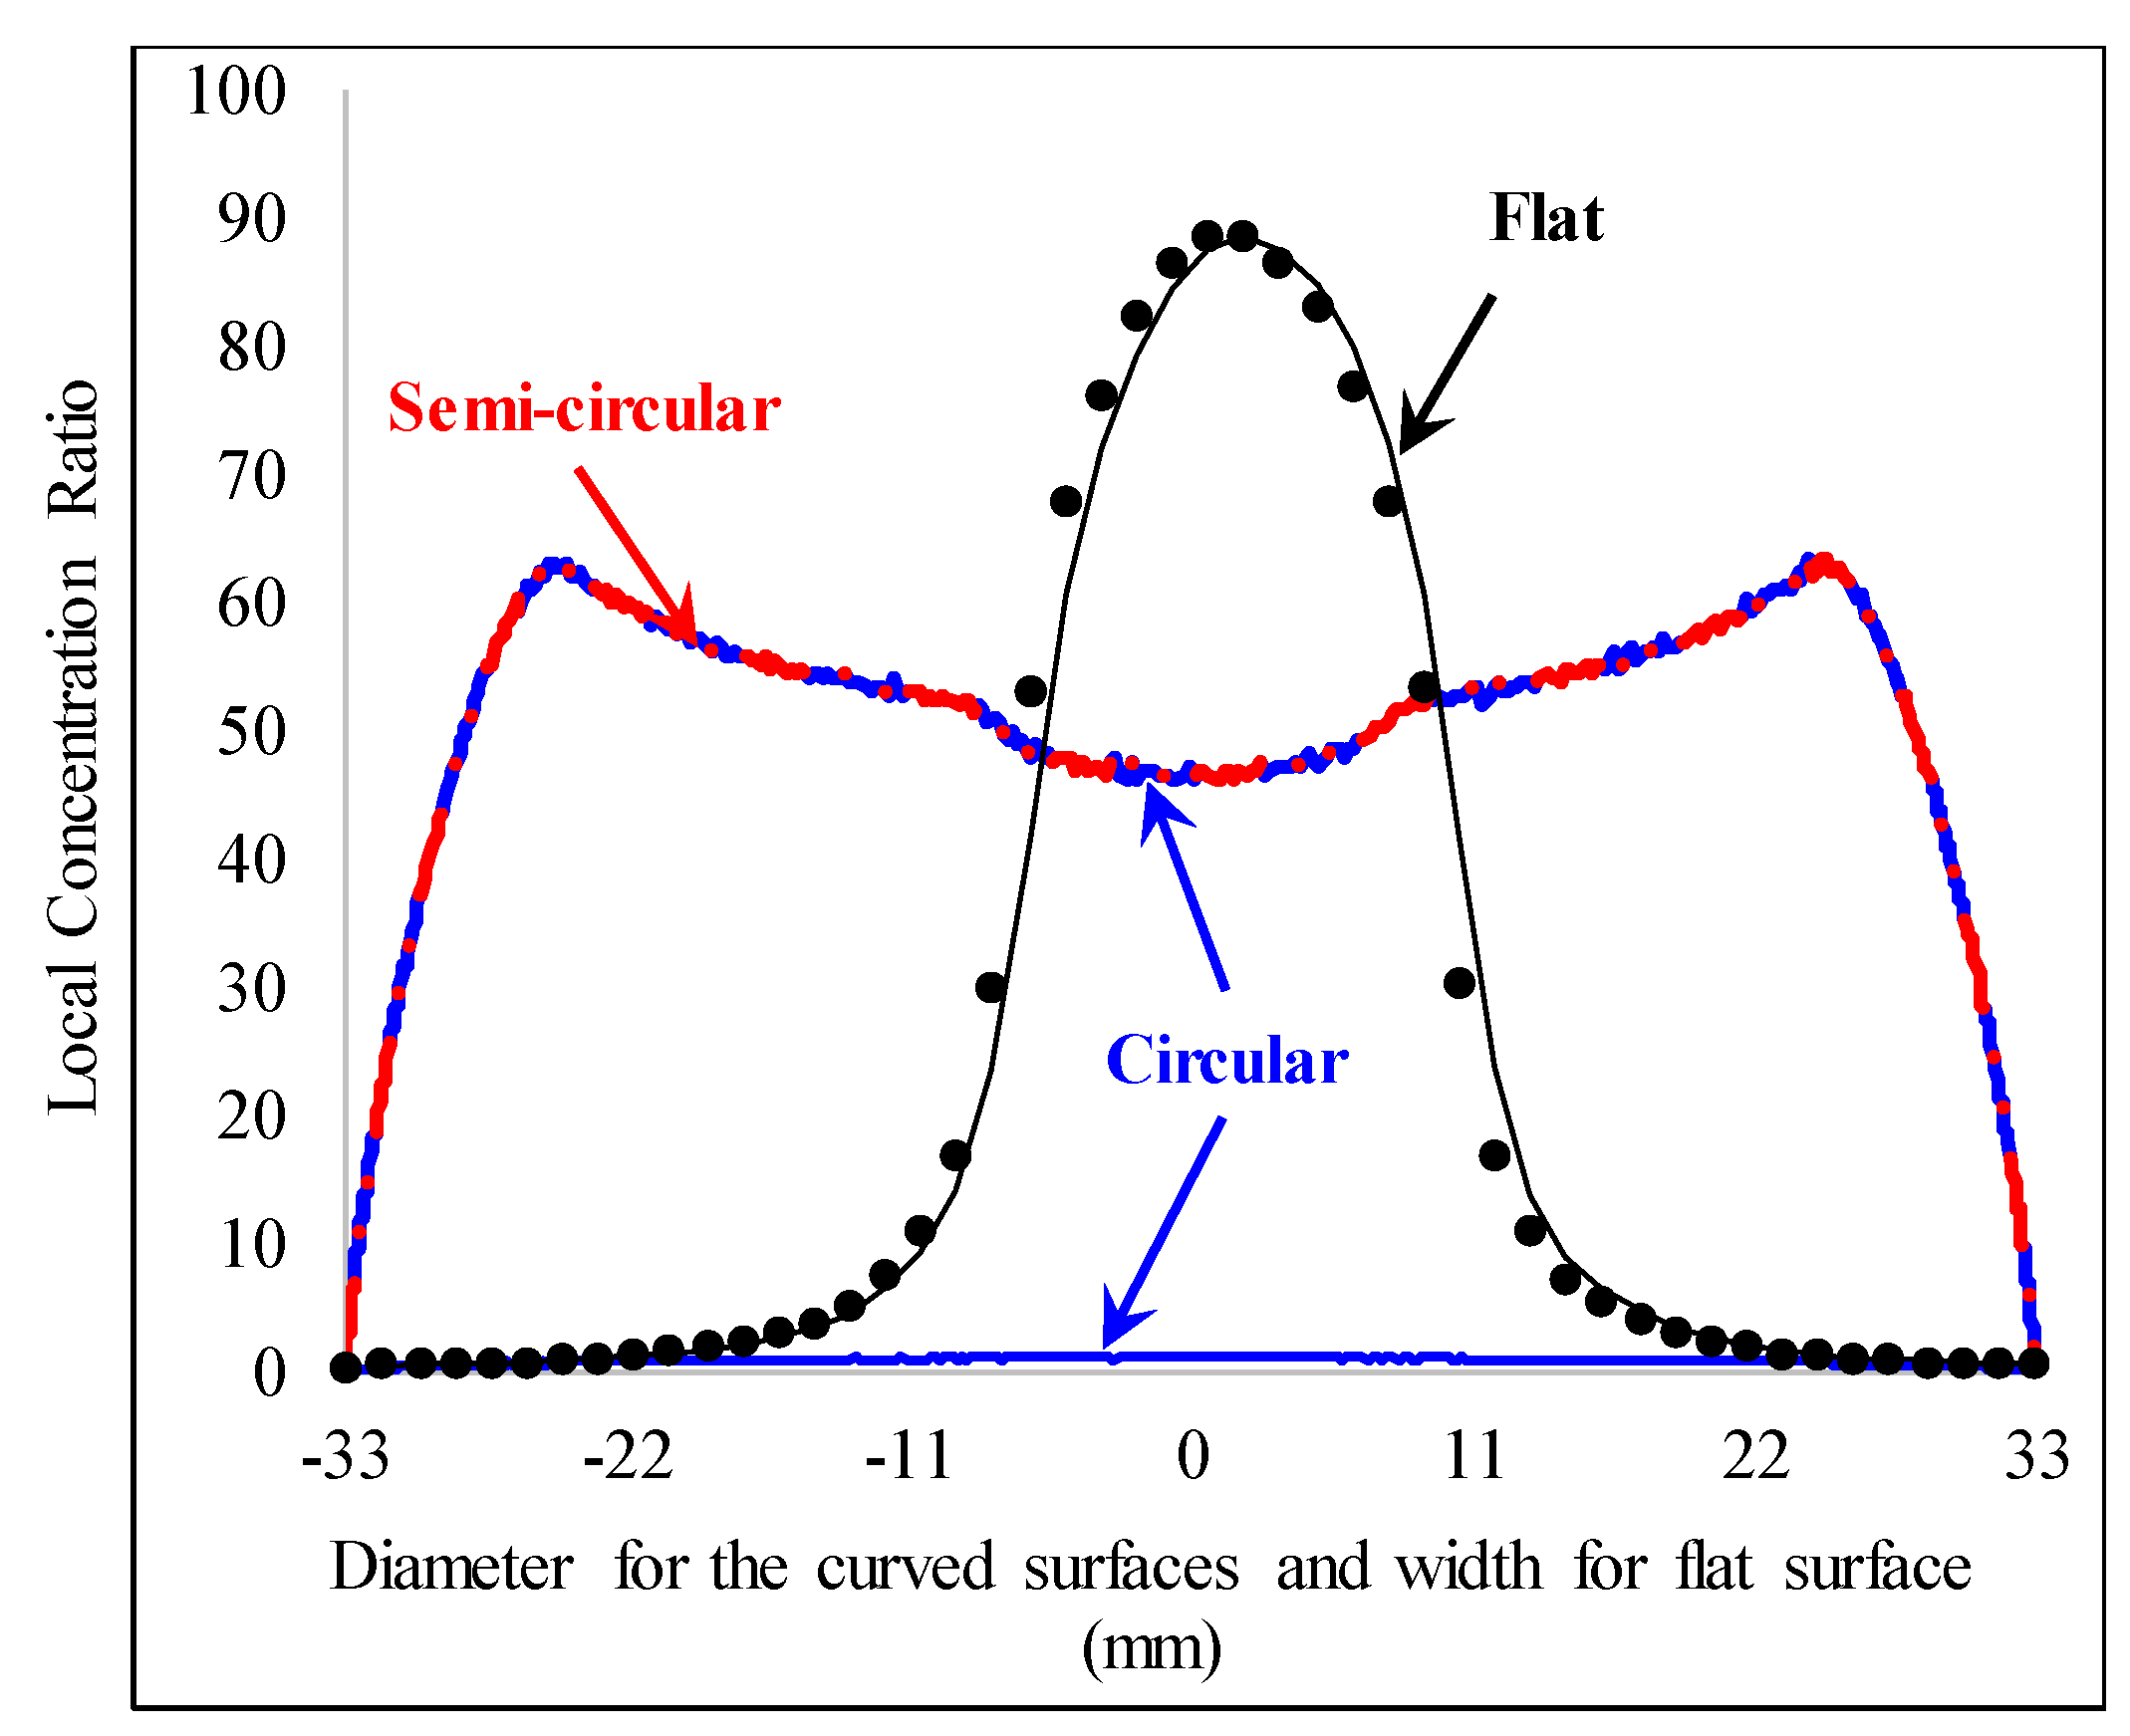
4.1. Circular
4.2. Semi-Circular
4.3. Flat
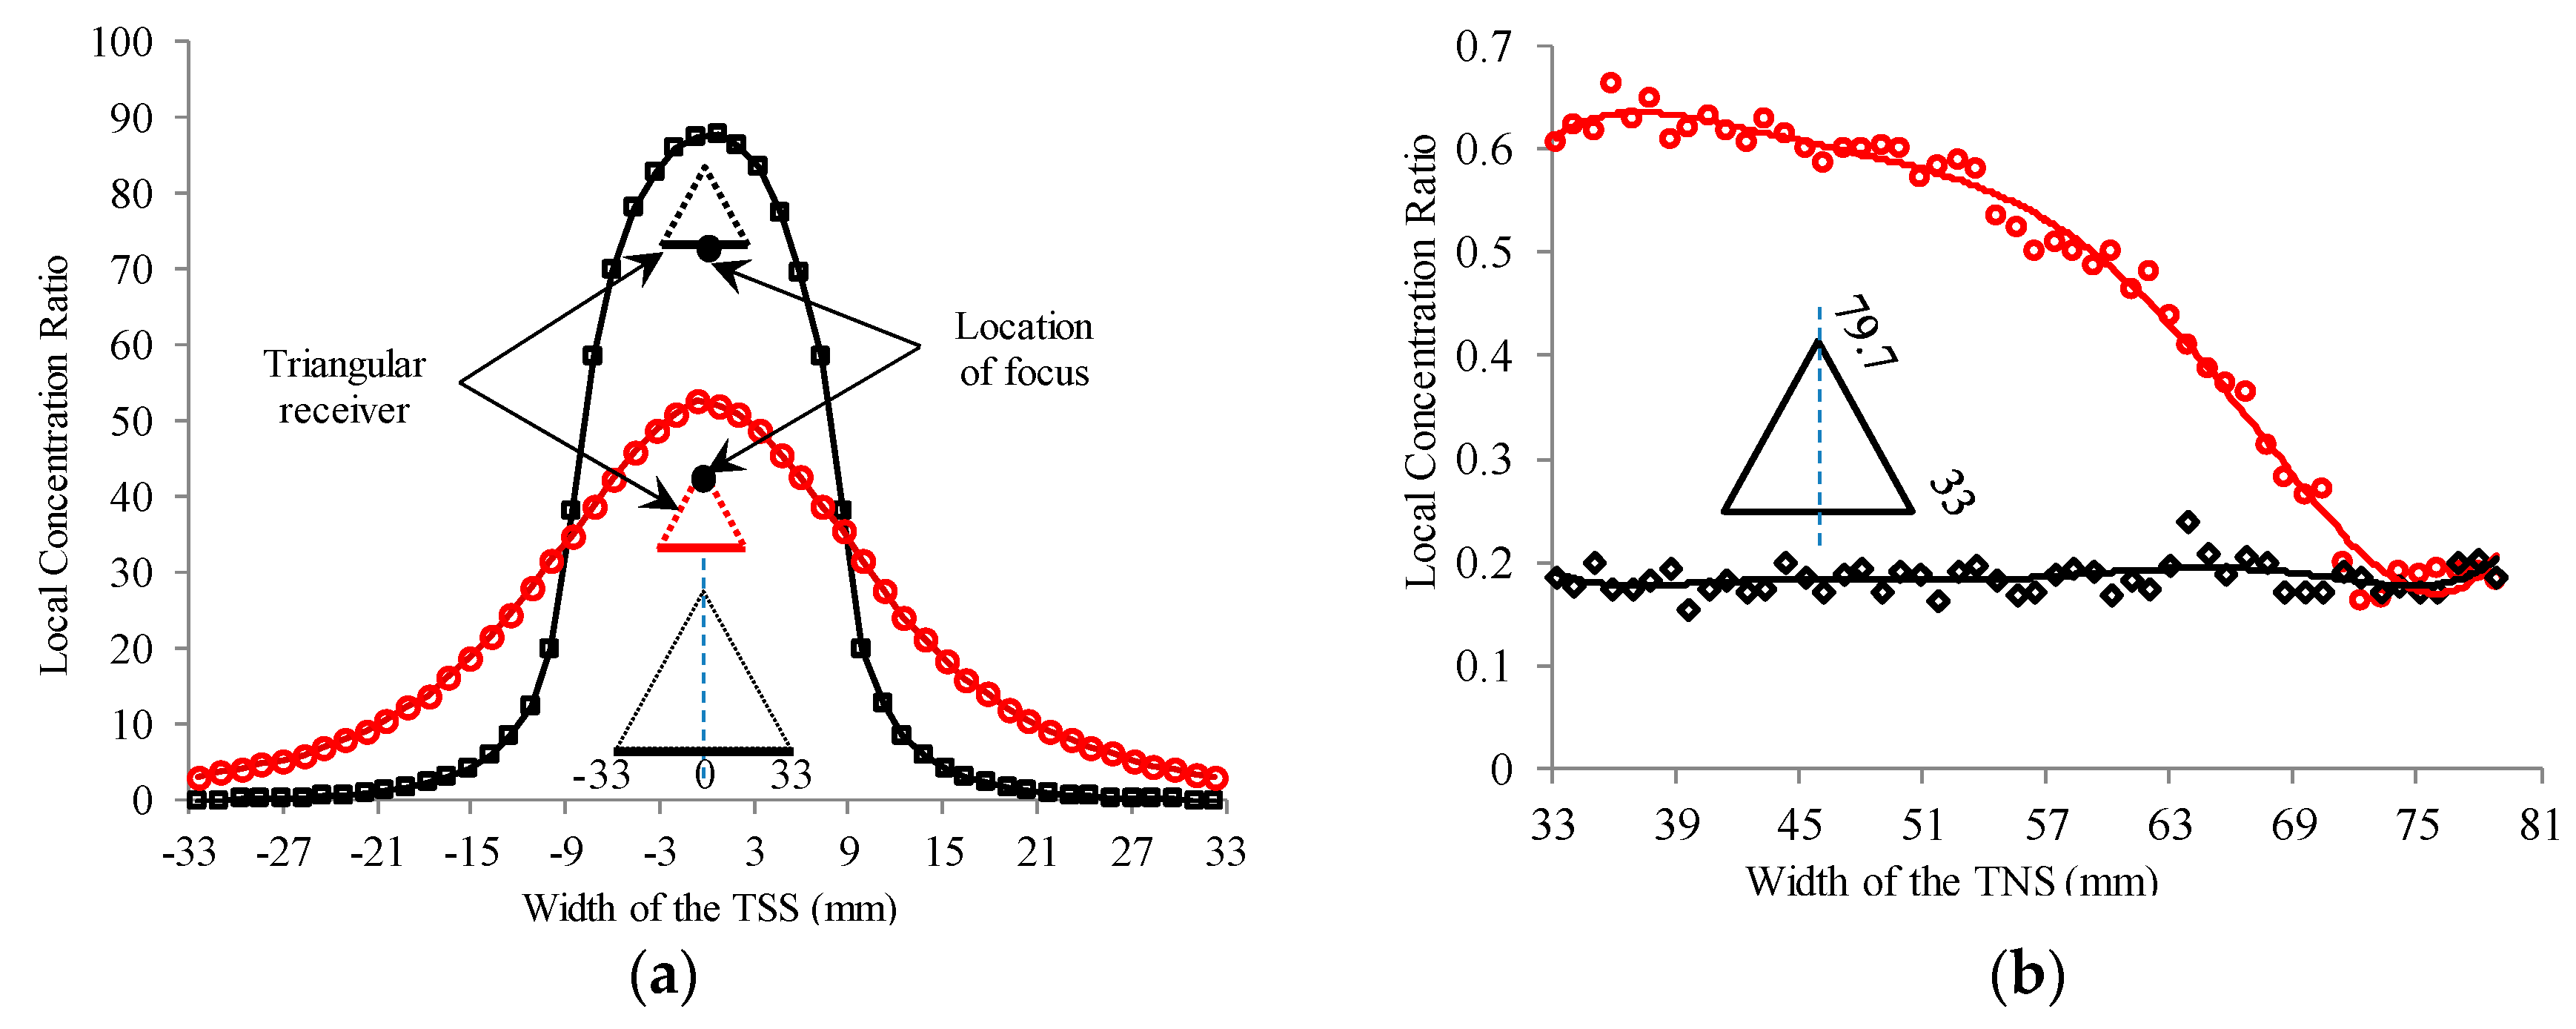
4.4. Triangular
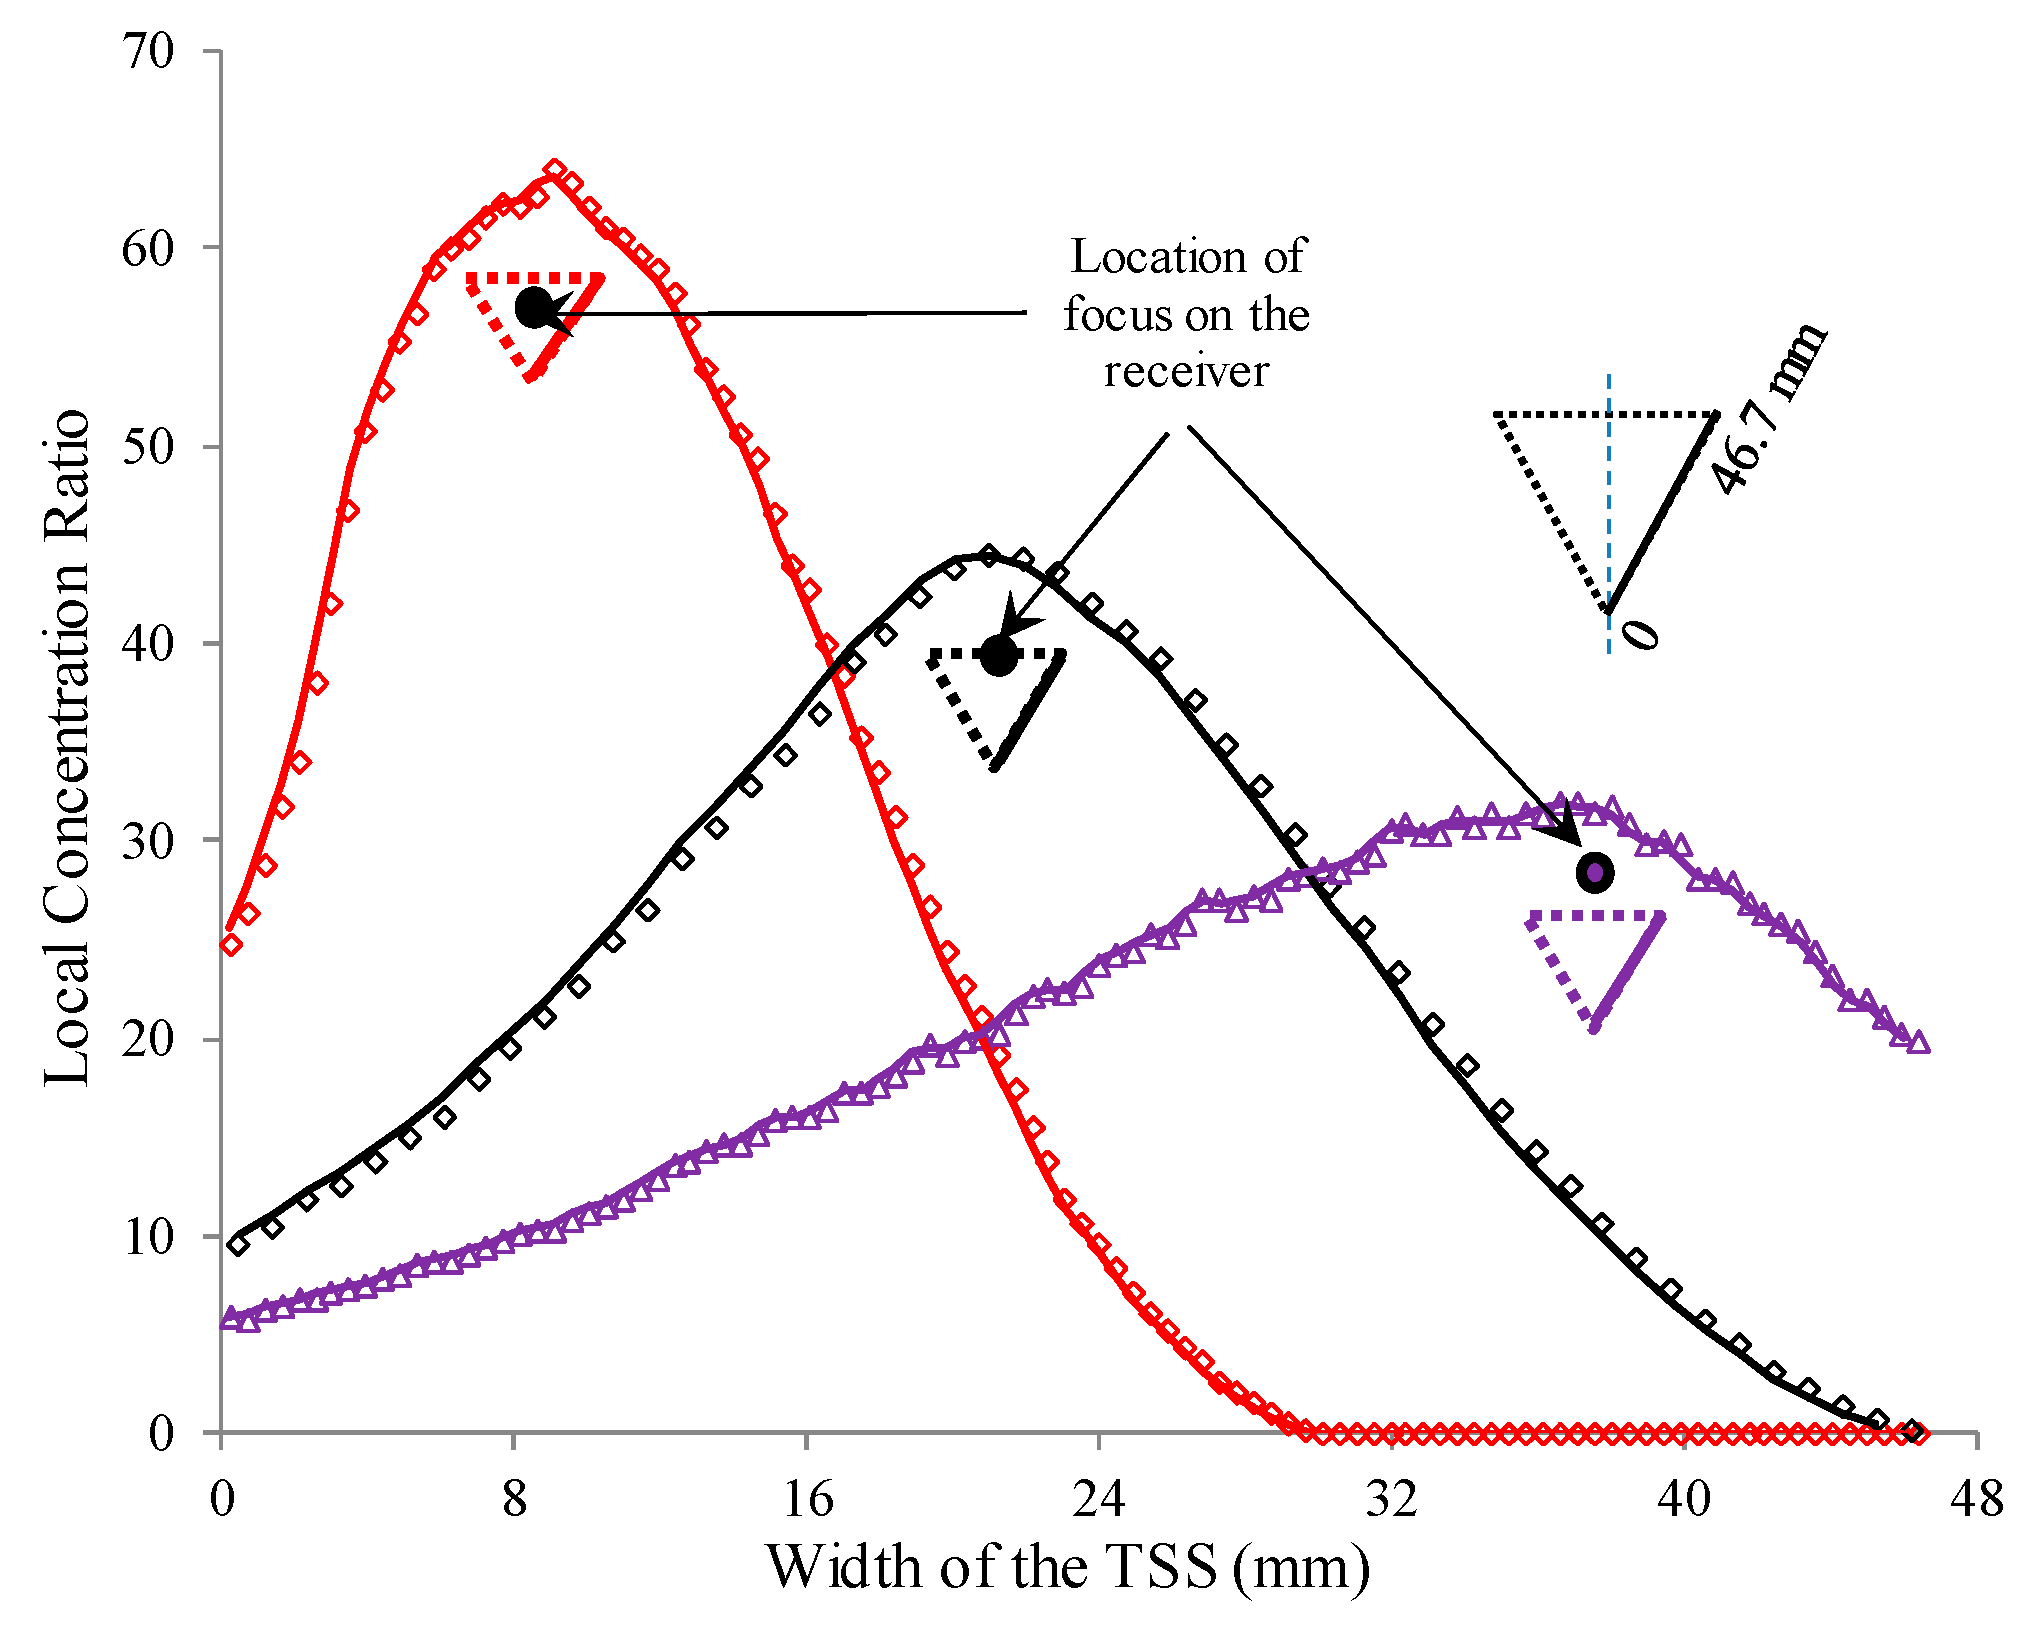
4.5. Inverted Triangular
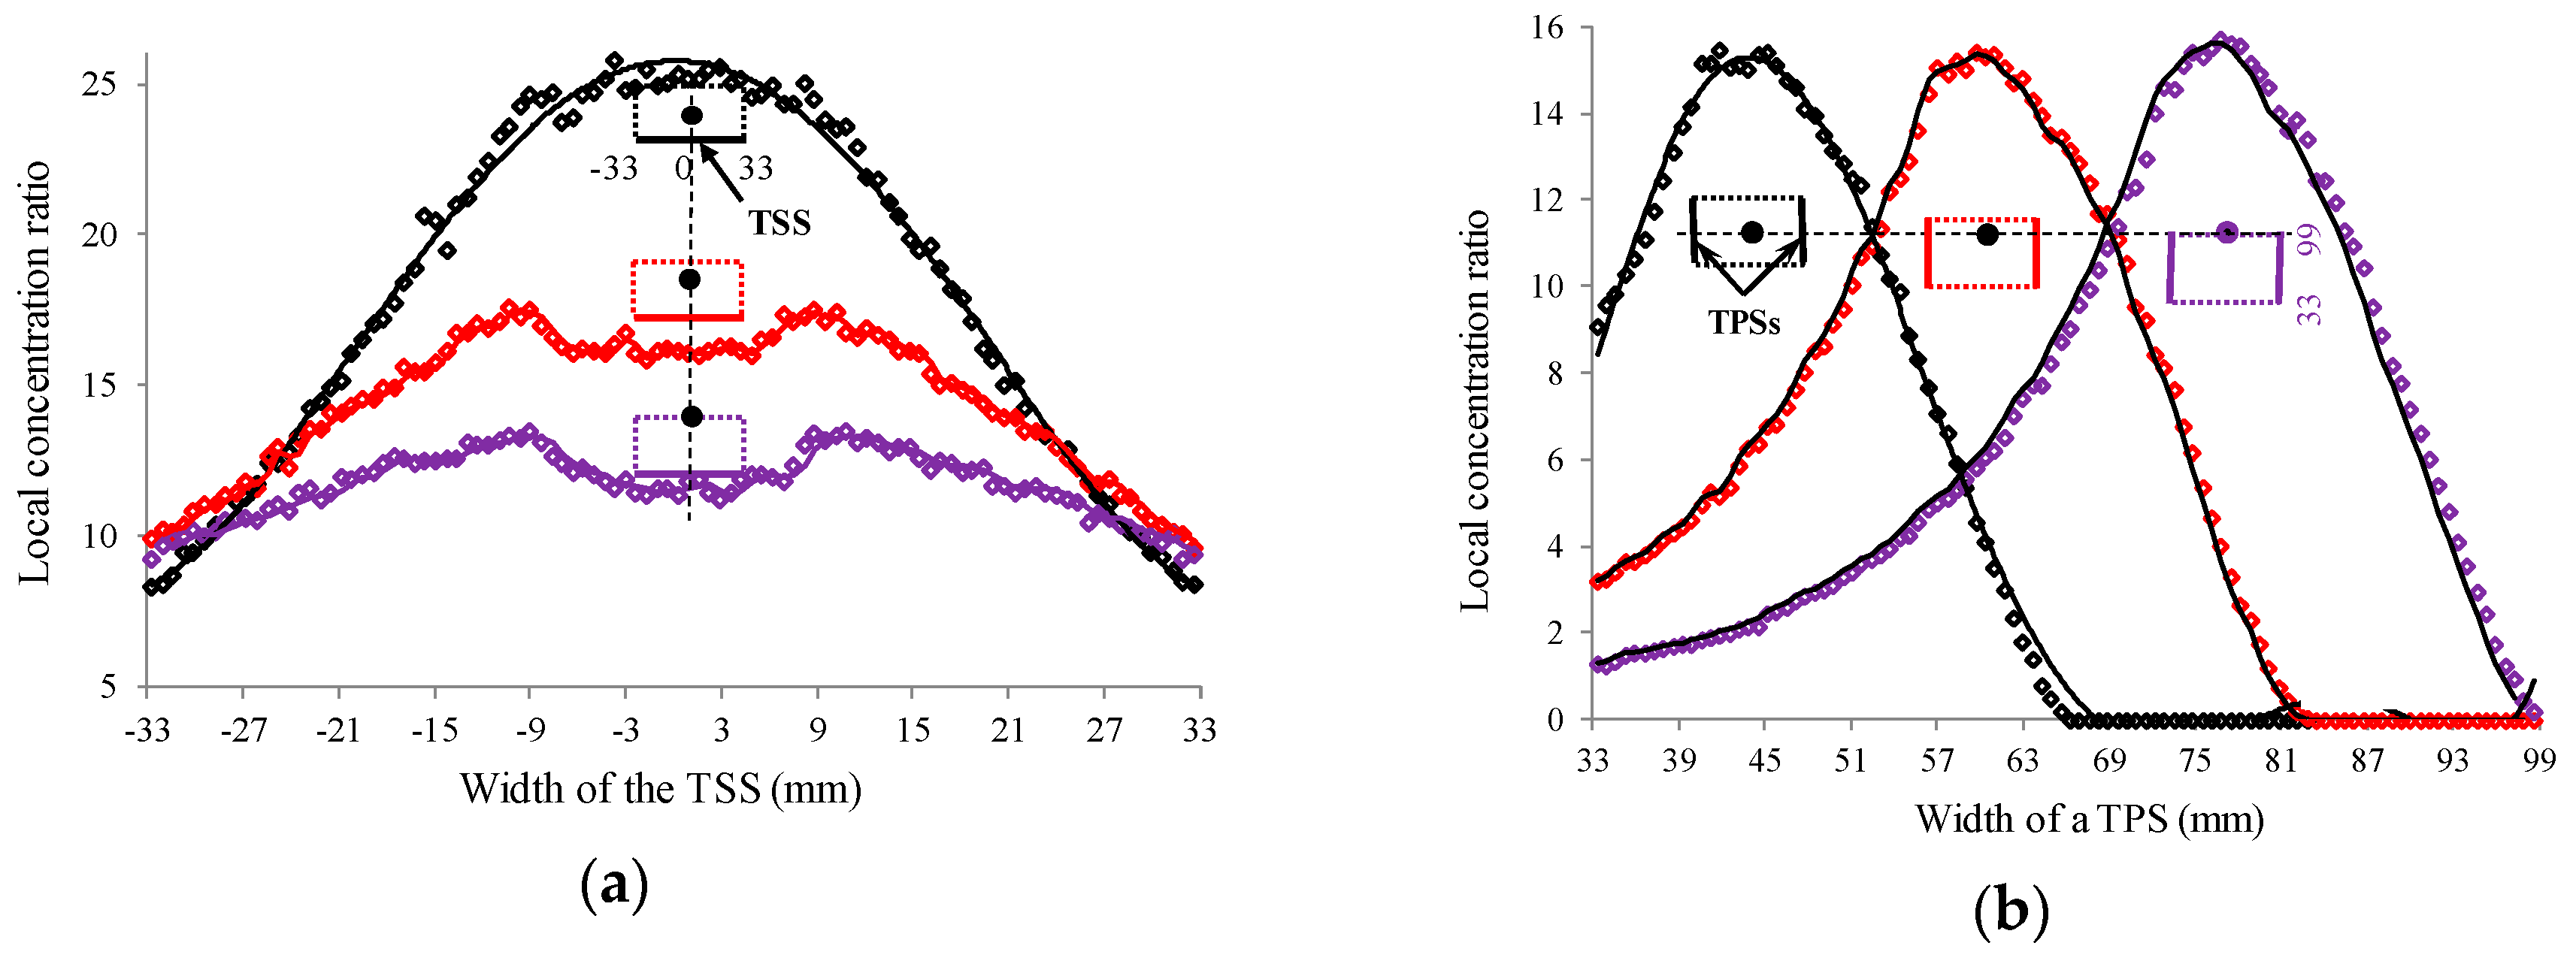
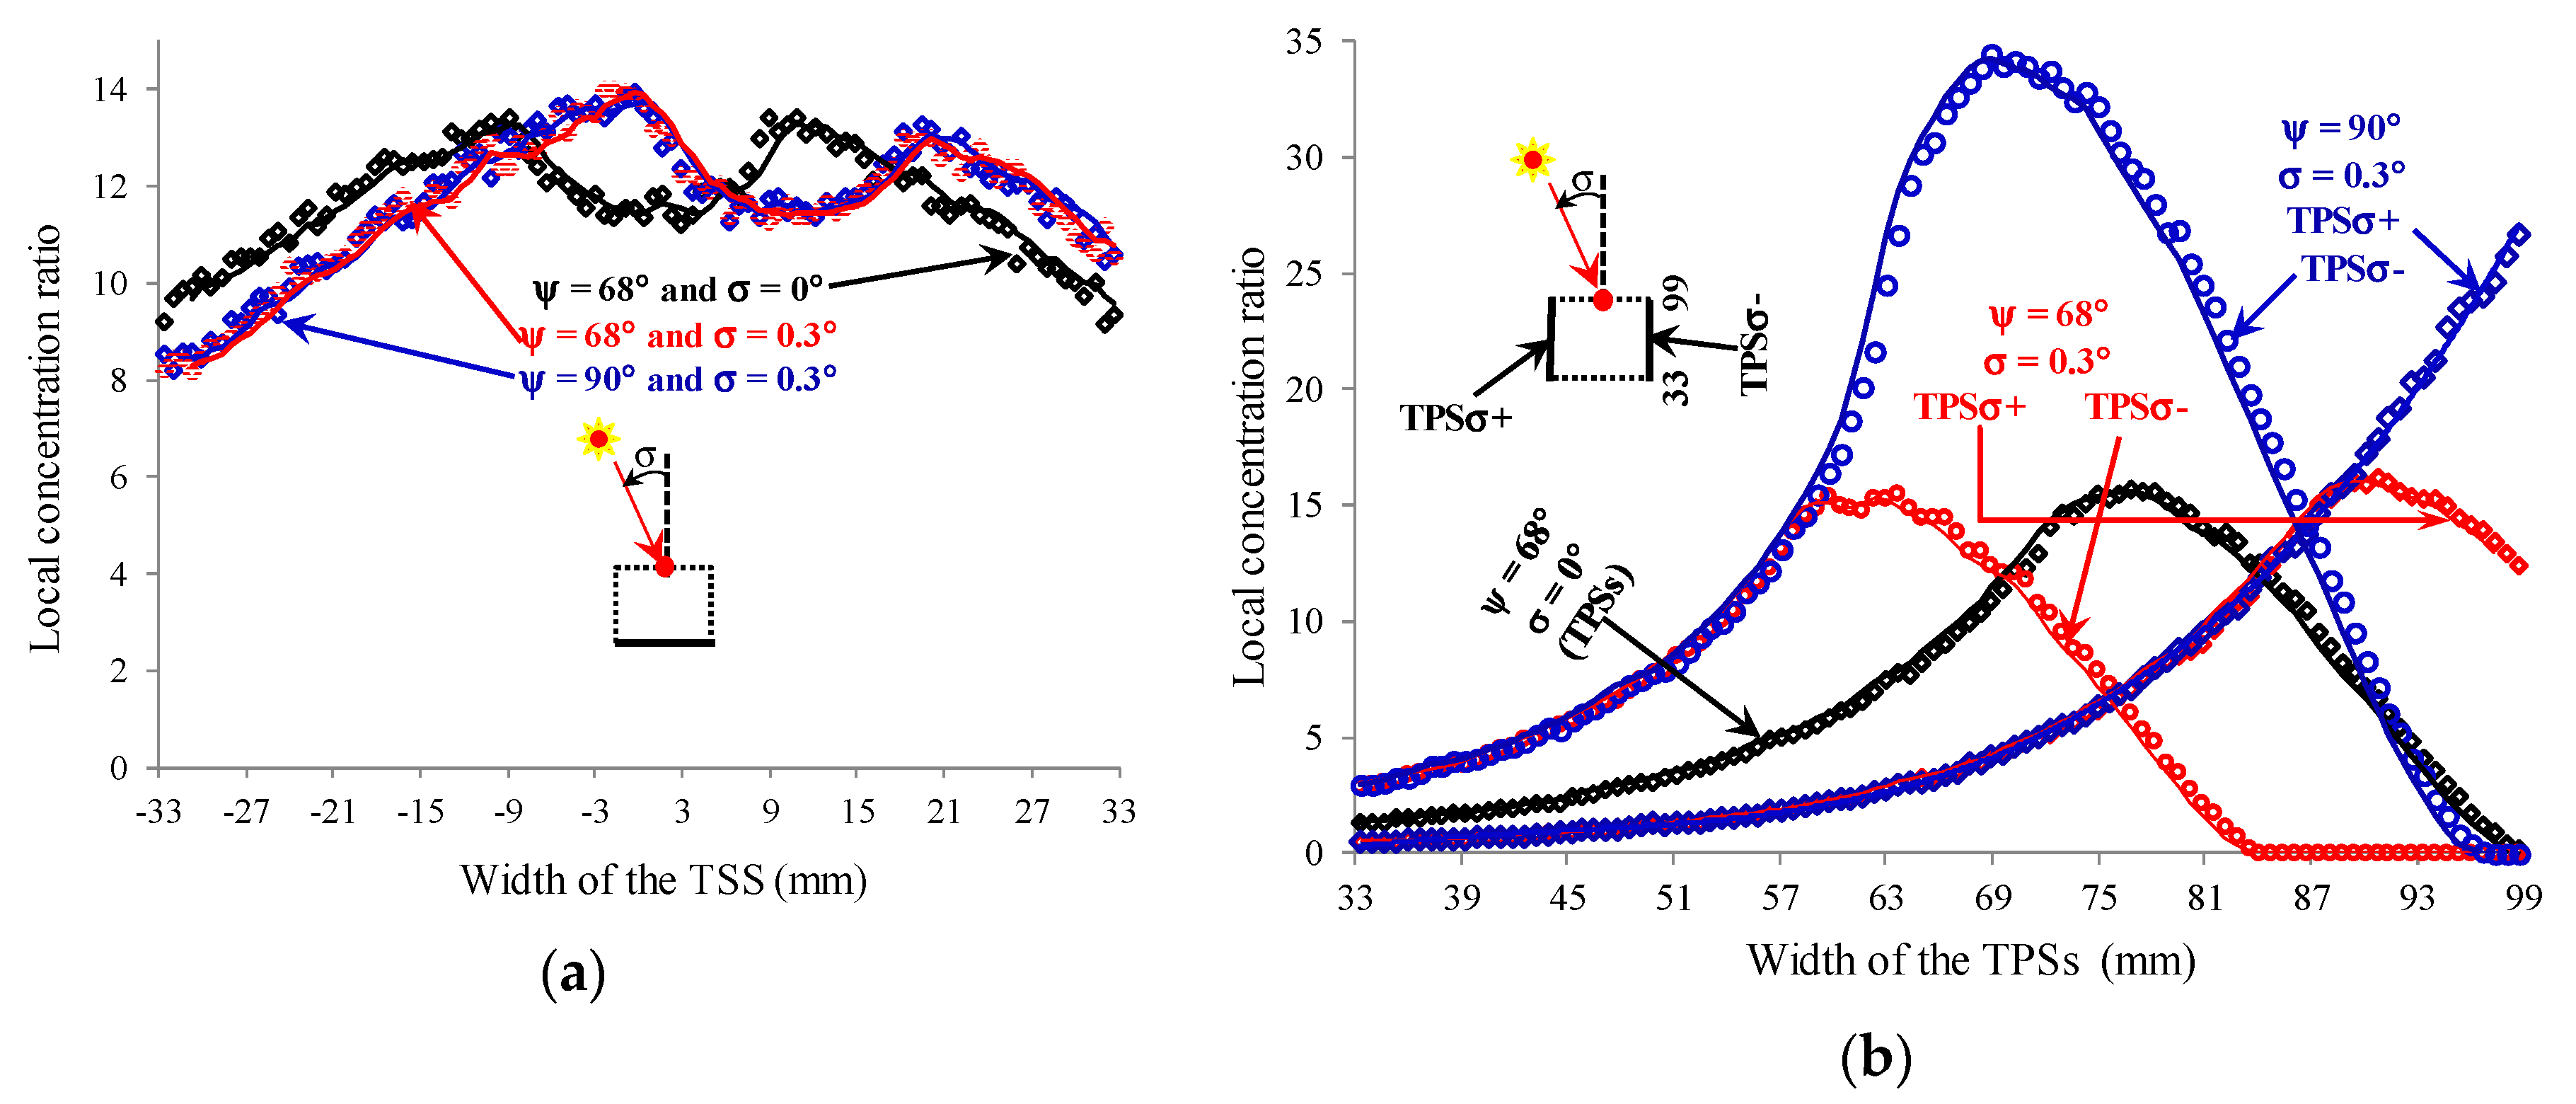
4.6. Rectangular (Square)
4.7. Rectangle on Semi-Circle (RSc) ECE
5. Discussion
6. Conclusions
- (i)
- The ECE orientation schemes (circular, semicircular and RSc) with curved TSS showed much higher ηopt (>79%) than those (flat, triangular, inverted triangular and rectangular) with linear TSS (ηopt ranging between 25% and 38%) in ideal conditions (i.e., no defocus and tracking error) with a trough of 68° rim angle
- (ii)
- Among the linear TSS group, the optical efficiency was calculated to be highest for the inverted triangular ECE (around 37%), lowest for the flat and triangular ECEs (≈26%), and somewhere in middle for the rectangular ECE (in between 30.5% and 33.5%).
- (iii)
- The MAD of the TSS of the rectangular ECE was estimated to be the lowest, ranging from 0.94 at defocus condition to 5.44 at ideal condition. In the event of tracking error and with a trough of higher rim angle, the MAD was found increased insignificantly, only increased to 1.05 from 0.94. That is the uniformity of the irradiance distribution (i.e., the LCR profile) on the TSS of a rectangular ECE was found to be the best among the studied ECE orientation schemes.
- (iv)
- In the event of defocus and tracking error, a significant portion of the concentrated light was observed to be intercepted by the TPSs. Therefore, based on this study, ECEs among the curved TSS group, it is clear that the RSc would be more efficient than the circular and semicircular ones. Similarly, among the linear TSS group the rectangular one would be more efficient than the remaining ECEs of the group.
- (v)
- Sun tracking error and the ECE defocus have negative effect on the optical efficiency of the collector in general. However, ECE defocus helps to reduce the MAD that is the non-uniformity of the LCR profile of the TSS.
- (vi)
- Study of the effect of 90° trough rim angle over a 68° one for the rectangular and RSc ECEs implied that there is an optimum rim angle for each collector design; trough rim angle larger than that would increase the total concentrated light on the ECE and, for few instances, the uniformity of the LCR profile of the TSS, but will decrease the optical efficiency of the collector.
Author Contributions
Funding
Acknowledgments
Conflicts of Interest
Nomenclature
| C | Light concentration |
| d | Depth, diameter, deviation, dislocation |
| D | Direction vector |
| DNI | Direct normal irradiance |
| E | Error |
| f | Focal length |
| ECE | Energy collection element |
| GC | Geometric concentration (Ratio of mirror aperture area to outer surface area of the absorber tube) |
| GT | Glass tube |
| I(φ) | Sunshape or light intensity as a function of deflection angle |
| LCR | Local concentration ratio |
| LS2 | Luz Solar 2 collector |
| MAD | Mean absolute deviation |
| MC | Monte Carlo |
| MCRT | Monte Carlo ray tracing |
| N | Normal vectors, Number of rays per unit aperture area of the sunshape |
| n | Refractive indices of glass and air |
| P | Point of light incidence |
| PT | Parabolic trough |
| PTCC | Parabolic trough concentrating collector |
| r | Radius of the receiver |
| RSc | Rectangle-on-Semicircle |
| RT | Receiver tube |
| TC | Test Conditions |
| TCPV | Trough concentrating photovoltaic collector |
| TCPVT | Trough concentrating hybrid photovoltaic/thermal collector |
| X, Y, Z | Cartesian coordinate system |
| X, r, β | Polar coordinate system |
| Symbols | |
| α | Absorptance of ECE material |
| ηopt | Optical efficiency |
| ψ | Rim angle (°) of the mirror |
| φ | Deflection angle of sun |
| θ | Angle of light incidence on the ECE |
| ρPT | Reflectance of mirror |
| τGT | Transmittance of glass |
| × | Times |
| Suffixes | |
| base | Base |
| est | Estimated |
| l | Local |
| mean | Mean |
| o | Outer or outside |
| peak | Peak |
References
- Burgess, G.; Scott, P.; Pye, J. Spherical and asymmetric mirror panels for paraboloidal concentrators. Presented at the 3rd International Solar Energy Society Conference—Asia Pacific Region (ISES-AP-08), Sydney, Australia, 4–6 March 2008. [Google Scholar]
- Kalogirou, S.A. Solar Energy Engineering: Processes and Systems. In Solar Energy Engineering; Kalogirou, S.A., Ed.; Academic Press: Boston, MA, USA, 2009; pp. 1–48. [Google Scholar]
- Yılmaz, İ.H. Optimization of an integral flat plate collector-storage system for domestic solar water heating in Adana. Anadolu Univ. J. Sci. Technol. A Appl. Sci. Eng. 2018, 19, 165–176. [Google Scholar] [CrossRef]
- Yılmaz, İ.H.; Mwesigye, A. Modeling, simulation and performance analysis of parabolic trough solar collectors: A comprehensive review. Appl. Energy 2018, 225, 135–174. [Google Scholar] [CrossRef]
- Price, H.; Lupfert, E.; Kearney, D.; Zarza, E.; Cohen, G.; Gee, R.; Mahoney, R. Advances in Parabolic Trough Solar Power Technology. J. Sol. Energy Eng. 2002, 124, 109–125. [Google Scholar] [CrossRef]
- Fernández-García, A.; Zarza, E.; Valenzuela, L.; Pérez, M. Parabolic-trough solar collectors and their applications. Renew. Sustain. Energy Rev. 2010, 14, 1695–1721. [Google Scholar] [CrossRef]
- Mousazadeh, H.; Keyhani, A.; Javadi, A.; Mobli, H.; Abrinia, K.; Sharifi, A. A review of principle and sun-tracking methods for maximizing solar systems output. Renew. Sustain. Energy Rev. 2009, 13, 1800–1818. [Google Scholar] [CrossRef]
- Parida, B.; Iniyan, S.; Goic, R. A review of solar photovoltaic technologies. Renew. Sustain. Energy Rev. 2011, 15, 1625–1636. [Google Scholar] [CrossRef]
- Timilsina, G.R.; Kurdgelashvili, L.; Narbel, P.A. Solar energy: Markets, economics and policies. Renew. Sustain. Energy Rev. 2012, 16, 449–465. [Google Scholar] [CrossRef] [Green Version]
- Tyagi, V.V.; Kaushik, S.C.; Tyagi, S.K. Advancement in solar photovoltaic/thermal (PV/T) hybrid collector technology. Renew. Sustain. Energy Rev. 2012, 16, 1383–1398. [Google Scholar] [CrossRef]
- Pavlović, T.M.; Radonjić, I.S.; Milosavljević, D.D.; Pantić, L.S. A review of concentrating solar power plants in the world and their potential use in Serbia. Renew. Sustain. Energy Rev. 2012, 16, 3891–3902. [Google Scholar] [CrossRef]
- Devabhaktuni, V.; Alam, M.; Depuru, S.S.S.R.; Green, R.C.; Nims, D.; Near, C. Solar energy: Trends and enabling technologies. Renew. Sustain. Energy Rev. 2013, 19, 555–564. [Google Scholar] [CrossRef]
- Cabrera, F.J.; Fernández-García, A.; Silva, R.M.P.; Pérez-García, M. Use of parabolic trough solar collectors for solar refrigeration and air-conditioning applications. Renew. Sustain. Energy Rev. 2013, 20, 103–118. [Google Scholar] [CrossRef]
- Zhang, H.L.; Baeyens, J.; Degrève, J.; Cacères, G. Concentrated solar power plants: Review and design methodology. Renew. Sustain. Energy Rev. 2013, 22, 466–481. [Google Scholar] [CrossRef]
- Mojiri, A.; Taylor, R.; Thomsen, E.; Rosengarten, G. Spectral beam splitting for efficient conversion of solar energy—A review. Renew. Sustain. Energy Rev. 2013, 28, 654–663. [Google Scholar] [CrossRef]
- Jebasingh, V.K.; Herbert, G.M.J. A review of solar parabolic trough collector. Renew. Sustain. Energy Rev. 2016, 54, 1085–1091. [Google Scholar] [CrossRef]
- IEA, Renewable Energy Essentials: Concentrating Solar Thermal Power. 2009. Available online: https://webstore.iea.org/renewable-energy-essentials-concentrating-solar-thermal-power (accessed on 1 December 2018).
- Dudley, V.E.; Kolb, G.J.; Mahoney, A.R.; Mancini, T.R.; Matthews, C.W.; Sloan, M.; Kearney, D. Test results: SEGS LS-2 solar collector, SAND-94-1884; Other: ON: DE95010682; TRN: TRN: 95:004741 United StatesOther: ON: DE95010682; TRN: TRN: 95:004741Thu Feb 18 07:35:13 EST 2010OSTI as DE95010682SNL; SCA: 141000; PA: EDB-95:095446; NTS-95:019046; ERA-20:021131; SN: 95001377800; TVI: 10724English. 1994. Available online: http://large.stanford.edu/publications/coal/references/troughnet/solarfield/docs/segs_ls2_solar_collector.pdf (accessed on 8 September 2013).
- Forristall, R. Heat Transfer Analysis and Modeling of a Parabolic Trough Solar Receiver Implemented in Engineering Equation Solver, National Renewable Energy Laboratory, 1617 Cole Boulevard, Golden, Colorado 80401-3393, Technical report No. NERL/TP-550-34169. NREL/TP-550-34169. 2003. Available online: http://fac.ksu.edu.sa/sites/default/files/34169.pdf (accessed on 24 April 2013).
- Lüpfert, E.; Zarza, E.; Geyer, M.; Nava, P.; Langenkamp, J.; Schiel, W.; Esteban, A.; Osuna, R.; Mandelberg, E. Euro Trough Collector Qualification Complete—Performance Test Results from PSA. In Proceedings of the ISES Solar World Congress, Göteborg, Sweden, 14–19 June 2003. [Google Scholar]
- Anton, I.; Sala, G.; Arboiro, J.C.; Monedero, J.; Valera, P. Effect of the optical performance on the output put power of the EUCLIDESTM array. Presented at the 16th European Photovoltaics Solar Energy Conference, Glasgow, UK, 1–5 May 2000. [Google Scholar]
- Sala, G.; Anton, I.; Arboiro, J.C.; Luque, A.; Camblor, E.; Mera, E.; Gasson, M.; Cendagorta, M.; Valera, P.; Friend, M.P.; et al. The 480 kW (p) EUCLIDES™ -THERMIE Power Plant: Installation Set-Up and First Results. Presented at the 16th European Photovoltaic Solar Energy Conference, Glasgow, UK, 1–5 May 2000. [Google Scholar]
- Coventry, J.S. Performance of a concentrating photovoltaic/thermal solar collector. Sol. Energy, 2005, 78, 211–222. [Google Scholar] [CrossRef]
- Coventry, J.S.; Franklin, E.; Blakers, A. Thermal and electrical performance of a concentrating PV/Thermal collector: Results from the ANU CHAPS collector. Presented at the ANZSES Solar Energy Conference, Newcastle, Australia, 27–29 November 2002. [Google Scholar]
- Li, M.; Li, G.L.; Ji, X.; Yin, F.; Xu, L. The performance analysis of the Trough Concentrating Solar Photovoltaic/Thermal system. Energy Convers. Manag. 2011, 52, 2378–2383. [Google Scholar] [CrossRef]
- Srivastava, S.; Reddy, K.S. Simulation studies of thermal and electrical performance of solar linear parabolic trough concentrating photovoltaic system. Solar Energy 2017, 149, 195–213. [Google Scholar] [CrossRef]
- Calise, F.; Palombo, A.; Vanoli, L. A finite-volume model of a parabolic trough photovoltaic/thermal collector: Energetic and exergetic analyses. Energy 2012, 46, 283–294. [Google Scholar] [CrossRef]
- Calise, F.; Vanoli, L. Parabolic Trough Photovoltaic/Thermal Collectors: Design and Simulation Model. Energies 2012, 5, 4186–4208. [Google Scholar] [CrossRef] [Green Version]
- Bernardo, L.R.; Perers, B.; Håkansson, H.; Karlsson, B. Performance evaluation of low concentrating photovoltaic/thermal systems: A case study from Sweden. Solar Energy 2011, 85, 1499–1510. [Google Scholar] [CrossRef] [Green Version]
- Baig, H.; Heasman, K.C.; Mallick, T.K. Non-uniform illumination in concentrating solar cells. Renew. Sustain. Energy Rev. 2012, 16, 5890–5909. [Google Scholar] [CrossRef]
- Coventry, J.S.; Franklin, E.; Blakers, A. Performance of the CHAPS collectors. Presented at the ANZSES Solar Energy Conference, Melbourne, Australia, 26–29 November 2003. [Google Scholar]
- Blakers, A.; Coventry, J.S.; Franklin, E.; Dennis, M.; Cotsell, J.; Holly, C.; Smeltink, J. Solar Concentrators at ANU. Presented at the International Solar Concentrator Conference for the Generation of Electricity or Hydrogen, Alice Springs, Australia, 10–14 November 2003. [Google Scholar]
- Thomas, A.; Guven, H.M. Parabolic trough concentrators—Design, construction and evaluation. Energy Convers. Manag. 1993, 34, 401–416. [Google Scholar] [CrossRef]
- Thomas, A.; Guven, H.M. Effect of optical errors on flux distribution around the absorber tube of a parabolic trough concentrator. Energy Convers. Manag. 1994, 35, 575–582. [Google Scholar] [CrossRef]
- Hassan, K.-E.; El-Refaie, M.F. Theoretical performance of cylindrical parabolic solar concentrators. Sol. Energy 1973, 15, 219–244. [Google Scholar] [CrossRef]
- Evans, D.L. On the performance of cylindrical parabolic solar concentrators with flat absorbers. Sol. Energy 1977, 19, 379–385. [Google Scholar] [CrossRef]
- Daly, J.C. Solar concentrator flux distributions using backward ray tracing. Appl. Opt. 1979, 18, 2696–2699. [Google Scholar] [CrossRef] [PubMed]
- Nicolás, R.O.; Durán, J.C. Generalization of the two-dimensional optical analysis of cylindrical concentrators. Sol. Energy 1980, 25, 21–31. [Google Scholar] [CrossRef]
- Durán, J.C.; Nicolás, R.O. Development and applications of a two-dimensional optical analysis of non-perfect cylindrical concentrators. Sol. Energy 1985, 34, 257–269. [Google Scholar] [CrossRef]
- Jeter, S.M. Calculation of the concentrated flux density distribution in parabolic trough collectors by a semifinite formulation. Sol. Energy 1986, 37, 335–345. [Google Scholar] [CrossRef]
- Jeter, S.M. The Distribution of Concentrated Solar Radiation in Paraboloidal Collectors. J. Sol. Energy Eng. 1986, 108, 219–225. [Google Scholar] [CrossRef]
- Jeter, S.M. Analytical determination of the optical performance of practical parabolic trough collectors from design data. Sol. Energy 1987, 39, 11–21. [Google Scholar] [CrossRef]
- Kalogirou, S.A.; Lloyd, S.; Ward, J.; Eleftheriou, P. Design and performance characteristics of a parabolic-trough solar-collector system. Appl. Energy 1994, 47, 341–354. [Google Scholar] [CrossRef]
- Shortis, M.R.; Johnston, G.H.G. Photogrammetry: An Available Surface Characterization Tool for Solar Concentrators, Part I: Measurements of Surfaces. J. Sol. Energy Eng. 1996, 118, 146–150. [Google Scholar] [CrossRef]
- Shortis, M.; Johnston, G. Photogrammetry: An Available Surface Characterization Tool for Solar Concentrators, Part II: Assessment of Surfaces. J. Sol. Energy Eng. 1997, 119, 286–291. [Google Scholar] [CrossRef]
- Pottler, K.; Lüpfert, E.; Johnston, G.H.G.; Shortis, M.R. Photogrammetry: A Powerful Tool for Geometric Analysis of Solar Concentrators and Their Components. J. Sol. Energy Eng. 2005, 127, 94–101. [Google Scholar] [CrossRef] [Green Version]
- Riffelmann, K.-J.; Neumann, A.; Ulmer, S. Performance enhancement of parabolic trough collectors by solar flux measurement in the focal region. Sol. Energy 2006, 80, 1303–1313. [Google Scholar] [CrossRef]
- Ergashev, S. Radiation Flux Distribution in the Focal Plane of a Parabolic-Cylindrical Concentrator. Appl. Sol. Energy C/C Geliotekhnika 2006, 42, 29. [Google Scholar]
- Lüpfert, E.; Pottler, K.; Ulmer, S.; Riffelmann, K.-J.; Neumann, A.; Schiricke, B. Parabolic Trough Optical Performance Analysis Techniques. J. Sol. Energy Eng. 2006, 129, 147–152. [Google Scholar] [CrossRef]
- Bader, R.; Steinfeld, A. A Solar Trough Concentrator for Pill-Box Flux Distribution Over a CPV Panel. J. Sol. Energy Eng. 2010, 132, 014501. [Google Scholar] [CrossRef]
- Xiao, J.; He, Y.; Cheng, Z.; Tao, Y.; Xu, R. Performance analysis of parabolic trough solar collector. J. Eng. Thermophys. 2009, 30, 729–733. [Google Scholar]
- Grena, R. Optical simulation of a parabolic solar trough collector. Int. J. Sustain. Energy 2010, 29, 19–36. [Google Scholar] [CrossRef]
- Yang, B.; Zhao, J.; Xu, T.; Zhu, Q. Calculation of the Concentrated Flux Density Distribution in Parabolic Trough Solar Concentrators by Monte Carlo Ray-Trace Method. In Proceedings of the 2010 Symposium on Photonics and Optoelectronics, Chengdu, China, 19–21 June 2010; pp. 1–4. [Google Scholar]
- Jiang, S.; Hu, P.; Mo, S.; Chen, Z. Optical modeling for a two-stage parabolic trough concentrating photovoltaic/thermal system using spectral beam splitting technology. Sol. Energy Mater. Sol. Cells 2010, 94, 1686–1696. [Google Scholar] [CrossRef]
- Cheng, Z.D.; He, Y.L.; Xiao, J.; Tao, Y.B.; Xu, R.J. Three-dimensional numerical study of heat transfer characteristics in the receiver tube of parabolic trough solar collector. Int. Commun. Heat Mass Transf. 2010, 37, 782–787. [Google Scholar] [CrossRef]
- Yung, C.-F.; Yeh, H.-Y.; Lee, C.-D.; Wu, J.-L.; Zhou1, P.-C.; Feng, J.-C.; Wang, H.-X.; Peng, S.J. Optimal regional pole placement for sun tracking control of high-concentration photovoltaic (HCPV) systems: Case study. Opt. Control Appl. Methods 2010, 31, 581–591. [Google Scholar] [CrossRef]
- He, Y.-L.; Xiao, J.; Cheng, Z.-D.; Tao, Y.-B. A MCRT and FVM coupled simulation method for energy conversion process in parabolic trough solar collector. Renew. Energy 2011, 36, 976–985. [Google Scholar] [CrossRef]
- Cheng, Z.D.; He, Y.L.; Cui, F.Q.; Xu, R.J.; Tao, Y.B. Numerical simulation of a parabolic trough solar collector with nonuniform solar flux conditions by coupling FVM and MCRT method. Sol. Energy 2012, 86, 1770–1784. [Google Scholar] [CrossRef]
- Cheng, Z.D.; He, Y.L.; Cui, F.Q. A new modelling method and unified code with MCRT for concentrating solar collectors and its applications. Appl. Energy 2013, 101, 686–698. [Google Scholar] [CrossRef]
- Cheng, Z.D.; He, Y.L.; Cui, F.Q.; Du, B.C.; Zheng, Z.J.; Xu, Y. Comparative and sensitive analysis for parabolic trough solar collectors with a detailed Monte Carlo ray-tracing optical model. Appl. Energy 2014, 115, 559–572. [Google Scholar] [CrossRef]
- Wang, Y.; Liu, Q.; Lei, J.; Jin, H. Performance analysis of a parabolic trough solar collector with non-uniform solar flux conditions. Int. J. Heat Mass Transf. 2015, 82, 236–249. [Google Scholar] [CrossRef]
- Zou, B.; Dong, J.; Yao, Y.; Jiang, Y. A detailed study on the optical performance of parabolic trough solar collectors with Monte Carlo Ray Tracing method based on theoretical analysis. Sol. Energy 2017, 147, 189–201. [Google Scholar] [CrossRef]
- Kabakov, V.I.; Levin, L.B. A choice of the position of receiver with photocells in parabolic trough concentrator. Sol. Energy Mater. Sol. Cells 1994, 33, 45–49. [Google Scholar] [CrossRef]
- Islam, M.; Miller, S.; Yarlagadda, P.K.; Karim, A. Investigation of the effect of physical and optical factors on the optical performance of a parabolic trough collector. Energies 2017, 10, 1907. [Google Scholar] [CrossRef]
- Zemax®. Optical Design Program, User’s Manual; Radiant Zemax LLC: Bellevue, WA, USA, 2011; Available online: www.radiantzemax.com (accessed on 23 April 2013).
- Buie, D.; Monger, A.G.; Dey, C.J. Sunshape distributions for terrestrial solar simulations. Sol. Energy 2003, 74, 113–122. [Google Scholar] [CrossRef]
- Buie, D.; Dey, C.J.; Bosi, S. The effective size of the solar cone for solar concentrating systems. Sol. Energy 2003, 74, 417–427. [Google Scholar] [CrossRef]
- Buie, D.; Monger, A.G. The effect of circumsolar radiation on a solar concentrating system. Sol. Energy 2004, 76, 181–185. [Google Scholar] [CrossRef]


| Parameters | Value |
|---|---|
| Concentrator width, W = | 5 m |
| Concentrator length, LPT = | 7.8 m |
| Receiver length, LRT = | 8 m |
| Rim angle, ψ = | ≈68° |
| Focal length, f = | 1.84 m |
| Close-end plug outer diameter, dP = | 50.8 mm |
| Glass tube outside diameter, dGT = | 115 mm |
| Glass tube thickness, tGT = | 3 mm |
| Receiver tube inside diameter, dRT = | 66 mm |
| Receiver tube thickness, tRT = | 2 mm |
| Concentrator reflectance, ρPT = | 0.9337 |
| Glass tube transmittance, τGT, for evacuated condition = and for bare receiver = | 0.935 1.0 |
| Receiver absorptance, αRT, for (mostly used) cermet selective coating = black chrome selective coating (used for the current MCRT model) = | 0.92 0.94 |
| Tracking error factor, Eσ = | 0.994 |
| Geometry error factor, Egeom = | 0.98 |
| General error factor, Egen = | 0.96 |
| Optical loss factor for FDirt_on_RT = | 0.981 |
| Optical loss factor for FDirt_on_PT = | 0.963 |
| Sl No. | DNI (W/m2) | Selective Coatings | Glass Tube Condition | ηopt (%) | Eest (%) |
|---|---|---|---|---|---|
| 1 | 807.9 | Cermet | Vacuum | 72.63 | 1.91 |
| 2 | 925.1 | Cermet | Air filled | 73.68 | 1.96 |
| 3 | 954.5 | Cermet | Removed | 77.5 | - |
| 4 | 850.2 | Black Chrome | Vacuum | 73.1 | 2.36 |
| ECE Orientation Schemes | Location of Focus (  ) ) | Cbase (×) | Cpeak (×) | Cmean (×) | MAD of the TSS | ηTSS (%) | ηTNS (%) | ηopt = Ση (%) |
|---|---|---|---|---|---|---|---|---|
| Circular |  | 0 | 63.44 | 21.85 | 23.7 | 79.56 | - | 79.56 |
| Semicircular |  | 1.26 | 63.44 | 43.01 | 15.46 | 78.3 | 1.02 | 79.32 |
| Flat |  | 0.03 | 88 | 22.61 | 27.36 | 26.19 | - | 26.19 |
| ECE Orientation Schemes | Location of Focus (  ) ) | Cbase (×) | Cpeak (×) | Cmean (×) | MAD of the TSS | ηTSS (%) | ηTNS (%) | ηopt = Ση (%) |
|---|---|---|---|---|---|---|---|---|
| Triangular |  | 0.03 | 88 | 22.61 | 27.36 | 26.19 | 0.31 | 26.51 |
 | 3.24 | 52.6 | 21.75 | 14.57 | 25.20 | 0.77 | 25.97 | |
| Inverted triangular |  | 0 | 63.12 | 22.42 | 21.97 | 36.37 | 1.02 | 36.99 |
 | 0.25 | 45 | 23.08 | 12 | 37.44 | 1.02 | 38.06 | |
 | 5.89 | 32.2 | 20.41 | 7.35 | 33.11 | 1.02 | 33.73 |
Location of Focus (  ) ) | ECE Surfaces | Cbase (×) | Cpeak (×) | Cmean (×) | MAD | η (%) | ηopt = Ση (%) |
|---|---|---|---|---|---|---|---|
 | TSS | 8.33 | 25.72 | 18.14 | 5.44 | 21.02 | 33.60 |
| TPSs | 0 | 15.48 | 4.99 | 5.54 | 11.56 | ||
 | TSS | 9.56 | 17.55 | 14.51 | 2.03 | 16.81 | 32.54 |
| TPSs | 0 | 15.39 | 6.35 | 4.7 | 14.71 | ||
 | TSS | 9.17 | 13.43 | 11.7 | 0.94 | 13.55 | 30.49 |
| TPSs | 0.17 | 15.71 | 6.87 | 4.26 | 15.92 | ||
| TNS (for all cases) | ≈0.88 | - | ≈1.02 | - | |||
 .
.
.
.| (°) | σ (°) | ECE Surfaces | Cbase (×) | Cpeak (×) | Cmean (×) | MAD | η (%) | ηopt = Ση (%) |
|---|---|---|---|---|---|---|---|---|
| 68 | 0 | TSS | 9.17 | 13.43 | 11.7 | 0.94 | 13.55 | 30.49 |
| TPSs | 0.17 | 15.71 | 6.87 | 4.26 | 15.92 | |||
| 0.3 | TSS | 8.2 | 13.95 | 11.68 | 1.05 | 13.53 | 28.63 | |
| TPSσ+ | 0.49 | 16.21 | 5.81 | 4.76 | 6.73 | |||
| TPSσ− | 0 | 15.47 | 6.34 | 4.56 | 7.35 | |||
| TNS (for both σ) | ≈0.88 | - | ≈1.02 | |||||
| 90 | 0.3 | TSS | 8.13 | 13.98 | 11.68 | 1.05 | 9.19 | 26.98 |
| TPSσ+ | 0.47 | 26.65 | 6.82 | 6.00 | 5.37 | |||
| TPSσ− | 0 | 34.5 | 14.9 | 9.98 | 11.73 | |||
| TNS | ≈0.88 | - | ≈0.69 | |||||
Location of Focus (  ) ) | ψ (°) | σ (°) | ECE Surfaces | Cbase (×) | Cpeak (×) | Cmean (×) | MAD | η (%) | ηopt = Ση (%) |
|---|---|---|---|---|---|---|---|---|---|
 | 68 | 0 | TSS | 1.26 | 63.44 | 43.01 | 15.46 | 78.3 | 79.32 |
| TPSs | 0 | 0 | 0 | - | - | ||||
| 0.3 | TSS | 0 | 73.37 | 40.16 | 19.42 | 74.93 | 77.47 | ||
| TPSσ+ | 0 | 11.89 | 2.63 | 3.28 | 1.52 | ||||
| TPSσ− | 0 | 0 | 0 | - | - | ||||
| TNS (for both σ) | ≈0.88 | - | ≈1.02 | ||||||
| 90 | 0 | TSS | 44.74 | 81.55 | 59.96 | 8.83 | 74.16 | 78.31 | |
| TPSs | 0 | 20.09 | 4.39 | 5.18 | 3.46 | ||||
| 0.3 | TSS | 0.03 | 95.61 | 56.23 | 15.57 | 69.54 | 77.23 | ||
| TPSσ+ | 0 | 30.01 | 17.80 | 8.54 | 7.00 | ||||
| TPSσ− | 0 | 0 | 0 | - | 0.00 | ||||
| TNS (for both σ) | ≈0.88 | - | ≈0.69 | ||||||
 | 68 | 0 | TSS | 23.07 | 33.88 | 29.91 | 1.99 | 54.45 | 67.11 |
| TPSs | 0 | 15.58 | 10.05 | 3.95 | 11.64 | ||||
| 0.3 | TSS | 22.08 | 49.19 | 30.36 | 6.38 | 55.27 | 64.84 | ||
| TPSσ+ | 0 | 16.01 | 10.23 | 3.99 | 5.93 | ||||
| TPSσ− | 0 | 13.71 | 4.05 | 4.41 | 2.35 | ||||
| TNS (for both σ) | ≈0.88 | - | ≈1.02 | ||||||
| 90 | 0 | TSS | 23.07 | 33.92 | 29.91 | 1.99 | 36.99 | 55.6 | |
| TPSs | 0.00 | 32.77 | 22.77 | 6.51 | 17.92 | ||||
| 0.3 | TSS | 22.09 | 73.26 | 31.71 | 8.11 | 39.22 | 52.37 | ||
| TPSσ+ | 1.5 | 29.77 | 12.23 | 5.61 | 4.81 | ||||
| TPSσ− | 0 | 34.37 | 19.43 | 11.17 | 7.65 | ||||
| TNS (for both σ) | ≈0.88 | - | ≈0.69 | ||||||
© 2018 by the authors. Licensee MDPI, Basel, Switzerland. This article is an open access article distributed under the terms and conditions of the Creative Commons Attribution (CC BY) license (http://creativecommons.org/licenses/by/4.0/).
Share and Cite
Islam, M.; Yarlagadda, P.; Karim, A. Effect of the Orientation Schemes of the Energy Collection Element on the Optical Performance of a Parabolic Trough Concentrating Collector. Energies 2019, 12, 128. https://doi.org/10.3390/en12010128
Islam M, Yarlagadda P, Karim A. Effect of the Orientation Schemes of the Energy Collection Element on the Optical Performance of a Parabolic Trough Concentrating Collector. Energies. 2019; 12(1):128. https://doi.org/10.3390/en12010128
Chicago/Turabian StyleIslam, Majedul, Prasad Yarlagadda, and Azharul Karim. 2019. "Effect of the Orientation Schemes of the Energy Collection Element on the Optical Performance of a Parabolic Trough Concentrating Collector" Energies 12, no. 1: 128. https://doi.org/10.3390/en12010128
APA StyleIslam, M., Yarlagadda, P., & Karim, A. (2019). Effect of the Orientation Schemes of the Energy Collection Element on the Optical Performance of a Parabolic Trough Concentrating Collector. Energies, 12(1), 128. https://doi.org/10.3390/en12010128