Article

An NNwC MPPT-Based Energy Supply Solution for Sensor Nodes in Buildings and Its Feasibility Study

1
Department of Electronic and Information Engineering, The Hong Kong Polytechnic University, Hong Kong, China
2
Department of Architecture, University of Cambridge, Cambridge CB3 0BN, UK
3
Department of Electrical and Computer Engineering, University of California San Diego, San Diego, CA 92122, USA
4
Department of Building and Real Estate, The Hong Kong Polytechnic University, Hong Kong, China
*
Author to whom correspondence should be addressed.
Energies 2019, 12(1), 101; https://doi.org/10.3390/en12010101
Submission received: 14 November 2018 / Revised: 24 December 2018 / Accepted: 27 December 2018 / Published: 29 December 2018
(This article belongs to the Section F: Electrical Engineering)

Abstract

:
Sensors for data collecting are vital in the development of IoT and intelligent systems. High power consuming current and voltage monitors are indispensable in conducting maximum power point tracking (MPPT) in traditional PV energy wireless sensor nodes. This paper presents a sensor node system based on Neural Network MPPT with cloud method (NNwC) which utilizes information sharing process that is specific to sensor networks. NNwC uses a few sample sensor nodes to collect environmental parameter data such as light intensity (L) and temperature (T) to build the MPPT regression model by Neural Network. Then all other functional sensor nodes implement the model with their environmental parametervalues to conduct MPPT. As a result, the new sensor node system reduces energy consumption as well as the size and cost of the harvester. Then, this paper provides a SPICE simulation to estimate the percentage of power consumption reduced in the new sensor node system and also estimates the percentage of loss in neural network MPPT power generation compared with the perfect MPPT. Finally, the study compares the economic and environmental performance of the proposed system and the traditional ones through a case in a real building situation.

1. Introduction

In developed countries, the building sector (i.e., residential and commercial buildings) consumes between 20% and 40% of energy [1]. Globally, energy usage for air-conditioning and artificial lighting accounts for approximately 70% of final energy consumption in buildings [1]. Thus, combining the built environment design with the internet of things (IoT), big data and artificial intelligence (AI) for indoor comforts and energy conservation are encouraged. In this pattern, widespread sensors collect various data such as temperature, illumination intensity, CO2 concentration continuously and send the data to the storage of Big Data (i.e., databases). AI utilizes the labeled data from the database to conduct analyzing, processing, training and decision making. Therefore, the key step in this procedure is the data collected by sensors. There are two types of power supply methods for traditional sensors. The first one is to utilize energy from the power grid, whose initial cost is enormous due to the requirement of power transmission line connection for each sensor. In addition, a mass of power transmission lines could greatly limit the distribution range of sensor nodes, which is against its feature of pervasive and massive. Another solution employs the self-energized PV wireless sensor nodes [1,2] for power generation from solar energy. These systems commonly use batteries or supercapacitors for energy storage to maintain the continuous operation of sensor nodes. However, due to the limited PV conversion efficiency, this design requires large-size PV panels to generate enough energy for sensor nodes. These large-size sensor nodes will not only alter original environmental factors but also restrict their distribution range, and then, reduce the reliability of data collected by the sensors.
Maximum power point tracking (MPPT) algorithms, a technique for increasing the output of the solar panel in a given size, is a promising solution to the energy storage problem in sensor node systems. However, MPPT requires voltage and current monitors to acquire the real-time power output of the harvester. Sensor node is a kind of low energy consumption application. In order to acquire more precise voltage and current parameters, the monitor components insulated with original output circuit should be adopted because they can obtain the voltage and current data without affecting the original values. The Hall Effect-Based Current/Voltage Monitors such as CSM series and VSM series are suitable for high accuracy current and voltage data collecting. However, the monitors, especially current monitors, not only have a high initial cost [3] but also require relatively large power support according to the load [4]. As the result, these sensors are commonly designed with space-consuming solar panels to avoid the interruption of sensors. To address such problem, there is a strong demand for a new wireless solar energy harvester for sensor node network systems with a higher conversion efficiency but lower power consumption. This paper presents a new system based on Neural Network MPPT with cloud method (NNwC) where most sensor nodes conduct MPPT without power-consuming monitors by learning the data from a few sample sensor nodes with I(current)/V(voltage) monitors. Then this paper analyzes the reduction percentage of operation power consumption in functional sensor nodes by SPICE simulation and estimates the percentage of loss in neural network MPPT power generation compared with the perfect MPPT. It proves that smaller size PV panels can satisfy the power requirement of functional sensor nodes in NNwC method. Finally, this paper analyzes the feasibility of the proposed system by comparing the economic and environmental performance of the proposed system and the traditional ones employing a case of a typical building in Southern China.

2. Literature Review

2.1. Maximum Power Point Tracking (MPPT) Technique

MPPT is a kind of techniques aiming at maximizing the power output of PV, wind or other systems [5]. In the PV situation, the MPPT is implemented by adjusting the Vpv to Vmpp with a DC-to-DC converter controlled by a microcontroller (MCU). Many effective algorithms implementing MPPT are commonly used in PV harvesters [6] as Table 1. These MPPT techniques are classified into four categories. The first category is MPPT based on output control, including Hill-climbing/P&O, IncCond, Ripple Correlation Control (RCC), Load I or V Maximization, DC Link Capacitor Droop Control. The second type is based on AI and non-linear controlling, it concludes Fuzzy Logic Control, Neural Network, One-Cycle Control (OCC) MPPT. The third type is MPPT based on optimization mathematic model, including Fractional Voc, Fractional Isc, and Current Sweep. Some MPPT techniques are not true MPPT since their algorithms do not aim at the most optimal MPP point, but only give a relative reasonable the maximum power point (MPP), such as Fractional Voc and Fractional Isc. This study only discusses four representative MPPT algorithms commonly used in research and industry [7,8,9,10,11,12,13,14,15,16,17,18,19,20,21,22,23,24,25,26,27,28,29,30,31,32,33,34,35].

2.1.1. Incremental Conductance

The Incremental Conductance (InC) is one of the traditional and commonly used MPPT techniques [7,8,9,10]. The PV power can be represented as Equation (1). After taking the derivative of P as Equation (2), it can be further transformed into (3)
P = V × I ;
dP dV = d / IV dV = I + V dI dV I + V Δ I Δ V
Δ I Δ V = I V ,   at   MPP Δ I Δ V = I V ,   left   of   MPP Δ I Δ V = I V ,   right   of   MPP ,
In [6], InC is divided in two steps. In the first step, an initial Vpv which is a fraction of open-circuit voltage will be set as a default value. Then in the second step, an accurate InC algorithm with smaller increments will be implemented in MPPT. This two-step InC can reduce the complexity of algorithm and avoid being trapped into local maximum. InC performs accurately and steadily in DSP and microcontroller control. However, InC requires a current monitor and a voltage monitor to sense the I and V value for implementing the algorithm [10].

2.1.2. Perturb and Observe

Perturb and Observe (P&O) is another most frequently discussed MPPT algorithm [13,14]. In this algorithm, there will be a default Vpv value using a fraction of open-circuit voltage. The P&O algorithm chart is shown as the Table 2. The three main problems of the P&O are that (1) the oscillations around the MPP under steady-state conditions; (2) the poor tracking under changing irradiance; and (3) energy consuming [15,16,17]. To record the power, a current monitor and voltage monitors are required for real-time power comparison. In [18,19,20], an adjustable perturbing increment is adopted to ensure that P&O MPPT accelerates tracking process at first and minimize the oscillation Ref 15 was wrongly written, it has been changed to correct one when it is closed to MPP. To avoid the invalid P&O tracking when the environment condition changes rapidly, in [21], the direction for next perturbing will be compared with the previous two Ppv. In [22,23,24], they use one monitor to estimate the other one based on power converter topology, but still need either I or V to achieve P&O algorithm.

2.1.3. Fuzzy Logic

Fuzzy Logic is one of the latest control algorithms used in MPPT [25,26,27]. It includes three steps: fuzzification, rule evaluation, and defuzzification. In [28,29], seven fuzzy sets mode is adopted for higher accuracy. In [29], the membership function and evaluation rules will be changed periodically, the performance of Fuzzy Logic MPPT will be improved. Fuzzy Logic has a good performance in solving a non-linear problem with inaccurate inputs [30]. However, in PV MPPT, Fuzzy Logic still needs voltage and current values as inputs.

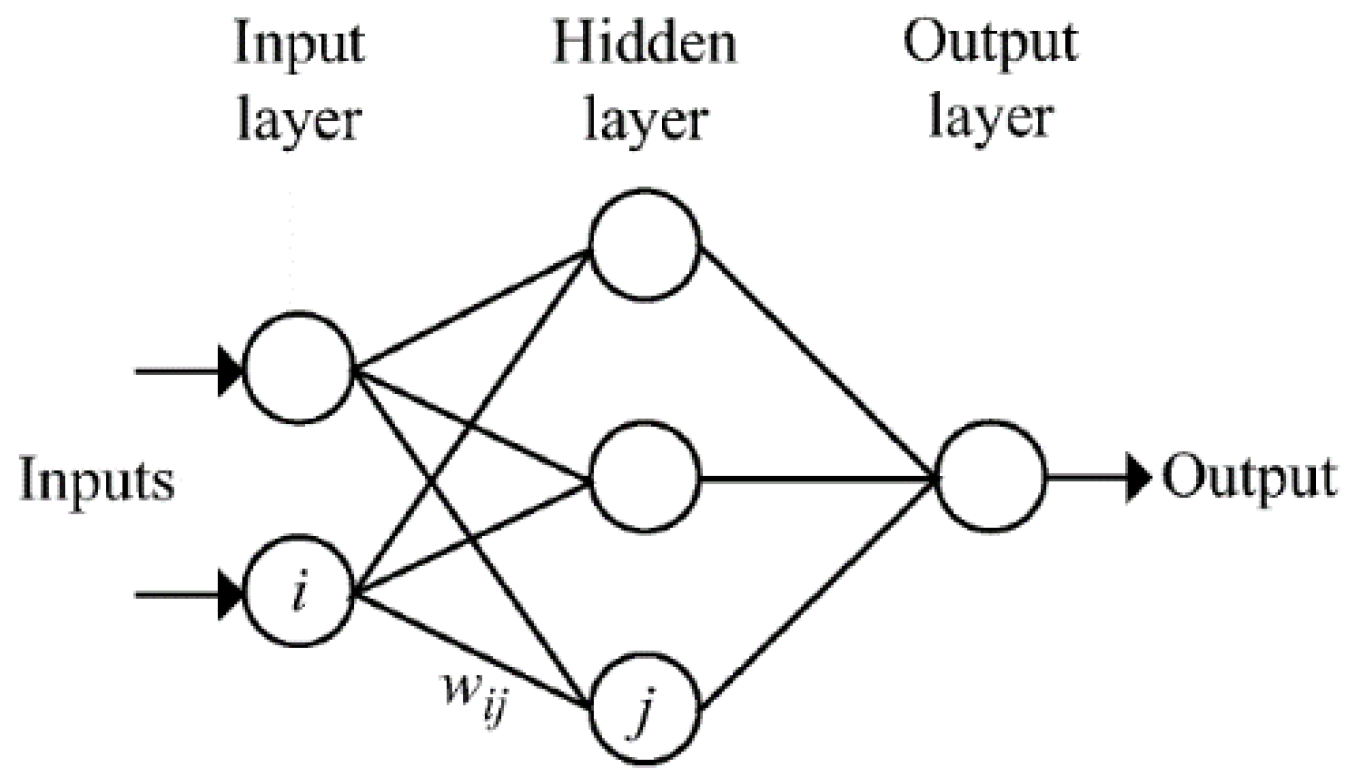
2.1.4. Neural Network

Basic structures and input parameter selection:
Artificial Neural Networks (ANN) can also be deployed in the MPPT technique [31,32,33]. ANNs usually have three parts of layers as Figure 1: input, hidden and output layers.
Training ANN for MPPT:
Tagged data is a combination of inputs as well as its corresponding output pairs. A lot of tagged data need to be acquired as training material in the training process. An ANN training process will find the optimal combination of weight Wij between the hidden layers [34]. A small group tagged data will not be used in the training process and will be used to verify the accuracy of this structure. If the predicting accuracy of output in this structure is below expectation. The structure of the hidden layer needs to be changed and retrain a new group of Wij until a satisfactory output regression model is decided [35]. ANNs in MPPT usually uses derived parameter of Ipv and Vpv as input [36] in ANN method, MCU does not need to do heavy calculation in MPPT algorithm after the ANN model has been constructed. ANN saves the computation power consumption. But it still cannot avoid using high power consuming and expensive I/V monitors.
For all MPPT algorithms discussed above, they require I/V monitors to sense the real-time power output value. I/V monitors will lead extra energy consuming in each sensor node. Energy consumption I/V monitors is negligible in high solar power generation of the power station. For low power application such as sensor nodes, a larger PV panel is needed to ensure the continuous operation of sensor nodes. Large PV panels have a higher expense, more importantly, will influence the original environment condition and make the data from the sensors less accurate.

3. Neural Network MPPT with Cloud Method (NNwC) System Design

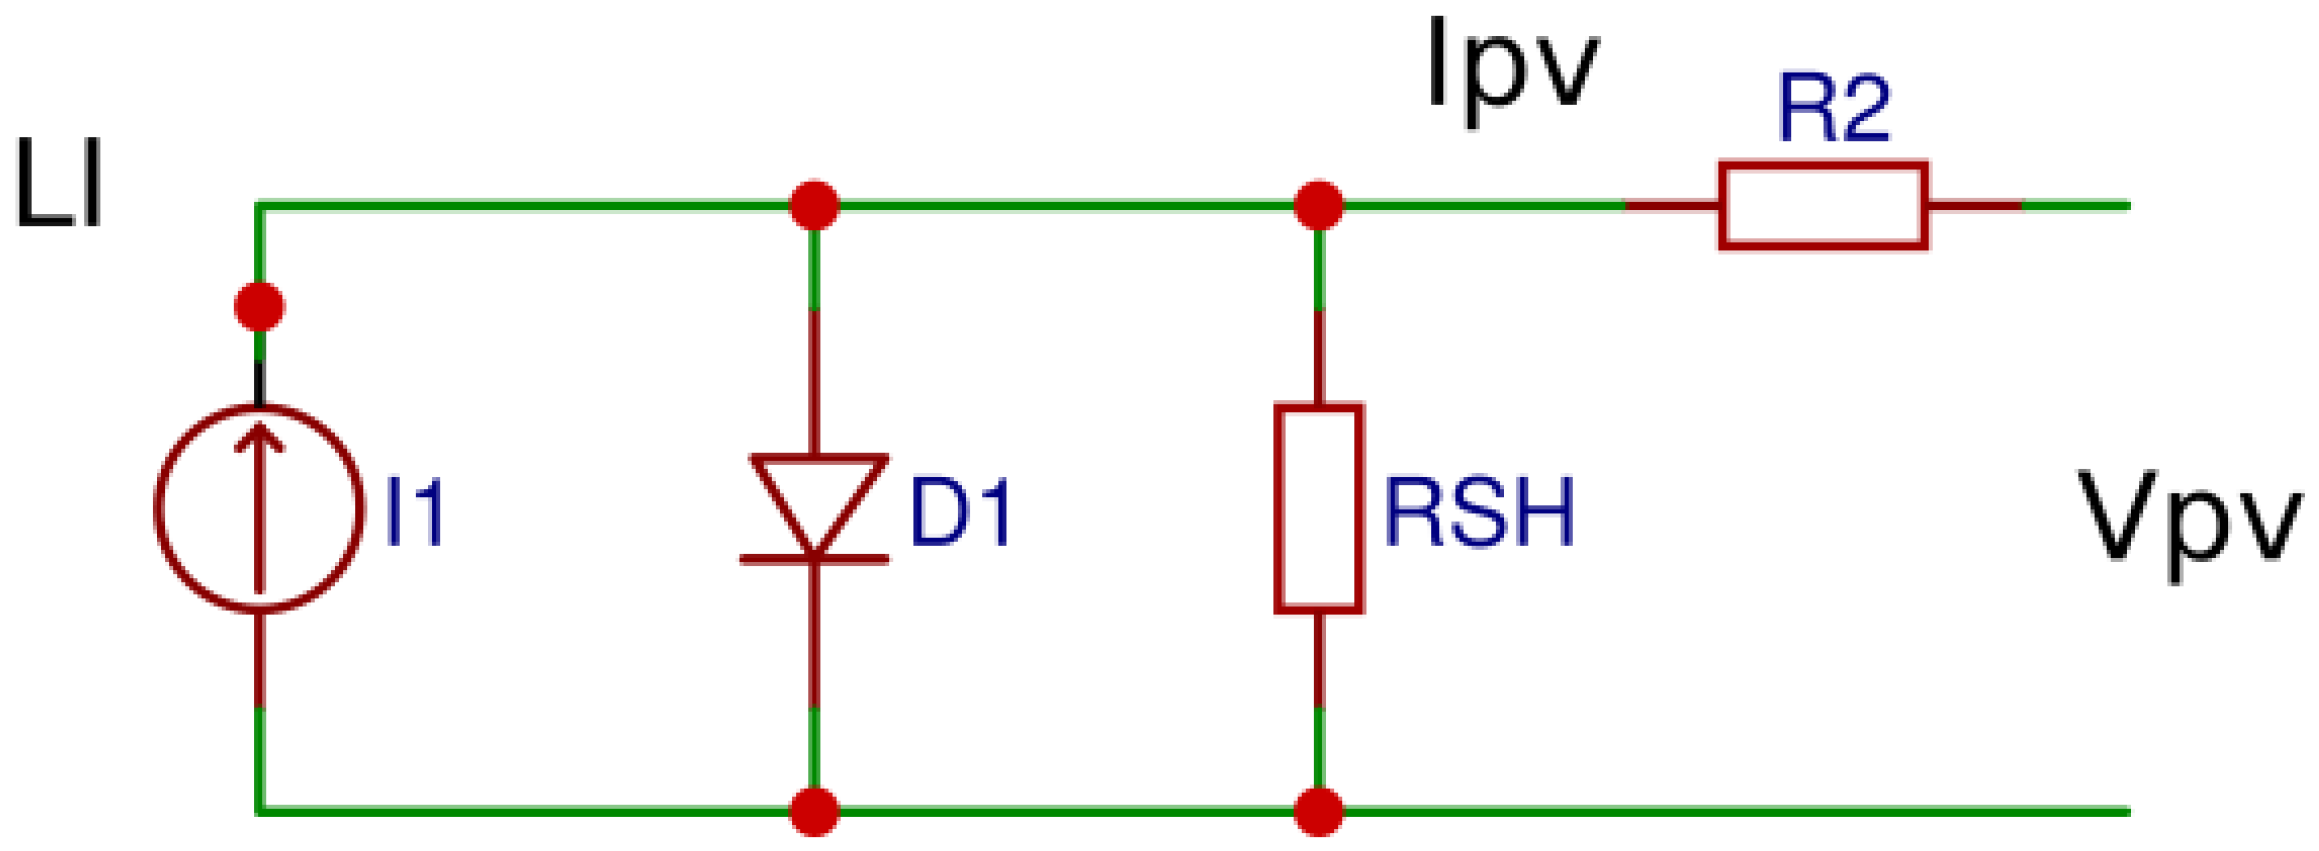
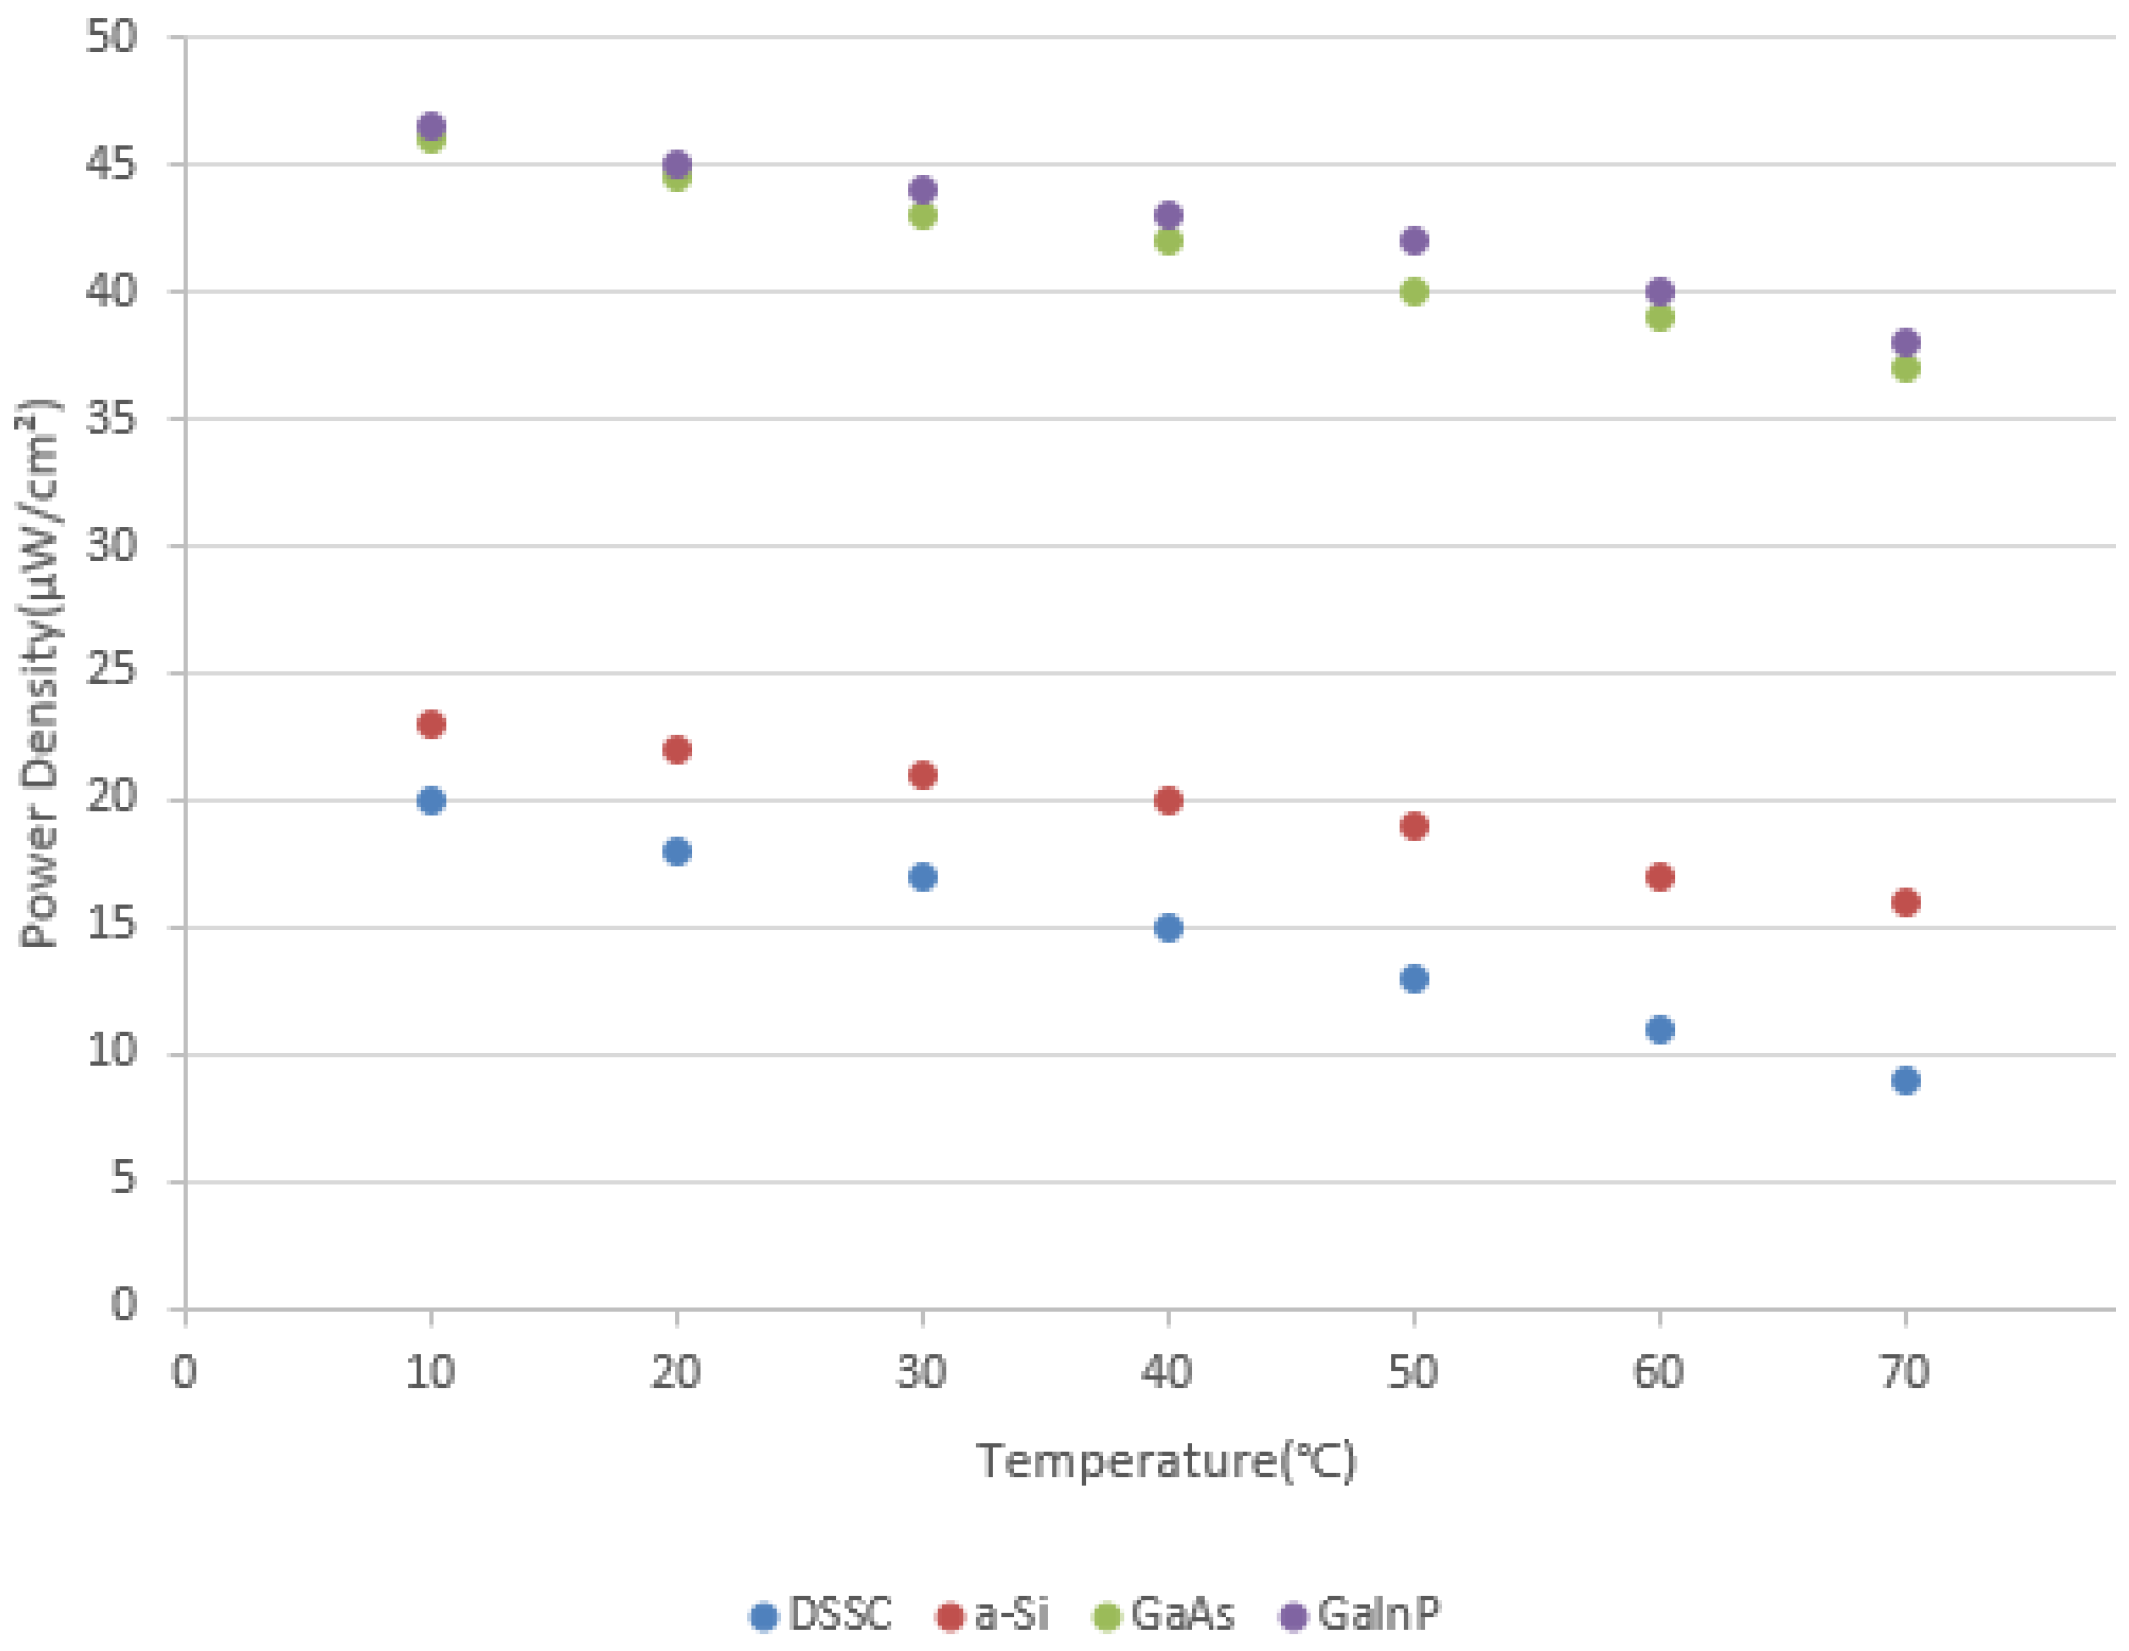
3.1. Solar Cells Characteristic

The global energy demand is continuously growing due to population explosion and economic development. Solar energy, among other sources of energy, is a promising and freely available energy source for managing long-term issues in energy crisis [37]. The industry therefore considers employing solar energy for supplying energy for sensor nodes [38,39,40]. The main challenge in the industry is to improve the power output of solar panels to meet sensor nodes’ demand. To acquire a higher power output, one methodology is PV material improvement, it needs to develop new type of PV material which has a higher converting efficiency. Al0.2Ga0.8AS is one of the best indoor PV materials, but its conversion efficiency is only up to 21.1% [41]. However, the actual energy can be utilized by load is even lower. To ensure the generated energy can be best deliver to the load under a given PV material, MPPT technique can be used to extract the maximum power from PV panel. An equivalent circuit model of the solar array module can be regarded as the following schematic [5]. (Figure 2).
The relationship shown in Figure 3 of Ppv, Ipv and Vpv can be found in some related researches in [42,43,44]. For the relationship between Ipv and Vpv, the output current Ipv is nearly proportional to the light intensity. With Vpv increases from zero, Ipv decreases with a speed from slow to fast. For the relationship between Ipv and Ppv. The output power of solar panel Ppv is the product of Ipv and Vpv. With Vpv increases from zero, Ppv will continuously increase as Vpv increases. After Vpv surpasses a certain voltage value named as Vmpp, Ppv will meet its extremum at this time. Afterwards, Ppv will reduce while increasing the value of Vpv.
The Vmpp are subject to both light intensity and temperature. In a real environment, however, the light intensity and temperature are fluctuating in different time of a day. According to researches [45,46] related to temperature factor of PV power generation, it can be concluded that power density of these kinds of PV cells will decrease while temperature increases (Figure 4). So, change in temperature will also cause a change in output current and its Vmpp.

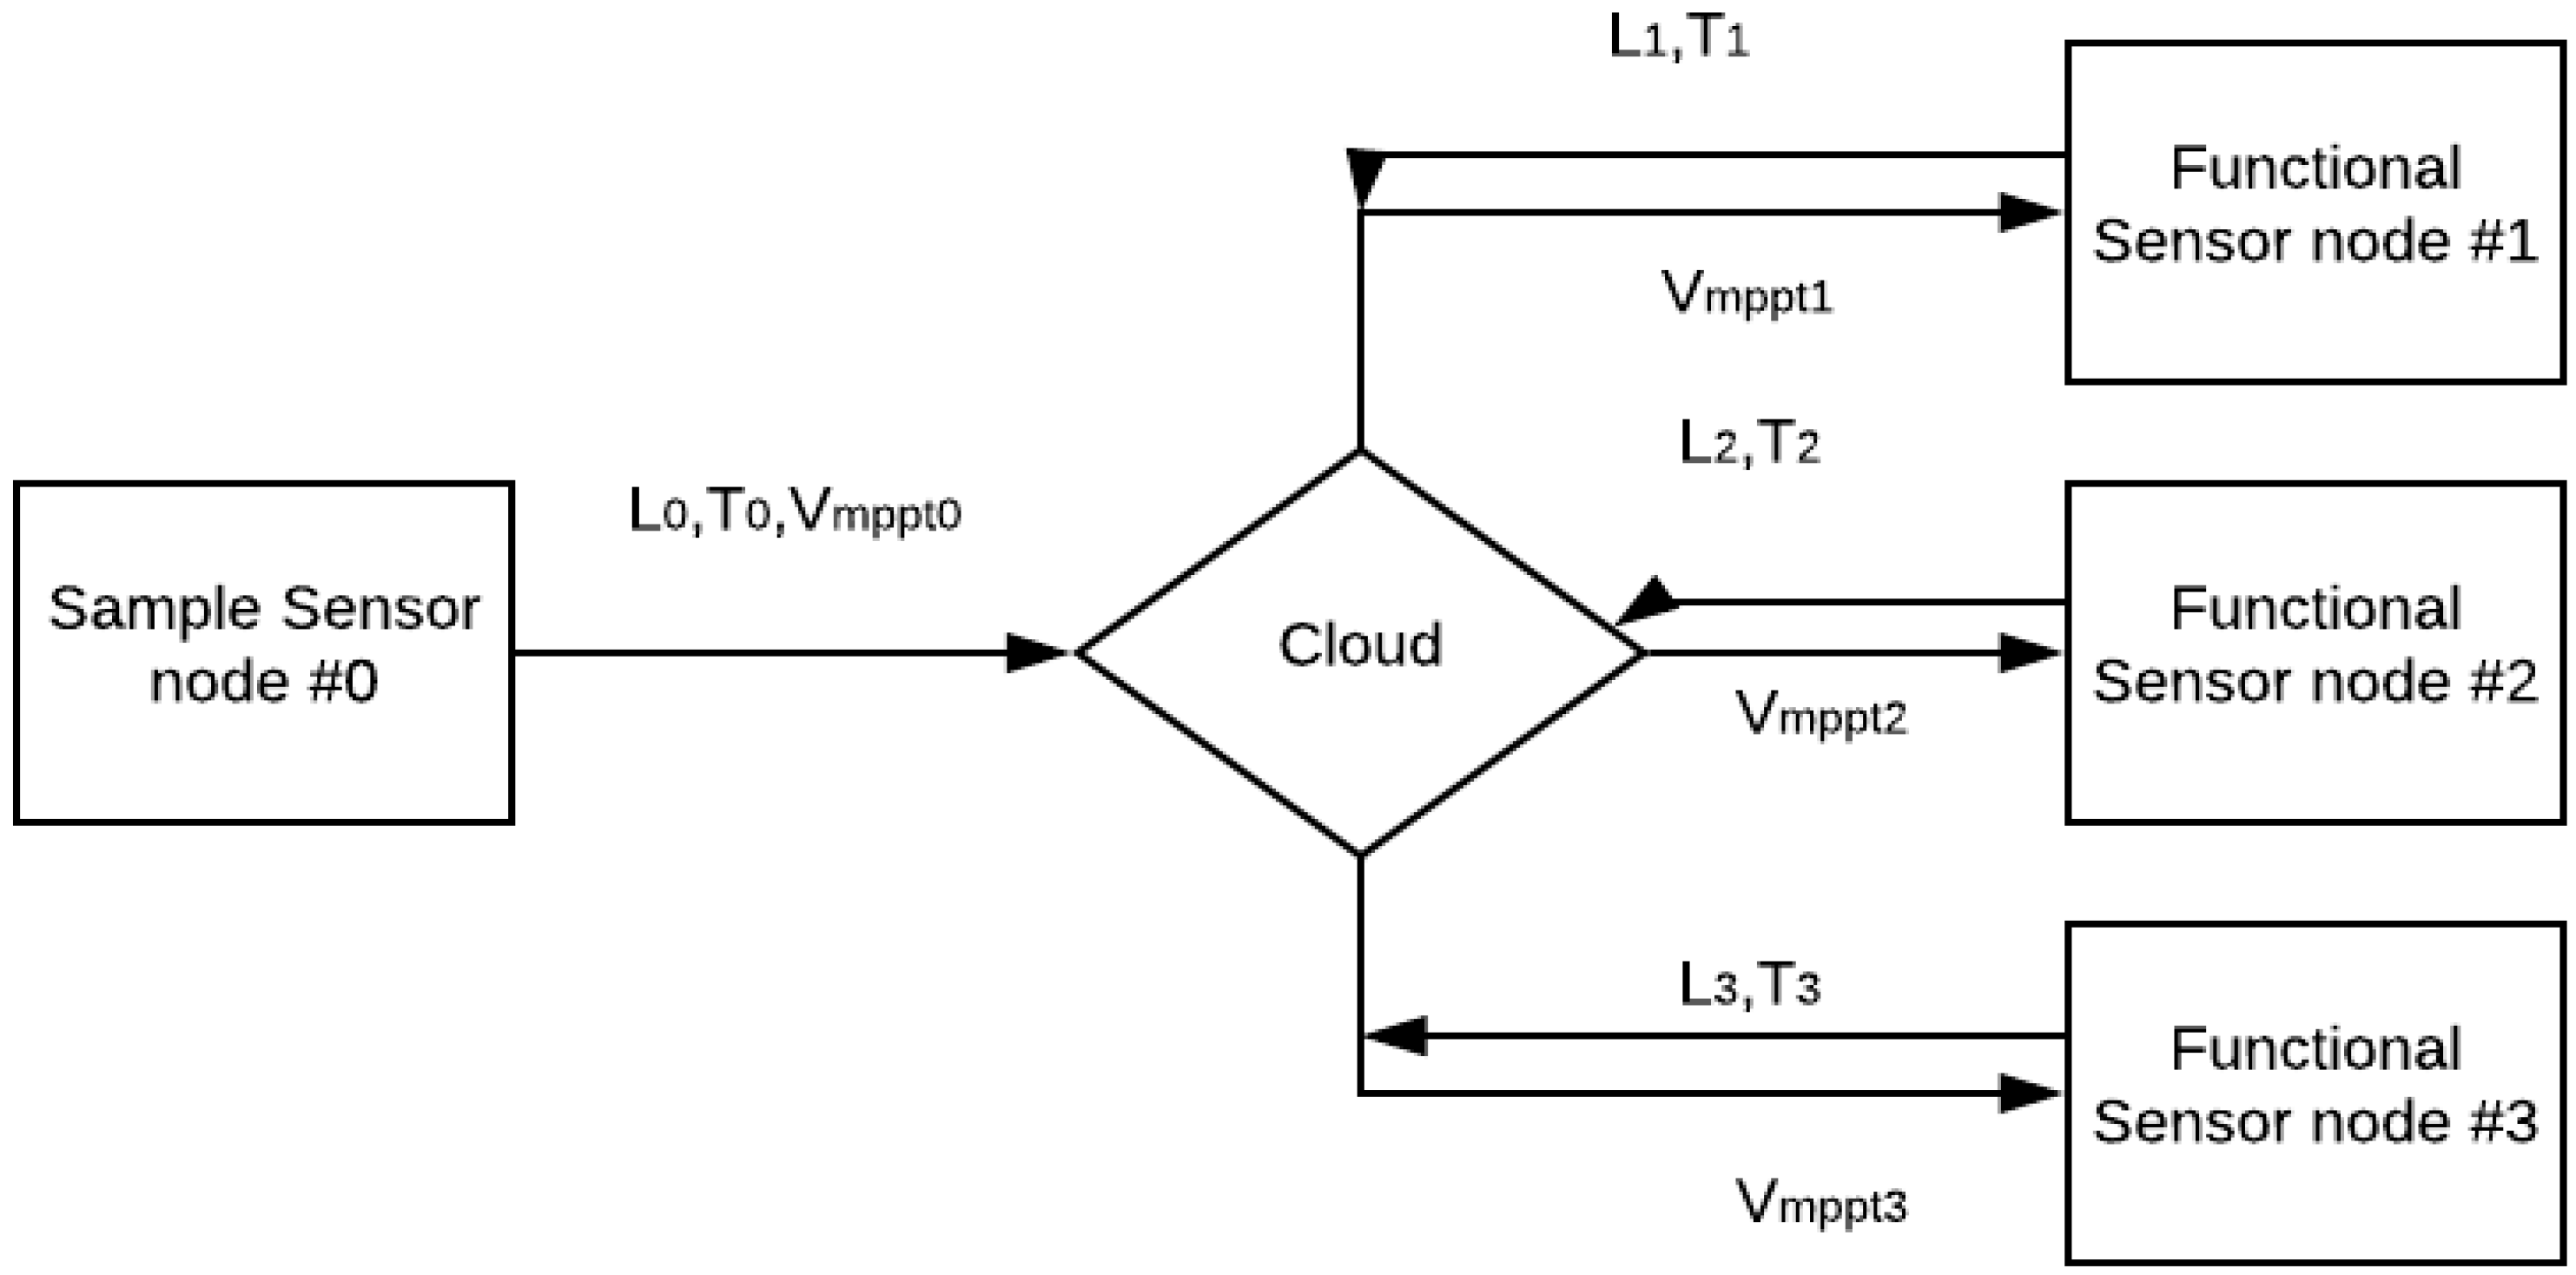
3.2. NNwC System Overview

To provide a high-efficiency power management solution for wireless sensor node system using the fewer I/V monitors, a system based on Neural Network MPPT with cloud method (NNwC) is suggested in this paper. NNwC makes use of light intensity and temperature influence in PV panel, and predict MPP of PV panel based on light intensity and temperature. This design focuses on the efficiency of the whole system of sensor nodes, rather than a single sensor node. NNwC system can be divided into two part: 1. High-efficiency solar energy wireless sensor system including sample sensor nodes and functional sensor nodes; 2. Processing Center on the cloud: the ANN data processing platform. The relationship between sensor nodes and cloud in NNwC is shown in Figure 5. Sample Sensors account for a small number of sensor nodes, they conducted MPPT using InC or simulated annealing algorithm and send their L0, T0 as well as their result MPPT0 to the cloud. The cloud receive the data from sample sensors and train a generalized model for all sensor nodes. After Functional Sensor Node i sends its Li Ti to the cloud, the cloud will return corresbonding Vmppti to each functional sensor node.

3.3. Environmental MPPT Model without Real-Time Current and Voltage Monitoring

An MPP (Maximum Power Point) voltage is harvester’s output voltage when it generates the greatest power output in a given environment situation. Because of the characteristic of PV cells, the MPP voltage mainly depends on the temperature (T) and light intensity (L). Then T and L values collected by sensors can be utilized to conduct MPPT directly, it will avoid using of I or V monitors to do MPPT, which is Environment-MPPT model.
A strength for sensor node to conduct Environment-MPPT is that it originally has the functions of collecting the environmental data such as T and L, and they send or receive data with the cloud server. If we assume the sensor nodes in a system are from the same batch produced by the factory, the PV characteristics and aging condition among each panel are almost the same. Then a small fraction of sensor nodes (sample sensor nodes) with high-power consuming I/V monitors will work first. They implement traditional MPPT method such as InC or Simulated Annealing algorithm, and then send MPPT result, Vmpp, as well as corresponding T and L values back to the cloud. The cloud server trains a Neural Network regression model by using these T, L and Vmpp data set from these sample sensor nodes. Finally, this model is able to predict the Vmpp at any combination of T and L condition.
In this way, other majority of sensor nodes in this system only need to send their real time T and L to the cloud respectively, the Vmpp will be available in the cloud by inputting T and L value to the neural network model. These Vmpp values will be sent back to each sensor node respectively. These sensor nodes are named as functional sensors nodes, they avoid the high-power consuming MPPT process and make it possible to reduce the scale of the solar panel.

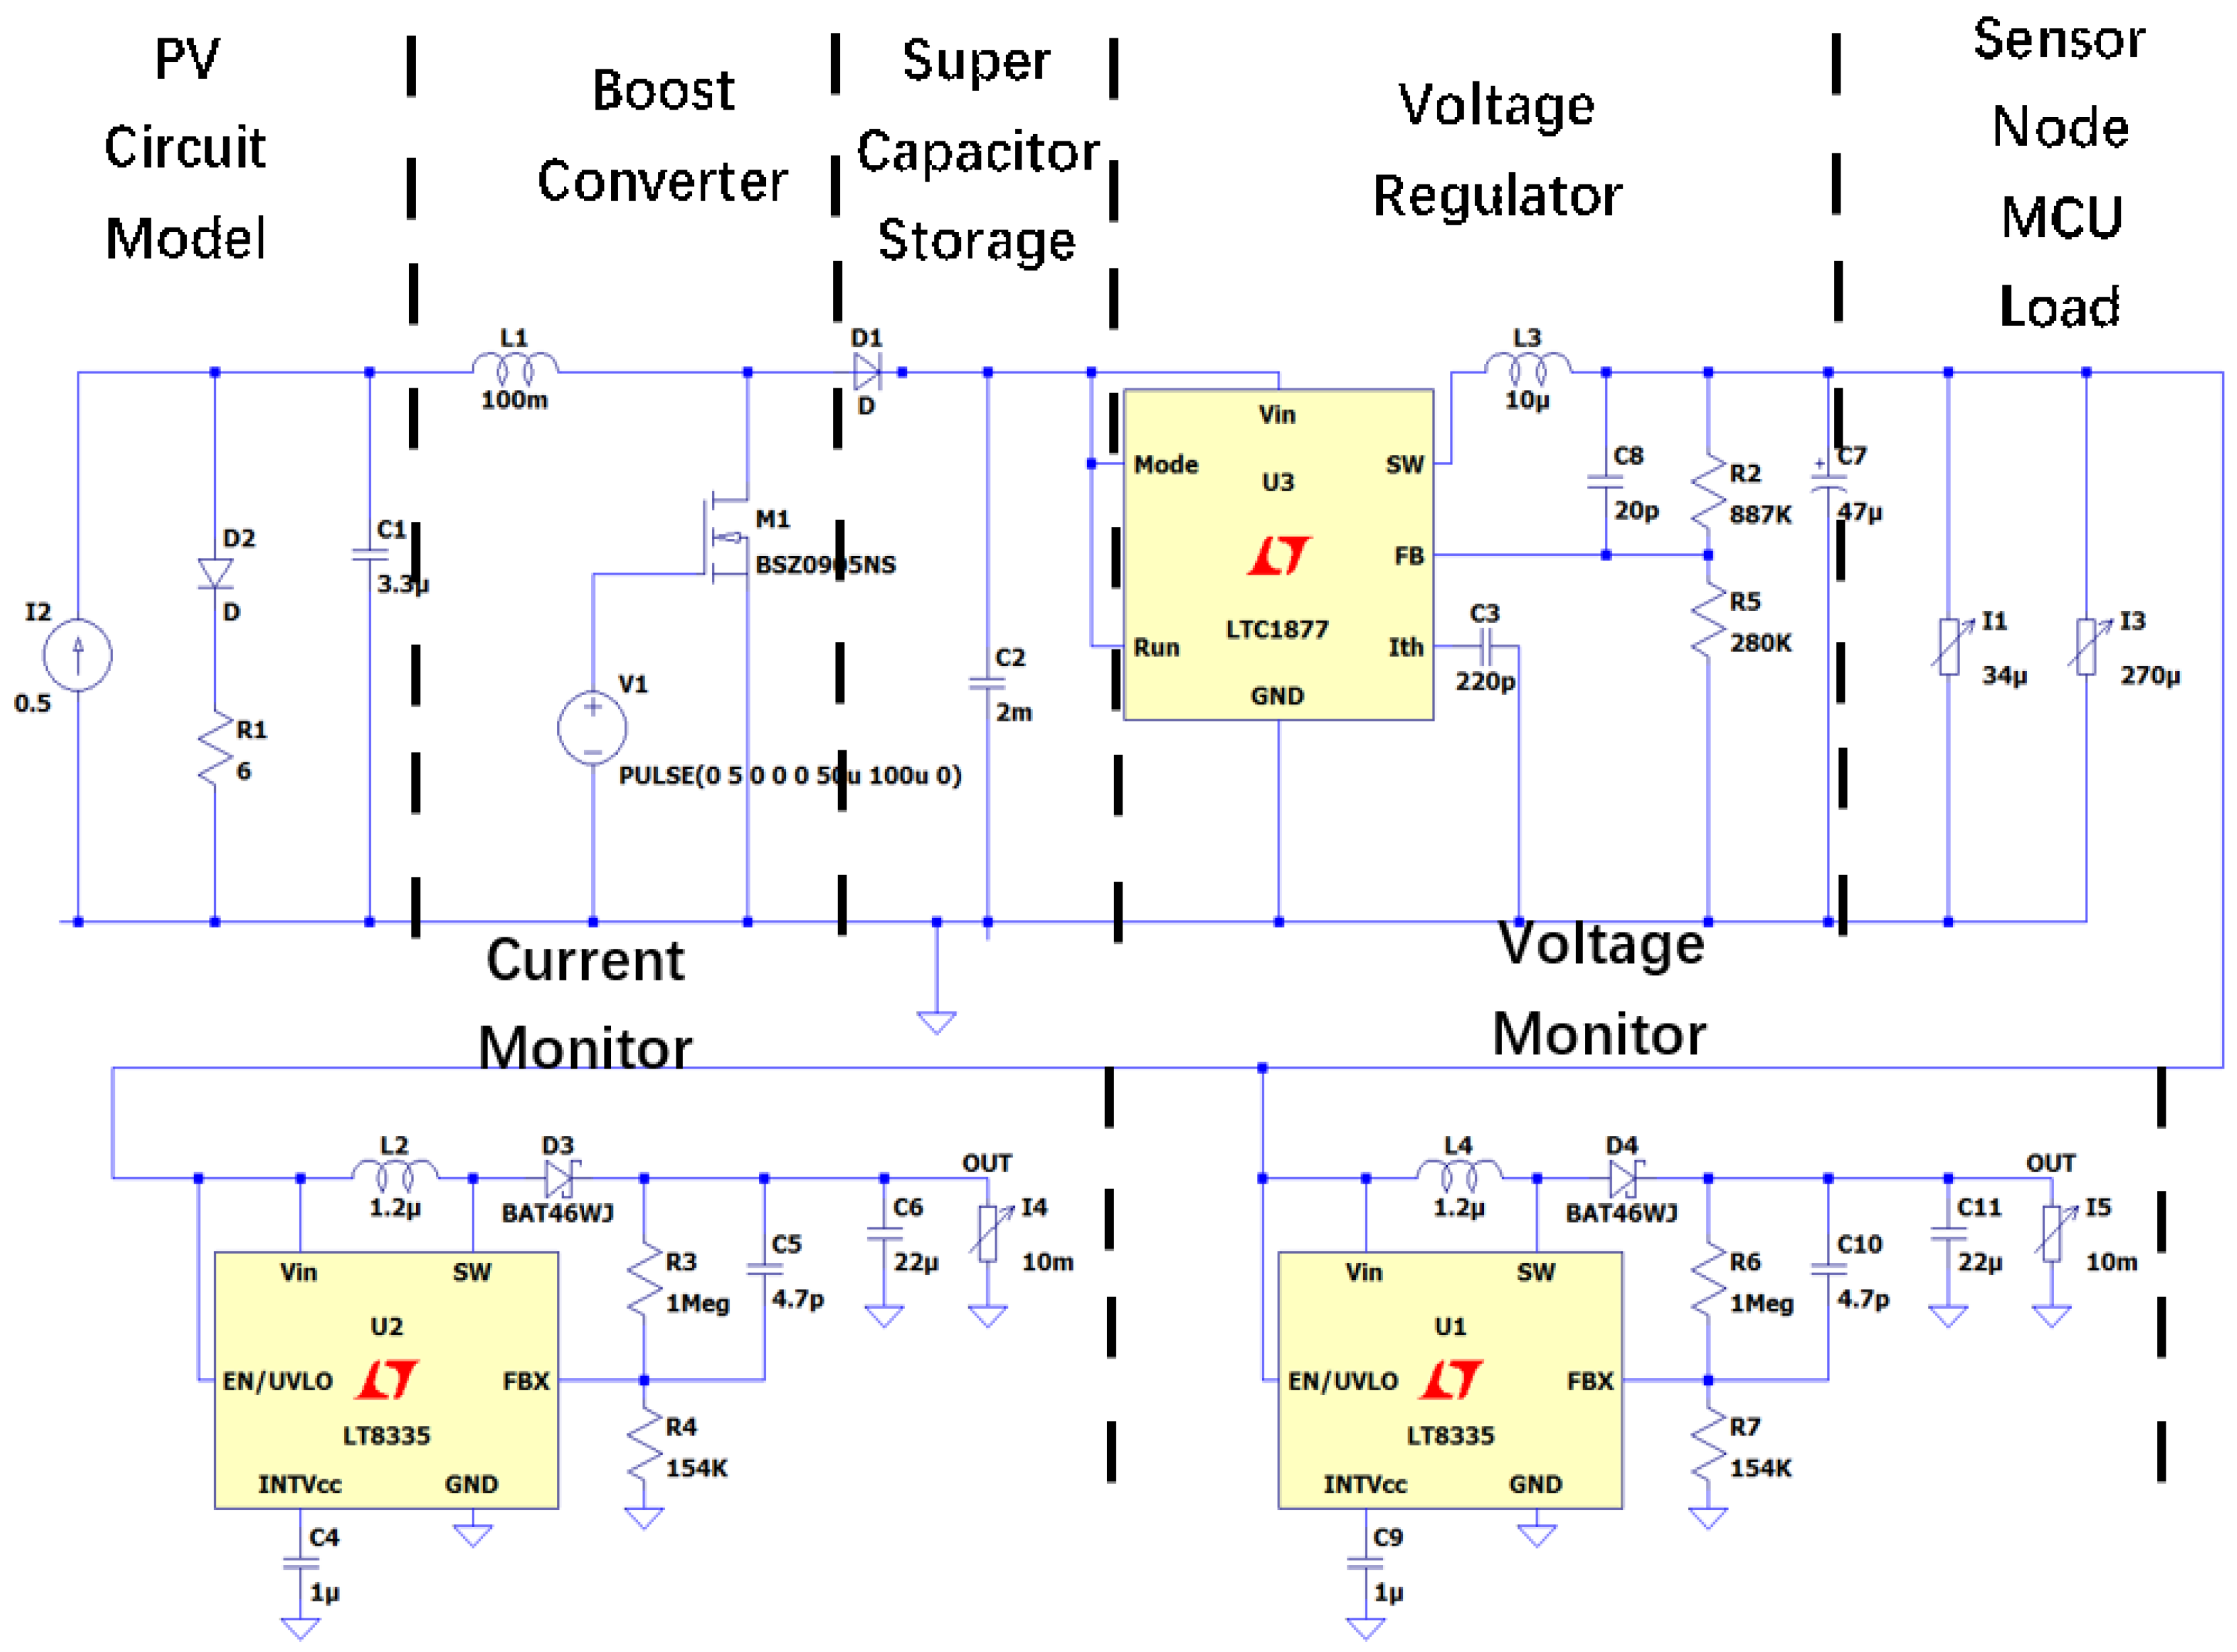
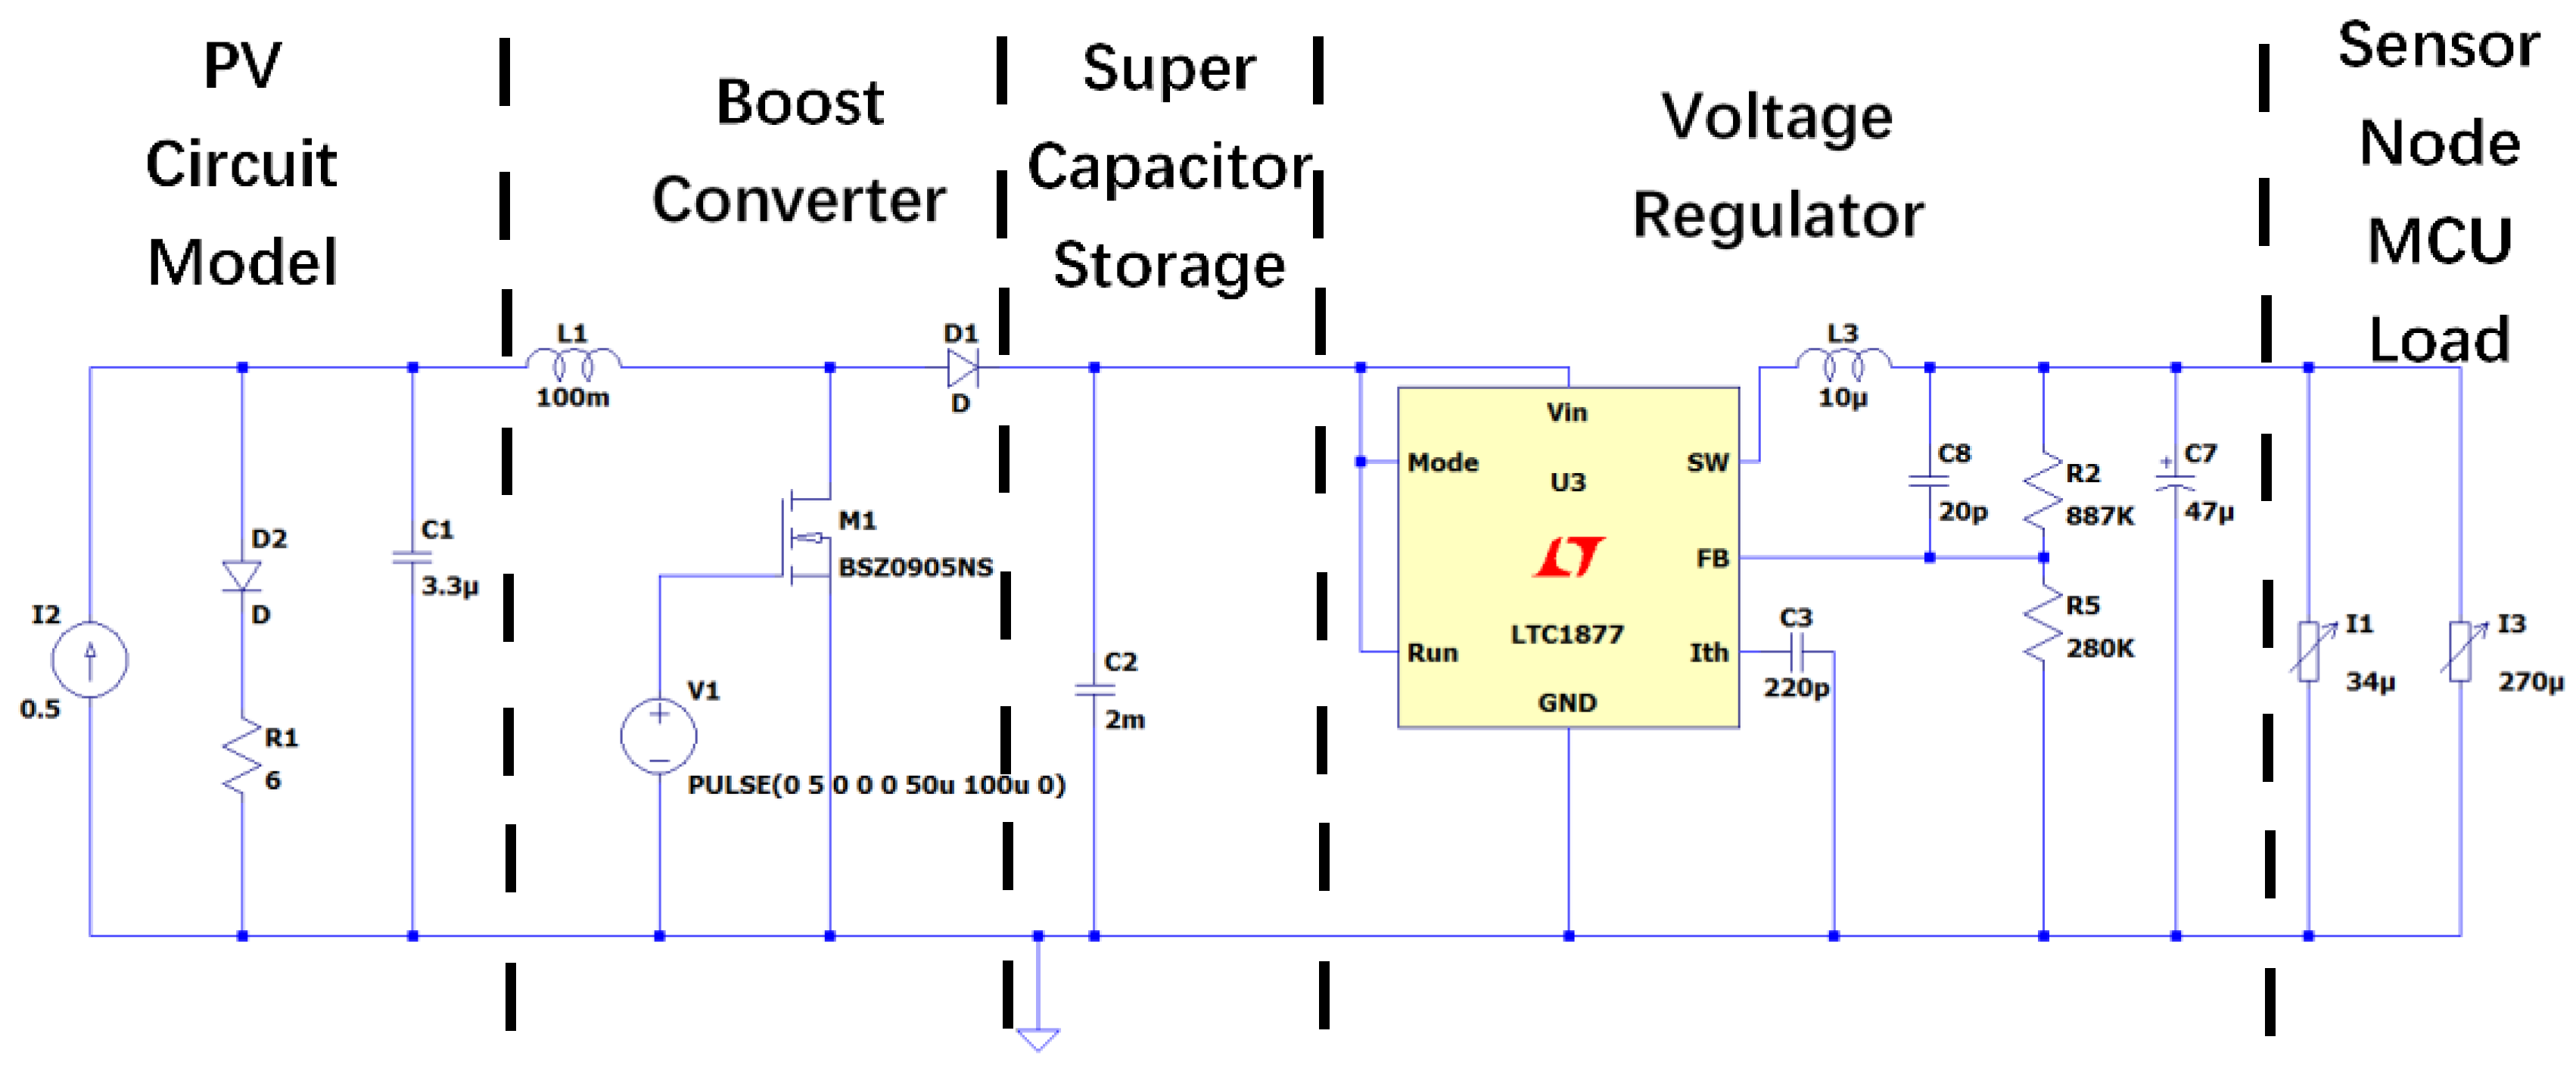
3.4. High-Efficiency Solar Energy Wireless Sensor Node System

Sensor nodes in NNwC are divided into two types—sample sensor nodes and functional sensor nodes.

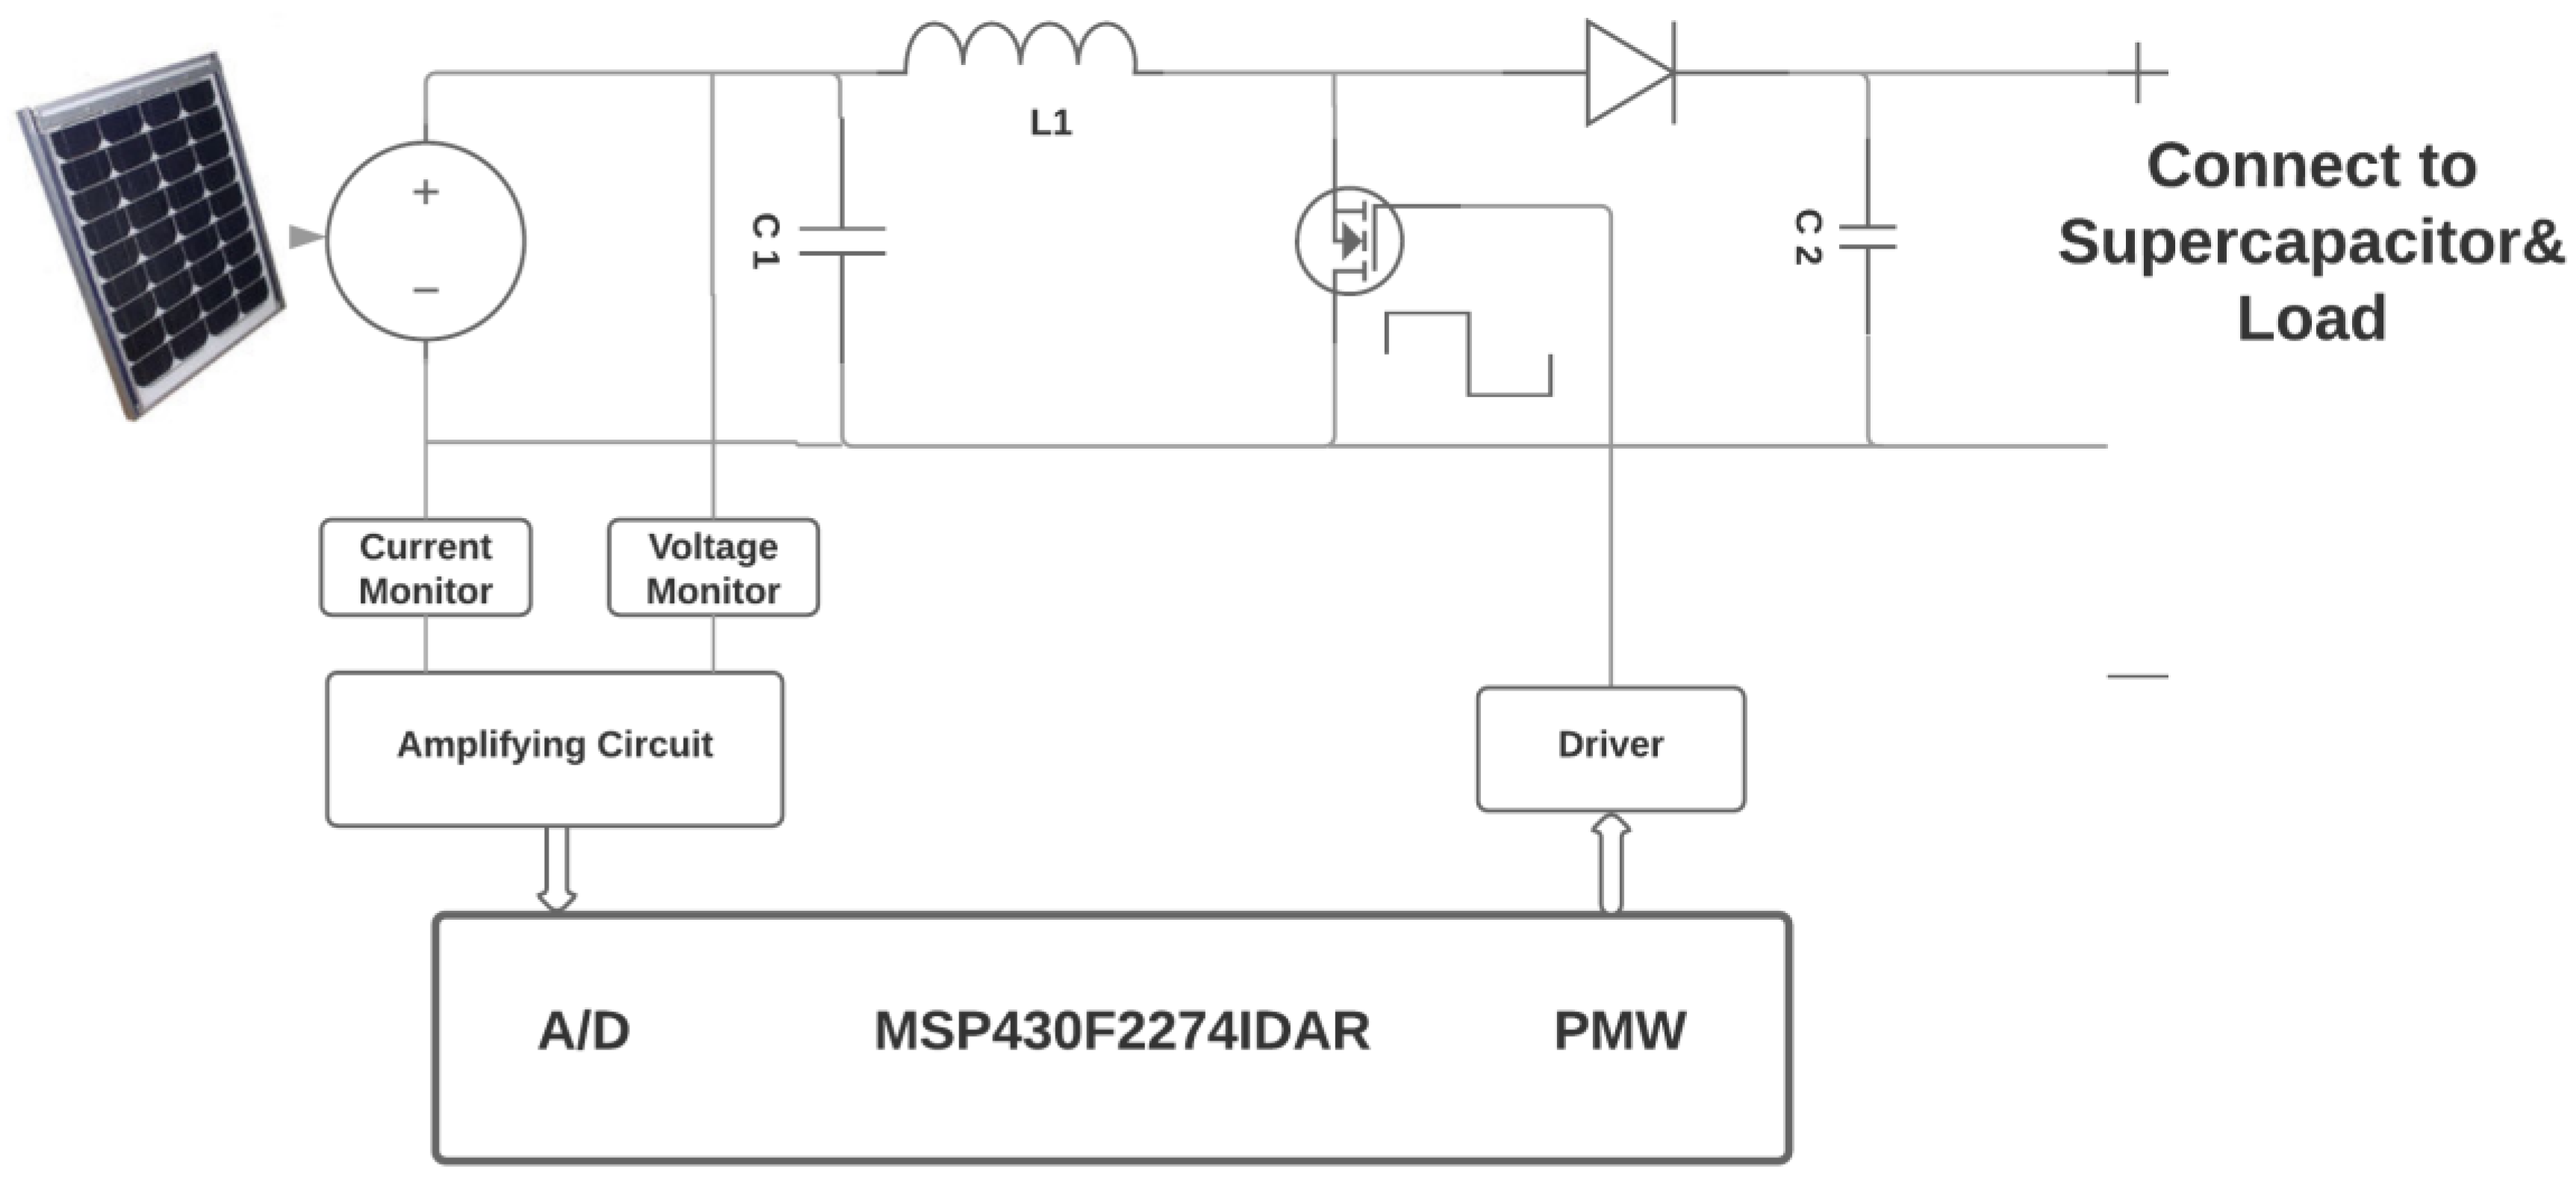
3.4.1. Sensor Node Harvester and MPPT Controller

Sample sensors (Figure 6) account for 2% of the total number of sensors. Each sample sensor node has two PV harvesters. One PV harvester with a current and a voltage monitor implements traditional MPPT technique-Incremental Conductance. Every time when it finishes MPPT by Incremental Conductance, then it sends T, L and VMPP result as a group of data to the cloud. The other PV harvesters of the sample sensor will load the parameters sent from the cloud as other functional sensors do.
Due to the benefits of the relatively low cost of functional sensors, functional sensor nodes (Figure 7) are more likely to account for the majority of all the sensor nodes (98%). They are not equipped with I or V monitor in their PV harvester. An MCU responsible for sending, receiving data and generating a PWM signal for its MPPT tracking. Functional sensor nodes collect all kinds of environmental data such as temperature, humidity, atmospheric pressure, sunlight level for specific application. Each functional sensor sends its real time data to Cloud Process Center and receive the its VMPP from Cloud. Then this voltage will be proportionally transformed into PWM value which controls the duty cycle of converter, finally approaches its MPP point without I/V monitors. Since the power consumption of functional sensors is much lower than sample sensors, smaller PV panels will fulfill the requirement of functional sensors.

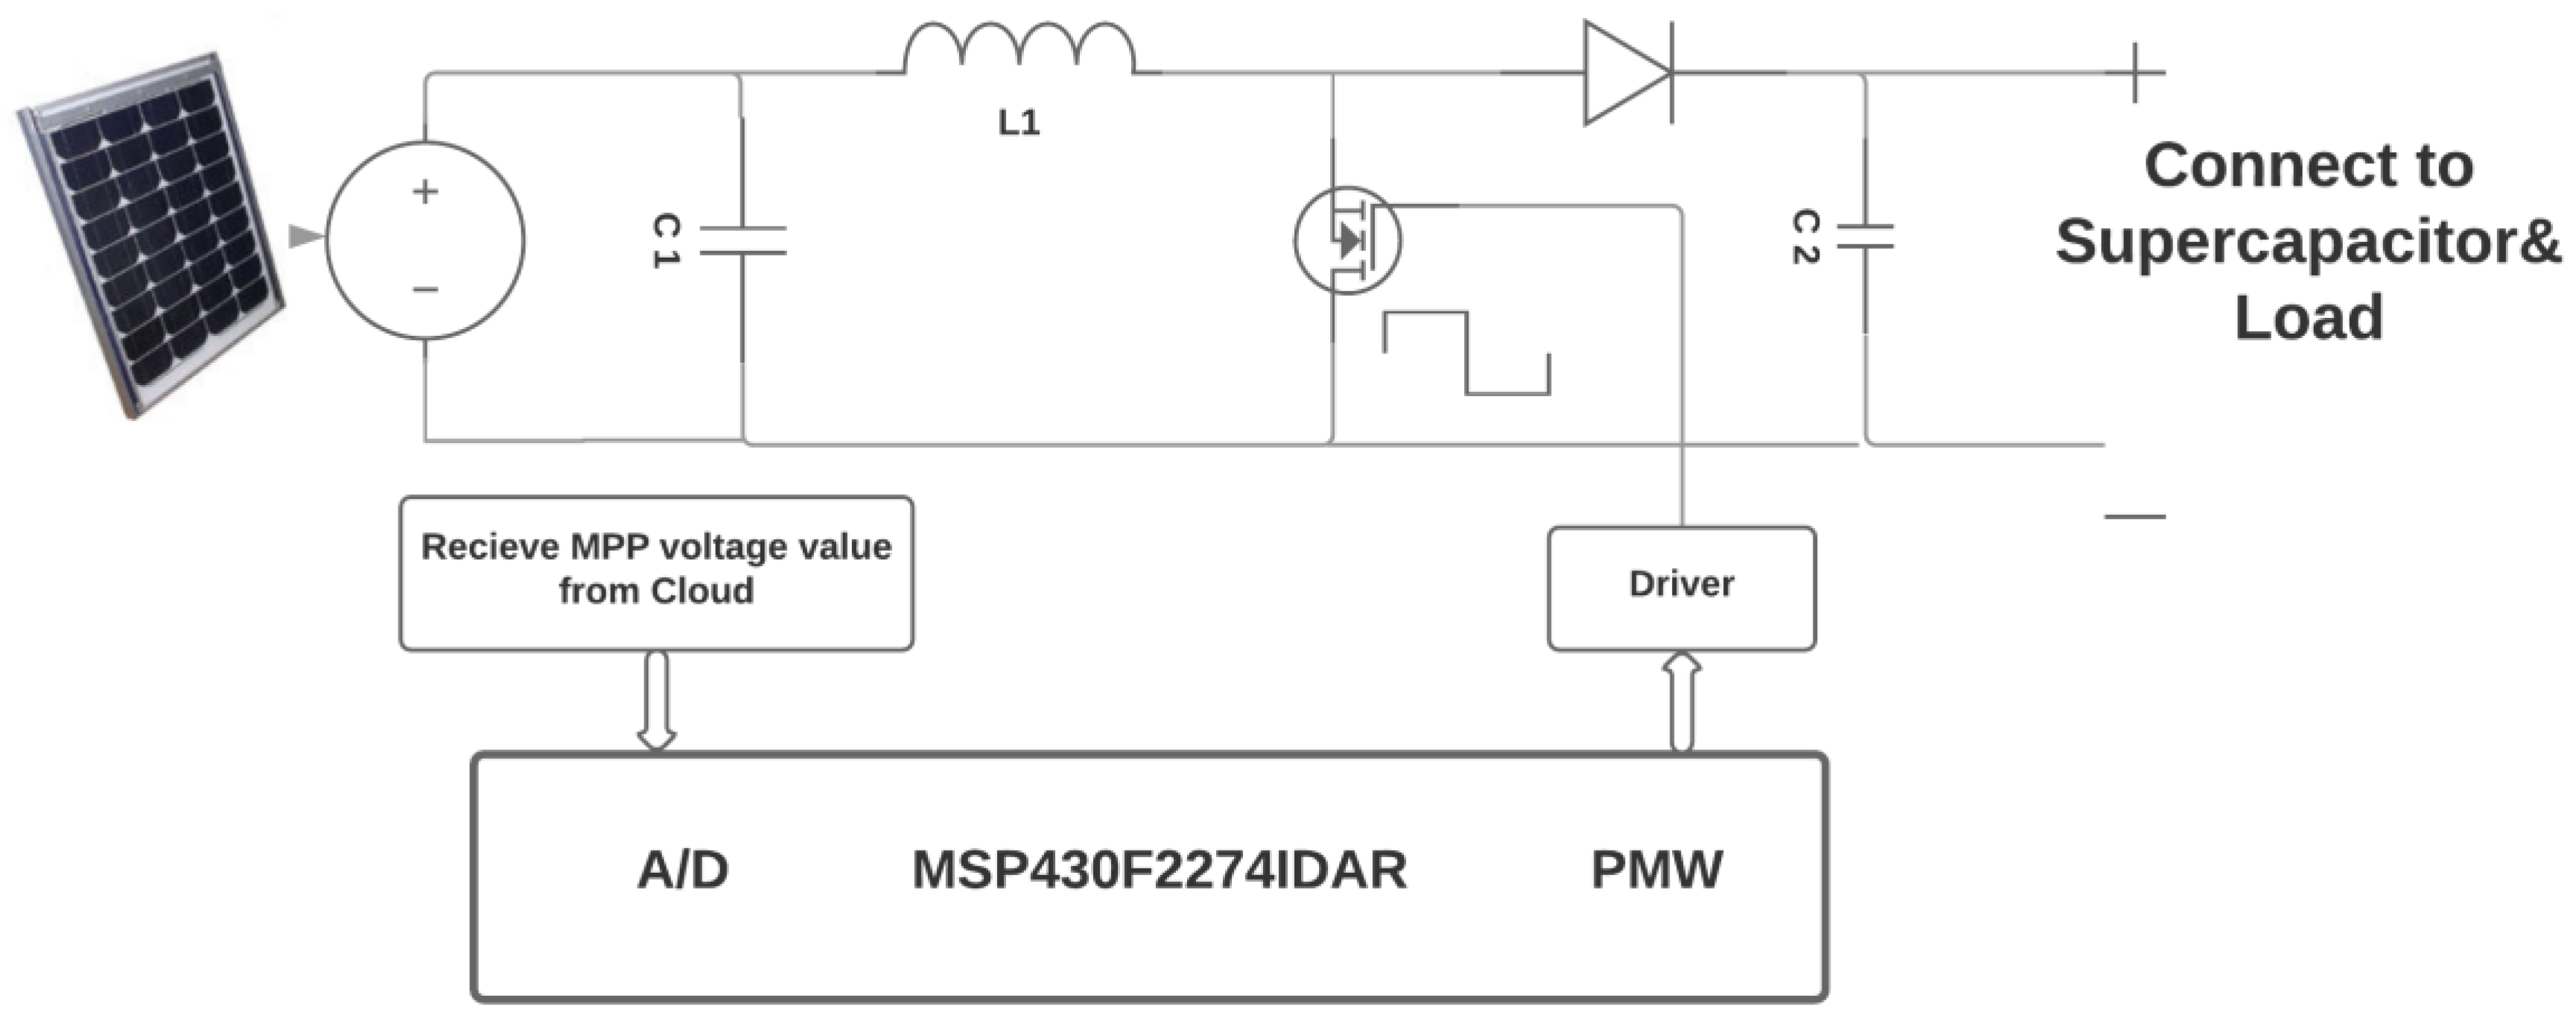
3.4.2. Cloud Process Center

Cloud Process Center receives data array including T, L, Vmpp and other valuable data sent from the sensor nodes, then uses neural network regression to train a 2-variable function, the T and L are independent variables (input layer), the Vmpp is the result (output layer).
Users can initialize the structure of the neural network, including the number of layers and the number of neural cells, learning rate. Cloud will train the data to find the most suitable Wij parameter. The structure can be adjusted and trained until a structure with satisfactory accuracy. The final structure will be used for all other PV harvesters to conduct MPPT. The ANN structure should also be updated every month to guarantee the ANN is conform to aging condition of PV panels.

3.5. Partial Shading Condition

Partial Shading Condition (PSC) of solar panels is caused by nonuniform sunlight distribution on a serial of solar cells. The shaded solar cells will consume the energy generated by unshaded solar cells and produce heat which will damage the solar panel which is called Hot Spot Heating effect. Hot Spot Heating effect can be greatly reduced by adding a shunt diode paralleled with solar panel output. However, adding a shunt diode will cause the multiple local maximum. In this low power consumption NNwC design, the area of solar panel is small, partial shading will not significant affect the MPPT performance. However, if high accuracy MPPT for each sensor node is required and PSC need to be considered, multiple local maximums problem should be solved by changing Incremental Conductance algorithm to Simulated Annealing algorithm. Simulated Annealing algorithm in sensor nodes can avoid that the MPPT be stuck into a local maximums cause by shunt diode. Below is a flowchart (Figure 8.) of a suggested Simulated Annealing algorithm for MPPT in NNwC.

4. Simulation and Estimation

The field experiment of thousands of sensor nodes in the NNwC system is unpractical at the design stage. Therefore, this section presents a simulation in the power consumption of the proposed system and compares it with that of the traditional wireless sensor node system. The simulation is conducted in two parts: (1) the power consumption simulation and (2) the ANN-based MPPT accuracy simulation in power generation.

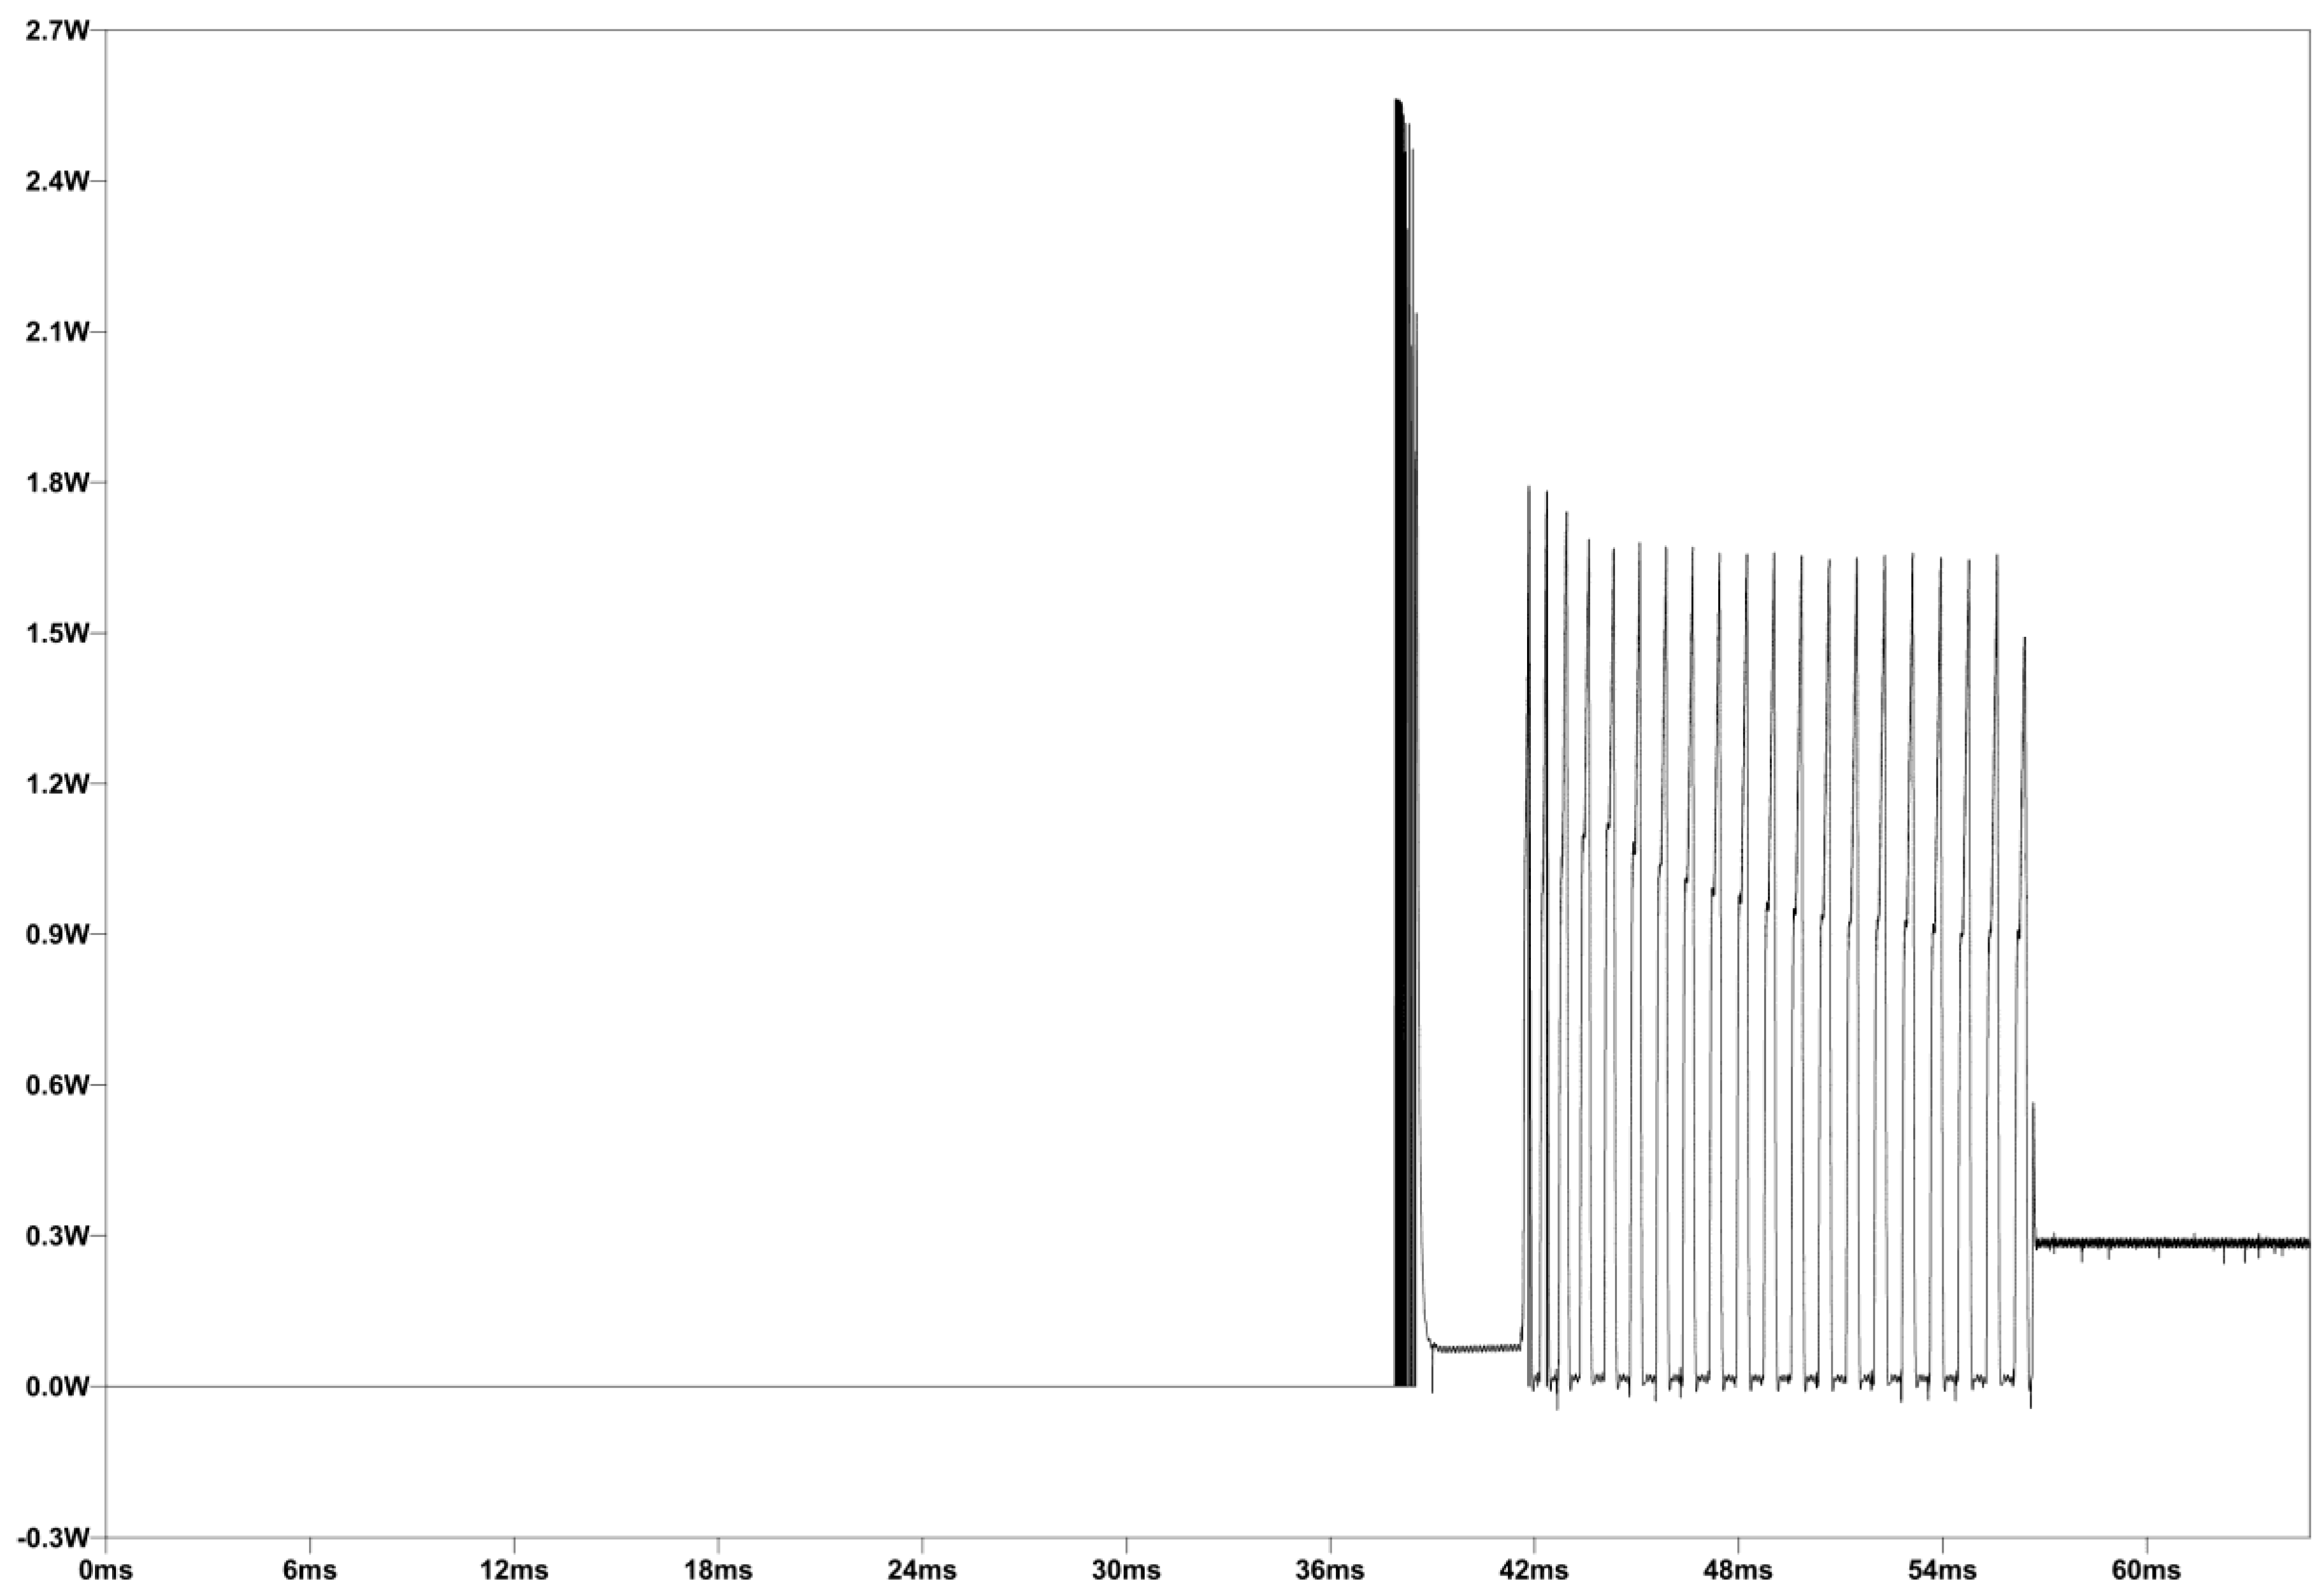
4.1. Power Consumption in Sensor Node

The circuit simulation discusses the operation power consumption for of one sample sensor node and one functional sensor node by LTSpice. Operation power consumption is the power consumption in internal circuit including regulator, monitors and loads. Figure 9 is a schematic for sample sensor node power consumption measuring. Since the internal power consumption has little change in different environment situations. A general PV supply situation which is closed to the general operation will be assumed in this simulation.
A DC to DC boost converter is constructed afterwards. The PWM signal generated by the MCU is sent to the gate pin of the MOSFET in the boost converter. The relationship between the duty cycle and the times of voltage expend is represented in Equation (4), where A is the times in voltage of the boost converter, D is the switching duty cycle of the MOSFET. A supercapacitor is connected after the boost converter. This supercapacitors in real design should be more than 3F. However, in order to simulate the steady-state power consumption fast in this circuit in SPICE, a C2 with only 2 mF will be set in this simulation. Then a voltage regulator is used to provide load with a constant voltage supply. L1 is the sensor node load, L3 is the MCU load. A current and a voltage monitor with peripheral circuits are considered in the simulation.
A = 1 1 D
Figure 10 is the simulation result of power consumption after supercapacitor for a sample sensor node. The power peak is caused by startup of the circuit. Since it is a very short period, we consider the steady-state power consumption is operation power consumption. The steady-state power consumption after 56 ms is 285.53 mW. Figure 11 is power consumption measuring circuit schematic of a functional sensor node. Compared with a sample sensor node, a functional sensor node cuts down the high power consuming I/V monitor components. Figure 12 is the simulation result of power consumption after supercapacitor for a functional sensor node: The steady-state power consumption after 0.5 s is 7.811 mW. From this simulation, the functional sensor node greatly reduces power consumption by more than 90%. Therefore, it is feasible to use a solar panel with no more than 100 mW output in all functional sensor nodes.

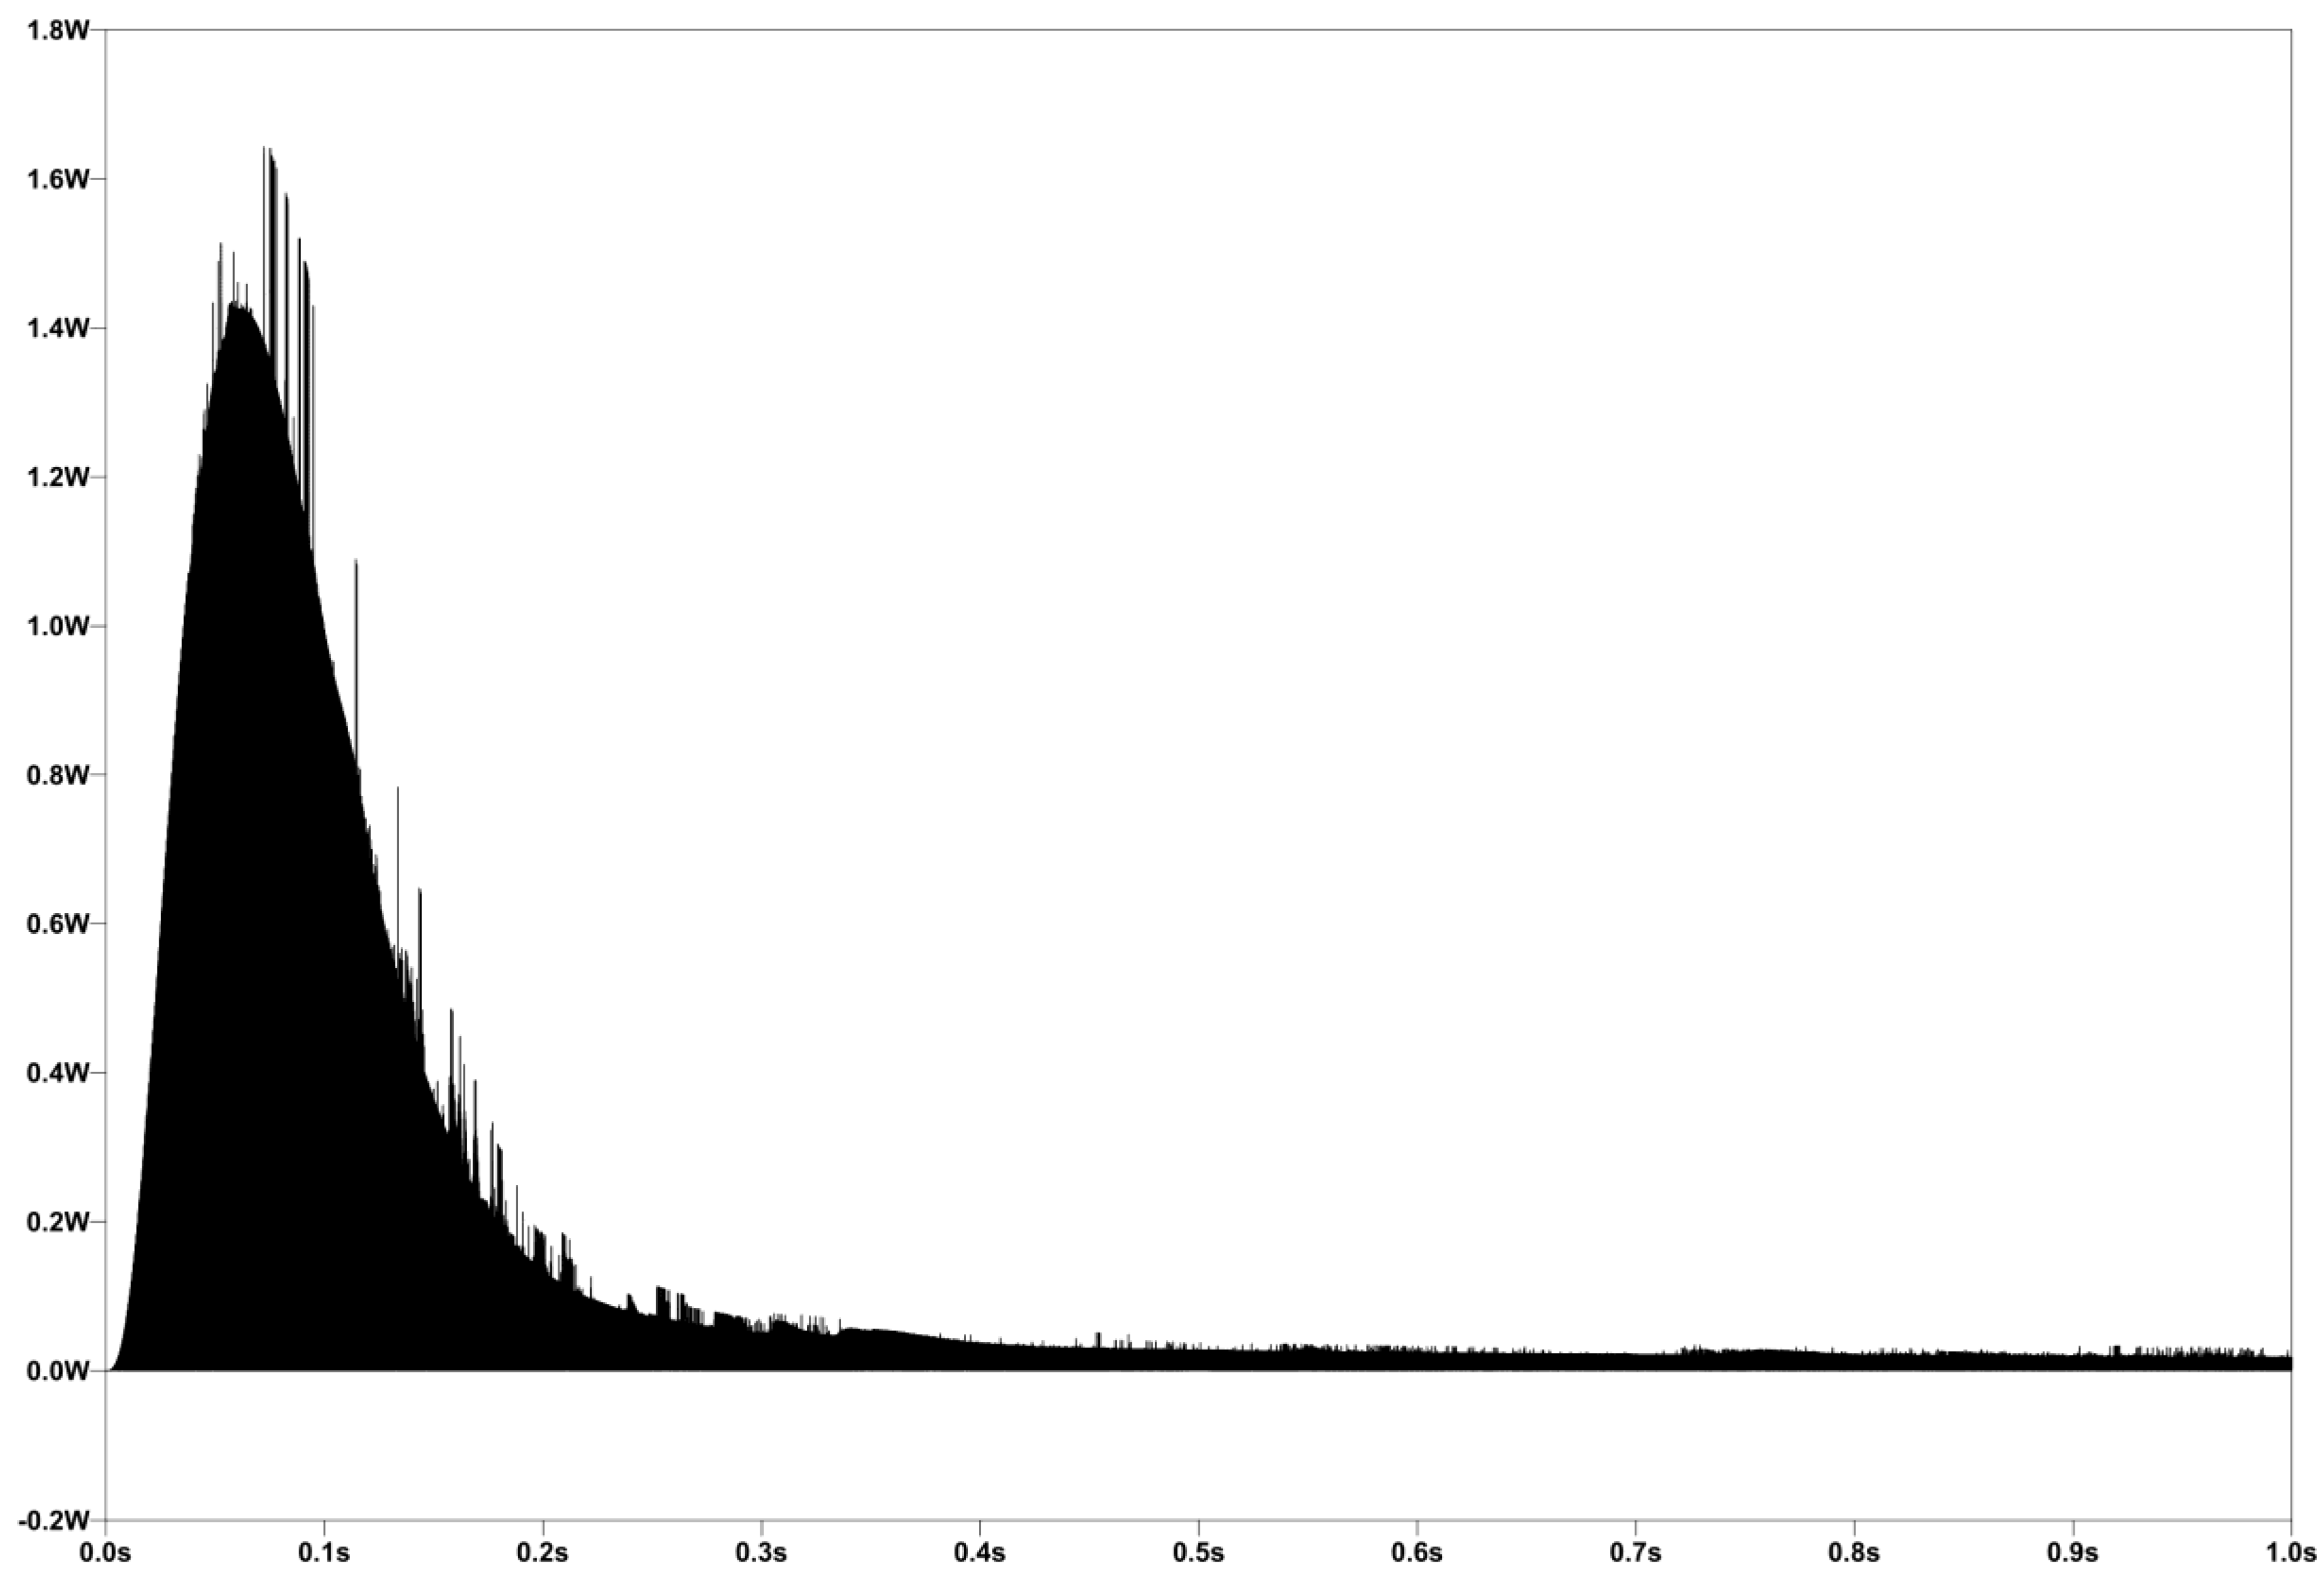
4.2. Power Generation in Sensor Node

This is an MPP simulation case to find out the predicted accuracy of Neural Network MPPT based on temperature (T) and light intensity (L), as well as the loss in power generation caused by error. Based on some researches in modeling and circuit simulation of PV arrays [47,48], some equations are used to find the relationship among T, L, and current. With T and L collected, the photocurrent generated is related by Equation (5): A simplified circuit is shown as Figure 13. And the current-voltage characteristic of a PV array can be described as Equation (6):
I Ph = L 1000 ( I sc + k i ( T T r ) )
I 0 = N p I ph N p I rs ( e q ( V + R s I 0 ) AkTN s 1 ) N p q ( V + R s I 0 ) N s R sh
Based on Equations (5) and (6), a Matlab program is employed to simulate the current-voltage curve and to find out the MPP value. The simulation conditions are listed as Table 3.
The current-voltage curves can be obtained by given different T and L combinations. For variables temperature (T) ranging from −20 °C to 50 °C, at an interval of 0.7 °C, and L ranging from 50 W/m2 to 1050 W/m2, at an interval of 1 W/m2, 105 ideal MPP values are calculated. These calculated data will be used utilized as real MPP and tagged data for ANN training. T and L are taken as input while the voltage at Vmpp and the maximum power (MP) are the result output.
These T, L and corresponding Vmpp values are taken as training data for the Neural Network. To better simulate the performance of cloud ANN regression, the machine learning process is conducted in the Microsoft Azure Machine Learning Studio. Azure is a cloud service provided by Microsoft and suitable for sensor nodes application, it is easy to deploy and compatible with other IoT application related with sensor nodes. The parameters used in Machine Learning Studio is shown in Table 4.
In MPPT loss evaluation, the difference of power in predicted Vmpp and simulated real Vmpp will be calculated. The average power loss for each environment condition in ANN MPPT prediction will further be transformed into percentage. After simulation, the loss percentage for each environment condition ranges from −0.31% to −0.02% and presents an average of −0.15%. Therefore, the power generation equivalent value in ANN MPPT is approximate 99.85% in NNwC.

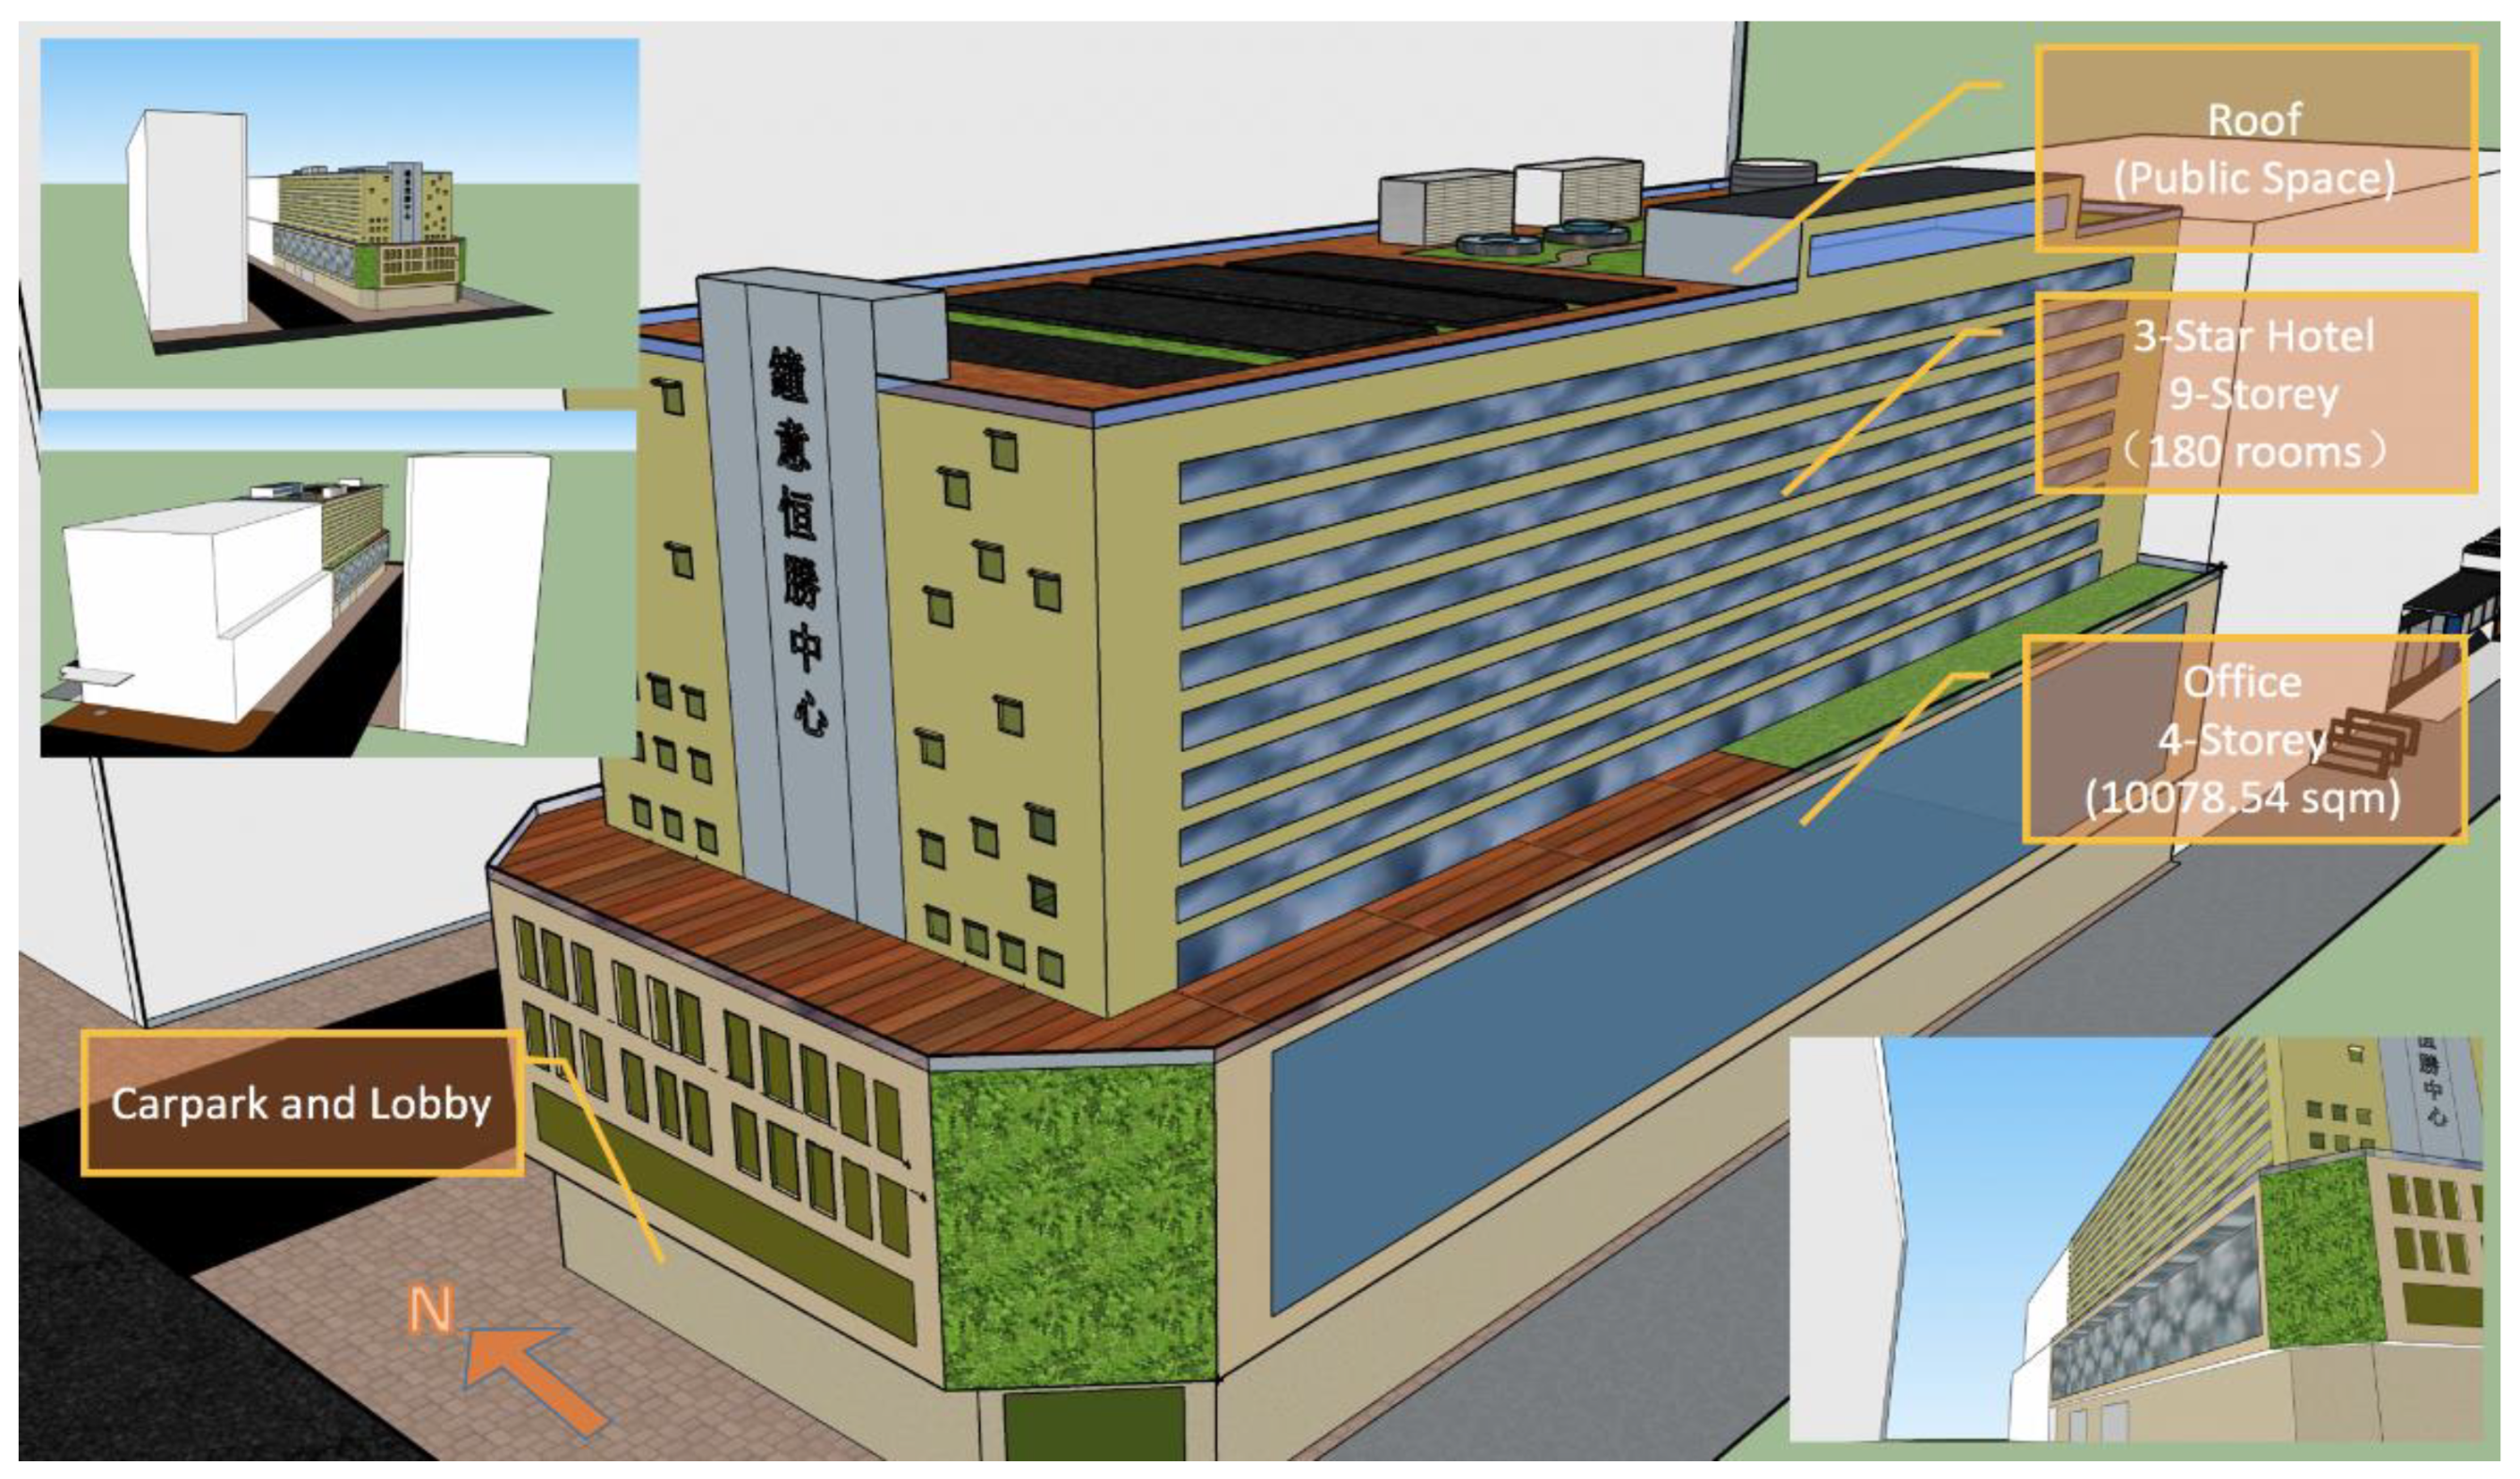
5. Feasibility Analysis

This study uses the operation data from a typical multi-functional building in Southern China containing two parts: a high-rise zone (a 9-story hotel) and a low-rise zone (a 4-story office and a single-storey multifunctional ground floor). An overview of the target building is shown in Figure 14. The high-rise zone includes 150 guest rooms and 15 en-suites (i.e., 180 rooms totally). The case combines the proposed system with a windows-shading system for a building passive energy saving system.
This section compares the capital expenditure (CAPEX), operating expenditure (OPEX) and present value of life cycle cost (LCC) of traditional grid power sensor node system (as Figure 15a), traditional wireless sensor node system (as Figure 15b) and the proposed system (as Figure 15c). The study then demonstrates the proposed system’s economic and environmental feasibility by analyzing its operation saving and payback period (PP) in building applications. The Equation (7) is employed, where we assume the interest rate is 1.75% p.a. based on market expectations in the short-term and the system’s lifespan is 10 years [49,50]. The assumption about the interest rate is derived from the one-year deposit rate provided by the largest commercial bank in mainland China (Industrial and Commercial Bank of China, ICBC) [51].
LCC = CAPEX + OPEX [ 1 ( 1 + i ) life   span i ]   Scrap   Value ( 1 + i ) life   span
The target building contains 180 rooms for the hotel and 10,078.54 m2 office. The traditional grid power design requires 308 WZP-PT100 temperature sensors and 308 TSL2561T photo-sensors for the case, whose unit cost are $1.46 and $2.92 respectively. Therefore, the initial cost of sensors in the traditional grid power node system is $1349.04. TI CC2500 wireless sensor nodes and LTC1877 voltage regulators are also equipped in each room with the unit price at $2.93 and $2.9 respectively. 308 MCUs cost $868.56. In addition, the initial cost of PCB and other electronic components is $985.6. The demand of wire in the high-rise zone and low-rise zones are 20,480 m and 43,440 m directly. The normal price of conducting wire is $0.29 per meter and therefore, the total price of the wire is $18,536.8. The CAPEX of the traditional grid power node system is $23,535.64. Considering the cost of a cloud platform is $302.22 and a 1% operation and maintenance (O&M) cost (i.e., $235.36), the annual OPEX of the system is $537.58. Considering an 8% scrap value, the LCC of the system is system is $26,845.28.
The traditional wireless power node system has a similar design with the traditional gird one: they share the same requirements in sensors, TI CC2500 wireless sensor nodes, LTC1877 voltage regulator, MCUs and JLC PCB. However, 308 EOGM-M5 gallium arsenide (GaAs) based solar panels cost $31,600.8 accounting for 86.71% of the total initial cost. The system also requires 616 5.5V supercapacitors whose unit price is $0.48. Wherefore, considering the annual rent of Ali cloud platform (i.e., $302.22) and the annual O&M cost (i.e., $364.46), the CAPEX of the traditional wireless power design is $36,445.64 and OPEX is $666.68 per year. Considering a 10% scrap value, the LCC of the traditional wireless system is $39,449.12.
The proposed system combines a sampling section and a functional section. 5% sensors (i.e., 30) are for sampling costing $65.7 and the others (i.e., 586) are functional sensors costing $1283.34. Similar with the traditional wireless system, the sampling part employs 15 TI CC250 wireless sensor nodes, MCUs, PCBs and supercapacitors. However, the part also adopts 15 EOGM-M1 miniature GaAs-based solar panels and 15 extra EOGM-M5 miniature GaAs-based solar panels. The initial cost of the sampling section is $2212.35. In addition to those basic electronic components, the functional section only requires 293 EOGM-M1 solar panels. Therefore, the initial cost of this section is $13,125.77. The CAPEX of the proposed system is $15,365.12 and the annual OPEX is $455.87. Considering a 10% scrap value, the LCC of the proposed system is $18,222.30. Compared with traditional systems (as Table 5—A & B), the proposed system (as Table 5—C) has a satisfactory performance in CAPEX, OPEX and LCC for building applications.
The target building has 40% windows (i.e., 494 m2) facing South, where the case combines the proposed system with a smart shading system. Traditional solar shadings can only save energy for the cooling system and even may have negative impacts on energy consumption for both lighting and heating systems [52,53,54], where the reason is the fixed shading facilities may reduce solar radiation for daylighting and heating [54]. Therefore, a smart shading system can help occupants to keep a balance between indoor illumination and temperature. The local monthly means of sunshine duration and daily solar radiation are presented in Table 4. The local average daily global solar radiation is 12.85 MJ/sqm, the annual bright sunshine duration is 1835.6 hours and the average available percentage is 42% during 1981 to 2010 [55]. The annual energy receiving from sunshine is 270,314 kWh and the annual saving of the proposed system is approximately 94,610.2 kWh, assuming the energy saving performance is 35%. Therefore, the annual saving of the proposed system is $44,331.6. Hondo (2005) noted that the lifecycle Greenhouse Gas(GHG) emission caused by a unit power generation is 26.9 gCO2/kWh in Japan [56] and this value may be slightly higher in China (i.e., 27.5 gCO2/kWh in est.). Considering above parameters, the payback period of the combined system is approximately 3.64 years and the total saving in the GHG emission is 12,192.015 kg CO2.
Although this study discusses the system’s comprehensive feasibility, there is still a lack of information for the actual performance and the lifespan of sensors remain to be demonstrated. Since there are only a few companies employ the proposed system in real cases, the reliability of the product requires further investigation. Without actual operational records, the manufacturer’s specification is less convincing. Especially, considering unpredictable factors, such as occupants’ behaviors, the application scenarios could be more complicated in real cases. For example, more than one local maximum point may occur in the PPV curve, where other algorithms considering more parameters, such as Annealing Algorithm, are required. In addition, to further measure the working performance of NNwC, the system may require a subsystem with more than 1000 sensor nodes. Further improvement, therefore, in algorithms and electronics components is necessary. Engineers can also combine the proposed system with Building Information Modelling (BIM) tools for a more systematic built environment design [57,58].
In addition to the immature technology, considerations should also be given to the operational strategy under dynamic application scenarios. In addition to the case of building applications, the system can also be used in forest fire prevention, industrial heating recycling and other scenarios with advanced materials or equipment. Those combinations should follow the economic principle. It is believed that a short payback period (i.e., within 3–5 years) seems to be a necessity for the adoption for building developers and other users [48]. In addition, supports from local governments are indispensable [59]. To satisfy the increasing energy demand and control environmental pollution, decision-makers have made a significant effort to boost sustainable power systems [60]. The governments can offer an additional incentive to decision-makers to adopt green technologies like the proposed systems by intensive or enforceable policies.

6. Conclusions

In considering the high energy cost and expense on traditional sense node system, this paper discusses a refinement sensor node system, wherein NNwC helps to orchestrate its function. This system can be described as a combination of sample and functional part. 2% of sense node in this system are used to perform in the traditional MPPT way, in order to collect the environment data, L and T. Here we propose that environment information including L and T suffice for the attainment of a MPPT regression model. In the cloud operation platform, these sample data are taken for training procedure. A 2-variable function, as the result of cloud algorithm, can be used to estimate the MPP voltage for the rest functional parts to get their maximum power. This idea shows a provable advantage that it requires fewer sample sensor nodes to collect data as L and T to guarantee the optimality of power consumption. The reduced size and cost of harvester based on our model enable more prevalent application of sensor node system compared with traditional grid power sensor node system. A SPICE simulation is conducted to explore the significant reduction of power consumption and the margin between the performance of our system and the ideal MPPT. Our experiments show that the cloud calculation can ensure an accuracy of 99.85% of the ideal MPP, with cutting down more than 90% power consumption.
Apart from the system design, this study also discusses the economic feasibility and environmental robustness of the proposed system in buildings with a case study. The proposed system showed a satisfactory economic performance: the CAPEX is $15,365.12 and the OPEX is $455.87. The life cycle cost of the system (i.e., $18,222.30) is also lower than that of two traditional systems (i.e., $26,845.28 and $39,449.12 respectively). Combining with a smart shadowing system, the payback of the integration system is approximately 3.6 years without any government subsidy. Also, this low-carbon integration technique can also reduce the equivalent emission of 12,192.02 kg CO2 over its 10-year lifespan. However, further study on the proposed system is also necessary to discuss more complex situations, and discussion with on-site testing data is also required before its commercialization. Besides, governments should encourage the heuristic application of green building techniques by this energy harvesting method. The study leaves incorporating the theoretical model into systematic attempts open for future works.

Author Contributions

Conceptualization, S.C. and H.H.; Methodology, Q.W. and S.C.; Simulation, H.H., Z.D. and H.G.; Original Draft Preparation, H.H. and H.G.; Writing-Review & Editing, Q.W. and Z.D.; Project Administration, S.C. and Q.W.

Funding

This research received no external funding.

Acknowledgments

The authors would like to also thank Ka Hong Loo (The Hong Kong Polytechnic University), Minghang Qu (University of Cambridge) and Qian Xu (National University of Singapore), who contributed to search and compilation of the existing publications or provided valuable suggestions.

Conflicts of Interest

The authors declare no conflict of interest.

References

  1. Pérez-Lombard, L.; Ortiz, J.; Pout, C. A review on buildings energy consumption information. Energy Build. 2008, 40, 394–398. [Google Scholar] [CrossRef]
  2. Paradiso, A.J.; Starner, T. Energy scavenging for mobile and wireless electronics. IEEE Pervasive Comput. 2005, 1, 18–27. [Google Scholar] [CrossRef]
  3. Kim, J.; Kim, J.; Kim, C. A regulated charge pump with a low-power integrated optimum power point tracking algorithm for indoor solar energy harvesting. IEEE Trans. Circuits Syst. II Express Briefs 2011, 58, 802–806. [Google Scholar] [CrossRef]
  4. Tan, Y.K.; Panda, S.K. Energy harvesting from hybrid indoor ambient light and thermal energy sources for enhanced performance of wireless sensor nodes. IEEE Trans. Ind. Electron. 2011, 58, 4424–4435. [Google Scholar] [CrossRef]
  5. Seyedmahmoudian, M.; Horan, B.; Soon, T.K.; Rahmani, R.; Oo, A.M.T.; Mekhilef, S.; Stojcevski, A. State of the art artificial intelligence-based MPPT techniques for mitigating partial shading effects on PV systems—A review. Renew. Sustain. Energy Rev. 2016, 64, 435–455. [Google Scholar] [CrossRef]
  6. Esram, T.; Chapman, P.L. Comparison of photovoltaic array maximum power point tracking techniques. IEEE Trans. Energy Convers. 2007, 22, 439–449. [Google Scholar] [CrossRef]
  7. Hussein, K.H.; Muta, I.; Hoshino, T.; Osakada, M. Maximum photovoltaic power tracking: An algorithm for rapidly changing atmospheric conditions. IEEE Proc. Gener. Transm. Distrib. 1995, 142, 59–64. [Google Scholar] [CrossRef]
  8. Sera, D.; Mathe, L.; Kerekes, T.; Spataru, S.V.; Teodorescu, R. On the perturb-and-observe and incremental conductance MPPT methods for PV systems. IEEE J. Photovolt. 2013, 3, 1070–1078. [Google Scholar] [CrossRef]
  9. Kuo, Y.-C.; Liang, T.-J.; Chen, J.-F. Novel maximum-power-point-tracking controller for photovoltaic energy conversion system. IEEE Trans. Ind. Electron. 2001, 48, 594–601. [Google Scholar]
  10. Wu, W.; Pongratananukul, N.; Qiu, W.; Rustom, K.; Kasparis, T.; Batarseh, I. DSP-based multiple peak power tracking for expandable power system. In Proceedings of the Applied Power Electronics Conference and Exposition, Miami Beach, FL, USA, 9–13 February 2003; Volume 1, pp. 525–530. [Google Scholar]
  11. Irisawa, K.; Saito, T.; Takano, I.; Sawada, Y. Maximum power point tracking control of photovoltaic generation system under non-uniform insolation by means of monitoring cells. In Proceedings of the Conference Record of the Twenty-Eighth IEEE Photovoltaic Specialists Conference, Anchorage, AK, USA, 15–22 September 2000; pp. 1707–1710. [Google Scholar]
  12. Abdelsalam, A.K.; Massoud, A.M.; Ahmed, S.; Enjeti, P.N. High-performance adaptive perturb and observe MPPT technique for photovoltaic-based microgrids. IEEE Trans. Power Electron. 2011, 26, 1010–1021. [Google Scholar] [CrossRef]
  13. Nedumgatt, J.; Jayakrishnan, K.B.; Umashankar, S.; Vijayakumar, D.; Kothari, D.P. Perturb and observe MPPT algorithm for solar PV systems-modeling and simulation. In Proceedings of the India Conference (INDICON), Hyderabad, India, 16–18 December 2011. [Google Scholar]
  14. Elgendy, M.A.; Zahawi, B.; Atkinson, D.J. Assessment of perturb and observe MPPT algorithm implementation techniques for PV pumping applications. IEEE Trans. Sustain. Energy 2012, 3, 21–33. [Google Scholar] [CrossRef]
  15. Wasynczuk, O. Dynamic behavior of a class of photovoltaic power systems. IEEE Trans. Power App. Syst. 1983, 102, 3031–3037. [Google Scholar] [CrossRef]
  16. Salas, V.; Olías, E.; Barrado, A.; Lázaro, A. Review of the maximum power point tracking algorithms for stand-alone photovoltaic systems. Sol. Energy Mater. Sol. Cells 2006, 90, 1555–1578. [Google Scholar] [CrossRef]
  17. Femia, N.; Granozio, D.; Petrone, G.; Spagnuolo, G.; Vitelli, M. Predictive & Adaptive MPPT Perturb and Observe Method. IEEE Trans. Aerosp. Electron. Syst. 2007, 43, 934–950. [Google Scholar]
  18. Al-Amoudi, A.; Zhang, L. Optimal control of a grid-connected PV system for maximum power point tracking and unity power factor. In Proceedings of the Seventh International Conference on Power Electronics and Variable Speed Drives, London, UK, 21–23 September 1998; pp. 80–85. [Google Scholar]
  19. Xiao, W.; Dunford, W.G. A modified adaptive hill climbing MPPT method for photovoltaic power systems. In Proceedings of the 2004 IEEE 35th Annual Power Electronics Specialists Conference, Aachen, Germany, 20–25 June 2004; Volume 3, pp. 1957–1963. [Google Scholar]
  20. Femia, N.; Petrone, G.; Spagnuolo, G.; Vitelli, M. Optimization of perturb and observe maximum power point tracking method. IEEE Trans. Power Electron. 2005, 20, 963–973. [Google Scholar] [CrossRef] [Green Version]
  21. D’Souza, N.S.; Lopes, L.A.; Liu, X. An intelligent maximum power point tracker using peak current control. In Proceedings of the 2005 IEEE 36th Power Electronics Specialists Conference, Recife, Brazil, 16 June 2005; p. 172. [Google Scholar]
  22. Wolfs, P.J.; Tang, L. A single cell maximum power point tracking converter without a current sensor for high performance vehicle solar arrays. In Proceedings of the 2005 IEEE 36th Power Electronics Specialists Conference, Recife, Brazil, 16 June 2005; pp. 165–171. [Google Scholar]
  23. Veerachary, M.; Senjyu, T.; Uezato, K. Maximum power point tracking control of IDB converter supplied PV system. IEEE Proc. Electr. Power Appl. 2001, 148, 494–502. [Google Scholar] [CrossRef]
  24. Kasa, N.; Iida, T.; Chen, L. Flyback inverter controlled by sensorless current MPPT for photovoltaic power system. IEEE Trans. Ind. Electron. 2005, 52, 1145–1152. [Google Scholar] [CrossRef]
  25. Won, C.-Y.; Kim, D.; Kim, S.; Kim, W.; Kim, H. A new maximum power point tracker of photovoltaic arrays using fuzzy controller. In Proceedings of the 1994 Power Electronics Specialist Conference, Taipei, Taiwan, 20–25 June 1994; Volume 1, pp. 396–403. [Google Scholar]
  26. Simoes, M.G.; Franceschetti, N.N.; Friedhofer, M. A fuzzy logic based photovoltaic peak power tracking control. In Proceedings of the IEEE International Symposium on Industrial Electronics, Pretoria, South Africa, 7–10 July 1998; Volume 1, pp. 300–305. [Google Scholar]
  27. Hilloowala, R.M.; Sharaf, A.M. A rule-based fuzzy logic controller for a PWM inverter in photo-voltaic energy conversion scheme. In Proceedings of the Conference Record of the 1992 IEEE Industry Applications Society Annual Meeting, Houston, TX, USA, 4–9 October 1992; pp. 762–769. [Google Scholar] [Green Version]
  28. Mahmoud, A.M.A.; Mashaly, H.M.; Kandil, S.A.; El Khashab, H.; Nashed, M.N.F. Fuzzy logic implementation for photovoltaic maximum power tracking. In Proceedings of the 9th IEEE International Workshop on Robot and Human Interactive Communication, Osaka, Japan, 27–29 September 2000; pp. 155–160. [Google Scholar]
  29. Patcharaprakiti, N.; Premrudeepreechacharn, S.; Sriuthaisiriwong, Y. Maximum power point tracking using adaptive fuzzy logic control for grid-connected photovoltaic system. Renew. Energy 2005, 30, 1771–1788. [Google Scholar] [CrossRef]
  30. Veerachary, M.; Senjyu, T.; Uezato, K. Neural-network-based maximum-power-point tracking of coupled-inductor interleaved-boost-converter-supplied PV system using fuzzy controller. IEEE Trans. Ind. Electron. 2003, 50, 749–758. [Google Scholar] [CrossRef]
  31. Hussein, A.; Hirasawa, K.; Hu, J.; Murata, J. The dynamic performance of photovoltaic supplied dc motor fed from DC-DC converter and controlled by neural networks. In Proceedings of the 2002 International Joint Conference on Neural Networks, Honolulu, HI, USA, 12–17 May 2002; Volume 1, pp. 607–612. [Google Scholar]
  32. Sun, X.; Wu, W.; Li, X.; Zhao, Q. A research on photovoltaic energy controlling system with maximum power point tracking. In Proceedings of the Power Conversion Conference, Osaka, Japan, 2–5 April 2002; Volume 2, pp. 822–826. [Google Scholar]
  33. Lin, W.M.; Hong, C.M.; Chen, C.H. Neural-network-based MPPT control of a stand-alone hybrid power generation system. IEEE Trans. Power Electron. 2011, 26, 3571–3581. [Google Scholar] [CrossRef]
  34. Elobaid, L.M.; Abdelsalam, A.K.; Zakzouk, E.E. Artificial neural network-based photovoltaic maximum power point tracking techniques: A survey. IET Renew. Power Gener. 2015, 9, 1043–1063. [Google Scholar] [CrossRef]
  35. Specht, D.F. A general regression neural network. IEEE Trans. Neural Netw. 1991, 2, 568–576. [Google Scholar] [CrossRef] [PubMed]
  36. Hiyama, T.; Kouzuma, S.; Imakubo, T. Identification of optimal operating point of PV modules using neural network for real time maximum power tracking control. IEEE Trans. Energy Convers. 1995, 10, 360–367. [Google Scholar] [CrossRef]
  37. Kannan, N.; Vakeesan, D. Solar energy for future world—A review. Renew. Sustain. Energy Rev. 2016, 62, 1092–1105. [Google Scholar] [CrossRef]
  38. Lin, K.; Yu, J.; Hsu, J.; Zahedi, S.; Lee, D.; Friedman, J.; Kansal, A.; Raghunathan, V.; Srivastava, M. Heliomote: Enabling long-lived sensor networks through solar energy harvesting. In Proceedings of the 3rd International Conference on Embedded Networked Sensor Systems, San Diego, CA, USA, 2–4 November 2005; p. 309. [Google Scholar]
  39. Brunelli, D.; Benini, L.; Moser, C.; Thiele, L. An efficient solar energy harvester for wireless sensor nodes. In Proceedings of the 2008 Design, Automation and Test in Europe, Munich, Germany, 10–14 March 2008; pp. 104–109. [Google Scholar]
  40. Hande, A.; Polk, T.; Walker, W.; Bhatia, D. Indoor solar energy harvesting for sensor network router nodes. Microprocess. Microsyst. 2007, 31, 420–432. [Google Scholar] [CrossRef] [Green Version]
  41. Bourgoine, N. Harvest energy from a single photovoltaic cell. J. Analog Innov. 2011, 21, 1–6. [Google Scholar]
  42. Ciulla, G.; Brano, V.L.; di Dio, V.; Cipriani, G. A comparison of different one-diode models for the representation of I–V characteristic of a PV cell. Renew. Sustain. Energy Rev. 2014, 32, 684–696. [Google Scholar] [CrossRef]
  43. Celani, J. Solar battery charger maintains high efficiency in low light. LT J. Analog. Innov. 2013, 10, 24–27. [Google Scholar]
  44. Badescu, V. Simple optimization procedure for silicon-based solar cell interconnection in a series—Parallel PV module. Energy Convers. Manag. 2006, 47, 1146–1158. [Google Scholar] [CrossRef]
  45. Mathews, I.; King, P.J.; Stafford, F.; Frizzell, R. Performance of III–V solar cells as indoor light energy harvesters. IEEE J. Photovolt. 2016, 6, 230–235. [Google Scholar] [CrossRef]
  46. Whitaker, C.M.; Townsend, T.U.; Wenger, H.J.; Iliceto, A.; Chimento, G.; Paletta, F. Effects of irradiance and other factors on PV temperature coefficients. In Proceedings of the The Conference Record of the Twenty-Second IEEE Photovoltaic Specialists Conference, Las Vegas, NV, USA, 7–11 October 1991; pp. 608–613. [Google Scholar]
  47. Villalva, M.G.; Gazoli, J.R.; Filho, E.R. Comprehensive approach to modeling and simulation of photovoltaic arrays. IEEE Trans. Power Electron. 2009, 24, 1198–1208. [Google Scholar] [CrossRef]
  48. Villalva, M.G.; Gazoli, J.R.; Filho, E.R. Modeling and circuit-based simulation of photovoltaic arrays. In Proceedings of the Power Electronics Conference, Bonito-Mato Grosso do Sul, Brazil, 27 September–1 October 2009; pp. 1244–1254. [Google Scholar]
  49. Wang, Q.; Wei, H.; Xu, Q. A Solid Oxide Fuel Cell (SOFC)-Based Biogas-from-Waste Generation System for Residential Buildings in China: A Feasibility Study. Sustainability 2018, 10, 2395. [Google Scholar] [CrossRef]
  50. Chen, J.M.P.; Ni, M. Economic analysis of a solid oxide fuel cell cogeneration/trigeneration system for hotels in Hong Kong. Energy Build. 2014, 75, 160–169. [Google Scholar] [CrossRef] [Green Version]
  51. Industrial and Commercial Bank of China Limited. RMB Deposit Interest Rate Table. Available online: http://www.icbc.com.cn/ICBC/EN/FinancialInformation/RMBDepositLoanRate/RMBDepositRate/ (accessed on 13 November 2018).
  52. Freewan, A.A.Y. Impact of external shading devices on thermal and daylighting performance of offices in hot climate regions. Sol. Energy 2014, 102, 14–30. [Google Scholar] [CrossRef]
  53. Al-Tamimi, N.A.; Fadzil, S.F.S. The potential of shading devices for temperature reduction in high-rise residential buildings in the tropics. Procedia Eng. 2011, 21, 273–282. [Google Scholar] [CrossRef]
  54. Franzetti, C.; Fraisse, G.; Achard, G. Influence of the coupling between daylight and artificial lighting on thermal loads in office buildings. Energy Build. 2004, 36, 117–126. [Google Scholar] [CrossRef]
  55. Hong Kong Observatory. Solar Energy Resources in Hong Kong from a Climatological Point of View. Available online: https://www.hko.gov.hk/education/article_e.htm?title=ele_00443 (accessed on 13 November 2018).
  56. Hondo, H. Life cycle GHG emission analysis of power generation systems: Japanese case. Energy 2005, 30, 2042–2056. [Google Scholar] [CrossRef]
  57. Lu, Y.; Wu, Z.; Chang, R.; Li, Y. Building Information Modeling (BIM) for green buildings: A critical review and future directions. Autom. Constr. 2017, 83, 134–148. [Google Scholar] [CrossRef]
  58. Chi, H.-L.; Wang, X.; Jiao, Y. BIM-Enabled Structural Design: Impacts and Future Developments in Structural Modelling, Analysis and Optimisation Processes. Arch. Comput. Methods Eng. 2014, 22, 135–151. [Google Scholar] [CrossRef]
  59. Xu, Z.; Li, M.; Lim, J.; Weng, Y.; Tay, Y.; Pham, H.; Pham, Q.-C. Large-scale 3D printing by a team of mobile robots. Autom. Constr. 2018, 95, 98–106. [Google Scholar]
  60. Zhao, Z.Y.; Chang, R.D. How to implement a wind power project in China?—Management procedure and model study. Renew. Energy 2013, 50, 950–958. [Google Scholar] [CrossRef]
Figure 1. Artificial Neural Networks (ANN) system diagram.
Energies 12 00101 g001
Figure 2. Simple photovoltaic cell model
Energies 12 00101 g002
Figure 3. Measured power output as a function of PV harvester temperature under 500-lx illumination.
Energies 12 00101 g003
Figure 4. Power output as a function of light harvester temperature under 500-lx illumination.
Energies 12 00101 g004
Figure 5. Block diagram of Neural Network MPPT with cloud method (NNwC).
Energies 12 00101 g005
Figure 6. Sample sensor node block diagram.
Energies 12 00101 g006
Figure 7. Functional sensor node block diagram.
Energies 12 00101 g007
Figure 8. Simulated annealing algorithm flowchart.
Energies 12 00101 g008
Figure 9. Power consumption measuring circuit schematic of a sample sensor node.
Energies 12 00101 g009
Figure 10. Simulation result of power consumption after supercapacitor in a sample sensor node.
Energies 12 00101 g010
Figure 11. Power consumption measuring circuit schematic of a sample sensor node.
Energies 12 00101 g011
Figure 12. Simulation result of power consumption after supercapacitor in a functional sensor node.
Energies 12 00101 g012
Figure 13. Simplified PV cell circuit model.
Energies 12 00101 g013
Figure 14. An overview of the target building.
Energies 12 00101 g014
Figure 15. (a) Traditional grid power sensor node system; (b) Traditional wireless sensor node system; (c) The proposed NNwC system.
Energies 12 00101 g015aEnergies 12 00101 g015b
Table 1. Different maximum power point tracking (MPPT) algorithms comparison.
MPPT TechniquePV Array DependentTRUE MPPTAnalog or DigitalPeriodic TuningConvergence SpeedImplementation ComplexitySensed Parameters
Hill-climbing/P&ONoYesBothNoVariesLowVoltage, Current
IncCondNoYesDigitalNoVariesMediumVoltage, Current
Fractional VocYesNoBothYesMediumLowVoltage
Fractional IscYesNoBothYesMediumMediumCurrent
Fuzzy Logic ControlYesYesDigitalYesFastHighVaries
Neural NetworkYesYesDigitalYesFastHighVaries
RCCNoYesAnalogNoFastLowVoltage, Current
Current SweepYesYesDigitalYesSlowHighVoltage, Current
DC Link Capacitor Droop ControlNoNoBothNoMediumLowVoltage
Load I or V MaximizationNoNoAnalogNoFastLowVoltage, Current
dP/dV or Feedback ControlNoYesDigitalNoFastMediumVoltage, Current
Array ReconfigurationYesNoDigitalYesSlowHighVoltage, Current
Linear Current ControlYesNoDigitalYesFastMediumIrradiance
State-based MPPTYesYesBothYesFastHighVoltage, Current
OCC MPPTYesNoBothYesFastMediumCurrent
BFVYesNoBothYesN/ALowNone
LRCMYesNoDigitalNoN/AHighVoltage, Current
Slide ControlNoYesDigitalNoFastMediumVoltage, Current
Table 2. Perturb and Observe (P&O) algorithm.
Direction of PerturbingPower ChangeDirection for Next Perturbing
PositivePositivePositive
PositiveNegativeNegative
NegativePositiveNegative
NegativeNegativePositive
Table 3. PV characteristic simulation conditions.
ParameterValueExplanation
Isc7.84 (A)Short-circuit current of the PV module (A)
Voc15 (V)Open-circuit voltage of the PV module (V)
Ns30 (Unit)Number of cells connected in series in the PV module
Kv−0.361 (%/C)Temperature coefficient of voltage
Ki0.102 (%/C)Temperature coefficient of current
A0.981Diode ideality constant
Rs0.393 (Ohm)Series resistors
Rsh313.4 (Ohm)Shunt resistors
Np1 (Unit)Number of parallel connections of cells in the PV module
Table 4. ANN training parameters in machine learning studio.
ParametersOption
Create Trainer ModeSingle Parameter
Hidden Layer SpecificationFully-Connected Case
Number of Hidden Nodes100
Learning Rate0.005
Number of Learning Iterations1000
The Initial Learning Weights Diameter0.1
The Momentum0
The Type of NormalizerMin-Max Normalizer
Training Samples:Testing Samples7:3
Table 5. The economic performance of the three systems.
ElementABC (The Proposed System)
Life Span (years)101010
CAPEX$23,535.64$36,445.64$15,365.12
OPEX (annual)$537.58$666.68$455.87
Scrap Value$1883 (8%)$3645 (10%)$1537 (10%)
LCC$26,845.28$39,449.12$18,222.30

