Article

Nonlinear Temperature-Dependent State Model of Cylindrical LiFePO4 Battery for Open-Circuit Voltage, Terminal Voltage and State-of-Charge Estimation with Extended Kalman Filter

1
Faculty of Science, Agriculture and Engineering, Newcastle University Singapore, Singapore 599493, Singapore
2
School of Engineering, Temasek Polytechnic, Singapore 529757, Singapore
3
School of Automotive Engineering, Chongqing University, Chongqing 400044, China
*
Author to whom correspondence should be addressed.
Energies 2018, 11(9), 2467; https://doi.org/10.3390/en11092467
Submission received: 27 August 2018 / Revised: 13 September 2018 / Accepted: 15 September 2018 / Published: 17 September 2018
(This article belongs to the Special Issue 10 Years Energies - Horizon 2028)

Abstract

:
Ambient temperature affects the performance of a battery power system and its accuracy in state-of-charge (SOC) estimation for electric vehicles and smart grid systems. This paper proposes a battery model that considered ambient temperature, cell temperature, hysteresis voltage and thermal aging on capacity due to multiple charging and discharging. The SOC is then estimated using an extended Kalman filter. Several forms of validation were tested on an actual cell battery under specific ambient temperatures to verify the battery cell model, terminal voltage and SOC estimation performance. The SOC estimation results show an improvement in root-mean-squared error as compared to Extended Kalman Filter (EKF) without considering the temperature dependency. The proposed battery temperature-dependent model gave a smaller root-mean square error in SOC and terminal voltage at 5 °C, 15 °C and 45 °C.

1. Introduction

Lithium iron phosphate (LiFePO4) batteries have become popular for renewable energy storage devices, electric vehicles [1,2,3] and smart grids [4,5,6]. However, the batteries are quite vulnerable to temperature variation and unforeseen operating conditions such as being overly charged or discharged, which affects its performance and reduces its lifespan in an electric vehicle. There have been many efforts in recent years to enhance the accuracy of the SOC estimation in a battery management system (BMS) [7]. A detailed literature review can be found in the following references [8,9,10,11]. The common Coulomb counting or Ampere-hour method [12] uses the current reading of the battery over the operating period to calculate SOC values.
Hence, an accurate and precise physical modeling on electrochemical batteries for SOC estimation [13] is needed. The electrochemical model [14] is one of the first such models using the Lithium-ion, electrolyte-phase concentration and reaction current density in partial differential equations (PDEs). The electrochemical model can provide accurate estimations of the cell behavior over a range of operating conditions at the expense of high computational complexity due to PDEs that are unsuitable for online application. To circumvent the problem, different model reduction techniques were applied. The most common reduced-order model can be achieved by neglecting the electrolyte-phase potential and assuming a constant electrolyte-phase concentration [15]. Such assumptions are allowed for low charging rates. Hence, the use of model [16] that preserves some of the physical insights to estimate the SOC at higher discharge rates. A similar model can be seen in Reference [17] for higher charge and discharge rates. The reduced electrochemical model of composite electrode Lithium-ion battery [18] was used for dual-nonlinear observers that could estimate five different cells’ SOC over time. An alternative approach, such as the equivalent circuit model (ECM) that models the internal battery characteristics using resistors and capacitors are commonly applied for SOC estimation due to their low complexity and simplicity. Some of the early works on SOC estimation include an adaptive filter such as an extended Kalman filter [19] on a 1-RC Lithium-ion battery cell. Although the aging effect was included with ±5% of the values estimated by Ah counting, this publication did not consider the ambient temperature as varying model parameter for estimation. Extension to 2-RC Lithium-ion battery cell via EKF [20] was studied. But the results did not consider the influence of ambient temperature, and the aging [19] in the SOC estimation.
As the ambient temperature affects the SOC estimation, the 1D (one-dimensional) electrochemical with the thermal model was used to understand the heat distribution of surface and internal temperature on a pouch-type lithium-ion battery cell [21] using thermodynamics and kinetics. The effects on the SOC estimation was not discussed. In addition, the ECM was used to simulate the electrochemical, thermal model [22] at an optimal cycling period. The results help to identify the battery cell parameters. However, the influence of ambient temperature and its impact on SOC estimation were not studied. As a result, a fully coupled electro-thermal model [23] with a fast charging strategy was modeled as a linear-time-varying model predictive control problem, while the unmeasurable battery internal states such as the SOC and core temperature were estimated via a nonlinear observer. But the works were surrounded on control to balance the time and core temperature increase instead of SOC identification.
More works were then performed to validate the lithium-ion battery at a different temperature such as 25 °C [24] and a low temperature of −10 °C [25] via a pseudo-two dimensional electrochemical thermal model [26]. Although the paper [27] shows that the macroscopic models are strongly controlled by the battery operating temperature conditions, the works were mainly on the proposed model that could affect the battery operating or internal temperature. The results of pulse-relaxation discharge in the electrochemical thermal model [28] describe the dynamic change of Lithium-ion concentration distribution in phases that were useful for analyzing the polarization of the battery. Another pseudo-two dimensional electrochemical thermal model [29] showing the battery pack application was then developed for the electric vehicle battery pack and thermal management system to maintain the temperature uniformity and decrease the maximum temperature of the cells. The SOC was not undertaken to further examine the impact of SOC estimation. In addition, other than modeling and analyzing the relationship between the temperature (−20 °C to 60 °C) and battery model parameters, the analyzed results did not show how the electrochemical-thermal battery model can be adaptively tuned for the different ambient temperature in the case of the multiple-cell battery. The research was further performed to model the electro-thermal behavior [30,31] of the battery of different size of cylindrical cells with the application of the battery pack on an actual electric vehicle under different drive tests. An electro-thermal model [32] of lithium-ion batteries based on the ECM was proposed. The model parameters of the cell were optimized and validated for a wide range of temperatures and SOC that led to the use of ECM again. However, the tuning of the battery model at different ambient temperature was not mentioned.
A few nonlinear observer design methods were applied to derive the ECM-based nonlinear SOC estimators such as sliding mode observer [33], nonlinear observer [34] and Lyapunov-based observer methods [35]. The ambient temperature was not considered during the SOC estimation. Nevertheless, an online parameter identification [36] was recently used to estimate the battery parameters and nonlinear Kalman filter for SOC estimation at different ambient temperatures. Another approach considering the battery temperature using particle swarm optimization and Gauss-Newton algorithm [37] to estimate the battery parameters was used. The temperature considered was either the battery’s internal or surface temperature.
An alternate non-model based approach including neural networks [38,39,40], fuzzy logic [41], neural network-fuzzy [42], support vector machine (SVM) [43,44] and extreme learning machine (ELM) [45,46,47,48,49,50,51] methods was developed to predict the SOC. These machine learning methods require sufficient large dataset and computation time for the training and validating the SOC value. They are not quite suitable for the operating battery power system as significant training time is required (except for ELM that uses regularized least squares to compute faster than the conventional quadratic programming approach used in gradient method). A battery model [52,53,54,55,56,57] is briefly discussed that could affect the SOC estimation. In addition, the ECM is likely to have higher precision in practice due to its simplicity in the parameter identification. Hence, an adaptable ECM based Lithium-ion battery with consideration of the ambient temperature variation for more accurate SOC estimation is required. In contrast to works done in battery parameter estimation [58,59,60,61,62], the proposed method is based on the temperature-dependent cell model.
In summary, the contributions are as follows. A unified lithium-ion battery model that includes the ambient temperature, cell temperature, thermal aging effect on capacity, hysteresis voltage and its impact on state-of-charge (SOC)-open-circuit voltage (OCV) relationship, hysteresis voltage dynamics and terminal voltage is proposed and validated by an actual experimental test.
The paper is organized as follows: The new nonlinear battery model including ambient temperature is derived in a few subsections starting from Section 2, Section 3, Section 4 and Section 5. Section 6 represents the methodology for SOC estimation using the extended Kalman filter. Section 7 provides the conclusions.

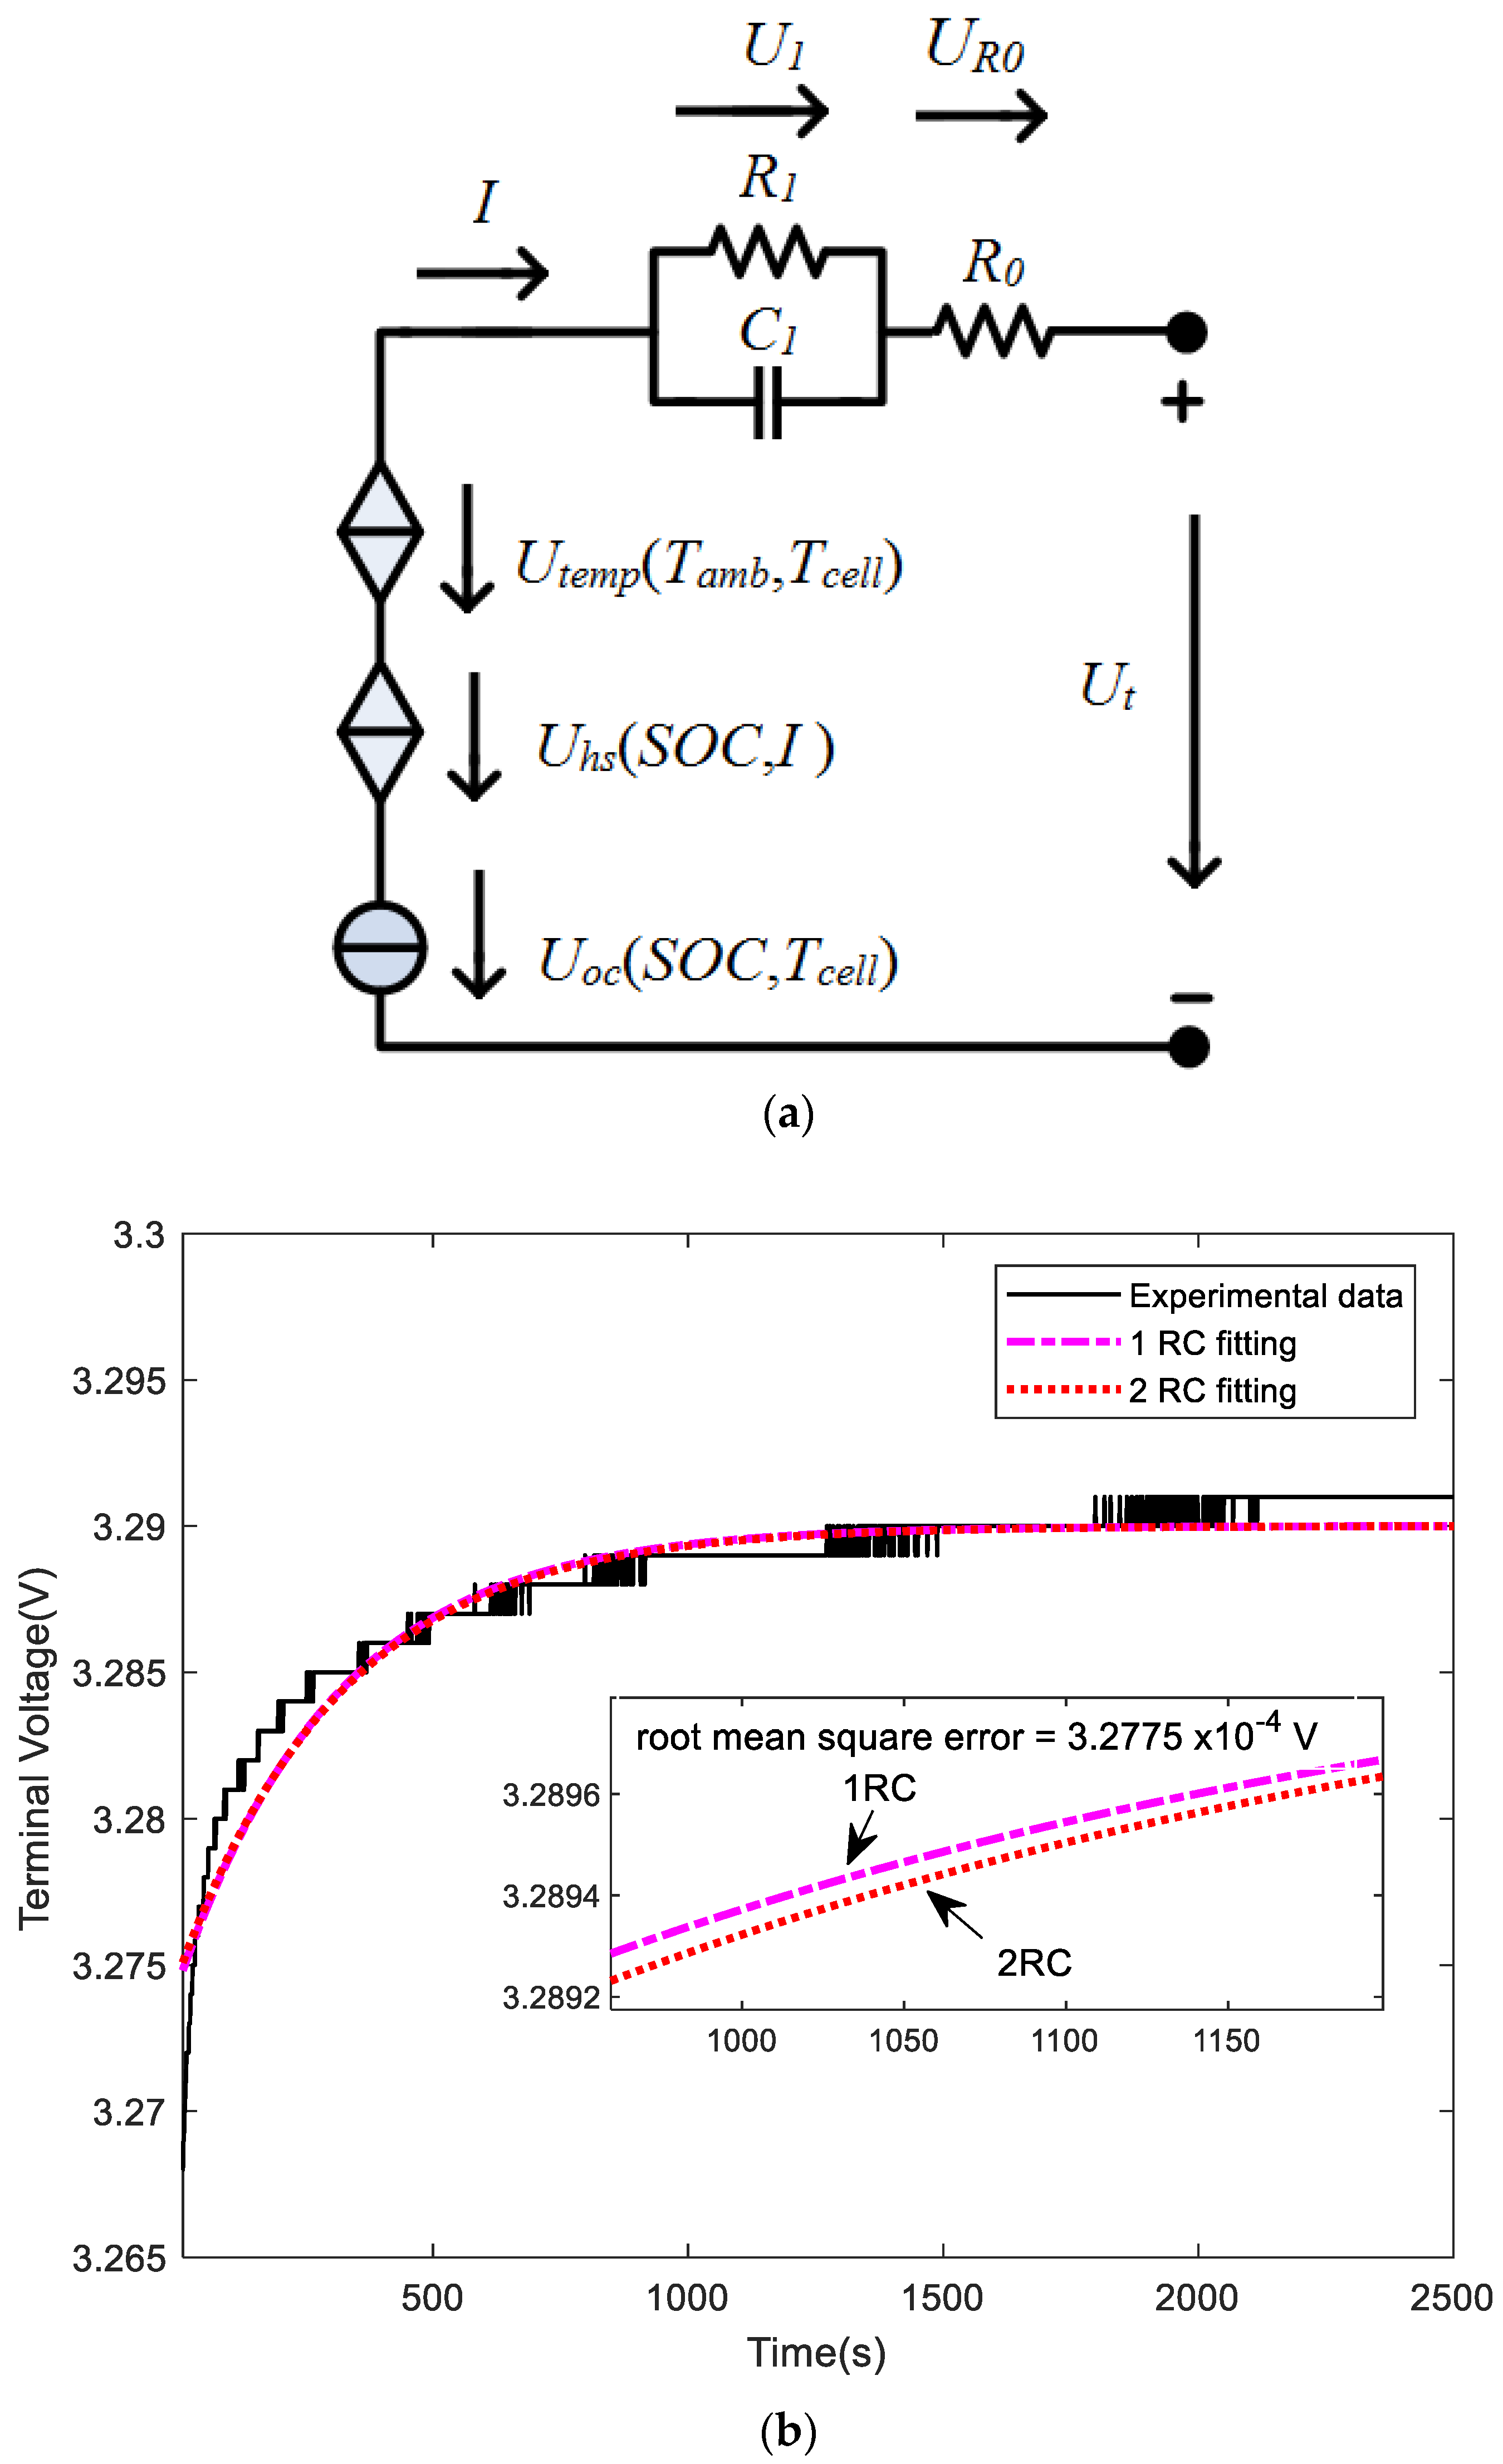
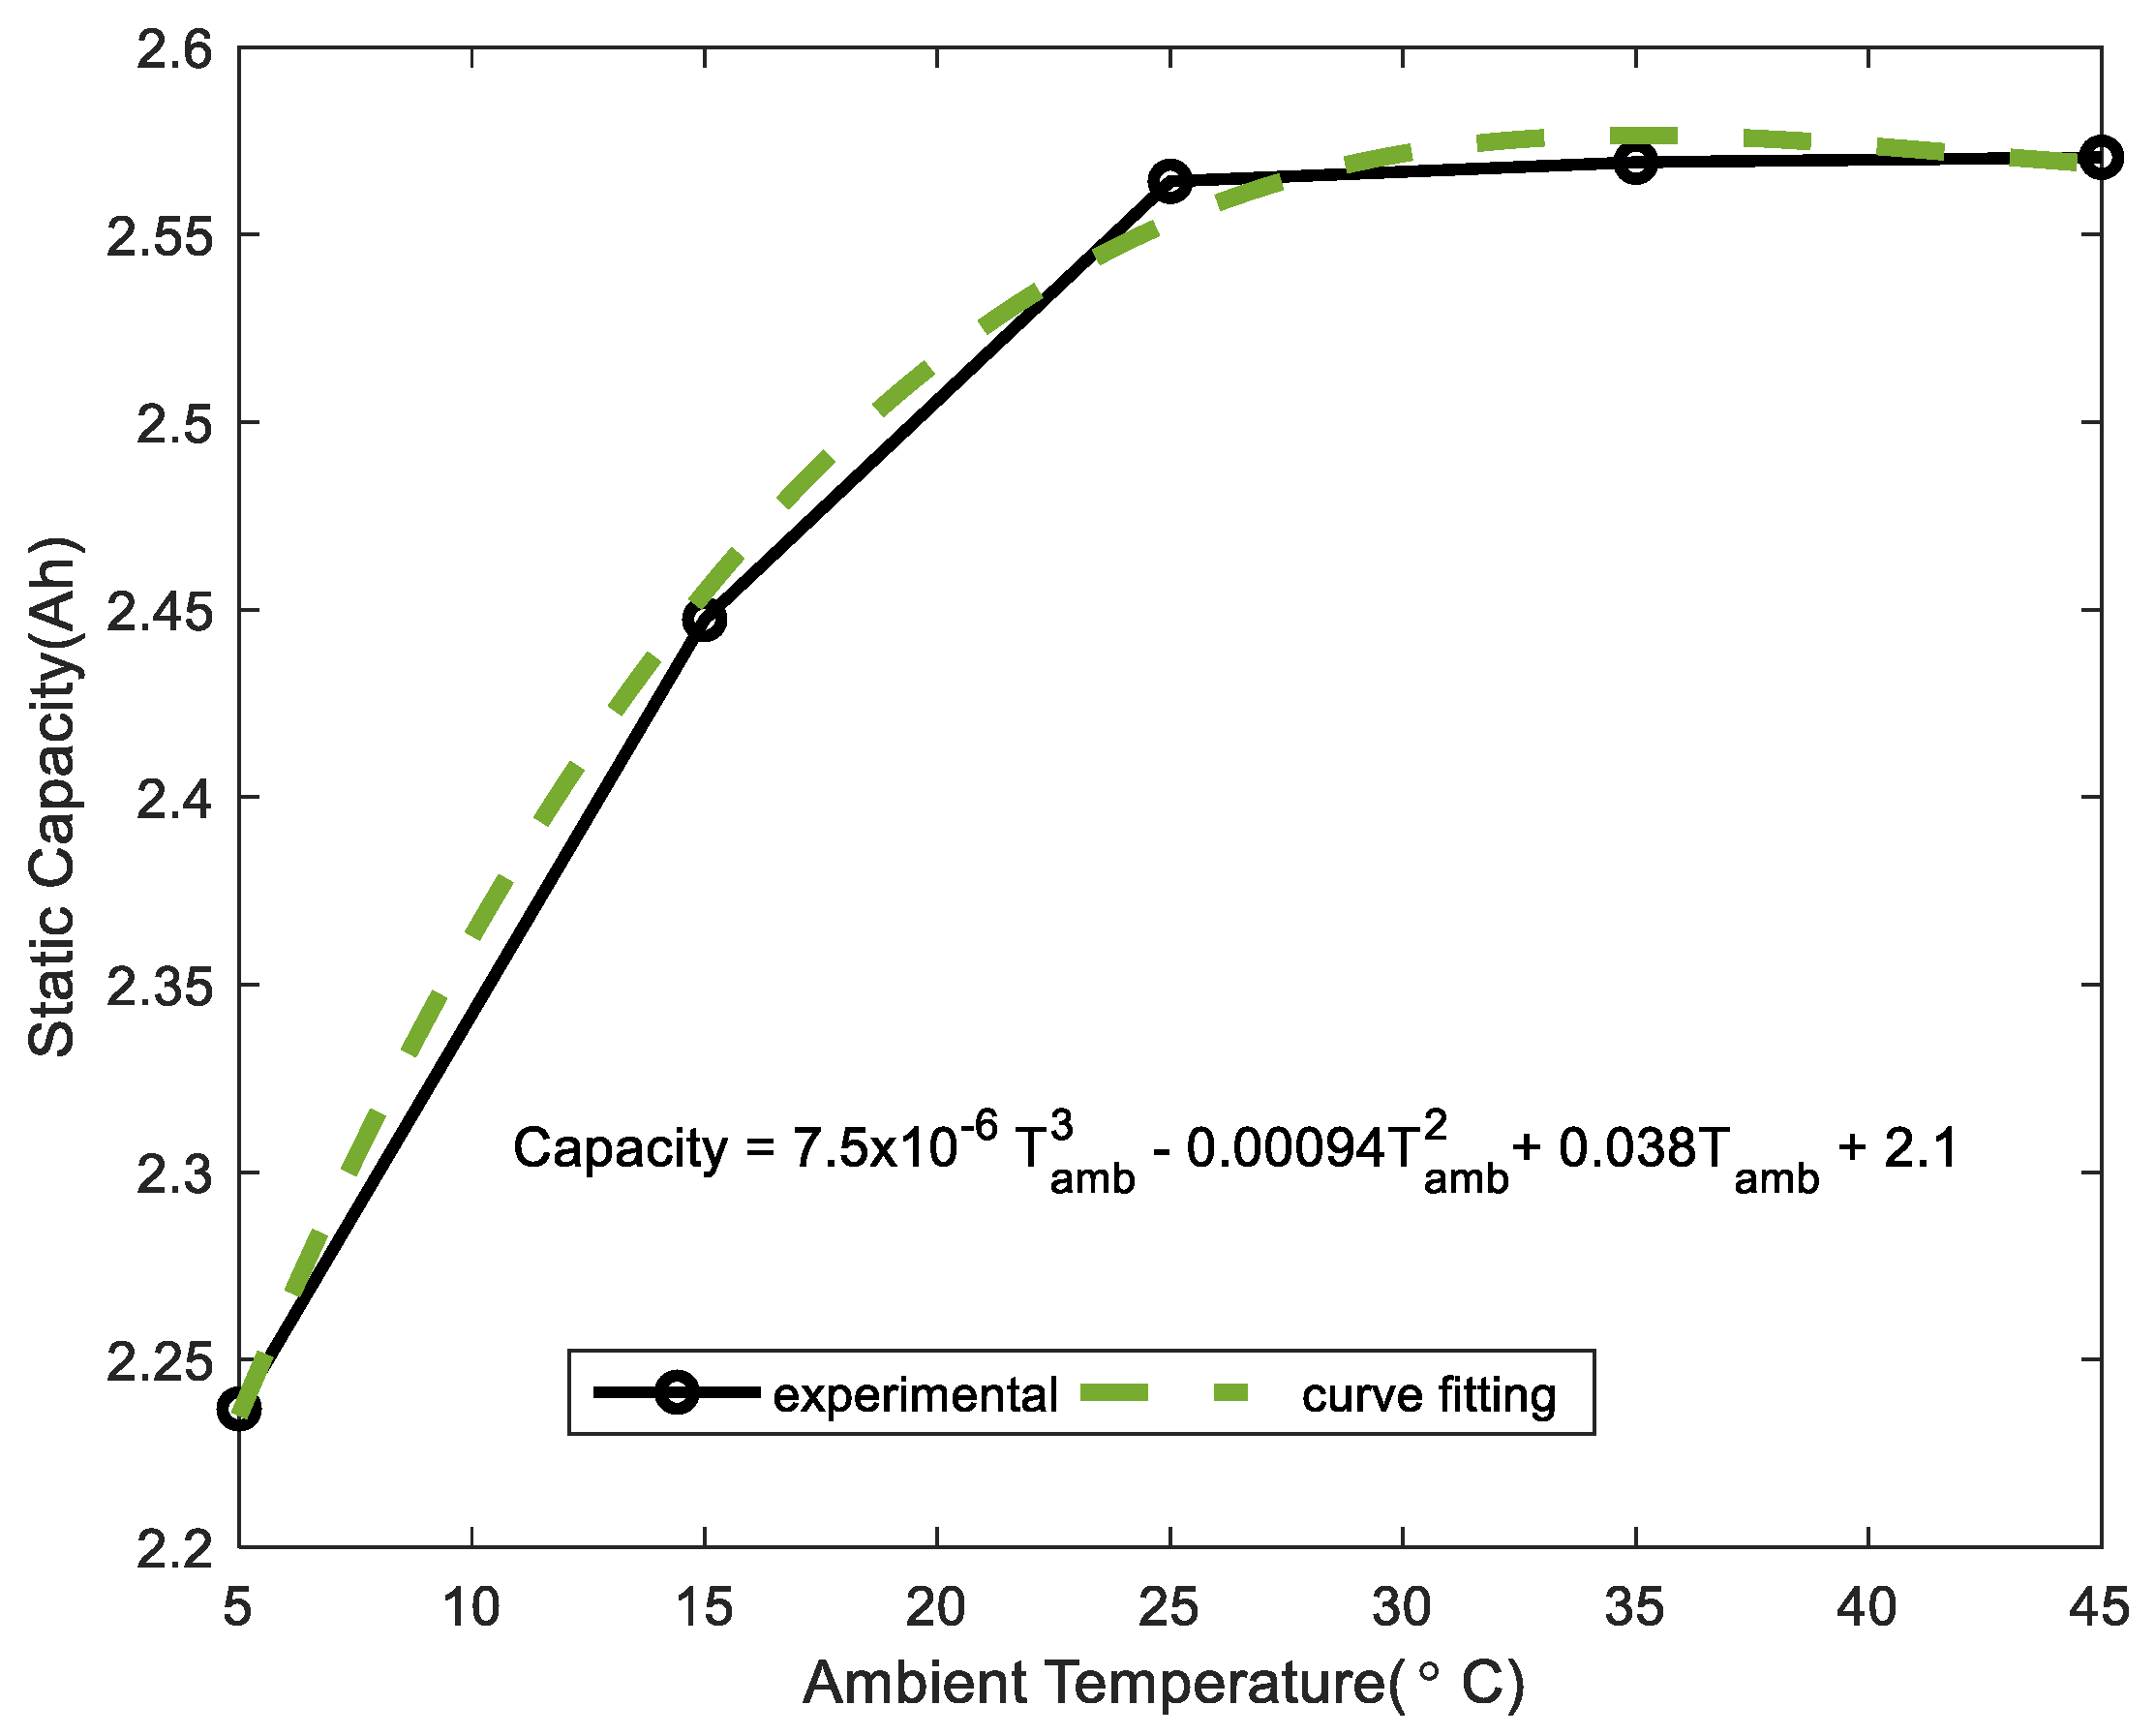
2. Cell Nonlinear Temperature-Dependent State Model

An ambient and cell temperature-dependent T ( T a m b , T c e l l ) equivalent circuit model (ECM) in Figure 1a is used. As shown in the circuit model, 1RC is used instead of 2RC. The comparative curves between the 1RC and 2RC can be seen in Figure 1b. The root mean square error of 1RC and 2RC is around 3.2775 × 10 4 V (i.e., quite small). Hence, 1RC is used for simplicity as fewer parameters are required for computing terminal voltage and SOC value.
The ambient ( T a m b ) temperature refers to the ambient temperature where the battery cell operates while the cell temperature ( T c e l l ) is the surface temperature of the cell. The terms are incorporated into U t e m p ( T c e l l , T a m b ) to represent the temperature dependency in obtaining the terminal voltage (instead of an external disturbance for model validation and robustness test). In addition, the proposed battery cell model provides the current-voltage behavior compensated by the hysteresis effect that gives a balance between simplicity and accuracy in modeling the battery cell model. Note that the experimental data used for the subsequent comparison was obtained from the cylindrical lithium iron phosphate battery cells (ANR26650M1-B) in Table 1.
From the ECM model in Figure 1a, the equations corresponding to the ECM can be expressed as follows.
S O ˙ C = I 3600 C n ( T a m b )  
U ˙ 1 = I C 1 ( S O C , T a m b ) U 1 R 1 ( S O C , T a m b ) C 1 ( S O C , T a m b )  
U ˙ h s = β | I | [ 0.0755 ( 1 S O C ) sign ( I ) + U h s ]  
U t = U o c ( S O C , T c e l l ) U 1 R 0 ( S O C , T a m b ) I + U h s + U t e m p ( T c e l l , T a m b )  
where the internal resistance is represented by R 0 in Ω, R 1 and C 1 are the polarization resistance (in Ω) and polarization capacitance (in F) as a function of T a m b (in °C) and state-of-charge, S O C ( 0 , 1 ) . The cell capacity C n is a function of ambient temperature ( T a m b ). The voltage across the single RC circuit is indicated as U 1 in V. The hysteresis voltage dynamics [63] at equilibrium state is denoted by U h s that is a function of S O C and current I in A. The function sign ( I ) = 1 for I greater or equal to 0 and −1 otherwise. The constant β has a value of 0.0245. The terminal or the output voltage of the battery cell is denoted by U t . The temperature dependency term U t e m p ( T ) is included in the terminal voltage equation to compensate for the temperature variation on the output voltage. The open-circuit voltage U o c is a function of S O C and cell temperature T c e l l (in °C). The following will explain how the parameters used in (1)–(4) are modelled.

3. Cell SOC-OCV Relationship

The SOC in (1) was obtained by the Ampere-counting method. However, the cell capacity C n can be a function of ambient temperature ( T a m b ) as shown in Figure 2 where the capacity varies at different ambient temperature. The static capacity curve is obtained by curve-fitting the experimental data. The capacity model C n ( T a m b ) used in (1) can be written as follows.
C n ( T a m b ) = 7.5 × 10 6 T a m b 3 0.00094 T a m b 2 + 0.038 T a m b + 2.1  
The mapping of open circuit voltage (OCV) to SOC is represented by Uoc as follows.
U o c ( S O C , T c e l l ) = 0.5863 exp ( 21.9 S O C ) + 3.38 + 0.1 S O C 0.17 exp [ 0.008 / ( 1 S O C ) ] + 0.0008 T c e l l
where S O C ( 0 , 1 ) and T c e l l is the cell temperature in °C. The plot of open-circuit voltage, U o c to SOC relationship in (6) as compared to the experimental OCV-SOC obtained from pulse discharge test (PDT) in [51,64,65,66] can be seen in Figure 3. The PDT conducted in Figure 3 generated a series of the discharge current of 2 A for decreasing SOC values in Figure 4. In the test, the battery was fully charged with constant current-constant voltage (CCCV) mode under 25 °C ambient temperature to 3.6 V. Then battery cell was then discharged at a pulse current 2 A with 450 s discharging time and 2700 s relaxation time until the terminal voltage reaches the cut-off voltage of 2.5 V as seen in Figure 5. The OCV was obtained when the battery’s terminal voltage reached equilibrium state during the relaxation period. As seen in Figure 6, the values of the SOC were then recorded. The cycle was repeated at other ambient temperatures. The battery cell was tested under specific ambient temperature (i.e., 5 °C, 15 °C, 25 °C, 35 °C, and 45 °C) in a temperature chamber. The reason for using the selected temperature is due to the limitation of the temperature chamber at the time of the testing, although the battery cell can go up to 55 °C (and in some application such as an i3 battery for BMW that could go beyond 70 °C) and reached a minimum of 5 °C only. In this study, the maximum limit of the operating ambient temperature is set to 45 °C with the use of heat absorbing material such as phase change material (PCM). The PCM can allow higher operating ambient temperature if needed.
As shown in Figure 6, the simulation of SOC using (1) is compared with the experimental data obtained from Ah counting method (without the ambient temperature in the static capacity). The results show slight differences in SOC estimation. The simulation result using (1) gives a higher value as compared to the Ah counting method. It shows that it is essential to include an ambient temperature in SOC estimation. On the other hand, the OCV-SOC relationship proposed in (6) exhibits a close match to the experimental data as seen in Figure 7a. The constants used in the equation were tuned iteratively to match the experimental OCV-SOC data.
The OCV-SOC at various ambient temperature can be simulated in MATLAB/Simulink as shown in Figure 7b. It is used to compare the simulated results with the experimental data as shown in Figure 7c. The root mean square errors (RMSEs) of OCV at different ambient temperature as compared to the proposed model can be seen in Figure 7d. The maximum RMSE of OCV is around 0.33 V at an ambient temperature of 5 °C followed by 15 °C with RMSE of 0.28 V.

4. Cell Temperature Model

In addition to the cell temperature affecting the OCV-SOC relationship, the ambient temperature [67,68] also affects the accuracy of terminal voltage and subsequent SOC estimation. To account for the influence, the term U t e m p ( T c e l l , T a m b ) is included to compensate for the differences on the terminal voltage equation.
U t e m p ( T c e l l , T a m b ) = 0.0492 6.8 × 10 6 Δ T 0.0012 exp ( 1 / t ) Δ T  
where Δ T = T c e l l T a m b , T c e l l is obtained from the general energy balance for battery thermal model proposed by Bernardi et al. [69] with the total heat generated ( Q g e n ) in the battery cell as defined by
m c p d T c e l l d t = h Δ T ε σ ( T c e l l 4 T a m b 4 ) + I ( U o c U t + T c e l l d U o c d T c e l l ) + I 2 R c Q g e n  
where m is the mass of the battery cell in kg, c p is the specific heat capacity of the cell in J/kgK, h is the convective heat transfer coefficient, Δ T = T c e l l T a m b , ε is the emissivity of heat term, σ is the Stefan-Boltzmann constant term in J·s−1m−2K4, d U o c / d T c e l l is the reversible heat term or entropy coefficient and R c is the contact resistance in Ω . The terminal voltage U t and open-circuit voltage U o c can be seen in (4) and (6), respectively. The values of the parameters related to the battery cell can be found in Table 1.
It is known that RC values depend on the SOC and T a m b . It is essential to include the dependent terms SOC and T a m b in (2) and (4) as seen in the following Figure 8, Figure 9 and Figure 10. The regression equations R 0 , R 1 , C 1 have a function of SOC. As compared with the ambient temperature counterpart, the behaviors of R 0 , R 1 , C 1 at different ambient temperature are difficult to model accurately. Hence, the dynamics of R 0 , R 1 , C 1 use in (2) and (4) are embedded into a series of lookup tables such that the values at specific SOC and T a m b can be obtained. The relationship between R 0 , R 1 , C 1 and SOC can be expressed as follows. For example, the equations for R 0 , R 1 , C 1 in (9) to (11) were derived by curve-fitting the experimental data at ambient temperature of 25 °C.
R 0 ( S O C ) = 19 S O C 6 60 S O C 5 + 75 S O C 4 46 S O C 3 + 15 S O C 2 2.3 S O C + 0.23  
R 1 ( S O C ) = 2.2 × 10 2 S O C 7 6.8 × 10 2 S O C 6 + 8.4 × 10 2 S O C 5 5.1 × 10 2 S O C 4 + 1.6 × 10 2 S O C 3 26 S O C 2 + 1.7 S O C 0.015
C 1 ( S O C ) = 2.3 × 10 8 S O C 7 8.5 × 10 8 S O C 6 + 1.2 × 10 9 S O C 5 9.3 × 10 8 S O C 4 + 3.8 × 10 8 S O C 3 7.7 × 10 7 S O C 2 + 7 × 10 6 S O C 1.3 × 10 5
where S O C ( 0 , 1 ) .
The terminal voltage is also affected by the changes in T c e l l instead of T a m b . The schematic of the experimental setup that utilizes infrared thermal imaging was used to determine the cell temperature as seen in Figure 11. The laboratory environment was first kept approximately 25 °C and discharged to a programmable electronic load. A thermal infrared camera was used to capture the temperature distribution of the battery cell which was wrapped in non-glossy black tape with a known emissivity of 0.95. The battery cell was discharged under a constant current rate (2 A) at the same ambient laboratory temperature. The experiment was performed on three different battery cells and the average cell temperature was taken. The stop condition for the discharge was set to a cut-off voltage of 2.5 V to prevent damage to the cell. For clarity, only one of the image captured can be seen in Figure 12. The surface temperature can reach around 29 °C as seen in the thermal image. The same test was then repeated at other ambient temperatures.
The time response, T c e l l obtained from the experimental is compared with the simulated result by Bernardi et al. [69]. It can be observed that there exist some errors. The errors are found to be around 3 °C at the steady-state. The high time constant resulted in the sluggish response as seen in Figure 13. The same phenomena can be observed at other ambient temperature. As time increases, the cell temperature will increase due to the continuous discharging the cell at 2 A until it reaches the cut-off voltage of 2.5 V. The entire simulation block diagram by MATLAB/Simulink can be seen in Figure 14. The block diagram was used to simulate the OCV-SOC relationship, cell temperature, terminal voltage and SOC estimate of the battery cell at different ambient temperature. The input load current can be changed.

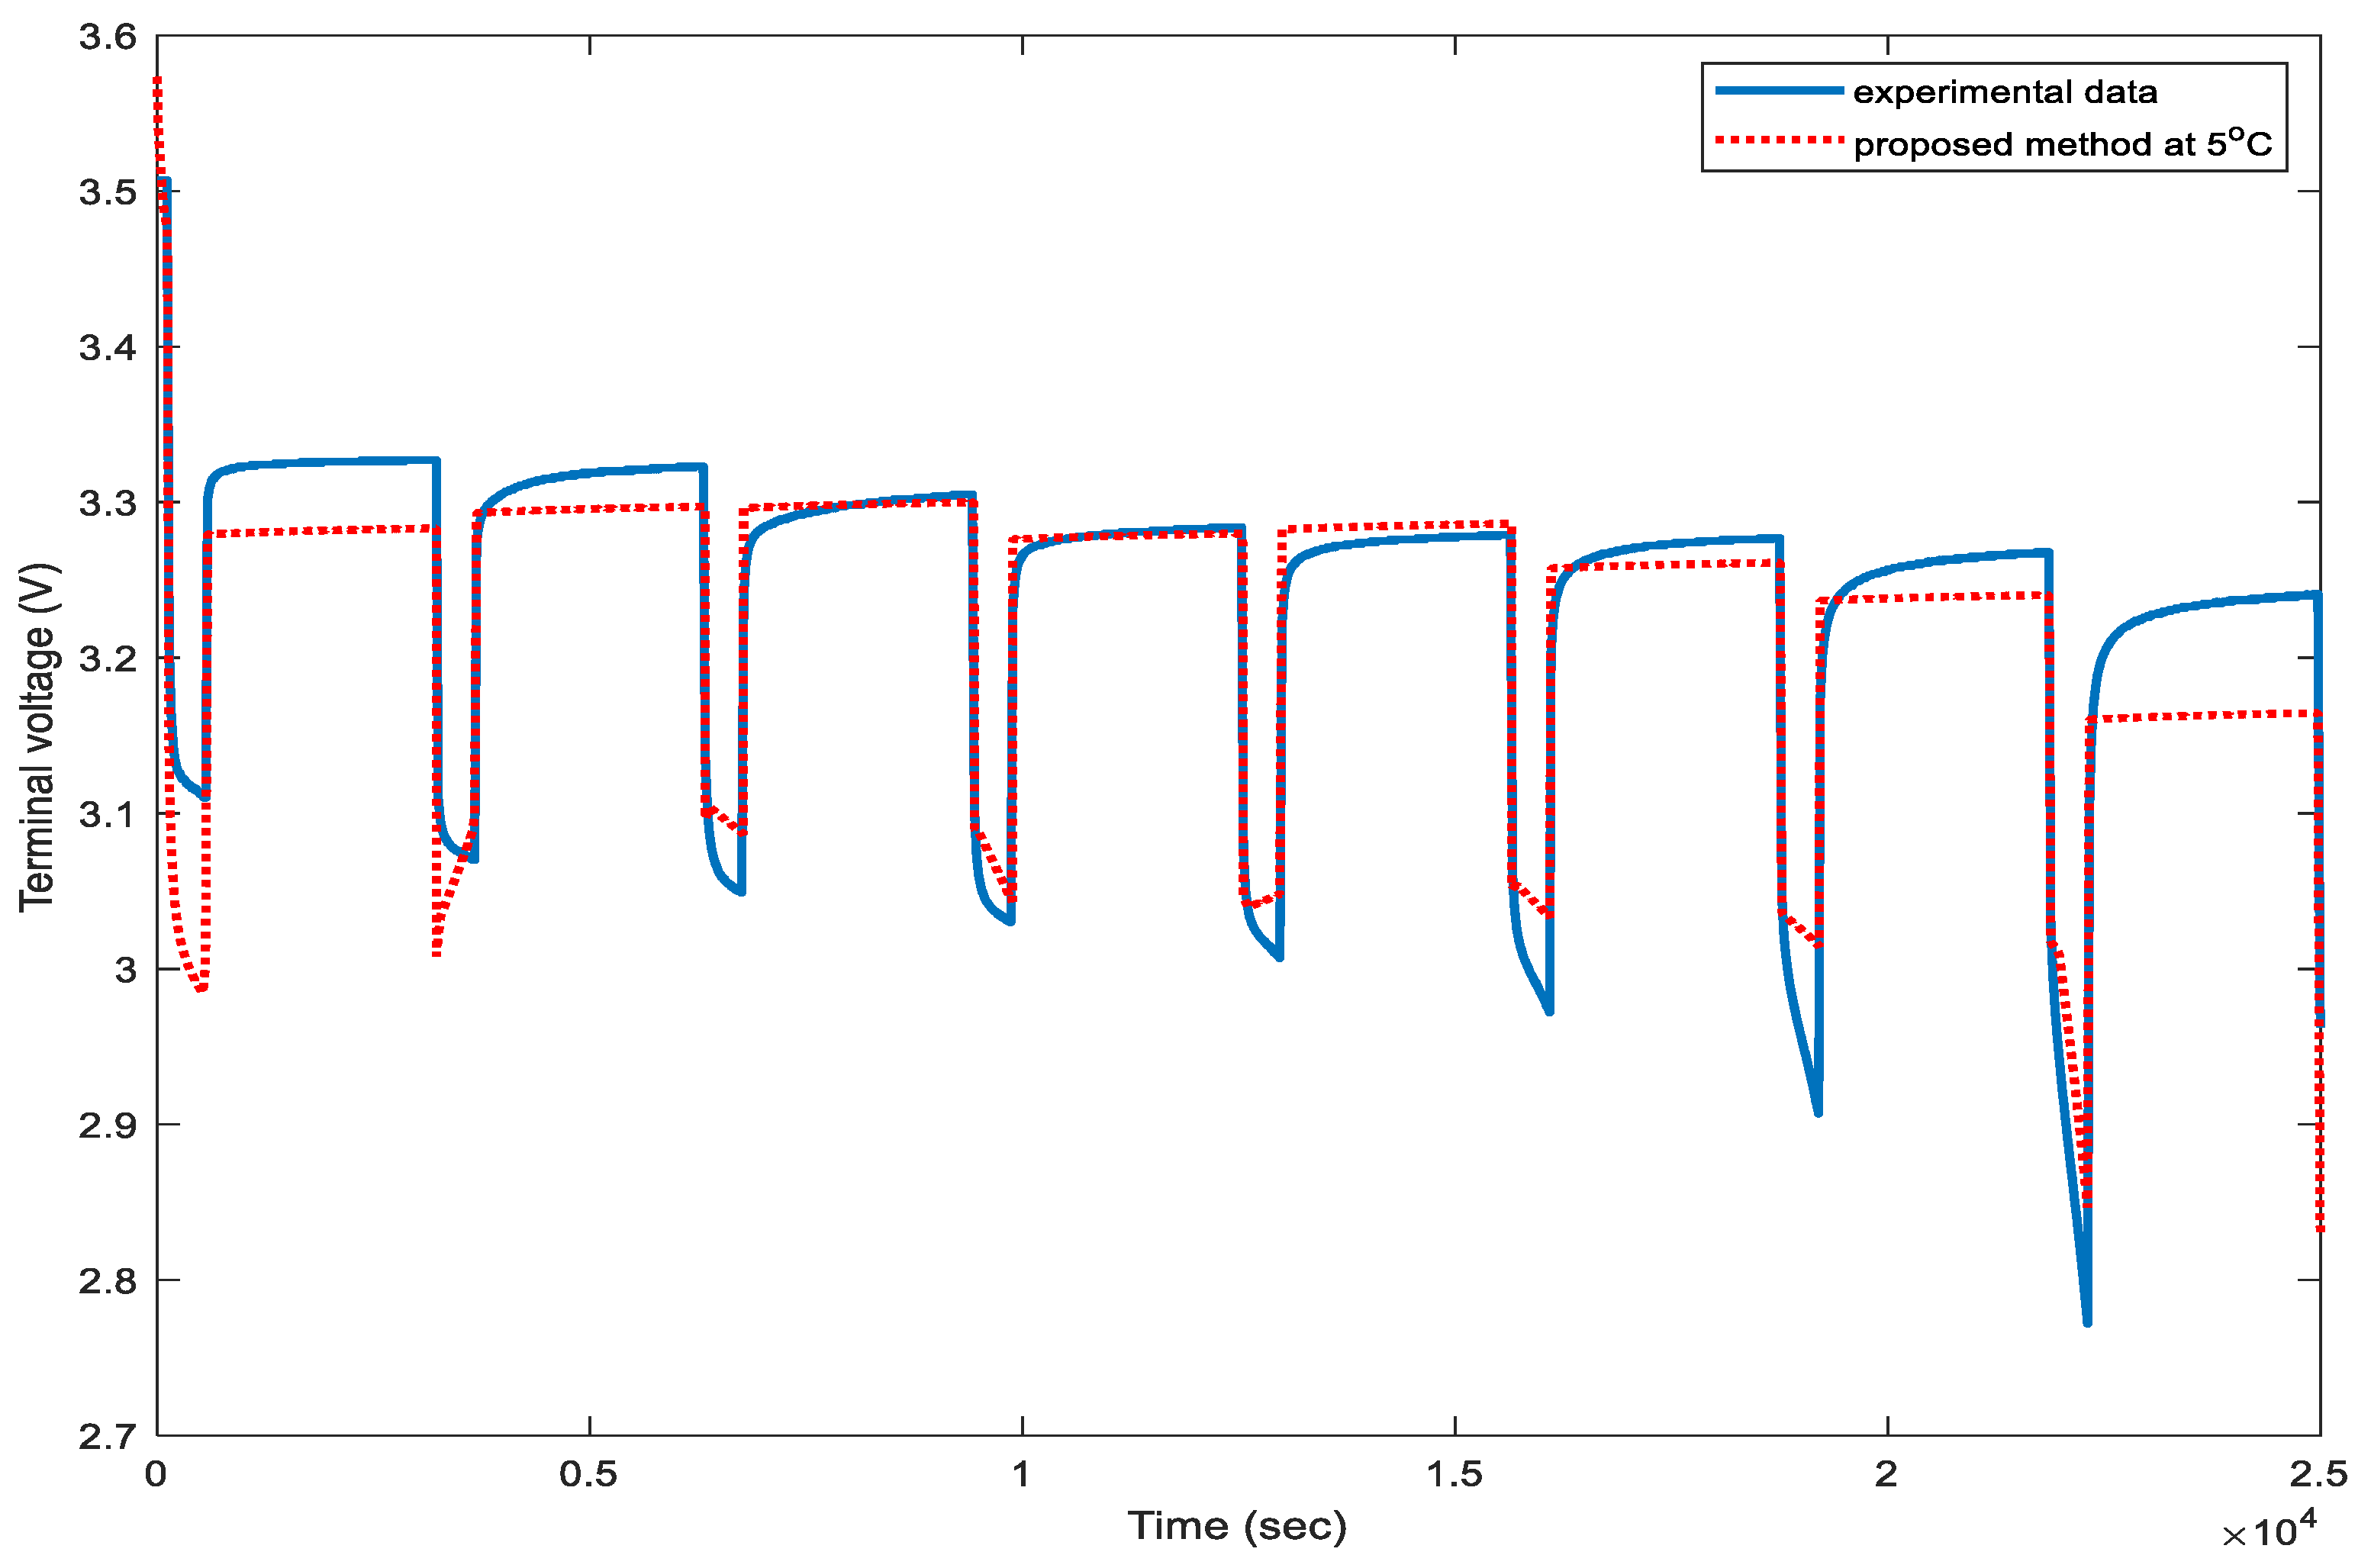
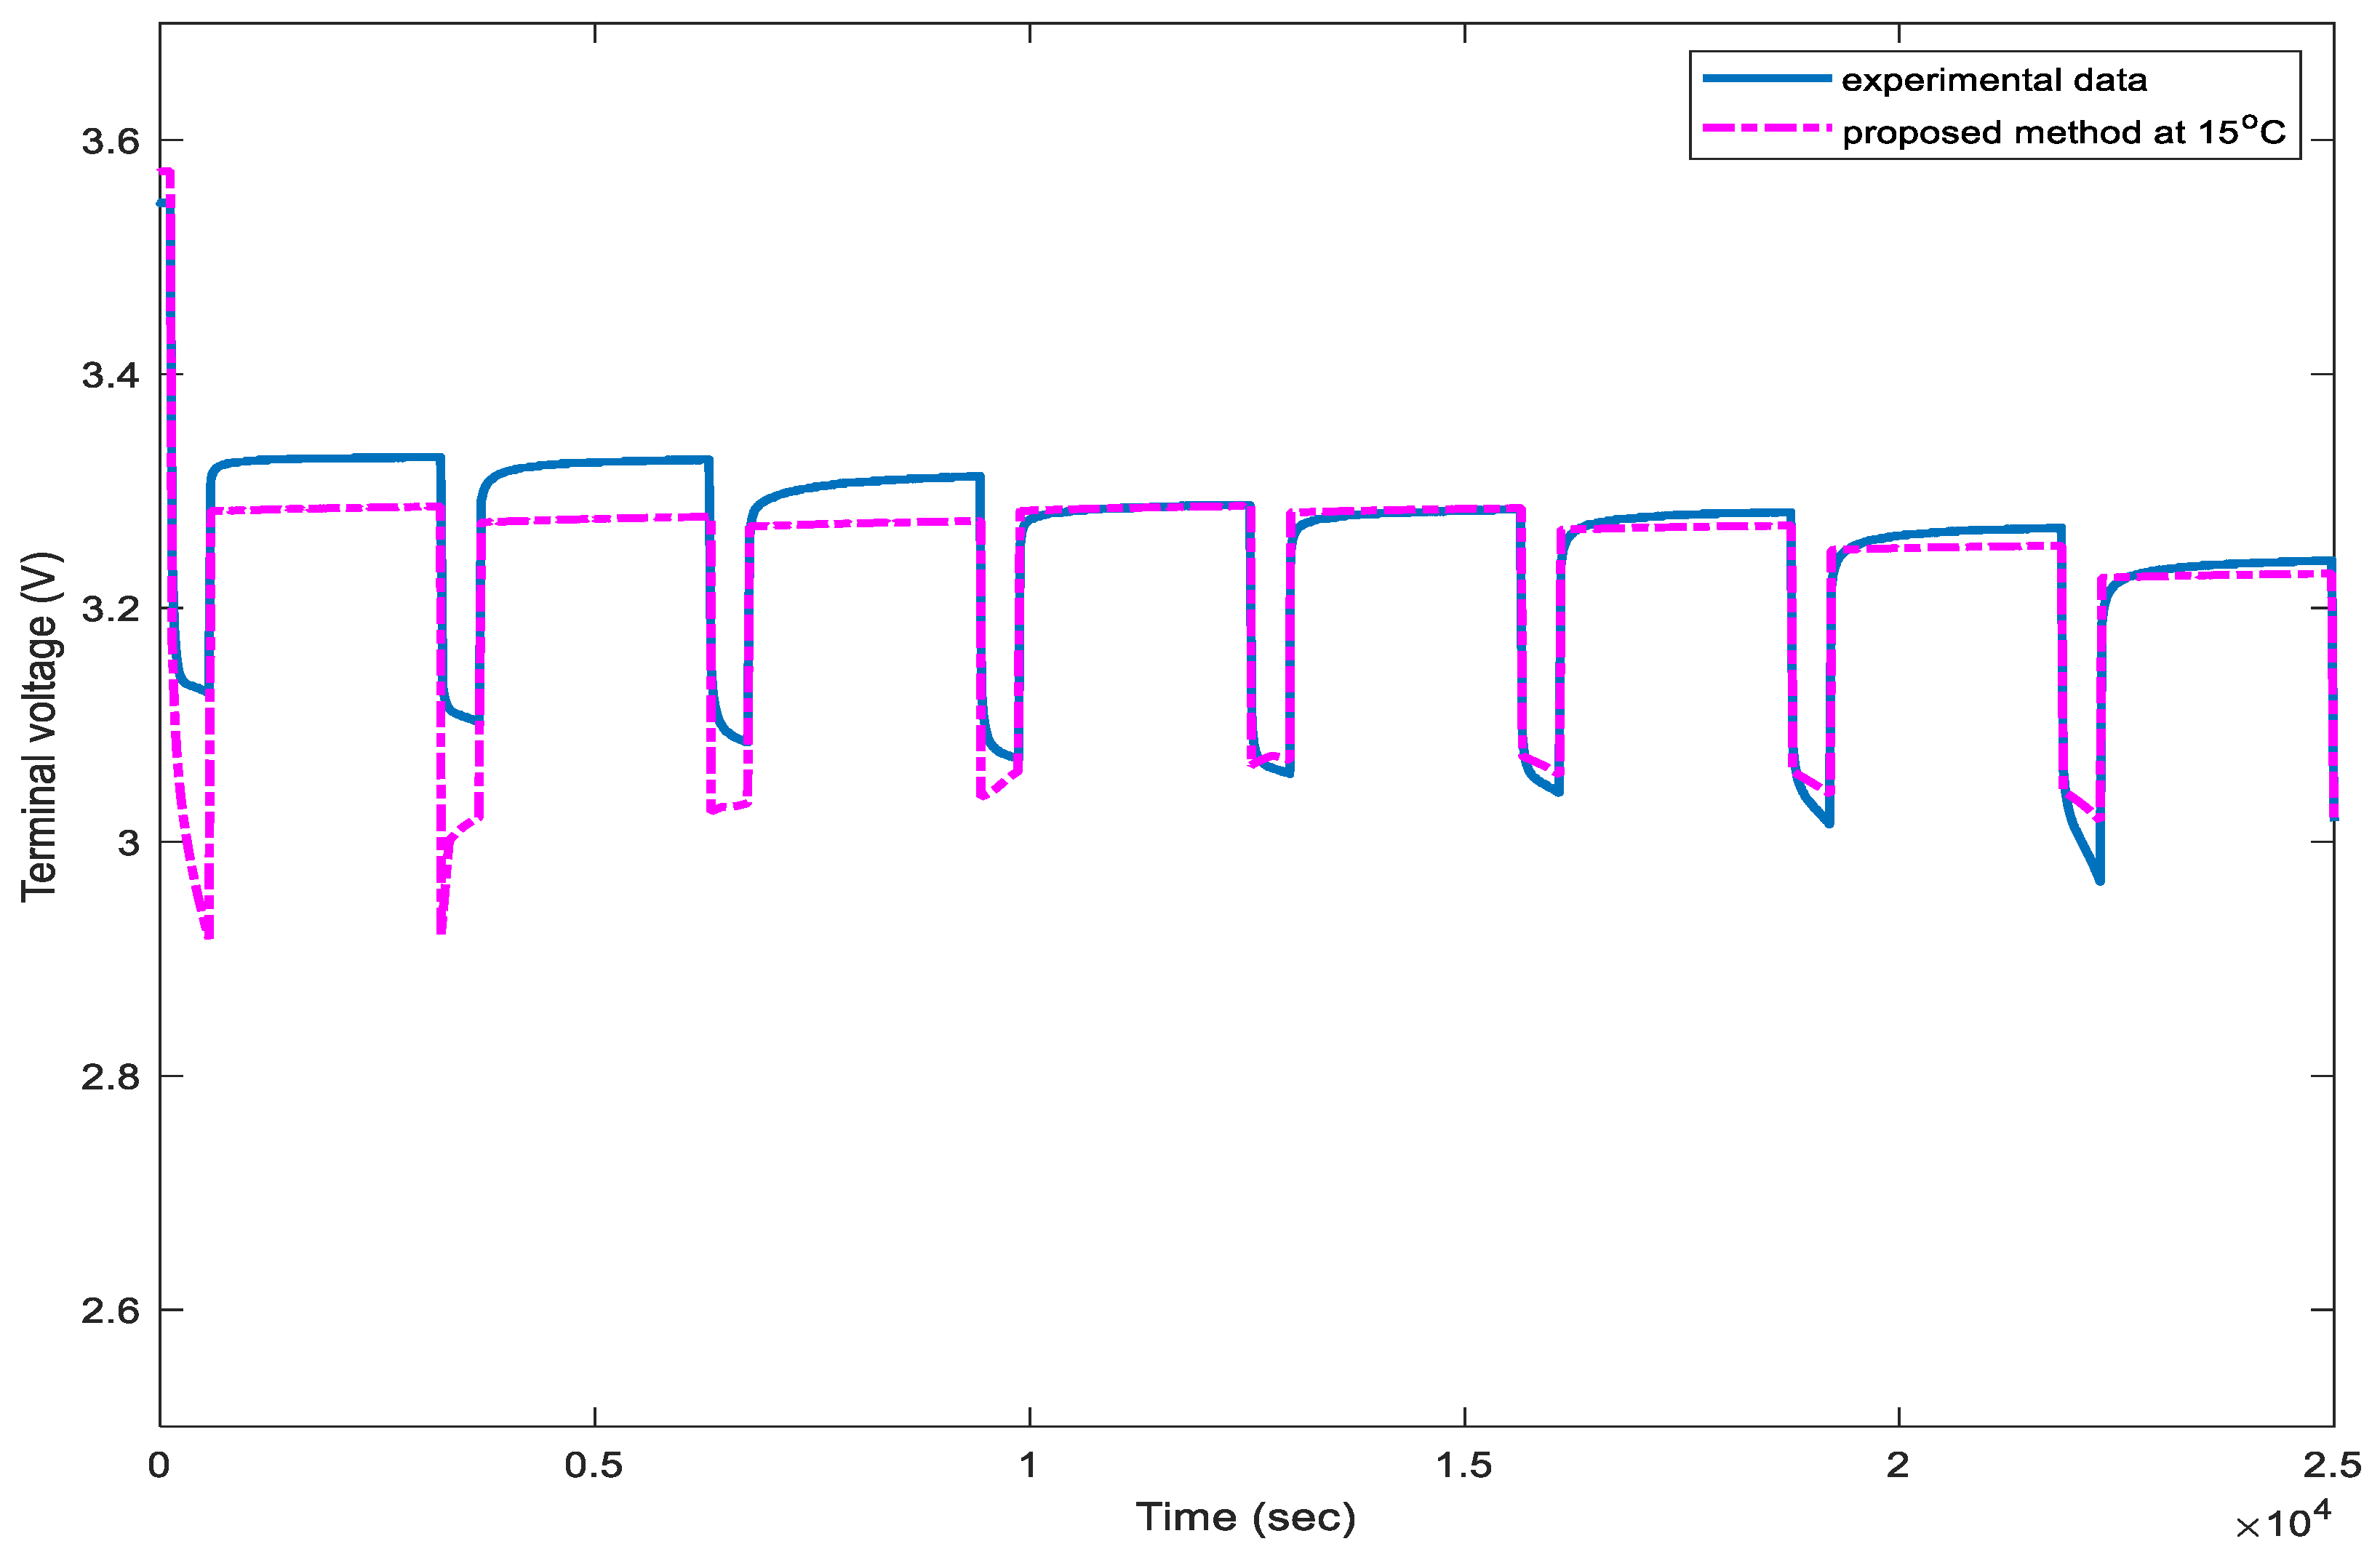
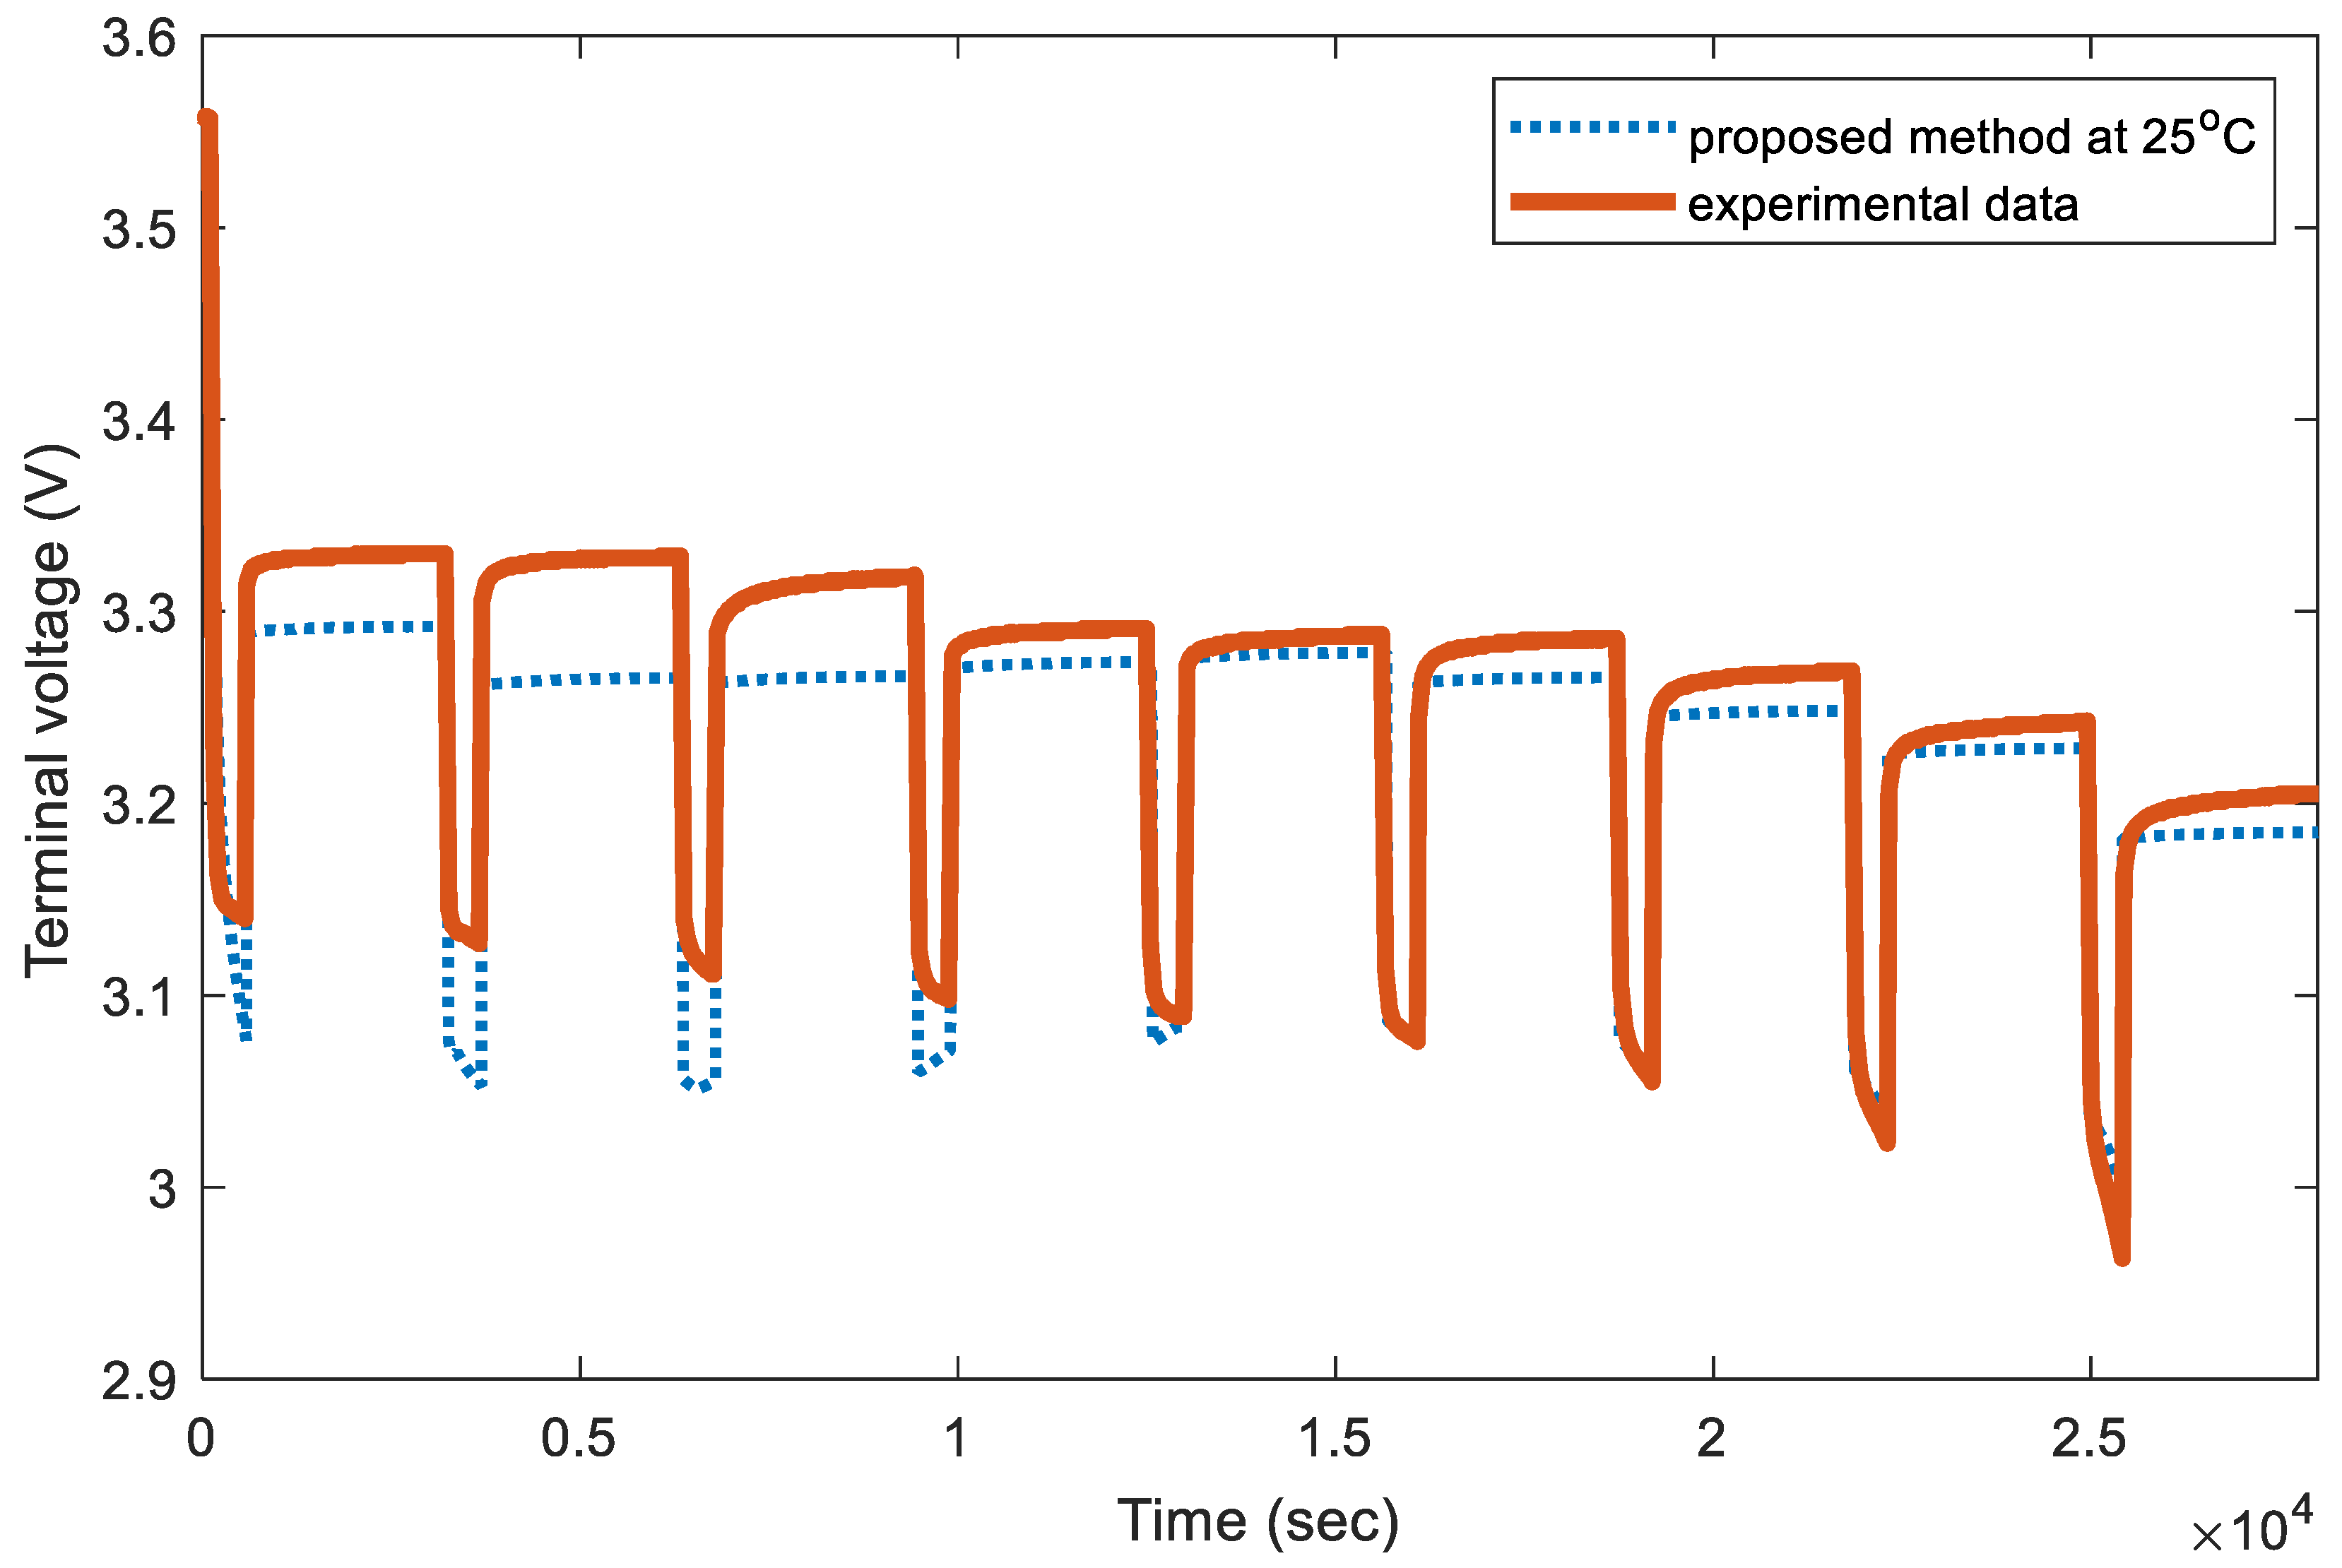
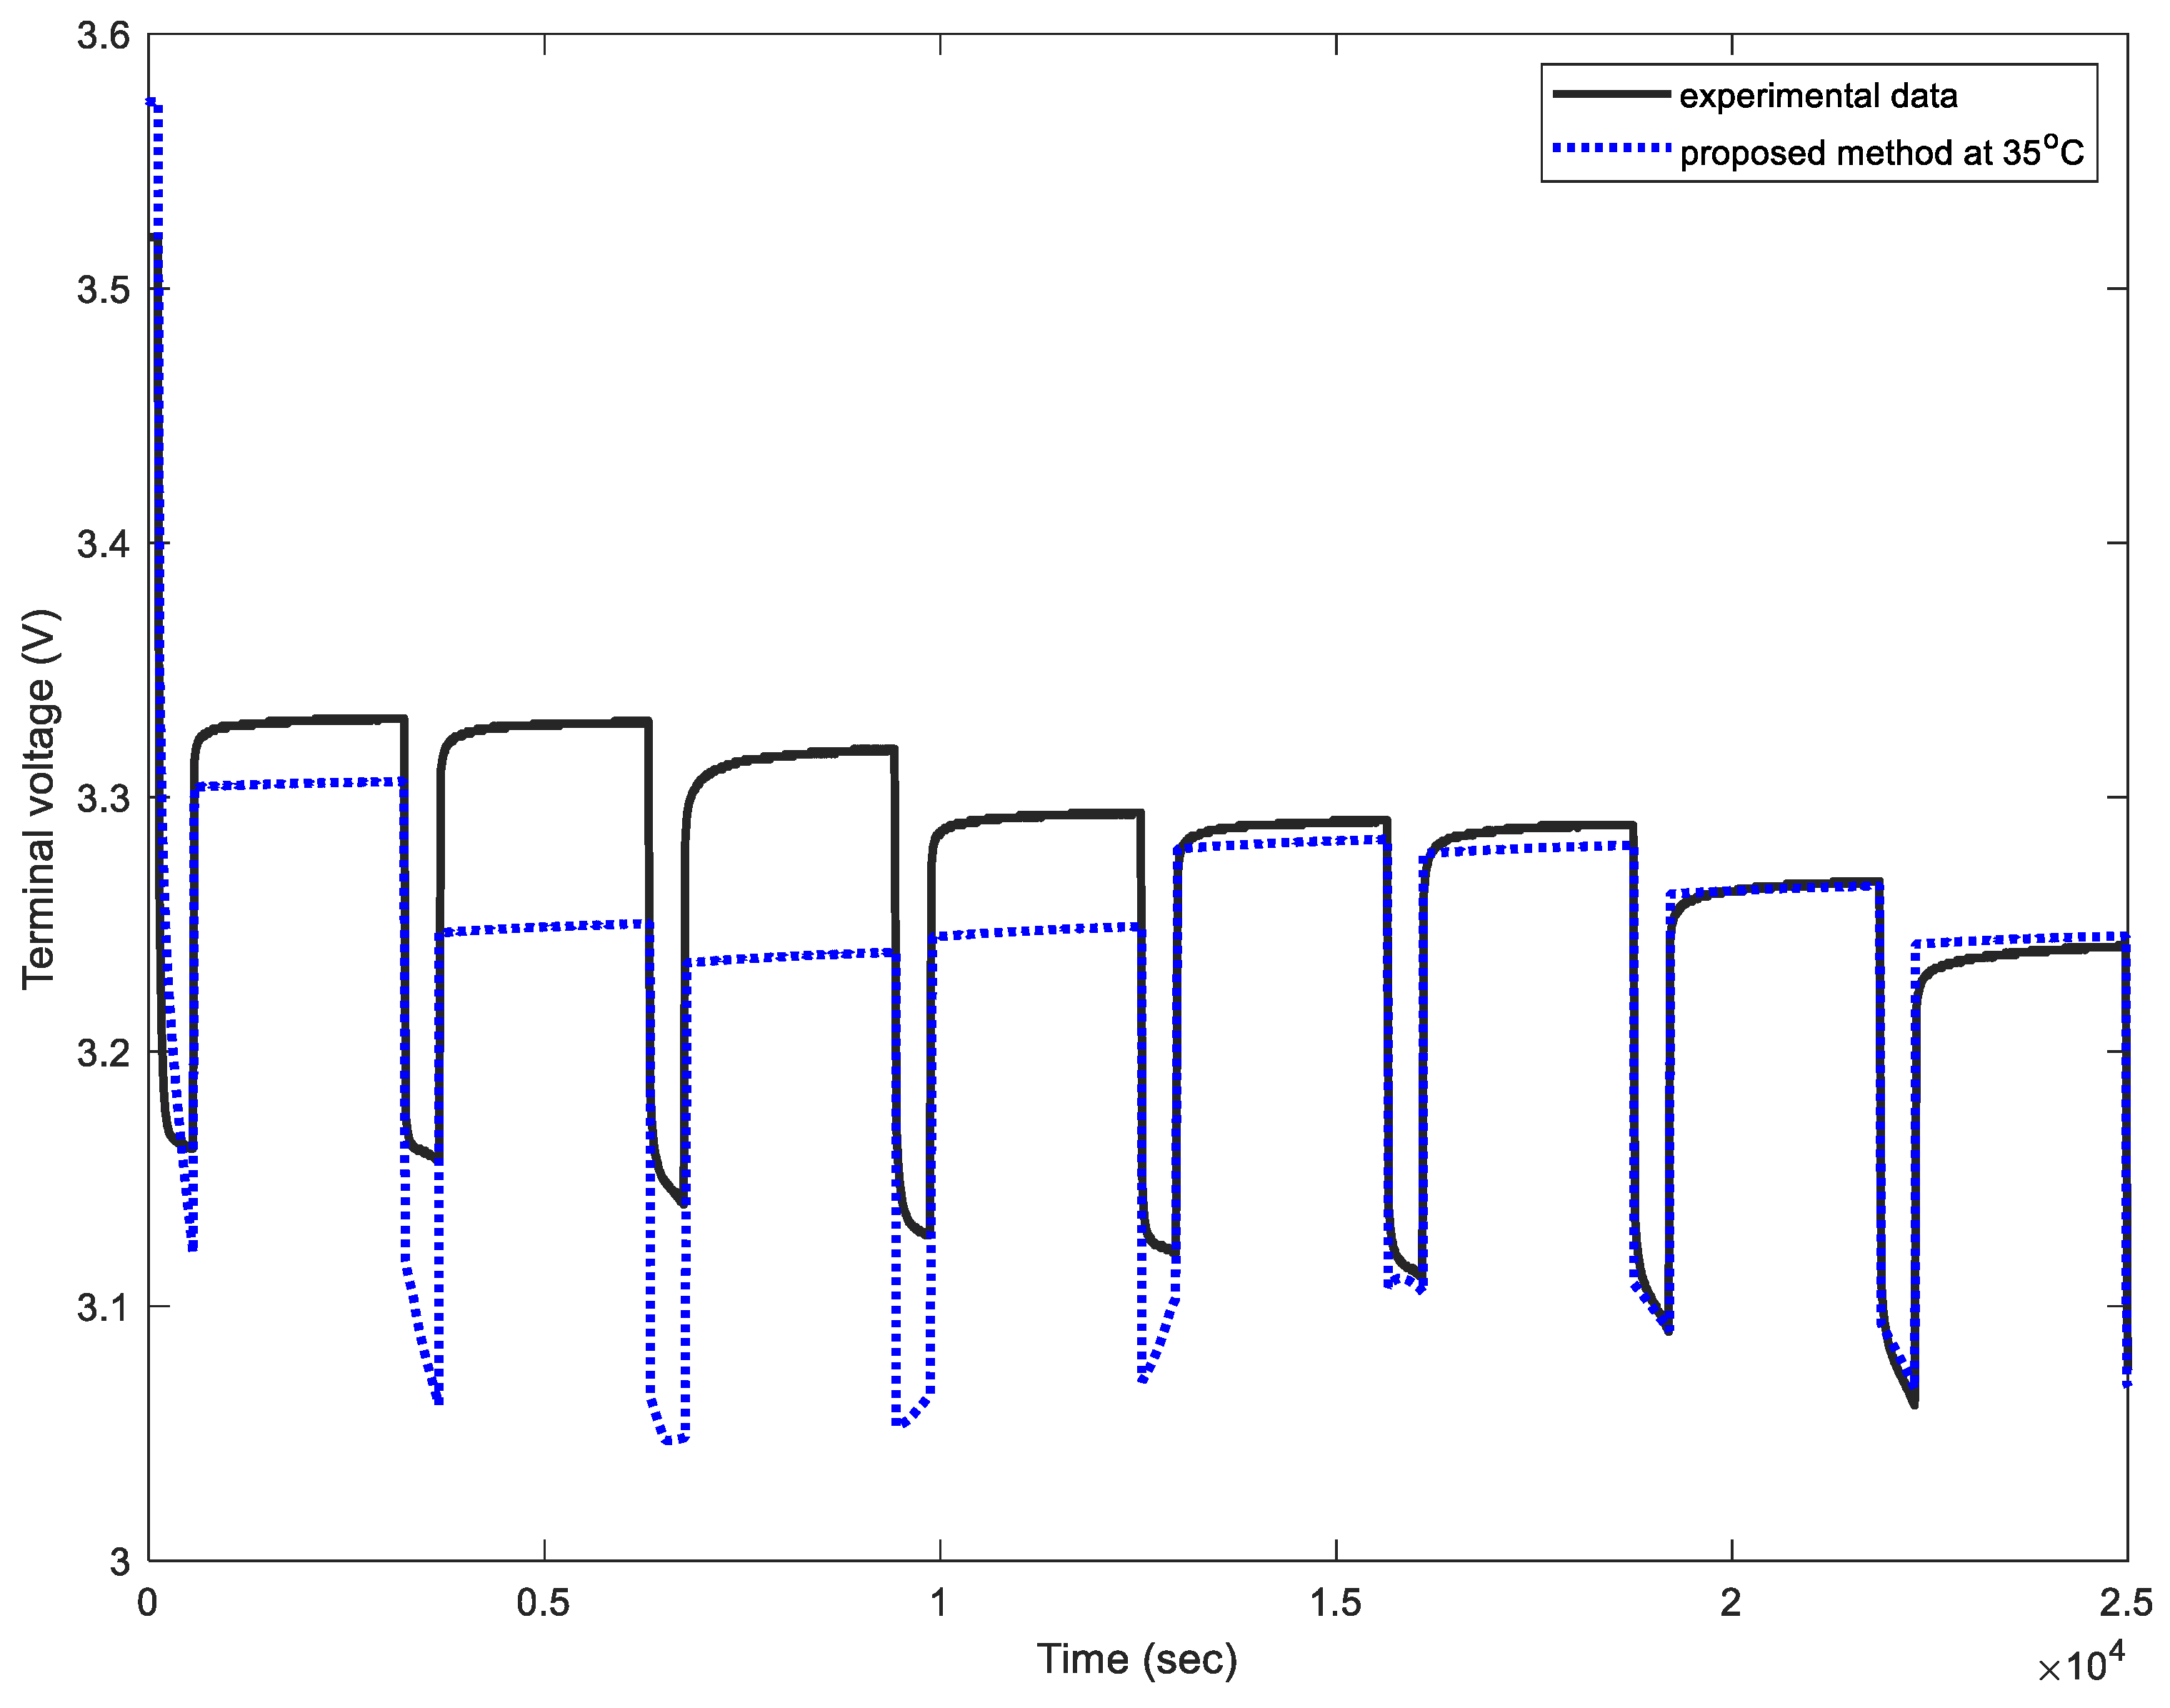
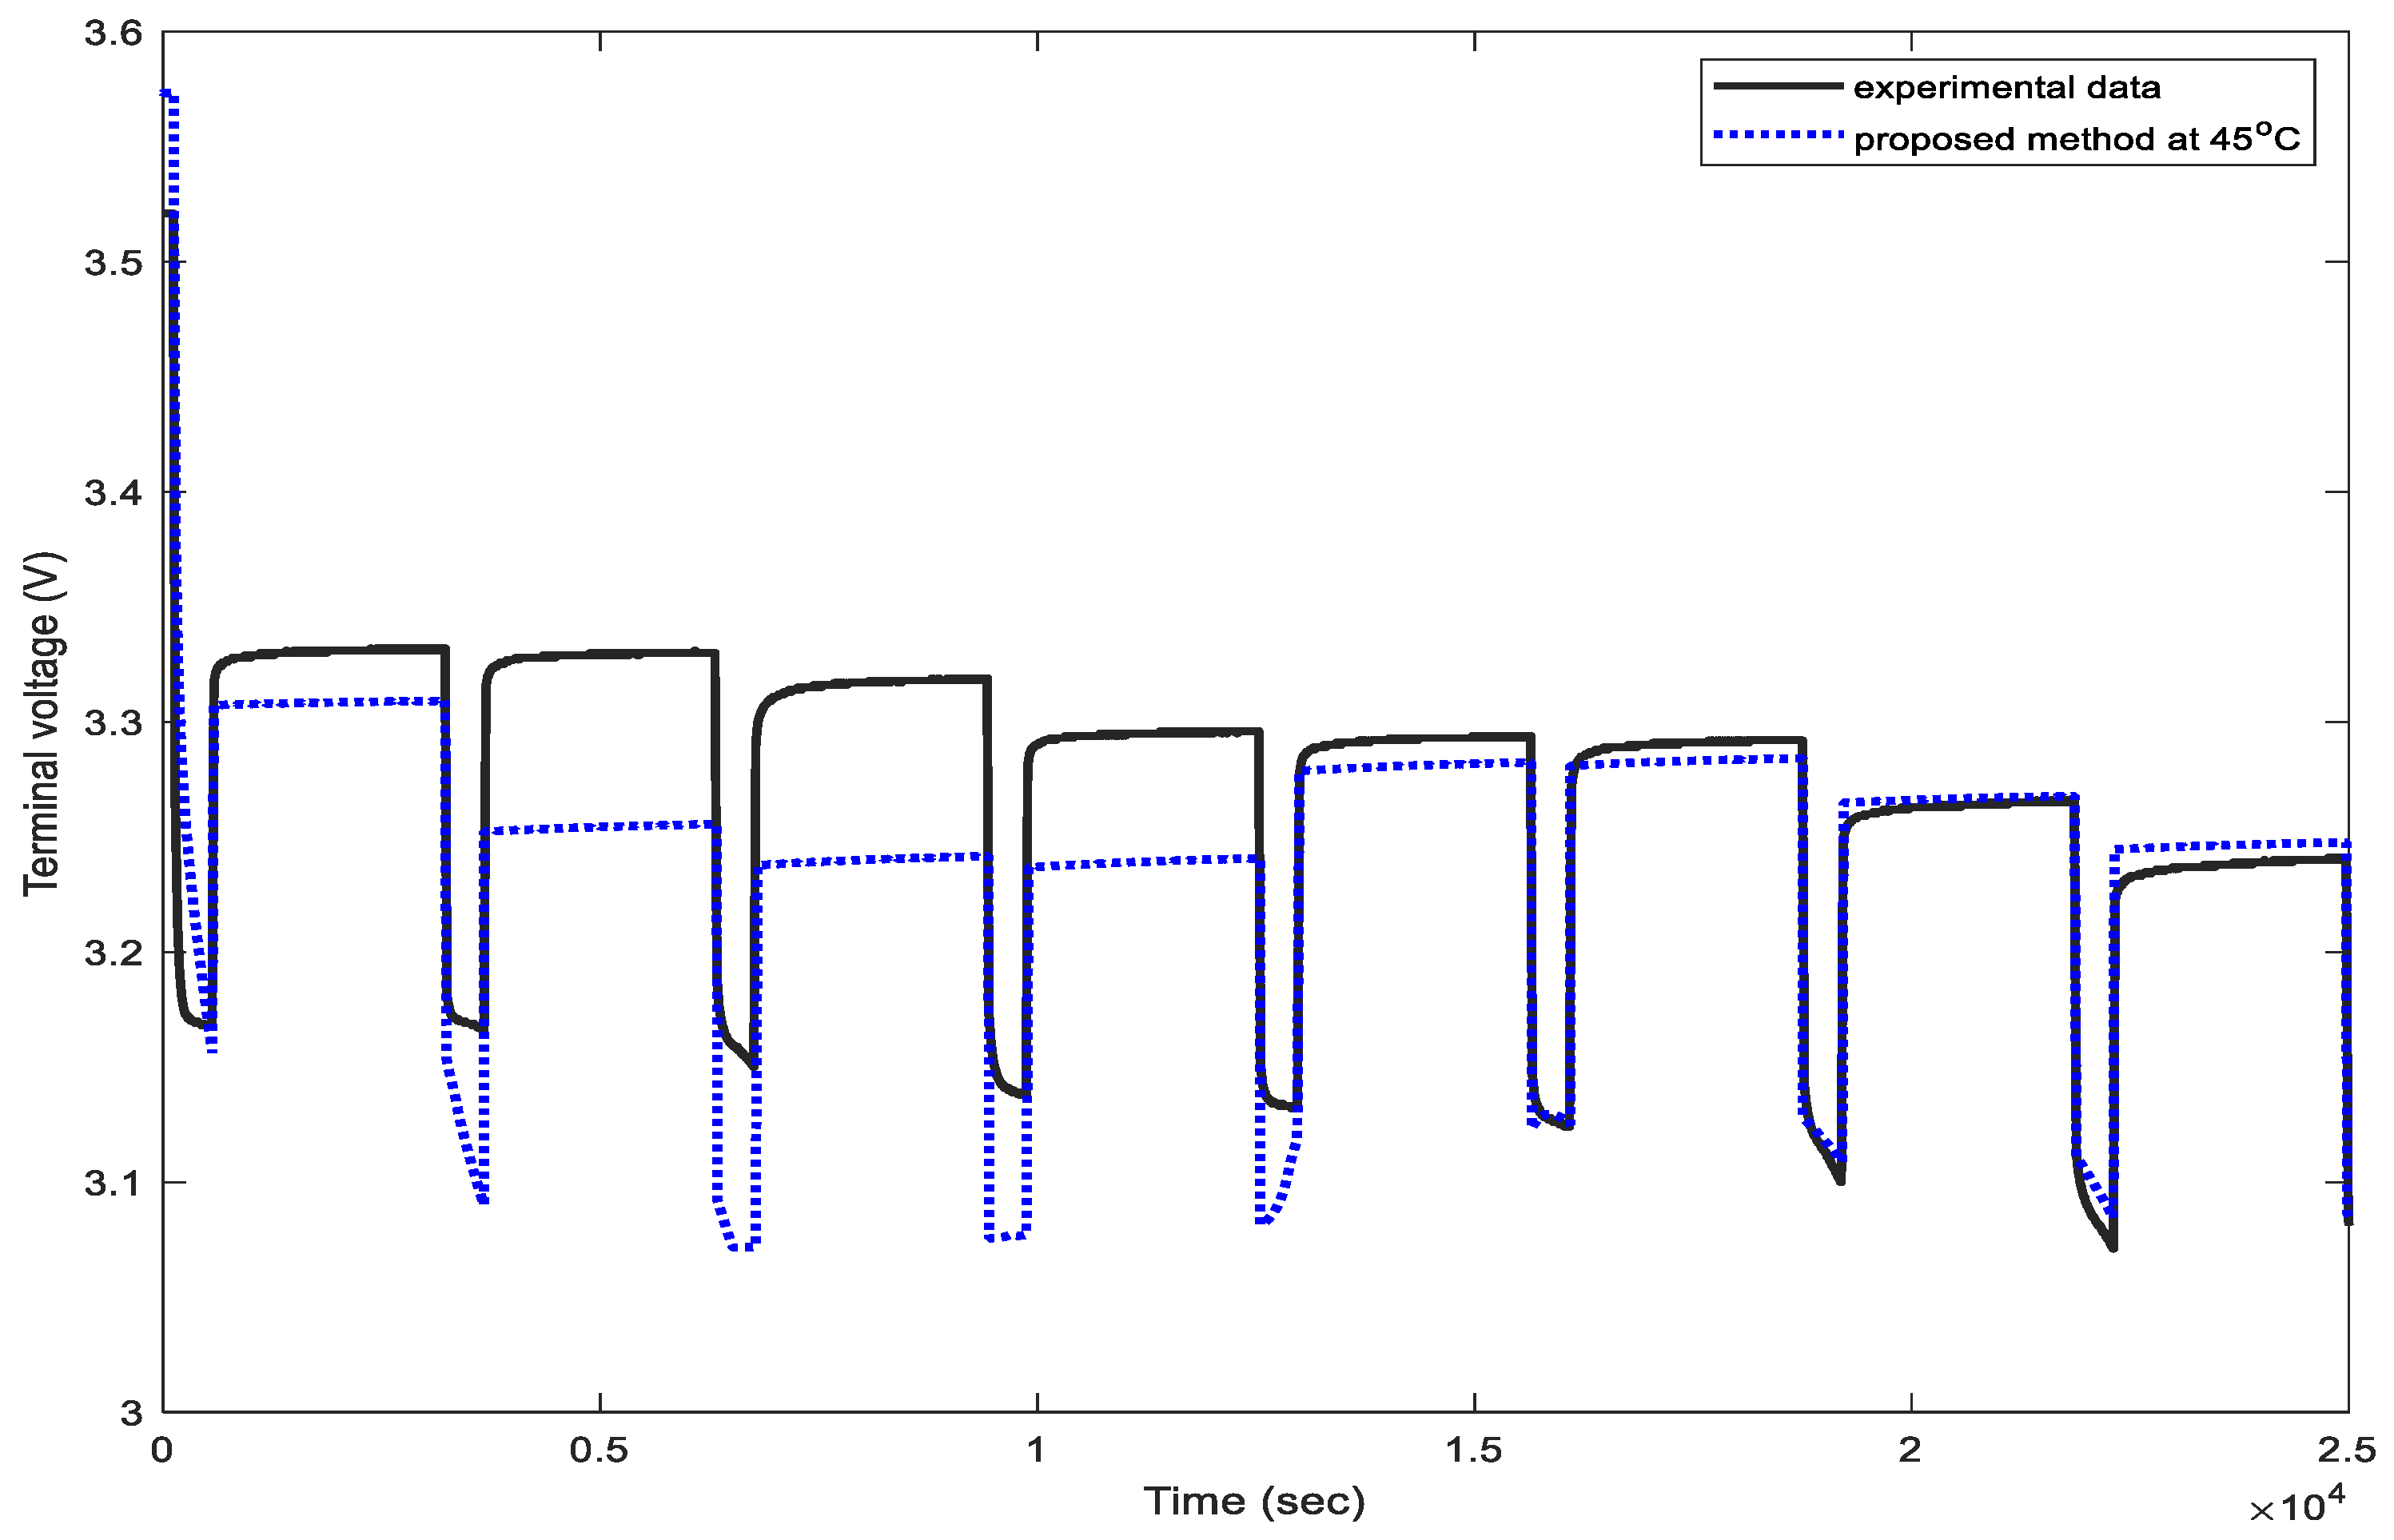
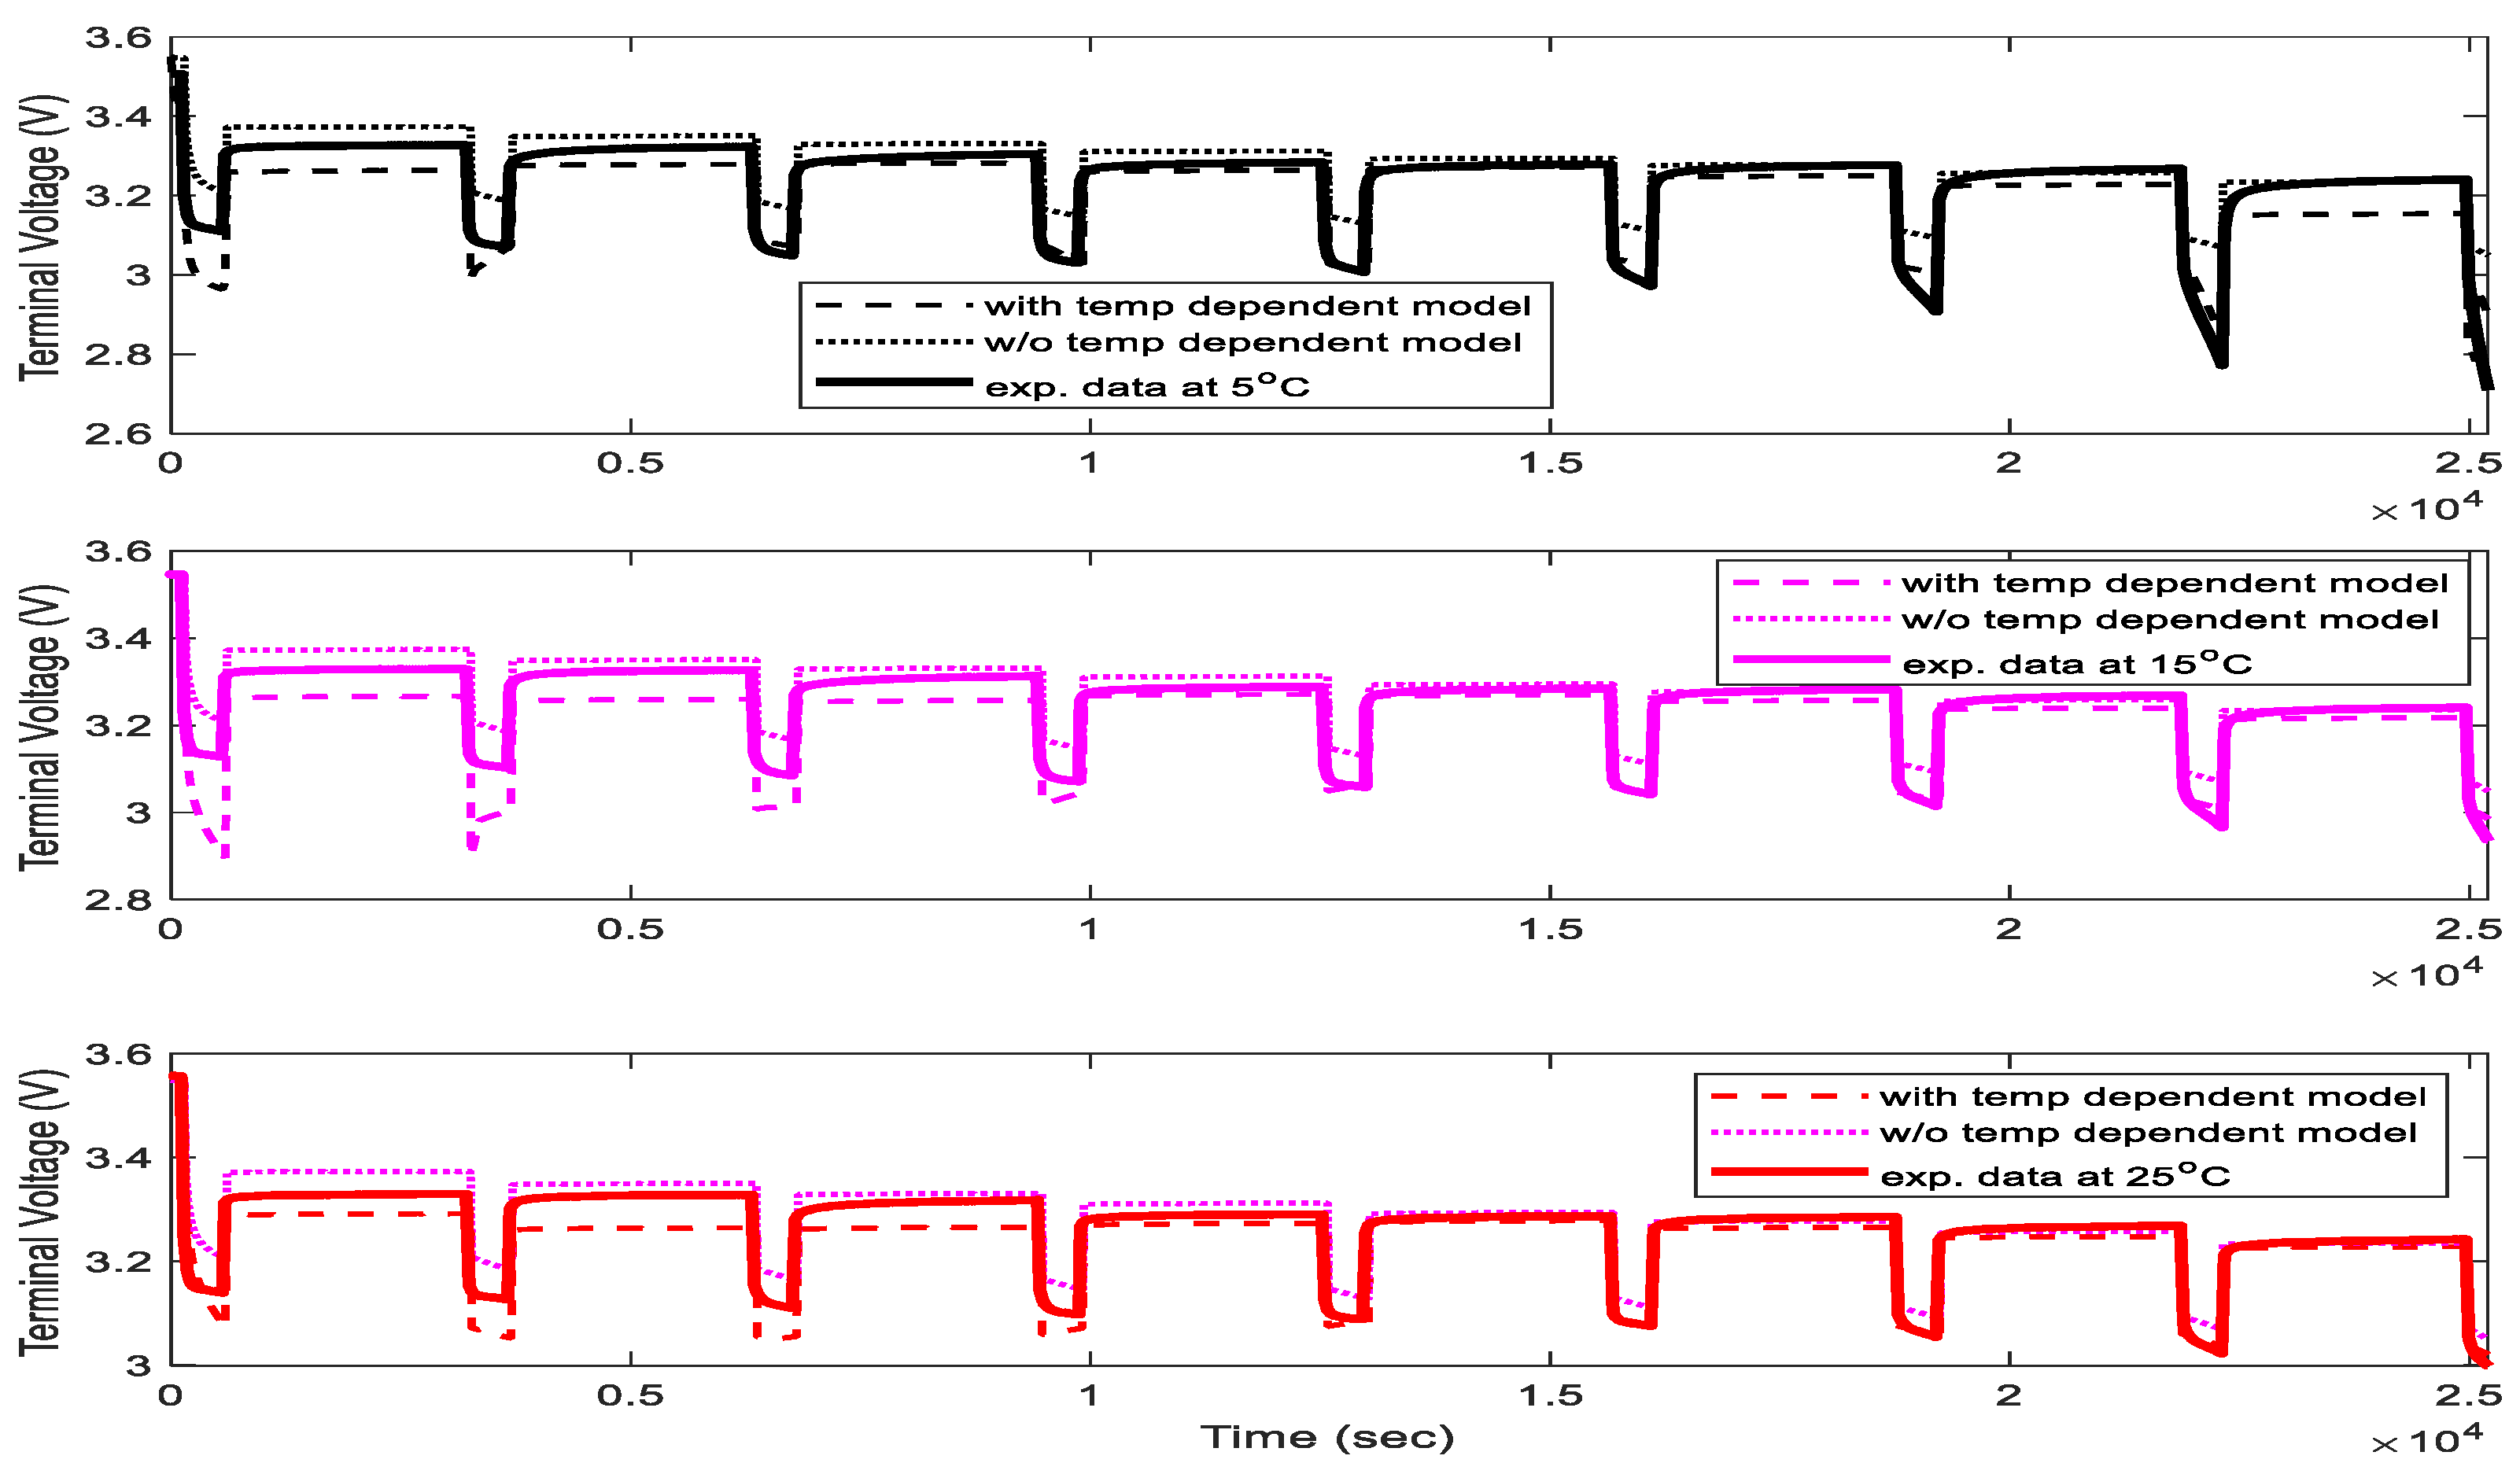
5. Cell Terminal Voltage Model

With U o c ( S O C , T c e l l ) and U t e m p ( T c e l l , T a m b ) obtained, the terminal voltage, U t of the battery cell in (4) can be numerically computed using the simulation block diagram as shown in Figure 14. As seen in Figure 15, Figure 16, Figure 17, Figure 18 and Figure 19, the terminal voltage at different ambient temperatures such as 5 °C, 15 °C, 25 °C, 35 °C, and 45 °C is plotted. It can be observed that the simulated terminal voltage matches experimental data near to the end of the discharging cycle or lower SOC value. The root means square errors (RMSEs) at each ambient temperature are tabulated in Table 2. The maximum error in the terminal voltage as compared with the actual data is around 0.0663 V. Note that the RMSE can be further improved by tuning the parameters in U o c and U t e m p in (6) and (7), respectively.

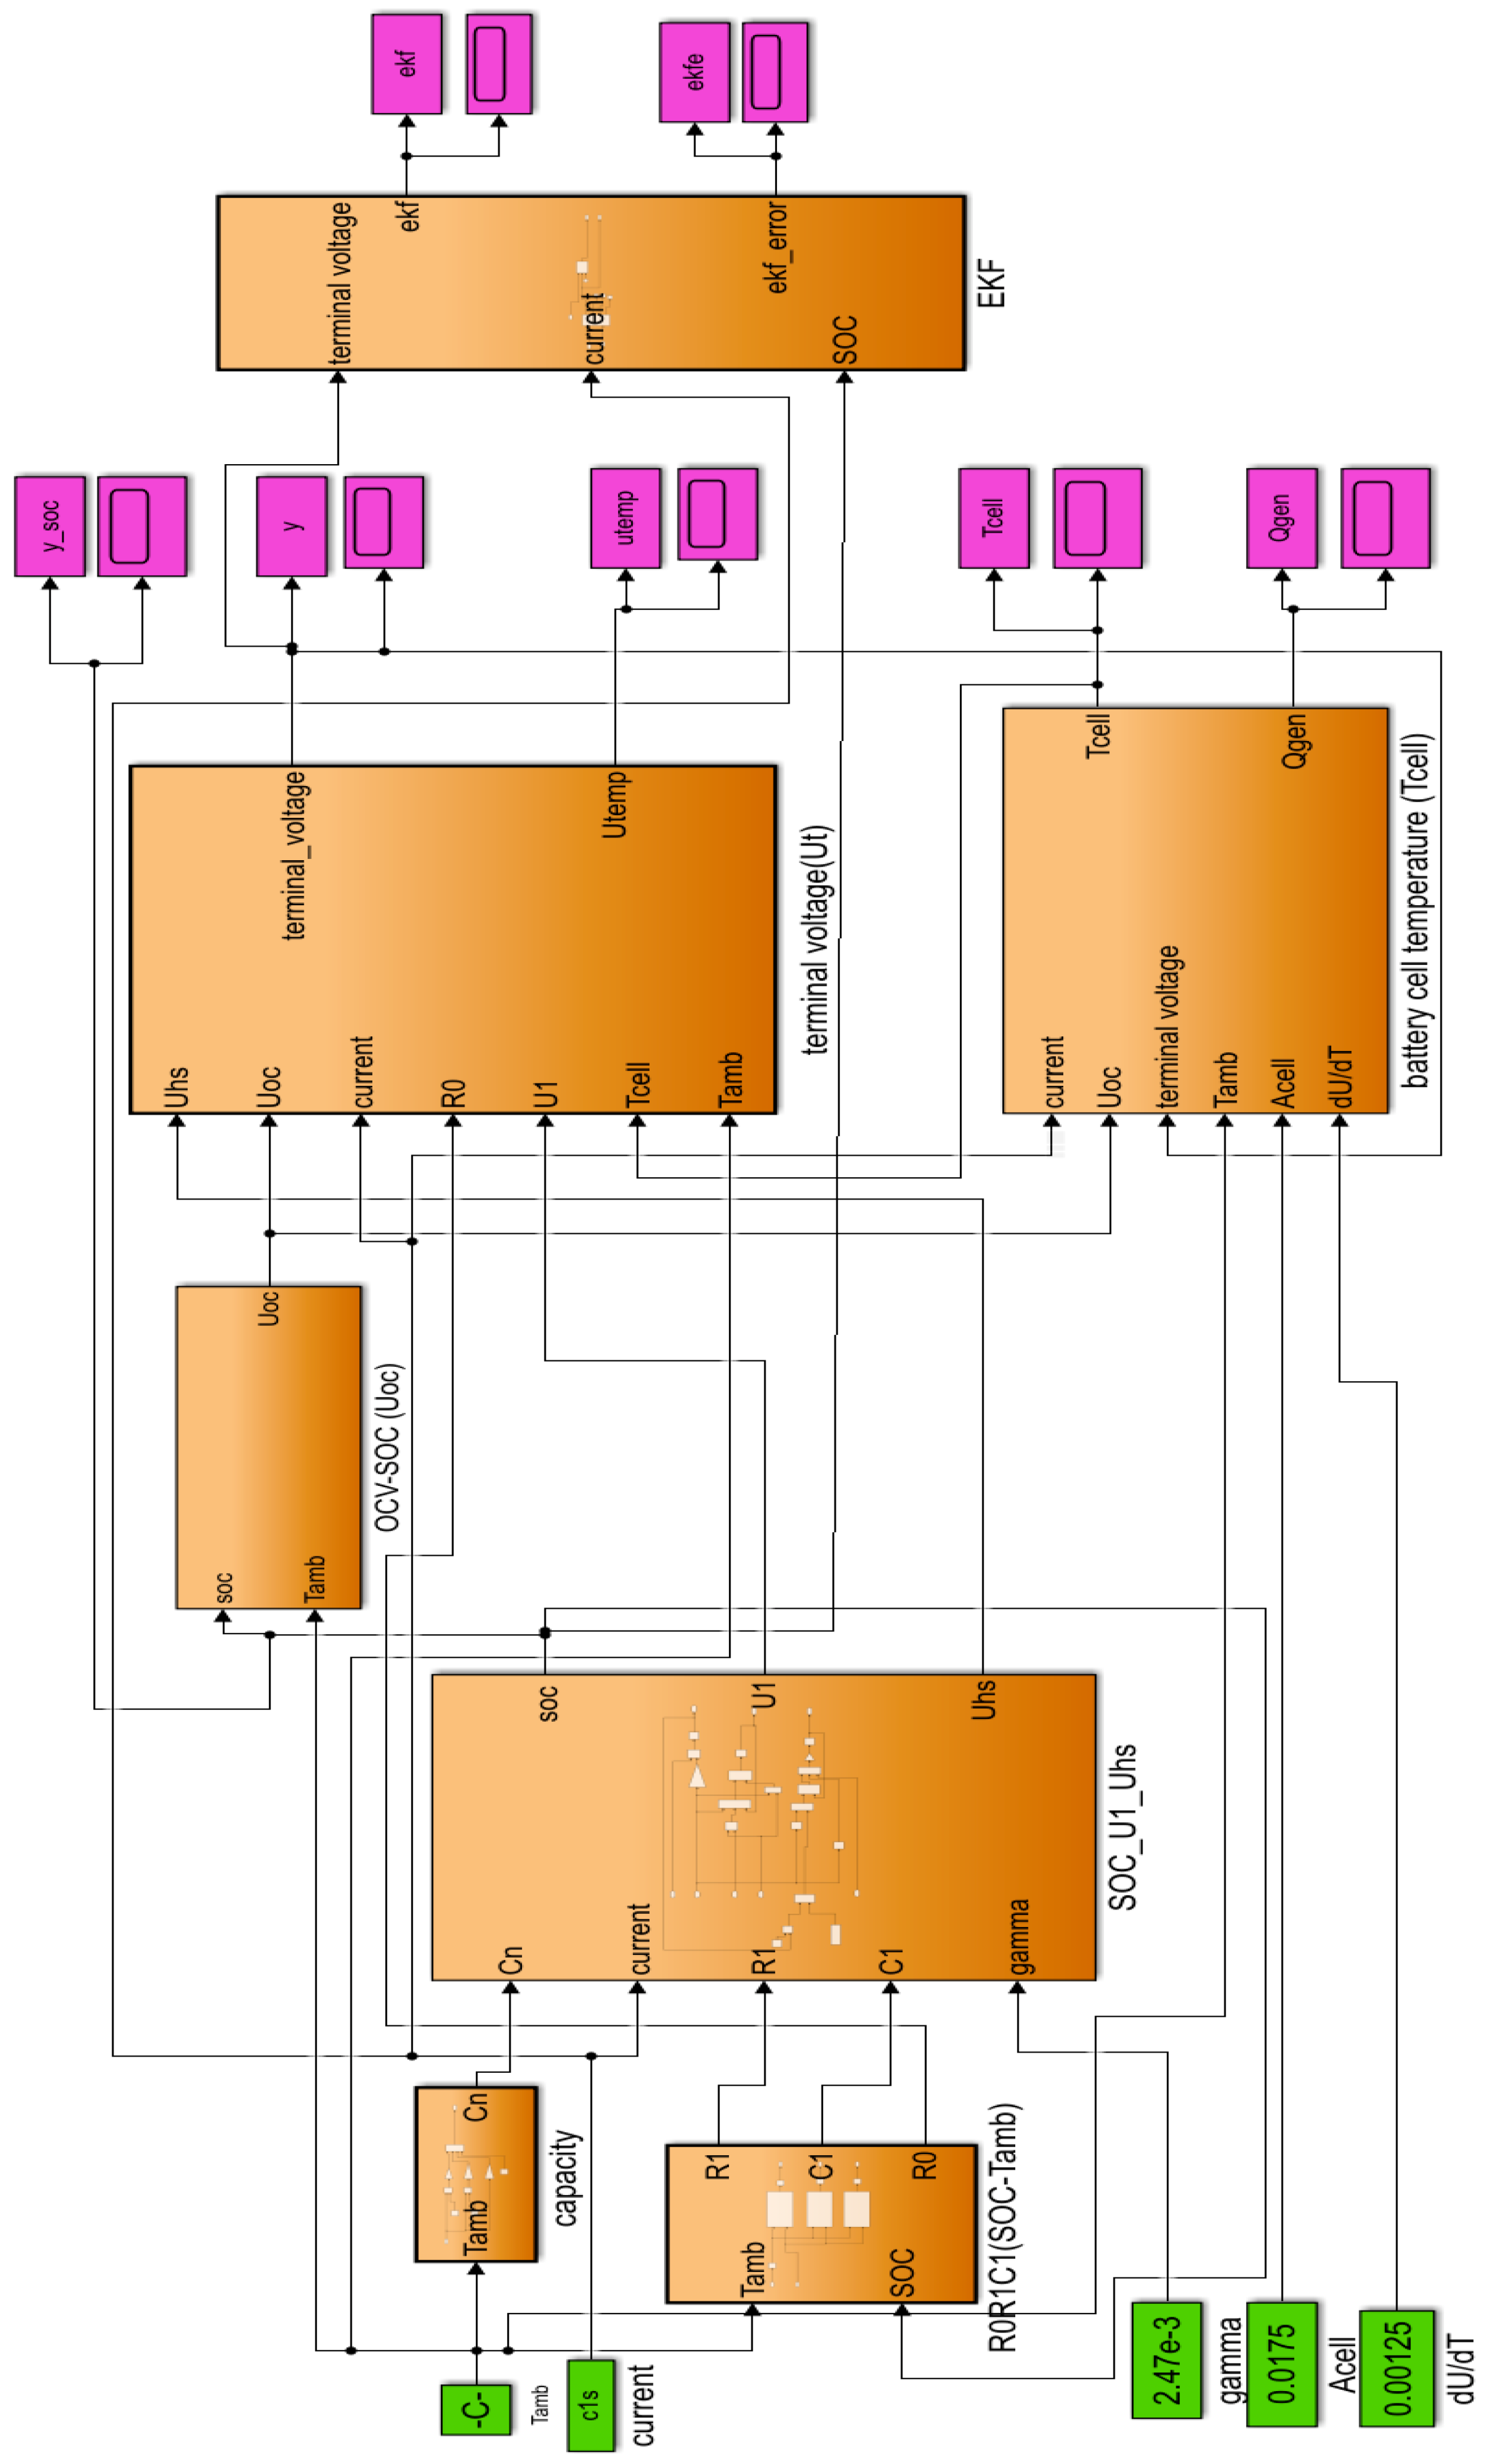
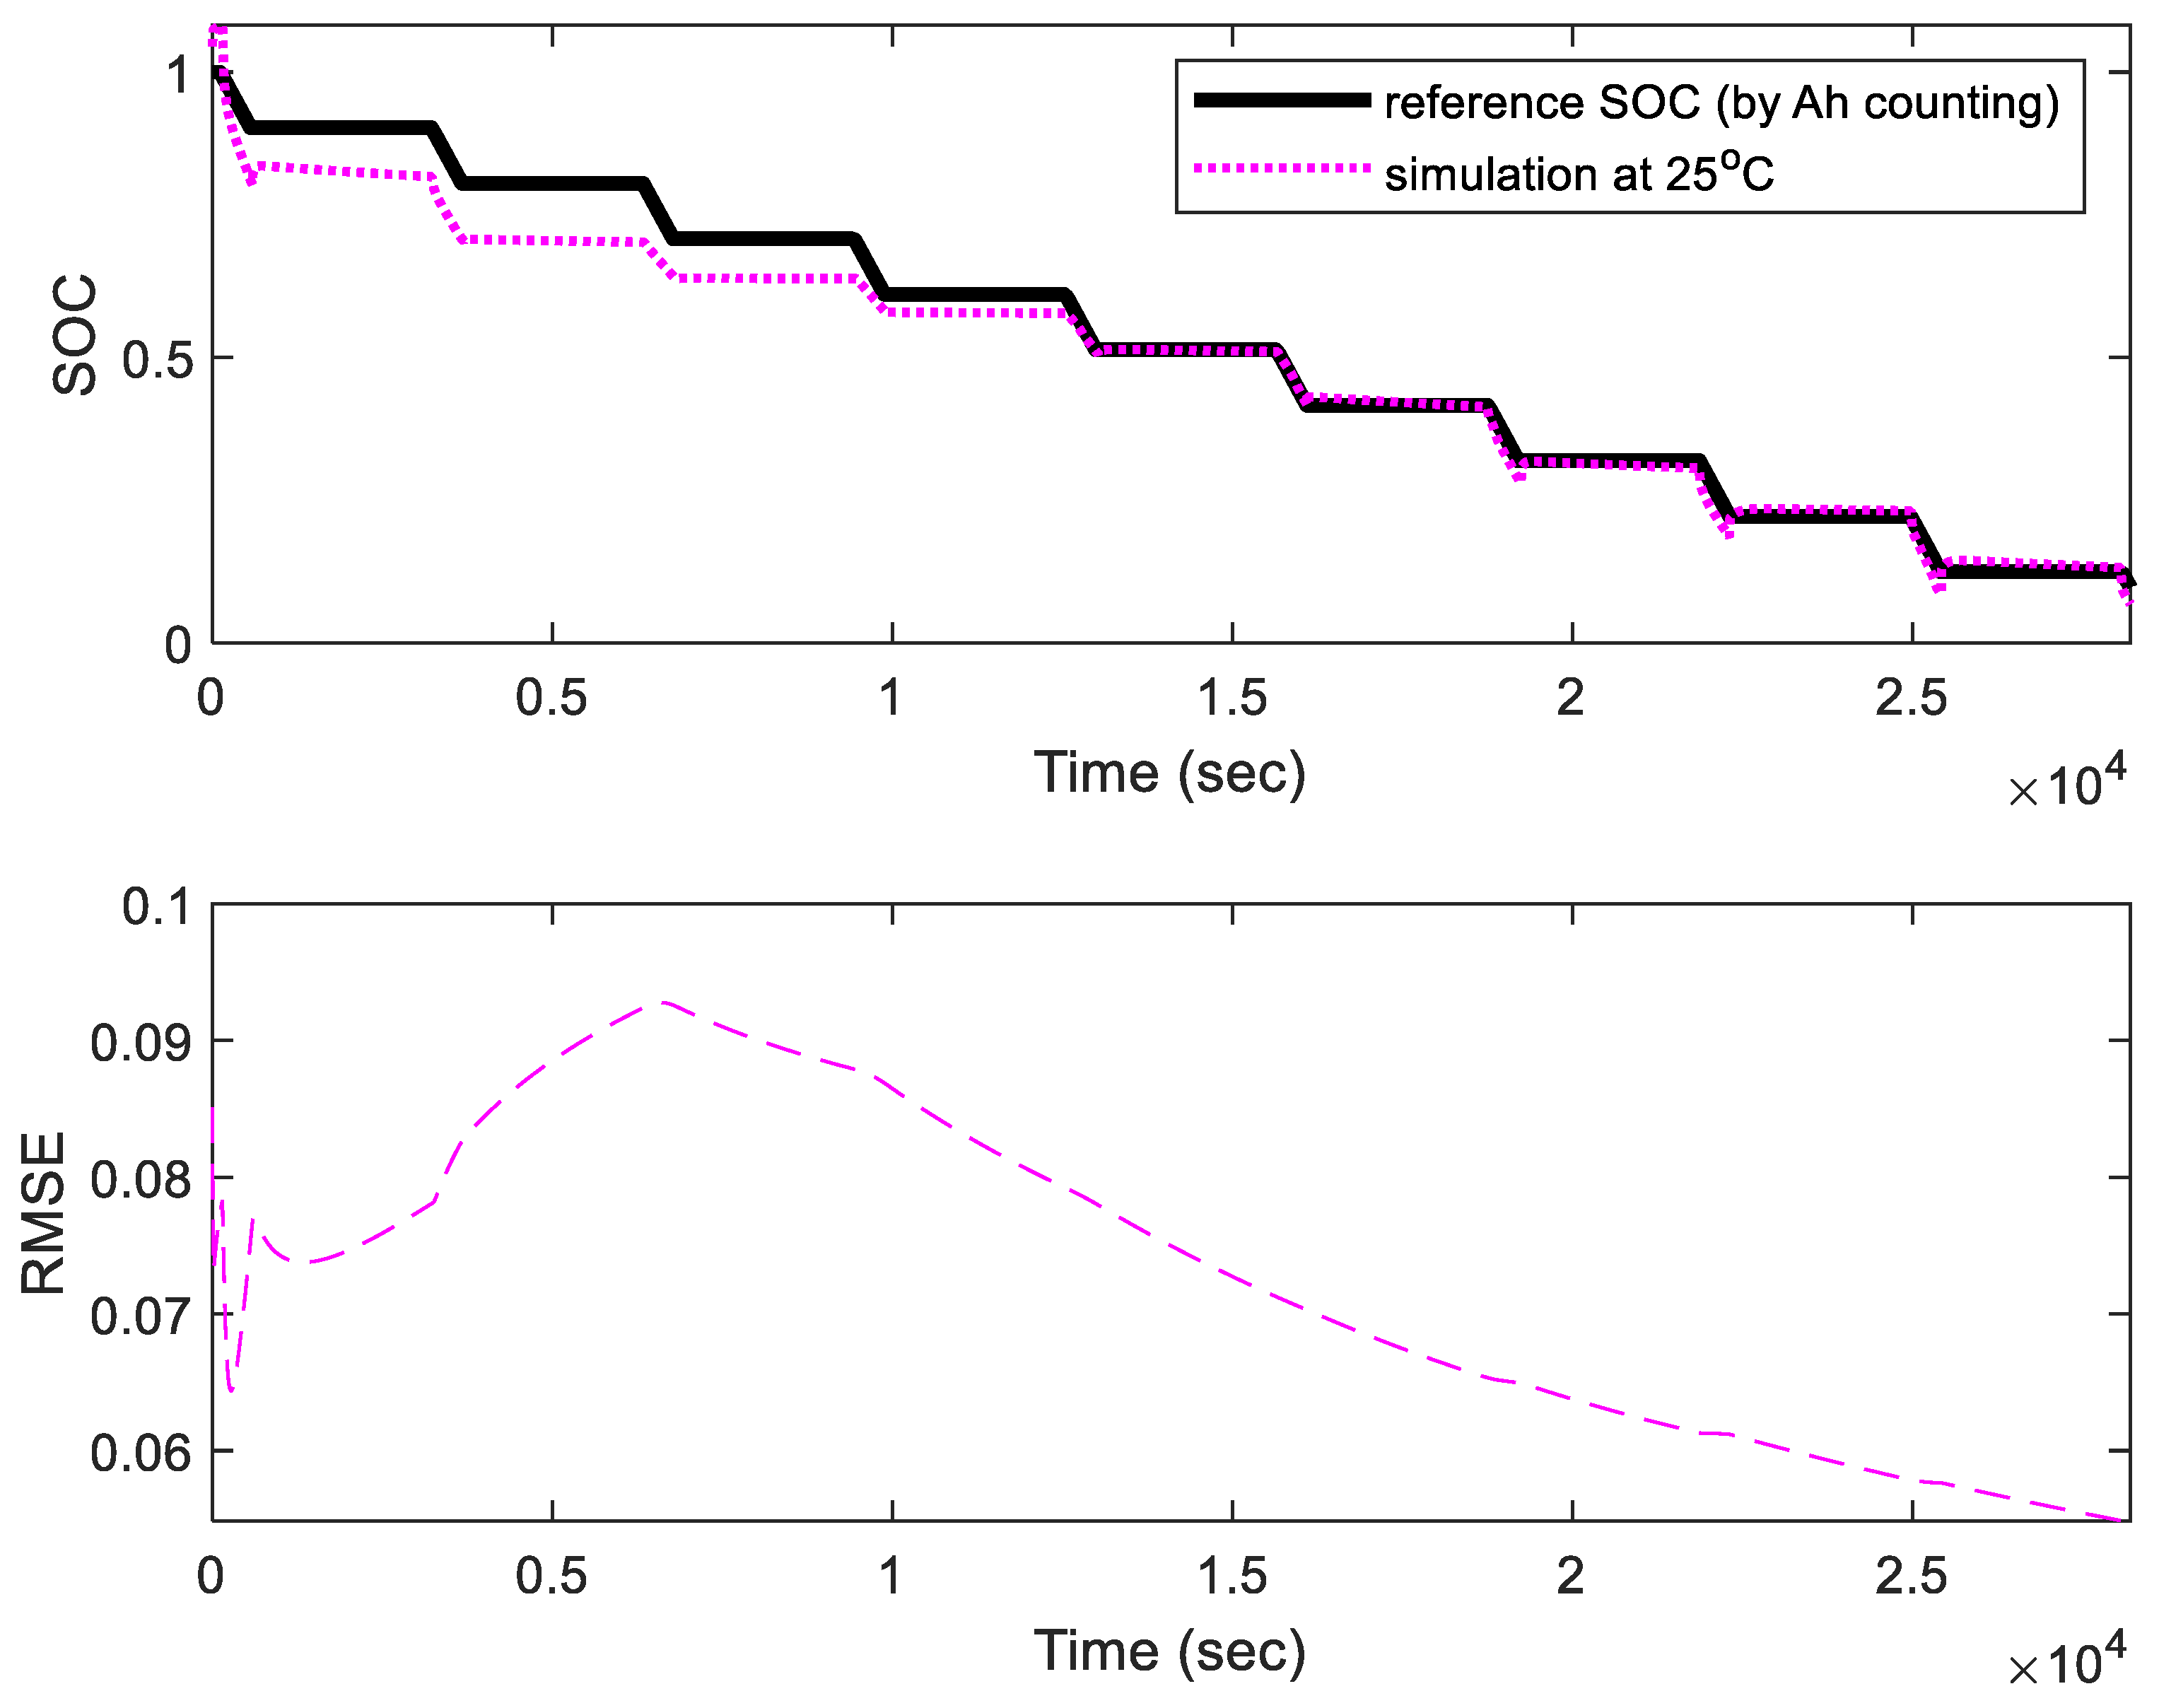
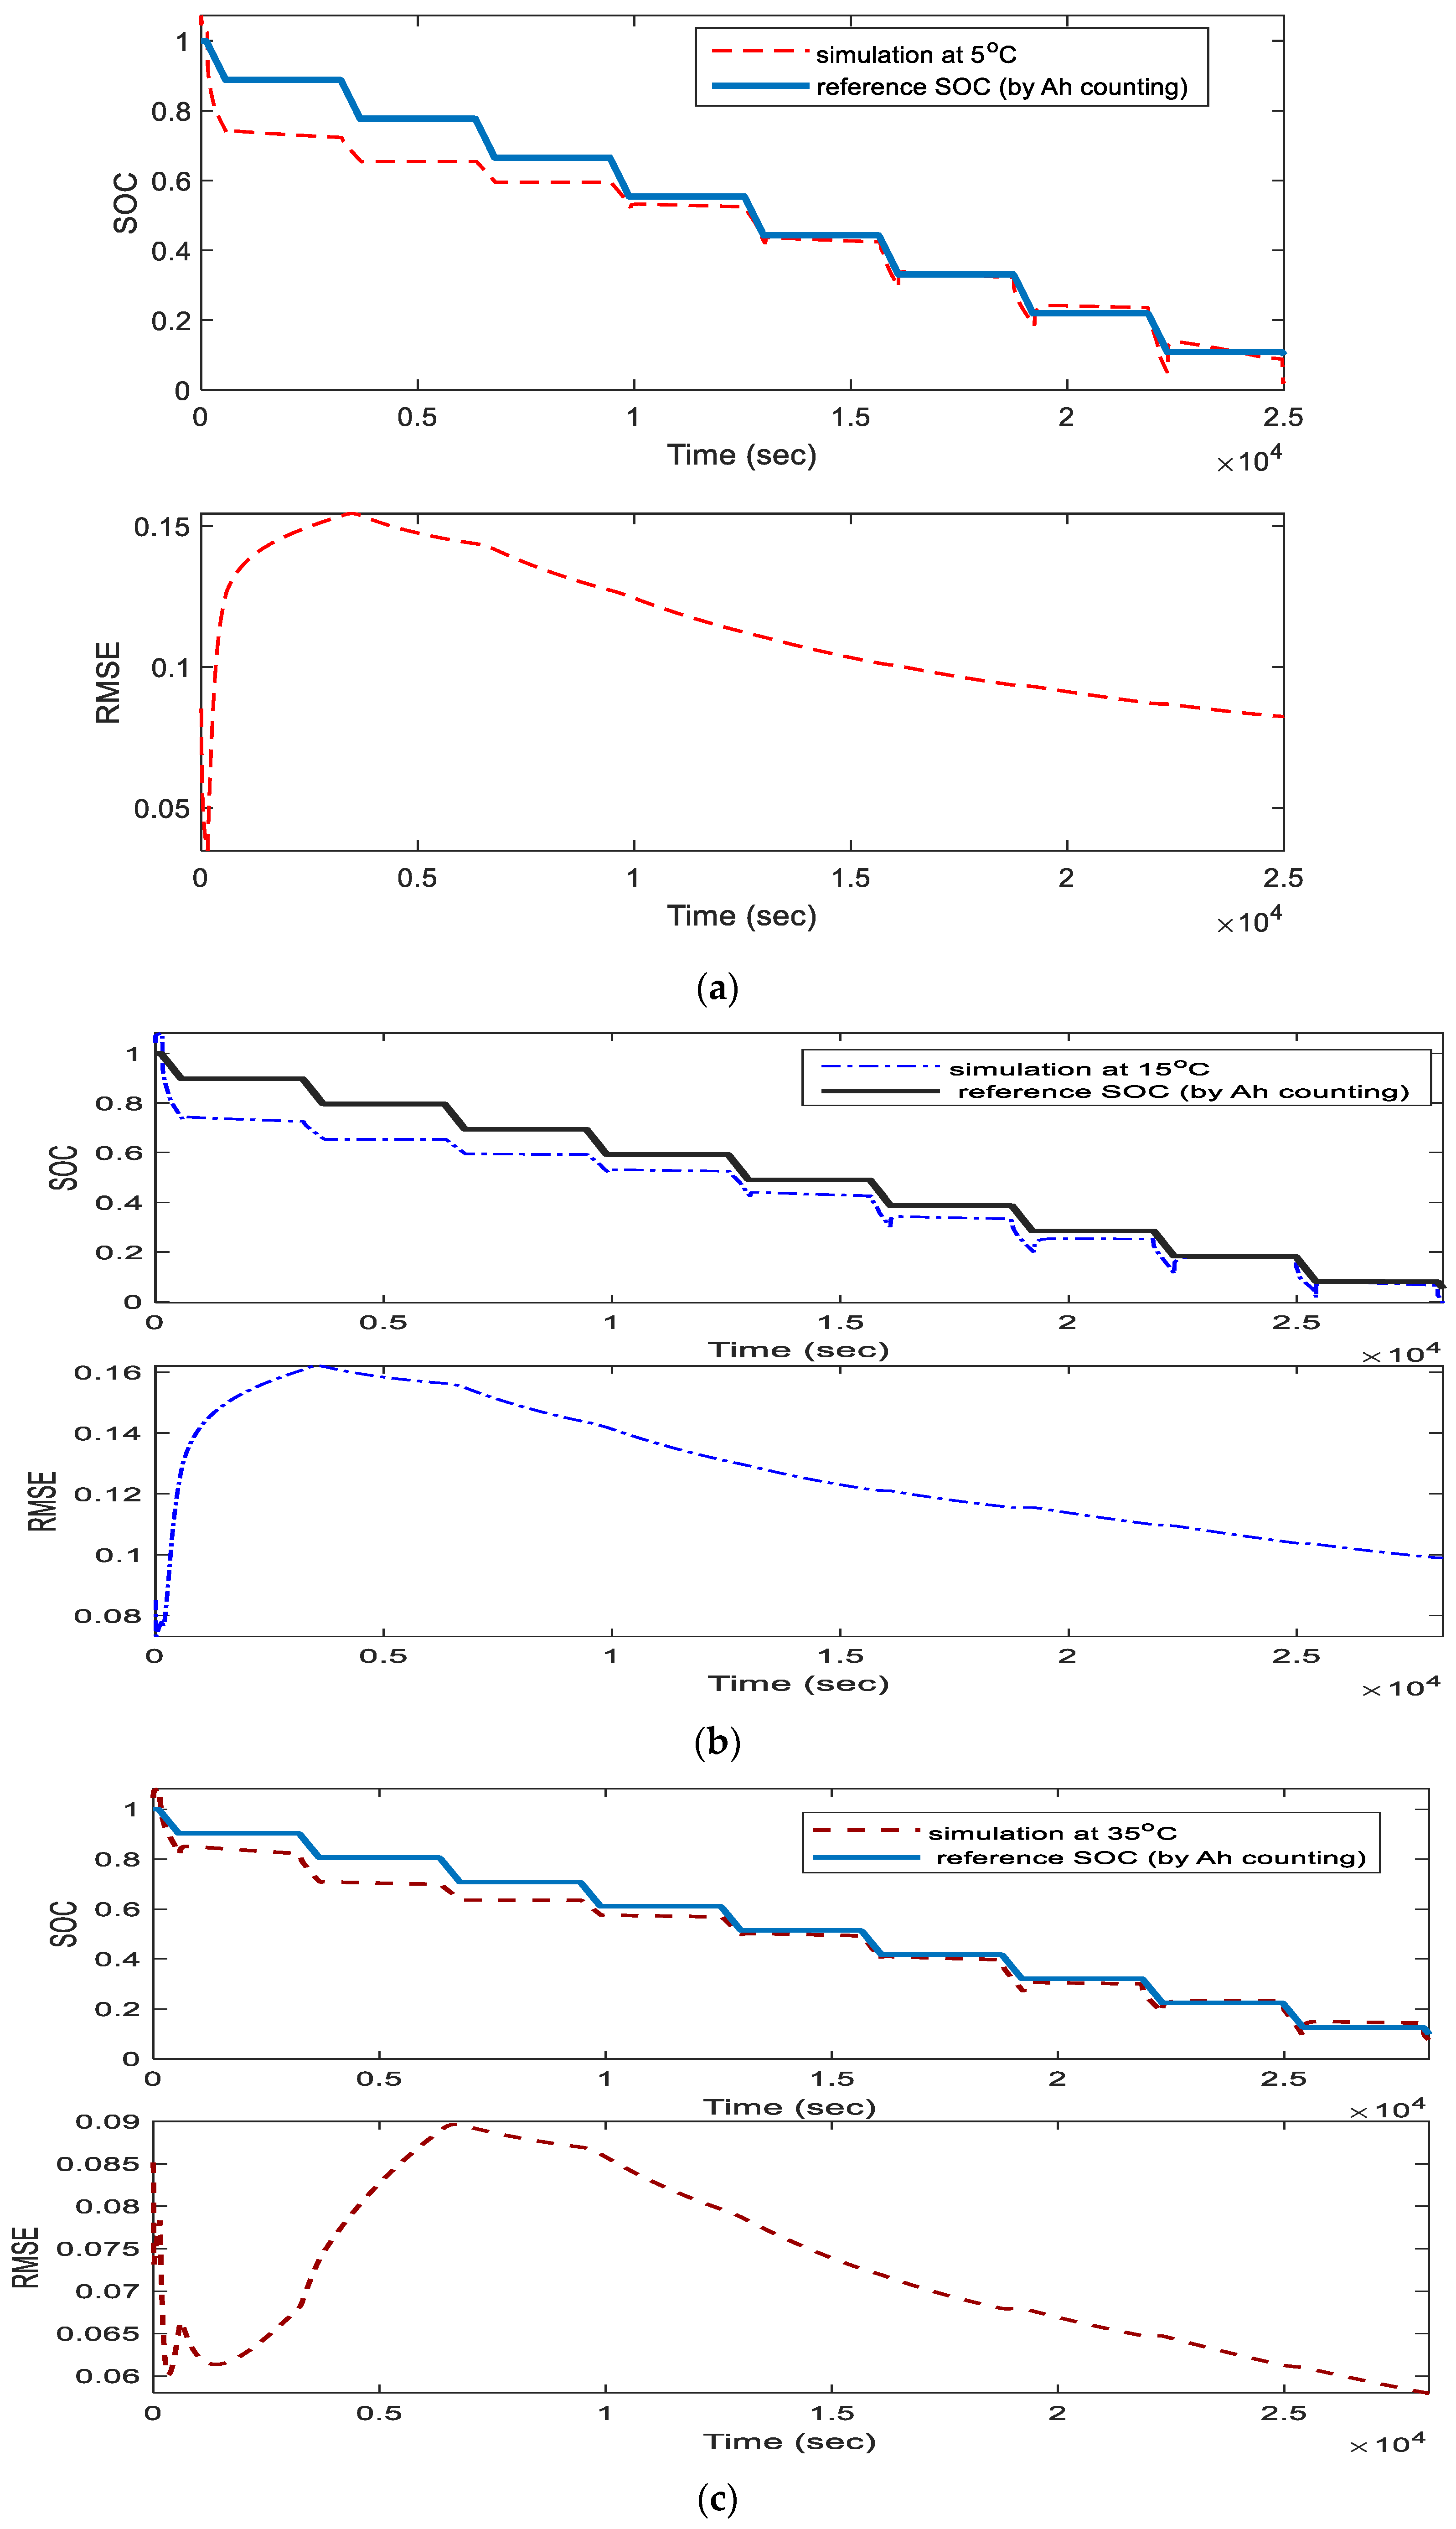
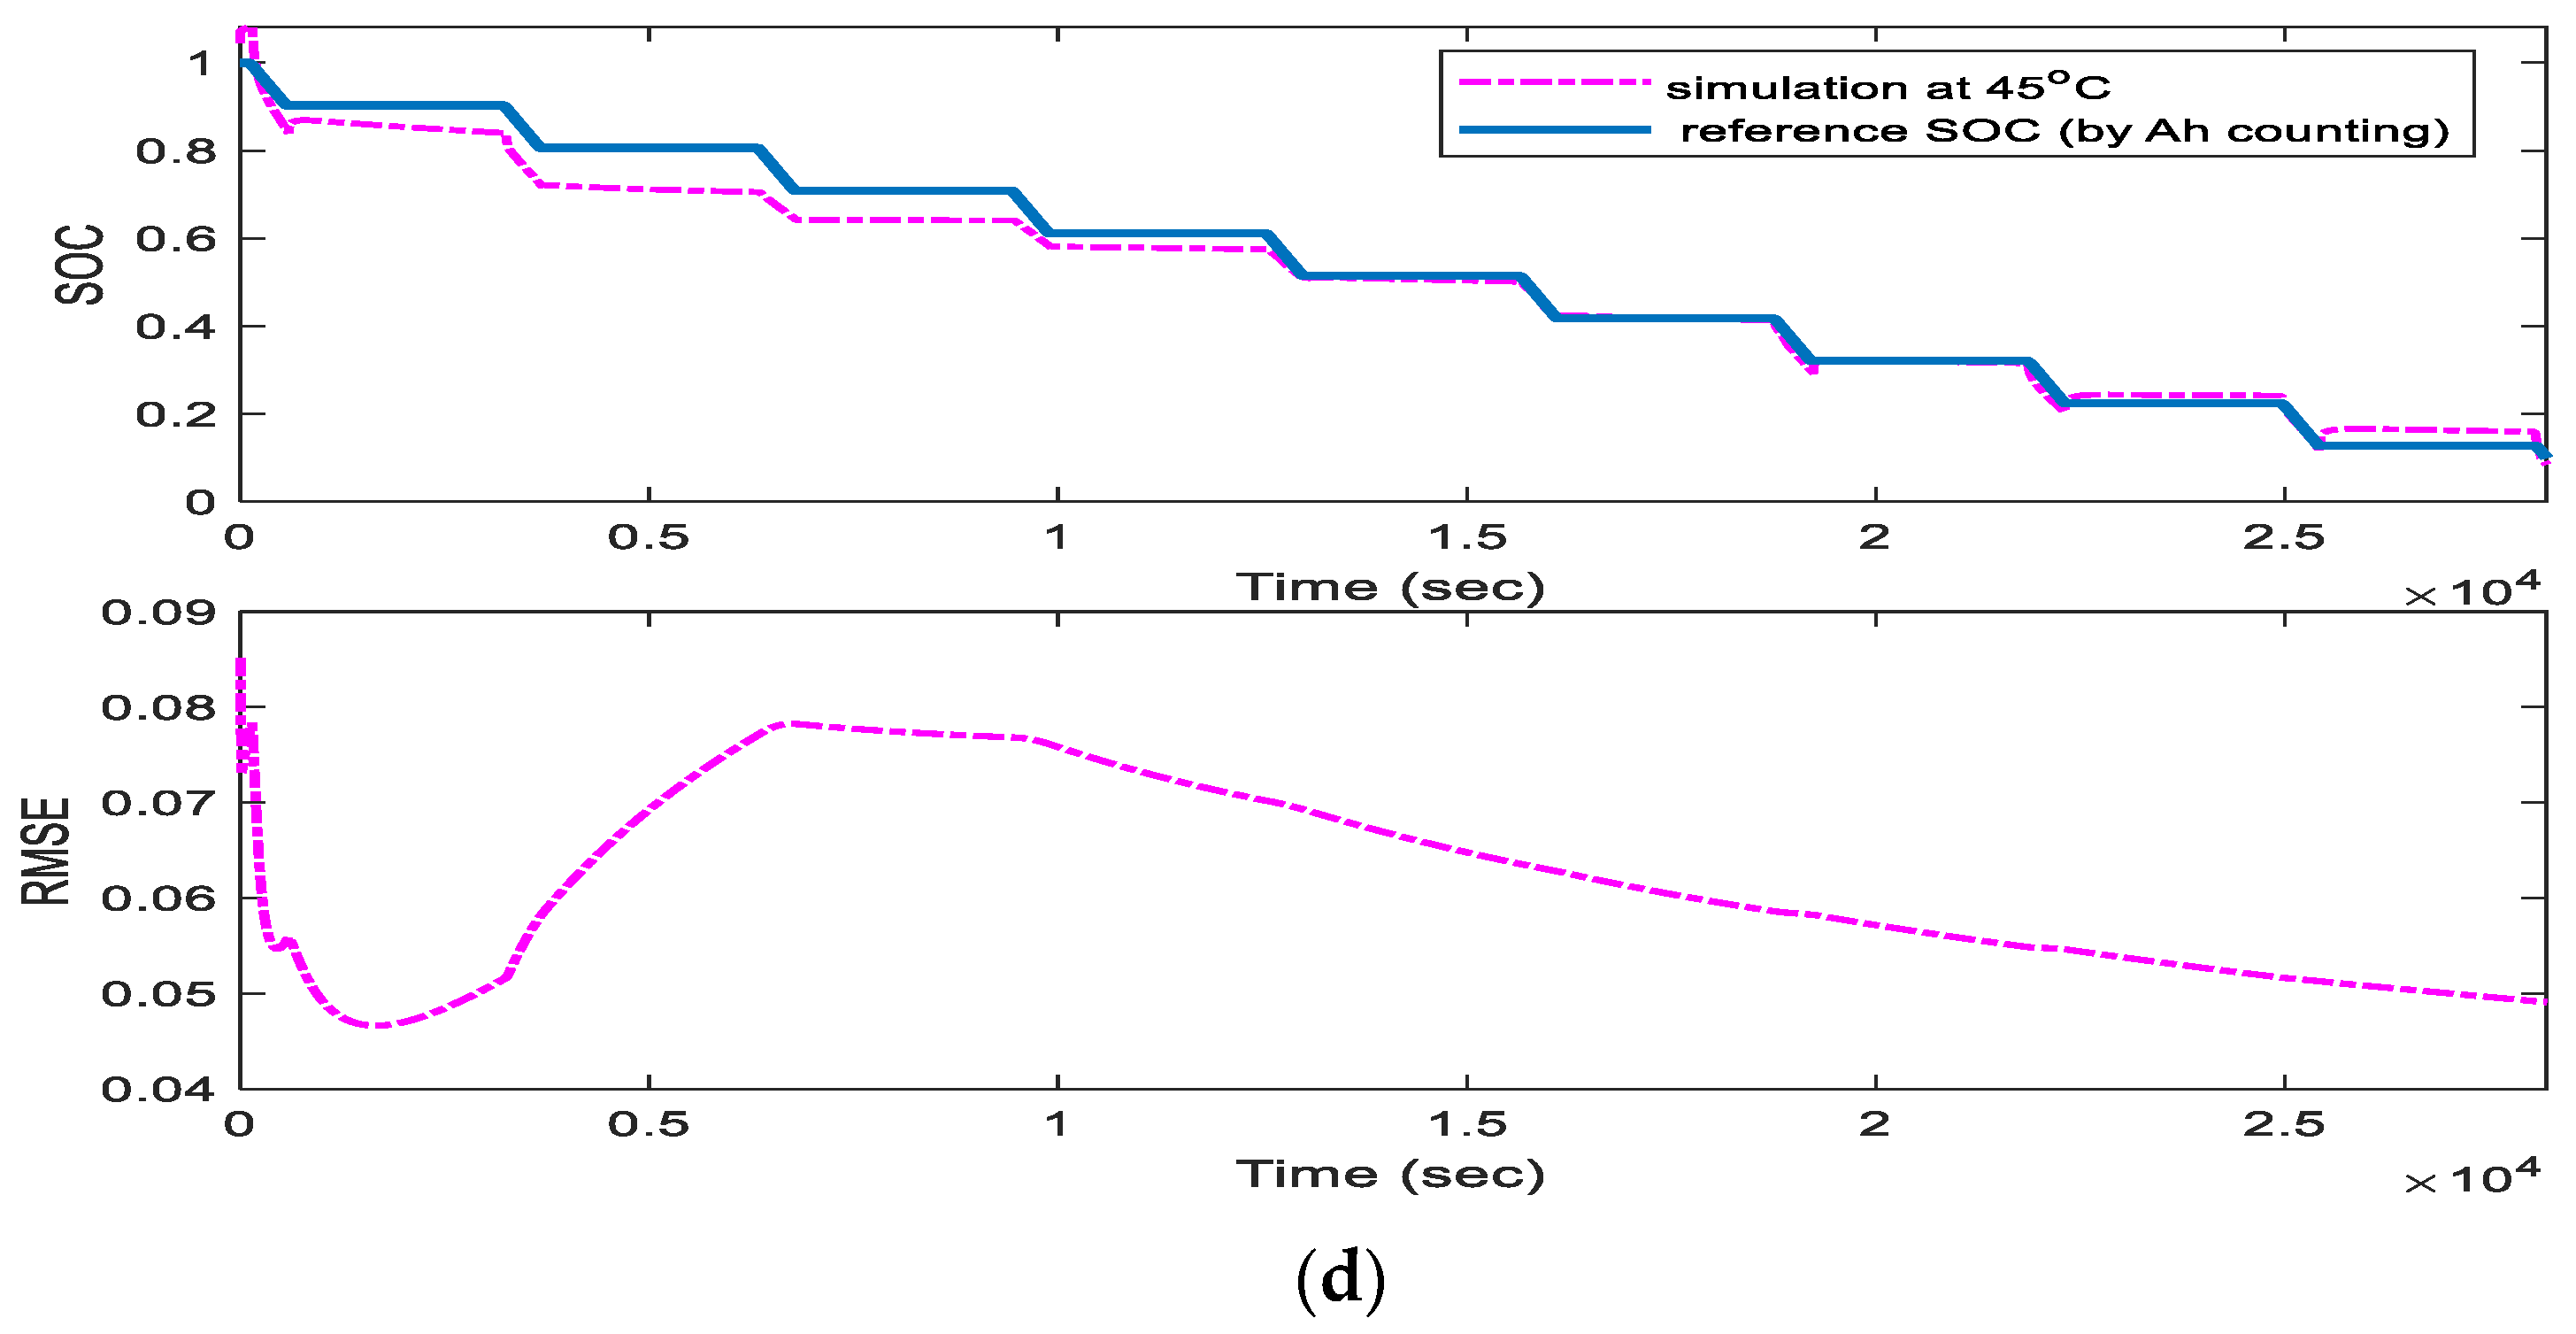
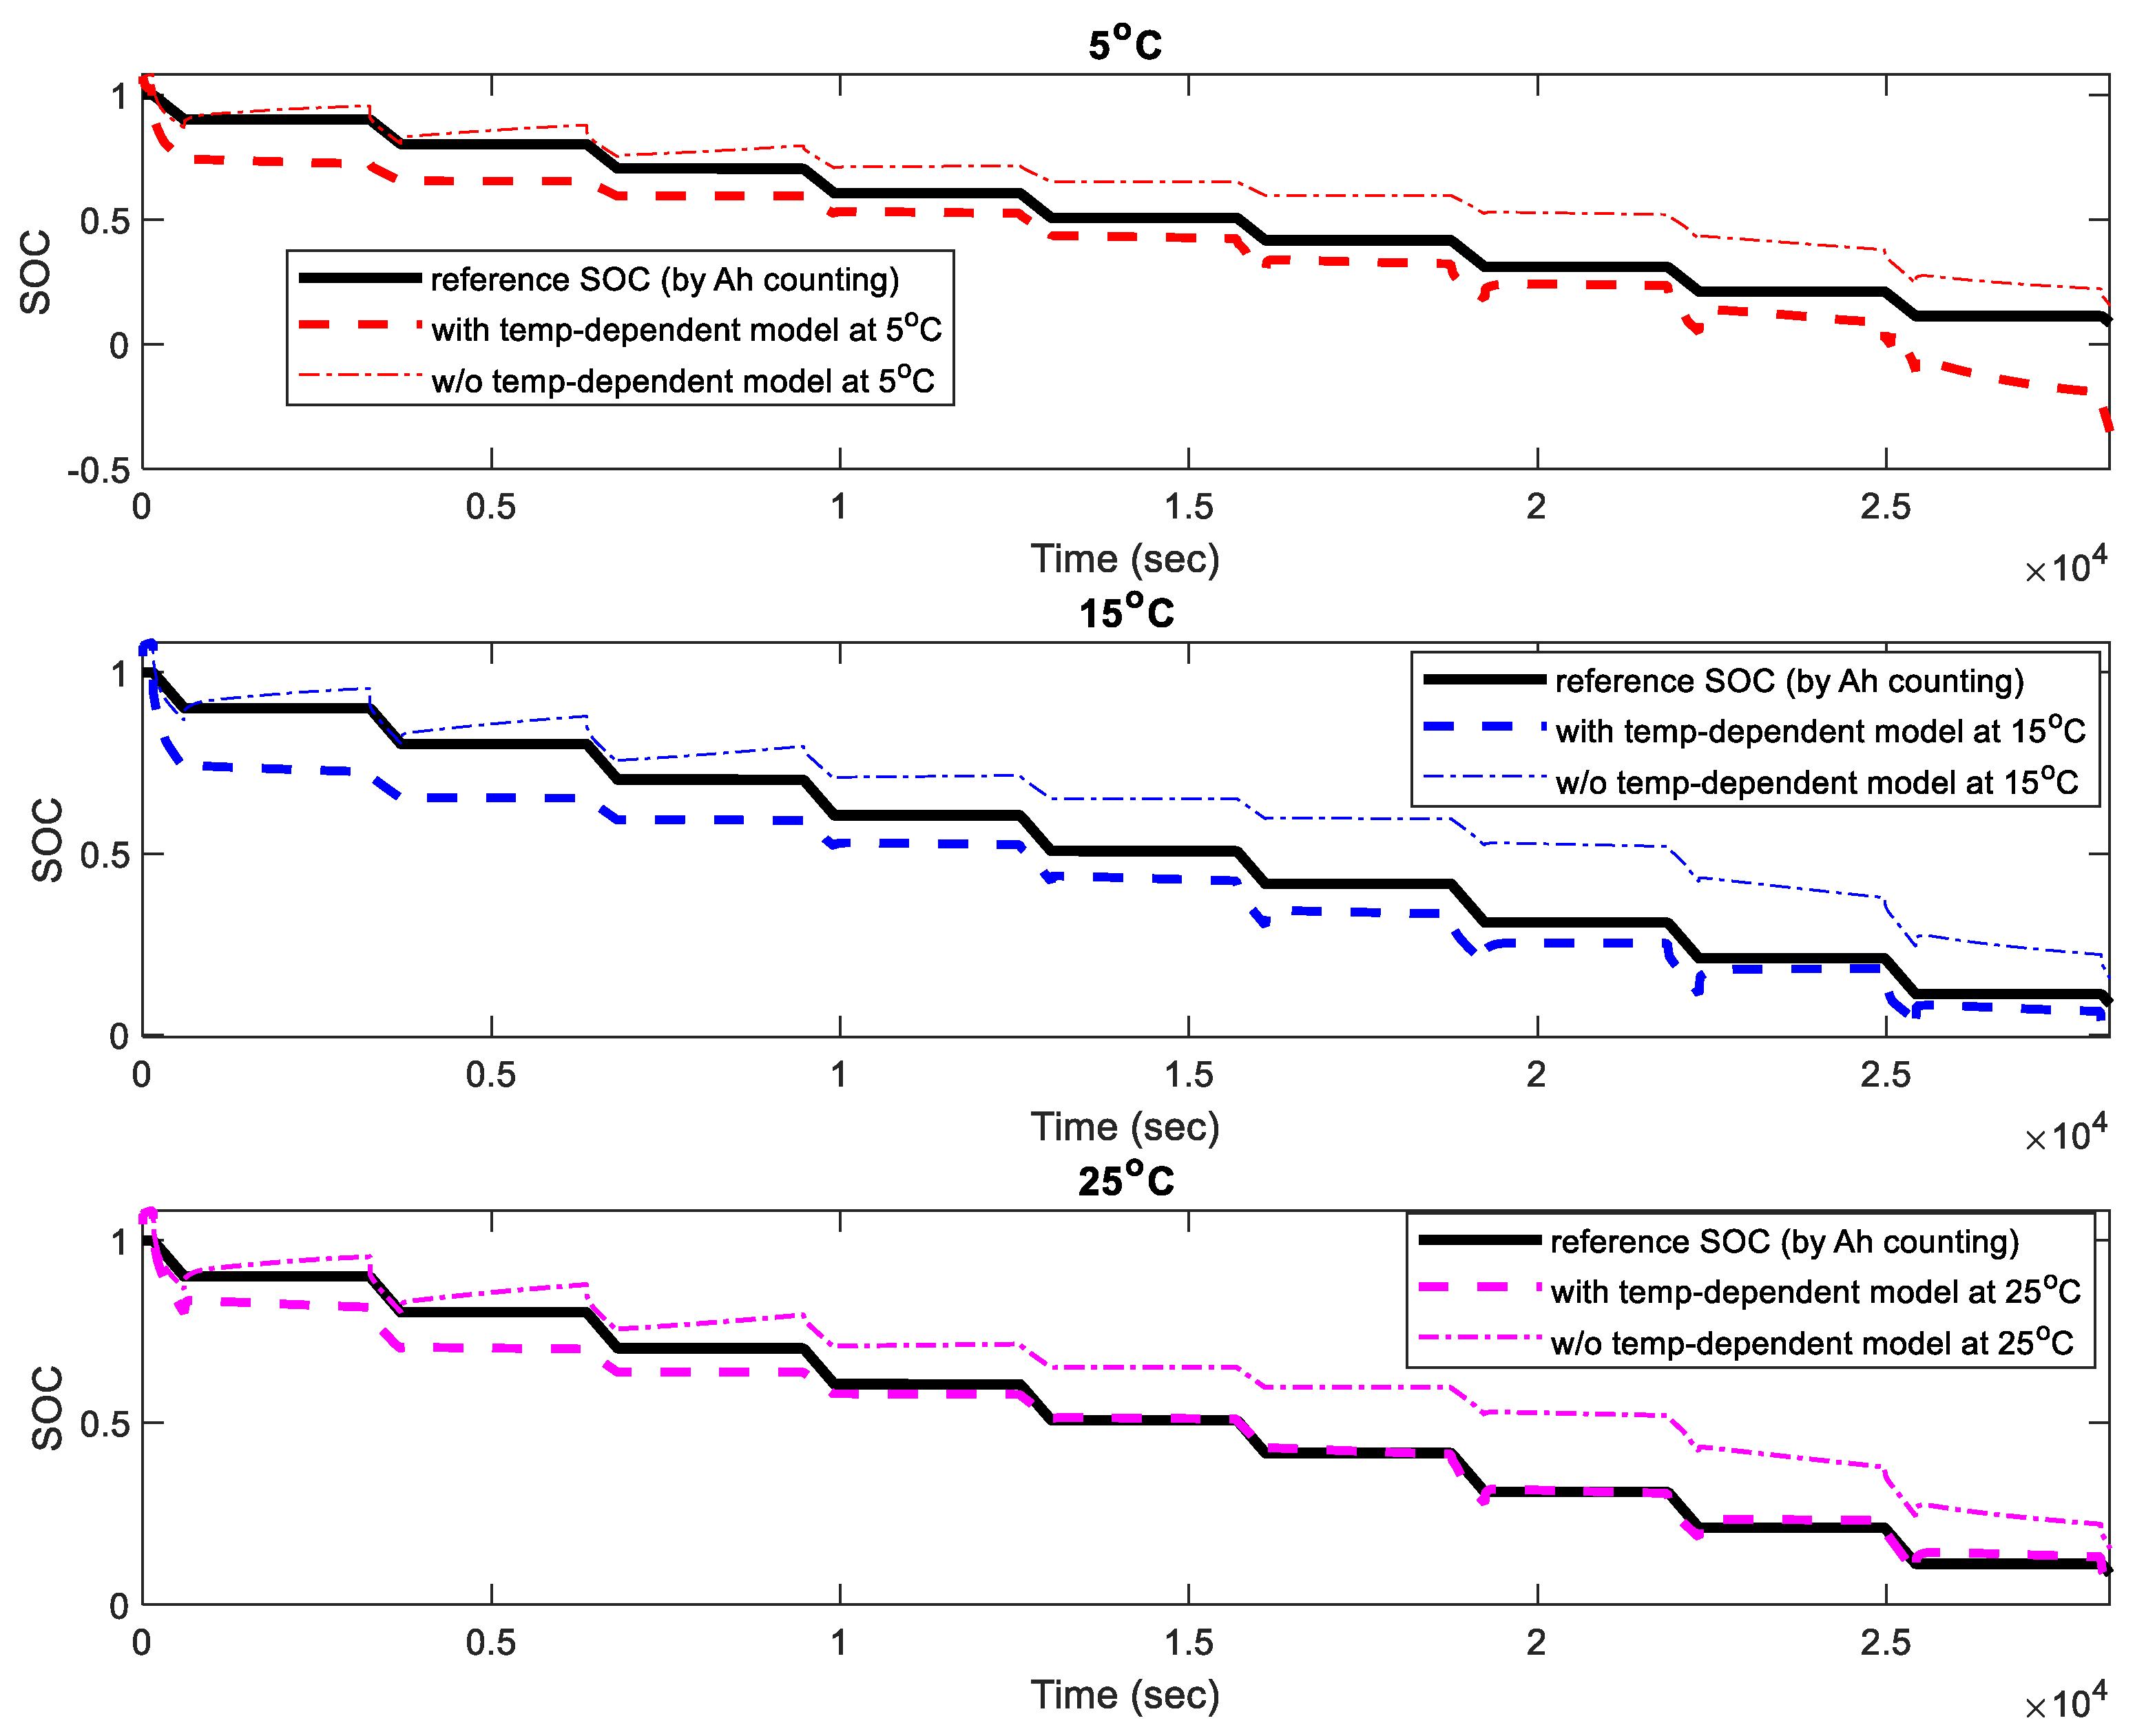
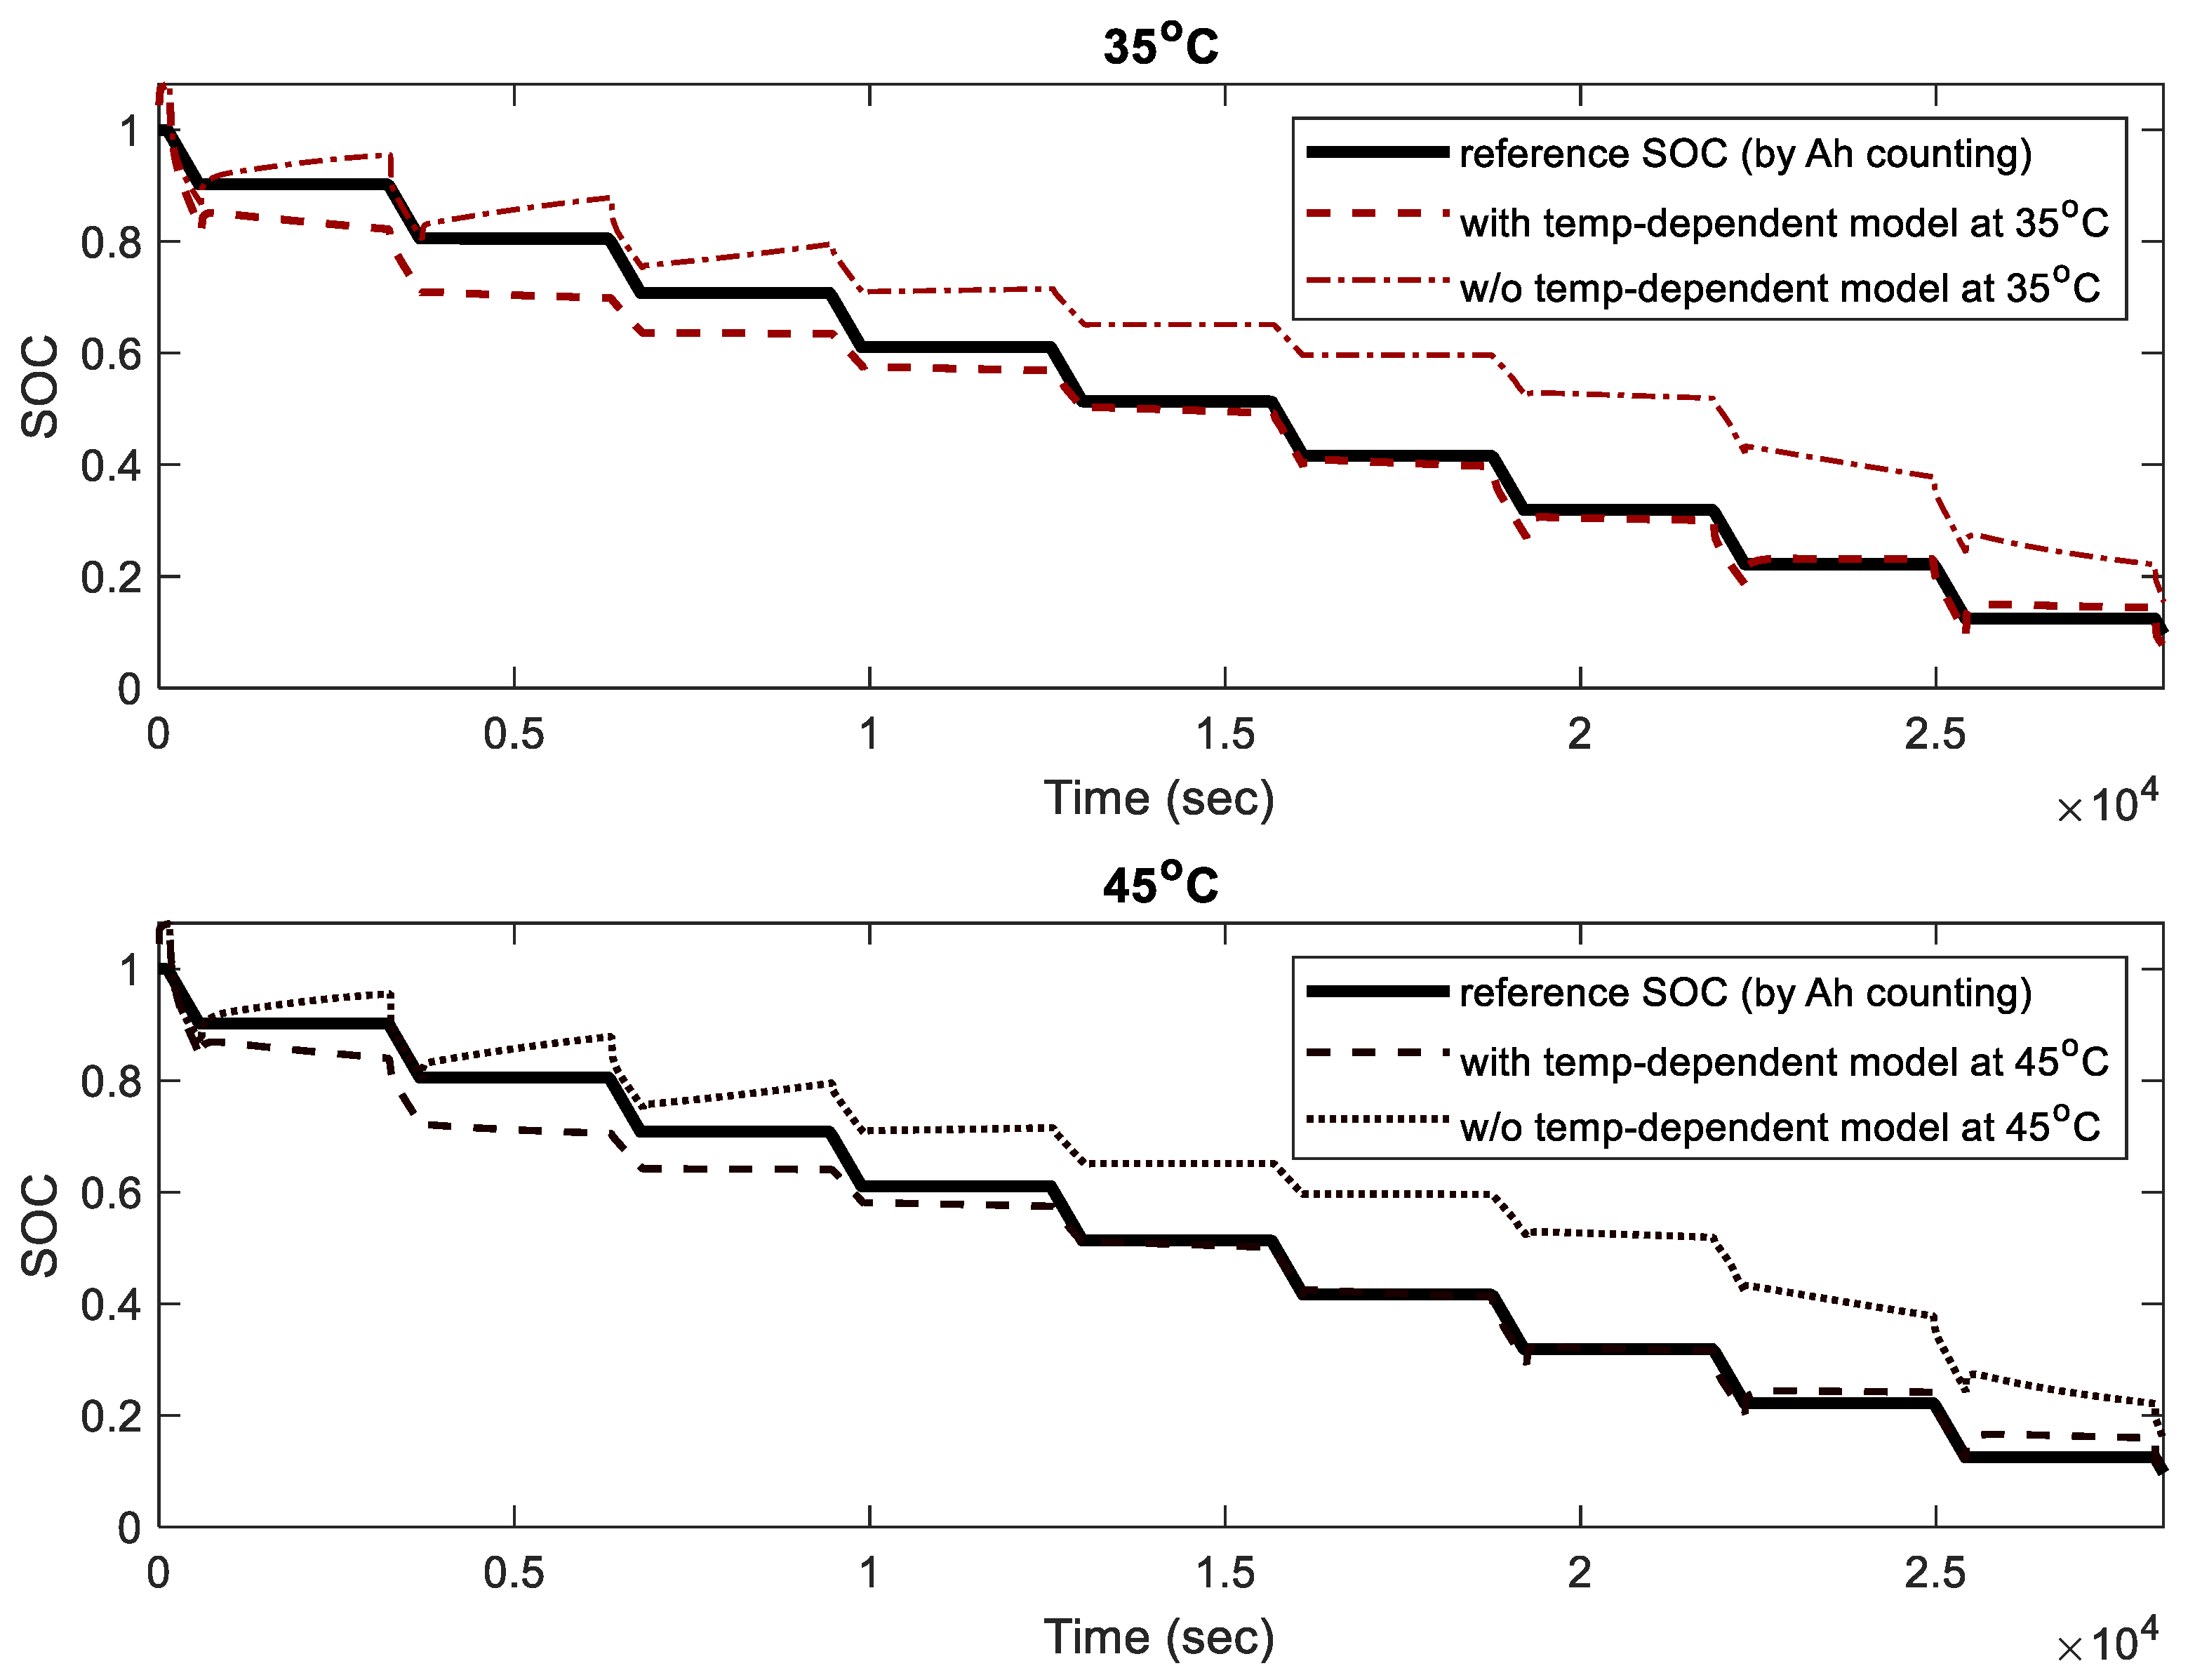
6. SOC Estimation by Extended Kalman Filter Method

To facilitate the SOC estimation process by EKF, the above equations from (1) to (3) have to be discretized [70]. Equation (6) and (7) will be included in the output equation in (4).
First, S O C ˙ ( t ) in (1) can be discretized as follows.
S O C [ ( k + 1 ) T ] = S O C ( k T ) Δ t 3600 C n ( T a m b ) I ( k T )  
Then, U ˙ 1 ( t ) in (2) can be discretized via the following steps.
U 1 ( t ) = exp [ 1 R 1 C 1 ( t t 0 ) ] U 1 ( t 0 ) + t 0 t exp [ 1 R 1 C 1 ( t τ ) ] 1 C 1 I ( τ ) d τ
where t is the current time, t 0 is initial time, t 0 = k T and t = ( k + 1 ) T ,   k = 0 , 1 , 2 , 3 n .
The current remains unchanged within one sampling time T that is I ( τ ) = I ( K T ) equals to a constant. Defining d t = d τ , t = ( k + 1 ) T τ and solving the integration with lower and upper limit of 0 and T, respectively gives
U 1 [ ( k + 1 ) T ] = exp [ Δ t R 1 C 1 ] U 1 ( k T )   + R 1 I ( k T ) [ 1 exp ( Δ t R 1 C 1 ) ]  
where U 1 ( k + 1 ) = U 1 [ ( k + 1 ) T ] , I ( k ) = I ( k T ) and Δ t is the sampling period of 1 s.
U 1 ( k + 1 ) = exp [ Δ t R 1 C 1 ] U 1 ( k )   + R 1 I ( k ) [ 1 exp ( Δ t R 1 C 1 ) ]  
Next, the solution for U h s ( t ) in (3) can be written as follows.
U h s ( t ) = 0.0755 [ 1 exp ( β ( t t 0 ) | I | ) ]   sign ( I ) I + exp ( β ( t t 0 ) | I | ) U h s ( t 0 ) + 0.0755 [ exp ( β ( t t 0 ) | I | ) 1 ] sign ( I )
Equation (16) can be discretized as
U h s ( k + 1 ) = 0.0755 [ 1 exp ( β Δ t | I ( k ) | ) ]   sign ( I ( k ) ) I ( k ) + exp ( β Δ t | I ( k ) | ) U h s ( k ) + 0.0755 [ exp ( β Δ t | I ( k ) | ) 1 ] sign ( I ( k ) )
The proposed temperature-dependent battery cell model that includes the ambient temperature, cell temperature, hysteresis voltage dynamics, the thermal aging effect on capacity and terminal voltage can be written as a nonlinear system equation.
X ˙ k + 1 = A k X k + B k u k + w k  
y k = U o c ( k ) U 1 ( k ) R 0 I ( k ) + U h s ( k ) + U t e m p ( k ) + v k  
where X k = [ S O C ( k ) U 1 ( k ) U h s ( k ) ] T , k is the time index, I ( k ) is the current at k , u k = [ I ( k ) 1 ] is the input vector, w k is the process noises and v k is the measurement noise. The process and measurement noise satisfy the following equations.
E [ w ( k ) ] = 0 E [ v ( k ) ] = 0 Cov [ w ( k ) , w ( j ) ] = E [ w ( k ) w ( j ) T ] = Q ( k ) δ k j Cov [ v ( k ) , v ( j ) ] = E [ v ( k ) v ( j ) T ] = R ( k ) δ k j Cov [ w ( k ) , v ( j ) ] = E [ w ( k ) v ( j ) T ] = 0
where δ k j = { 0   if   k j 1   if   k = j is Kronecker delta, Q ( k ) and R ( k ) are symmetric positive definite matrix.
The matrices used in (18) are defined as:
A k = [ 1 0 0 0 exp ( Δ t R 1 C 1 ) 0 0.0755 [ 1 exp ( β Δ t | I ( k ) | ) sign ( I ( k ) ) ] 0 exp ( β Δ t | I ( k ) | ) ]  
B k = [ Δ t 3600 C n ( T a m b ) 0 R 1 [ 1 exp ( Δ t R 1 C 1 ) ] 0 0 0.0755 [ exp ( β Δ t | I ( k ) | 1 ) sign ( I ( k ) ) ] ]  
where Δ t is the sampling period of 1 s. Note that the function of T a m b and S O C in R 0 , R 1 , C 1 are omitted for clarity.
Based on the nonlinear battery cell model obtained in the previous sections, an extended Kalman filter (EKF) can be designed to estimate the SOC of the cell. The EKF remains quite appealing for most practitioners even with the inherent linearization error and noises [63]. The detrimental effects due to the linearization-induced error on the SOC estimation are not significant as the battery cell model does not have strong nonlinearity. The state equation is quite linear in the state and the nonlinearity in the output equation has a bounded gradient [63]. The model mismatch due to linearization can be resolved by setting the initial SOC value close to the true value obtained from OCV that can give a reasonable estimate of SOC value. The EKF design [19] for the state estimation is straightforward and is thus omitted in this paper. The initial conditions of the battery cell model are taken as X ( 0 ) = [ 0.9 0.12 0.002 ] T and the EKF estimator is X ^ ( 0 ) = 0.1 X ( 0 ) . The tuning parameters of the EKF are taken as: Q = I 3 , R = 0.0005   and   P 0 = 0.1 I 3 where I 3 is 3 × 3 identity matrix. The matrix Q , P and R are symmetric positive definite. The EKF is quite robust to changes of the tuning parameters, and the process of tuning them is straightforward.
As shown in Figure 20, with the EKF and proposed cell model use the same values of model parameters, the SOC values converge to the reference values obtained by Ah counting method. The maximum RMSE of the SOC estimate is around 0.09. The SOC converged to the actual value at time increases. When compared at different ambient temperature, Figure 21 shows the response of the SOC estimate when 5 °C, 15 °C, 35 °C, and 45 °C. It can be observed at lower ambient temperature; the SOC value is lowered than the ambient temperature of 25 °C and above.
The battery cell model that includes the ambient temperature, cell temperature, hysteresis effect and thermal aging effect on capacity, OCV-SOC and terminal voltage was simulated. As ambient temperature varies, the response of SOC deviates from the reference or experimental data (by Ah counting method). However, the proposed cell model with temperature-dependent terms is capable of estimating SOC despite the variation in ambient temperature as seen in Figure 22 and Figure 23.
Similar phenomena can be seen in Figure 24 and Figure 25 at different ambient temperatures for the terminal voltage. Without the temperature-dependent terms in the battery cell model, the terminal voltage is higher than the actual terminal voltage (that does not represent the characteristic of the battery cell where the terminal voltage can exhibit a lower value).
The results of the SOC estimation and terminal voltage using the proposed model with EKF based SOC estimation method (with and without considering the ambient temperature) is shown in Table 3. The model without the ambient temperature-dependent term in static capacity, U t e m p and RC parameters ( R 0 , R 1 , C 1 ) , gives a less RMSE as compared to the non-temperature-dependent model. Both model with and without ambient temperature term used the same U o c in (6). The non-temperature-dependent model adopted the fixed RC parameters [51,64,65,66]: R 0 = 0.0823 ,   R 1 = 0.0042 ,   C 1 = 52.2 . The similar phenomena can be seen in the terminal voltage where lower RSME can be observed (except for 25 °C and 35 °C). It may be due to the modelling was mostly performed at 25 °C, and thus improvement is not prominent. Nevertheless, the increased in RMSE is not more than 5%. In addition, there exists at least 57% improvement in SOC estimation at a lower temperature. For the case of terminal voltage, the improvement is around 56% at a lower temperature of 5 °C. There is no improvement at ambient temperature of 25 °C.
In summary, the proposed cell model can estimate the SOC and terminal voltage under the different and aging thermal effect on the battery cell at a low (i.e., 5 °C and 15 °C) and high ambient temperature (45 °C). Note that the results depend on the type of battery cell used. However, a similar approach can be applied in various applications [71,72].

7. Conclusions

The effects of the ambient temperature, cell temperature, hysteresis voltage and thermal aging on capacity due to multiple charging and discharging was considered in the battery cell model of the cylindrical lithium iron phosphate battery cells (ANR26650M1-B). The temperature-dependent extended Kalman filter (EKF) algorithm was used to estimate the state-of-charge (SOC) of the battery cell. The effectiveness of the proposed scheme was validated experimentally on actual battery cell under different ambient temperatures. As compared with cell model without the ambient temperature term in the SOC model, the proposed battery temperature-dependent model gave a less root-mean-square error at low (i.e., 5 °C and 15 °C) and high ambient temperature (45 °C). For future works, the battery packs will be simulated and tested. The reliability of the SOC estimation under varying conditions of the battery pack will be examined. The prismatic or pouch cell will be examined.

Author Contributions

C.S.C. defined the flow of the paper, theoretical concepts of the unified battery cell model and model simulation and verification that drove this research with Z.G. and J.H.K.C. on cell temperature measurements. C.Z. provided the academic support and advice during the project. All authors discussed and provided comments at all stages.

Funding

This research received no external funding.

Acknowledgments

This work was performed at Newcastle University in Singapore. The authors would like to thank all partners for providing support.

Conflicts of Interest

The authors declare no conflict of interest.

References

  1. Zhang, S.; Luo, Y.; Wang, J.; Wang, X.; Li, K. Predictive Energy Management Strategy for Fully Electric Vehicles Based on Preceding Vehicle Movement. IEEE Trans. Intell. Transp. Syst. 2017, 18, 3049–3060. [Google Scholar] [CrossRef]
  2. Alhanouti, M.; Gießler, M.; Blank, T.; Gauterin, F. New Electro-Thermal Battery Pack Model of an Electric Vehicle. Energies 2016, 9, 563. [Google Scholar] [CrossRef]
  3. Hussein, A.A. Capacity Fade Estimation in Electric Vehicle Li-Ion Batteries Using Artificial Neural Networks. IEEE Trans. Ind. Appl. 2015, 51, 2321–2330. [Google Scholar] [CrossRef]
  4. Tenfen, D.; Finardi, E.C.; Delinchant, B.; Wurtz, F. Lithium-ion battery modeling for the energy management problem of microgrids. IET Gener. Transm. Distrib. 2016, 10, 576–584. [Google Scholar] [CrossRef]
  5. Ye, F.; Qian, Y.; Hu, R. Incentive Load Scheduling Schemes for PHEV Battery Exchange Stations in Smart Grid. IEEE Syst. J. 2015, 11, 922–930. [Google Scholar] [CrossRef]
  6. Casals, L.C.; Garca, B.A. Communications concerns for reused electric vehicle batteries in smart grids. IEEE Commun. Mag. 2016, 54, 120–125. [Google Scholar] [CrossRef] [Green Version]
  7. Lelie, M.; Braun, T.; Knips, M.; Nordmann, H.; Ringbeck, F.; Zappen, H.; Sauer, D.U. Battery Management System Hardware Concepts: An Overview. Appl. Sci. 2018, 8, 534. [Google Scholar] [CrossRef]
  8. Li, Z.; Huang, J.; Liaw, B.Y.; Zhang, J. On state-of-charge determination for lithium-ion batteries. J. Power Sources 2017, 348, 281–301. [Google Scholar] [CrossRef]
  9. Jaguemont, J.; Boulon, L.; Dubé, Y. A comprehensive review of lithium-ion batteries used in hybrid and electric vehicles at cold temperatures. Appl. Energy 2016, 164, 99–114. [Google Scholar] [CrossRef]
  10. Marongiu, A.; Nußbaum, F.G.W.; Waag, W.; Garmendi, M.; Sauer, D.U. Comprehensive study of the influence of aging on the hysteresis behavior of a lithium iron phosphate cathode-based lithium ion battery—An experimental investigation of the hysteresis. Appl. Energy 2016, 171, 629–645. [Google Scholar] [CrossRef]
  11. Hannan, M.A.; Lipu, M.S.H.; Hussain, A.; Mohamed, A. A review of lithium-ion battery state of charge estimation and management system in electric vehicle applications: Challenges and recommendations. Renew. Sustain. Energy Rev. 2017, 78, 834–854. [Google Scholar] [CrossRef]
  12. Zhang, C.; Li, K.; Deng, J.; Song, S. Improved Real-time State-of-Charge Estimation of LiFePO4 Battery Based on a Novel Thermoelectric Model. IEEE Trans. Ind. Electron. 2017, 64, 654–663. [Google Scholar] [CrossRef]
  13. Cacciato, M.; Nobile, G.; Scarcella, G.; Scelba, G. Real-Time Model-Based Estimation of SOC and SOH for Energy Storage Systems. IEEE Trans. Power Electron. 2017, 32, 794–803. [Google Scholar] [CrossRef]
  14. Fuller, T.F.; Doyle, M.; Newman, J. Simulation and optimization of the dual lithium ion insertion cell. J. Electrochem. Soc. 1994, 141, 1–10. [Google Scholar] [CrossRef]
  15. Santhanagopalan, S.; Guo, Q.; Ramadass, P.; White, R.E. Review of models for predicting the cycling performance of lithium ion batteries. J. Power Sour. 2006, 156, 620–628. [Google Scholar] [CrossRef]
  16. Lotfi, N.; Landers, R.G.; Li, J.; Park, J. Reduced-Order Electrochemical Model-Based SOC Observer with Output Model Uncertainty Estimation. IEEE Trans. Control. Syst. Technol. 2017, 25, 1217–1230. [Google Scholar] [CrossRef]
  17. Rahimian, S.K.; Rayman, S.; White, R.E. Extension of physics based single particle model for higher charge–discharge rates. J. Power Sources 2013, 224, 180–194. [Google Scholar] [CrossRef]
  18. Bartlett, A.; Marcicki, J.; Onori, S.; Rizzoni, G.; Yang, X.G.; Miller, T. Electrochemical Model-Based State of Charge and Capacity Estimation for a Composite Electrode Lithium-Ion Battery. IEEE Trans. Control. Syst. Technol. 2016, 24, 384–399. [Google Scholar] [CrossRef]
  19. Chen, Z.; Fu, Y.; Mi, C.C. State of Charge Estimation of Lithium-Ion Batteries in Electric Drive Vehicles Using Extended Kalman Filtering. IEEE Trans. Veh. Technol. 2013, 62, 1020–1030. [Google Scholar] [CrossRef]
  20. Kim, J.; Cho, B.H. State-of-Charge Estimation and State-of-Health Prediction of a Li-Ion Degraded Battery Based on an EKF Combined With a Per-Unit System. IEEE Trans. Veh. Technol. 2011, 60, 4249–4260. [Google Scholar] [CrossRef]
  21. Ghalkhania, M.; Bahiraeib, F.; Nazric, G.A.; Saifa, M. Electrochemical-Thermal Model of Pouch-type Lithium-ion Batteries. Electrochim. Acta 2017, 247, 569–587. [Google Scholar] [CrossRef]
  22. Mendoza, S.; Rothenberger, M.; Liu, J.; Fathy, H.K. Maximizing Parameter Identifiability of a Combined Thermal and Electrochemical Battery Model Via Periodic Current Input Optimization. IFAC PapersOnLine 2017, 50, 7314–7320. [Google Scholar] [CrossRef]
  23. Zou, C.; Hu, X.; Wei, Z.; Tang, X. Electrothermal dynamics-conscious lithium-ion battery cell-level charging management via state-monitored predictive control. Energy 2017, 141, 250–259. [Google Scholar] [CrossRef]
  24. Hosseinzadeh, E.; Marco, J.; Jennings, P. Electrochemical-Thermal Modelling and Optimisation of Lithium-Ion Battery Design Parameters Using Analysis of Variance. Energies 2017, 10, 1278. [Google Scholar] [CrossRef]
  25. Tagade, P.; Hariharan, K.S.; Basu, S.; Verma, M.K.S.; Kolake, S.M.; Song, T.; Oh, D.; Yeo, T.; Doo, S. Bayesian calibration for electrochemical thermal model of lithium-ion cells. J. Power Sources 2016, 320, 296–309. [Google Scholar] [CrossRef]
  26. Lai, Y.; Du, S.; Ai, L.; Ai, L.; Cheng, Y.; Tang, Y.; Jia, M. Insight into heat generation of lithium ion batteries based on the electrochemical-thermal model at high discharge rates. Int. J. Hydrogen Energy 2015, 40, 13039–13049. [Google Scholar] [CrossRef]
  27. Arunachalam, H.; Onori, S. Temperature-dependent multiscale-dynamics in Lithium-Ion battery electrochemical models. In Proceedings of the 2015 American Control Conference, Chicago, IL, USA, 1–3 July 2015. [Google Scholar]
  28. Li, J.; Cheng, Y.; Jia, M.; Tang, Y.; Lin, Y.; Zhang, Z.; Liu, Y. An electrochemical thermal model based on dynamic responses for lithium iron phosphate battery. J. Power Sources 2014, 255, 130–143. [Google Scholar] [CrossRef]
  29. Saw, L.H.; Ye, Y.; Tay, A.A.O. Electrochemical–thermal analysis of 18,650 Lithium Iron Phosphate cell. Energy Convers. Manag. 2013, 75, 162–174. [Google Scholar] [CrossRef]
  30. Zhu, C.; Li, X.; Song, L.; Xiang, L. Development of a theoretically based thermal model for lithium ion battery pack. J. Power Sources 2013, 223, 155–164. [Google Scholar] [CrossRef]
  31. Saw, L.H.; Ye, Y.; Tay, A.A.O. Electro-thermal analysis and integration issues of lithium ion battery for electric vehicles. Appl. Energy 2014, 131, 97–107. [Google Scholar] [CrossRef]
  32. Hu, Y.; Yurkovich, S.; Guezennec, Y.; Yurkovich, B.J. Electro-thermal battery model identification for automotive applications. J. Power Sources 2011, 196, 449–457. [Google Scholar] [CrossRef]
  33. Chen, X.; Shen, W.; Dai, M.; Cao, Z.; Jin, J.; Kapoor, A. Robust Adaptive Sliding-Mode Observer Using RBF Neural Network for Lithium-Ion Battery State of Charge Estimation in Electric Vehicles. IEEE Trans. Veh. Technol. 2016, 65, 1936–1947. [Google Scholar] [CrossRef]
  34. Ma, Y.; Li, B.; Li, G.; Zhang, J.; Chen, H. A nonlinear observer approach of SOC estimation based on hysteresis model for lithium-ion battery. IEEE/CAA J. Autom. Sin. 2017, 4, 195–204. [Google Scholar] [CrossRef]
  35. Hu, Y.; Yurkovich, S. Battery cell state-of-charge estimation using linear parameter varying system techniques. J. Power Sources 2012, 198, 338–350. [Google Scholar] [CrossRef]
  36. Greenleaf, M.; Dalchand, O.; Li, H.; Zheng, J.P. A Temperature-Dependent Study of Sealed Lead-Acid Batteries Using Physical Equivalent Circuit Modeling With Impedance Spectra Derived High Current/Power Correction. IEEE Trans. Sustain. Energy 2015, 6, 380–387. [Google Scholar] [CrossRef]
  37. Dvorak, D.; Bäuml, T.; Holzinger, A.; Popp, H. A Comprehensive Algorithm for Estimating Lithium-Ion Battery Parameters From Measurements. IEEE Trans. Sustain. Energy 2018, 9, 771–779. [Google Scholar] [CrossRef]
  38. Fotouhi, A.; Auger, D.J.; Propp, K.; Longo, S. Lithium-Sulfur Battery State-of-Charge Observability Analysis and Estimation. IEEE Trans. Power Electron. 2018, 33, 5847–5859. [Google Scholar] [CrossRef]
  39. Charkhgard, M.; Farrokhi, M. State-of-Charge Estimation for Lithium-Ion Batteries Using Neural Networks and Ekf. IEEE Trans. Ind. Electron. 2010, 57, 4178–4187. [Google Scholar] [CrossRef]
  40. He, W.; Williard, N.; Chen, C.; Pecht, M. State of Charge Estimation for Li-Ion Batteries Using Neural Network Modeling and Unscented Kalman Filter-Based Error Cancellation. Int. J. Electr. Power Energy Syst. 2014, 62, 783–791. [Google Scholar] [CrossRef]
  41. Wang, S.C.; Liu, Y.H. A Pso-Based Fuzzy-Controlled Searching for the Optimal Charge Pattern of Li-Ion Batteries. IEEE Trans. Ind. Electron. 2015, 62, 2983–2993. [Google Scholar] [CrossRef]
  42. Fekry, H.M.; Hassan, M.A.M.; Aziz, M.M.A.E. The state of charge estimation for rechargeable batteries using Adaptive Neuro Fuzzy Inference System (ANFIS). In Proceedings of the First International Conference on Innovative Engineering Systems, Alexandria, Egypt, 7–9 December 2012; pp. 201–206. [Google Scholar]
  43. Nuhic, A.; Terzimehic, T.; Soczka-Guth, T.; Buchholz, M.; Dietmayer, K. Health diagnosis and remaining useful life prognostics of lithium-ion batteries using data-driven methods. J. Power Sources 2013, 239, 680–688. [Google Scholar] [CrossRef]
  44. Weng, C.; Cui, Y.; Sun, J.; Peng, H. On-board state of health monitoring of lithium-ion batteries using incremental capacity analysis wit support vector regression. J. Power Sources 2013, 235, 36–44. [Google Scholar] [CrossRef]
  45. Fang, H.; Wang, Y.; Sahinoglu, Z.; Wada, T.; Hara, S. State of charge estimation for lithium-ion batteries: An adaptive approach. Control Eng. Pract. 2014, 25, 45–54. [Google Scholar] [CrossRef]
  46. Du, J.; Liu, Z.; Wang, Y. State of charge estimation for Li-ion battery based on model from extreme learning machine. Control Eng. Pract. 2014, 26, 11–19. [Google Scholar] [CrossRef]
  47. Du, J.; Liu, Z.; Chen, C.; Wang, Y. Li-ion battery SOC estimation using EKF based on a model proposed by extreme learning machine. In Proceedings of the 7th IEEE Conference on Industrial Electronics and Applications, Singapore, 18–20 July 2012; pp. 1648–1653. [Google Scholar]
  48. Densmore, A.; Hanif, M. Modeling the condition of Lithium Ion Batteries using the extreme machine learning. In Proceedings of the IEEE PES Power Africa Conference, Livingstone, Zambia, 28 June–3 July 2016; pp. 184–188. [Google Scholar]
  49. Far, R.R.; Chakrabarti, S.; Saif, M. Multi-Step Parallel-Strategy for Estimating the Remaining Useful Life of Batteries. In Proceedings of the IEEE 30th Canadian Conference on Electrical and Computer Engineering (CCECE), Windsor, ON, Canada, 30 April–3 May 2017; pp. 1–4. [Google Scholar]
  50. Tang, X.; Yao, K.; Liu, B.; Hu, W.; Gao, F. Long-Term Battery Voltage, Power, and Surface Temperature Prediction Using a Model-Based Extreme Learning Machine. Energies 2018, 11, 86. [Google Scholar] [CrossRef]
  51. Chin, C.; Gao, Z.C. State-of-Charge Estimation of Battery Pack under Varying Ambient Temperature Using an Adaptive Sequential Extreme Learning Machine. Energies 2018, 11, 711. [Google Scholar] [CrossRef]
  52. Remmlinger, J.; Buchholz, M.; Dietmayer, K. Model-based on-board monitoring for lithium-ion batteries. ATZ Autom. 2014, 62, 282–295. [Google Scholar] [CrossRef]
  53. Plett, G.L. Extended Kalman filtering for battery management systems of LiPB based HEV battery packs: Part 1. Background. J. Power Sources 2004, 134, 252–261. [Google Scholar] [CrossRef]
  54. Plett, G.L. Extended kalman filtering for battery management systems of LIPB based HEV battery packs: Part 2. Modeling and identification. J. Power Sources 2004, 134, 262–276. [Google Scholar] [CrossRef]
  55. Plett, G.L. Extended Kalman filtering for battery management systems of LiPBbased hev battery packs: Part 3. State and parameter estimation. J. Power Sources 2004, 134, 277–292. [Google Scholar] [CrossRef]
  56. Plett, G.L. Sigma-point Kalman filtering for battery management systems of LIPB-based HEV battery packs: Part 1: Introduction and state estimation. J. Power Sources 2006, 161, 1356–1368. [Google Scholar] [CrossRef]
  57. Plett, G.L. Sigma-point kalman filtering for battery management systems of LIPB-based HEV battery packs: Part 2: Simultaneous state and parameter estimation. J. Power Sources 2006, 161, 1369–1384. [Google Scholar] [CrossRef]
  58. Zhang, F.; Liu, G.; Fang, L.; Wang, H. Estimation of Battery State of Charge with H∞ Observer: Applied to a Robot for Inspecting Power Transmission Lines. IEEE Trans. Ind. Electron. 2012, 59, 1086–1095. [Google Scholar] [CrossRef]
  59. Zhang, F.; Liu, G.; Fang, L. A battery state of charge estimation method using sliding mode observer. In Proceedings of the 7th World Congress on Intelligent Control and Automation Conference, Chongqing, China, 25–27 June 2008. [Google Scholar]
  60. Zhang, F.; Liu, G.; Fang, L. A battery State of Charge estimation method with extended Kalman filter. In Proceedings of the IEEE/ASME International Conference on Advanced Intelligent Mechatronics, Xi’an, China, 2–5 July 2008. [Google Scholar]
  61. Zhang, F.; Liu, G.; Fang, L. Battery state estimation using Unscented Kalman Filter. In Proceedings of the IEEE International Conference on Robotics and Automation, Kobe, Japan, 12–17 May 2009. [Google Scholar]
  62. Ali, D.; Mukhopadhyay, S.; Rehman, H. A novel adaptive technique for Li-ion battery model parameters estimation. In Proceedings of the 2016 IEEE National Aerospace and Electronics Conference (NAECON) and Ohio Innovation Summit (OIS), Dayton, OH, USA, 26–29 July 2017. [Google Scholar]
  63. Wang, Y.; Fang, H.; Zhou, L.; Wang, Y.; Fang, H.; Zhou, L.; Wada, T. Revisiting the State-of-Charge Estimation for Lithium-Ion Batteries: A Methodical Investigation of the Extended Kalman Filter Approach. IEEE Control Syst. 2017, 37, 73–96. [Google Scholar]
  64. Jia, J.; Lin, P.; Chin, C.S.; Toh, W.D.; Gao, Z.; Lyu, H.; Cham, Y.T.; Mesbahi, E. Multirate strong tracking extended Kalman filter and its implementation on lithium iron phosphate (LiFePO4) battery system. In Proceedings of the IEEE 11th International Conference on Power Electronics and Drive Systems, Sydney, Australia, 9–12 June 2015; pp. 640–645. [Google Scholar]
  65. Gao, Z.; Chin, C.S.; Chiew, J.H.K.; Jia, J.B.; Zhang, C.Z. Design and Implementation of Smart Lithium-ion Battery System with Real-time Fault Diagnosis Capability for Electric Vehicles. Energies 2017, 10, 1503. [Google Scholar] [CrossRef]
  66. Gao, Z.; Chin, C.S.; Woo, W.L.; Jia, J. Integrated Equivalent Circuit and Thermal Model for Simulation of Temperature-Dependent LiFePO4 Battery in Actual Embedded Application. Energies 2017, 10, 85. [Google Scholar] [CrossRef]
  67. Waag, F.W.; Sauer, D.U. Application-specific electrical characterization of high power batteries with lithium titanate anodes for electric vehicles. Energy 2016, 112, 294–306. [Google Scholar]
  68. Wijewardana, S.; Vepa, R.; Shaheed, M.H. Dynamic battery cell model and state of charge estimation. J. Power Sources 2016, 308, 109–120. [Google Scholar] [CrossRef]
  69. Bernardi, D.; Pawlikowski, E.; Newman, J. A general energy balance for battery systems. J. Electrochem. Soc. 1985, 132, 5–12. [Google Scholar] [CrossRef]
  70. Li, Y.; Wang, C.; Gong, J. A combination Kalman filter approach for State of Charge estimation of lithium-ion battery considering model uncertainty. Energy 2016, 109, 933–946. [Google Scholar] [CrossRef]
  71. Zhang, R.H.; He, Z.C.; Wang, H.W.; You, F.; Li, K.N. Study on self-tuning tyre friction control for developing main-servo loop integrated chassis control system. IEEE Access 2017, 5, 6649–6660. [Google Scholar] [CrossRef]
  72. Xiong, H.; Zhu, X.; Zhang, R. Energy Recovery Strategy Numerical Simulation for Dual Axle Drive Pure Electric Vehicle Based on Motor Loss Model and Big Data Calculation. Complexity 2018, 4071743. [Google Scholar] [CrossRef]
Figure 1. (a) Proposed ambient and cell temperature-dependent ECM of battery cell; (b) terminal voltage of 1RC and 2RC as compared to experiment data.
Energies 11 02467 g001
Figure 2. Cell capacity of battery cell as function of ambient temperature.
Energies 11 02467 g002
Figure 3. Test bench setup for battery testing [51,64,65,66].
Energies 11 02467 g003
Figure 4. Discharge current pulses during discharging pulse test.
Energies 11 02467 g004
Figure 5. Terminal voltage during discharging pulse test.
Energies 11 02467 g005
Figure 6. State-of-charge during discharging pulse test at 25 °C.
Energies 11 02467 g006
Figure 7. (a) proposed OCV-SOC relationship as compared to experimental data (at ambient temperature of 25 °C); (b) block diagram for OCV-SOC relationship at different ambient temperature (c) proposed OCV-SOC relationship to experimental data at different ambient temperature; (d) RMSE of OCV as compared to the proposed method at a different ambient temperature.
Energies 11 02467 g007aEnergies 11 02467 g007b
Figure 8. R0 as function of (a) SOC; (b) SOC and ambient temperature.
Energies 11 02467 g008aEnergies 11 02467 g008b
Figure 9. R1 as function of (a) SOC; (b) SOC and ambient temperature.
Energies 11 02467 g009aEnergies 11 02467 g009b
Figure 10. C1 as a function of (a) SOC; (b) SOC and ambient temperature.
Energies 11 02467 g010aEnergies 11 02467 g010b
Figure 11. Schematic of experimental setup.
Energies 11 02467 g011
Figure 12. Thermal image of cell temperature at ambient temperature of 25 °C (for constant 2 A load current).
Energies 11 02467 g012
Figure 13. Cell temperature at different ambient temperature (for constant 2 A load current) for 3000 s.
Energies 11 02467 g013
Figure 14. Simulation block diagram for battery cell model.
Energies 11 02467 g014
Figure 15. Terminal voltage at different ambient temperature of 5 °C.
Energies 11 02467 g015
Figure 16. Terminal voltage at different ambient temperature of 15 °C.
Energies 11 02467 g016
Figure 17. Terminal voltage at different ambient temperature of 25 °C.
Energies 11 02467 g017
Figure 18. Terminal voltage at different ambient temperature of 35 °C.
Energies 11 02467 g018
Figure 19. Terminal voltage at different ambient temperature of 45 °C.
Energies 11 02467 g019
Figure 20. SOC and RMSE of SOC as compared to experimental result at 25 °C.
Energies 11 02467 g020
Figure 21. SOC and RMSE of SOC as compared to experimental result at ambient temperature of (a) 5 °C; (b) 15 °C; (c) 35 °C; (d) 45 °C.
Energies 11 02467 g021aEnergies 11 02467 g021b
Figure 22. SOC as compared to experimental result at different ambient temperature (5 °C, 15 °C and 25 °C).
Energies 11 02467 g022
Figure 23. SOC as compared to experimental result at different ambient temperature (35 °C and 45 °C).
Energies 11 02467 g023
Figure 24. Terminal voltage at different ambient temperature (5 °C, 15 °C and 25 °C).
Energies 11 02467 g024
Figure 25. Terminal voltage at different ambient temperature (35 °C and 45 °C).
Energies 11 02467 g025
Table 1. Parameters values used in equations.
ParametersValues
Nominal Capacity, Cn (Ah)2.5
Cell density, ρ (kgm−3)2700
Cell mass, m (kg)0.076
Surface Area of Heat Exchange, A c e l l (m2)0.0175
Specific Heat Capacity of the Cell, c p ( J / kgK ) 825
Contact resistance, R c (Ω)25 µΩ
Entropy coefficient d U o c / d T c e l l 0.00125 [2]
Convective Heat Transfer Coefficient, h (W/m2/K)4
Stefan-Boltzmann constant term, σ 5.67 × 10⁻⁸ J·s−1m−2K4
The emissivity of heat term, ε 0.95
Hysteresis voltage dynamics time constant, β 2.47 × 10⁻³ [63]
Table 2. RMSEs of terminal voltage at different ambient temperature.
Ambient Temperature (°C)RMSE of Terminal Voltage (V)
50.0663
150.0262
250.0153
350.0533
450.0523
Table 3. RMSE comparison between the proposed model using EKF for SOC and terminal voltage estimation.
ModelsParametersRMSE
5 °C15 °C25 °C35 °C45 °C
With temperature SOC0.01660.11970.29320.29190.1132
Without temperature 0.30020.27850.28010.27880.2784
Percent improvement 94.0%57.0%(5.00%)(5.00%)59.0%
With temperature Terminal Voltage0.05930.11860.1380.12680.1082
Without temperature 0.13440.11990.13520.12810.127
Percent improvement56.0%1.08%(2.07%)1.00%15.0%

