1. Introduction
Concentrated solar energy is based on the principle of using optical concentrators, e.g., reflectors or lenses, to substantially increase the irradiance at the focal point where the solar receiver and/or reactor is located. This high concentration of solar light provides unique thermal and thermochemical conversion efficiencies for systems duly optimized to handle high power exchanges in noticeable small-size receivers/reactors [
1]. Thus concentrated solar energy can be efficiently transformed into electrical, thermal or chemical energy. The optical system is composed of tracking mirrors, distributed in different configurations depending on the concentrating solar technology used. The solar receiver is a device that collects concentrating solar radiation and where a heat transfer fluid or reactive material is heated. Concentrating solar technologies are classified, according to concentration strategy, into linear focusing, as parabolic through and Lineal Fresnel, and point- focusing (parabolic dish and central receiver). The latter allow for achieving higher temperatures than linear focusing technologies.
Central receiver systems consist of a large number of two-axis tracking mirrors reflecting direct sunlight onto a fixed focal point located on top of a tower [
2]. Concentrated solar power (CSP) is a commercial electricity-generation technology with approximately 5 GW in grid-connected operation at the end of 2017 [
3]. The operational capacity of commercial CSP plants is between 1 MW and 400 MW.
However, solar thermal technology presents a problem, common in the majority of renewable energies: dispatchability. The energy production depends on both weather conditions and hours of sunlight per day. So it is necessary to store or convert the solar energy in order to produce energy during nights and cloudy days. Thermal storage is the current commercial solution. Another possibility is to transform solar energy into solar fuels, energy carriers such as hydrogen.
Solar hydrogen production can be performed by water splitting or using carbonaceous materials (fossil fuels or biomass) as feedstock [
4]. Water splitting can be realized by means of thermolysis or using thermochemical cycles. Thermolysis is based on the direct thermal dissociation of the water molecule into hydrogen and oxygen and requires temperatures higher than 2000 °C which are challenging for reactor materials. The thermochemical cycling route, which involves several chemical steps, allows for a noticeable reduction of temperature levels and less demanding conditions, and also provides hydrogen production separated from the oxygen production, thus avoiding its explosive mixture [
5,
6,
7]. One of the most usual processes in thermochemical cycles involves the consecutive reduction and oxidation of a metal oxide. The sum of all reactions is the direct dissociation of water [
8,
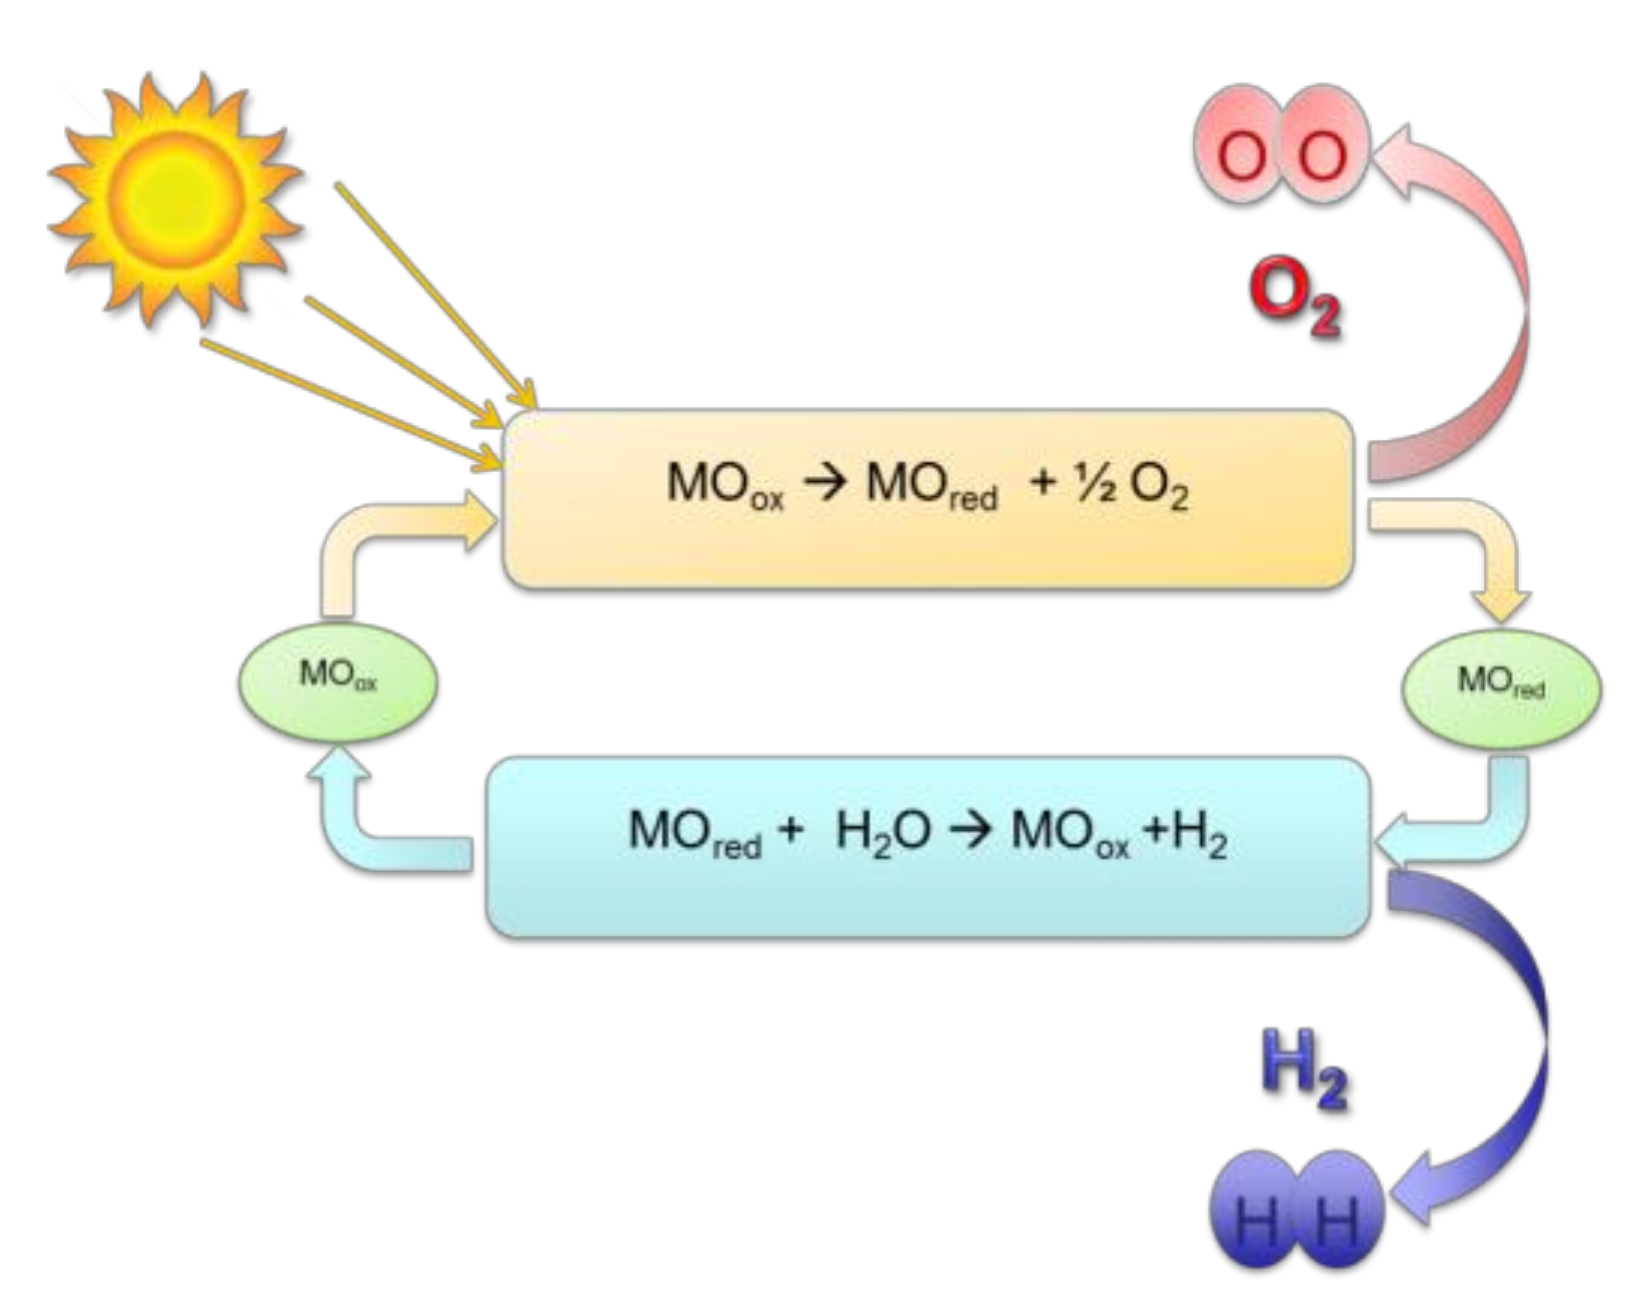
9]. In a two-step thermochemical cycle (
Figure 1), the initial reaction is the reduction of the metal oxide by solar energy (endothermic reaction typically at the cycle highest temperature), producing oxygen. In the second step, the reduced oxide reacts with water (exothermic reaction at lower temperature) to produce hydrogen and the initial oxide is recovered by oxidation.
Cerium (IV) oxide, ceria, is an attractive metal oxide for water splitting because of its high melting point [
10], high oxygen exchange capacities, fast oxygen-ion transport, high oxidation rates and no presence of phase transition irreversibility between oxidized oxide and non-stoichiometric partially reduced oxides [
11]. The stoichiometric cycle of CeO
2/Ce
2O
3 was first demonstrated as a system for thermochemical cycles by Abanades et al. [
12], however that stoichiometric reduction of ceria requires very high temperatures (2000 °C). On the other hand, cerium oxide presents non-stoichiometric partially reduced forms at 1500 °C [
13] that are found attractive by many researchers to conduct two-step water splitting, as well. Ceria redox reactions are represented by:
Apart from the suitable properties of ceria as candidate material for solar thermochemistry previously stated, an important reason for eventually choosing it in the present work relies on experimental evidence of cyclability in a laboratory-scale solar reactor with a radiative power input of 4 kW shown by ETH Zurich [
14]. It was thus selected as the benchmark to explore a methodology of operation in the solar simulator test bed described here.
In order to carry out the reactions, an optimal solar particle reactor is necessary that withstands high temperatures, minimizes thermal losses and favours mass and heat transfer. The main classification of solar particle reactors considers direct and indirect concepts, depending on whether the sample is directly irradiated by sunlight or not [
15]. Directly irradiated solar reactors are commonly used at power levels between 1 kW and 500 kW, since unitary sizes above that power cannot be conveniently furnished with a single transparent window and the corresponding efficient cavity to minimize thermal emission losses, a key benefit when working at temperatures above 500 °C. Transparent windows are required to favour the direct absorption of the photons by the reactants while preserving reactants from contact with external atmosphere. The scaling up of direct particle reactors is not trivial and windows have strong limitations for sizes above 1 m
2, therefore the common trend at high power levels is moving to indirect designs involving an intermediate surface for heat exchange. There are many designs of particles reactors [
15,
16,
17,
18]. For example, they can be stacked beds, fluidized or suspended beds and entrained beds. Fixed bed reactors are included within the stacked beds category. Cerium oxide tests in fluidized beds, in fixed beds [
14], as foam or porous materials [
11,
13,
19] have been reported in the literatures.
Redox materials are studied by thermogravimetric analyses, in ovens/furnaces [
20] or solar reactors like the ones already mentioned. A solar reactor that works with simulated solar radiation is the only option at laboratory scales to expose materials at similar conditions (radiation and temperature) to those found in a central receiver with sun light. However, working with solar reactors presents some challenges such as the measurement of actual sample temperatures, getting the optimal experimental methodology, and performing redox cycles in a continuous mode (without intermediate charges/discharges).
This paper proposes a reactor design and experimental setup that enables the analysis of different materials for solar thermochemical applications using simulated radiation. The experimental facility is flexible, modular, and easy to operate and maintain.
The work aims to determine key specifications of experimental setup and testing methodology to carry out solar chemistry in a fixed bed solar reactor with simulated solar radiation. For that purpose, commercial ceria is used as the benchmark to produce hydrogen by water splitting thermochemical cycles. Besides, the sample is directly irradiated, so radiation effects are considered, and redox reactions in the sample occur continuously, without intermediate charges/discharges, so that consecutive cycling is reproduced.
2. Experimental Facility
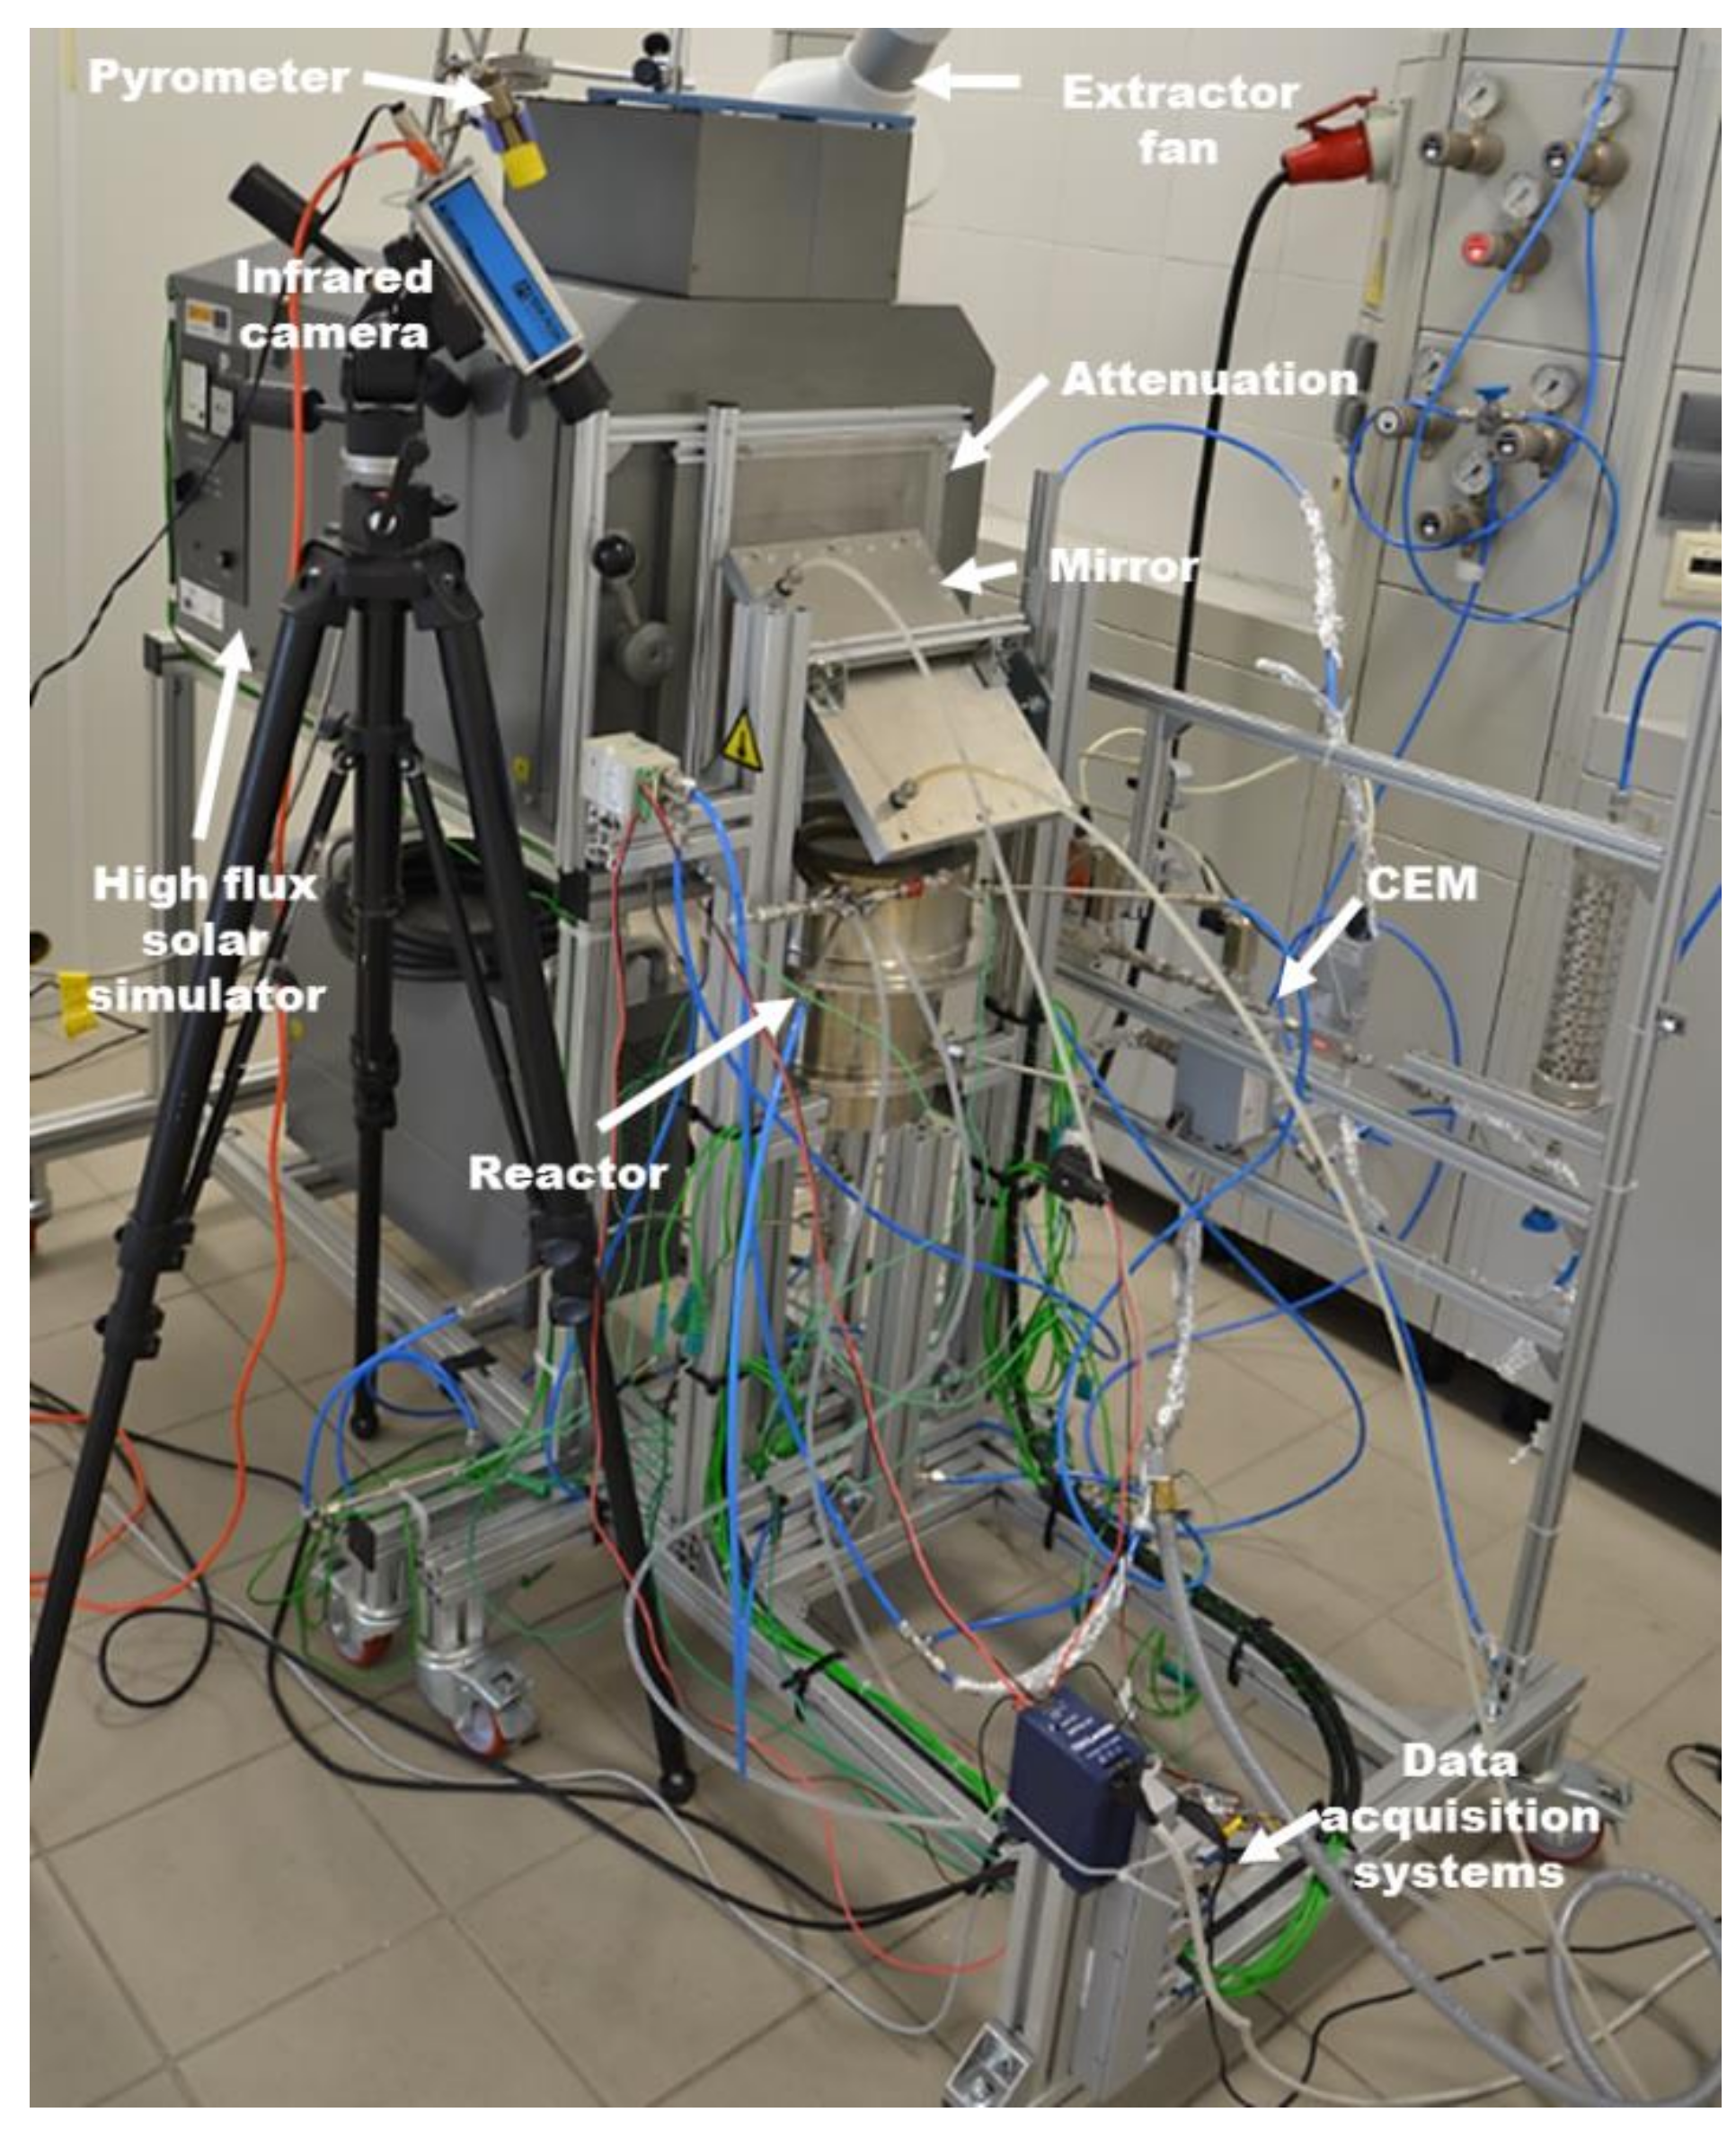
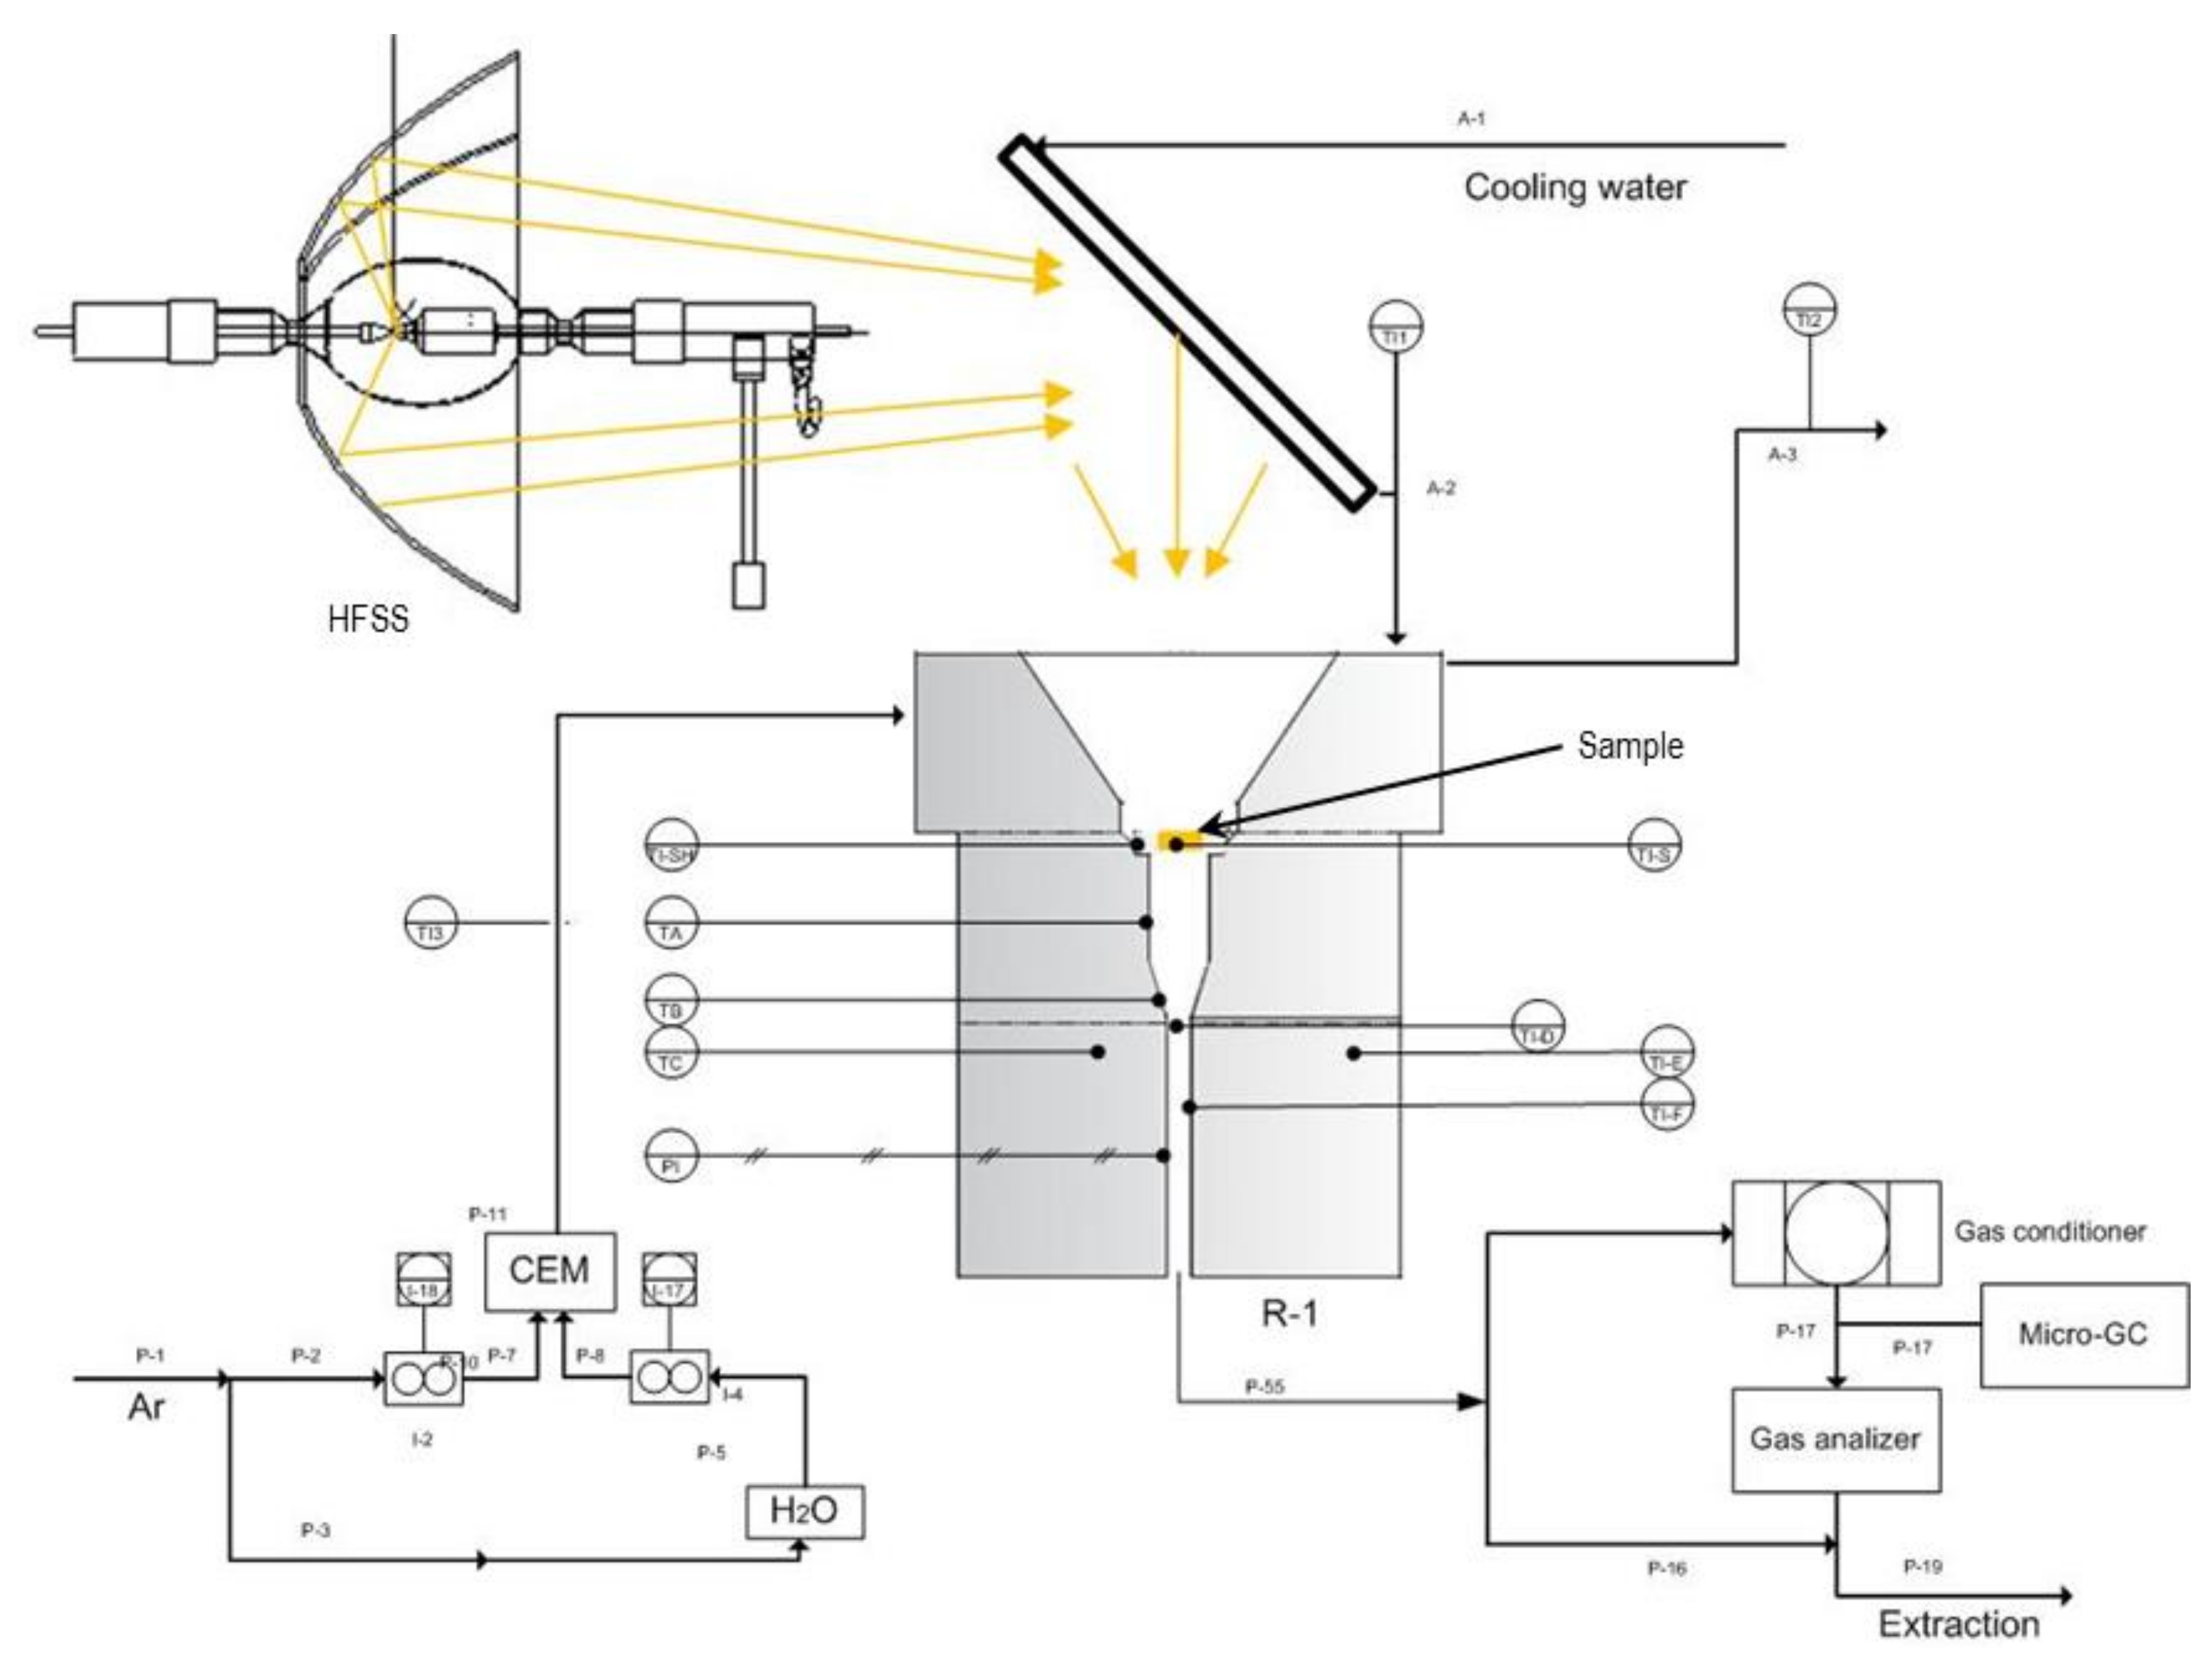
The experimental facility is presented in
Figure 2 and is composed of a high flux solar simulator (HFSS), a solar reactor and several setup devices and sensors [
21]. The HFSS radiation source consists of a 7 kW Xenon arc lamp and an truncated ellipsoidal reflector [
22]. The Xenon arc lamp is located at one of the ellipsoid focal points, so that the reflected radiation is concentrated in the second focal point (
Figure 3). Concentrated radiation presents a Lorentzian profile with maximum irradiance on the focal plane. In order to adjust the overall incident power, different attenuators are used. The attenuators are made from stainless steel meshes of varying mesh size and wire diameter. They are placed by the window of the solar simulator. The radiation is concentrated at the focal point in the horizontal axis by the primary elliptical reflector and then its optical path is modified to the vertical axis by a secondary flat mirror tilted an angle of 45°. The use of a vertical optical axis in the second stage becomes practical for easier handling of samples, especially powders, inside the reactor [
23].
The solar reactor is made up of stainless steel housing, ceramic insulation and a quartz glass window. The housing supports instrumentation and encloses the reaction cavity, thus allowing for a controlled atmosphere inside the reactor. The inner cavity is composed of ceramics bricks (JM 25) and has a conical geometry in the upper part to reduce radiation losses [
23].
Figure 3 shows a cross-sectional schematic representation of the setup, with of the ceramic bricks (in grey) and the sample (in yellow). The quartz glass window has a UV transmittance of 90%, a diameter of 30 mm and a thickness of 3 mm. Radiation passes though the quartz window impinging on the sample. A chiller cools down the mirror and the reactor window in a closed-loop cooling circuit.
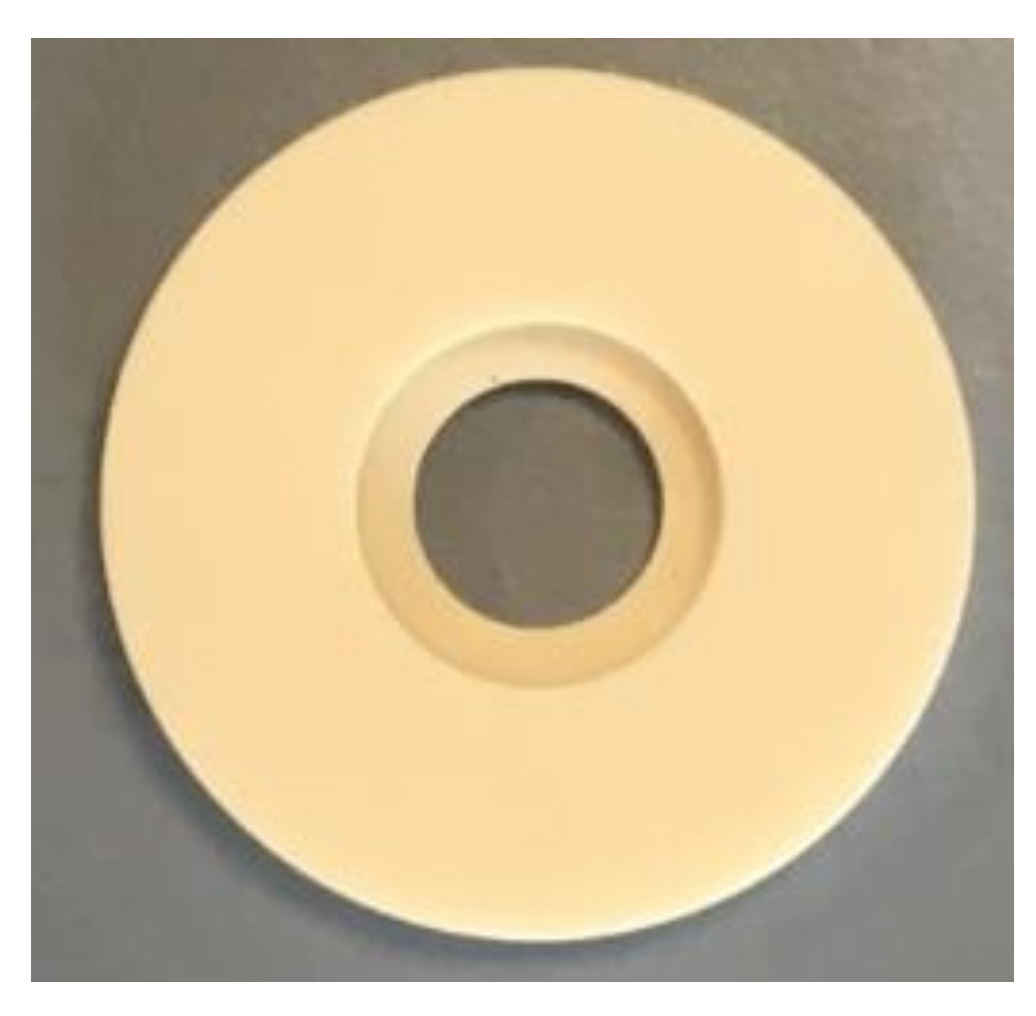
The sample holder is made of 99.96% pure alumina. It is a flat o-ring with a central cylindrical borehole passage of 13-mm diameter at the top and 9-mm diameter at the bottom (
Figure 4). A stainless steel wire mesh is placed inside in order to support the sample in powder form. This grid also helps gas pass though the sample and it is replaced after each test because of its degradation.
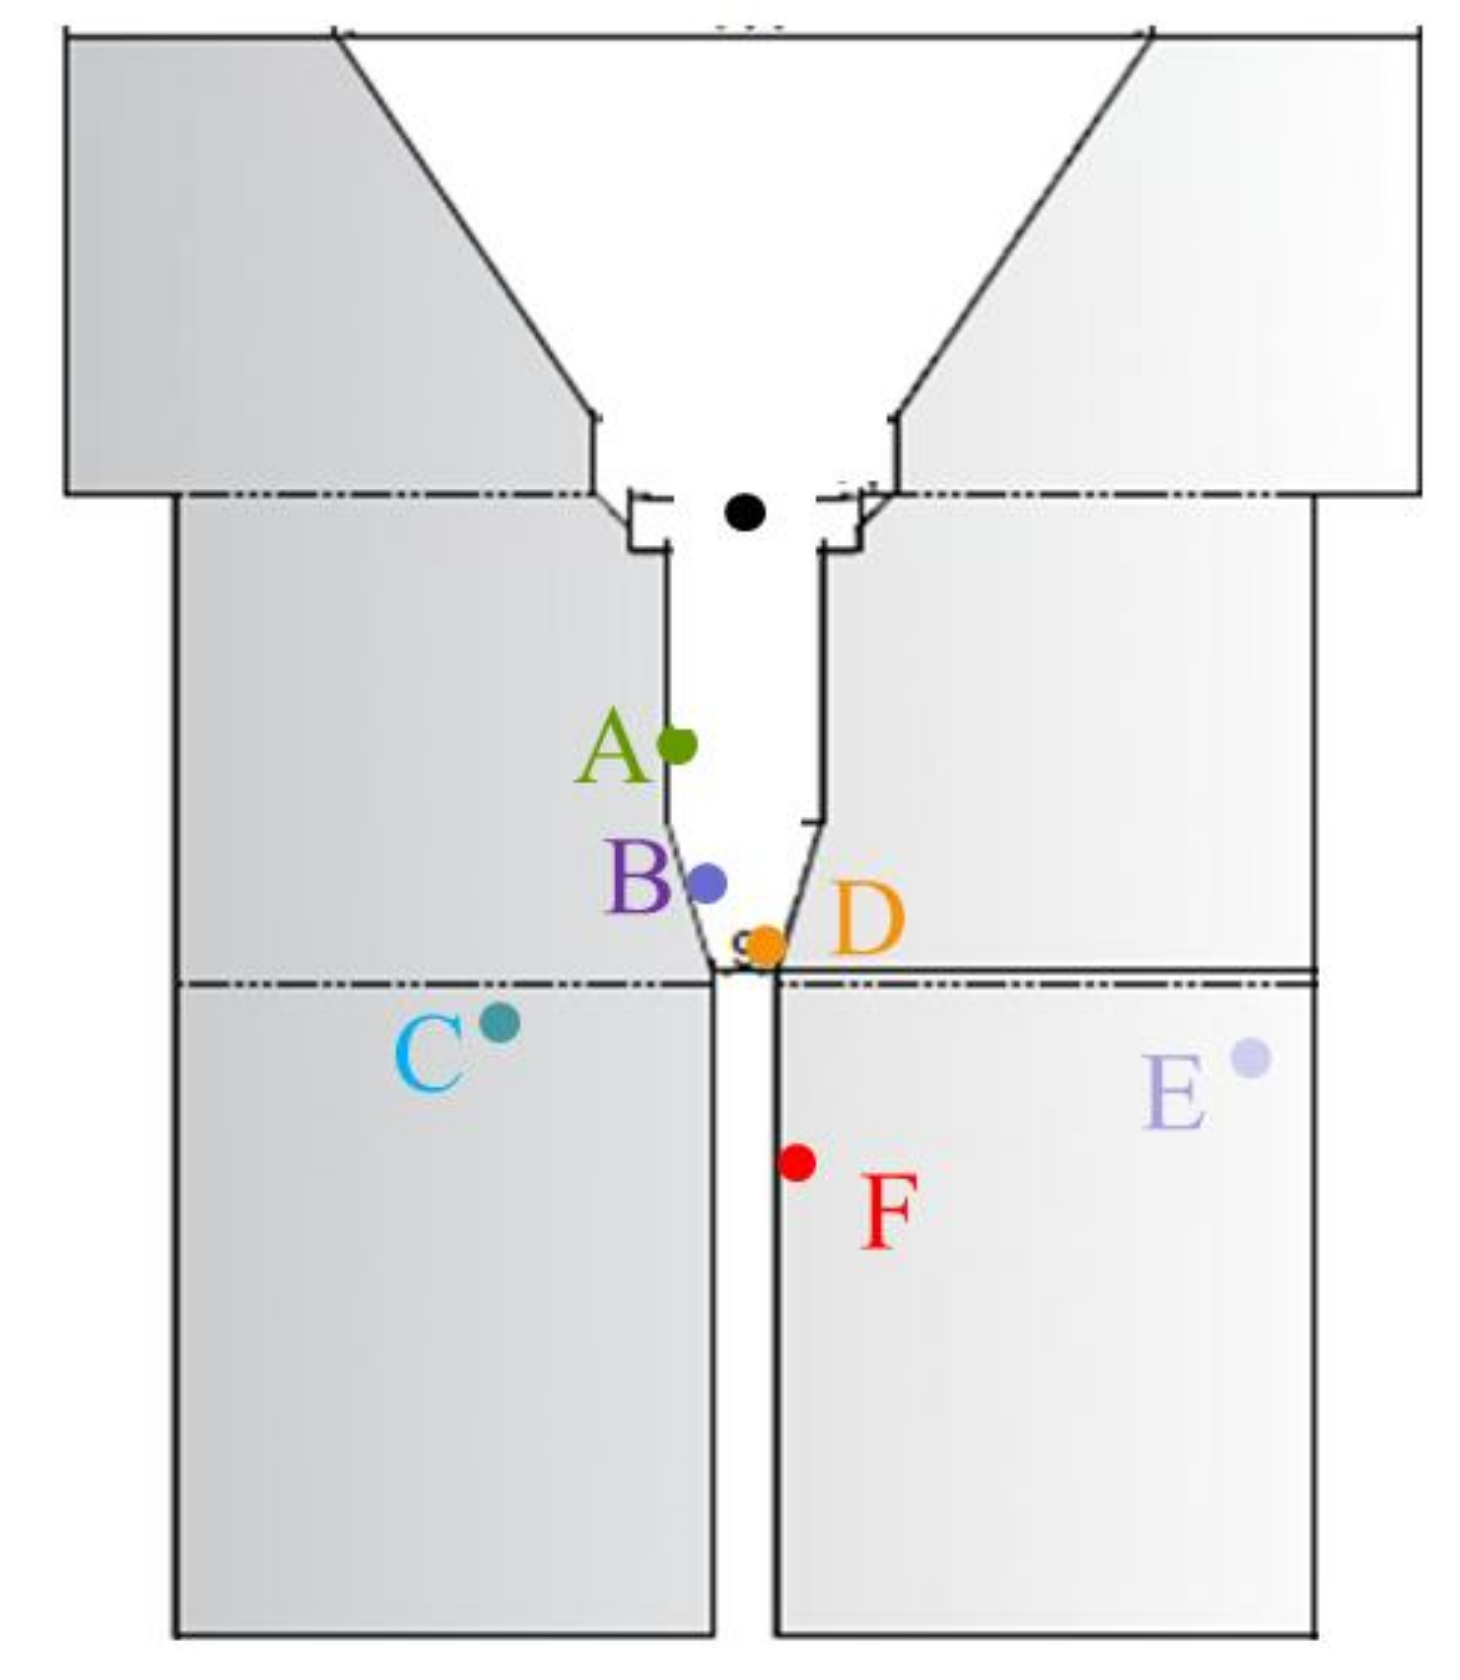
Temperatures are measured by k-type thermocouples and a bichromatic pyrometer (IMPAC Pyrometer IGAR 12-LO, LumaSense Technologies, Santa Clara, CA, USA). Thermocouples identified by letters from A to F are placed in different positions of the reactor as shown in
Figure 5, also a black point indicates the sample position. Temperatures are measure on the sample bottom, on the sample holder bottom, in the gas downstream of the sample and in the insulation walls. The pyrometer monitors the temperature on the irradiated surface of the sample. Measuring the reaction temperature inside the reactor is one of the challenges and not fully solved problems in any high flux/high temperature solar simulator. The pyrometer is affected by radiation reflected from the sample and consequently gives higher temperature values than found in the sample. Since thermocouple measurements at the bottom of the sample (not irradiated) and pyrometer measurements are affected by radiation, actual sample temperatures have been considered to be between both values, closer to the thermocouple reading. These temperature measurement constraints are always evidenced in experimental tests in high solar concentration reactors where dramatic gradients are found between illuminated and not directly illuminated zones [
8].
Gas is fed by 4 inlet ports at the upper part of the reactor that help keep the window clean. Gas is exhausted through the bottom of the reactor. Exhaust gas passes through a gas conditioner in order to eliminate particles and humidity. After that, it is analysed by a Calomat 6® (Siemens, Munich, Germany) in order to determine the H2 concentration (continuous measurement of hydrogen by measuring the thermal conductivity of the gas mixture and using it to calculate the concentration), coupled to a micro-chromatograph (Micro-GC 490, Agilent, Santa Clara, CA, USA, Molsieve 5 Å PLOT 20 M Unheated).
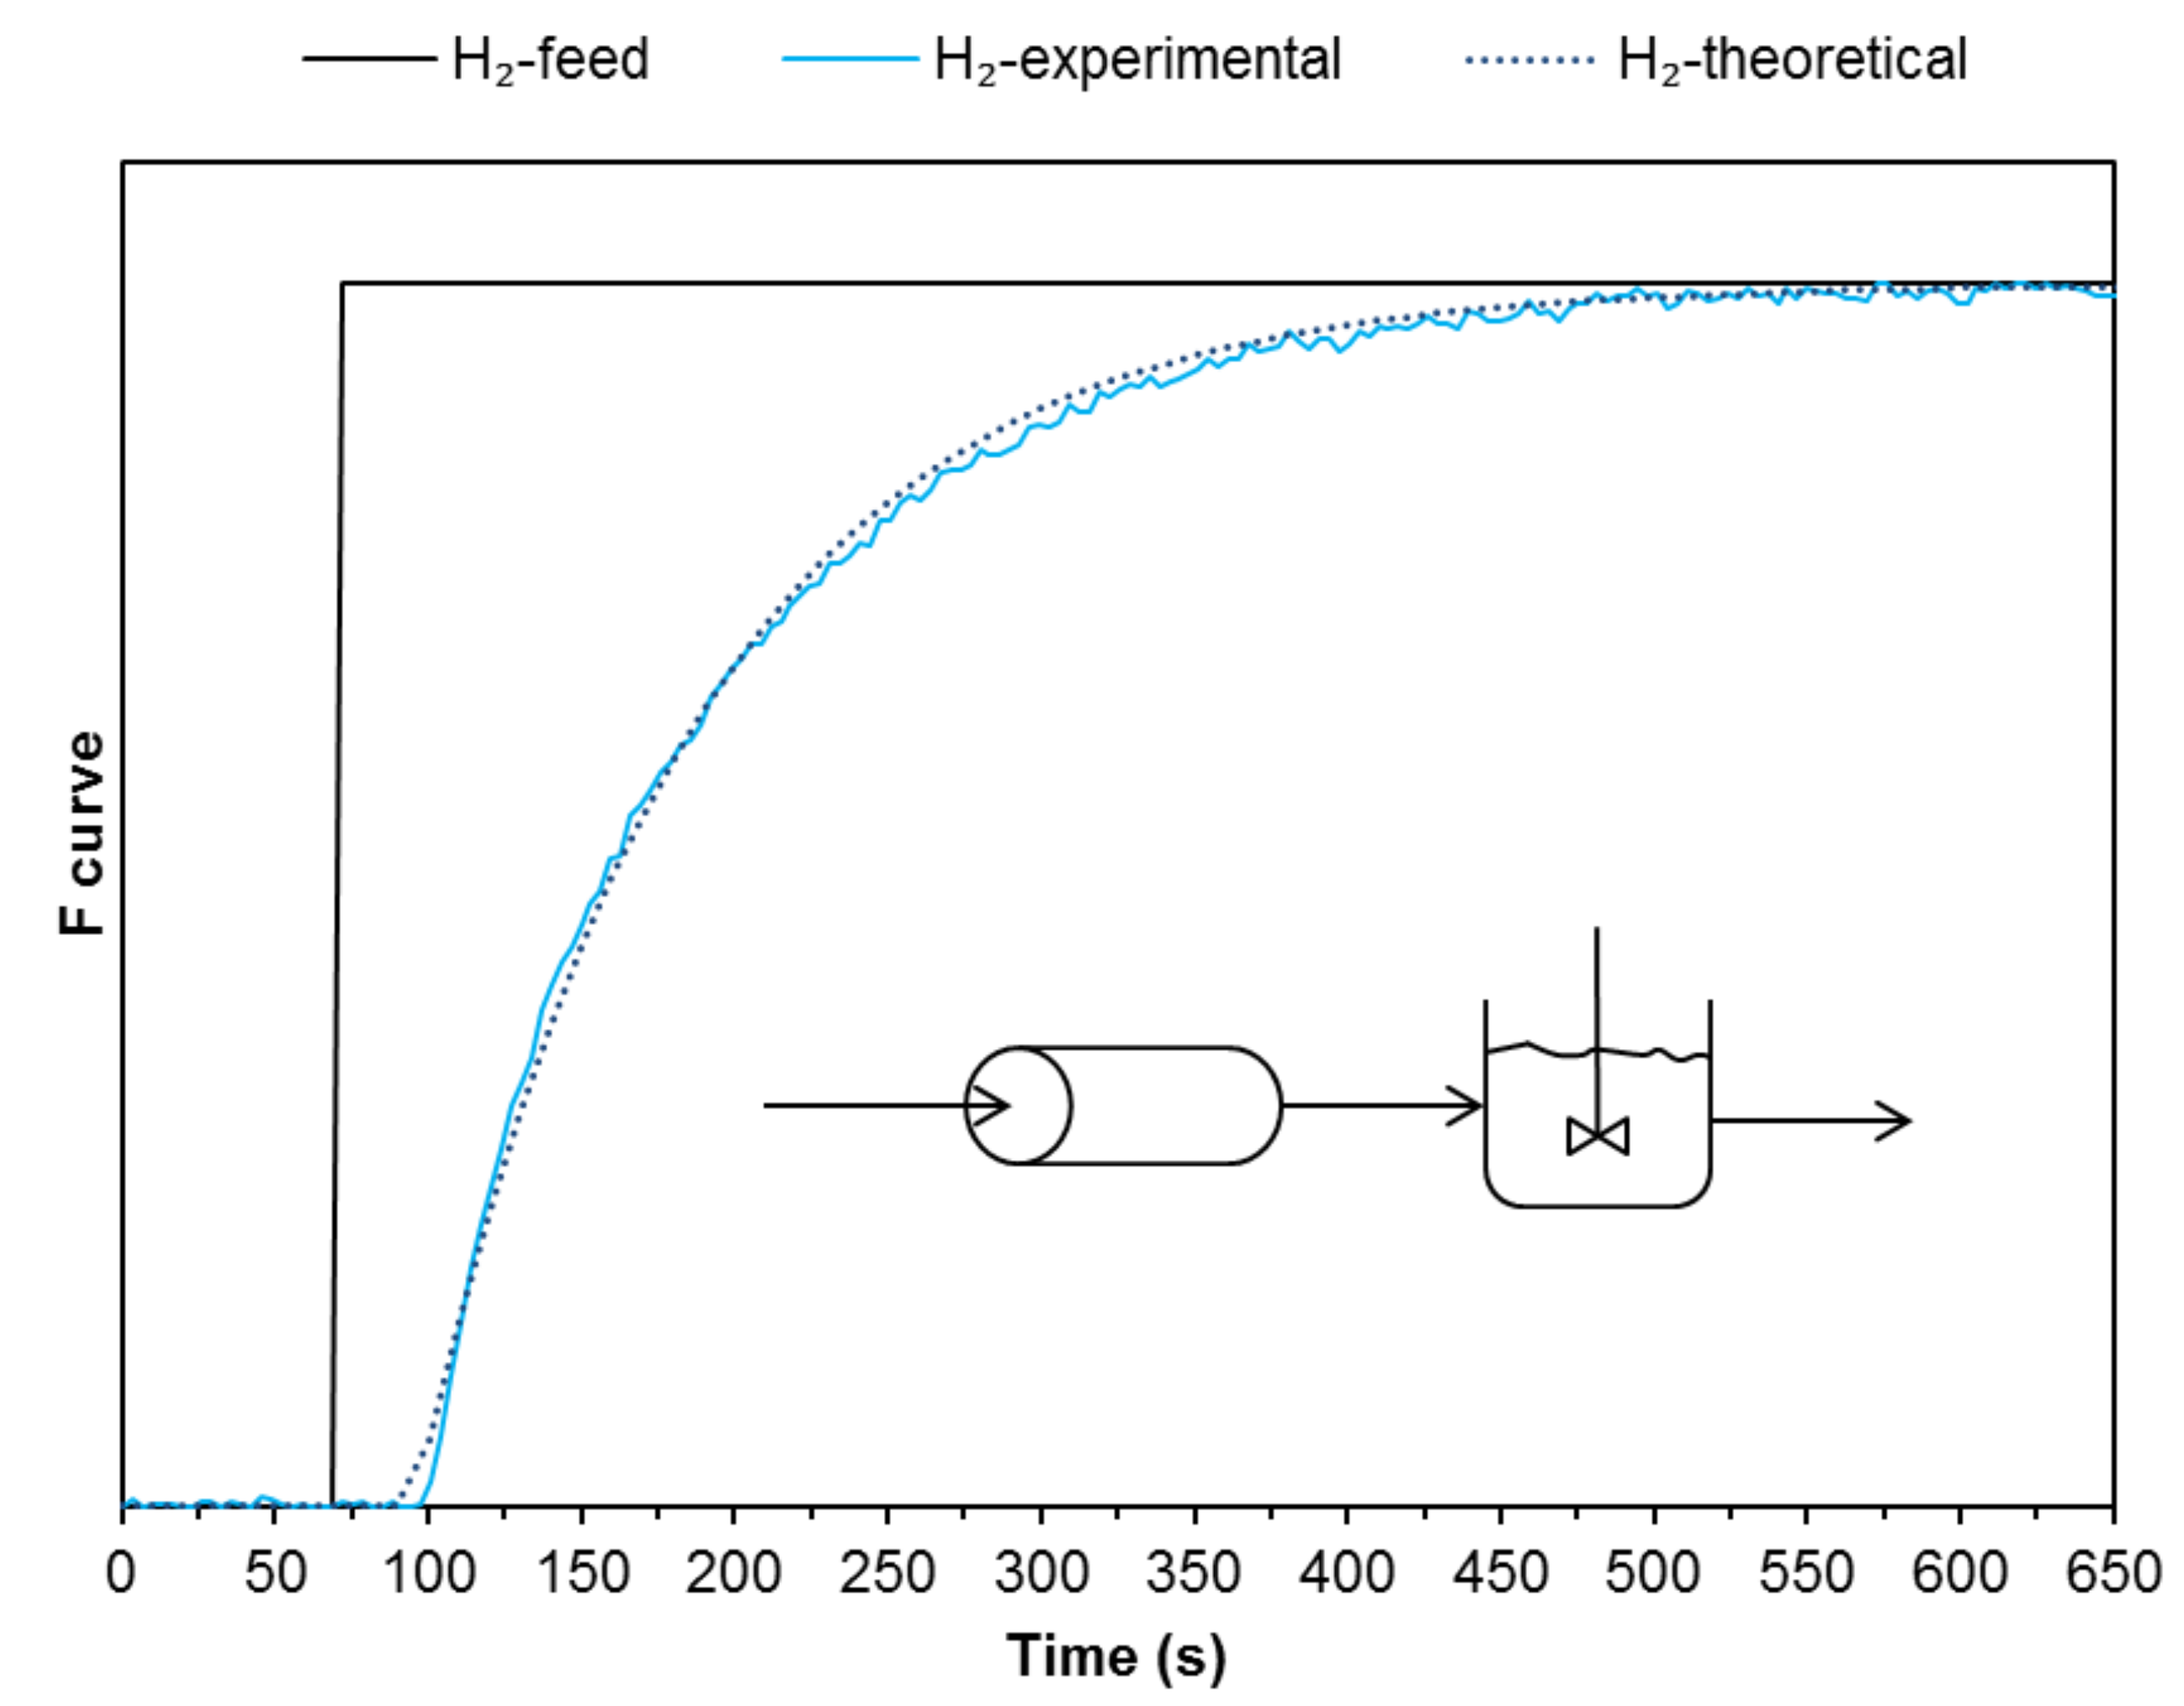
2.1. Residence Time Distribution
The experimental configuration herewith proposed and analysed is based on solid reactants located on crucibles or sample holders, confined inside a cavity and vertically irradiated through a quartz window. Then, it is important to know the flow distribution in the reactor. In order to characterize the reactor, the residence time distribution (RTD) was calculated applying the step input method [
24]. A gas composed of 1 vol.% of hydrogen and 99 vol.% of argon is used as a tracer. At constant volumetric flow rate, gas switches from argon to the mixture of H
2/argon at a given instant and then hydrogen concentration is measured at the outlet of the reactor. The time distribution of hydrogen concentration determines the RTD of the reactor. The dimensionless form of concentration versus time is referred to as the curve
F(
t). In this case, the fixed bed reactor presents a negative exponential function (Equation (3)) with a small delay. In Equation (3),
tm is the time constant and represents the time when 63.21% of the total change has occurred. The negative exponential means a continuous stirred-tank reactor (CSTR) and the delay can be modelled as a plug flow reactor connected upstream in series (
Figure 6).
This characterization shows that the behaviour of the reactor is not producing flow irregularities, such as channelling, recirculation of fluid or stagnant regions [
24]. This implies that the outlet product gas is not affected by the reactor configuration and, therefore, the variations detected in the analysis are due to the reaction itself.
2.2. Working Procedure and Operating Conditions
Table 1 shows the parameters used in water-splitting tests. The sample holder was filled with 330 mg to 430 mg of cerium (IV) oxide (99.9%, trace metal basis, Fisher Scientific, Hampton, NH, USA). The sample weight range is determined in previous tests to guarantee the detection of hydrogen with the gas flow rates used. The diameter of the sample bed is 13 mm, which means that, for an incident irradiance of 2034 kW/m
2, the total power on the sample is 270 W. Bed depth affects to the heat transfer, the kinetics and the conversion. A previous work with directly illuminated manganese oxide samples up to 15 mm thickness studied the evolution of temperatures at different bed depths by experimental data and numerical models [
25]. Temperature divergences between irradiated part and a depth were below 100 °C for values of 1–3 mm, and became noticeable, more than 500 °C, at 13 mm. As a consequence real on-sun tests with bulk material should make use of thermal propagation models for kinetic analysis and characterization of the reactor. For lab-scale testing with HFSSs it is recommended to reduce the thickness of the sample to minimize this impact. In this work, bed depth is reduced to 1 mm, approximately, to avoid low heat transfer limitations. Thermal conductivity for ceria is higher than for manganese oxide and, in terms of practical operation, at least 1 mm thickness is required to monitoring sample temperature and having enough mass to detect the production of hydrogen. Argon is fed at a flow rate of 2.5 NL/min, and also 30 g/h of steam in the oxidation steps. Before the beginning of each test, argon is used to purge the air inside the reactor to ensure inert atmosphere conditions.
Redox cycles were carried out by varying the radiation impinging upon the sample. Reductions were performed irradiating the sample with 50% of the total radiation by employing an attenuator (1017 kW/m2, 135 W) and 100% of radiation (removing the attenuator) at different times in each experiment (2034 kW/m2, 270 W). Oxidations were performed by reinstalling the attenuator and turning off the solar simulator in order to cool down the sample.
3. Water Splitting of CeO2
Three tests were performed with three consecutive redox cycles in each.
Table 2 shows the maximum sample temperature achieved, the volume of hydrogen produced, the extension of reactions and the percentages of partial or total cerium oxide reduced for the three cycles. It is expected that the actual sample temperature is between the measured values of the thermocouple and the pyrometer. The last four variables in Test 1-Cycle I include two values, the first one considers the whole cycle, and second one considers only the cooling step.
It should be highlighted that the strategy has been to look for the conditions to optimize hydrogen production. During Test 1, 100% radiation was purposefully employed at various times in order to study the performance and behaviour of the sample, starting in Cycle I with a long irradiation period in order to achieve maximum sample temperatures and, theoretically, maximum reduction rates as well. However, the sample was dramatically affected, therefore 100% irradiation periods were reduced afterwards. In Tests 2 and 3, the objective was to make 3 similar cycles, in order to study sample cyclability. From the conclusions after Test 1, a reasonable irradiation time of 20 s was selected for Test 2 to produce sufficient yield and preserve the integrity of the sample. Since the volume of hydrogen produced was still low in Test 2, the irradiation time at 100% power was increased up to 120 s in Test 3.
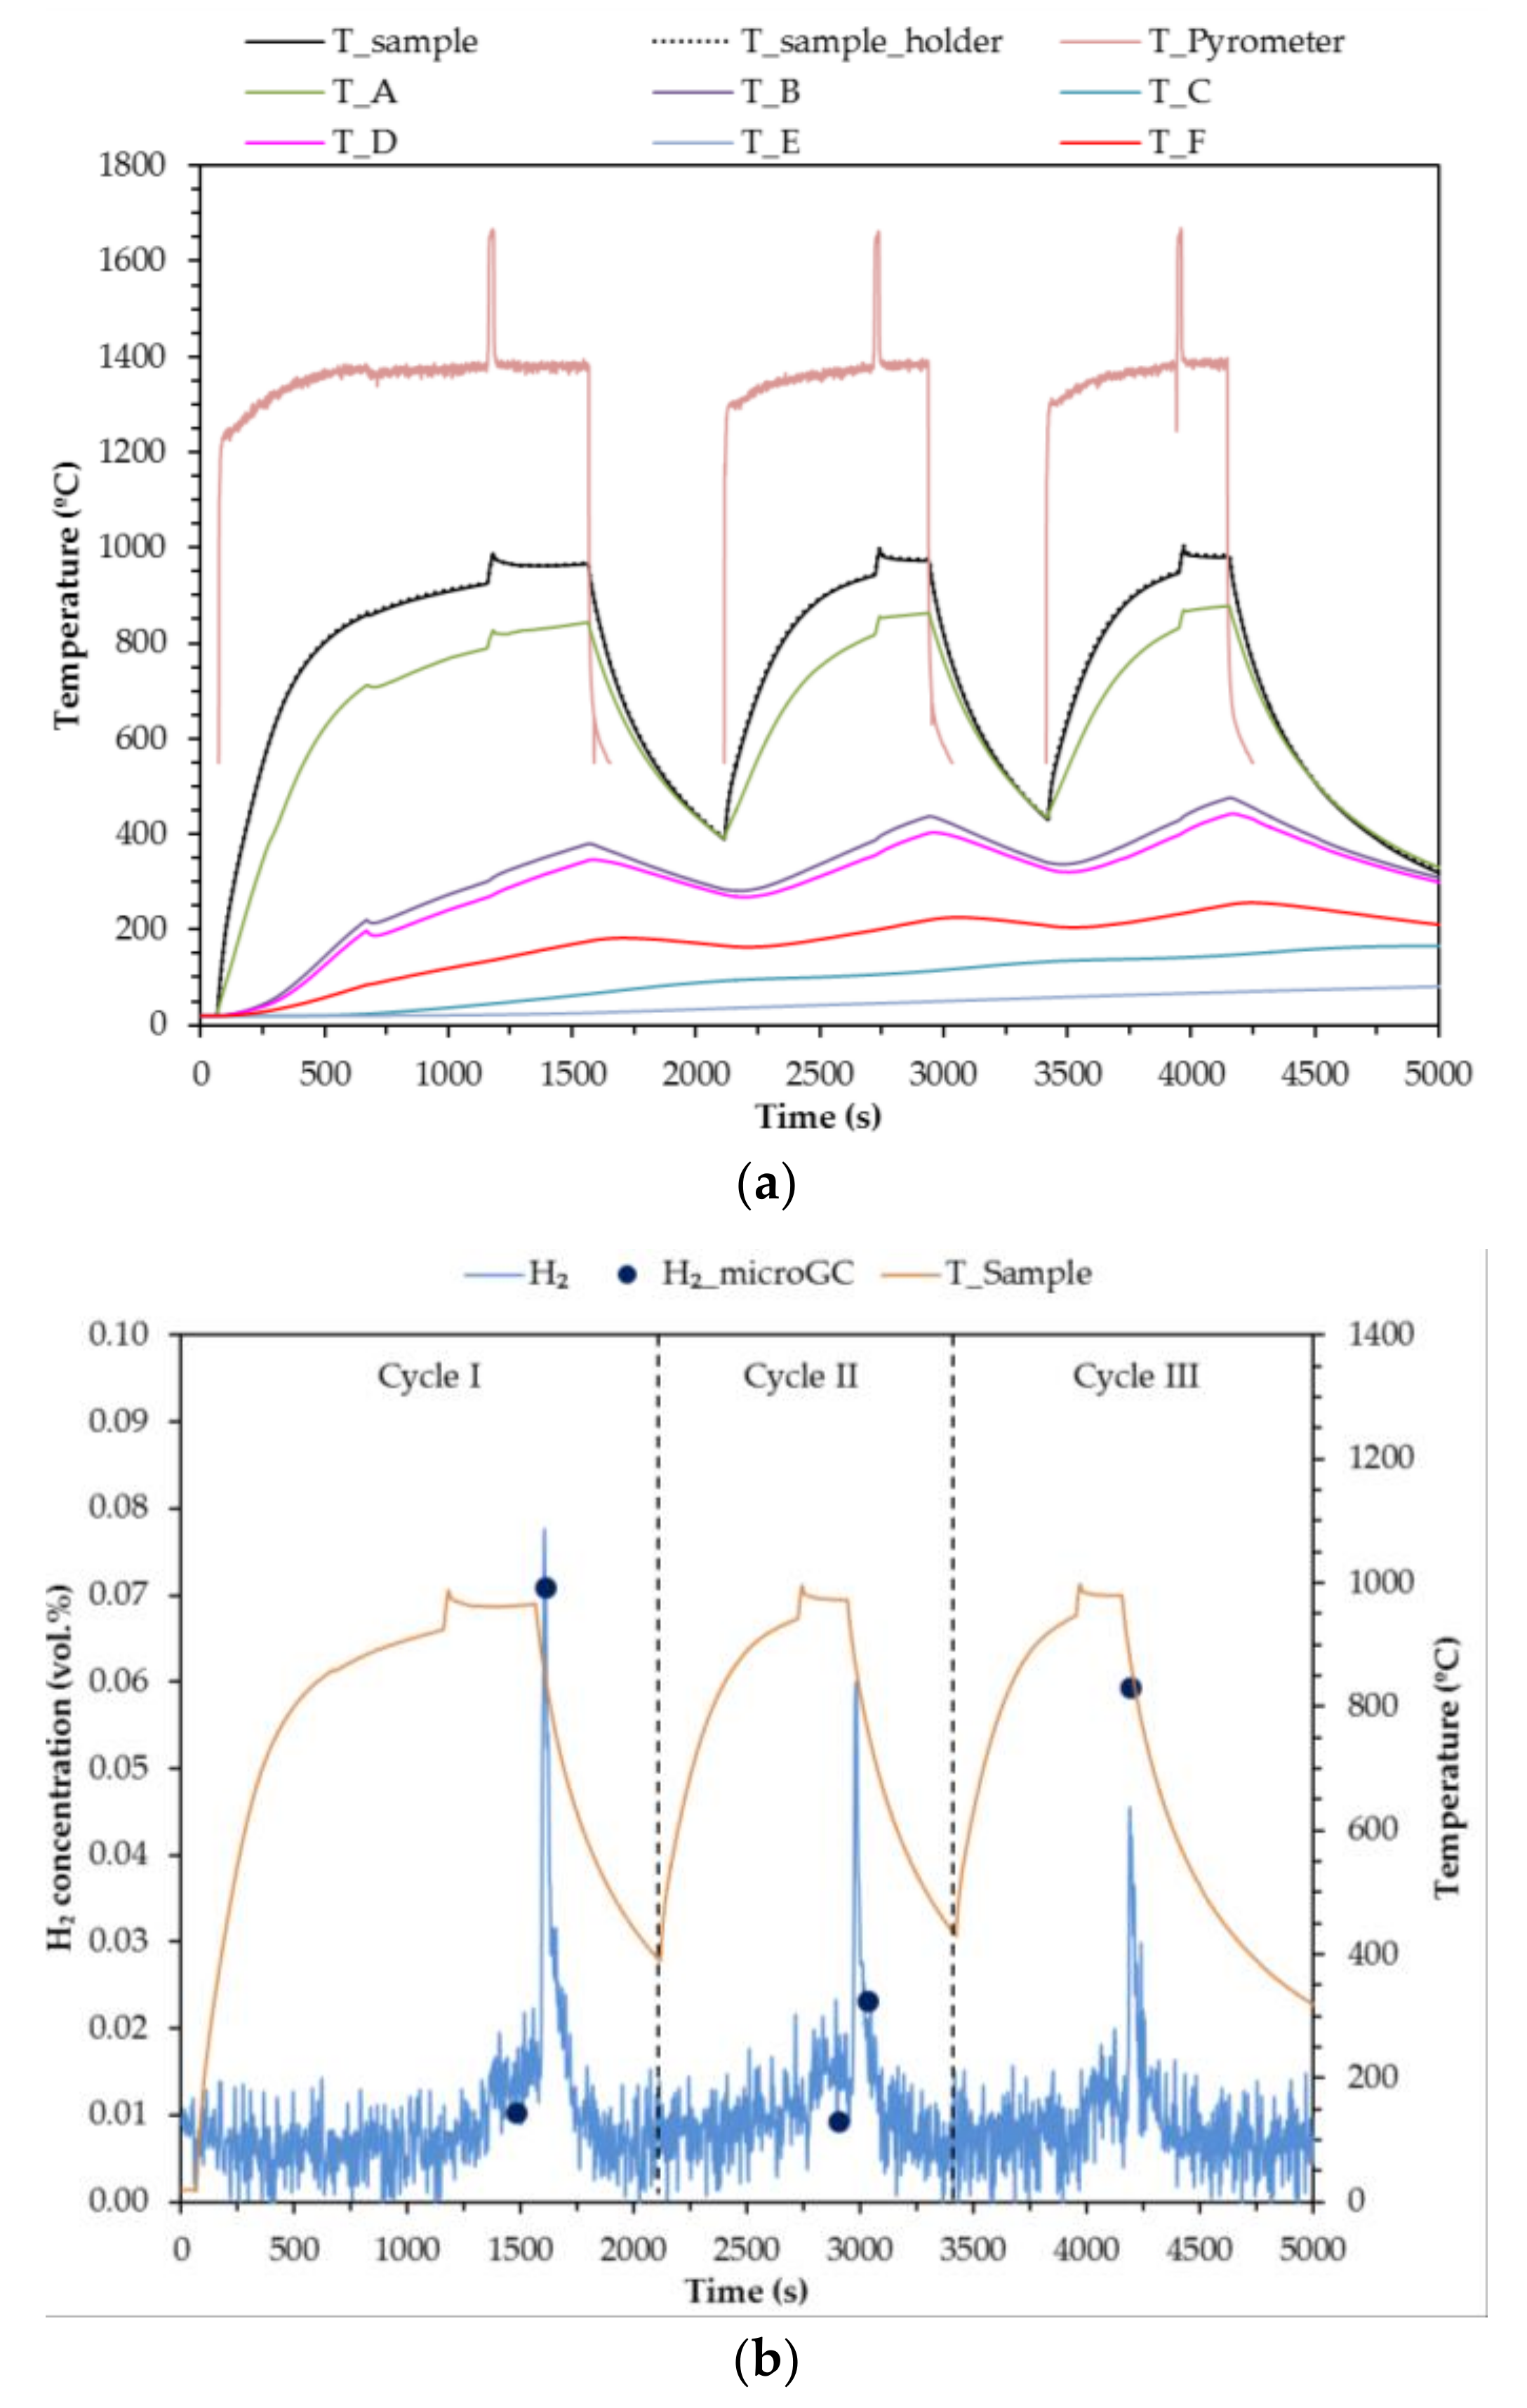
The results of Test 1 are shown in
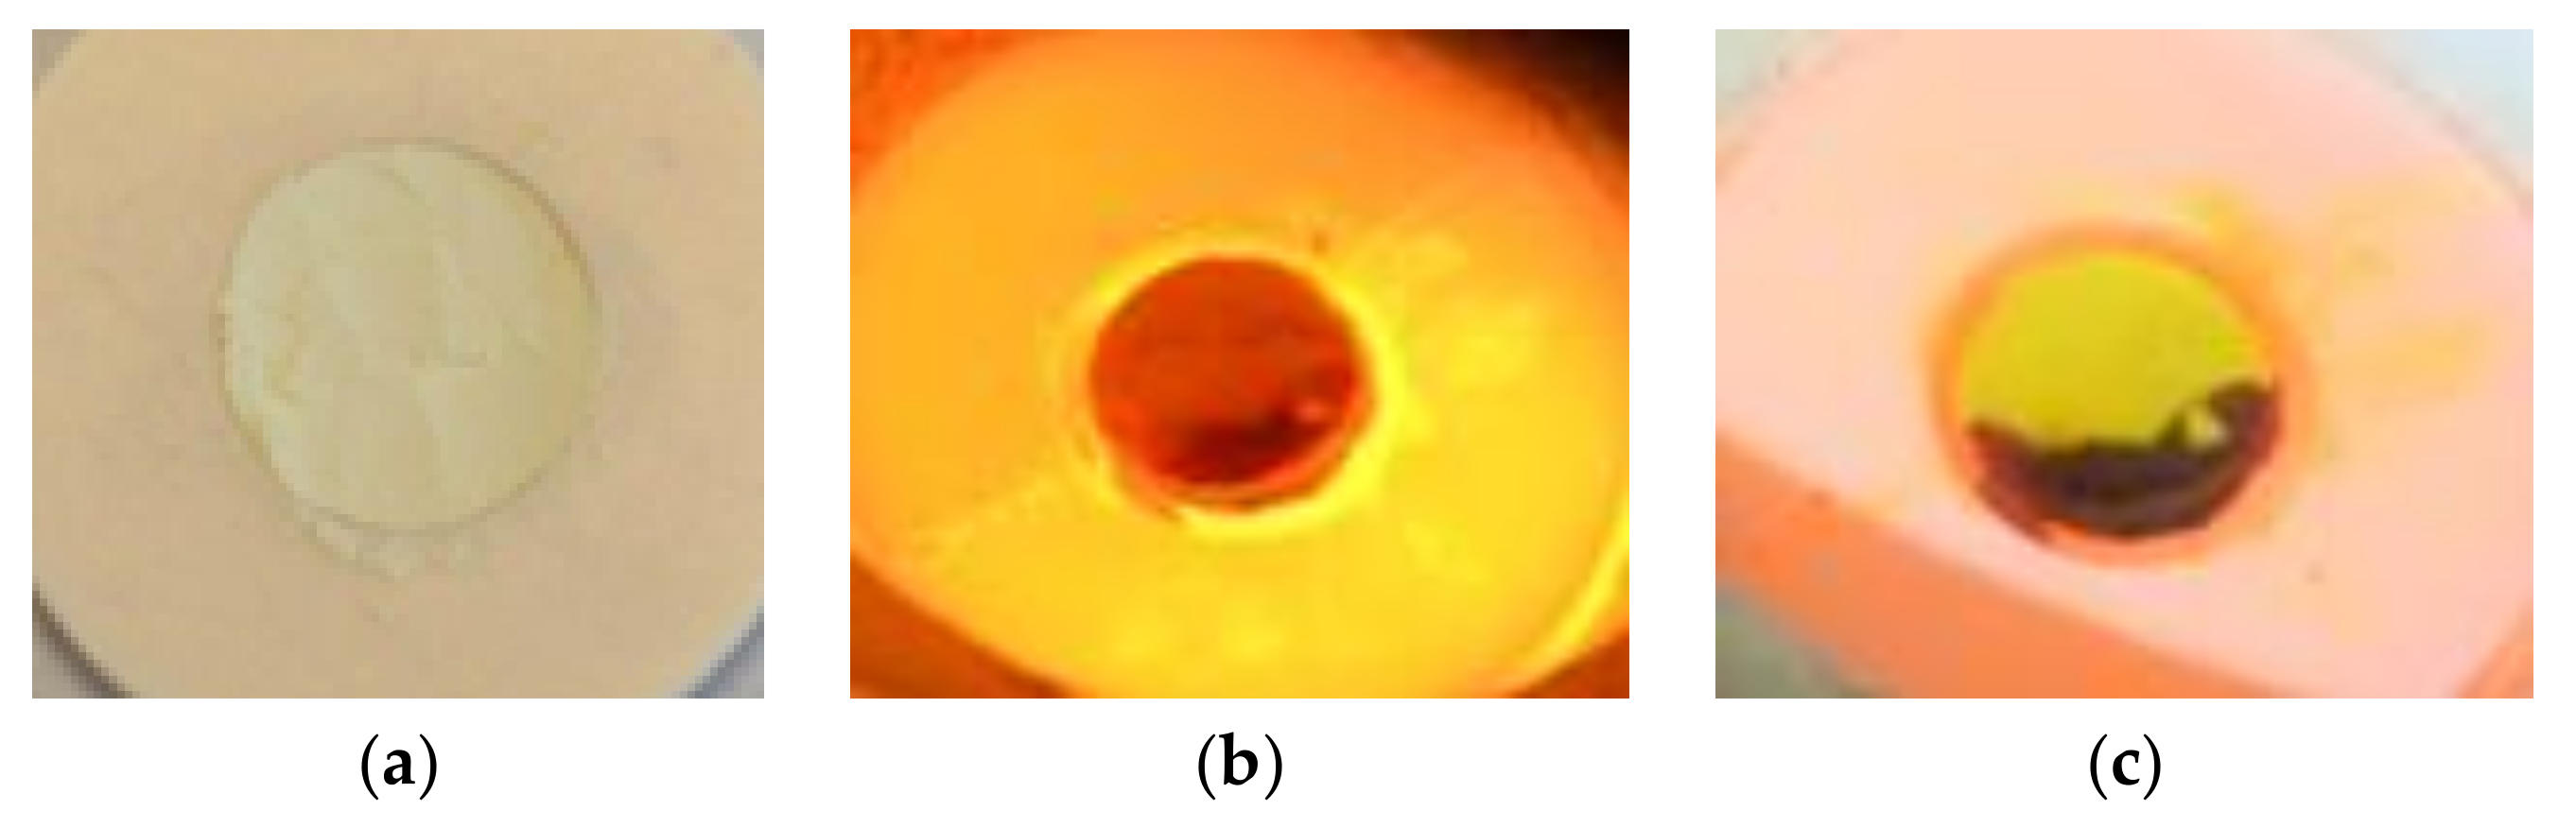
Figure 7. The test starts by heating the sample with a 50% attenuation level. Right after turning on the HFSS, the sample colour changes radially from white to brown.
Micro-chromatograph and gas analyser measurements detect hydrogen during the first heating leg. Steam is not fed during this heating (reduction) leg, but it is possible that there is some remaining water present in the pipes and some of the reduced ceria is oxidized with this water producing hydrogen. When the sample reaches around 900 °C, the attenuator is removed, and full irradiation of the sample ensues (270 W). Once the sample temperature changes less than 1% in 1 min, steam is fed while keeping the irradiated at 100% power (
t = 1260 s). The maximum sample temperature achieved is 1282 °C. After 2 min of steam flow (
t = 1380 s), the attenuator is reinstalled (the power is reduced to 135 W) and the hydrogen concentration increases. When the hydrogen concentration starts to decrease, the HFSS is turned off (
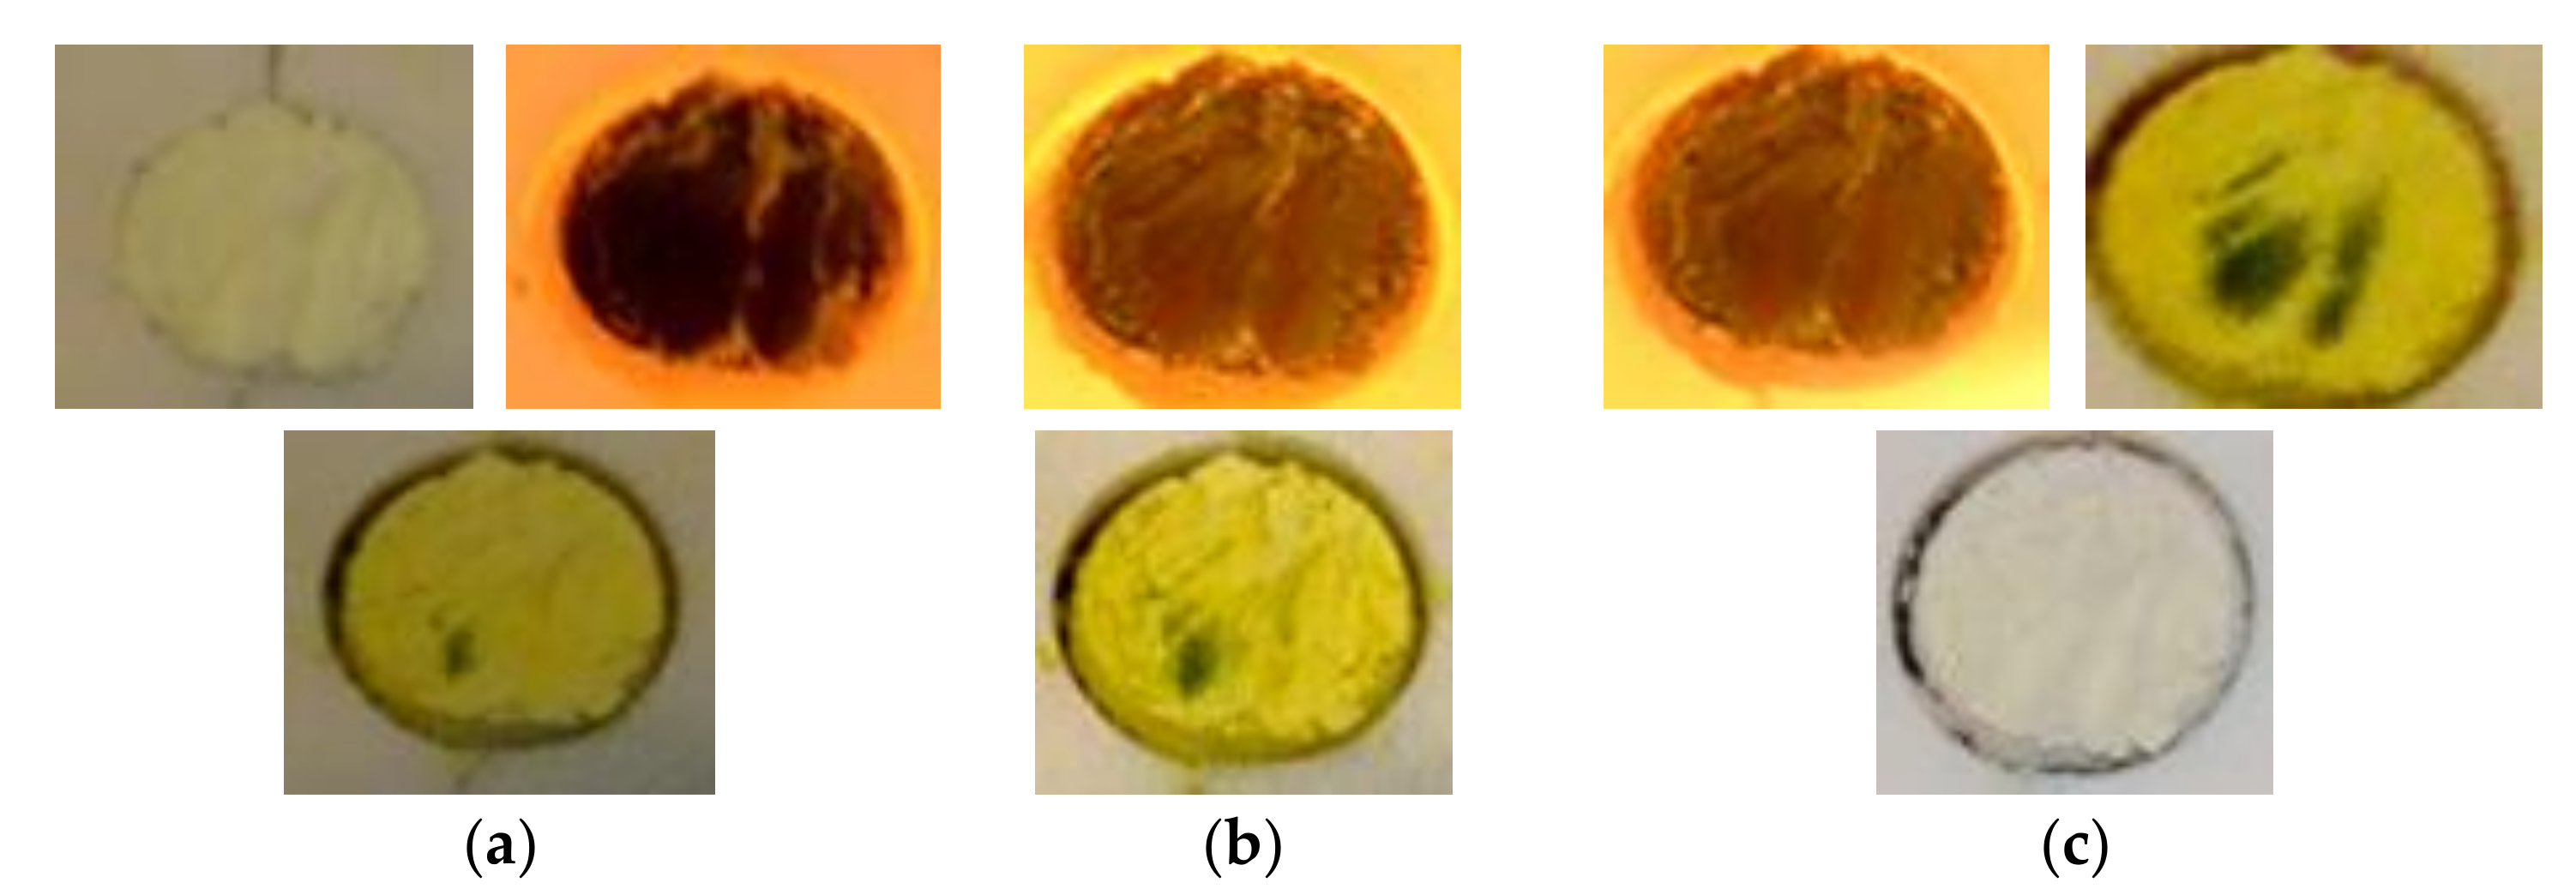
t = 1680 s), and another peak of hydrogen production is observed. With HFSS switched off, the sample colour changes from dark green to intense yellow. Also a black part is observed as shown in
Figure 8.
Once the entire sample is yellow, except for the black part, the HFSS is switched on to start Cycle II at a 50% attenuation level. The same operation procedure is followed, except that the irradiation time at full power is reduced to 20 s in this case because of the earlier sample degradation during Cycle I. The maximum temperature achieved is 1127 °C.
The third cycle is performed exactly the same as the second one. The maximum temperature achieved is 1037 °C. The hydrogen production decreases with the cycles, and also the temperature. Lower temperatures imply lower reduction rates, and also lower hydrogen production in the oxidation steps.
The black region observed after the first cycle remains black after cold inspection and has a rigid plastic texture. This might be explained by local overheating due to photon-phonon interactions as reported in the literature for other materials subjected to high irradiances [
26]. This part lost its reactivity. Therefore, in the second and third cycles, a lower amount of ceria was reactive.
Integration of the hydrogen concentration curves show that 4.78 mL of hydrogen were produced in the first cycle, with a value of 2 − δ = 1.92. However, removing the hydrogen that was produced during the first heating leg, and considering only the hydrogen that was produced after t = 1000 s in the first cycle, the volume of hydrogen produced is equal to 3.1 mL with a 2 − δ = 1.95. After the reduction leg, the sample probably presents a mix of non-stoichiometric cerium oxides. Assuming only two cerium oxides, the first composition produced considering equilibrium, CeO1.83, and the stoichiometric reduced oxide, Ce2O3, it can be concluded that around 32% of the sample was reduced to CeO1.83, or that 11% was totally reduced to Ce2O3.
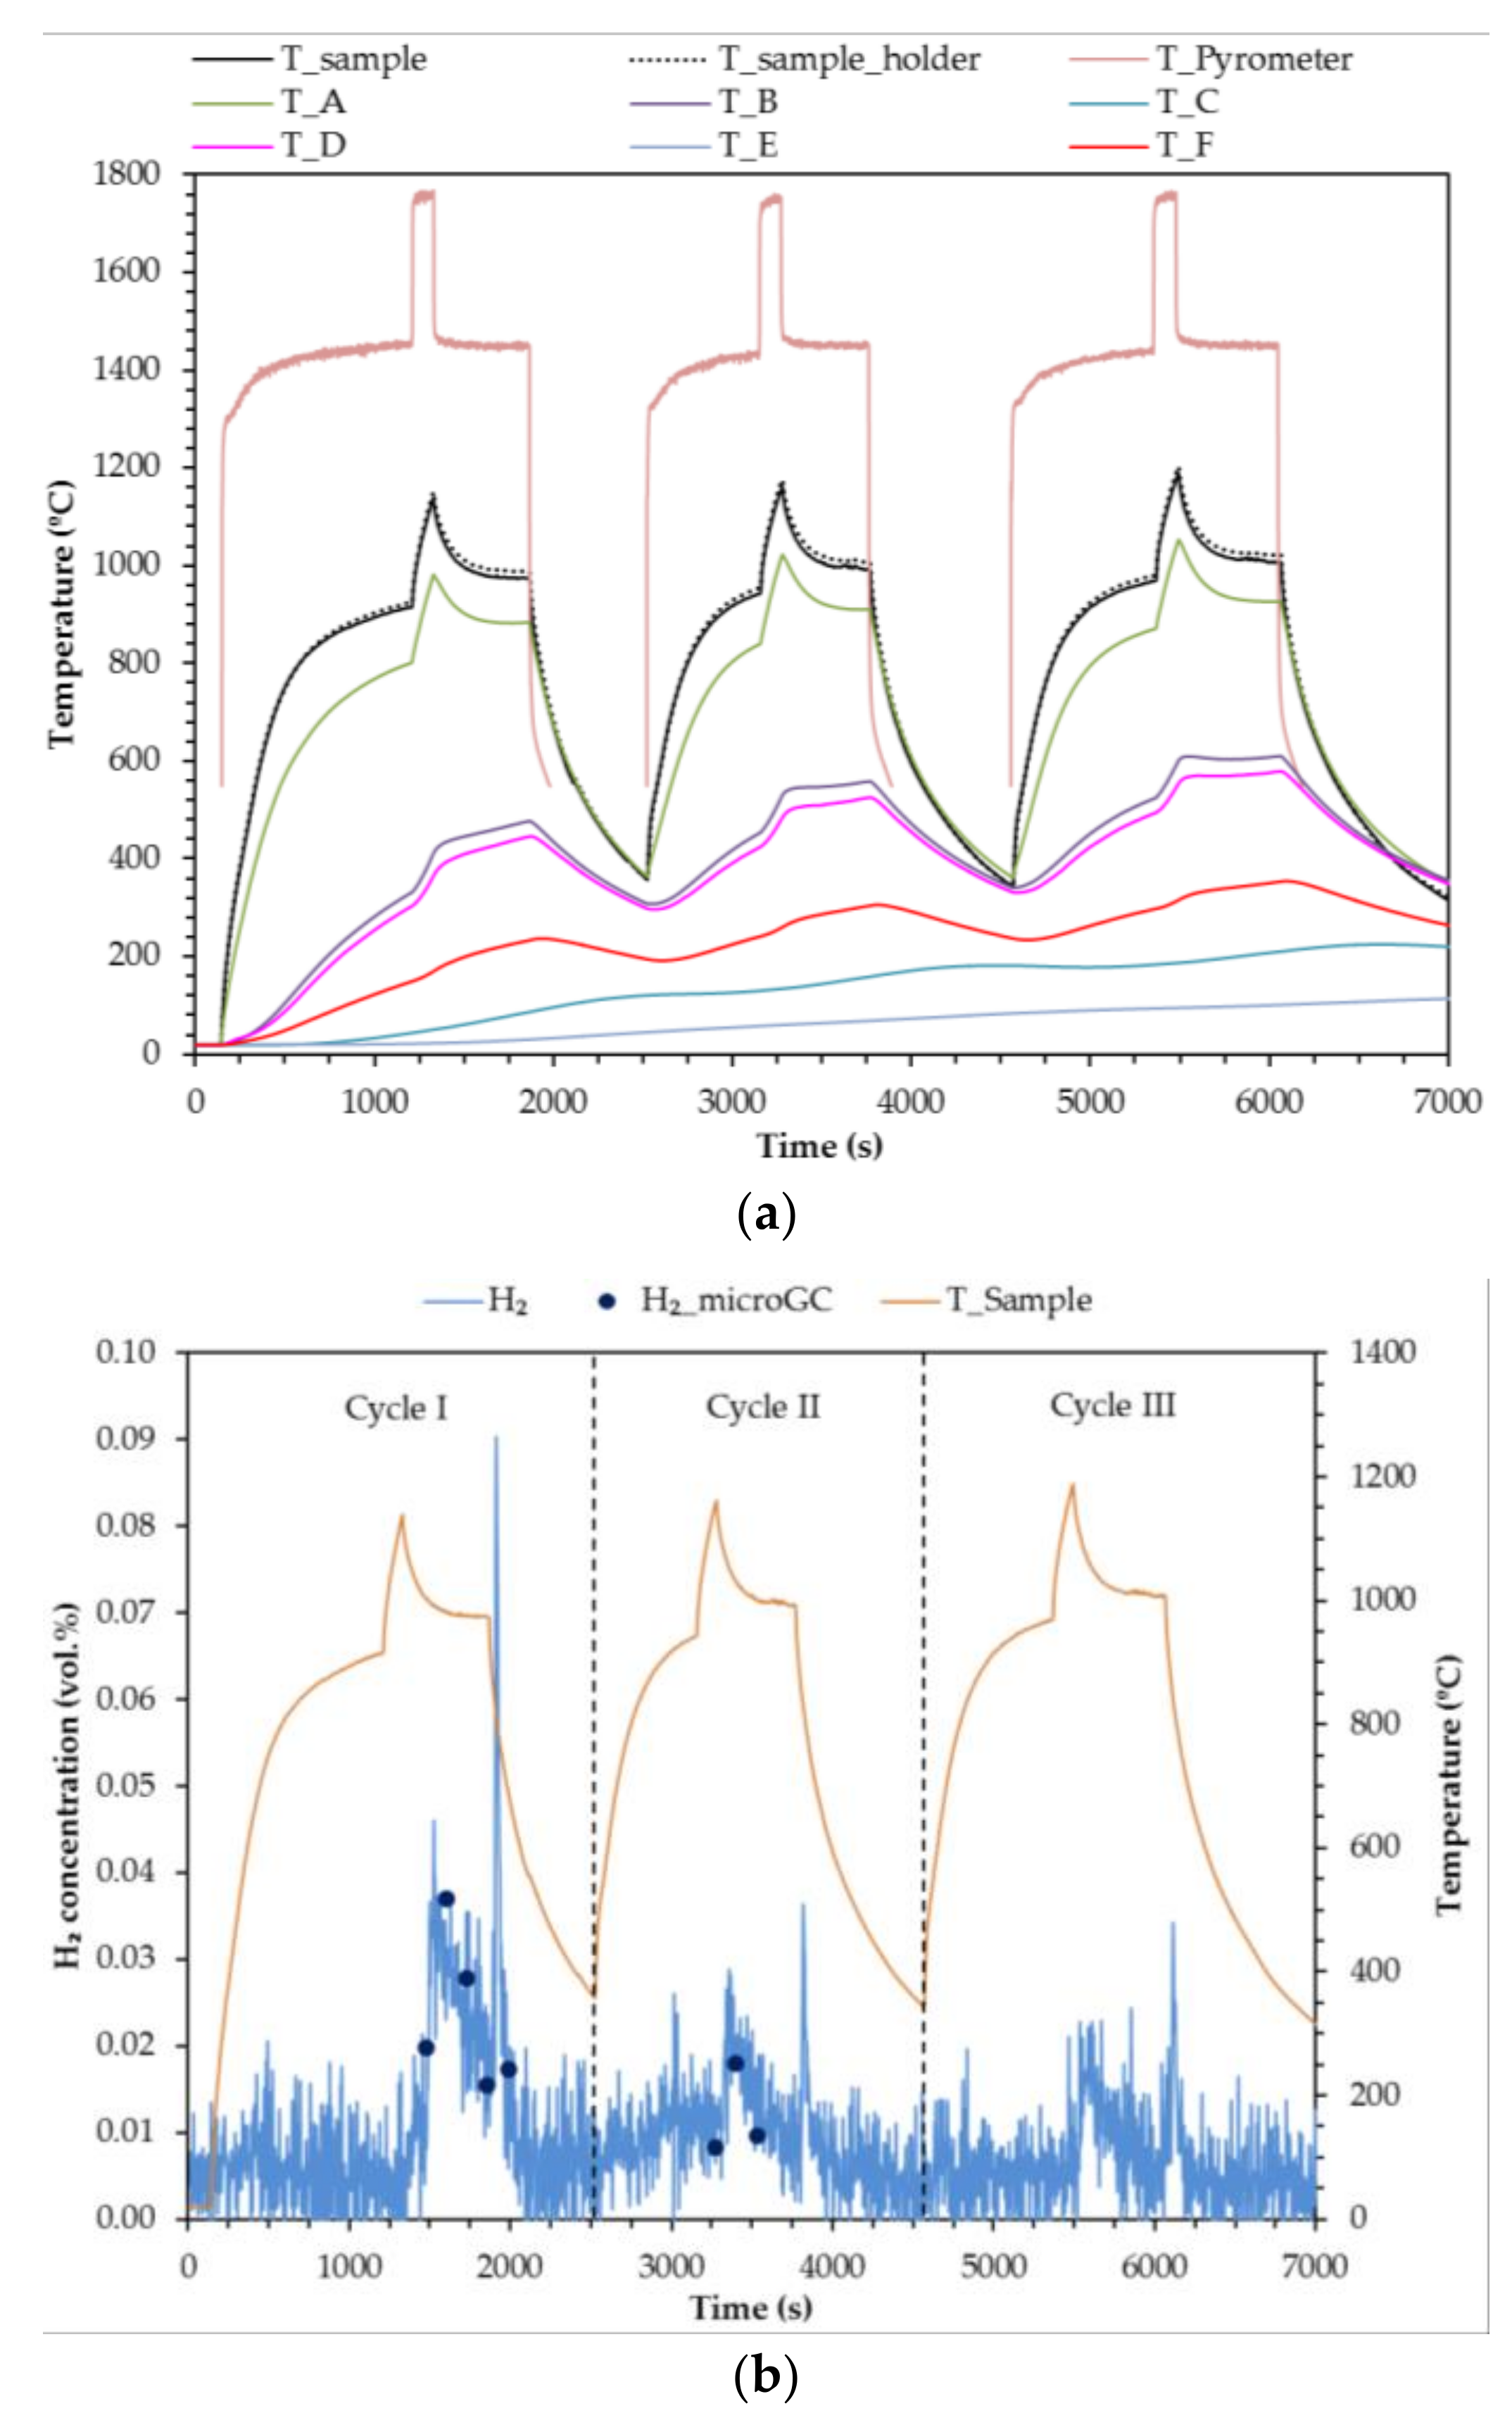
Taking into account the results from Test 1, a second test was carried out reducing the periods of time during which the sample was irradiated at 100% power in order to avoid degrading it. Results of test number 2 are shown in
Figure 9. It starts by a heating leg at a 50% attenuation level. When the HFSS is switched on, the sample colour changes to brown, from the region subjected to peak flux and radially outwards through the rest of the sample. Once the sample reaches 900 °C, the attenuator is removed (
t = 1155 s) and the sample becomes darker in colour. To prevent sample degradation, the irradiation time at 100% power is limited to 20 s. The maximum temperature achieved in the first cycle was thus 998 °C.
With the attenuator in place again, steam feeding is started at
t = 1300 s. A small fraction of hydrogen production is detected. When the hydrogen concentration begins to decrease, the HFSS is switched off (
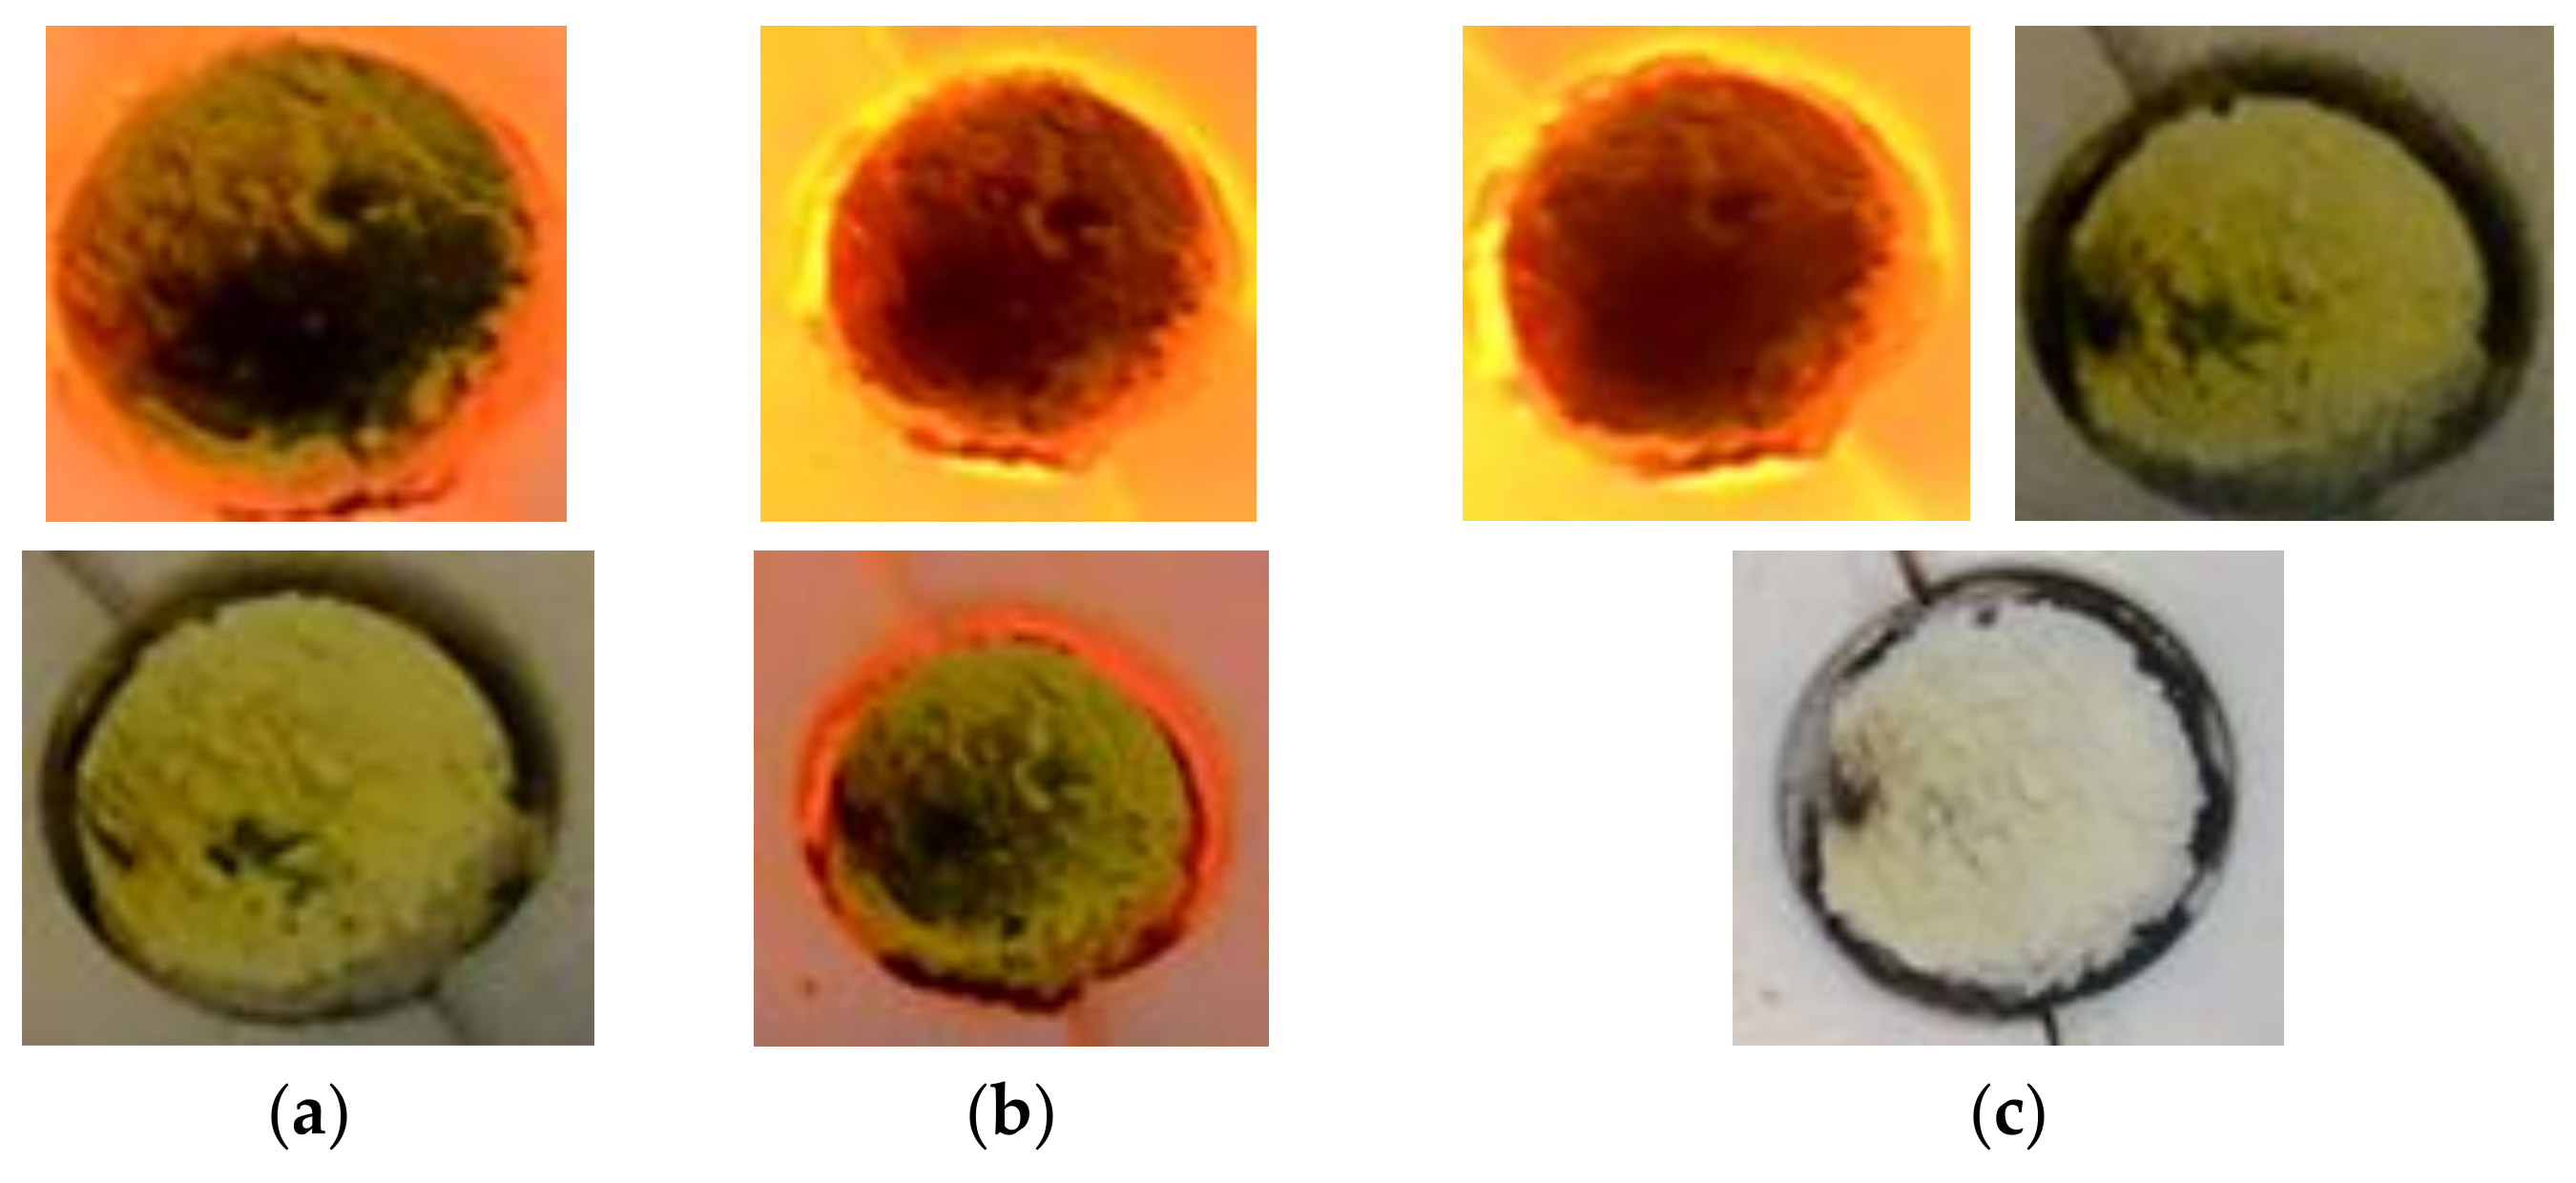
t = 1560 s). The hydrogen production peak is achieved in that moment. The sample colour changes from dark green to intense yellow (
Figure 10). Once the sample is completely yellow, the steam supply is cut off and the HFSS is turned on with a 50% attenuation level. This procedure is repeated in the two subsequent cycles.
Hydrogen production decreases with cycles despite the fact that the temperature achieved is similar (996 °C in Cycle II and 997 °C in Cycle III). That suggests the presence of some structural or morphological changes in the sample, probably sintering. The volume of hydrogen produced in Cycle I of Test 2 is 1.6 mL with a 2 − δ = 1.97. Around 18% of the sample was reduced to CeO1.83, or 6% was totally reduced to Ce2O3.
Finally, a third test was carried out with pure ceria. The results of Test 3 are shown in
Figure 11. Repeating the procedure of Test 2, the sample was irradiated at 100% power for 2 min in this case (a period of time between Test 1-Cycle I and Test 2).
The maximum temperature reached in cycle I was 1140 °C. Colour changes in the sample can be seen in
Figure 12.
Hydrogen production decreased with number of cycles even though the maximum temperature increased. The volume of hydrogen achieved in the first cycle was 2.11 mL which implies a 2 − δ = 1.97, 29% of the sample was reduced to CeO1.83, or 10% was totally reduced to Ce2O3.
Considering the results of the three tests, it can be concluded that the higher the temperature achieved during the reduction leg, the higher the reduction rate and the hydrogen production. However, radiation affects the chemical reactivity of samples, which decreases at lower temperatures than would be the case with heating in a conventional oven. Ceria is stable up to 2000 °C, however, its cyclability diminishes in tests conducted in the HFSS at substantially lower temperatures, typically between 1280 °C and 1480 °C. In order to avoid this degradation, it is necessary to find a trade-off between maximum temperature levels for hydrogen production and sample stability. From results obtained it is observed that:
An exposure time of 9.5 min at 100% radiation (2034 kW/m2) produces irreversible damage in the sample.
An exposure time of 20 s at 100% radiation leads to lower temperatures (1000 °C) and lower conversion rates (4.5%–6.2%).
With an exposure time of 2 min at 100% radiation, temperatures reached a range between 1150 °C and 1200 °C, a similar conversion rate is achieved (9.7%) in comparison to longer exposure times (Test 1-Cycle I: 10.9%), and there is no irreversible damage in the sample.
In order to estimate the efficiency achieved in these experiments, in addition to conversion rates, the solar to fuel efficiency and the volume of hydrogen per gram of ceria have been calculated. Results are shown in
Table 3. The solar to fuel efficiency is defined as the energy contained in the products, the high heating value of hydrogen (HHV
H2), to the solar energy input (
Qsolar) (Equation (4)) [
27]:
The solar energy input is given by the HFSS power level (
P50% = 135 W,
P100% = 270 W), multiplied by irradiance times in each case (
t50%,
t100%) (Equation (5)):
The volume of hydrogen produced in Test 1-Cycle I, which was 3.1 mL has been used to calculate these variables (only the hydrogen produced during the oxidation leg, because the sample was reduced after the initial hydrogen production).
Solar to fuel efficiencies are very low in all three tests, and a small amount of hydrogen is produced with respect to the energy input. It should herewith be highlighted that the efficiency calculation is employed to establish the characterization, and to estimate the level of spillage and inefficiencies inherent to lab-scale solar simulators utilized for experimental thermochemical cycles, therefore helping to correctly size both sample and power input. Increasing solar to fuel efficiencies would be possible by decreasing non useful periods of irradiance time at 50% of power (t50%), however this kind of optimization is beyond the scope of the present work.
Although experimental conditions in Tests 1, 2 and 3 are different, the comparison of solar to fuel efficiencies between them provides indications on the most adequate operating conditions in terms of solar energy conversion. Even though Test 2 produces lower reduction rates, its solar to fuel efficiency is higher, because the solar energy input decreases to a higher extent than the hydrogen production. Test 3 produces a higher amount of hydrogen per gram of ceria. As a reference, Chueh et al. [
13] achieved an experimental solar to fuel efficiency of 0.8% with a porous monolith of ceria and reduction temperatures between 1420 and 1640 °C.
4. Conclusions
The experimental work and results obtained provide information about optical design, heat transfer management, chemical conversion and operational strategies for solar-driven thermochemical cycles based on ceria and characterized by employing solar simulators in the low-kW range.
A versatile and easy to operate and maintain experimental facility has been described. Directly irradiated ceria has been employed to produce hydrogen by water splitting thermochemical cycles and solar simulated energy. Three cycles have been performed in a continuously-operated fixed bed reactor, with radiation levels varying between 1017 kW/m2 and 2034 kW/m2. Reduction and oxidation legs took place in the same reactor without intermediate charges/discharges of material and without any regeneration or milling, so that experiments could realistically reproduce the cycling expected in on-sun processes.
High temperature (>1200 °C) is required to increase the reduction rate of ceria, and thus increase the amount of hydrogen produced in the oxidation leg. However, the high irradiance that is generally required to operate with reasonable thermal efficiencies at such temperatures (thus reducing the reactor radiation losses) affects the sample, producing local irreversible damage at temperatures at which ceria is stable in conventional furnaces (1280–1480 °C). When the sample was irradiated at maximum power for 9.5 min the sample was partially degraded. Illuminating for 20 s produced low conversion rates (4.5–6.2%). Irradiating the sample at maximum power for 2 min was the optimal solution in order to produce a similar conversion rate to that obtained with 9.5 min of irradiation, but without degrading the sample.
Solar to fuel efficiencies and volume of hydrogen produced per gram of ceria were calculated. The highest efficiency was obtained in test 2, with 20 s at maximum irradiance, and the highest volume of hydrogen per gram of ceria was achieved in test 3 (2 min at 100% power). The low values of solar to fuel efficiency demonstrate the existence of spillage and inefficiencies inherent to lab-scale solar simulators. The comparison of efficiency levels serves to establish the preferred experimental methodology to perform redox cycles. An increase of solar to fuel efficiency would be possible by decreasing non useful periods of irradiance, for instance, by shortening irradiation times at 50% power.
The experimental methodology (radiation changes, measurements, flux conditions and cycling procedures) established herewith is considered suitable for further research on ceria and other candidate materials to be qualified for solar-driven processes, which requires them to be analysed at the low-kW scale in HFSSs as best analogues prior to full on-sun tests.


