1. Introduction
Energy has been one of the most challengeable demands of human beings in all of history. In the 20th century, due to industrialization, this issue became more problematic. The increase in the price of common energy sources, especially in recent years, has forced human to use alternative sources of energy [
1]. In addition, the spread of pollution caused by fossil fuel consumption signals the necessity to develop renewable energy sources with fewer effects on the environment such as biodiesel.
Recently the usage of biodiesel in internal combustion engines has been accepted as a reliable source of energy [
2]. The similarity of the biodiesel fuel characteristics to diesel fuel is the most important property of biodiesel fuel. Application of the biodiesel fuel in compression ignition engines is convenient due to this similarity. Biodiesel fuel is a renewable source of energy and can be used without any concern about its supply ending. In addition, the main sources of production for this fuel are waste materials and this provides a worthy way to recycle used materials [
3,
4].
In Iran the percentage of waste cooking oil is about 20%, which is approximately 0.24 million tons. This wasted oil is a suitable source of biodiesel production [
3].
There are a lot of studies on different aspects of this type of energy source. Generally speaking, there are two different categories of studies on biodiesel. The first are those studies which have investigated biodiesel production from different raw materials [
5]. The other type of studies are concerned with the application of these produced biodiesels [
6]. Although engine revision is not required in order to use biodiesel, this fuel has some characteristics that are a little different than standard diesel. These differences may alter the engine specifications. Due to this problem in most cases biodiesel has been used as a blend with standard diesel fuel.
Engine performance, emission and combustion features would be affected due to use of biodiesel, so many researchers have considered the results of the application of various types of biodiesel fuel in internal combustion engines [
7,
8,
9]. The most important effective parameters which have been studied were engine load and speed, the biodiesel percent in the diesel biodiesel blend and different aftertreatment techniques. The parameters which show the effect of biodiesel have been considered in three different categories: performance characteristics (such as power, torque, exhaust gas temperature, specific fuel consumption (BSFC), tailpipe emissions (
, CO, soot, HC,
), combustion characteristics (combustion pressure, heat release, ignition delay), etc.
These studies are similar in numerous aspects. In addition experiments on internal combustion engines is very expensive and time consuming, so recently different methods have been used to investigate the usage of biodiesel in engines without performing lots of experiments [
10,
11]. One of these methods involves using artificial intelligence methods such as artificial neural networks (ANNs). ANNs are a convenient way to model performance, especially when the development of the model involves inadequate data and complex conditions. In addition they are resistant to artifacts [
12].
ANN has been used in some engine research. Dehkiani et al. [
13] studied the use of a backpropagation ANN to calculate exhaust emissions and performance of an SI engine. They stated that that the artificial neural network using an ANN offers advantages compared to numerical and mathematical methods. Similar experiments and results have been presented by Yuanwang et al. [
14].
In another study, Uzun [
15] used the ANN method to execute studies to explore the influence of injection advance, engine speed and load on brake specific fuel consumption. They stated that the created model was a robust way to predict of brake specific fuel use. Ghazikhani and Mirzaei developed an ANN model to predict the soot emissions of a diesel engine [
16]. In addition, some other researchers have used the BP ANN algorithm to evaluate engine parameters [
17,
18,
19,
20]. Most of them stated that ANN models can be used in internal combustion studies and development.
According to the abovementioned studies and their results, it is found that there is a lack of the information about the importance of the input parameters to create an ANN model for engine parameter prediction. The knowledge about this problem could help the developers choose appropriate input parameters, so in this study, different blends of diesel biodiesel (B0, B5, B10, B15 and B20) made from waste cooking oil have been used in an air cooled 4-stroke engine at various engine speeds (1700, 2100, 2500 and 2900 rpm) and loads (0, 25, 50, 75 and 100%). Then, the effects of these factors on the engine have been evaluated by its performance features (engine power, torque, specific fuel consumption (BSFC) and exhaust gas temperature) and emission (CO, , HC, , k value) parameters. A BP-structured ANN was proposed to determine the engine emission and performance characteristics using the mentioned group of engine operating factors as the ANN inputs. In addition, a sensitivity analysis was carried out on the created ANN model. Generally, the aim of this study is to evaluate the engine in different operating conditions and fuels, then propose a robust ANN model to predict the engine behavior for further study of the considered parameters and finding the degree of the importance for input parameters of the developed model.
2. Materials and Methods
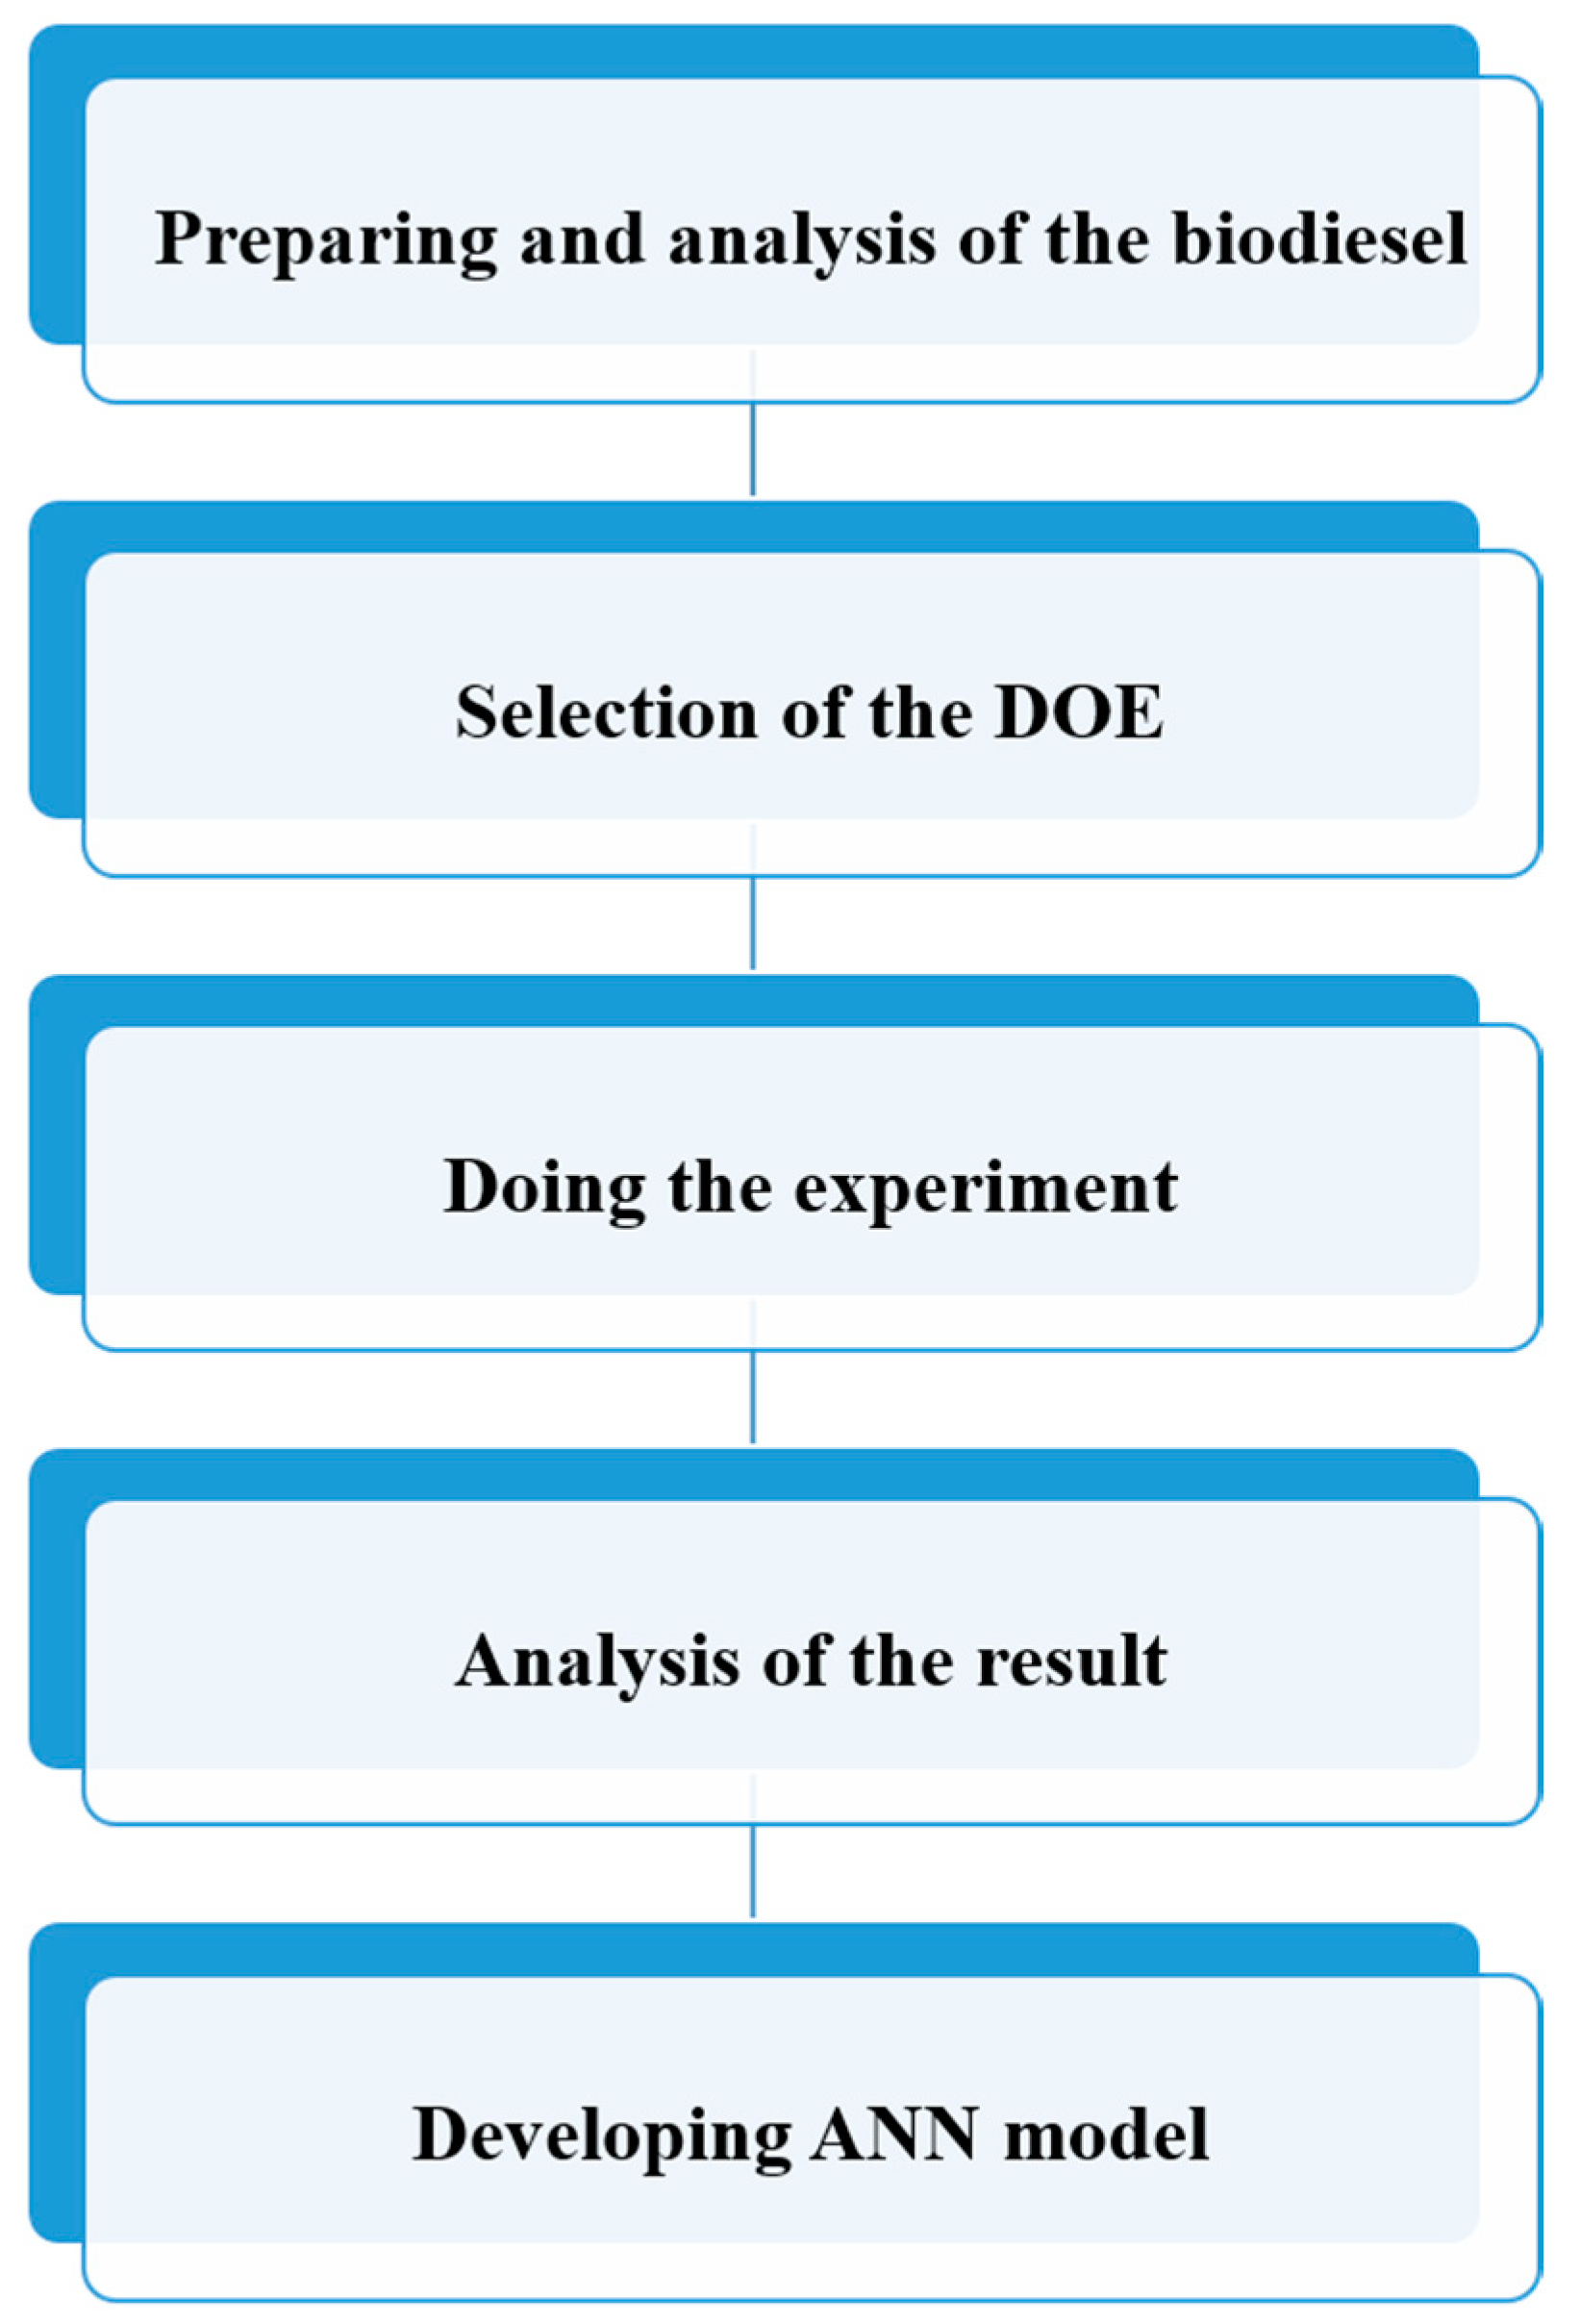
The biodiesel fuel was produced from waste cooking oil by the transesterification method. An ultrasonic device was utilized in a pre-treatment stage to increase the rate of biodiesel production. Different fuel mixtures of diesel and biodiesel (with 0, 5, 10, 15 and 20 mix percentages by the volume ratio method) were evaluated. A four-stroke air-cooled single-cylinder diesel engine was selected for conducting the experiments. The performance of the engine in terms of BSFC, fuel consumption and output power was explored under various engine loads and speeds, using an engine dynamometer. Fuel consumption was measured according to ASTM D7589 standard. Measurement of the different parameters for each operating point have done in three replicates. In
Figure 1a flowchart depicting the research steps used for developing the model are shown.
Biodiesel fuel was provided by the Renewable Energy Laboratory of Tarbiat Modares University. Diesel No. 2 which is the commercial fuel used in diesel engines in Iran has been used for comparison of the biodiesel fuel effects on the engine. Some significant features of the fuels, standard methods used for measuring the fuel characteristics and allowable ranges of these characteristics are presented in
Table 1. These characteristics were measured according to the mentioned standards at the Renewable Energy Laboratory of Tarbiat Modares University.
An eddy current dynamometer (Schenk, Darmstadt, Germany) has been used to measure engine power, torque and revelation speed of the engine. The limitations of the dynamometer were 80 Nm engine torque, 10,000 rpm engine speed and 15.66 kW engine power with 0.5–1% accuracy range. Specifications of the engine is presented in the
Table 2. A schematic of the test setup is presented in
Figure 2.
For measuring the engine fuel consumption, a system including pipes, tank, volume sensor, thermal sensors and pressure sensor has been used. The accuracy of this measurement system was ±1 cc/h. The returned fuel from the engine is cooled by a cooling system and returned to the tank.
Engine emissions have measured by an AVL DITEST GAS 1000 exhaust gas analyzer (AVL, Graz, Austria) and AVL DISmoke 480 BT smoke opacimeter (AVL, Graz, Austria). The gas analyzer was able to determine the amount of CO, CO
2, and HC using infrared technology. The quantities of O
2 and
gases are determined by this device using chemical sensors. The measurement accuracy and other features of these instruments are shown in the
Table 3. For measuring the emissions, during each test, after reaching desired engine speed stability level, the analyzing probe was put into the engine exhaust chamber. Then, the emission indices could be recorded and displayed on the monitor.
The tests were performed during a short period of time with the aim of comparing the engine emissions and performance characteristics. The comparisons were made between different mixtures of diesel and biodiesel fuels. The controlled variables during the experiments were load applied to the engine by dynamometer, engine speed and type of fuels (
Table 4).
The steps of the experiments were as follows:
Starting up the central control unit of dynamometer;
Engine warming up;
Applying load under engine steady state condition (for each fuel mixture, five loads including 0, 25, 50, 75 and 100% were applied to engine at different speeds of 1700, 2100, 2500 and 2900 rpm);
Measurement of torque and calculation of power;
Measurement of fuel consumption. For this purpose, during each test, signals were sent from volumetric flow sensor to the control system. The fuel measuring device was equipped with fuel temperature control and fuel pressure compensation systems.
Measurement of pollutants. The emission sensor was placed in the engine exhaust path and the amounts of emissions were therefore recorded from the system screen. Before each test, the sensor of emissions measurement were cleaned to preventing any effect of the exhaust soot on the accuracy of measurements.
Generally, ANN includes input, hidden and output layers which contain artificial neurons [
21]. One of the most important part of an ANN model is its learning algorithm. The backpropagation (BP) method is a most popular learning algorithm. This algorithm is a powerful learning algorithm in artificial neural networks which has been used in many conducted engine parameter modeling studies [
12,
13,
22,
23]. Training of all forms of a training data set is called an epoch. BP is a type of gradient descent algorithm. With this algorithm the performance of the artificial neural network is improved by decreasing of the error of the created model. This has been done by changing the weights as well as the gradient [
12].
BP networks are known for their capability to generalize well in different problems. Due to this advantage of BP networks, they have been used in a very wide range of applications. These artificial neural networks are known as supervised type. In these networks, both input and outputs are introduced to the networks. The primary group of neural network designs is the one where each layer is linked to the directly preceding layer. Usually, just with three layers (input, hidden, and output layer) of neurons most problems can be handled. A BP network with this structure with normal connections is sufficient for nearly all problems. However, contingent on the problem features different network architectures can be used (one, two or three hidden layers). The networks with more than five layers are not useful and will have not any advantage [
12]. Thus, in this study different topologies of back propagation ANNs have tested with two and three hidden layers.
The number of the input neurons are equal to the input parameters in the study. Then, a learning algorithm should be chosen to train the network. In this study the BP algorithm has been used. The number of neurons in the hidden layer is a way to improve the BP learning algorithm. When the number of the neurons in this algorithm is too large, the network will memorize the data instead of learning the pattern. In networks with insufficient hidden neurons the pattern may not be properly learned by the network [
12], so the right number of hidden neurons was determined by trial and error [
15].
The activation function is a part of the ANN which provides a relationship between its different layers. One important part of developing an ANN model is to choose an appropriate activation function because this element has a significant effect on the network performance [
24].
The Statistica Neural Networks software version 10 (Stat Soft .Inc, Tulsa, OK, USA) [
25] was used to create the ANN model. The software applied different transfer functions and neuron numbers for the hidden layer. The number of neurons in the input layer is same as the number of inputs (three neurons) and the number of neurons in the output layer (nine neurons) is the same as the number of outputs of the model. The best model according to the lowest error in prediction of the experimental data has eight neurons in the hidden layer.
The weights of the ANN model can be determined by different learning algorithms. The BP algorithm is one of the most popular methods to do this task. In this method, the weights of the model have been updated in terms of differences between the target and output of the network. Various training functions such as gradient descent with adaptive learning rule, Bayesian regularization, scaled conjugate gradient and Levenberg-Marquardt gradient descent with momentum have been used in different studies [
21]. The Levenberg-Marquardt method is widely used in developing ANNs to predict engine parameters and it shows more capability to predict different parameters [
19,
21,
22,
26], so in this study this training function was applied in developing the ANN model. To achieve the best result and as much as possible the closest values of the ANN output to the experimental data, the neurons in the hidden layer were determined by software.
One of the most effective parameters in back propagations and capability of the ANN model is the scaling of the input and output data. The transfer function used in this study is the logistic sigmoid function. This function just can produce a value between 0 and 1. Usually, and also in this study, the problem data is normalized before training and testing the model. This can be done by an equation (Equation (1)) and the data will be between 0 and 1 [
27]:
where
is the actual data,
is the normalized data,
is the minimum of the actual data and
is the maximum of the actual data.
The data set were classified into three categories as training, test and validation data set. Through training, the network was tested in contradiction of the test data set to control correctness and training stopped when the mean average error remained constant for a number of epochs. This is done in order to avoid overfitting, it means that, the network learns faultlessly the training patterns but it cannot predict the target when an unfamiliar training set is introduced to it [
12].
The other effective parameters in the performance of the ANN model are the percentage and amounts of data used for training and testing. Different percentages of the data have been used in various studies such as 80%:20% [
28], 75%:25% [
29], 70%:30% [
17,
30,
31] for training and testing, respectively, although, training and testing data percentage ratios of 70%:30% are most common. Thus, in this context, the ratio for training and testing data was selected as 70%:30%. The steps of determining the best ANN model to predict the engine performance and emission parameters are given as follows:
To have a simple BP neural network architecture, only one hidden layer will be used. The accuracy of the network has been improved by selecting appropriate numbers of neurons in hidden layer.
The proper objective error alongside with the primary weights and biases of the model can be chosen by training the model using the training samples. Different numbers of hidden neurons have been used in the model while training the network. Then the proper number of hidden neurons has been selected by observing the training errors. The number of hidden neurons can be selected according to the following three principles: (1) the expected goal errors must be reached within the given training numbers; (2) the architecture of the network is not too complicated; (3) after training the network with the training samples, the network can reflect well the sample change laws and have higher prediction accuracy. If the number of hidden neurons is too small, the network does not reach the expected goal error, or if the number of the neurons is too large, the network is too complicated. Considering the architecture and prediction accuracy of the network, 10 hidden neurons was the appropriate number for our network.
The back propagation learning algorithm is a gradient descent algorithm. In this algorithm the total error is minimized by altering the weights through the slope of the algorithm and this will try to enhance the performance and accuracy of the network. The stop point of the network training is the time which in the root mean square error of the network for tested values stops reducing and starts to increase. In this step, to understand whether the ANN model is work properly and making good calculations, the testing data which are not introduced to the network, are applied and the consequences are checked [
21].
In this study a statistical method has been used to evaluate the results of the ANN model. The coefficient of determination (
R2) which shows the degree of association between predicted and experimental values has been applied as seen in Equation (2) [
7]:
where
Yestimate is the predicted data,
Yobserved is the experimental data. These statistical measures provide information about the strength of the linear relationship between the predicted and the experimental data. If the model is “perfect”,
R2 is 1. If the model is a total failure,
R2 is zero.
There is a lack of information about the importance of the engine parameters on its performance and exhaust emissions. In this study, the global sensitivity analysis has been used to evaluate the importance and to measure the effect of the engine parameters on the engine performance and exhaust emissions. In this method the relative importance of the input ANN model parameters has been determined by checking the variation of the ANN model to changes of the each one of the input parameters. In this analysis, the dataset is introduced to the network repetitively, with each variable in turn replaced with its mean value calculated from the training sample, and the resulting network error is recorded. If an important variable changed in this technique, the error will rise greatly; if an unimportant variable is concerned, the error will not increase too much. Then, the error of the ANN model in each condition, by omitting each input parameters, is compared with initial ANN network error. The result of the analysis is a ratio. If the ratio is lower than the 1 for a parameters it can be ignored and higher value of this ratio is a signal of the higher importance of that parameter [
25].
3. Results and Discussion
3.1. Correlation Coefficients Table
At the first step of data analysis, the correlations among different parameters have been investigated (
Table 5).
Correlation is defined as a measure of the relation between two or more parameters. The correlation coefficient which is used here is Pearson coefficient (R) which is in range of −1.0 to +1.0. The correlation coefficient equal to −1.0 means an absolute negative relationship between two variables, +1.0 for this quantity means an absolute positive relationship between variables and 0 means no relationship between variables.
As can be seen in this table, there is some interesting information about the correlations among them. The highest correlations are related to engine load, so it can be seen in the following sections that the most effective parameter for the engine performance and emissions characteristics is the engine load. The highest correlation coefficient among the parameters is related to engine load, so it can be stated that the most effective parameter on engine performance and emissions parameters is engine load. The engine speed and biodiesel diesel blends are the next most effective parameters. Although, the effect of the increase in biodiesel blends with diesel fuel is not very considerable (here up to 20% biodiesel), but it can be seen that the value of engine emissions except k, decreased with an increase in biodiesel percentage. The details of the performance and engine emissions behavior will be discussed in detail in the following sections, but here some information which can be derived from the correlation coefficient table has been discussed.
The smoke opacity (
k) exhaust emission is related with the carbon content of the exhaust emissions [
32,
33], so as can be seen in
Table 5, there is a very strong positive correlation coefficient between the k values and carbon-containing emissions (0.97, 0.85 and 0.96 for CO, CO
2 and HC, respectively), while there is a poor positive correlation between k and
emissions (0.31).
CO emissions are the result of incomplete fuel combustion in the cylinder. Incomplete combustion is referred to the combustion under nonstoichiometric conditions [
34]. In this case, the amount of the air which is mixed with fuel is not sufficient, so the product of the combustion would not be CO
2 and the production of CO and HC is increased. The very strong correlation between HC and CO in the
Table 5 is a signal of this phenomenon.
Among the emissions, the highest correlation for the
is with CO
2 (0.63). The required condition to forming the
in cylinder are high temperature and availability of oxygen [
35]. This condition, especially the high oxygen in cylinder, would improve the combustion quality and thus increasing of CO
2 production too. The exhaust gas temperature has a strong positive correlation coefficient with most of engine emissions except
. Increased exhaust gas temperature is a sign that the most part of the combustion cycle have been in latest crank angle of combustion stroke while the production of the
in the cylinder is dependent on the peak temperature in the cylinder. Under this condition the time which the high temperature blends spends in the cylinder is not sufficient to produce
emissions.
3.2. Engine Performance Parameters
In the following sections the performance parameter variation details under different loads, speeds and fuel blends have been considered. These parameters include: engine power (kW), engine torque (Nm), BSFC (g/kwh) and exhaust gas temperature (K).
3.2.1. Engine Power
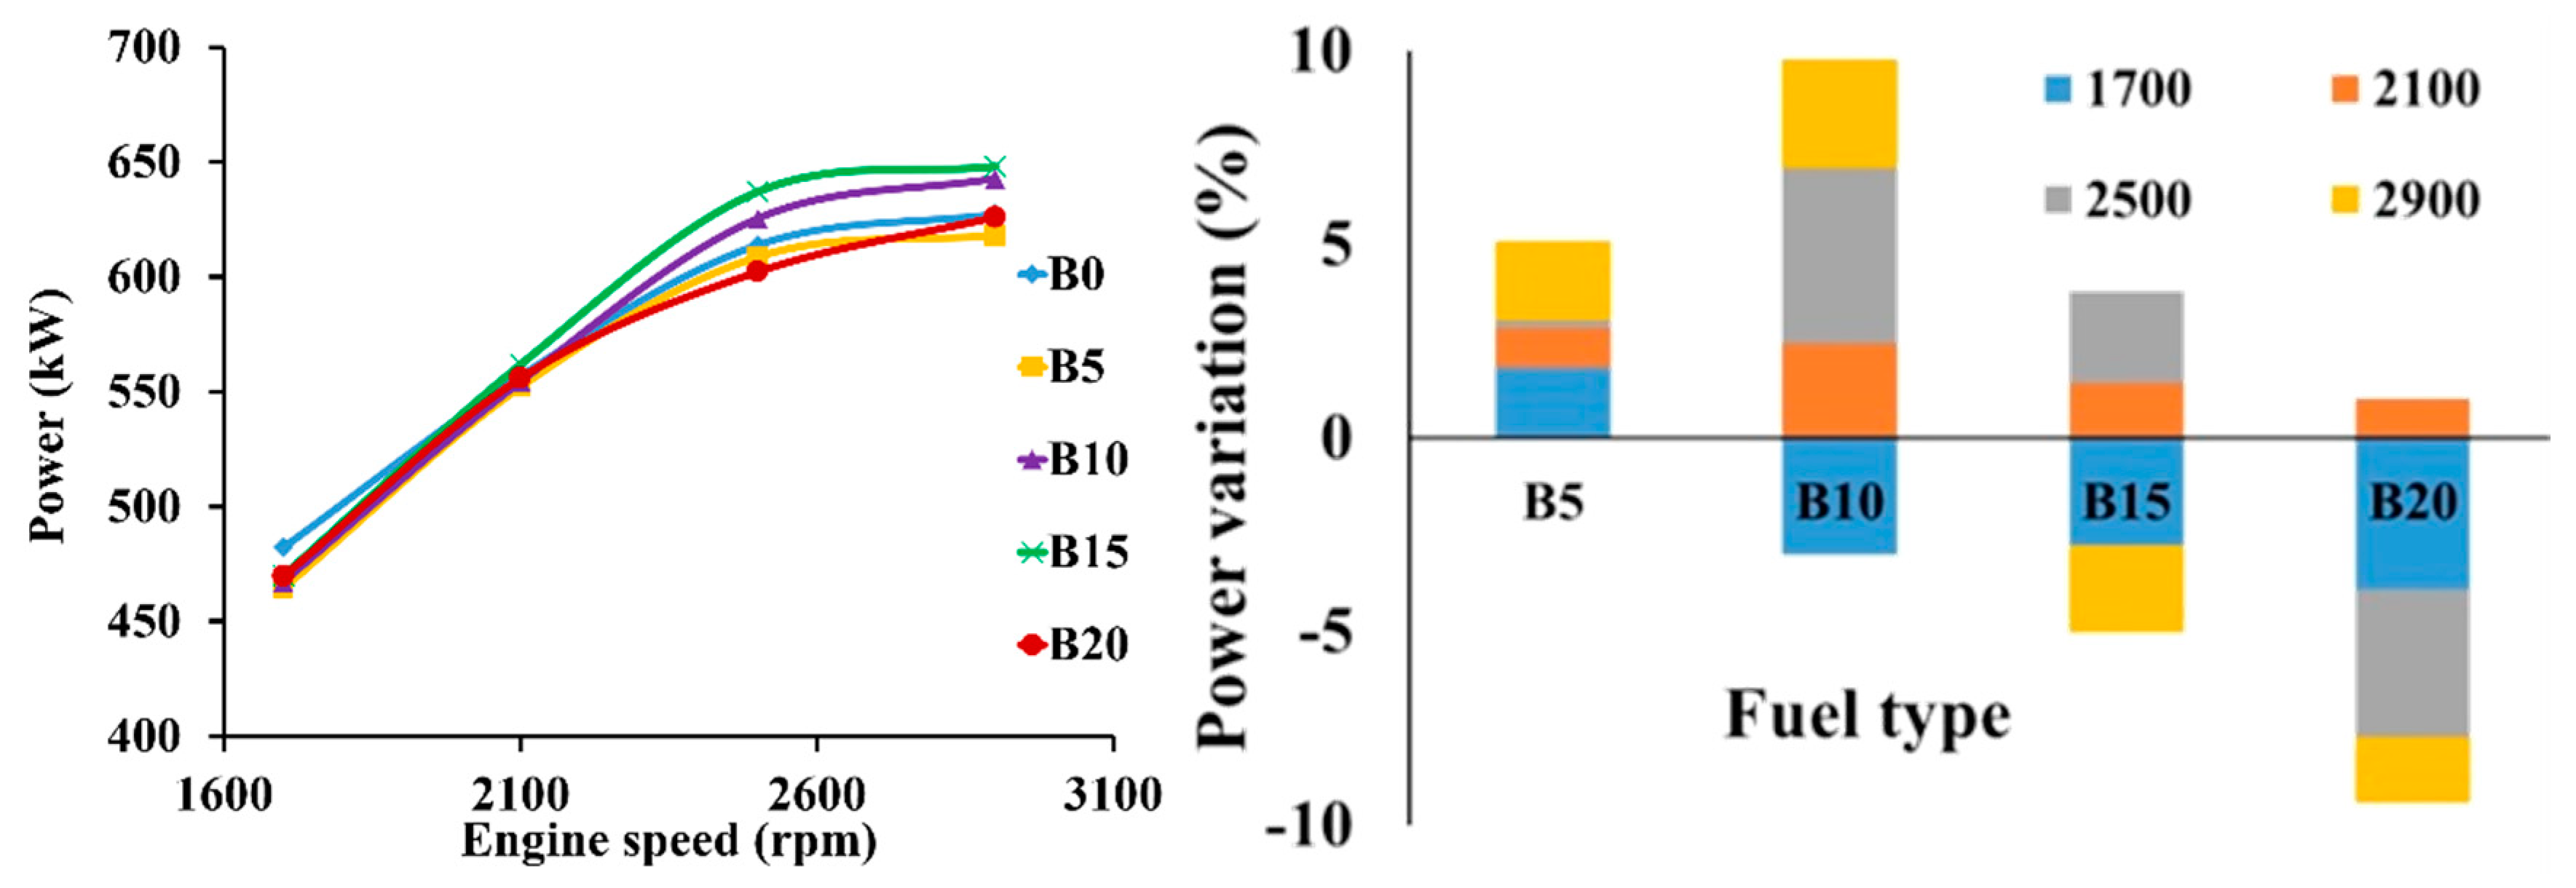
As can be seen in
Figure 3, there is an initial increase in engine power with the increase in engine speed, then it reaches a peak and after that it starts to fall with any further increase of engine speed. This can be seen for all the kinds of fuels. Although the power of the engine difference for diesel and B5 fuels, especially in maximum engine power, is not noticeable, the engine power for B10 and B15 blends are higher than that of the diesel fuel. The maximum increase in engine power for B10 and B15 fuels is 4.54 and 2.35%, respectively. The maximum reduction in engine power for B20 fuel is 3.92%. The reason for this is the lower heating value of the waste cocking oil [
36]. Finally it can be stated that the addition of biodiesel to diesel fuel increases the power in a small amount but the engine power will be reduced by adding more biodiesel. For instance, the engine power for the B10 fuel blend, 2100 rpm engine speed and 75 engine load has been increased by 28.67%. This trend is also reported by other researchers [
36,
37]. The higher viscosity and density of biodiesel fuel than diesel fuel and higher oxygen content are proposed as possible reasons for this behavior. The quality of the combustion has improved and compensates for a lack of oxygen in the rich zone of the combustion chamber. Fuel flow rate is increased due to the higher density and lower leakage of fuel in the fuel sending high pressure pipes due to the higher dynamic viscosity of the biodiesel fuel than diesel fuel [
38]. This will increase the engine power.
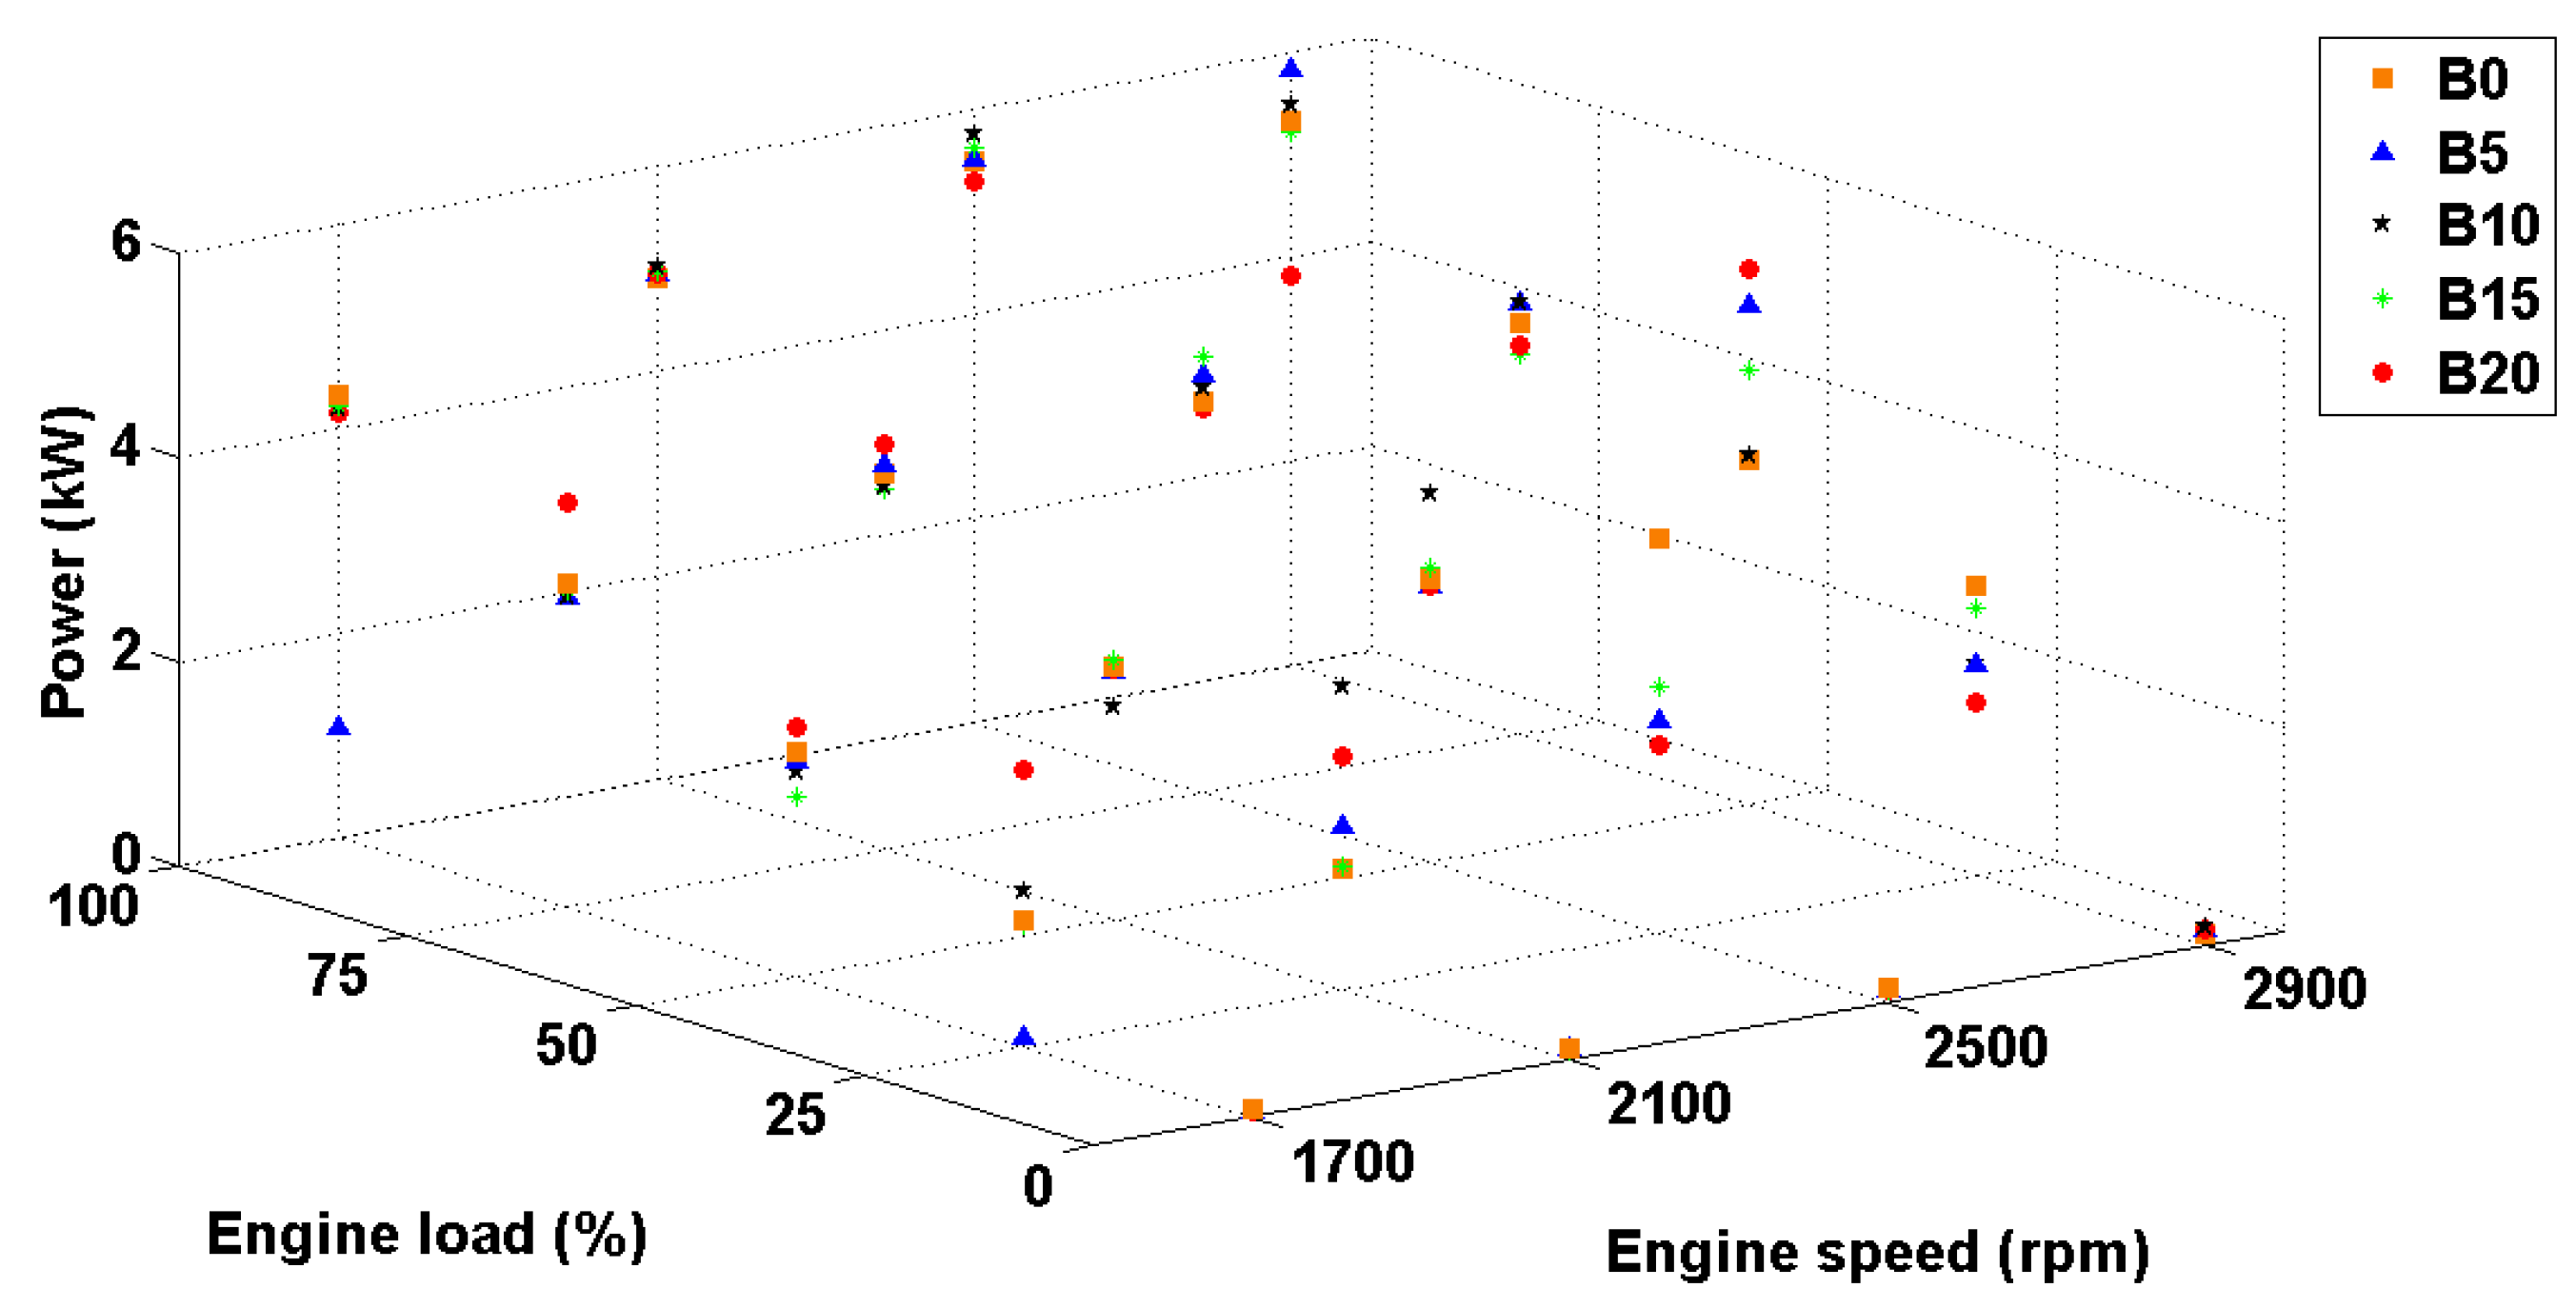
The power of the engine under different engine loads, engine speeds and fuel blends are shown in
Figure 4.
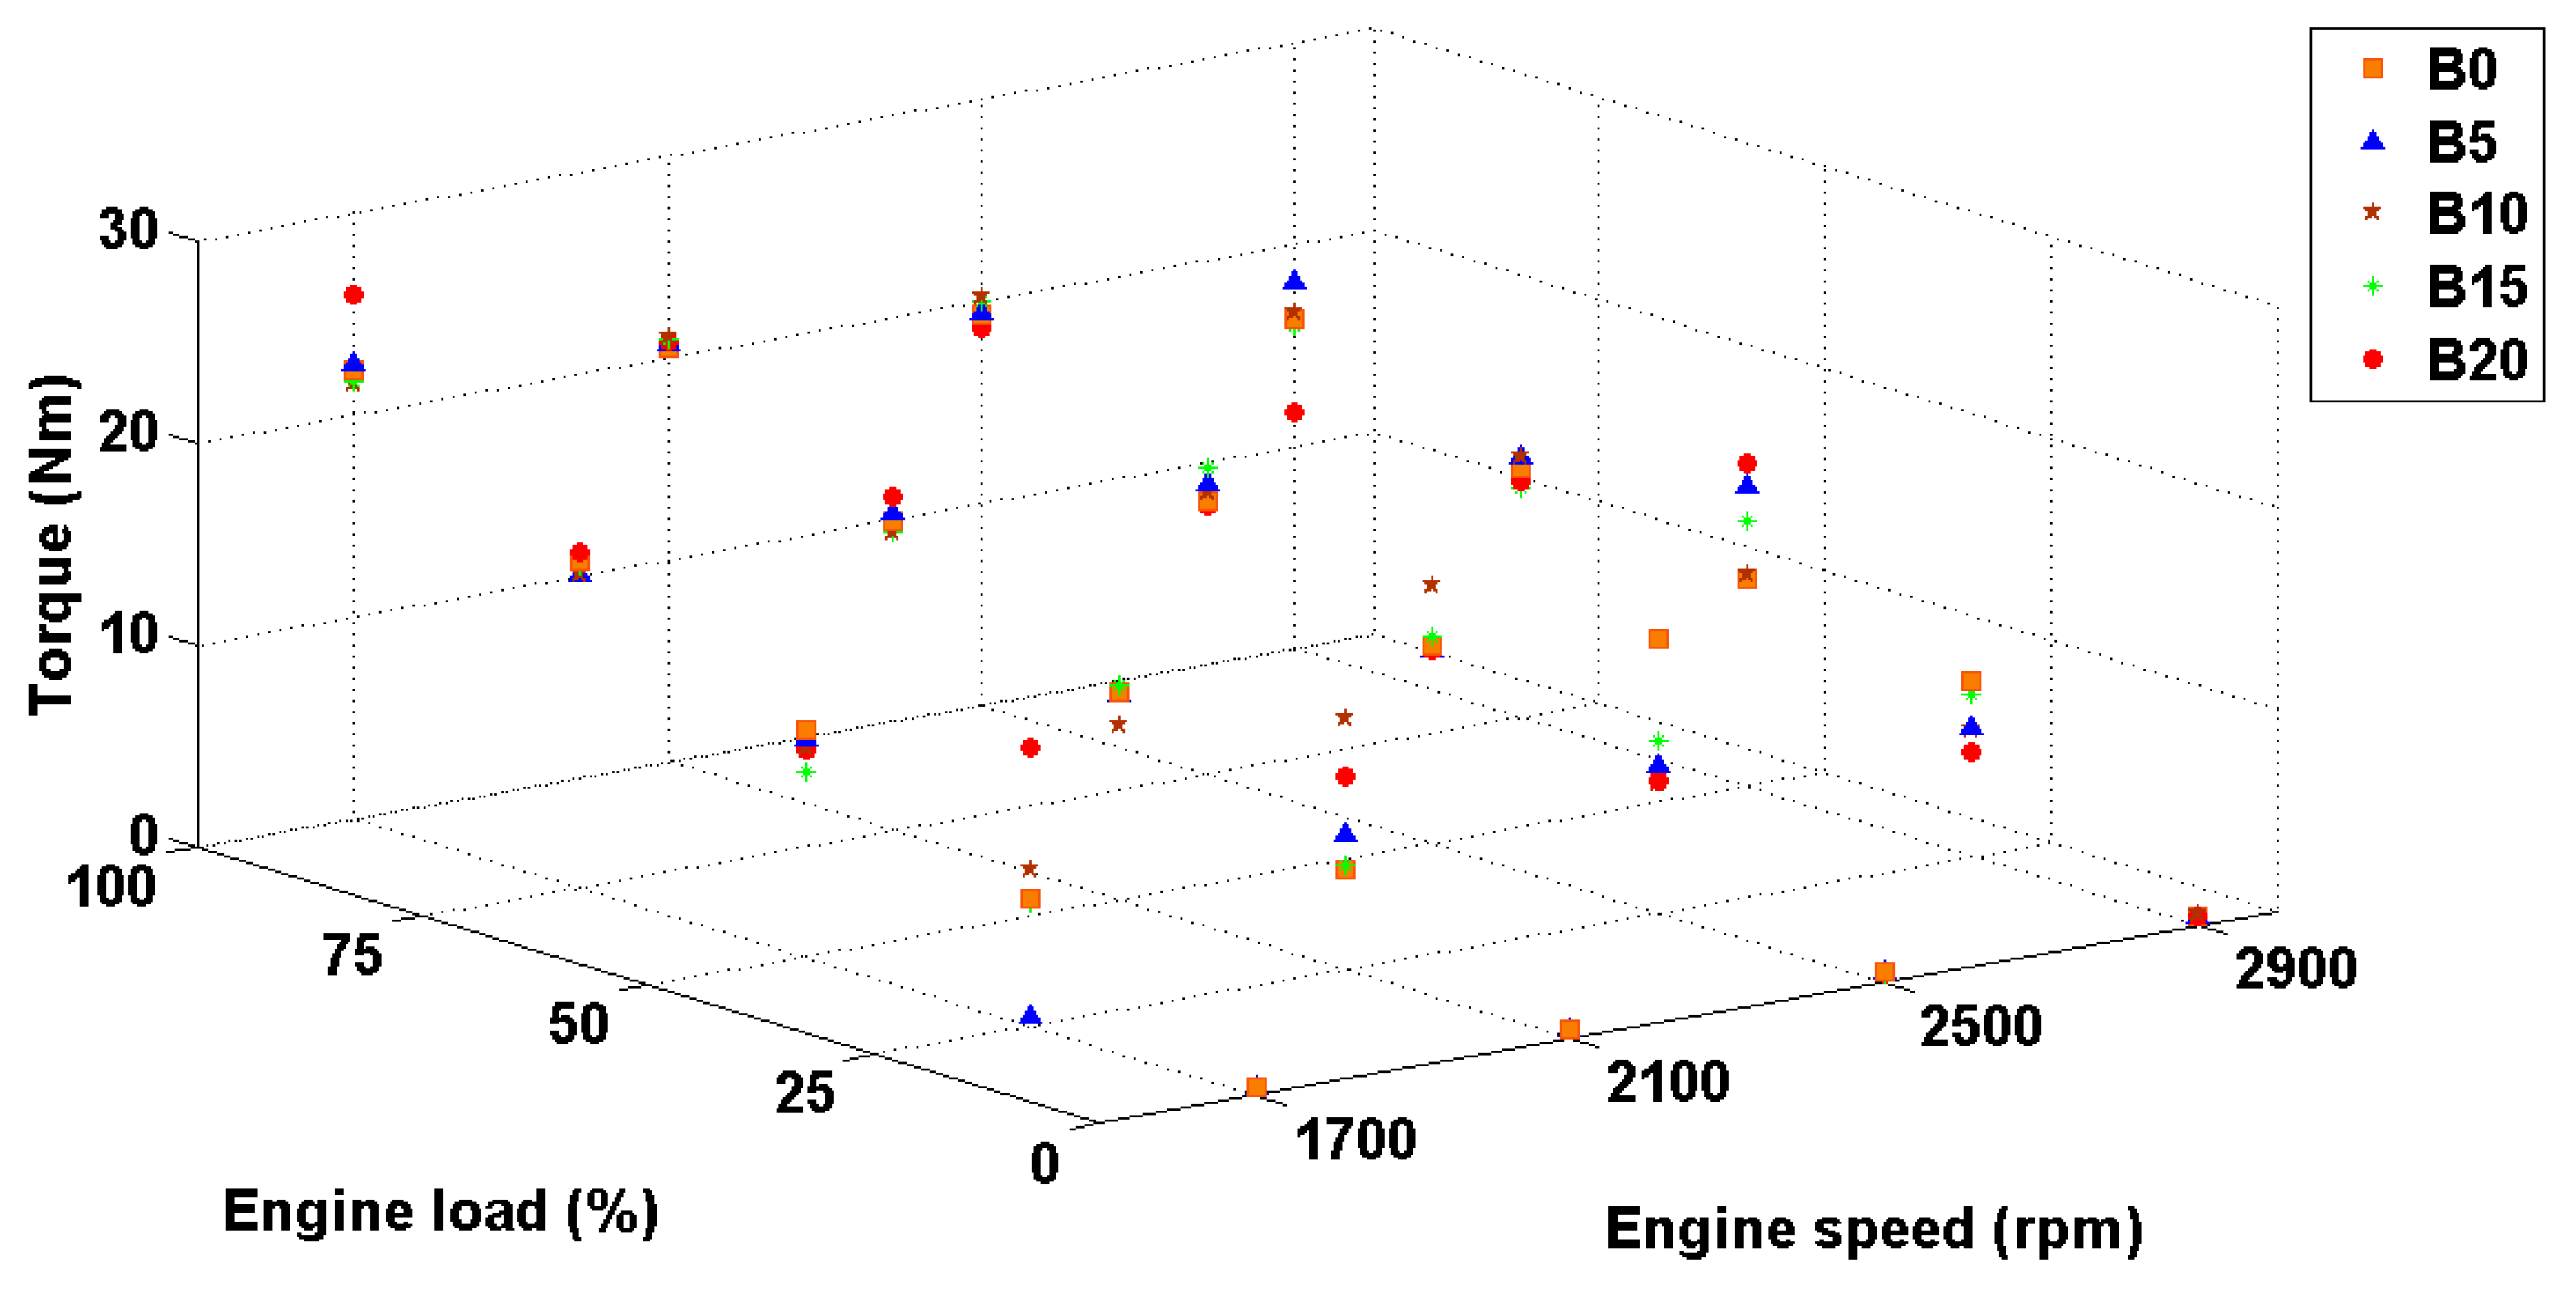
3.2.2. Engine Torque
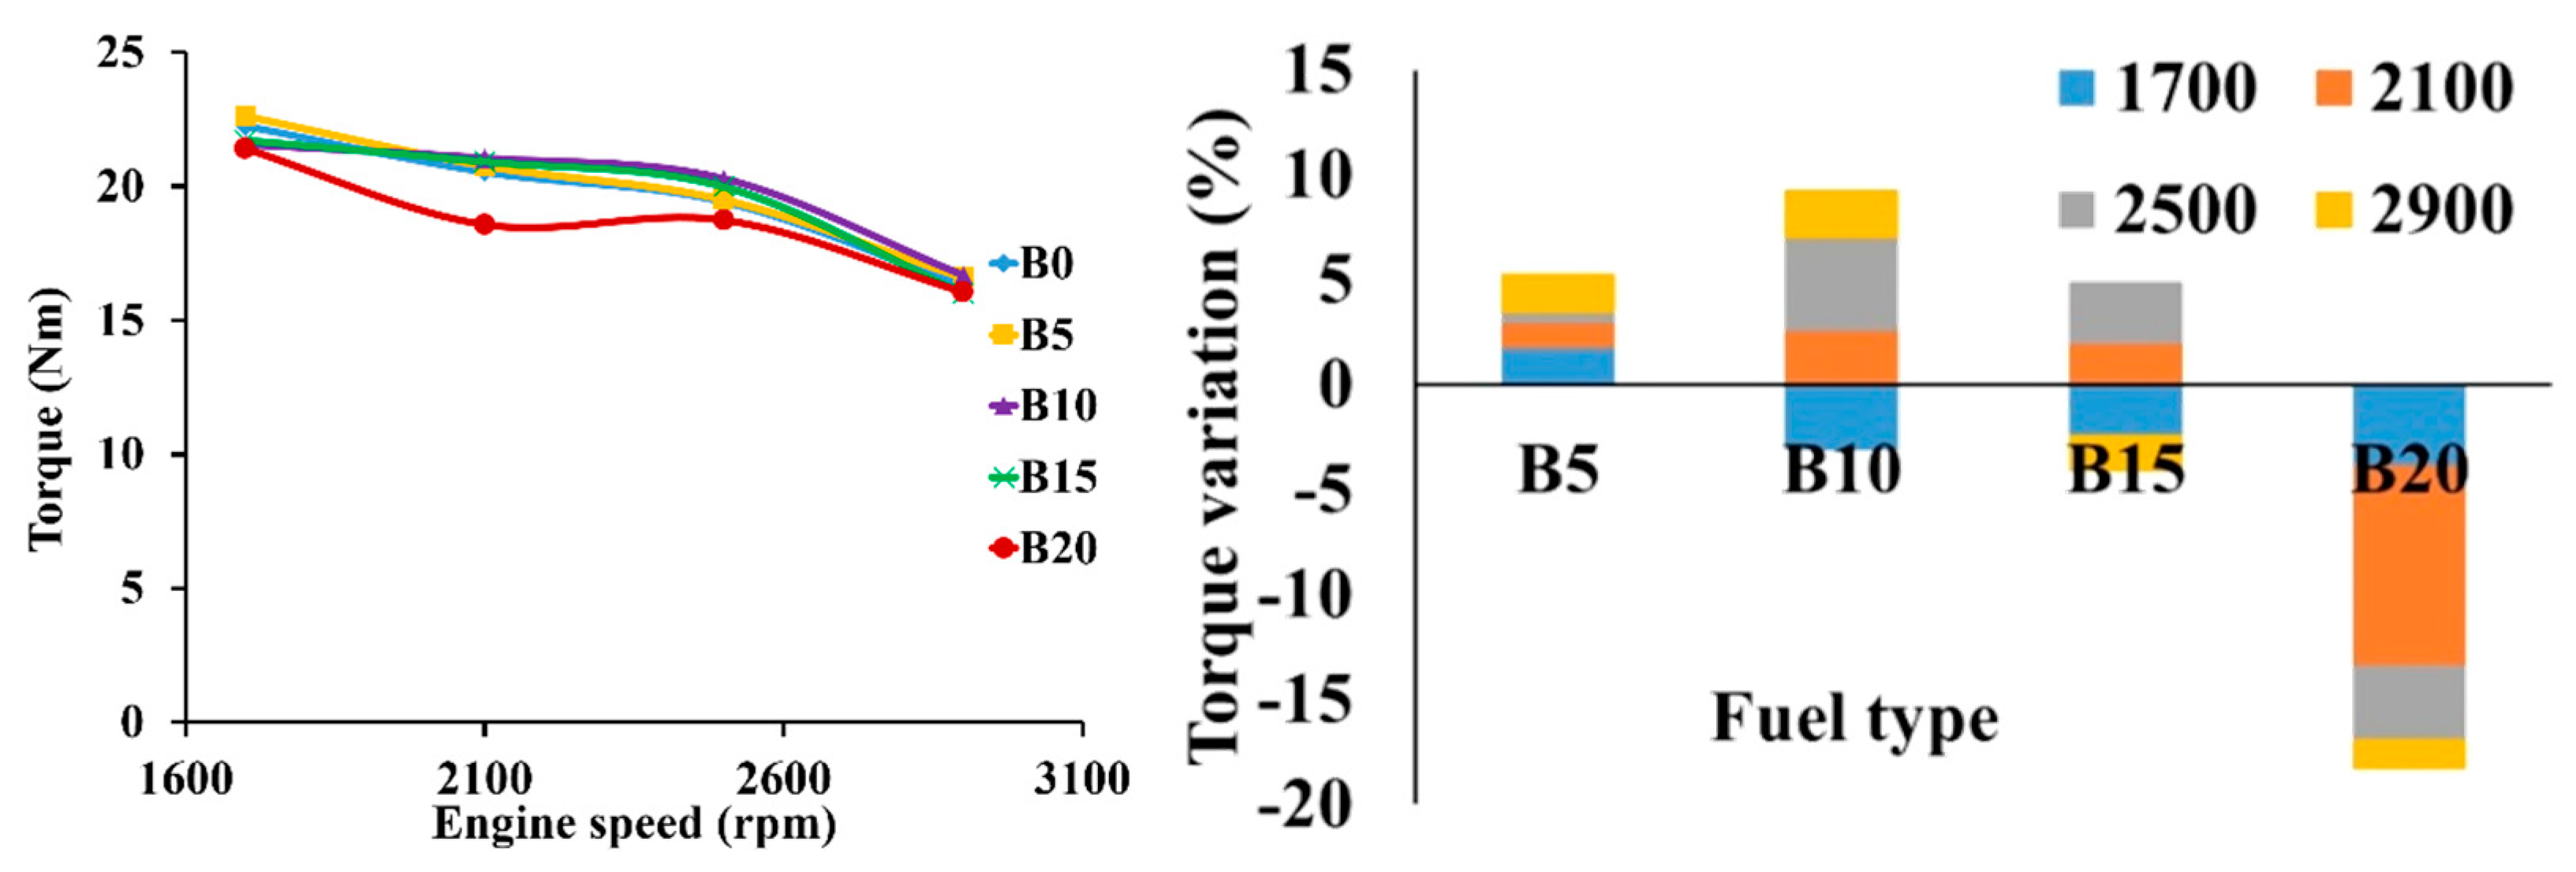
Maximum torque was obtained at 1700 rpm for each fuel blend (
Figure 5). The torque of the B5 fuel is higher than that of diesel fuel, but there is a reduction in engine torque for the B10, B15 and B20 fuels, and the highest torque drop is between diesel fuel and B20 fuel (9.55%). An effective parameter in the increase of the engine torque when using biodiesel fuel are its higher surface tension and viscosity which reduces fuel leakage in the fueling pipes. The reduction of the engine torque is due to the lower heating value of the biodiesel blend [
37], so it can conclude that in biodiesel fuel blends with lower biodiesel content the effect of viscosity and surface tension are more significant and in blends with higher contents of biodiesel the effect of the oxygen content is more significant. The torques of the engine under different engine loads, engine speeds and fuel blends are shown in
Figure 6.
3.2.3. Engine BSFC
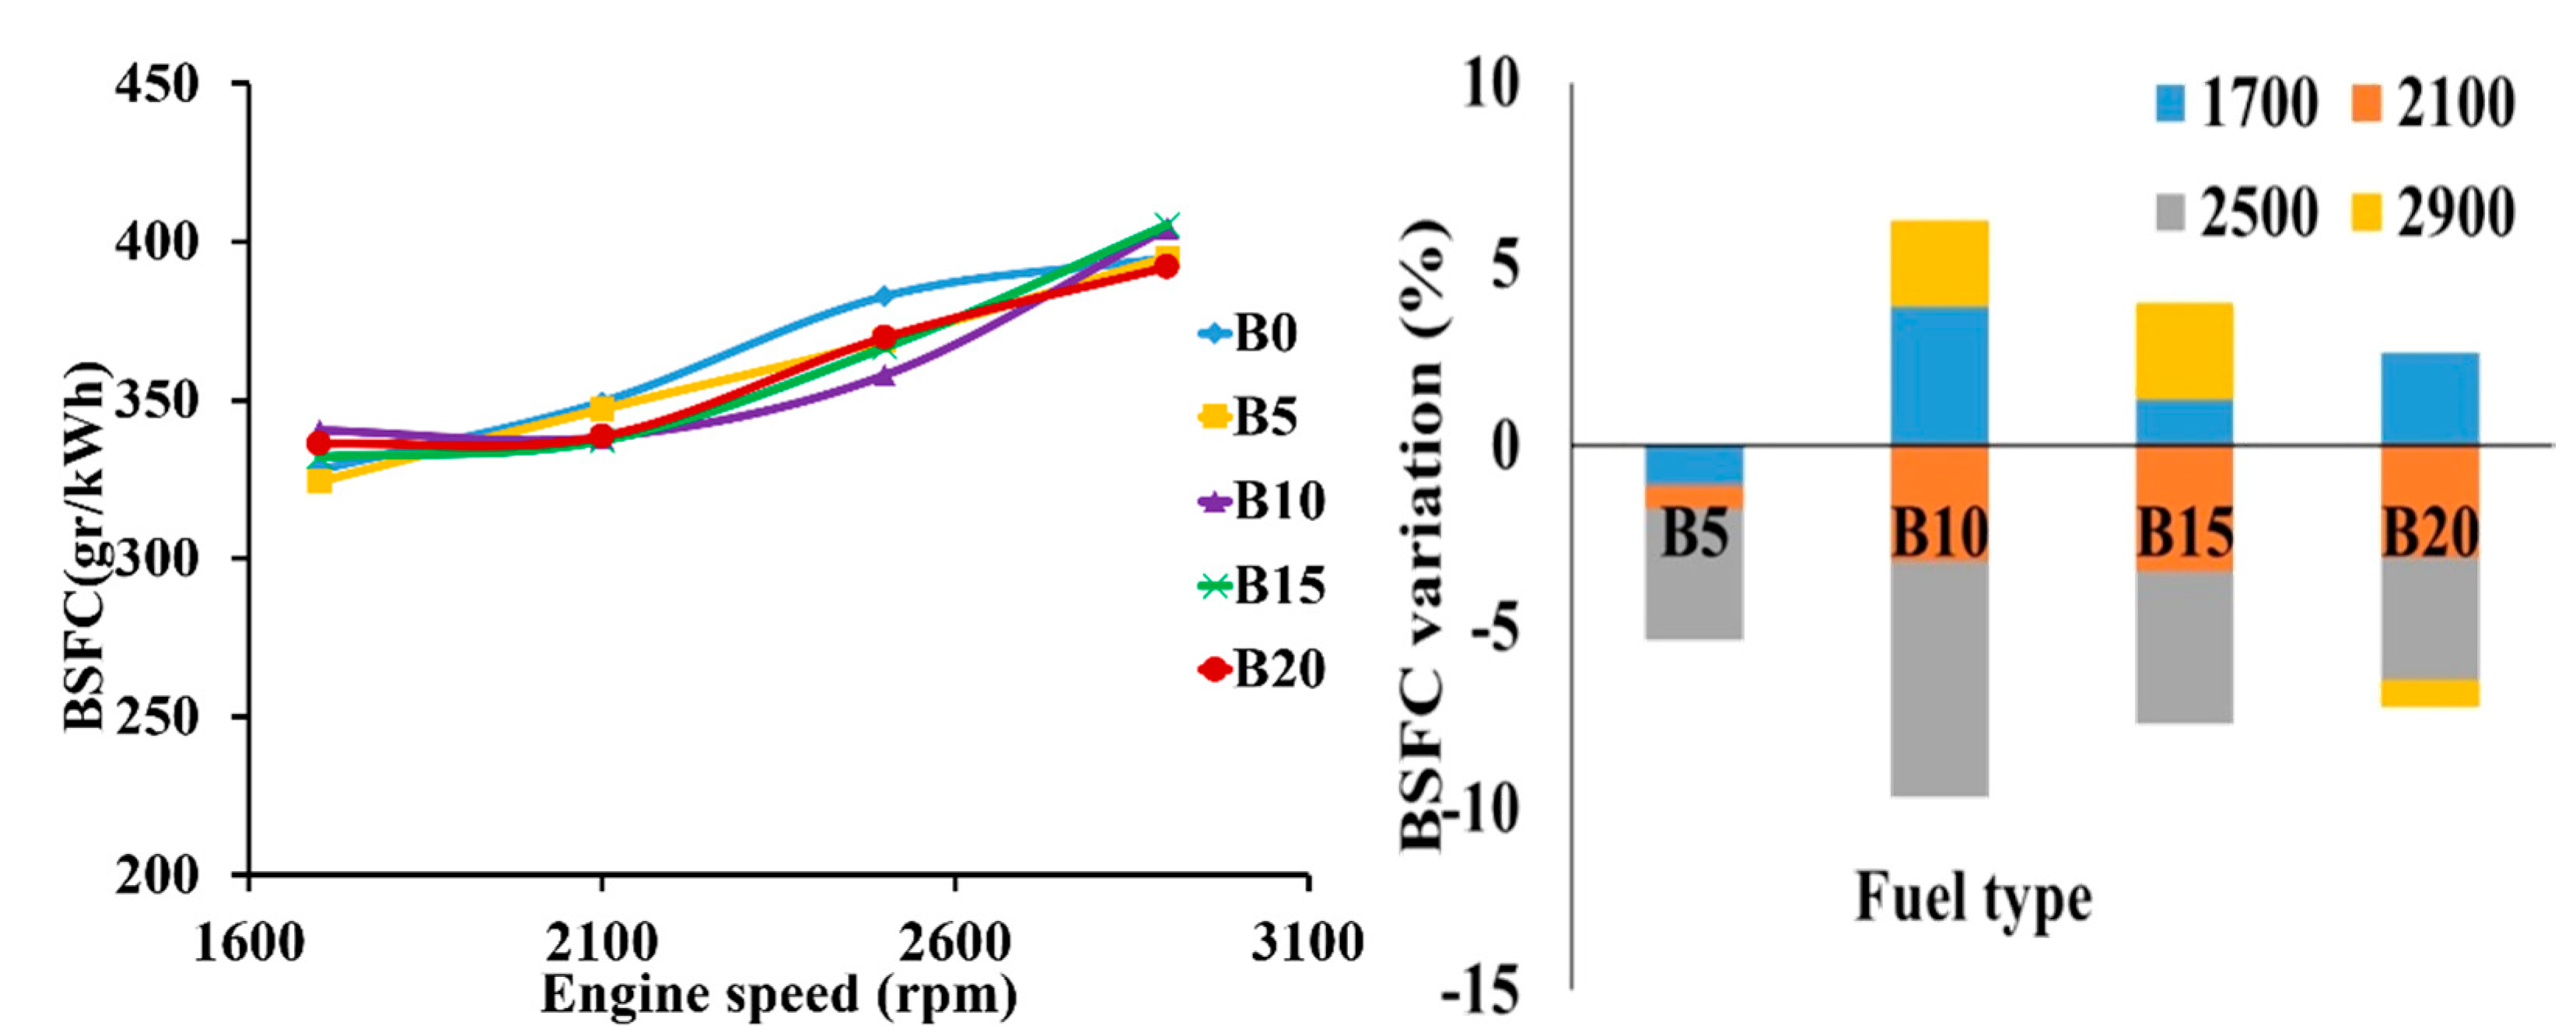
The brake specific fuel consumption (BSFC) for all fuel blends was raised with the increase in engine speed (
Figure 7). The BSFC of fuel blends are lower than that at 1700 and 2900 rpm and is higher at 2100 and 2500 rpm. The most decrease and increase in BSFC is for B10 in 2500 rpm and 1700 rpm, respectively. Overall it can be stated that the amount of BSFC of the engine while using biodiesel blends is decreased because the value of increase in the BSFC is higher than its decrease for all biodiesel fuel blends. BSFCs of the engine under different engine loads, engine speeds and fuel blend percentages are shown in
Figure 8.
The increase of the engine BSFC due to using biodiesel fuel is reported by most studies. Lower LHV of the biodiesel is stated as the main reason for the reduction of the engine BSFC when fueled by biodiesel. Some other effective parameters which cause a reduction in BSFC are changes in the combustion timing (ignition delay) due to its higher cetane number and injection timing because of its different viscosity and density [
36]. However, a slight decrease in BSFC is reported by some studies [
36].
3.3. Engine Exhaust Gas Temperature
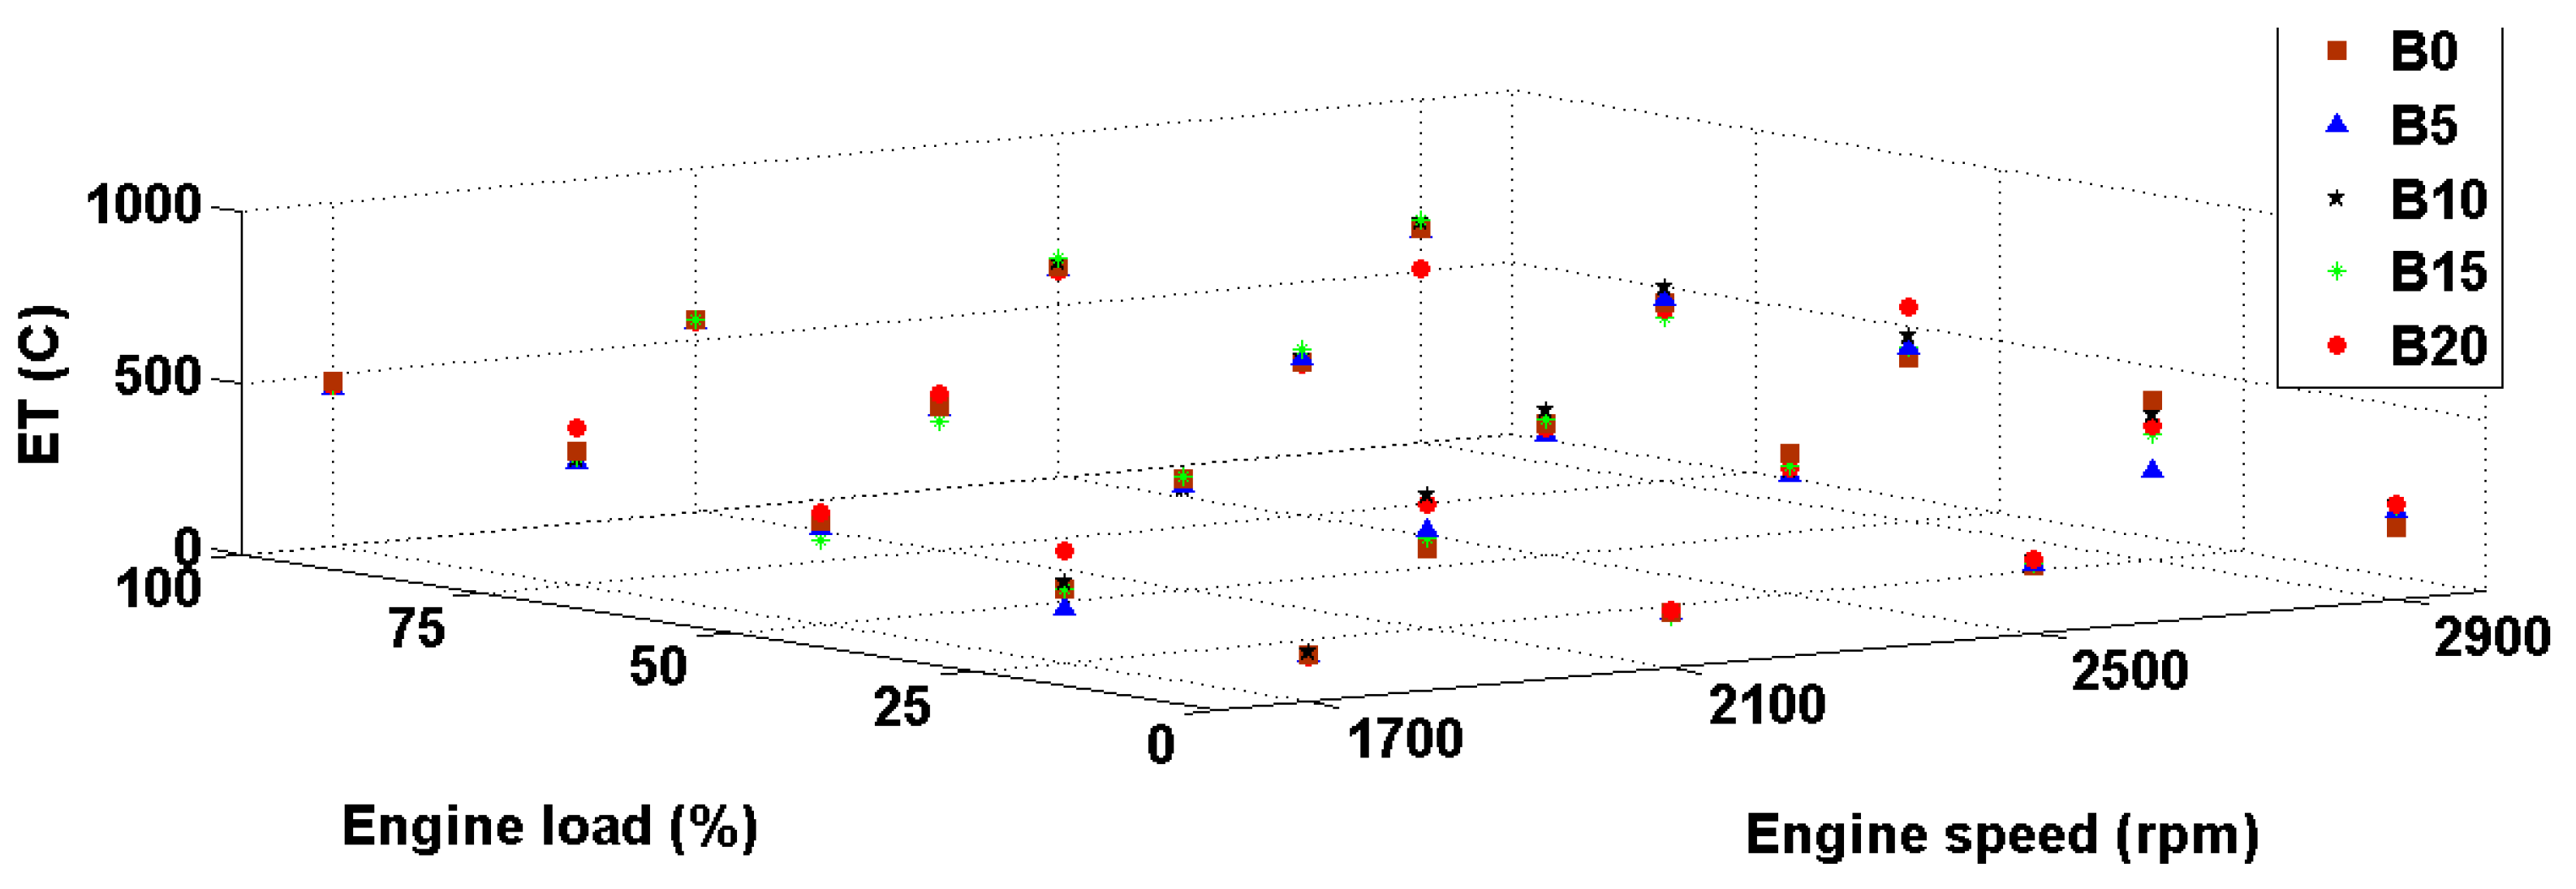
The temperature of exhaust gas for all fuel blends increased with increased engine speed (
Figure 9). Overall it can be stated that the exhaust gas temperature for most fuel blends was lower than that of diesel fuel (B0). This reduction in exhaust gas temperature can be seen clearly at lower engine speed (1700 rpm). The most decrease in the exhaust gas temperature is 3.66% at 1700 rpm engine speed for the B5 fuel blend. The exhaust gas temperature while using B5 and B20 fuel blends at all engine speeds is lower than that for B0, but the exhaust gas temperatures of the engine while using B10 and B15 were greater than that of B0. The maximum exhaust gas temperature was 910.25 K (3.77% more than B0 at 2500 rpm). Exhaust gas temperature of the engine for different engine loads, engine speed and fuel blend percentages are shown in
Figure 10.
Generally, different effects of using of biodiesel on exhaust gas temperature have been reported. Some researchers have stated that the exhaust gas temperature was increased using biodiesel [
39,
40] and also a reduction of exhaust gas temperature due to the use of biodiesel has been observed by some other researchers [
41].
Density, viscosity, lower heating value and oxygen content of the biodiesel fuel are parameters that affect the exhaust gas temperature [
41,
42,
43]. A signal of lower engine loss is the reduction of the exhaust gas temperature [
44,
45], so one of the advantages of biodiesel fuel is its lower exhaust gas temperature when used in an engine [
42]. The other parameter affecting the exhaust gas temperature is the ignition delay. Ignition delay is the time between start of the injection to start of the combustion. Ignition delay is affected by the CN of the fuel and a higher CN will result in a shorter ignition delay. As can be seen in the
Table 2, the CN of the biodiesel fuel is higher than that of diesel fuel and this means a shorter ignition delay for biodiesel fuel combustion than diesel fuel. This shorter ignition delay causes shifting of the combustion to the start of the combustion stroke. This will increase the residual time of the burning mixture and cooling down of the gases inside the cylinder [
43]. Finally regarding the waste cooking oil and this experiment it can be stated that in lower engine speed effect of shorter ignition delay and oxygen content of biodiesel was more than that of its injection parameters (viscosity) while at higher engine speed the effect of injection parameters is more significant.
3.4. Emissions
These emissions are CO (%), (%), HC (ppm), (ppm), K (1/m). Each one of these parameters are discussed in the following sections.
3.4.1. CO
One of the products of the incomplete combustion is carbon monoxide (CO) [
34]. At all engine speeds the CO emissions are lower than for diesel (
Figure 11). This is in agreement with the results of other studies [
46] and may be due to the oxygen content of the biodiesel. It was observed that the CO emissions increased with the increase of engine speed, from 1700 to 2500 rpm. The highest CO emission of 3.25% was measured for diesel fuel at 2500 rpm.
CO formation during the diesel engine combustion process is affected by various parameters. In one hand, as stated before CO emission is a consequence of the incomplete combustion of the fuel which may come from an insufficiency of oxygen in the cylinder, so the oxygen content of the biodiesel fuel can provide extra oxygen to react with fuel and enhance the combustion quality. In the other hand, higher viscosity and density of the biodiesel fuel may have a negative effect on the injection and atomization of the sprayed fuel and reduces the combustion quality, especially under high load conditions [
43]. The CO emissions of the engine under different engine loads, engine speeds and fuel blend percentages are shown in
Figure 12.
3.4.2. CO2
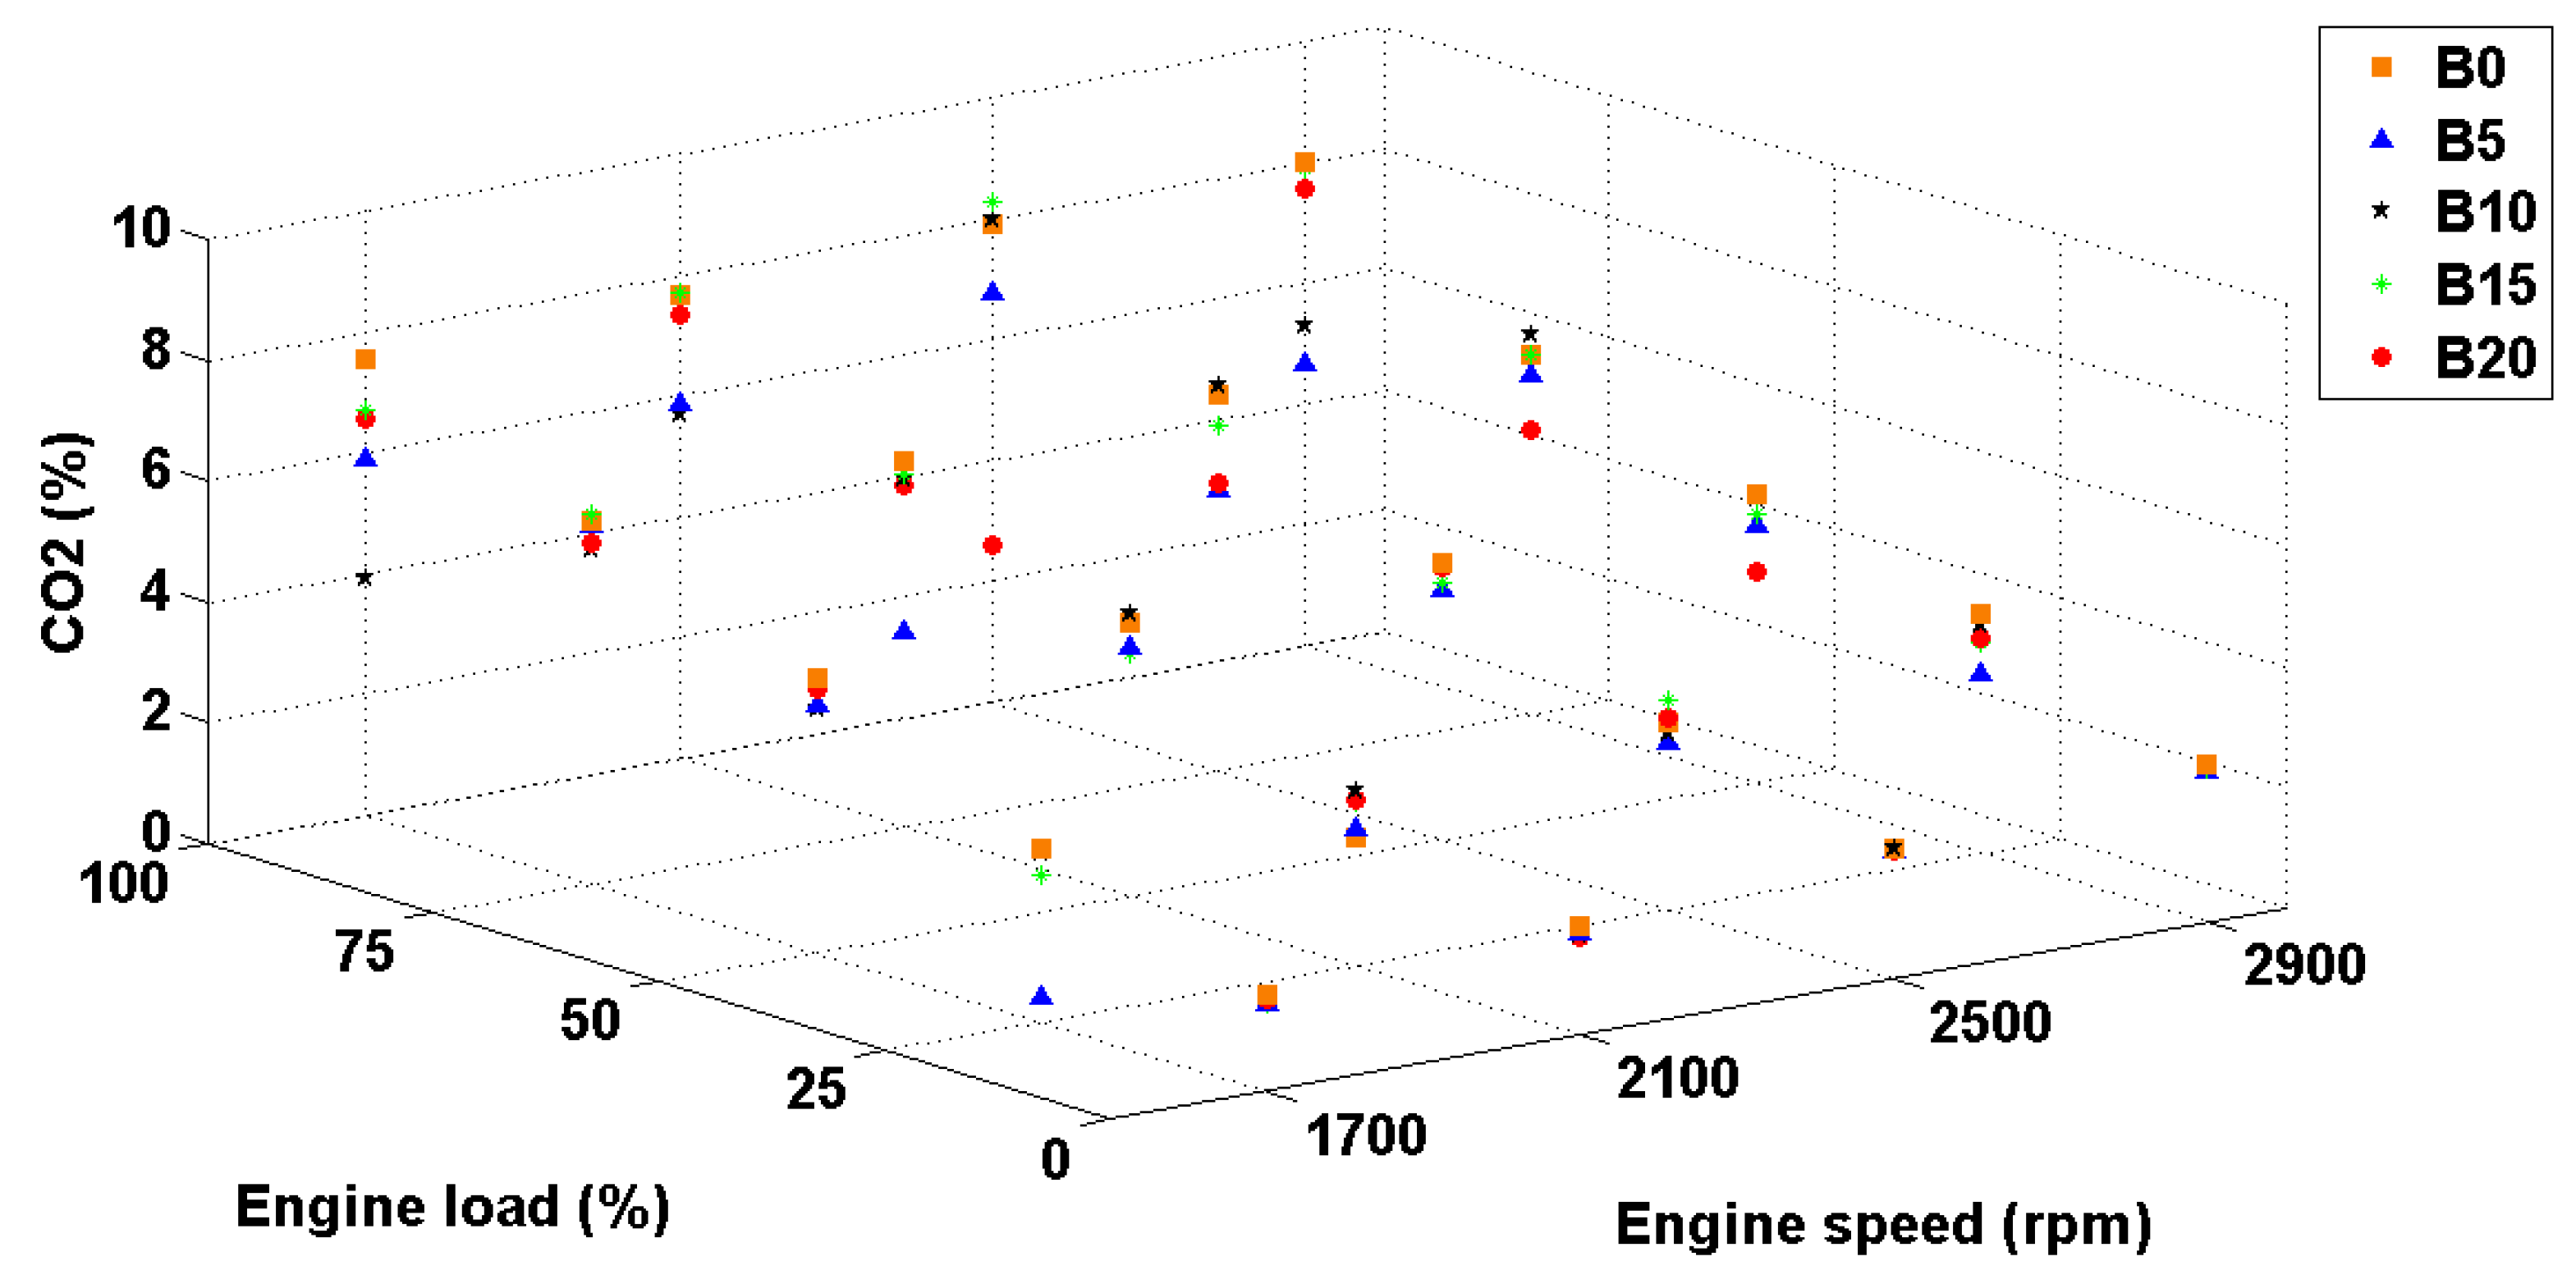
This emission is not one of the tail pipe pollutants and is not regulated in engine emission regulations but it can be dangerous for human health at high concentration [
47] and it is a greenhouse gas which may be a reason for ozone formation and global warming [
47]. In addition, higher amounts of
emission are a signal of a more complete combustion process.
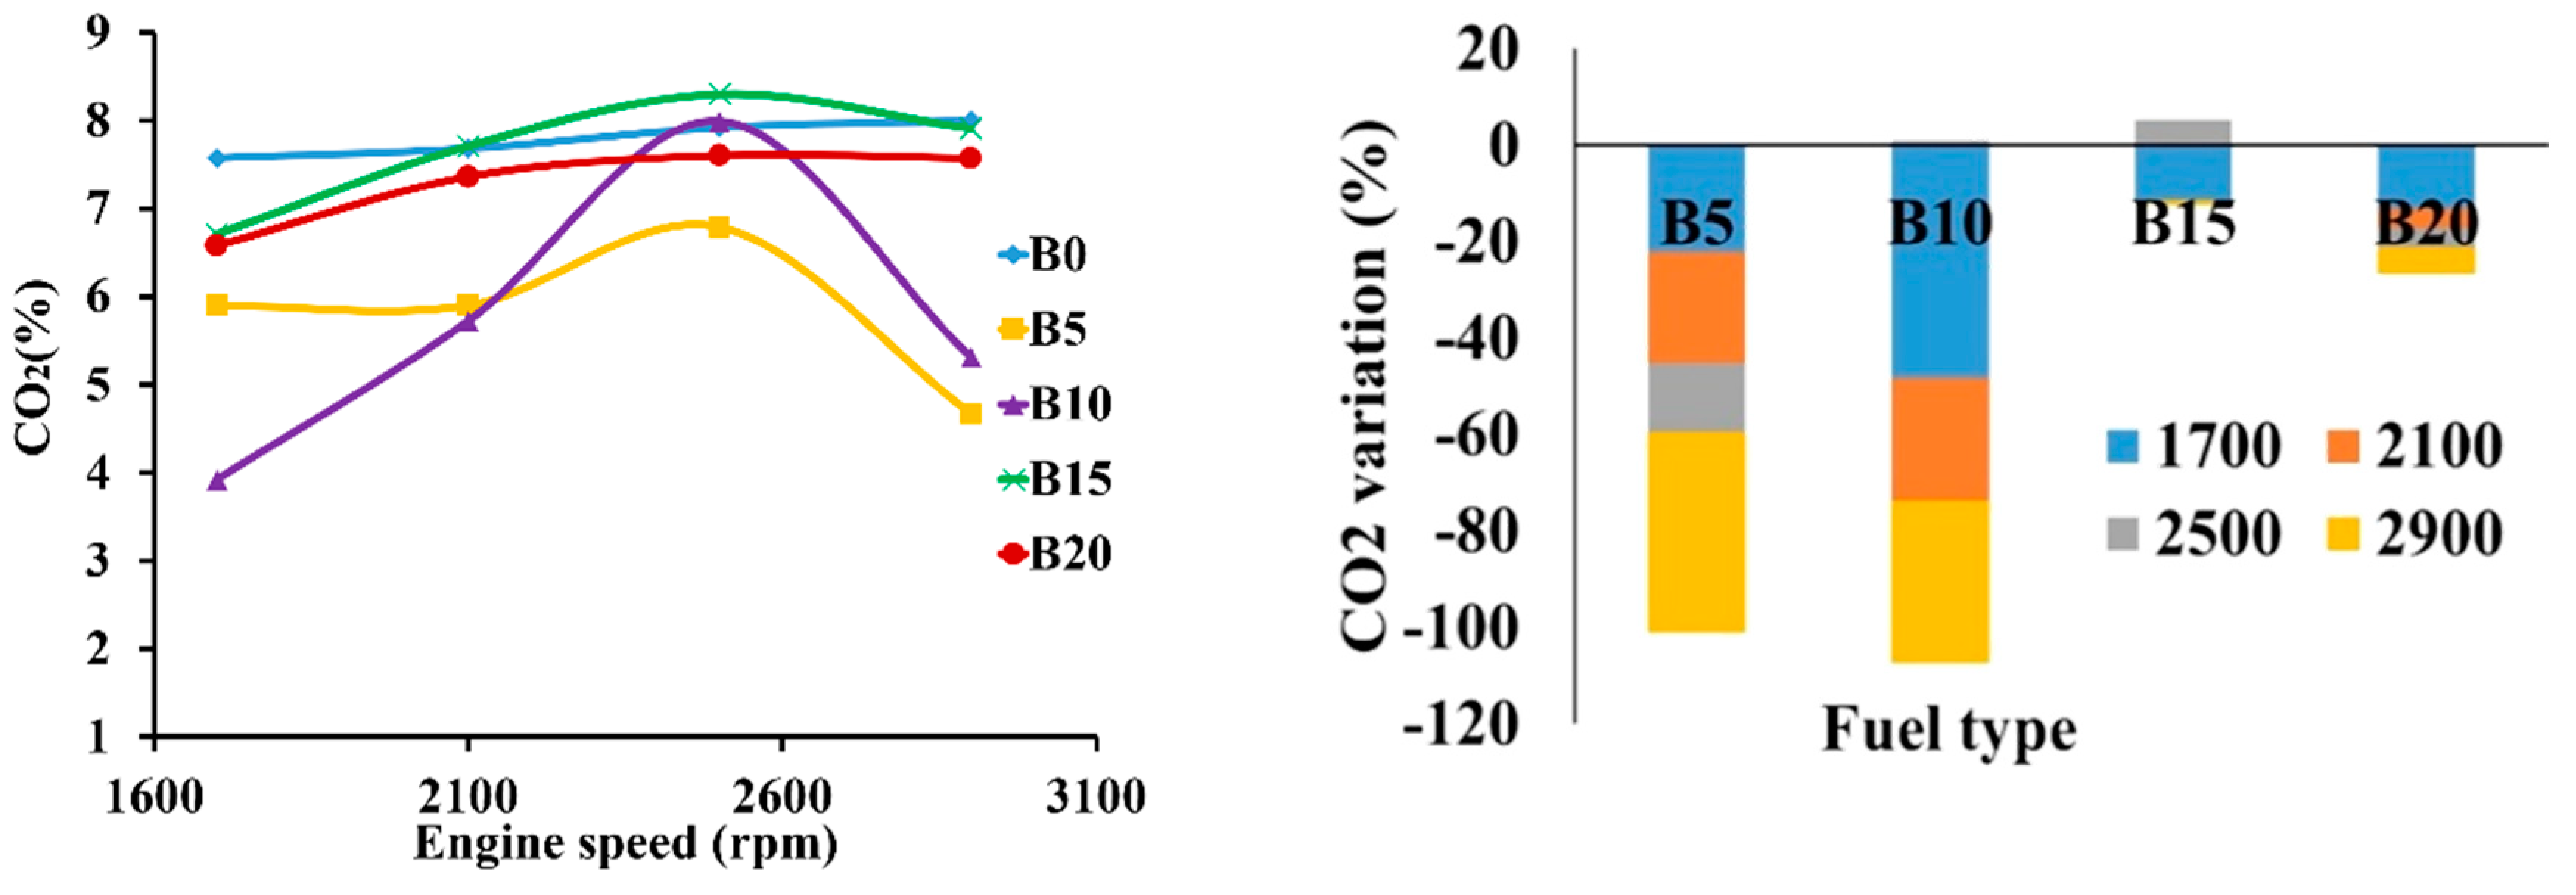
The
emission of all fuels has the tendency to increase with increasing engine speed for fueling with all percentages of diesel biodiesel blends fuels (
Figure 13). The
emissions are lower when the engine is fueled by diesel biodiesel blends than when fueled by standard diesel in the 1700–2100 rpm engine speed range. The
emission decreased for all diesel biodiesel blends fuel in the 2100–2500 rpm range. Increase of
in the exhaust emissions is an indication of the complete combustion of fuel and this is due to the higher oxygen content of biodiesel [
43,
48]. As can be seen in
Figure 8, the best percentage of diesel biodiesel blend regarding
emissions is B15, which causes the highest increase in
emissions. In addition by increasing the percentage of the biodiesel in diesel fuel, the
increased up to B15, but for B20 the value of this emission decreased again. This may be a consequence of the lower viscosity of that biodiesel blend [
49].
emissions of the engine for different engine loads, engine speeds and fuel blend percentages are shown in
Figure 14.
Different and conflicting results have been presented by various researchers about the effect of biodiesel fuel on
production by internal combustion engines. In one hand it was found that when using biodiesel in internal combustion engines it results in a rise of
emission production [
50] and on the other hand, a decrease in
emissions due to the use of this fuel is reported [
48]. In addition, plants would use the
emitted by the engine during photosynthesis process [
51].
3.4.3. HC
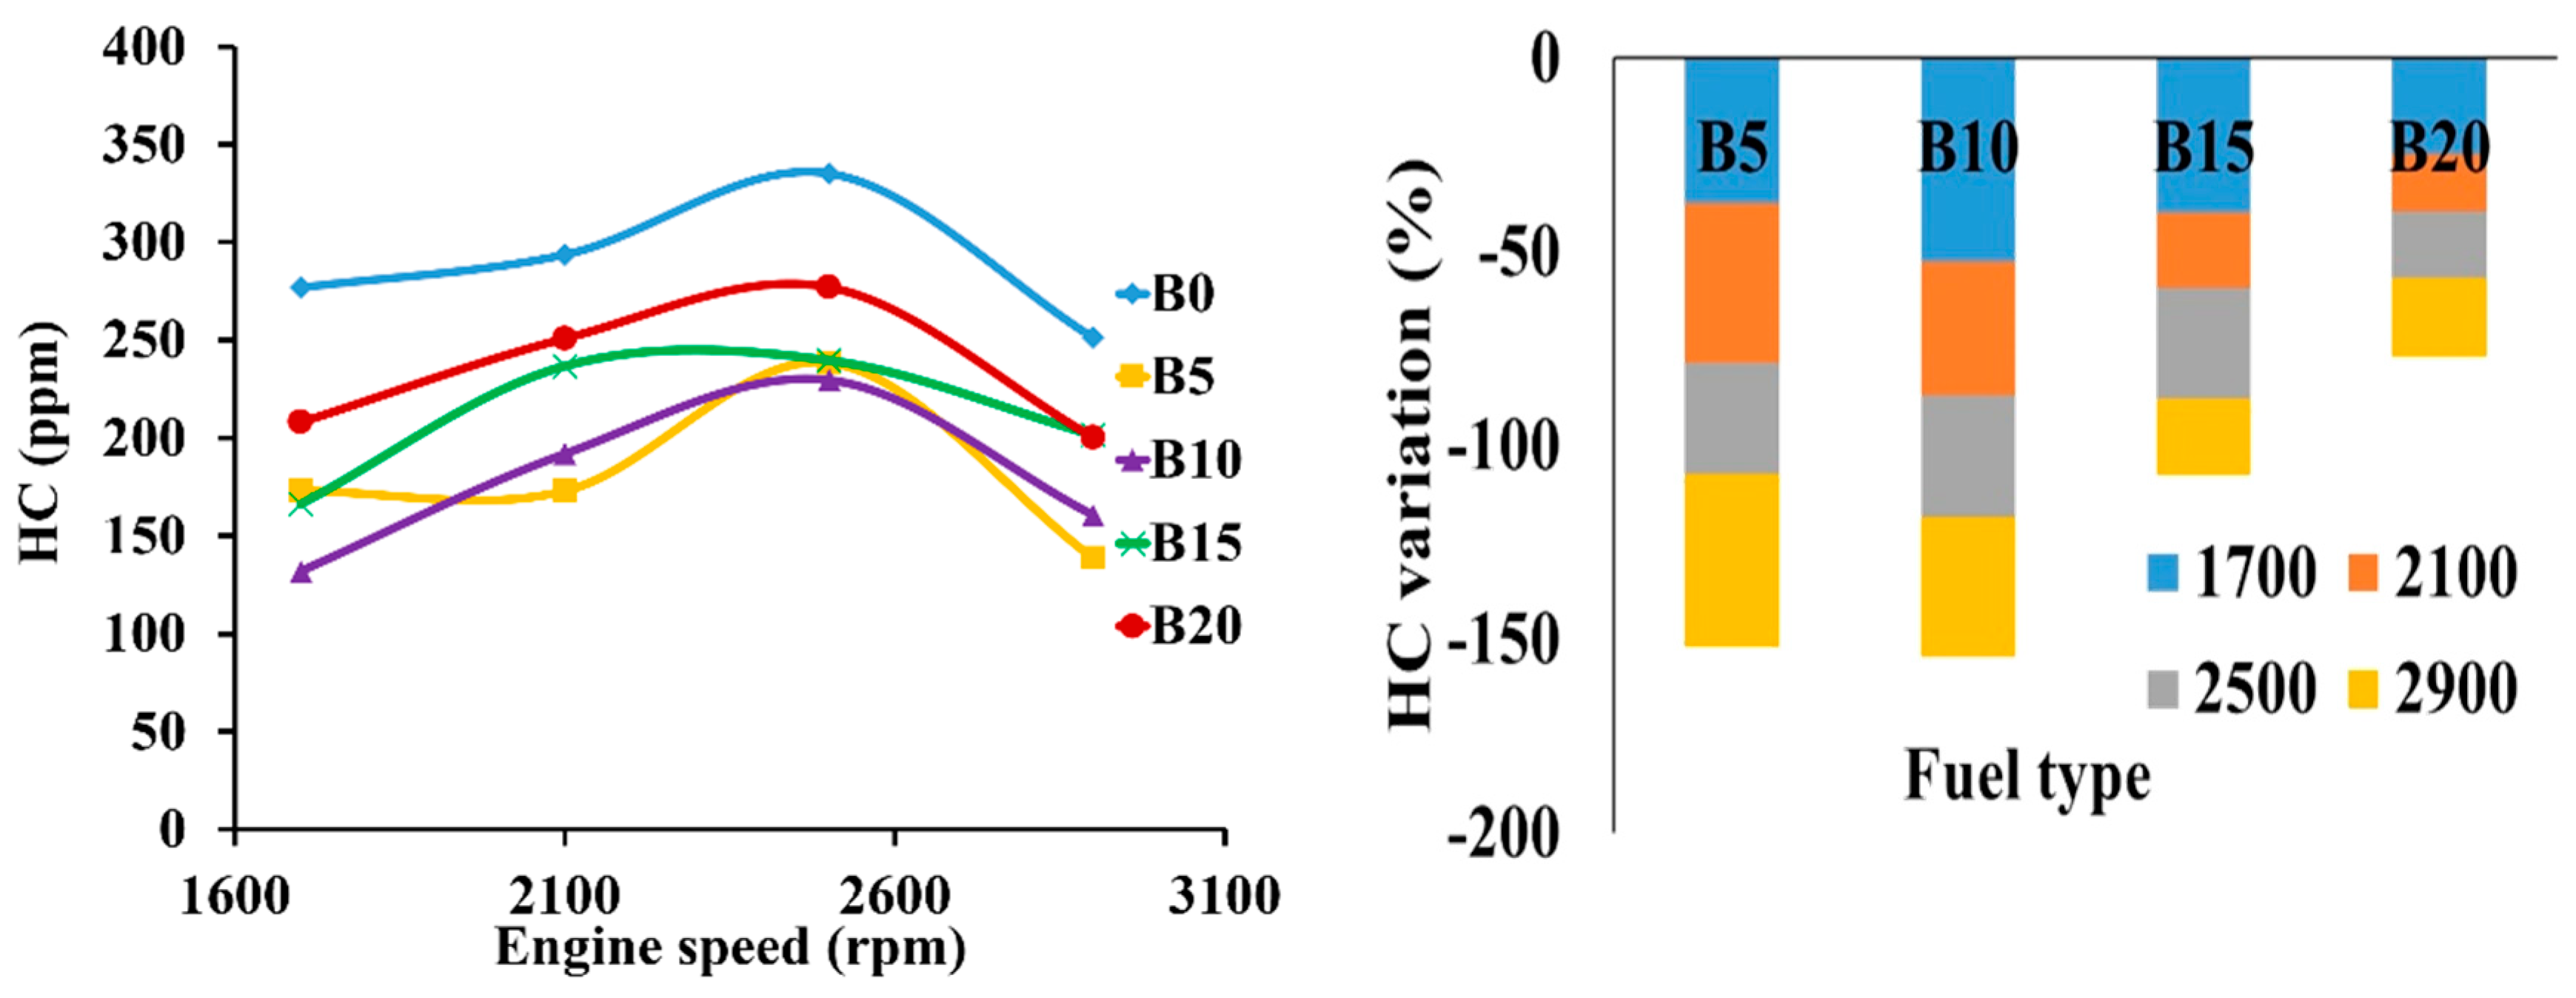
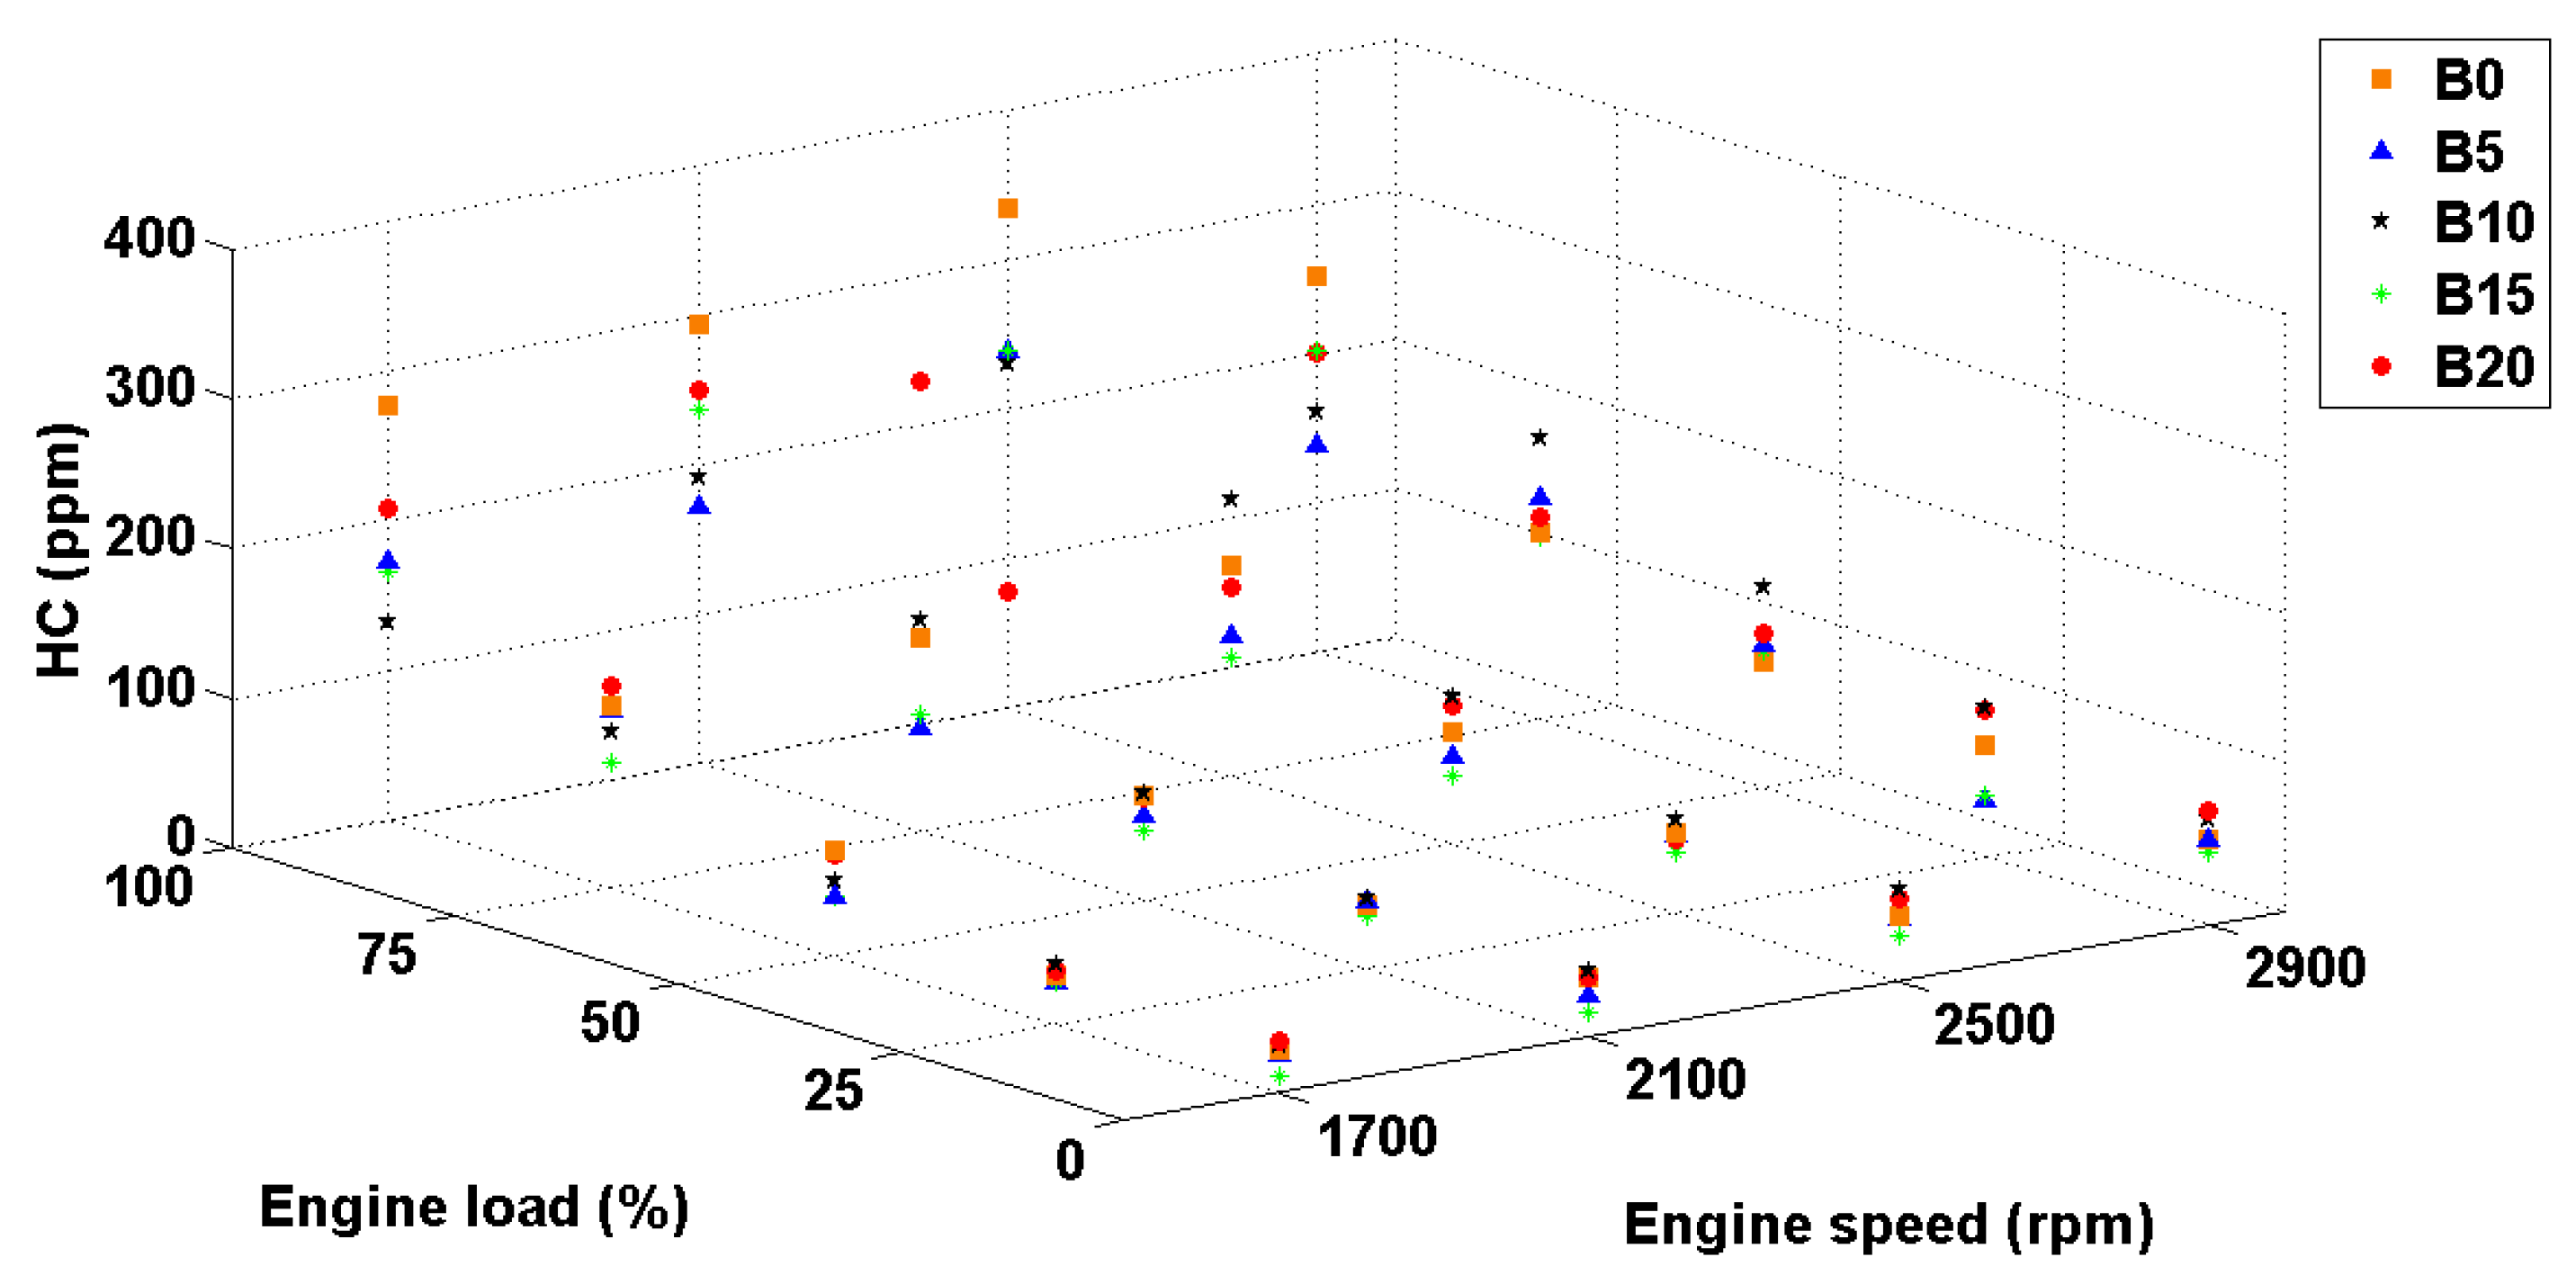
The recorded HC emission levels for all biofuel blends are lower than that of diesel alone (
Figure 15). The highest reduction of HC is for B10 fuel at 1700 rpm (52.37%). The B5 and B10 biodiesel diesel blends have had same HC value. but the B15 fuel has a higher value than these two. The lowest reduction trend in HC value is for B20 fuel. Overall, a higher amount of biodiesel in diesel biodiesel blends decrease the combustion quality and increases HC emissions due to changing of the injection and atomization of the fuel into the cylinder while a lower amount of biodiesel enhanced the quality of combustion and reduces HC emissions due to its higher oxygen content. This behavior is also reported by other researchers [
45,
52]. The next reason for reduction of the HC emissions is the higher CN of biodiesel fuel which increases the premix combustion phase [
49]. HC emissions of the engine for different engine loads, engine speeds and fuel blend percentages are shown in
Figure 16.
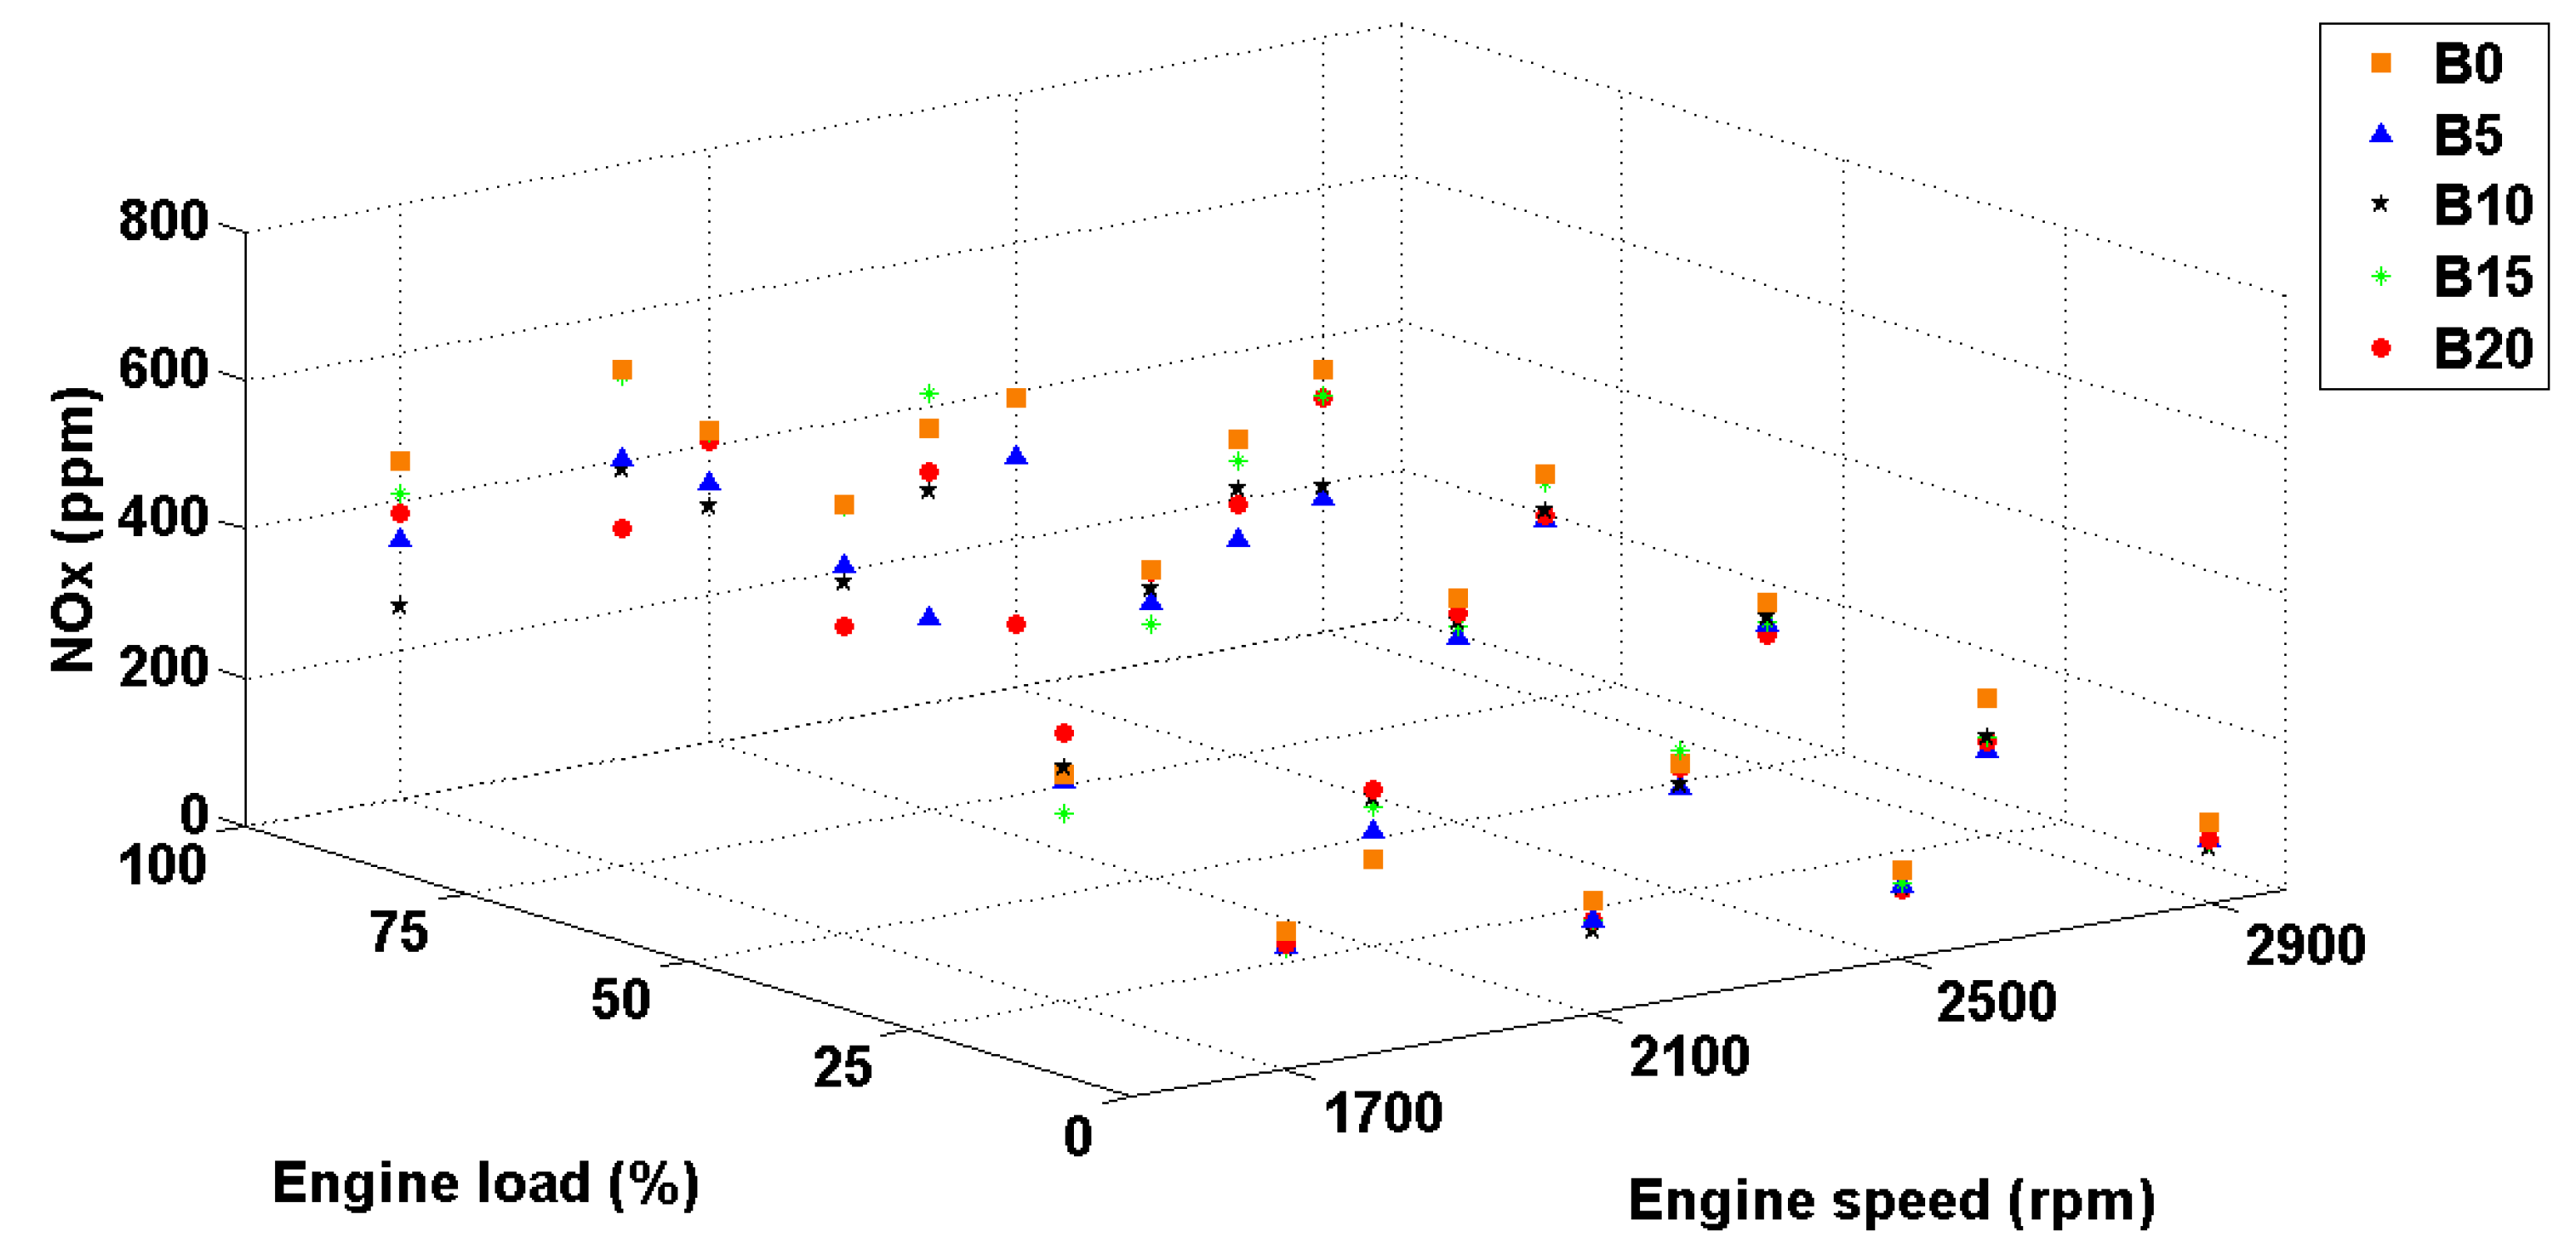
3.4.4. NOX
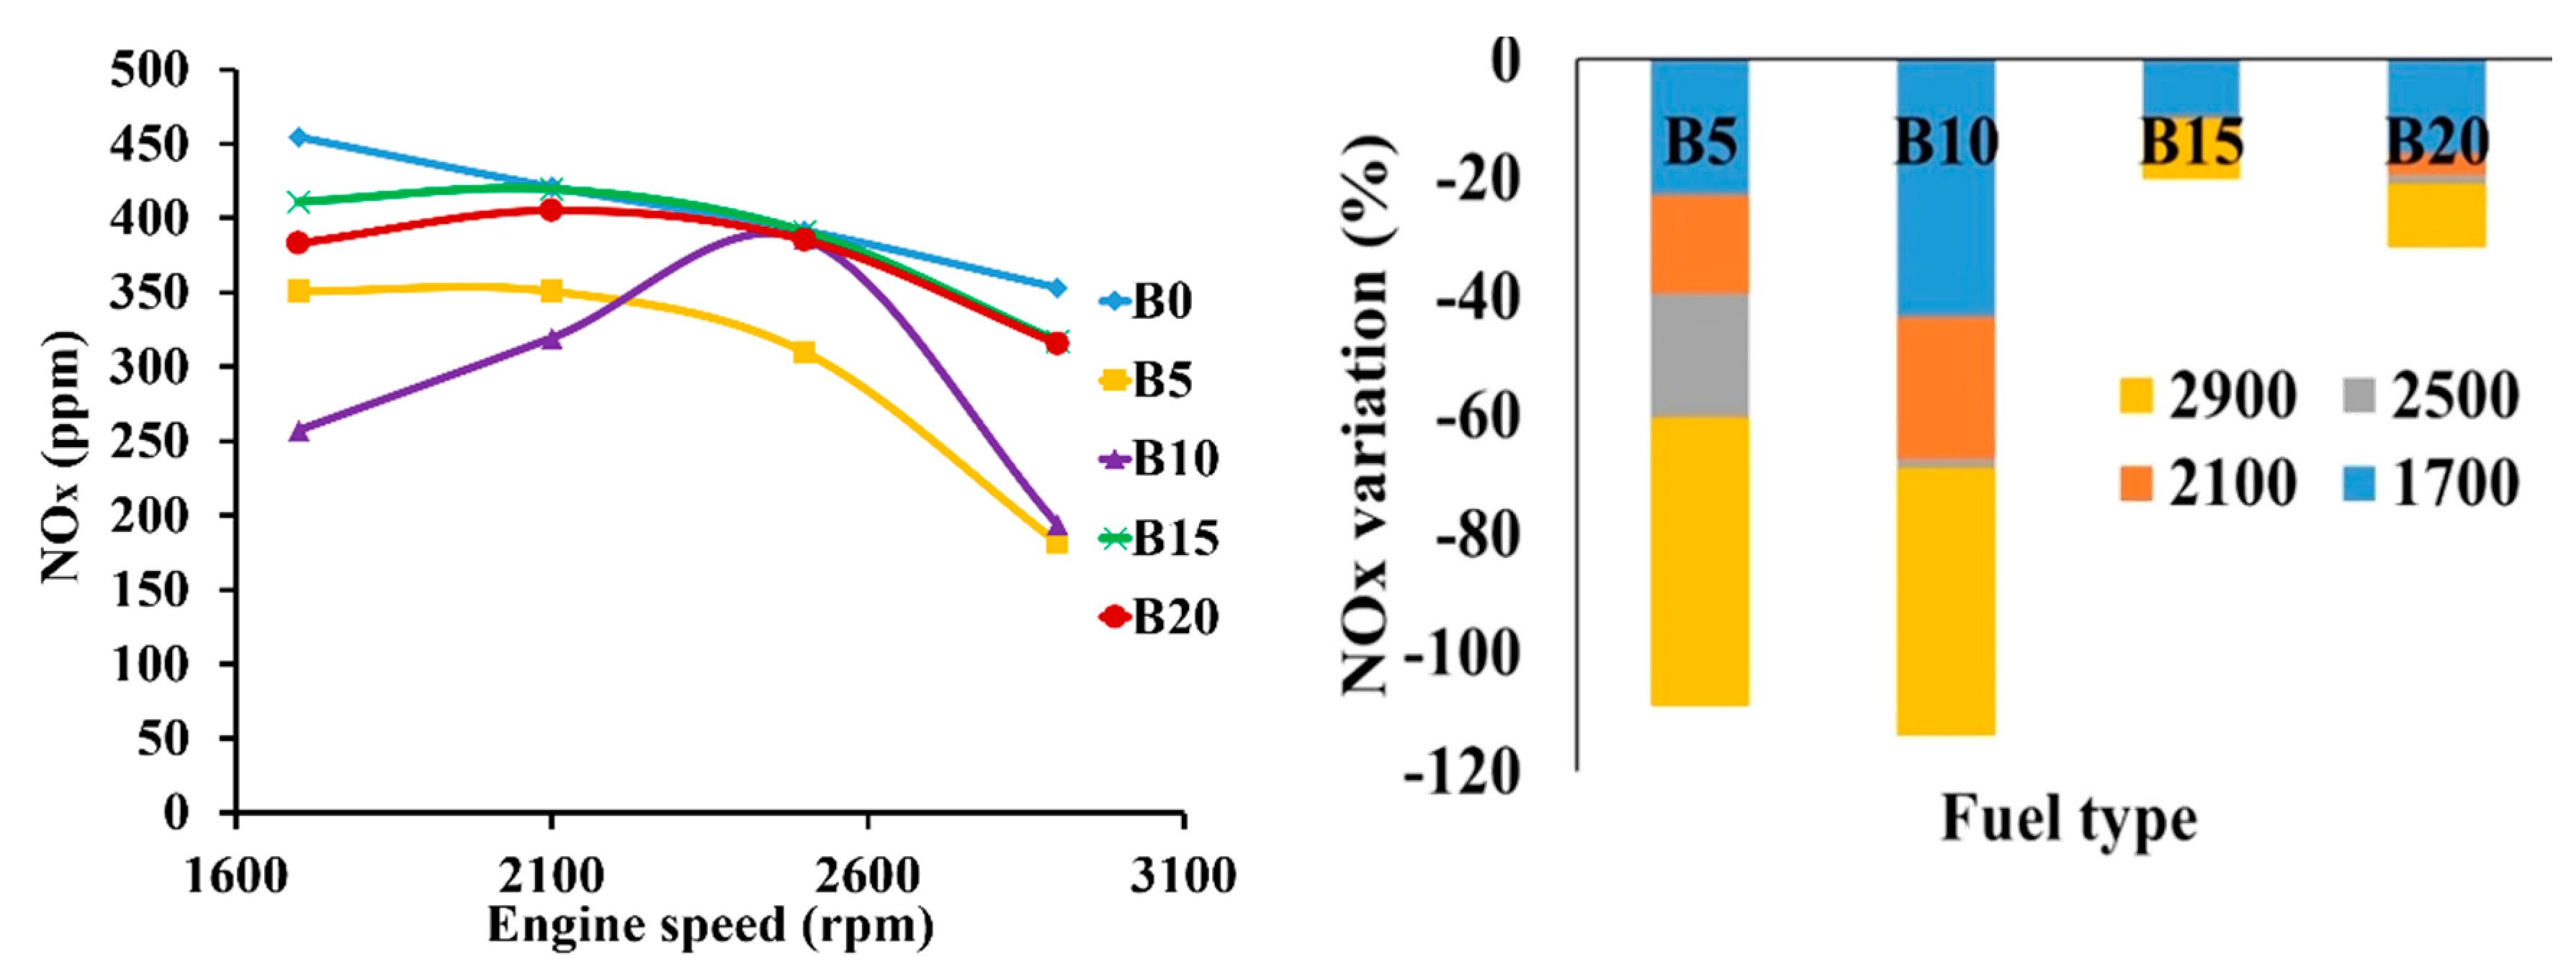
The
emissions decrease with increasing engine speed (
Figure 17). At all engine speeds the
emissions of diesel biodiesel blends are lower or at least same as that of diesel fuel. Similar trends have been reported by Aydin and Bayindir [
53,
54]. Reduction of the
emissions while using biodiesel fuel instead of the diesel fuel is also reported by Geng et al., [
55]. The most decrease in
emission corresponds to B5 at 2900 rpm (94.55%).
emissions of the engine for different engine loads, engine speeds and fuel blend percentages are shown in
Figure 18.
The higher cetane number (CN) of biodiesel can be a reason for the decreasing
emissions. The premixed combustion is increased by increasing in cetane number due to the decrease in the ignition delay. Due to this reduction in premixed combustion the pressure of combustion rises more slowly and the time for cooling comes from heat transfer and dilution will decrease local gas temperature [
54].
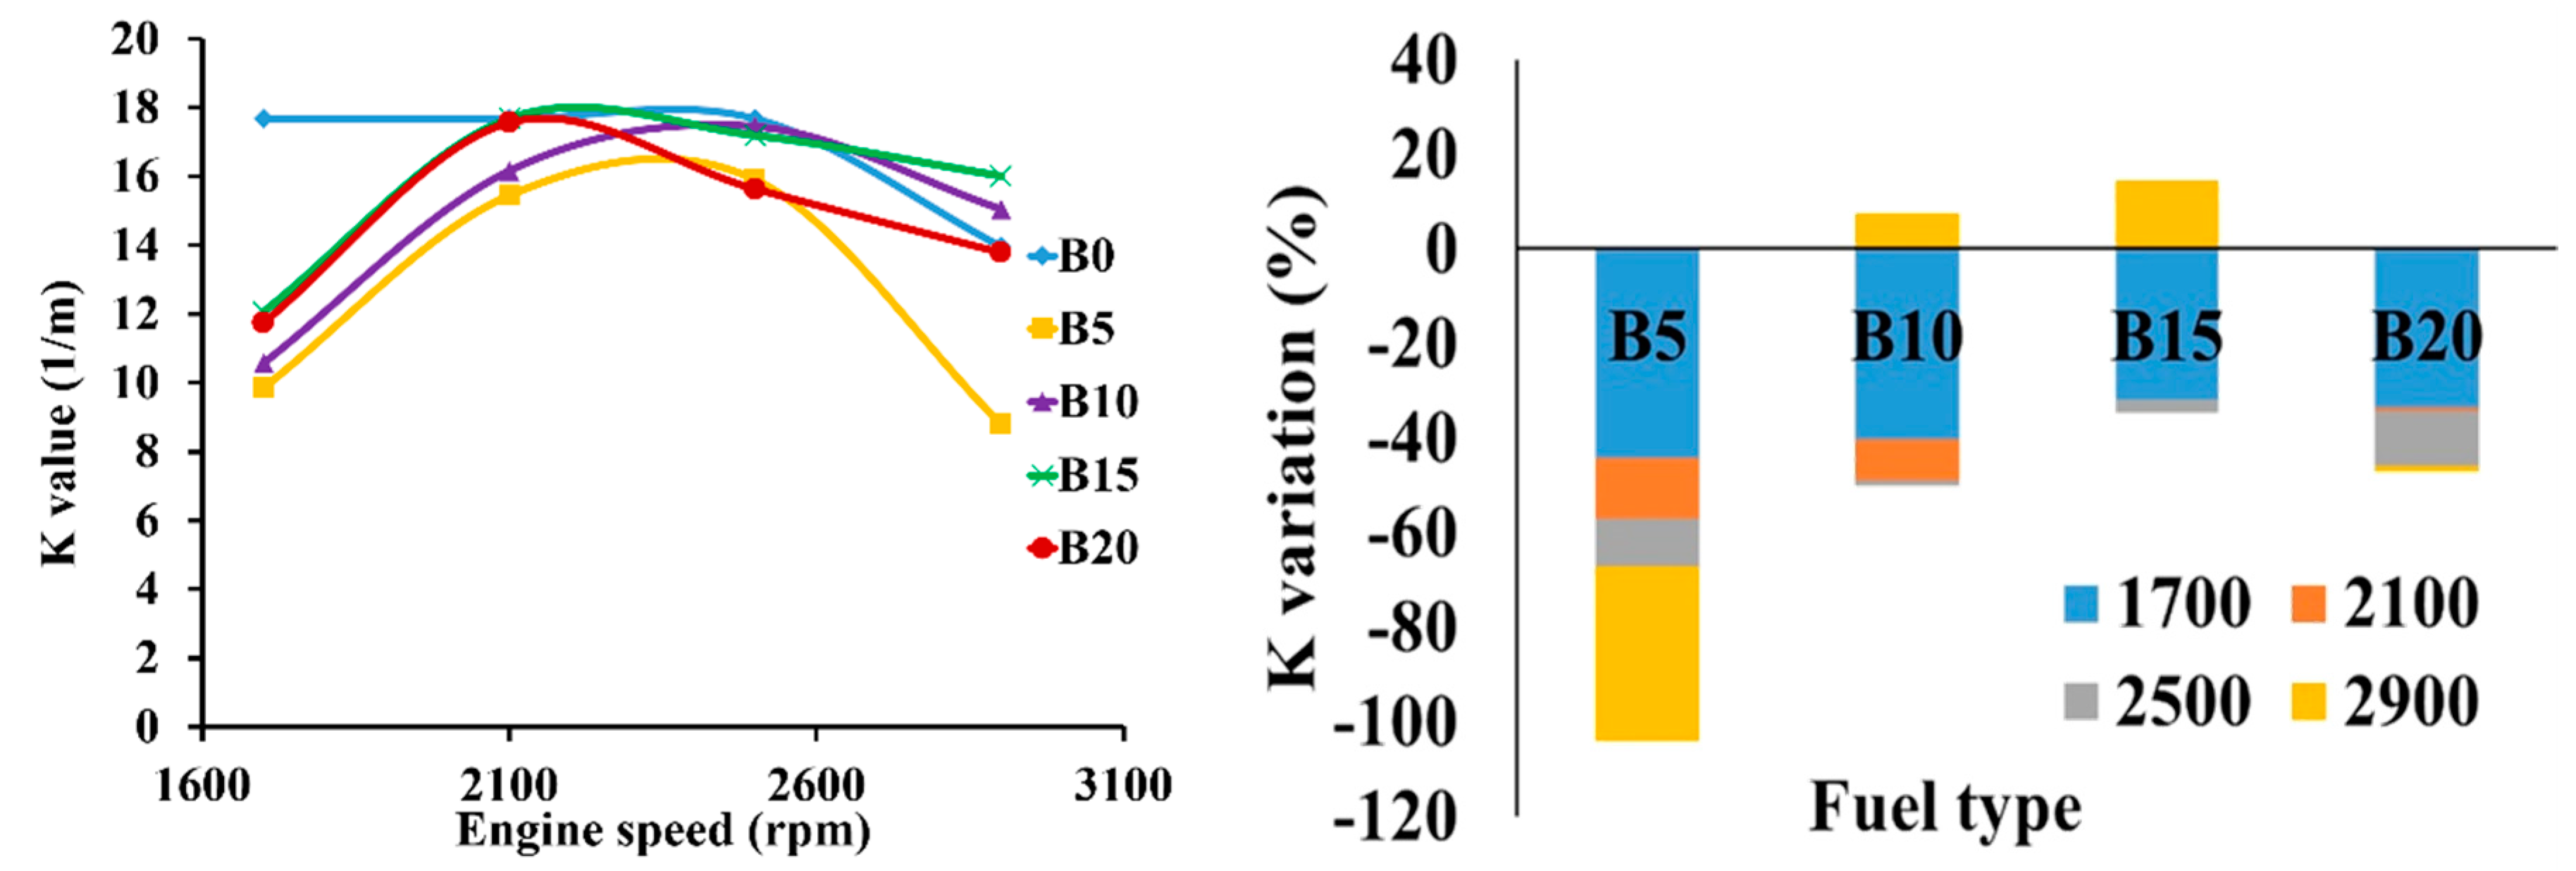
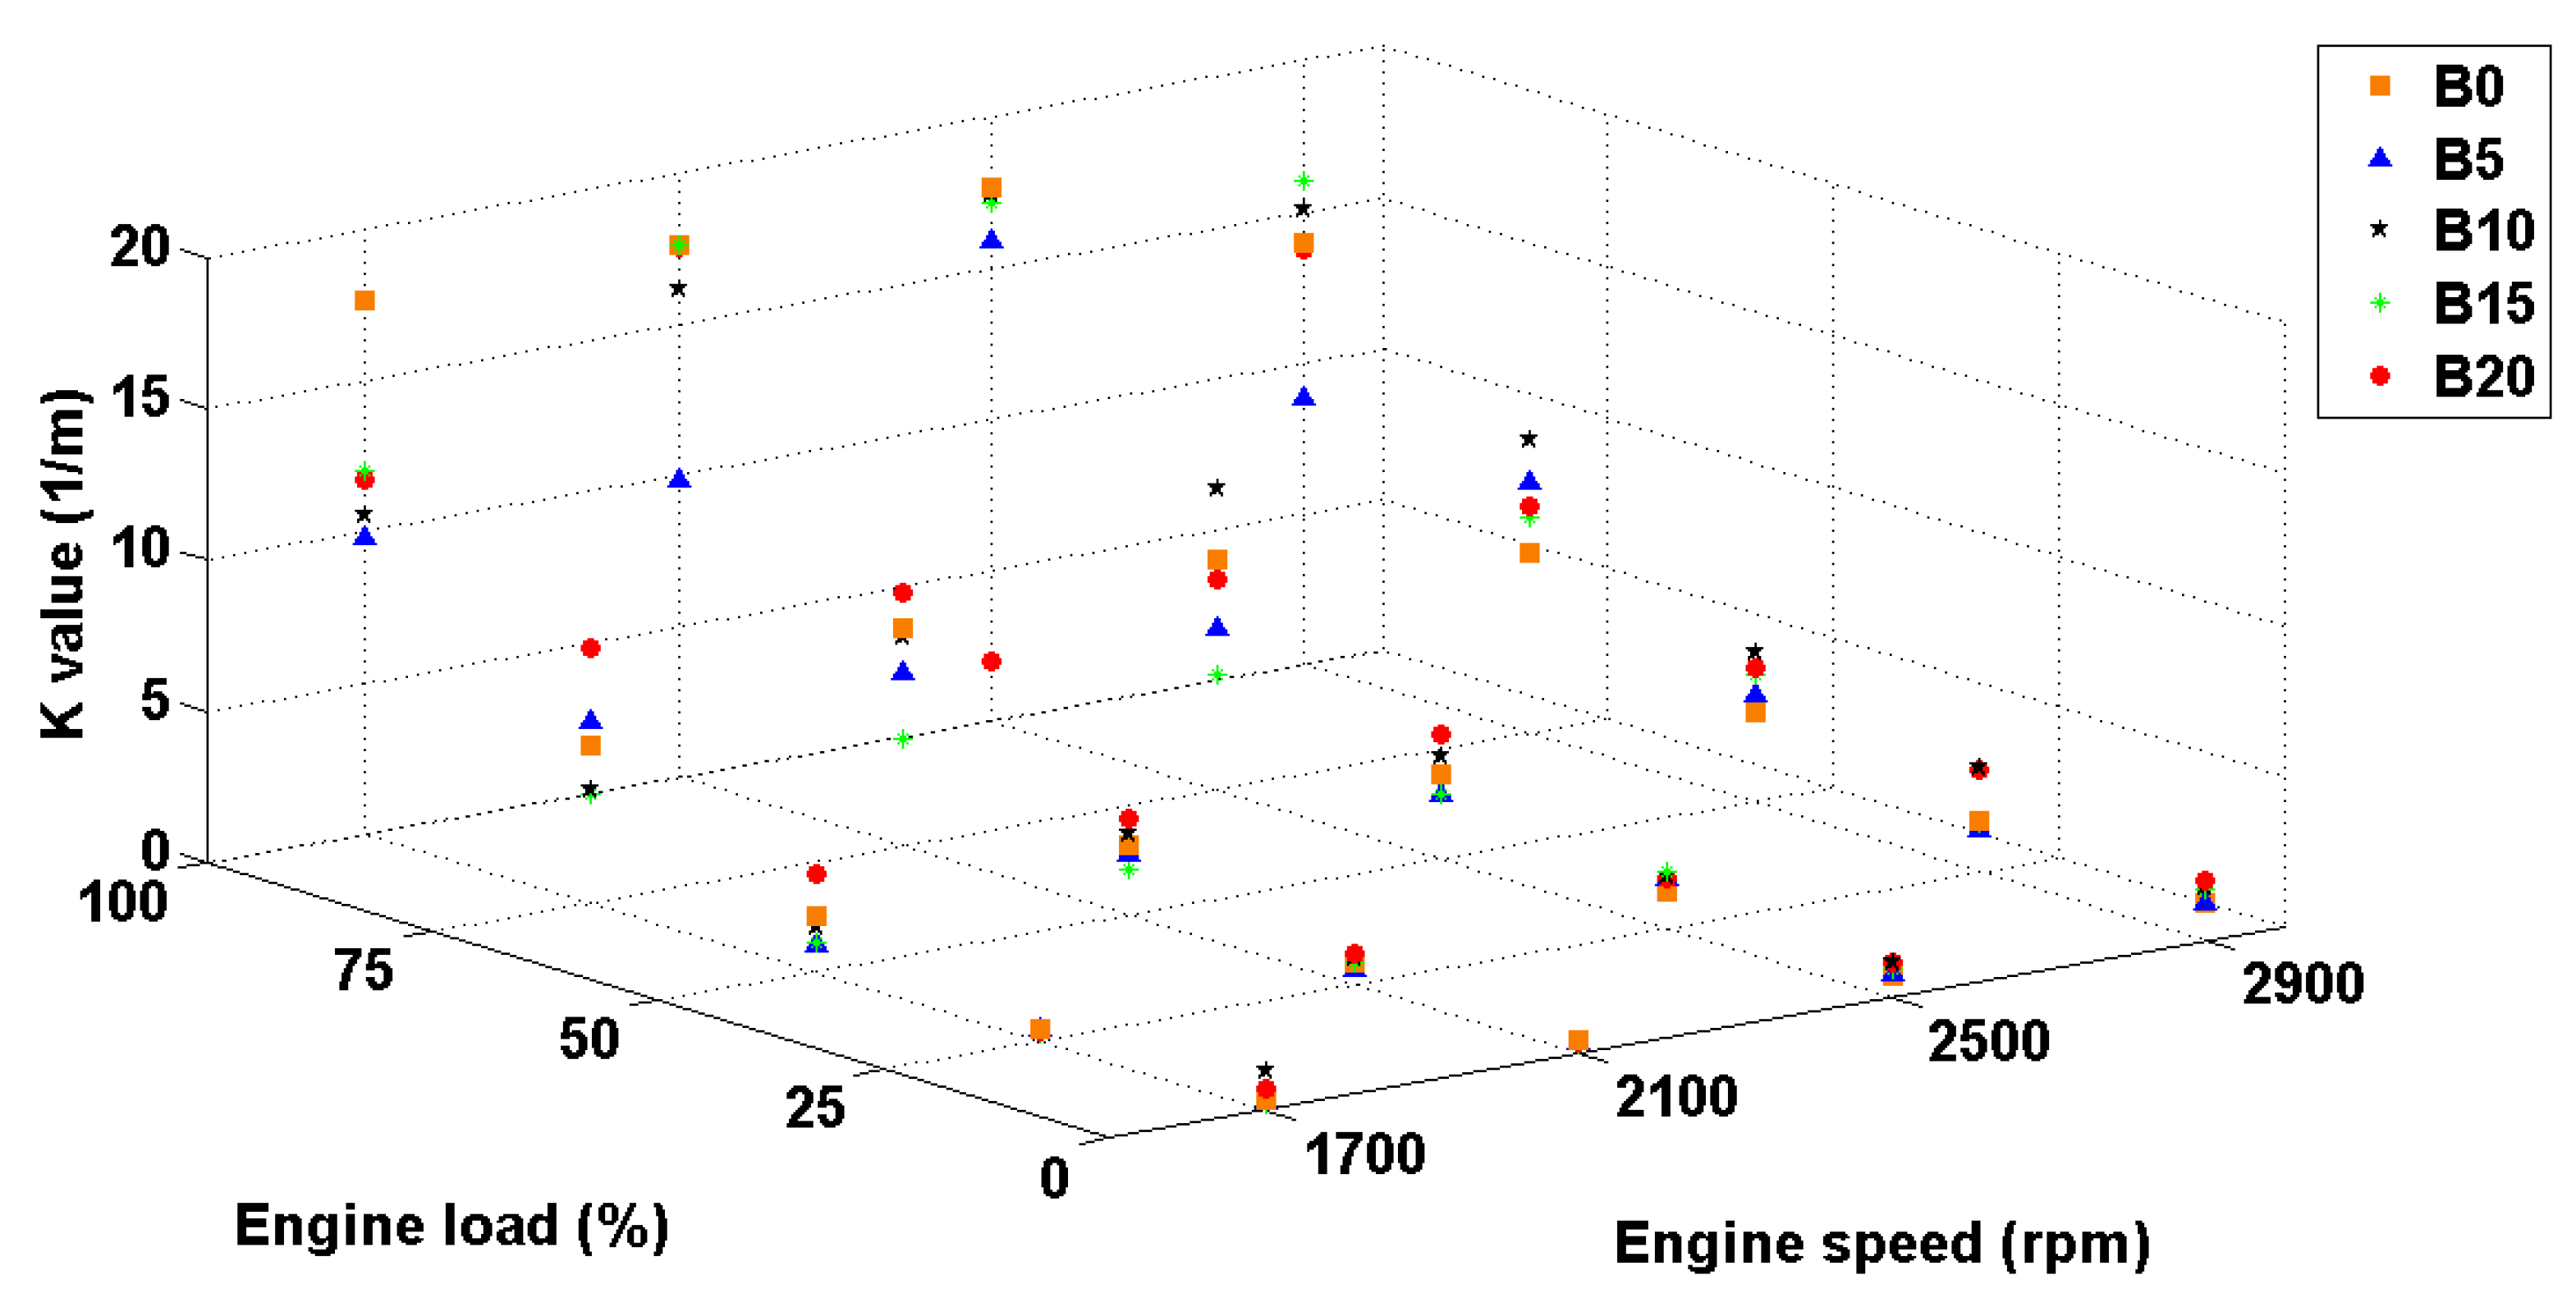
3.4.5. Smoke Opacity (k Value)
This emission is lower for biodiesel fuel than diesel fuel (
Figure 19). The highest value of
k value reduction is for B5 fuel blends (44.29%) at 1700 rpm. Overall it can be stated that the k value for all the fuel blends at 1700 rpm have been decreased considerably compared to B0 (44.29, 40.21, 31.79 and 33.60% for B5, B10, B15 and B20, respectively). The reduction of the soot due to the use of biodiesel fuel was also reported by Yusop et al., [
56]. As discussed in the above section about correlation between the
k value and amount of CO,
and HC, the order of fuel blends for
k value is same as that in the mentioned emissions, so the main reason for the reduction of
k value while using biodiesel diesel fuel blends is its oxygen content. This added oxygen improves the quality of combustion and hence decreases the HC and CO emissions. Increases in the
k value of biodiesel blends may be due to their higher viscosity and density than diesel fuel, which may decrease the injection and mixing of fuel in the cylinder. The result of this variation in injection and mixing is a low quality combustion and production of CO, HC and finally smoke. Similar results were reported by other researchers [
36]. The
k value of the engine under different engine loads, engine speeds and fuel blend percentages are shown in
Figure 20.
3.5. ANN
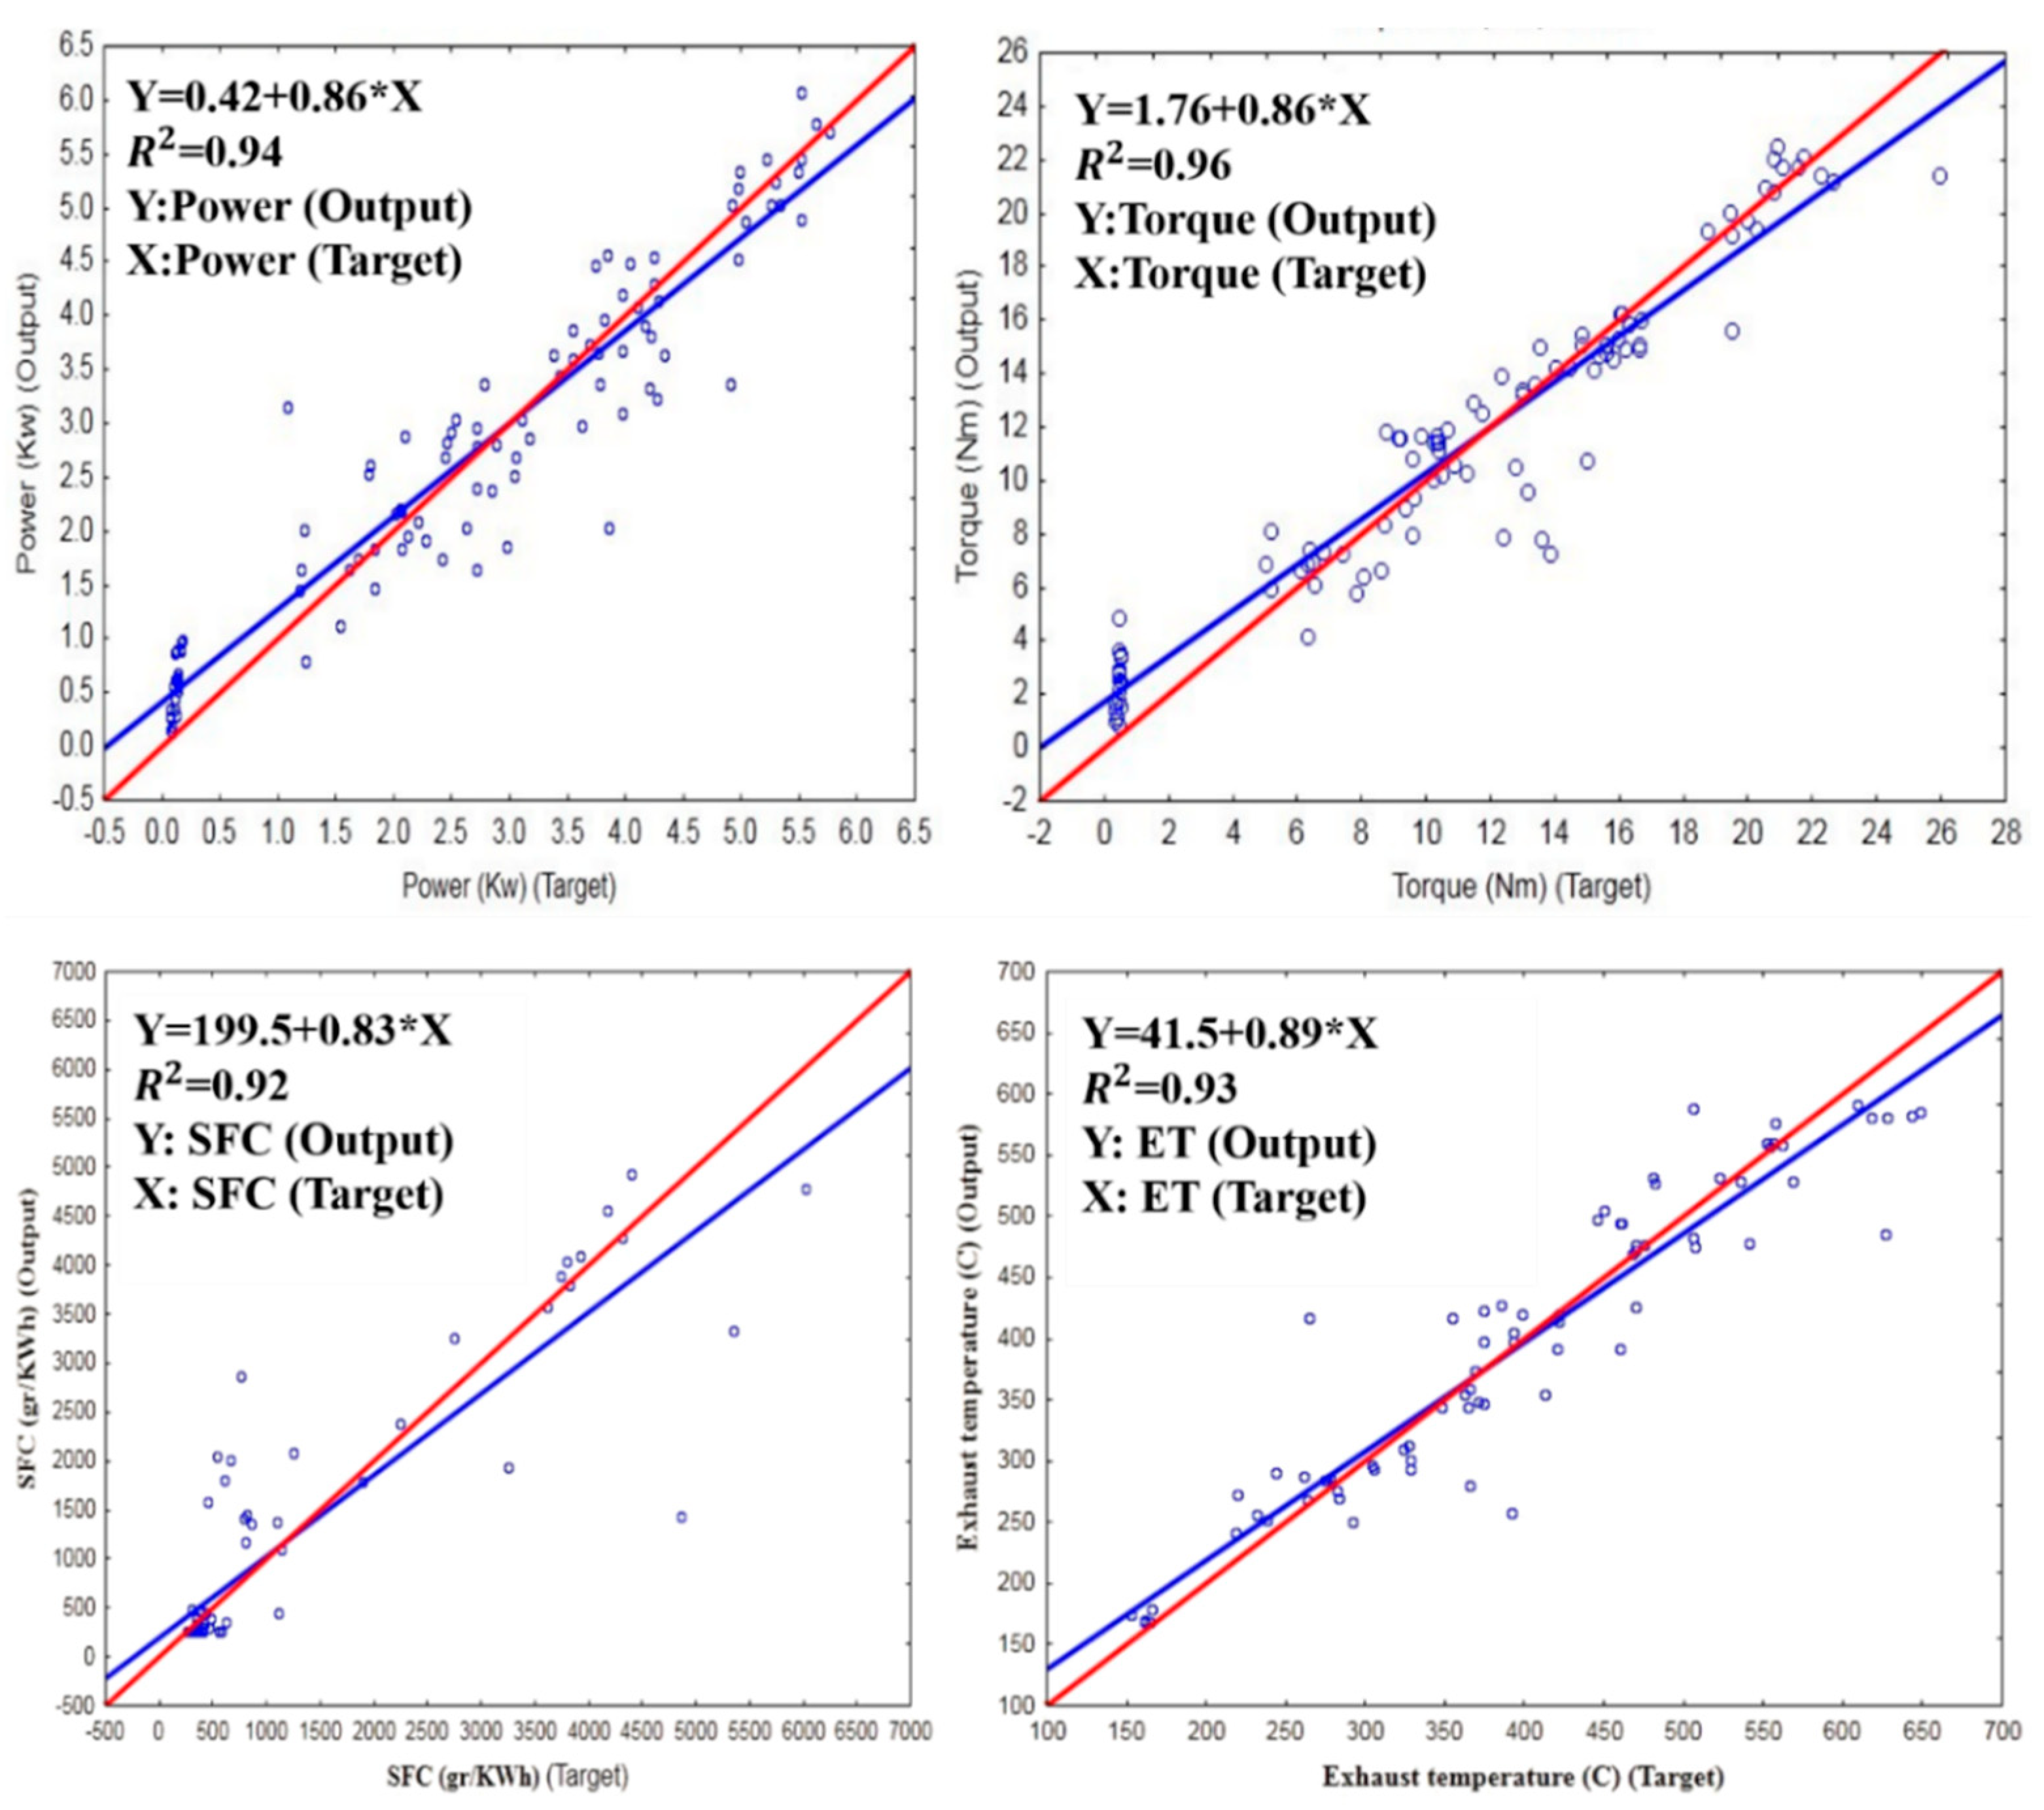
The ANN model has been developed by using experimental data in order to predict BSFC, engine power, exhaust gas temperature, torque, , HC, CO,, k value according to engine LOA and speed and fuel type. The results of the prediction by this model showed a good capability and correlation between the output of the model and experimental data. So, application of this model in order to predict such a parameter is recommended.
In consequence of trials, the best network architecture for prediction of effective power became 3-8-9 after 150 epochs (
Figure 21). Considering the architecture and prediction accuracy of the network, 8 hidden neurons had been selected. The ANN has been used in prediction of the emission and performance parameters of the engine. The network has three input parameters: engine load and speed and percent of biodiesel blend. Correlation between predicted data and experimental data is considered in term of
R2. This is done to evaluate the model. As can be seen in the
Figure 22 and
Figure 23 the
R2 is close to 1 for considered parameters.
In
Figure 12, the capability of created ANN model to predict of performance parameters of the engine is shown. The coefficient of determination (
R2) between predicted and real value of each parameters are shown in this figure. As it can be seen, the
R2 value for all performance parameters is very close to 1. The highest and lowest values of
R2 are 0.98 and 0.93 for torque and exhaust gas temperature of the engine, respectively.
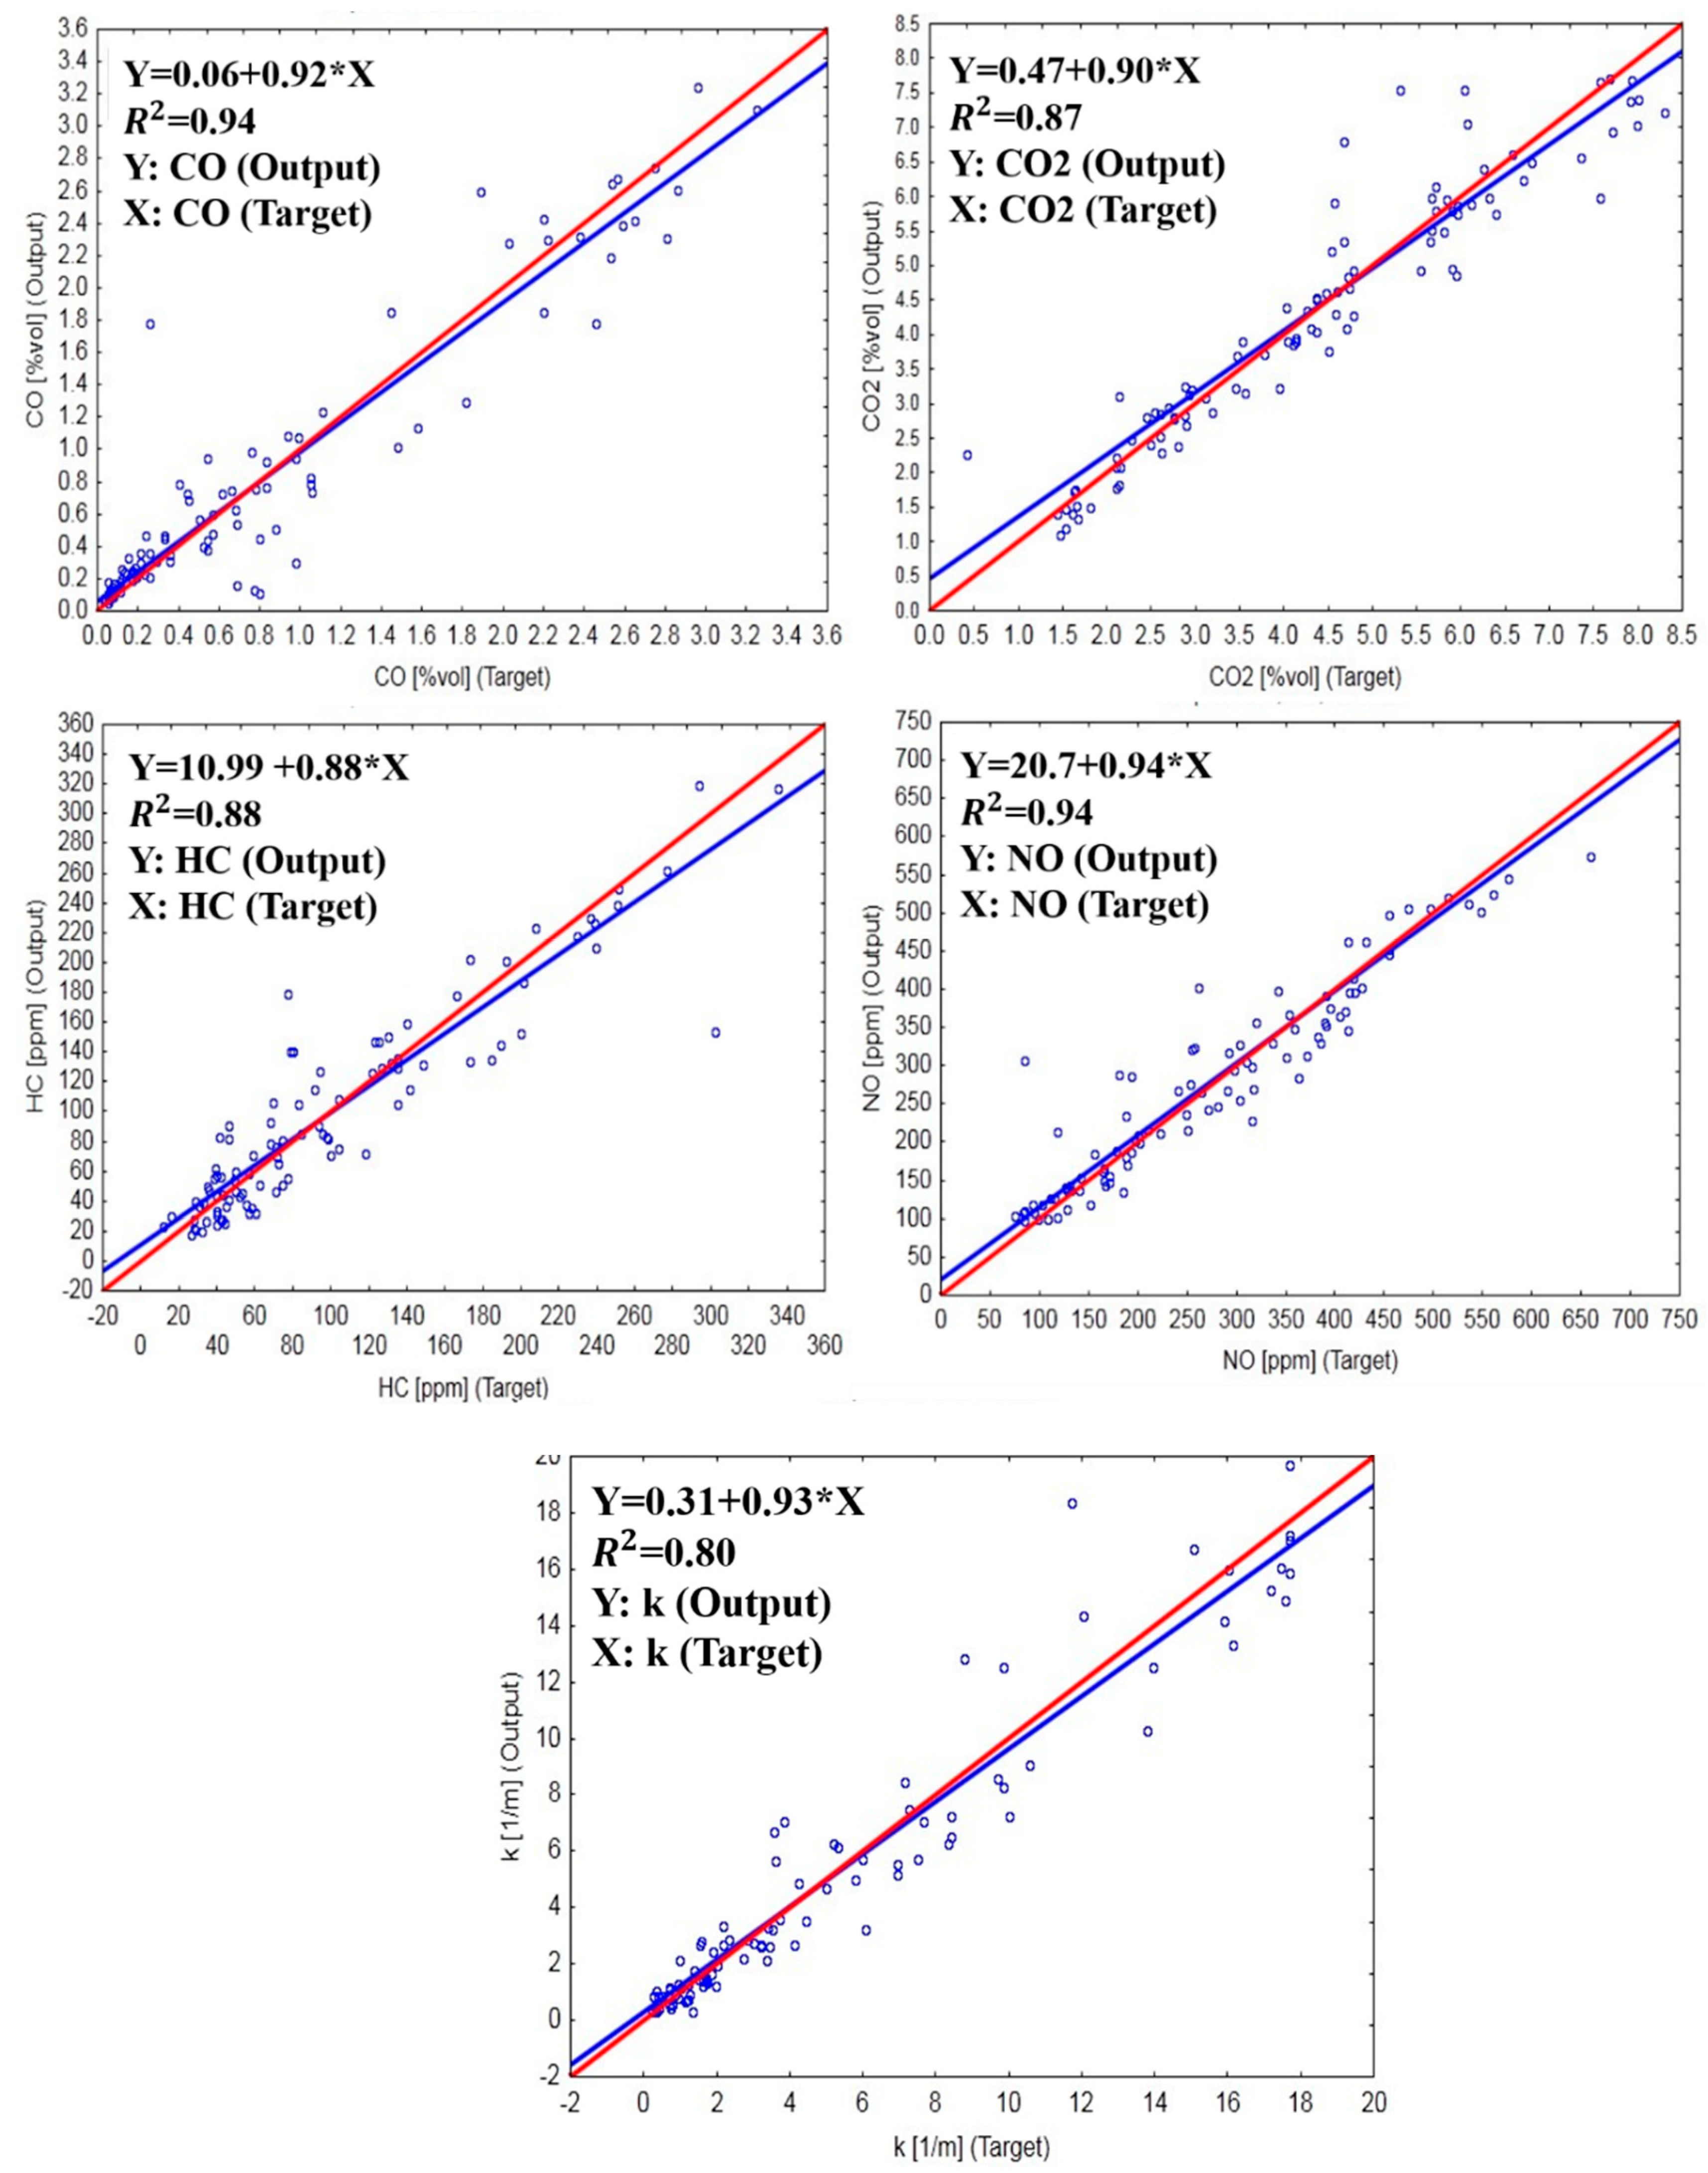
The goodness of emission prediction of developed ANN model is shown in
Figure 14. As it can be seen in this figure, the determination coefficients (
R2) for prediction of emissions of the engine are lower than that in prediction of performance parameter of the engine, e.g., the highest and lowest values of the
R2 are 0.94 and 0.80 for CO and K, respectively. The same result can be seen in the other studies [
7,
13].
One reason for these differences may be due to the quantity characteristics which have been measured. The capability of ANN model to predict a quantity is dependent on the data which is trained by them. Here measurement of the emission parameters may include more noisy data than performance parameters. In addition selection of the input parameter for each model to predict an output parameter is crucial. From the results of the determination coefficient in this study, it can be concluded that there may be some effective parameters which are effective on predicted parameters but not included as input parameters.
3.6. Sensitivity Analysis
The result of the global sensitivity analysis is shown in
Table 6. As it can be seen the parameter that most affects the outputs is engine load and the engine speed and percent of biodiesel in diesel biodiesel blends have a lower effect on the outputs. This also can be seen in the different graphs shown, which show the variations of output parameter with inputs.
In summary, it can be generally stated that application of sensitivity analysis for the ANN model of the engine parameters can help distinguish the importance of the input parameters of the model. In addition, it should be noticed that this is extremely helpful when there are numerous input parameters for the ANN model. The advantages of the present study in comparison with the previous studies [
7,
13] is the application of the sensitivity analysis to determine the importance of the input parameters of the ANN model which is created for engine performance and emission modeling, although, a lack of the information about the combustion parameters may be a deficiency of the developed model which will be the topic of future study by the authors.


