Article

Effect of Densification Conditions on Specific Energy Requirements and Physical Properties of Compacts Made from Hop Cone

1
Institute for Agricultural and Earth Moving Machines (IMAMOTER), Italian National Research Council (CNR)-Strada delle Cacce, 73-10135 Torino (TO), Italy
2
Department of Agricultural, Forestry and Food Sciences, University of Turin–Largo Paolo Braccini, 2-10095 Grugliasco (TO), Italy
*
Author to whom correspondence should be addressed.
Energies 2018, 11(9), 2389; https://doi.org/10.3390/en11092389
Submission received: 10 August 2018 / Revised: 31 August 2018 / Accepted: 8 September 2018 / Published: 11 September 2018

Abstract

:
Hop cones, due to their essential flavor, are one of the four main ingredients for beer production. The paper reports the results on an investigation of the densification process of hop cones. This experiment investigated (i) the effects of compression pressure in the range of 40 to 80 MPa and pressure application time in the range of 10 to 40 s on the final density and durability of the compacts made from hop cones and ii) the specific compression energy required for the process. The specific compression energy requirements to compact hop cones ranged from 14.20 to 24.48 kJ kg−1. The final compact density values ranged from 515.2 to 876.6 kg m−3, while the durability percentage calculated ranged from 71% to 91%. The obtained results highlighted that compression pressure—in the range of 40–80 MPa—significantly affects the specific compression energy requirements, the final density and the durability of the produced compacts. In this experiment, pressure application time plays a key role in determining compacts density, while did not affect durability and compression energy requirements. Considering the specific compression energy values calculated in this experiment, it can be stated that the pressure agglomeration method described to compact hop cones is more efficient than pelletizing process which is typically characterized by specific energy values ranging from 19 to 90 kJ kg−1.

1. Introduction

Hop (Humulus lupulus L.) is a spontaneous plant in central Europe, nowadays, widely cultivated in all temperate areas [1]. According to statistics from Food and Agriculture Organization of the United Nations (FAO) published in 2016 [2], the total amount of hops harvested worldwide was about 346,000 tonnes from an area of about 93,000 ha (http://faostat.fao.org). The main hops producers in the world are Germany, China and U.S.A., with the European production ranging between 50% and 62% of the world production [3]. The female flowers, the cones, are used in the brewing industry. The bitter hop-compounds (approximately 17–55 ppm of iso-a-acids), being toxic especially for Gram-positive bacteria, contribute with the ethanol to build an unfavourable medium for many microorganisms [4]. These properties have been used for many centuries but nowadays hops are included into to brewing recipe to give the beer its specific hallmarks with the flavours of the selected hops: traditional aroma varieties are responsible for spicy or herbal ‘noble hop aroma’ while flavour hops give tropical fruit, citrus, pine, or flowers aromas in beer [5]. Among the latter, the Cascade variety, thanks to its floral and citrusy aromas and bitterness, is considered the main culprit of the craft beer explosion that has transformed the beer business [6].
The high moisture content (about 75%) of fresh hop cones is one of the most limiting factors for their use in the brewing industry. According to Krofta et al. [7], in order to prevent hop cones degradation, reducing their moisture content under 12% immediately after harvest is strongly recommended. Furthermore, the low bulk density (about 25 kg m−3), negatively affects hop cones transportation, handling and storage, representing an additional obstacle for their industrial use.
The density of biomass is an important parameter for technologies, is termed “densification” and is widely used in the biomass fuel industry [8]. As highlighted by many authors [9,10,11,12], densification processes, such as pelletizing, increase the biomass bulk density from an initial value of 40–200 kg m−3 to a final one higher than 800 kg m−3. Thus, densification of biomass material could reduce the costs of transportation, handling and storage [13]. Typically, two techniques have been used for densification: tumble and pressure agglomeration [13]. In tumble agglomeration, densified products are formed by means of suitable movement of the bulking materials containing binder in machinery such as balling discs, balling cones and balling drums. In pressure agglomeration, densified products are formed by applying high forces to a mass of bulking materials within a confined volume [13].
Typically, hop cones are densified into pellet form [7,8,14]. Before pelletizing, hop cones are reduced to a fine powder with predominating particle dimension to 0.5 mm. After homogenization, the powder is forced through the holes of the metal matrix and is compressed in pelletized form [15]. However, due to the friction generated by the pressure between the holes and rollers which force the particulate material through the perforations, pellet production requires a high energetic input [16]. According to Tumuluru et al. [17], the energy required to overcome friction during pelletizing ranged from 60% to 63% of the total energy input needed for the process. The high energy requirement which characterizes pelletizing process has been confirmed by Tabil and Sokhansanj [18] which calculated, in their study focused on alfalfa pellet manufacturing, a specific energy value ranging from 19 to 90 kJ kg−1.
Considering the high energetic input to form hop cones pellet, this paper reports studies aimed at investigate alternative densification process of dry hop cones. In particular, two specific aspects were examined: (i) the physical characterization of the compacts obtained by the densification process, in terms of density and durability, being the properties that, as affirmed in many studies [18,19,20], mostly affect compacts quality; (ii) the specific energy requirement for hop compacts production under different compressing conditions.

2. Materials and Methods

2.1. Hop Cones Characterization

The investigated cones have been harvested at the end of September 2017 from 3 years old plantation of hop variety Cascade farmed in Piedmont region in North West Italy. The initial moisture content and bulk density values of harvested cones were 75% and 24 kg m−3, respectively.
Hop cones moisture content has been calculated according to the American Society of Agricultural and Biological Engineers (ASABE) Standard S358.2 [21]. Samples moisture content was obtained by oven drying at 103° for 24 h. The moisture content values showed in the present study are on a wet mass basis.
The ASABE Standard S269.4 [22] was used to determine the initial bulk density of the hop cones. The standard requires pouring the investigated biomass into a cylindrical container characterized by a volume equal to 0.05615 m3. The material is levelled across the top of the surface of the container and weighed. The biomass density value, expressed in kg m−3, is obtained by dividing its mass per unit volume. The bulk density values reported in this article are the mean of five measurements.

2.2. Hydraulic Compacts Press

A prototype hydraulic press was used to compact hop cones. The compaction equipment consists of two opposite hydraulic cylinders. The unit, fitted with an oil-hydraulic system, is able to deliver up to 297 kN in a time variable from 0 to 210 s. Different compressing chambers can be used, as needed. The hydraulic cylinders are fitted with load cells (model TMT–HY–C/PS, max rated load 200 kN, LCM Systems, Newport, Isle of Wight, UK) giving signals proportional to the compressing force. The top of the plunger is connected to a potentiometric displacement sensor (model LT-M-0500-S, 500 mm full stroke, Gefran SpA, Provaglio d’Iseo, Italy) giving the exact position and volume of the compressing chamber. A pressure transducer (sensor 3100 series, 0–250 bar, Gems Sensor & Controls, Plainville, CT, USA) is mounted on the oil feed line. Signals from the load cells and displacement transducer are processed using a pc-based acquisition system (DS-NET with BR8 module, Dewesoft, Trbovlje, Slovenia) able to acquiring up to 10 ks s−1. See Pampuro et al. [11,23] and Cavallo and Pampuro [12] for more details of the equipment.
For this specific experiment a chamber with an internal diameter of 45 mm and a volume equal to 440 cm3 has been used while. The sampling rate was set at 1 ks s−1.
Specific software (Dewesoft 7.0, Trbovlje, Slovenia) was used to record data and for the post processing operations.

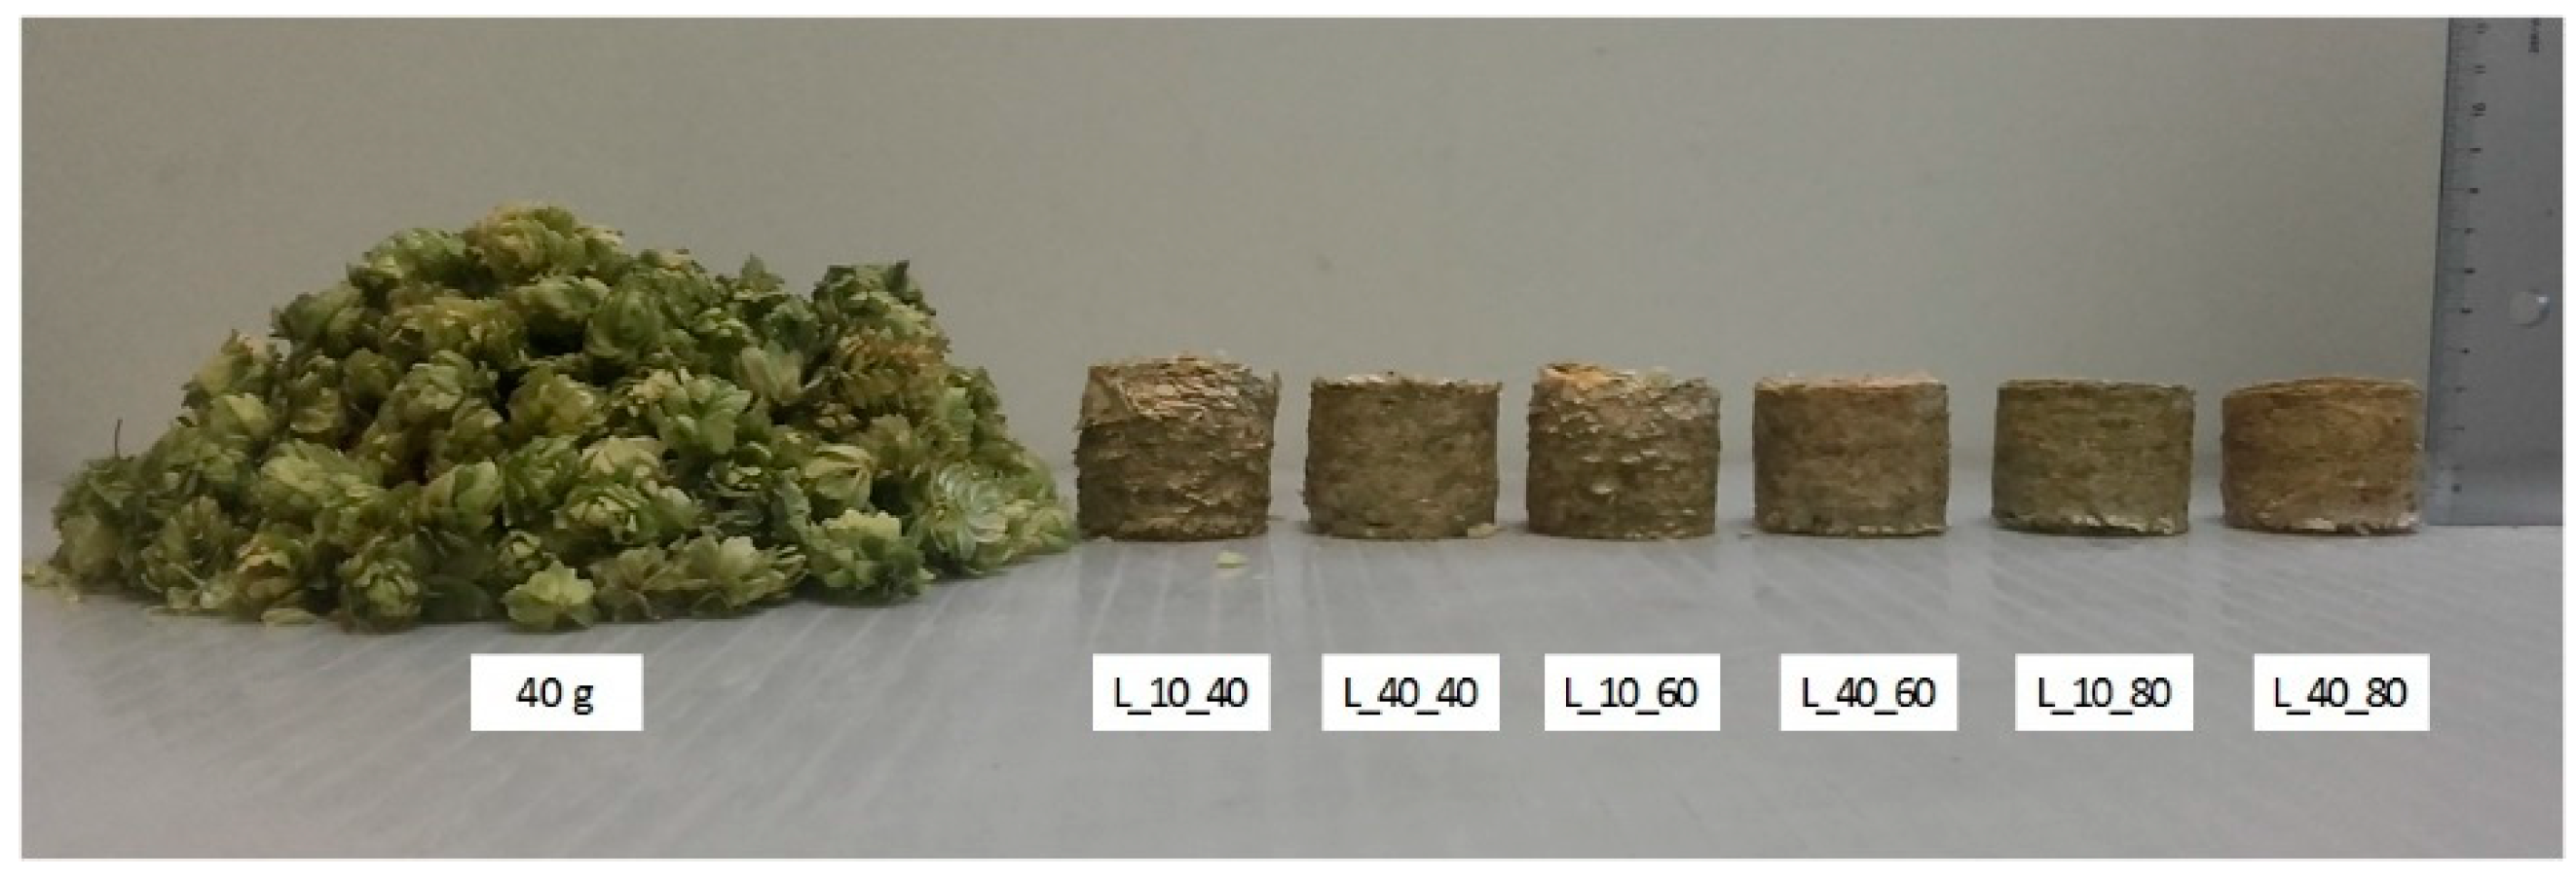
2.3. Compacts Production and Specific Compression Energy Calculation

Before performing compaction tests, to prevent hop cones degradation, their moisture content was reduced to 10% [7] by drying in an oven set to 60 °C [24]. The moisture content was selected after review literature that report 10% as the most appropriate moisture level to obtain high quality compacts from different biomass [9,10,11,25].
To form compacts, 40.0 ± 0.5 g of dried hop cones were used. Compaction tests were performed investigating three preset pressures, 40, 60 and 80 MPa corresponding to 63.1, 94.6 and 126.1 kN respectively, and two pressure application times, 10 and 40 s. The experiment was carried out without adding any binder or additive to the investigated material.
Compaction test included six treatments: hop cones compacts obtained by applying pressure of 40 MPa for 10 s [L_10_40]; hop cones compacts obtained by applying pressure of 40 MPa for 40 s [L_40_40]; hop cones compacts obtained by applying pressure of 60 MPa for 10 s [L_10_60]; hop cones compacts obtained by applying pressure of 60 MPa for 40 s [L_40_60]; hop cones compacts obtained by applying pressure of 80 MPa for 10 s [L_10_80]; hop cones compacts obtained by applying pressure of 80 MPa for 40 s [L_40_80]. For each combination of pressure and pressure application time, ten compacts were produced.
Figure 1 shows hop cones before and after compaction tests.
Treatment codes in the legend stands for hop cones compacts obtained by applying: pressure of 40 MPa for 10 s (L_10_40); pressure of 40 MPa for 40 s (L_40_40); pressure of 60 MPa for 10 s (L_10_60); pressure of 60 MPa for 40 s (L_40_60); pressure of 80 MPa for 10 s (L_10_80); pressure of 80 MPa for 40 s (L_40_80).
After compression, the base plate of the experimental press was removed and the upper plunger was used to eject the hop cones compact from the compression chamber. A digital caliber was used to measure length and diameter of each densified sample, while the mass of the compacts was determined by means of a digital balance (accuracy 0.01 g). The hop cones compact density (kg m−3) was calculated by ratio of mass to volume. According to Li and Liu [25], density was determined 2 min after sample ejection from the compression chamber.
Force-displacement data were recorded during the compaction test (Figure 2). To calculate the Specific Compression Energy (SCE) required for hop cones compaction, the methodology proposed by Pampuro et al. [11], Cavallo and Pampuro [12], Adapa et al. [26] and Mani et al. [27] was adopted. It consists in integrating the area under force-displacement curve; when combined with the compact mass, it yielded the specific energy value in kJ kg−1.
Treatment codes in the legend stand for hop cones compacts obtained by applying: pressure of 40 MPa for 10 s (L_10_40); pressure of 80 MPa for 10 s (L_10_80).

2.4. Compacts Durability

The ASABE Standard 269.4 [22] was adopted to determine the durability of the hop cones compacts. This Standard requires a rotating tool characterized by internal dimensions of 300 mm × 300 mm × 460 mm and external cover made of mesh (12.5 mm), with a horizontal axis of rotation.
According to the Standard, to determine the hop cones compacts durability, 10 samples were tumbled for 3 min at 40 rpm. When overturned, compacts are attritioned due to impacts among themselves and against the inner surface of the rotating device. After overturning, samples are sieved through a mesh of a diameter approaching 0.8 times the initial diameter of compacts. The durability, reported as percentage, has been calculated as the ratio between the weights of the samples after and before the tumbling operation, multiplied by 100. The durability values reported in this article are the mean of five measurements.

2.5. Statistical Analysis

SPSS software v.24 (IBM Corp. Armonk, NY, USA) was used to perform the analysis of variance (ANOVA) and post hoc analysis at 5% significance level. Post hoc analysis was conducted according to Duncan’s test method to determine the influence of pressure and pressure application time on density, durability and specific compression energy. To check the normality of data distribution and assumption of equal variance Shapiro-Wilk and Levene tests were used, respectively.

3. Results and Discussion

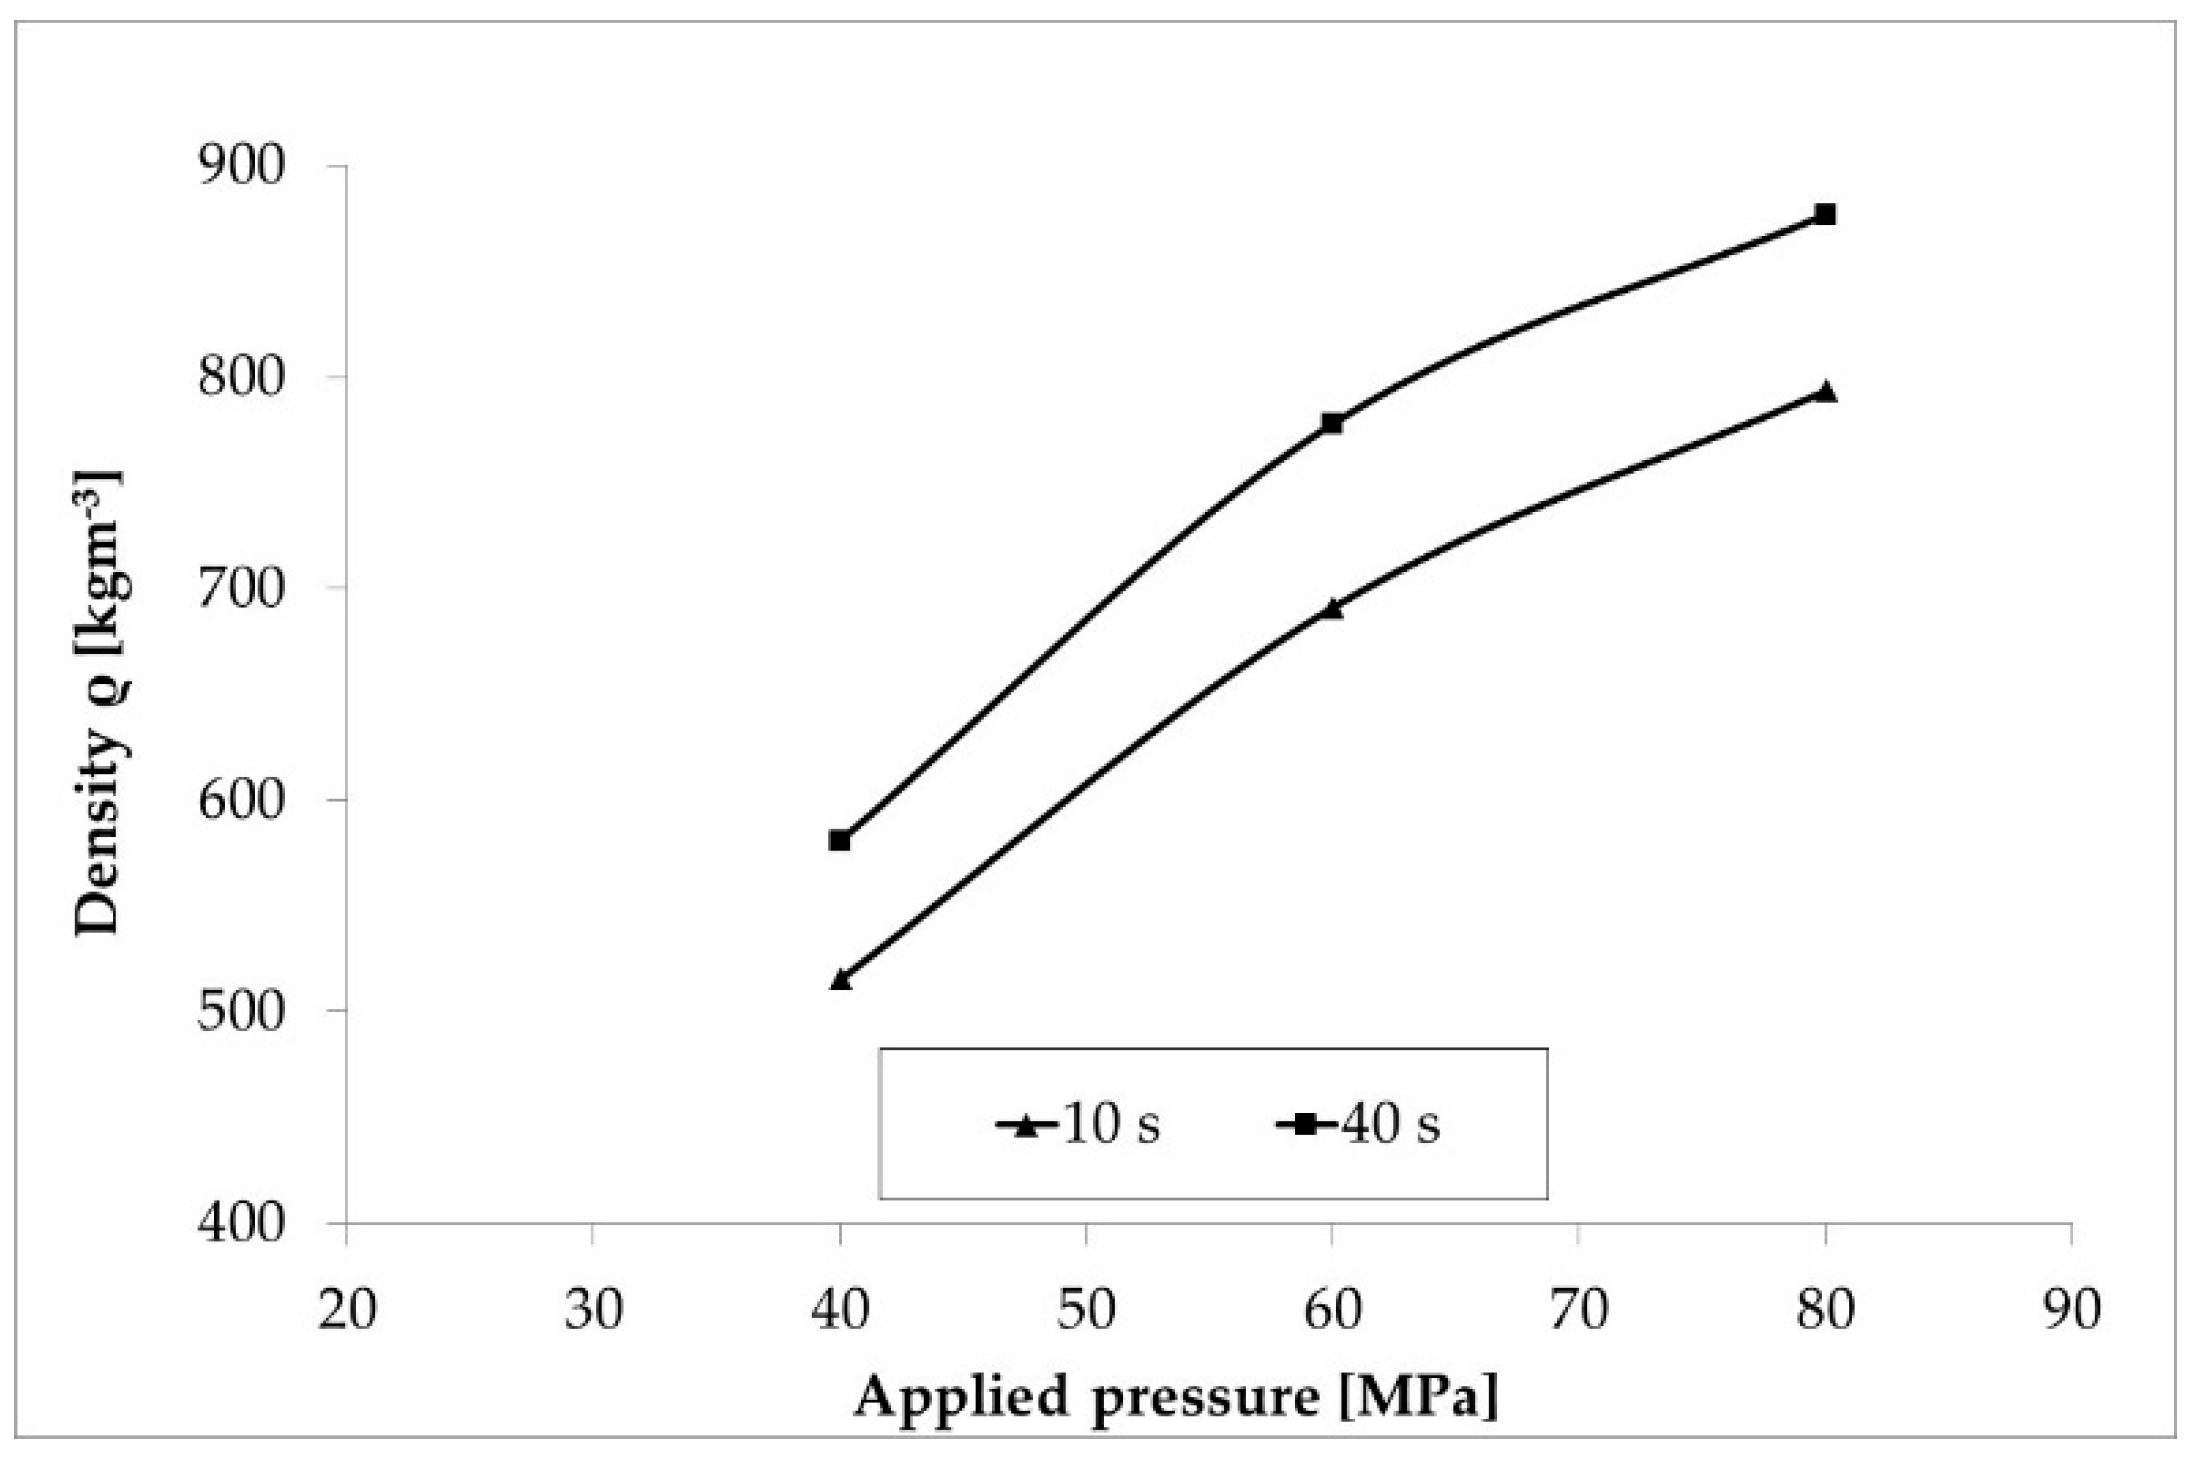
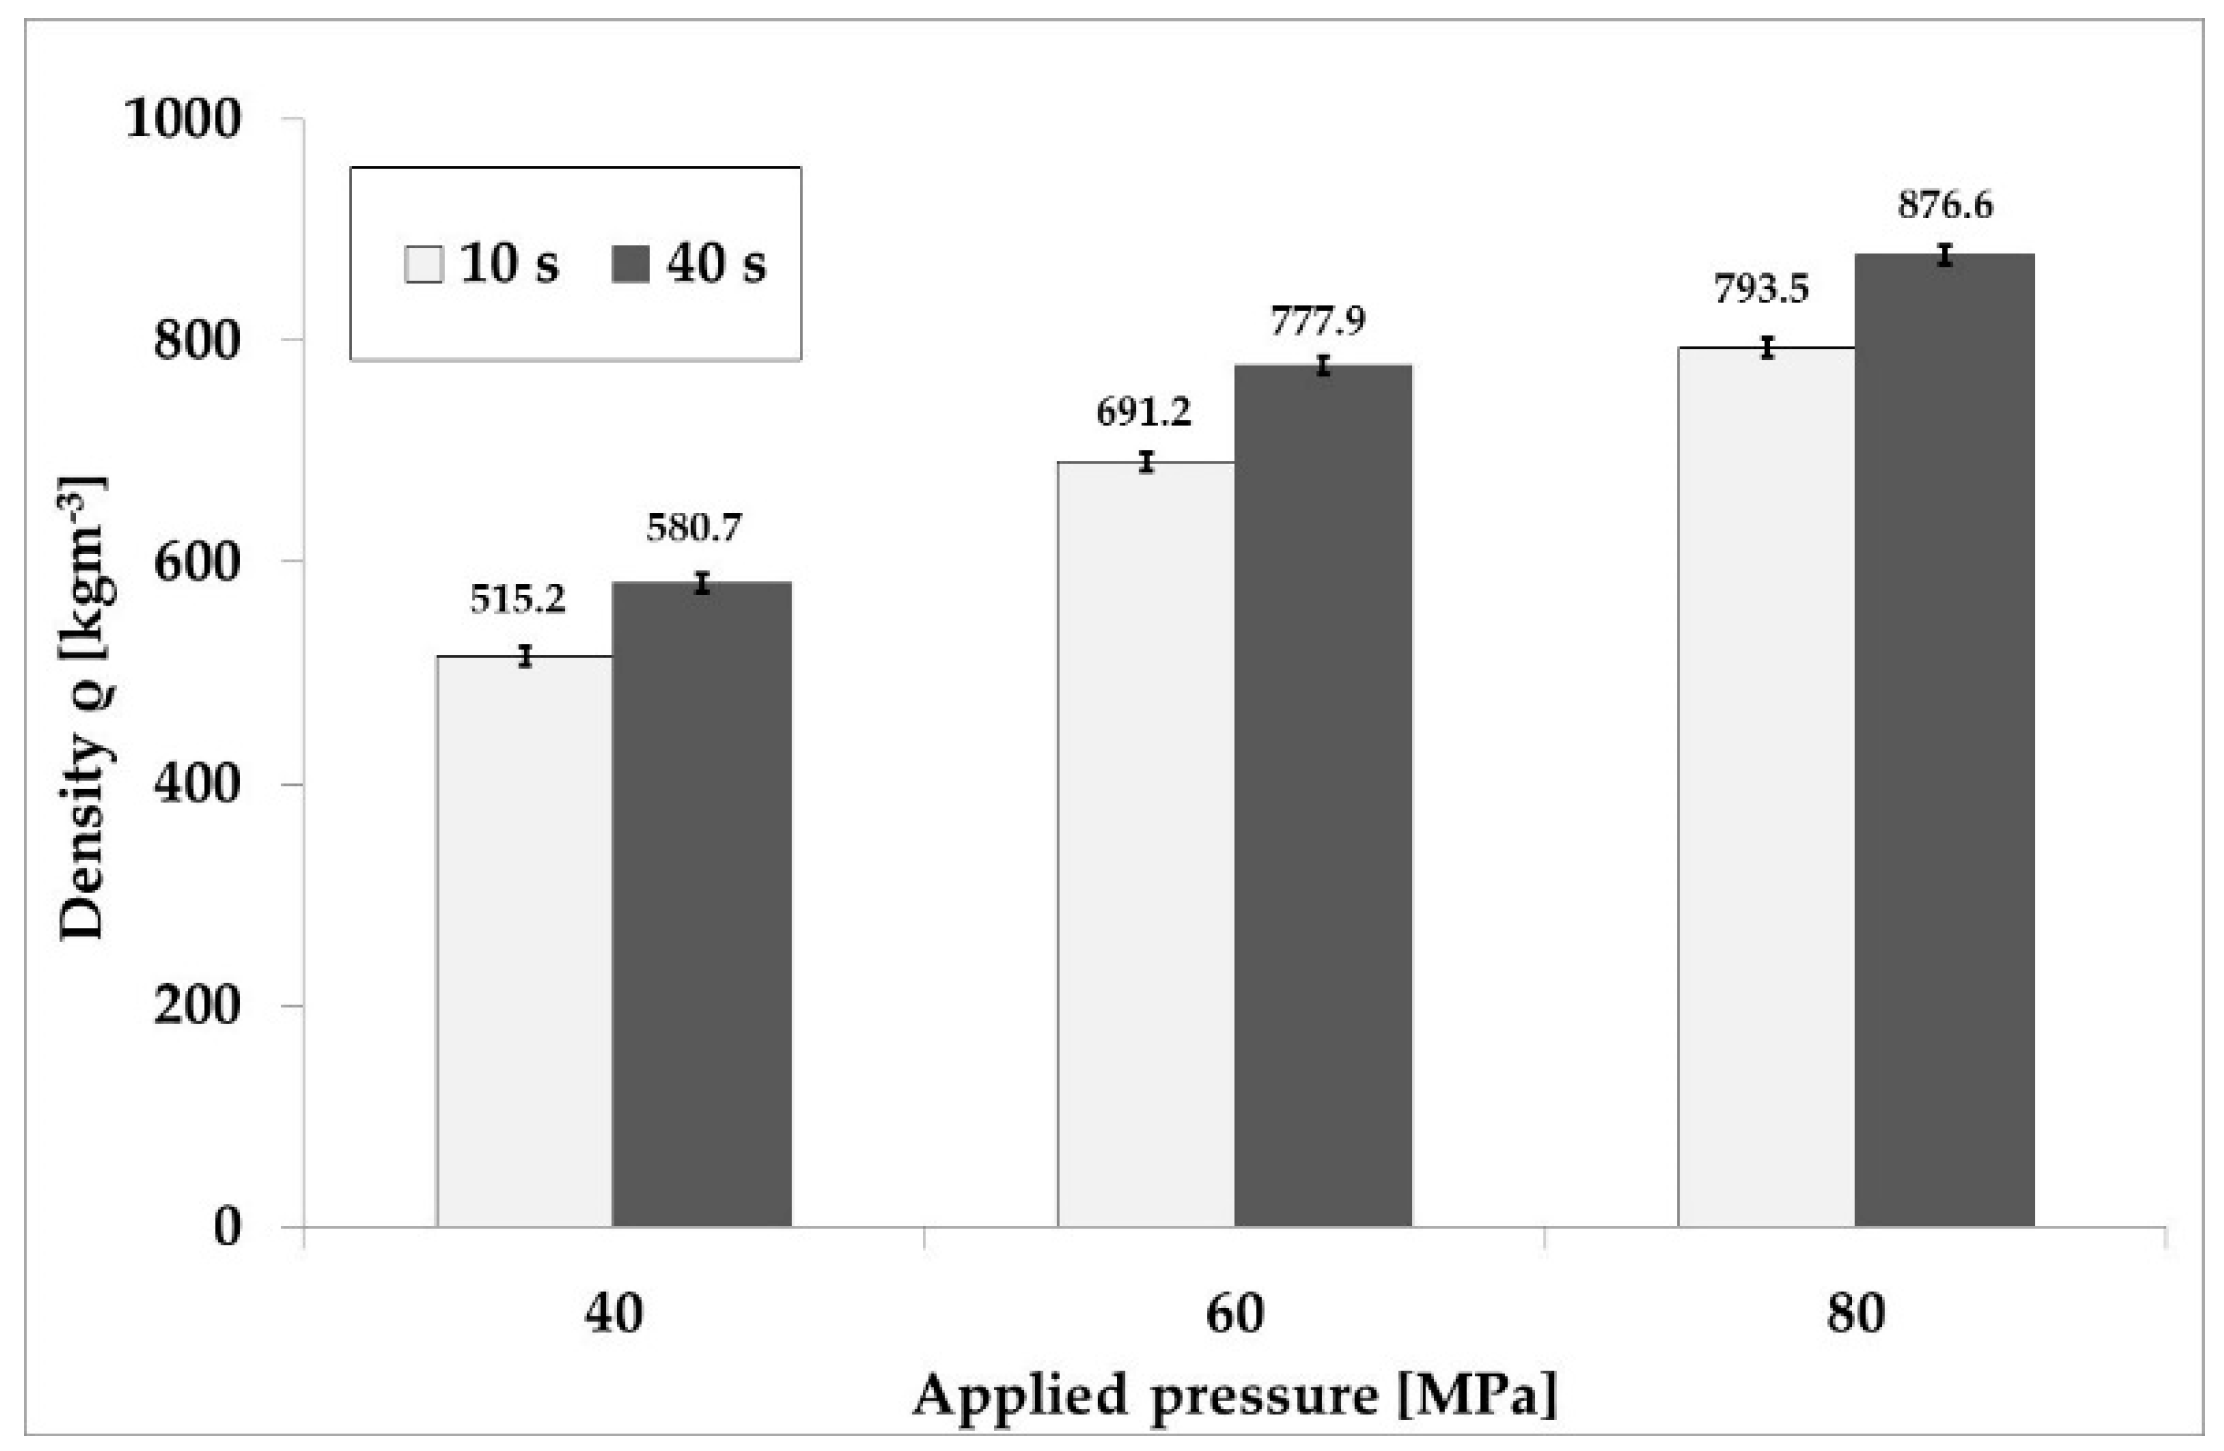
3.1. Compacts Density

As highlighted in many studies [19,23,28], compacts density plays a key role in determining handling and storage procedures to preserve their integrity.
Duncan’s test showed significant effect (p < 0.05) of compression pressure and pressure application time on compacts density. However, not significant interaction (p > 0.05) between the two above-mentioned parameters was detected.
Figure 3 shows the relationship between compression pressure and compacts density at different pressure application time (10 and 40 s). Results from the experiment (data not shown) highlighted that, when the applied pressure was lower than 40 MPa, hop cones could not be compacted. Beyond this pressure level, the compacts density ranged from 515.2 to 876.6 kg m−3 depending on the combination of compression pressure and pressure application time. More in detail, by applying compression pressure between 40 and 80 MPa, the mean density values of hop cones compacts increased significantly (p < 0.05) from 515.2 to 793.5 kg m−3 and from 580.7 to 876.6 kg m−3 for pressure application time equal to 10 s and 40 s, respectively.
For each compression pressure level applied, as shown in Figure 4, the higher compacts density values were obtained with pressure application time of 40 s.
Cavallo and Pampuro [12] investigating different woody biomass with about 10% of moisture content (wet mass basis) obtained by applying compression pressure between 20 and110 MPa compacts density values in line with those obtained in this study. Results of the experiment are slightly lower than those obtained by Kaliyan and Morey [29] for compacts made from corn cobs (1030.7–1112.1 kg m−3). Even if the moisture content of the investigated material was equal to those of this study (about 10% on wet mass basis), the higher pressure applied (150 MPa) significantly affected the final compacts density of corn cobs. Though Demibras [30] used higher pressure (200–800 MPa) for briquetting wheat straw and waste paper, the author reported compacts density values in the range of 90–350 kg m−3 and 200–400 kg m−3 for wheat straw and waste paper, respectively. We suspect that the lower density value obtained is related to the lower moisture content of the investigated feedstock (7% on wet mass basis).

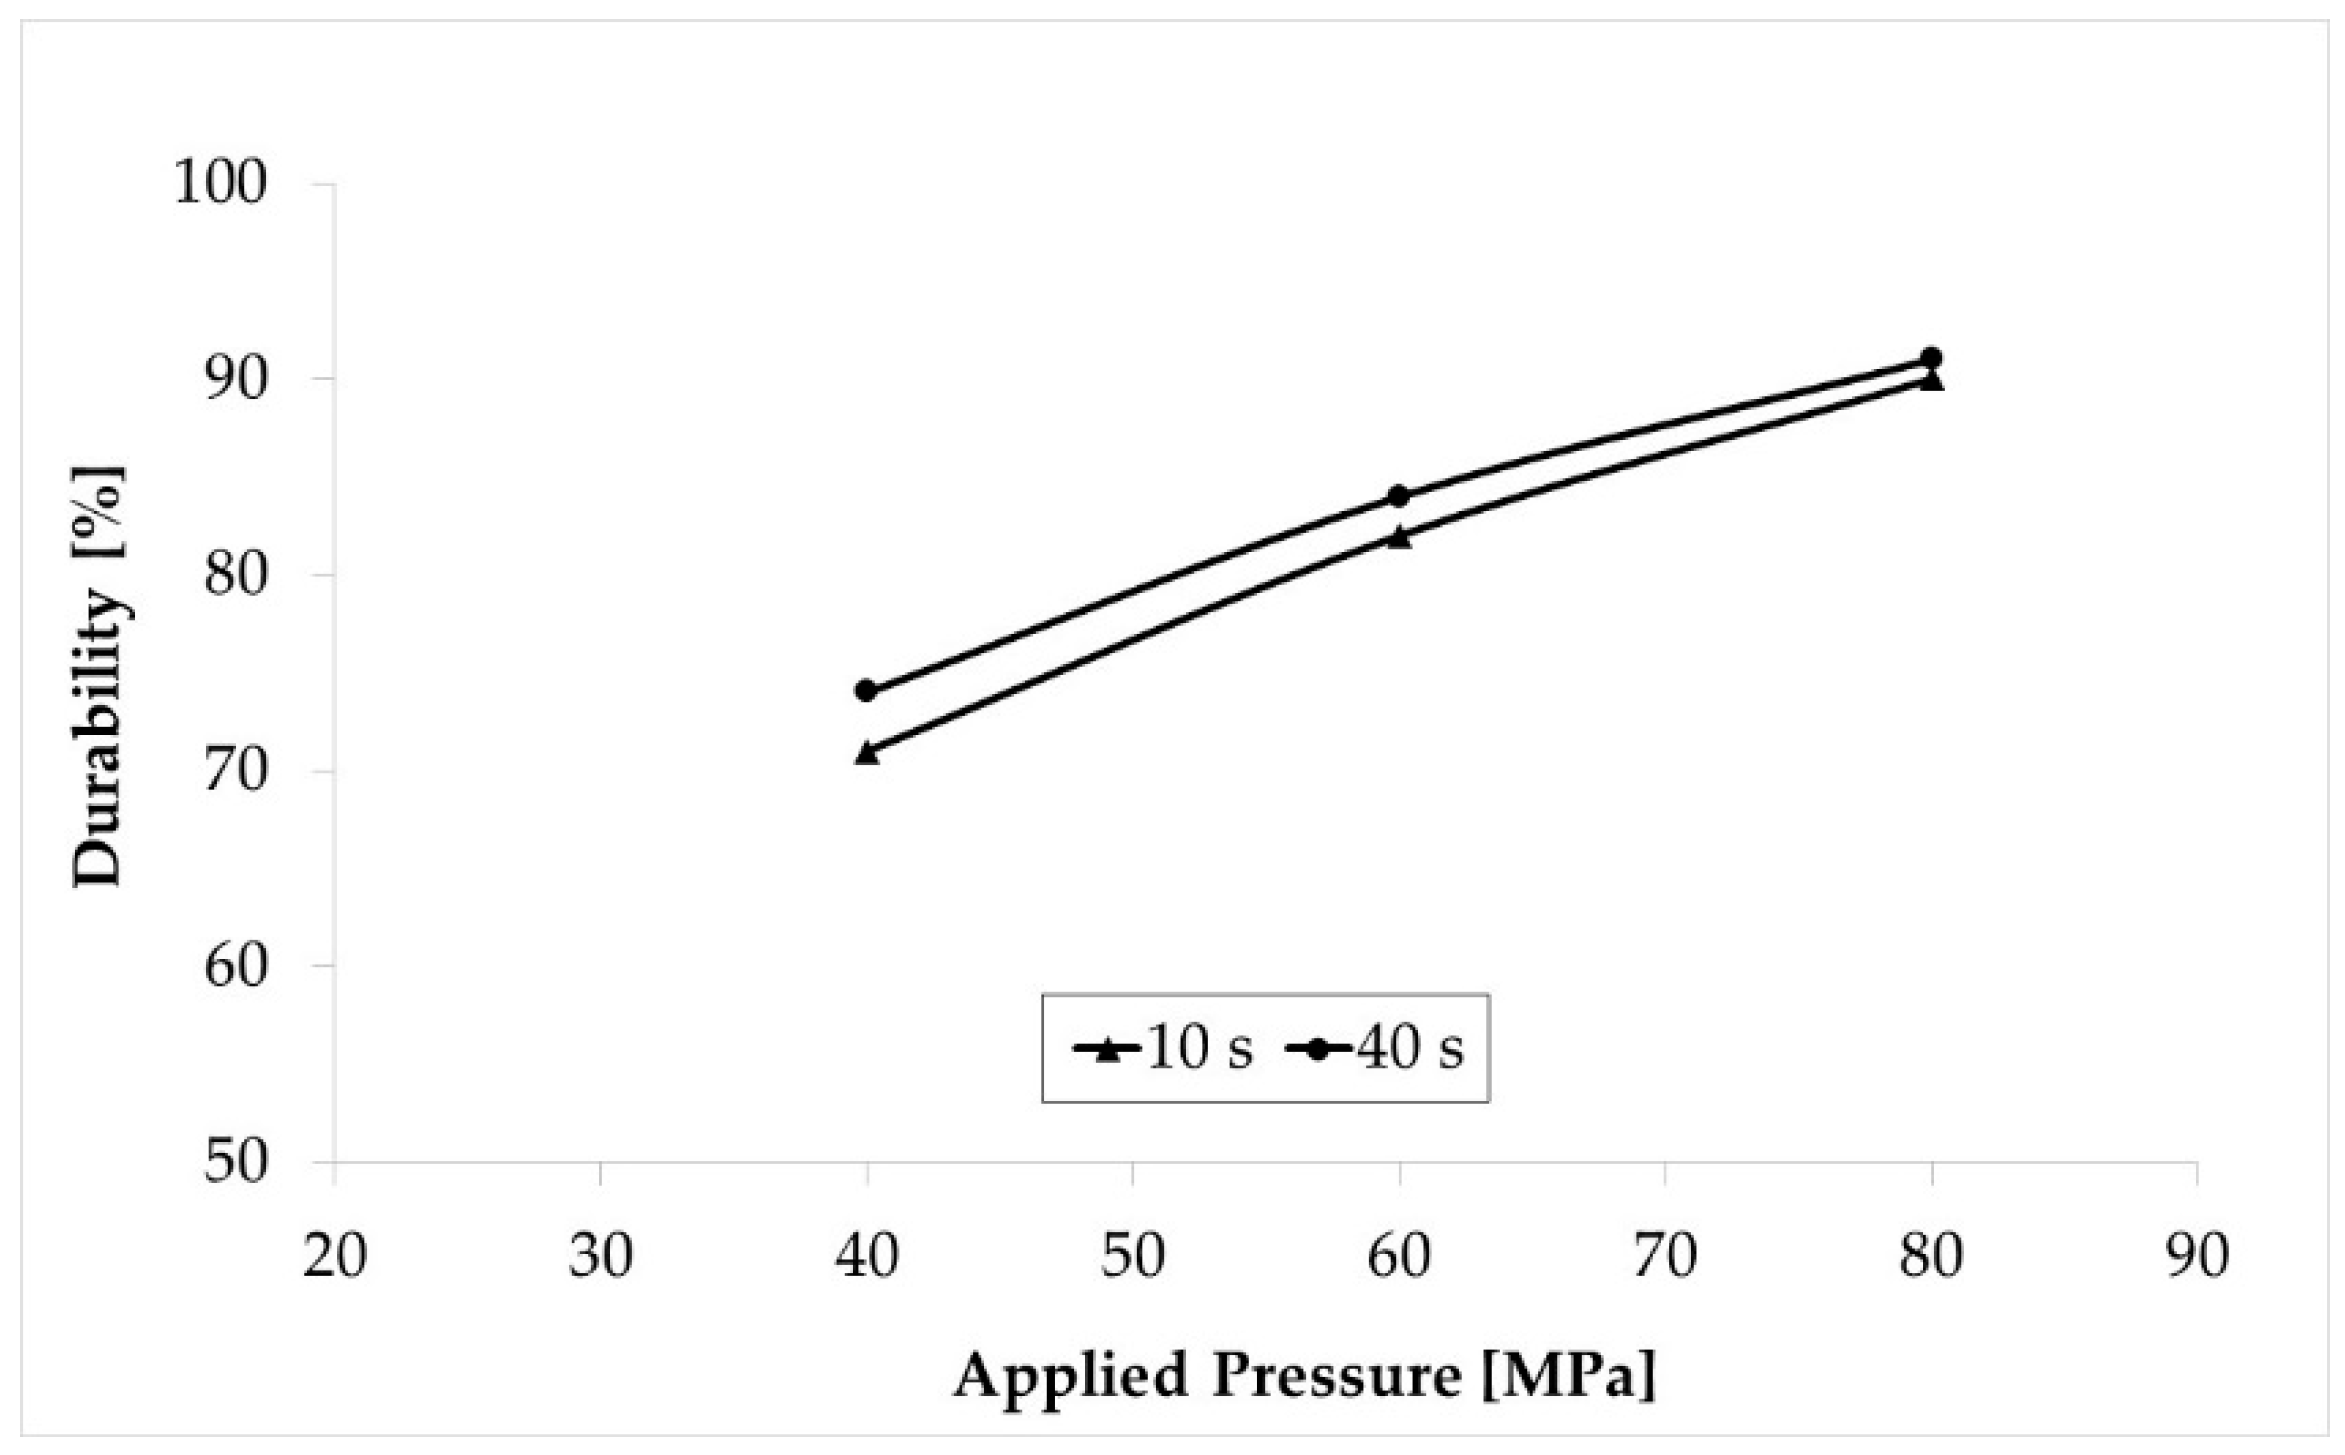
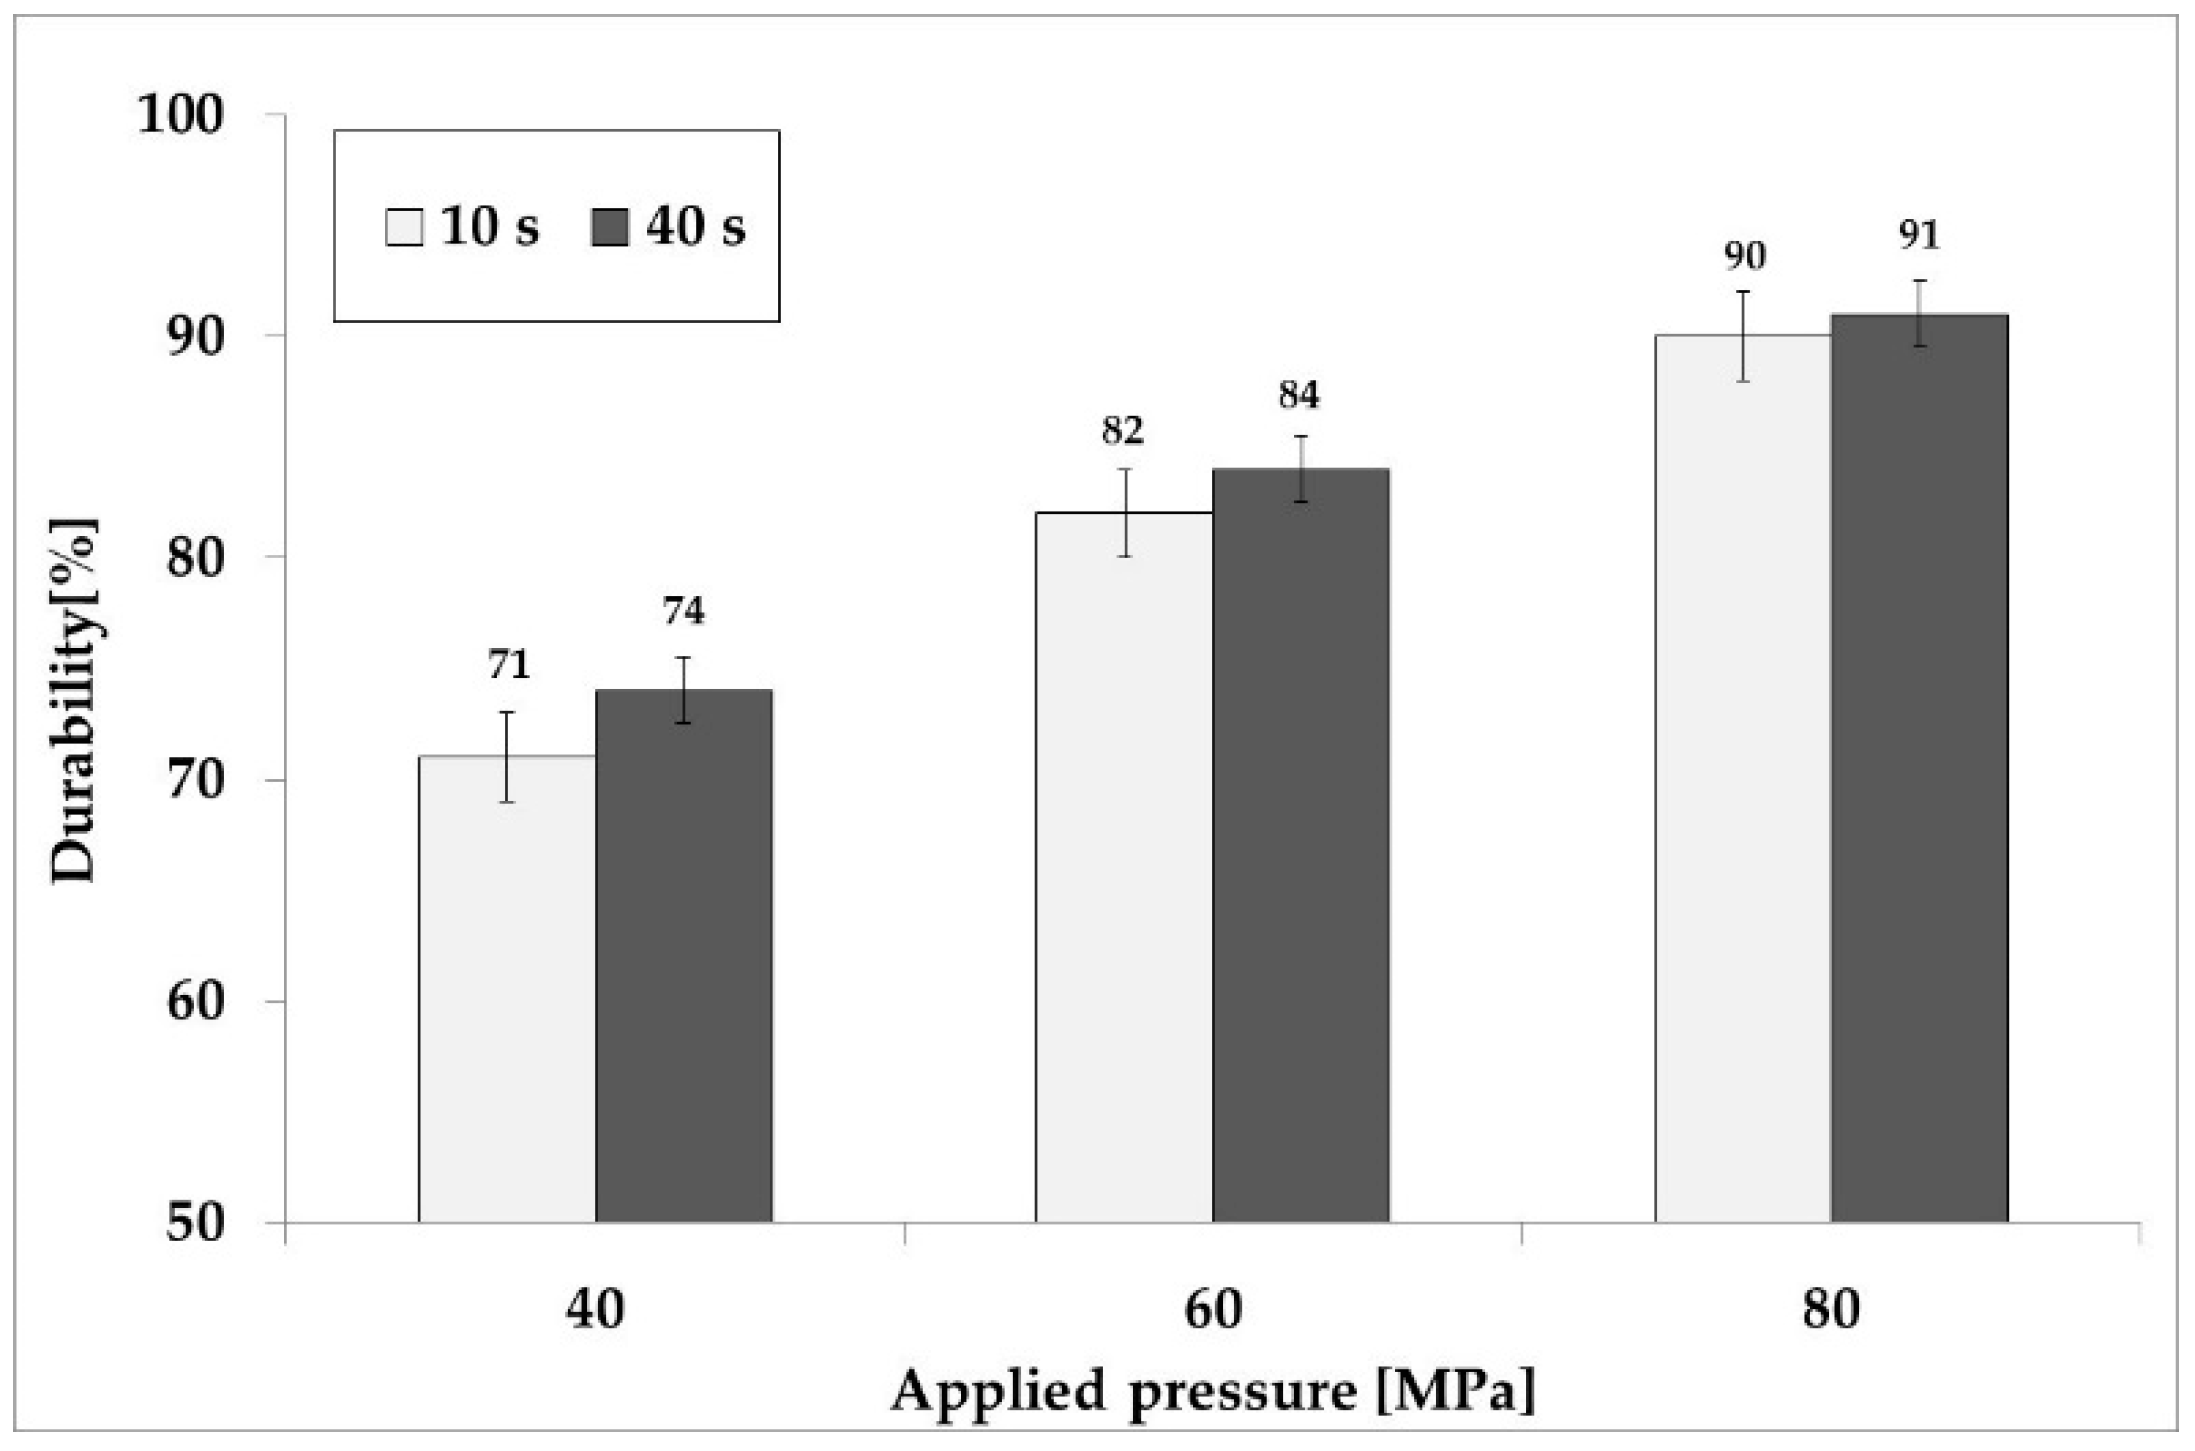
3.2. Compacts Durability

As highlighted by Tabil and Sokhansanj [18] and by Kaliyan and Vance Morey [9], durability indicates the ability of densified material to withstand shear and impact force during handling, storing and transportation. Many authors [12,18,19,23,31,32] considered durability value high when the value is higher than 80%, medium when the value is in the range 70–80%, and low when the value is lower than 70%. Low compacts durability is typically not appreciated as it can cause problems such as health hazard and inconvenient environment for the workers due to the production of fines during handling, transport and storage [33]. In this context, Ruiz Celma et al. [28] affirmed that the higher compacts durability the higher compacts quality.
Durability results obtained in this experiment are plotted in Figure 5 and Figure 6. More in detail, Figure 5 represents the relationship between applied compression pressure and compacts durability, while Figure 6 shows the average durability values obtained by compressing hop cones with three compression pressure levels (40, 60 and 80 MPa) and two pressure application times (10 and 40 s). For applied pressures of 40, 60 and 80 MPa, the mean durability values obtained were 71%, 82% and 90% considering pressure application time equal to 10 s and 74%, 84% and 91% for pressure application time equal to 40 s.
Kaliyan and Vance Morey [34] reported a comparable durability of 50–97% for corn stover briquettes obtained with a compression pressure in the range of 100–150 MPa.
Duncan’s test highlighted a significant effect (p < 0.05) of compression pressure on compacts durability, while this compact property is not affected by pressure application time. This result is in accordance with the study conducted by Adapa et al. [10] in which they highlighted that applied pressure had a significant effect on compacts durability. Similarly, Kaliyan and Vance Morey [34] indicated that compression pressure significantly affects the durability of corn stover or switchgrass briquettes.

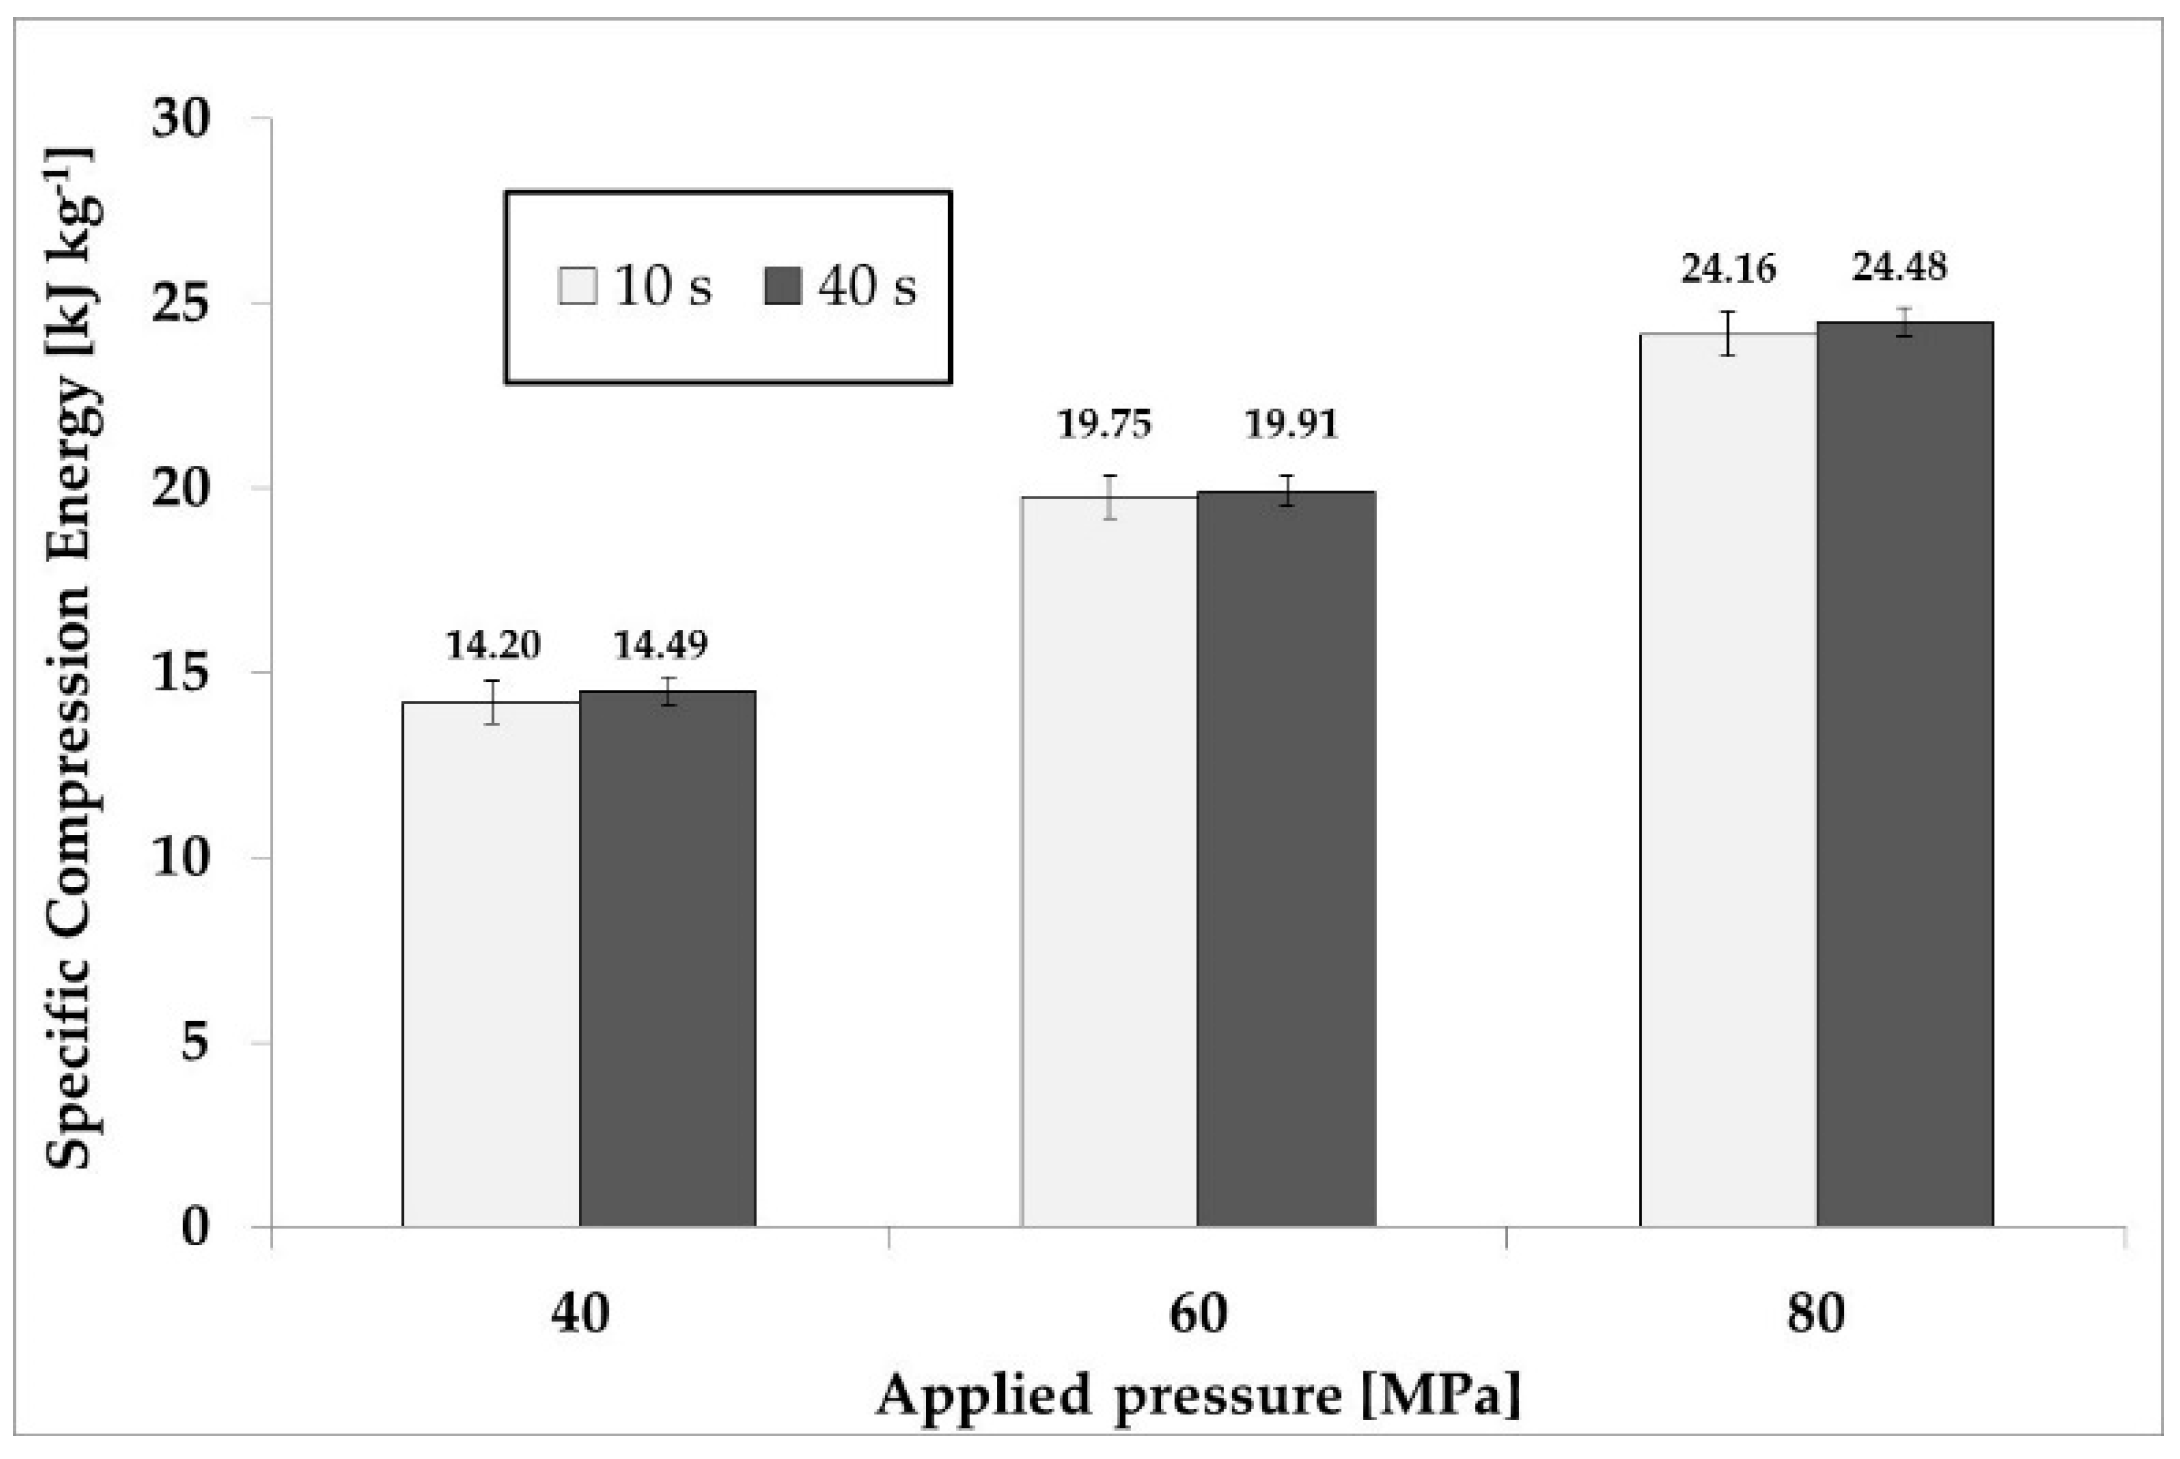
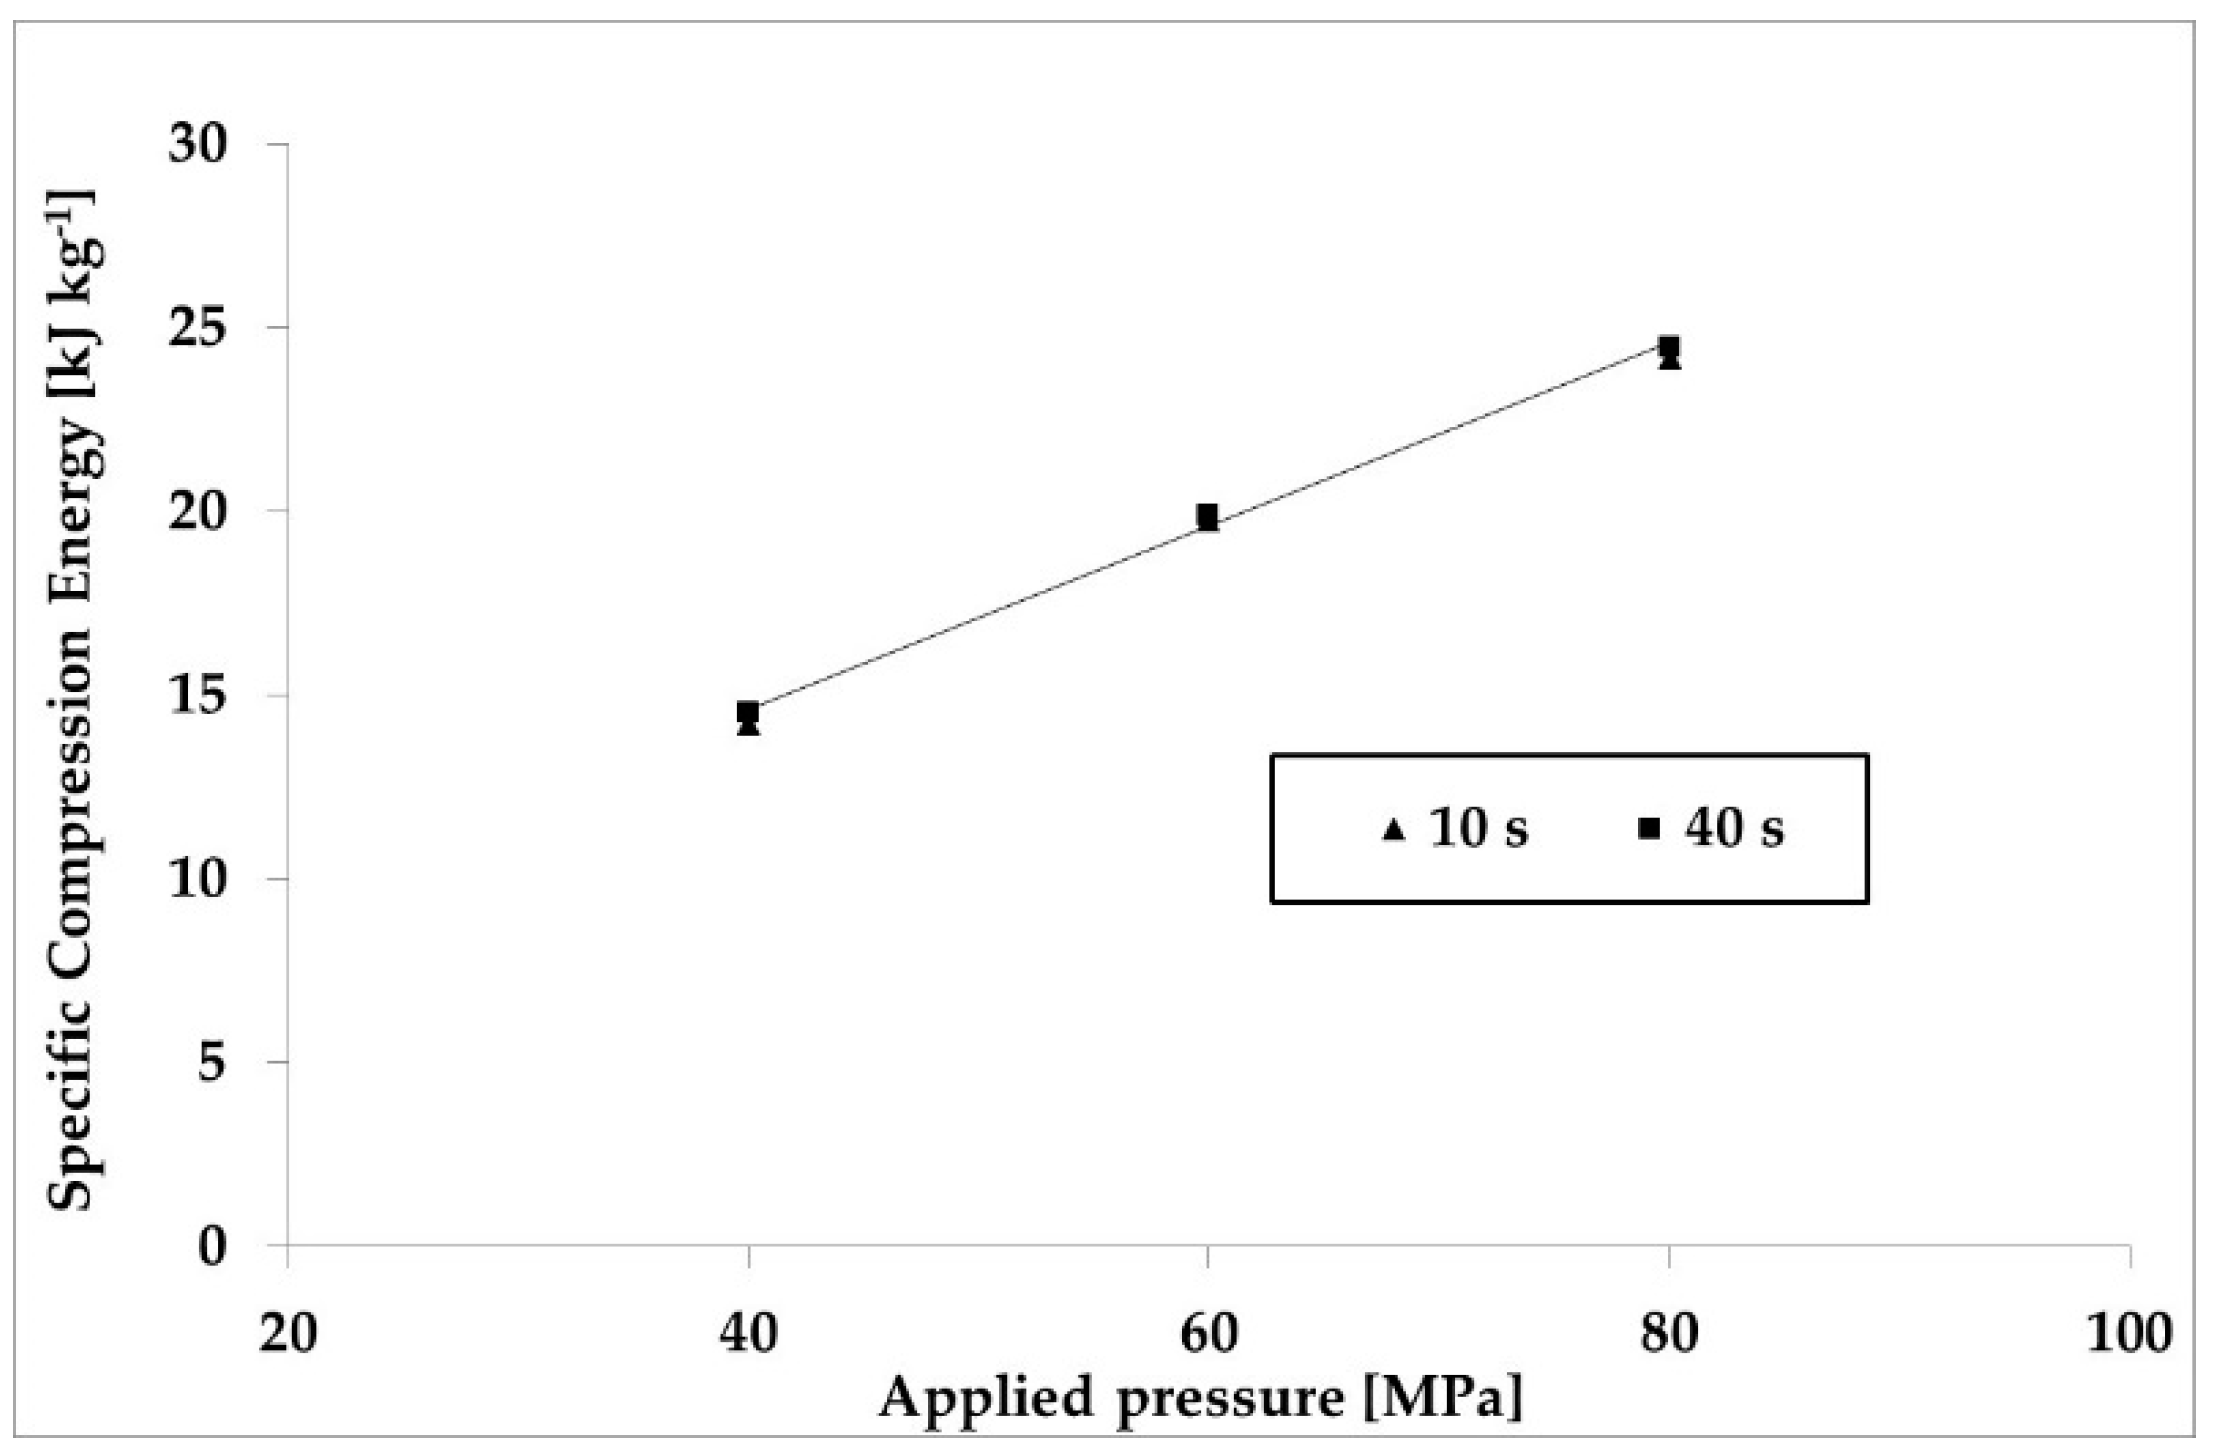
3.3. Specific Compression Energy—SCE

In this study, no significant effect (p > 0.05) of pressure application time on SCE required for hop compacts production was found (according to the Duncan’s test) This result is in line with the studies conducted by Pampuro et al. [11] and by Cavallo and Pampuro [12] focused on compaction of composted pig slurry solid fraction and different woody biomasses, respectively.
Figure 7 shows the average specific compression energy values required for compressing hop cones with three compression pressure levels (40, 60 and 80 MPa) and two pressure application times (10 and 40 s), while Figure 8 represents the relationship between applied compression pressure and specific compression energy.
As reported by Adapa et al. [10] in their investigation, the results obtained in this study highlighted that the SCE significantly (p < 0.05) increased when the pressure rises from 40 to 80 MPa. More in detail, to produce compacts made from hop cones, the average specific compression energy absorption increased from 14.20 to 24.48 kJ kg−1 (Figure 7).
As affirmed by Mani et al. [35], the energy requirements is strongly related not only to the applied pressure and moisture content, but also to the physical properties of the investigated material and to the densification technology. Mani et al. [27], in their investigation focused on compression of 10% moisture wheat straw using a 30 mm die diameter and a compression pressure in the range 5–15 MPa, found specific compression energy values lower than those obtained in this study. The main reason for the difference is that the applied pressure adopted by Mani et al. [27] was much lower than the pressure levels applied for the compression of the hop cones. To compact oilseed rape straw under the same experimental conditions described in this study—moisture content of 10% and applied pressure of about 50 MPa, Santamarta et al. [36] calculated SCE values higher than those needed to compact hop cones, probably because of the different characteristics of the bulk materials investigated.

4. Conclusions

With the aim to obtain knowledge about the densification process of hop cones, a series of compaction tests were carried out, considering three compression pressure levels (40, 60 and 80 MPa) and two pressure application time (10 and 40 s) by means of prototype hydraulic press.
The results obtained highlighted that compression pressure—in the range of 40–80 MPa—significantly affects the specific compression energy requirements, the final density and the durability of the produced compacts. According to results from the experimentation the pressure application time play a key role in determining compacts density, while did not affect durability and compression energy requirements.
The specific compression energy values calculated on dried hops cones compaction varies between 14.20 to 24.48 kJ kg−1, lower than that required for the pelletizing process, where the specific energy values ranges between 19 and 90 kJ kg−1. According to these values, the adoption of compaction process can contribute to reduce the energy input in the brewing industry without compromising the logistic and storage features it requires.

Author Contributions

N.P. and E.C. conceived and designed the experiments; N.P. performed the experiment; N.P. and P.B. analyzed the data; N.P., P.B. and E.C. wrote the paper.

Funding

This research received no external funding.

Conflicts of Interest

The authors declare no conflict of interest.

References

  1. Maietti, A.; Brighenti, V.; Bonetti, G.; Tedeschi, P.; Principe, P.F.; Benvenuti, S.; Brandolini, V.; Pellati, F. Metabolite profiling of flavonols and in vitro antioxidant activity of young shoots of wild Humulus lupulus L. (hop). J. Pharm. Biomed. Anal. 2017, 142, 28–34. [Google Scholar] [CrossRef] [PubMed]
  2. Food and Agriculture Organization of the United Nations—FAOSTAT. Available online: http://faostat.fao.org (accessed on 15 June 2018).
  3. European Commission: Agriculture. 2017. Hops. Available online: https://ec.europa.eu/agriculture/hops_en (accessed on 20 December 2017).
  4. Sakamoto, K.; Konings, W.N. Beer spoilage bacteria and hop resistance. Int. J. Food Microbiol. 2003, 89, 105–124. [Google Scholar] [CrossRef]
  5. Schnaitter, M.; Wimmer, A.; Kollmannsberger, H.; Gastl, M.; Becker, T. Influence of hop harvest date of the ‘Mandarina Bavaria’ hop variety on the sensory evaluation of dry-hopped top-fermented beer. J. Inst. Brew. 2016, 122, 661–669. [Google Scholar] [CrossRef]
  6. Kopp, P.A. Hoptopia: A World of Agriculture and Beer in Oregon’s Willamette Valley; University of California Press: Oakland, CA, USA, 2016; 306p, ISBN 978-0-520-27748-9. [Google Scholar]
  7. Krofta, K.; Mikyska, A.; Haskova, D. Changes in antioxidative properties of hops in the course of drying, milling, palletization and storage. Kvasny Prumysl 2007, 53, 266–272. [Google Scholar] [CrossRef]
  8. Kumhala, F.; Blahovec, J. Bulk properties of densified hop cones related to storage and throughput measurements. Biosyst. Eng. 2014, 126, 123–128. [Google Scholar] [CrossRef]
  9. Obernberger, I.; Thek, G. Physical characterization and chemical composition of densified biomass fuels with regard to their combustion behavior. Biomass Bioenergy 2004, 27, 653–669. [Google Scholar] [CrossRef]
  10. Adapa, P.; Tabil, L.; Schoenau, G. Compaction characteristics of barley, canola, oat and wheat straw. Biosyst. Eng. 2009, 204, 335–344. [Google Scholar] [CrossRef]
  11. Pampuro, N.; Facello, A.; Cavallo, E. Pressure and specific energy requirements for densification of compost derived from swine solid fraction. Span. J. Agric. Res. 2013, 11, 678–684. [Google Scholar] [CrossRef]
  12. Cavallo, E.; Pampuro, N. Effects of compressing pressure on briquettes made from woody biomass. Chem. Eng. Trans. 2017, 58, 517–522. [Google Scholar]
  13. Kaliyan, N.; Vance Morey, R. Factors affecting strength and durability of densified biomass products. Biomass Bioenergy 2009, 33, 337–359. [Google Scholar] [CrossRef]
  14. Mikyska, A.; Krofta, K.; Haskova, D.; Culik, J.; Cejka, P. Impact of hop pellets storage on beer quality. Kvasny Prumysl 2012, 58, 148–154. [Google Scholar] [CrossRef]
  15. Lisowski, A.; Dabrowska-Salin, M.; Ostrowska-Ligeza, E.; Nawrocka, A.; Stasiak, M.; Swietochowski, A.; Klonowski, J.; Sypula, M.; Lisowska, B. Effects of the biomass moisture content and pelleting temperature on the pressure-induced agglomeration process. Biomass Bioenergy 2017, 107, 376–383. [Google Scholar] [CrossRef]
  16. Battacharya, S.C.; Sett, S.; Shrestha, R.M. State of the art for biomass densification. Energy Source 1989, 11, 161–182. [Google Scholar] [CrossRef]
  17. Tumuluru, J.S.; Wright, C.T.; Hess, J.R.; Kenney, K.L. A review of biomass densification systems to develop uniform feedstock commodities for bioenergy application. Biofuels Bioprod. Biorefin. 2011, 5, 683–707. [Google Scholar] [CrossRef] [Green Version]
  18. Tabil, L.G.; Sokhansanj, S. Process conditions affecting the physical quality of alfalfa pellets. Appl. Eng. Agric. 1996, 12, 345–350. [Google Scholar] [CrossRef]
  19. Pampuro, N.; Bagagiolo, G.; Priarone, P.C.; Cavallo, E. Effects of pelletizing pressure and the addition of woody bulking agents on the physical and mechanical properties of pellets made from composted pig solid fraction. Powder Technol. 2017, 311, 112–119. [Google Scholar] [CrossRef]
  20. Carone, M.T.; Pantaleo, A.; Pellerano, A. Influence of process parameters and biomass characteristics on the durability of pellets from the pruning residues of Olea europea L. Biomass Bioenergy 2011, 35, 402–410. [Google Scholar] [CrossRef]
  21. American Society of Agricultural and Biological Engineers (ASABE). ASAE S358.2—Moisture Measurement—Forages. In American Society of Agricultural and Biological Engineers Standards; ASABE: St. Joseph, MI, USA, 2006; p. 608. [Google Scholar]
  22. American Society of Agricultural and Biological Engineers (ASABE). ASAE S269.4—Cubes, pellets and crumbles—Definitions and methods for determining density, durability and moisture content. In American Society of Agricultural and Biological Engineers Standards; ASABE: St. Joseph, MI, USA, 2007; pp. 624–626. [Google Scholar]
  23. Pampuro, N.; Preti, C.; Cavallo, E. Recycling pig slurry solid fraction as a sound absorber. Sustainability 2018, 10, 277. [Google Scholar] [CrossRef]
  24. Thoreson, C.P.; Webster, K.E.; Darr, M.J.; Kapler, E.J. Investigation of process variables in the densification of corn stover briquettes. Energies 2014, 7, 4019–4032. [Google Scholar] [CrossRef]
  25. Li, Y.; Liu, H. High-pressure densification of wood residues to form an upgraded fuel. Biomass Bioenergy 2000, 19, 177–186. [Google Scholar] [CrossRef]
  26. Adapa, P.K.; Schoenau, G.J.; Tabil, L.G.; Sokhansanj, S.; Singh, A. Compression of fractionated sun-cured and dehydrated alfalfa chops into cubes—Specific energy models. Bioresour. Technol. 2007, 98, 38–45. [Google Scholar] [CrossRef] [PubMed]
  27. Mani, S.; Tabil, L.G.; Sokhansanj, S. Specific energy requirement for compacting corn stover. Bioresour. Technol. 2006, 97, 1420–1426. [Google Scholar] [CrossRef] [PubMed]
  28. Ruiz Celma, A.; Cuadros, F.; Lopez-Rodriguez, F. Characterization of pellets from industrial tomato residues. Food Bioprod. Process. 2012, 90, 700–706. [Google Scholar] [CrossRef]
  29. Kaliyan, N.; Vance Morey, R. Densification characteristics of corn cobs. Fuel Process. Technol. 2010, 91, 559–565. [Google Scholar] [CrossRef]
  30. Demibras, A. Physical properties of briquettes from waste paper and wheat straw mixtures. Energy Convers. Manag. 1999, 40, 437–445. [Google Scholar]
  31. Theerarattananoon, K.; Xu, F.; Wilson, J.; Ballard, R.; Mckinney, L.; Staggenborg, S.; Vadlani, P.; Pei, Z.J.; Wang, D. Physical properties of pellets made from sorghum stalk, corn stover, wheat straw, and big bluestem. Ind. Crops Prod. 2011, 33, 325–332. [Google Scholar] [CrossRef]
  32. Colley, Z.; Fasina, O.O.; Bransby, D.; Lee, Y.Y. Moisture effect on the physical characteristics of switchgrass pellets. Trans. ASAE 2006, 49, 1845–1851. [Google Scholar] [CrossRef]
  33. Karunanithy, C.; Wang, Y.; Muthukumarappan, K.; Pugalendhi, S. Physiochemical Characterization of briquettes made from different feedstocks. Biotechnol. Res. Int. 2012, 2012, 1–12. [Google Scholar] [CrossRef] [PubMed]
  34. Kaliyan, N.; Vance Morey, R. Densification characteristics of corn stover and switchgrass. Trans. ASABE 2009, 52, 907–920. [Google Scholar] [CrossRef]
  35. Mani, S.; Tabil, L.G.; Sokhansanj, S. Evaluation of compaction equations applied to four biomass species. Can. Biosyst. Eng. 2004, 46, 351–361. [Google Scholar]
  36. Santamarta, L.C.; Ramirez, A.D.; Godwin, R.J.; White, D.R.; Chaney, K.; Humphries, A.C. Energy use and carbon dioxide emissions associated with the compression of oilseed rape straw. In Proceedings of the International Conference of Agricultural Engineering-CIGR-AgEng 2012: Agriculture and Engineering for a Healthier Life, Valencia, Spain, 8–12 July 2012. [Google Scholar]
Figure 1. Bulking hop cones and compacts obtained during the experiment.
Energies 11 02389 g001
Figure 2. Force-displacement plots recorded during the compression test.
Energies 11 02389 g002
Figure 3. Relationship between hop cones compacts density (kg m−3) and compression pressure (MPa) at different pressure application times (10 and 40 s).
Energies 11 02389 g003
Figure 4. Average compacts density values (kg m−3) obtained by compressing hop cones with three compression pressure levels (40, 60 and 80 MPa) and two pressure application times (10 and 40 s). Error bars indicate standard error (n = 5).
Energies 11 02389 g004
Figure 5. Relationship between hop cones compacts durability (%) and compression pressure (MPa) at different pressure application times (10 and 40 s).
Energies 11 02389 g005
Figure 6. Average compacts durability values (%) obtained by compressing hop cones with three compression pressure levels (40, 60 and 80 MPa) and two pressure application times (10 and 40 s). Error bars indicate standard error (n = 5).
Energies 11 02389 g006
Figure 7. Mean specific compression energy values (kJ kg−1) required for compressing hop cones with three compression pressure levels (40, 60 and 80 MPa) and two pressure application times (10 and 40 s). Error bars indicate standard error (n = 5).
Energies 11 02389 g007
Figure 8. Relationship between applied pressure in the range 40–80 MPa and specific compression energy (kJ kg−1) obtained during compression test at different pressure application times (10 and 40 s).
Energies 11 02389 g008

