Physical and Mathematical Modeling of a Wave Energy Converter Equipped with a Negative Spring Mechanism for Phase Control


Abstract
:1. Introduction
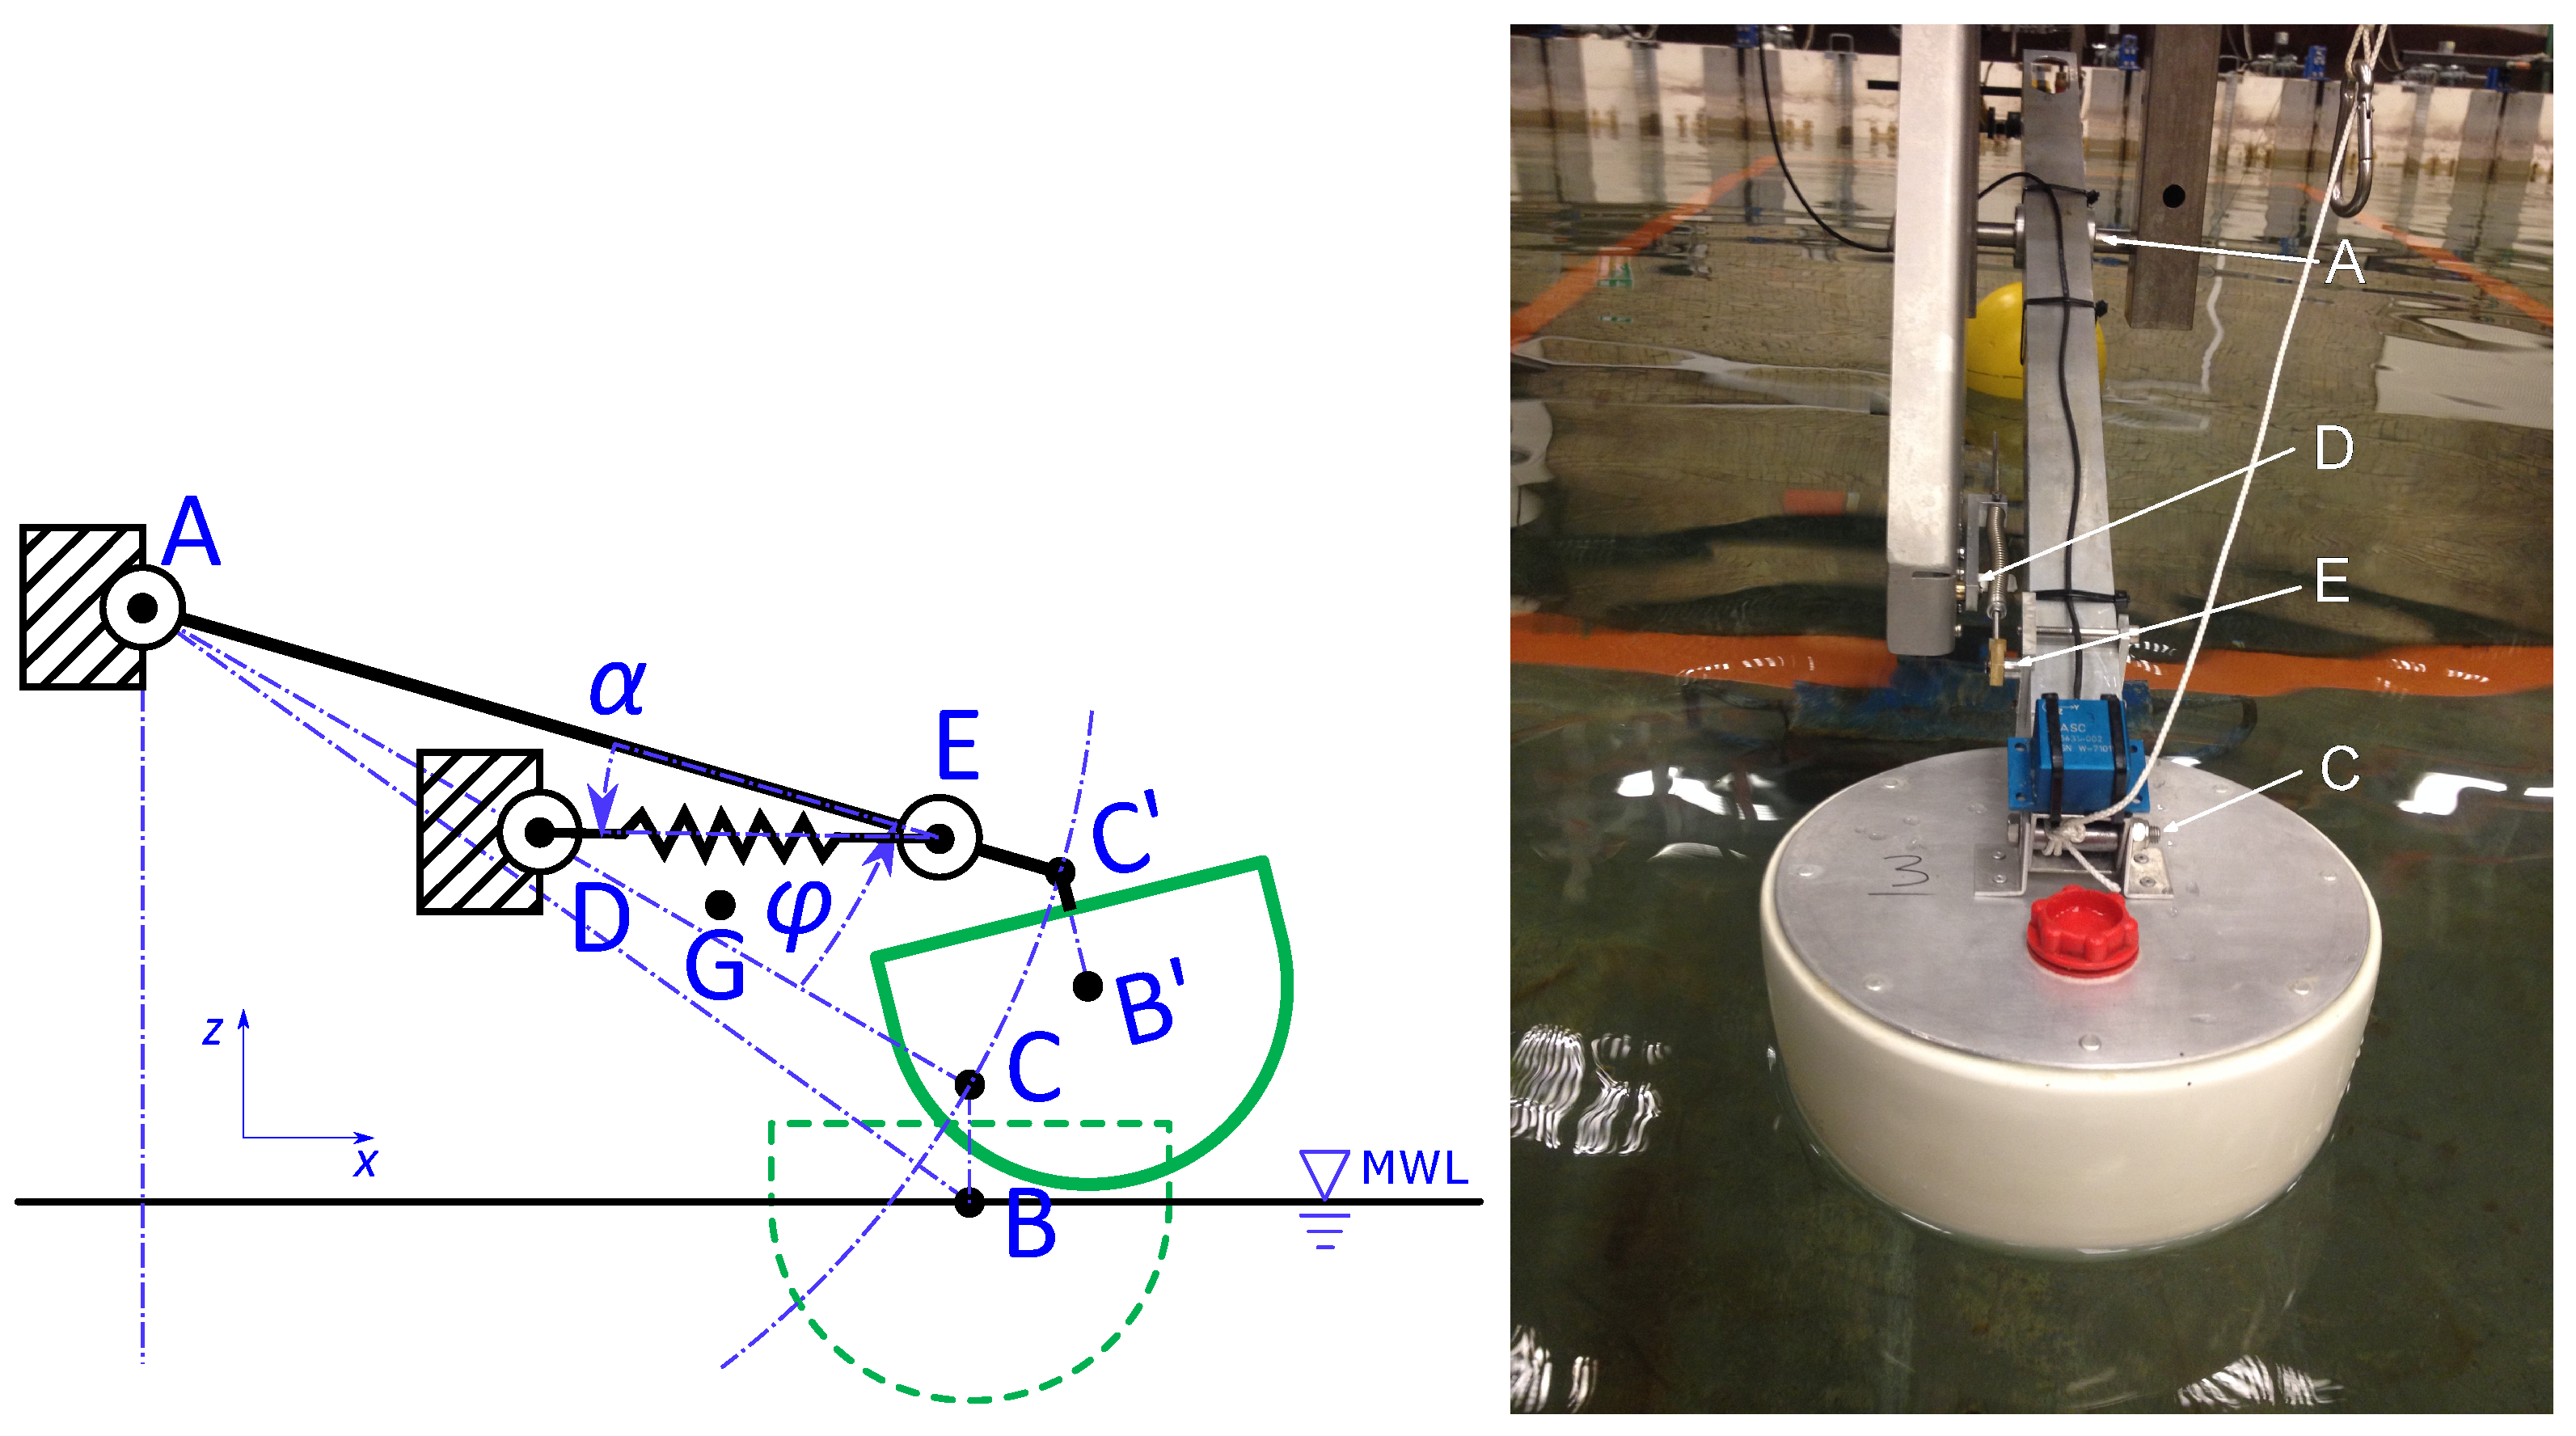
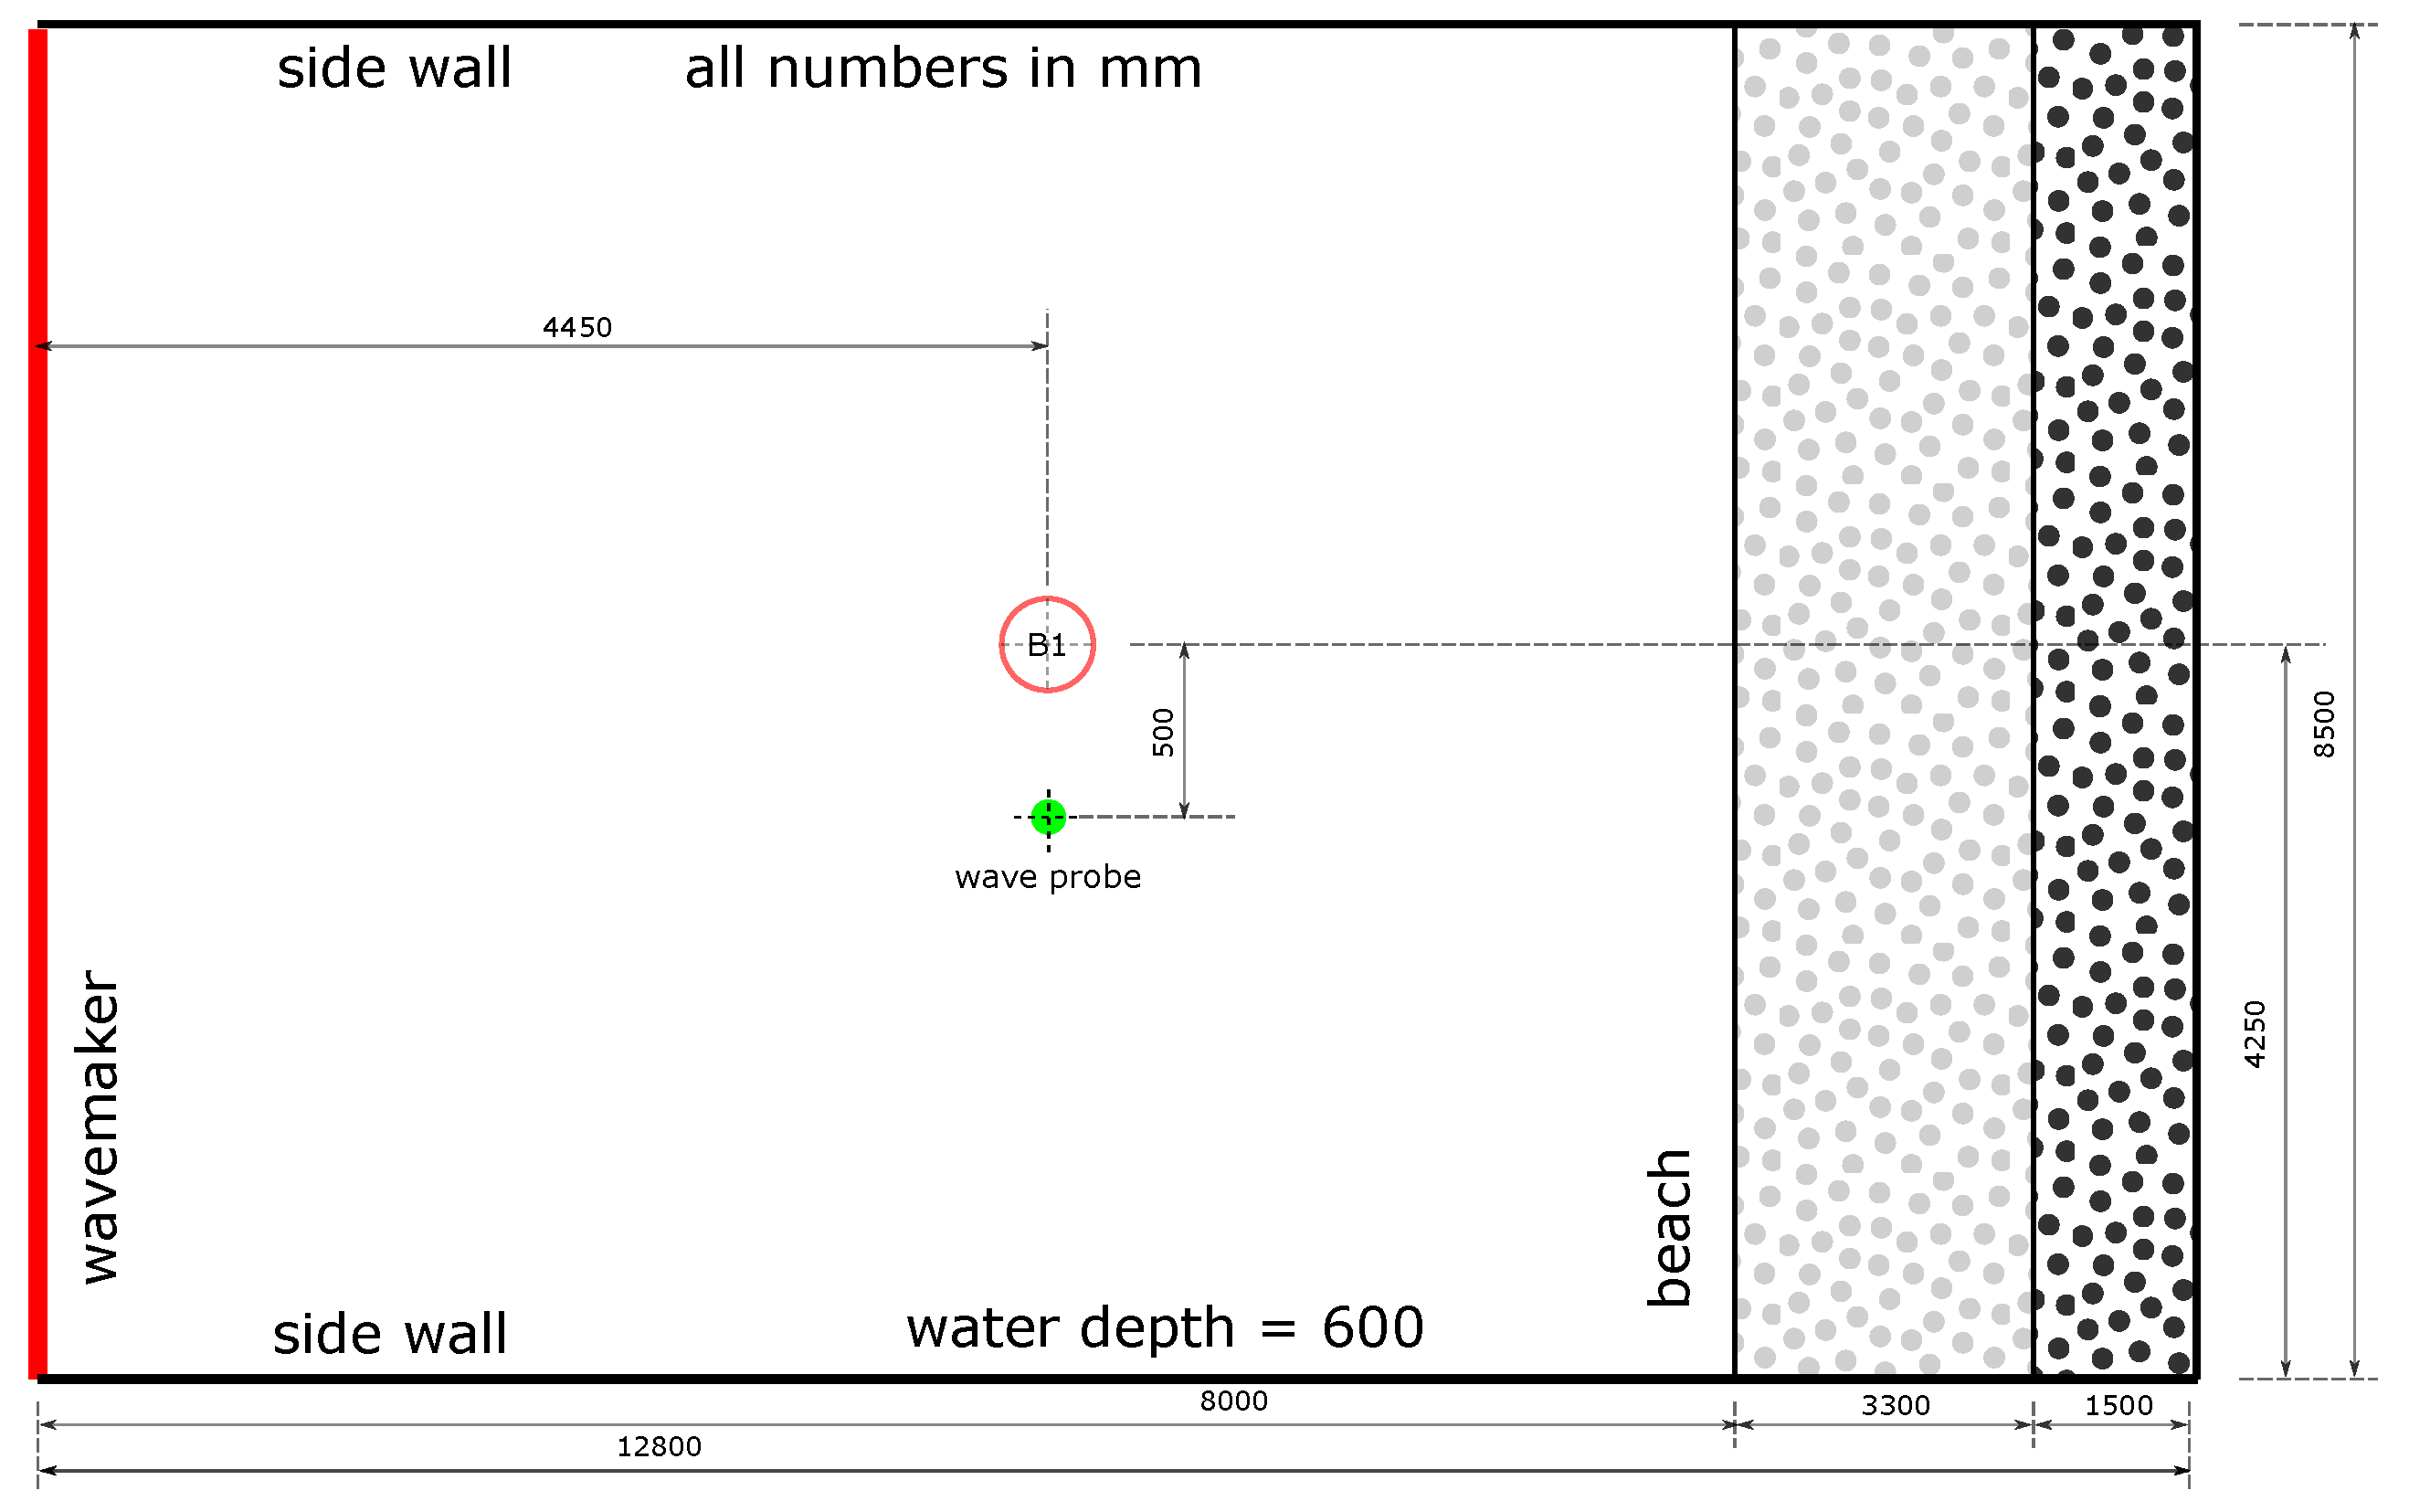
2. Experimental Setup
- The spring’s stiffness, k;
- The initial compression force of the spring, which is a function of its natural length , its actual length l, and the stiffness k, ;
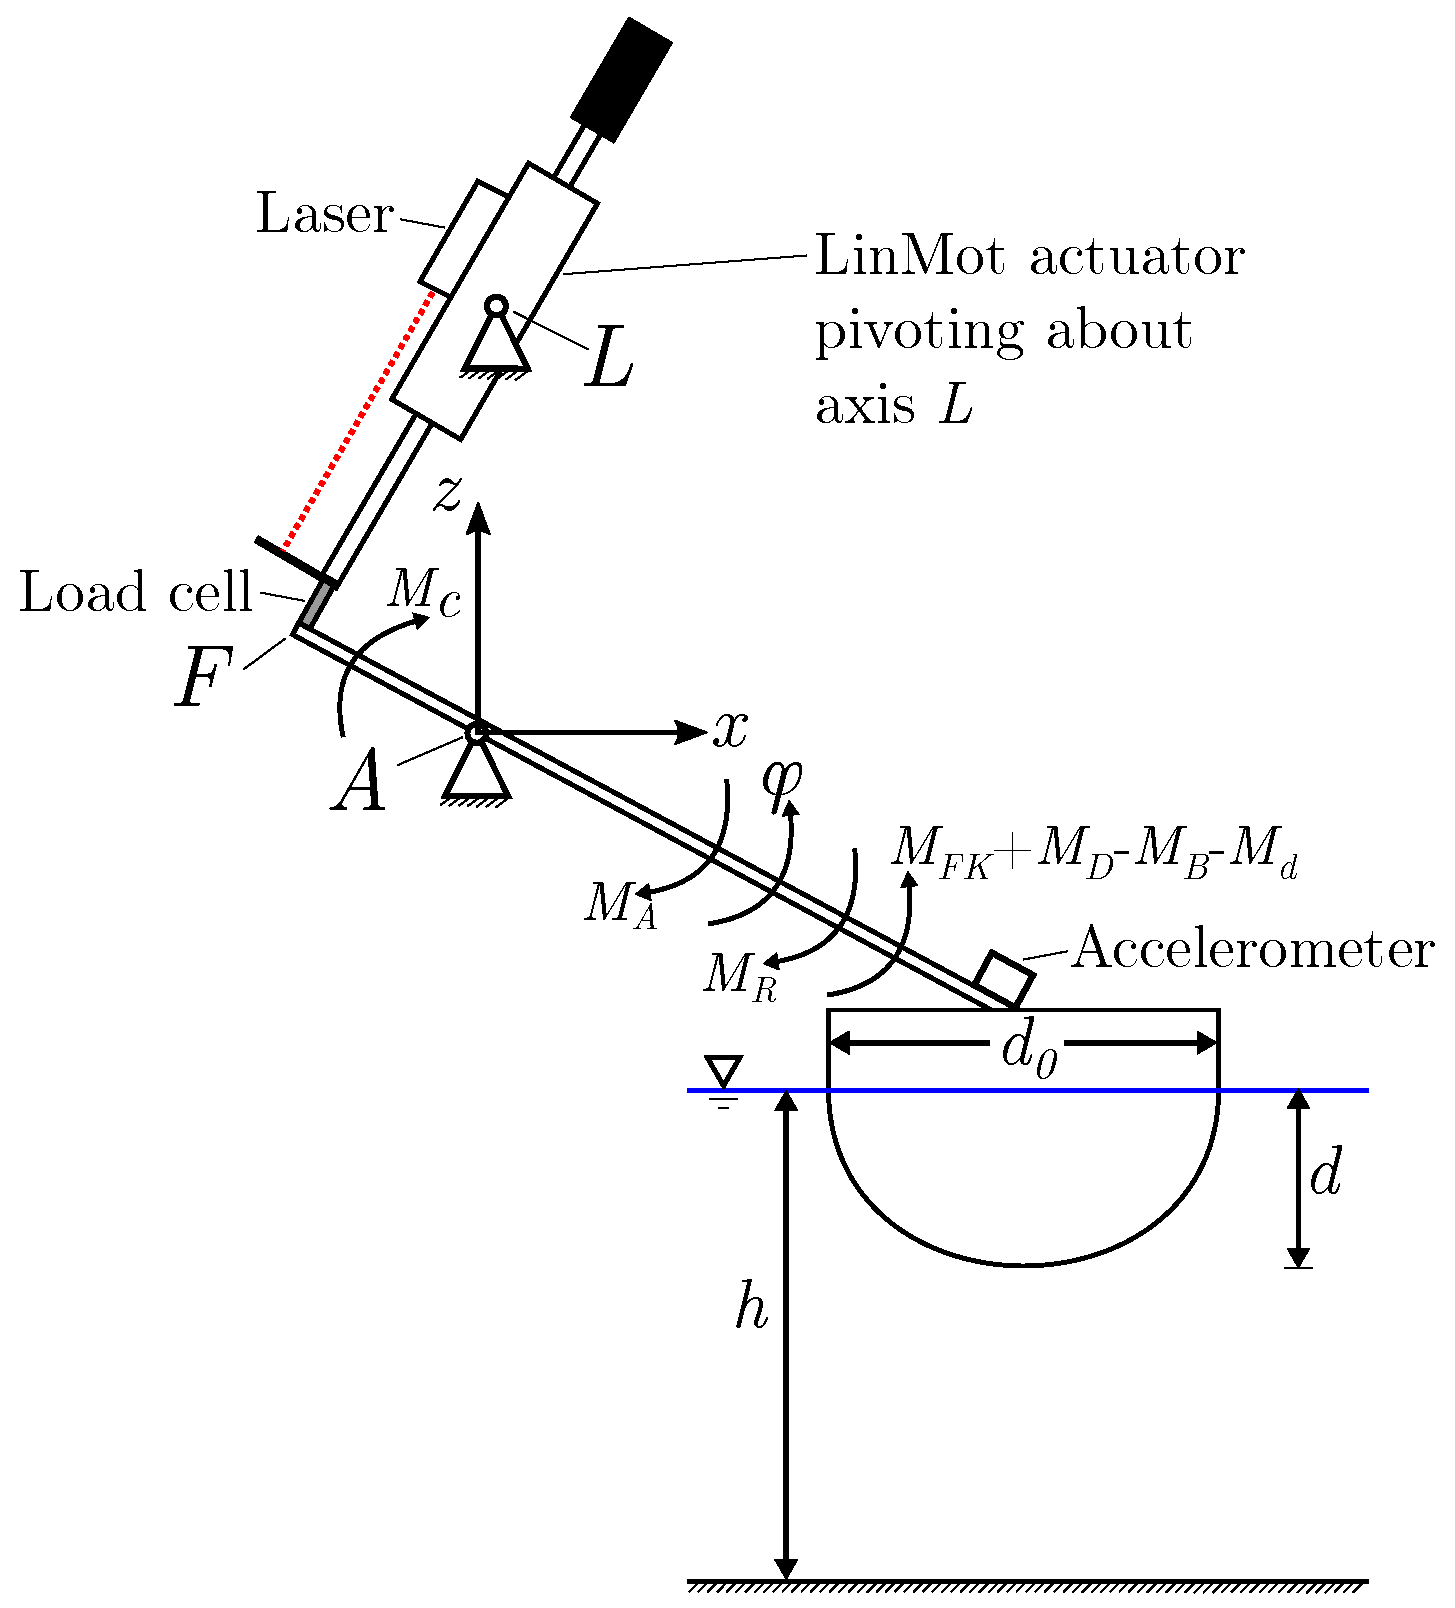
- The angular displacement of arm () as a function of angular displacement of the arm axis (), cf. Figure 2;
- The change in distance as a function of angular displacement of the axis ().
3. Mathematical Model
3.1. Equation of Motion
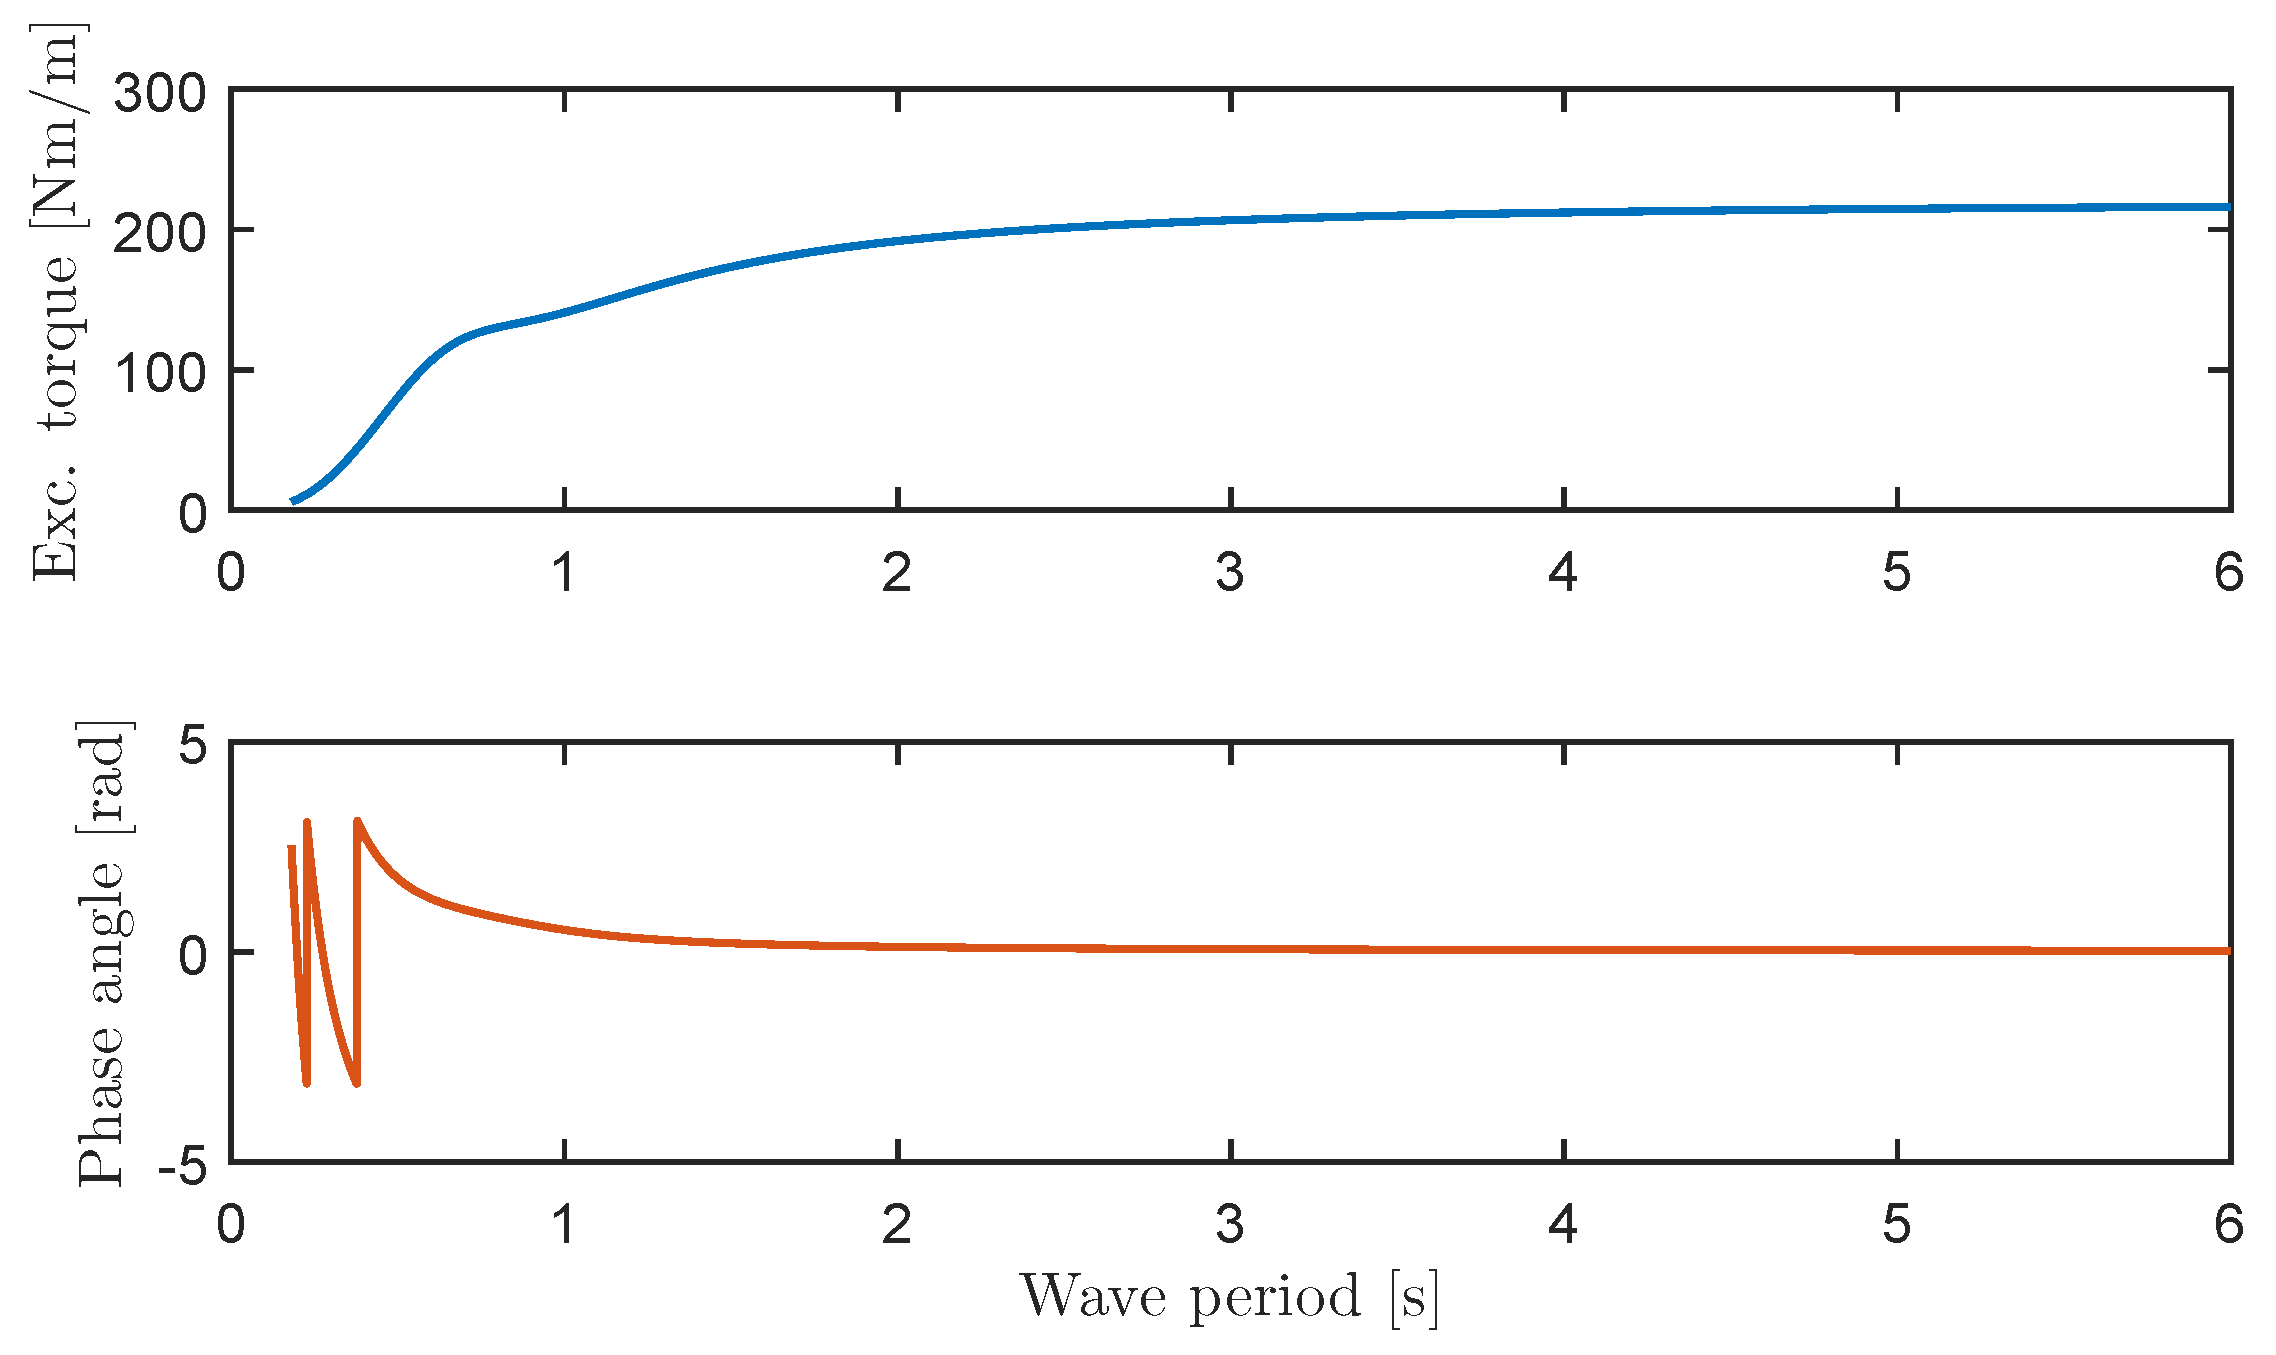
3.2. Hydrodynamic Parameters
3.3. Optimal Load Resistance for Unconstrained Oscillation
3.4. Optimal Load Resistance for Constrained Oscillation
4. Experimental Testing Conditions
4.1. Model Variations
4.2. Wave Conditions
5. Results and Discussion
5.1. Uncertainty
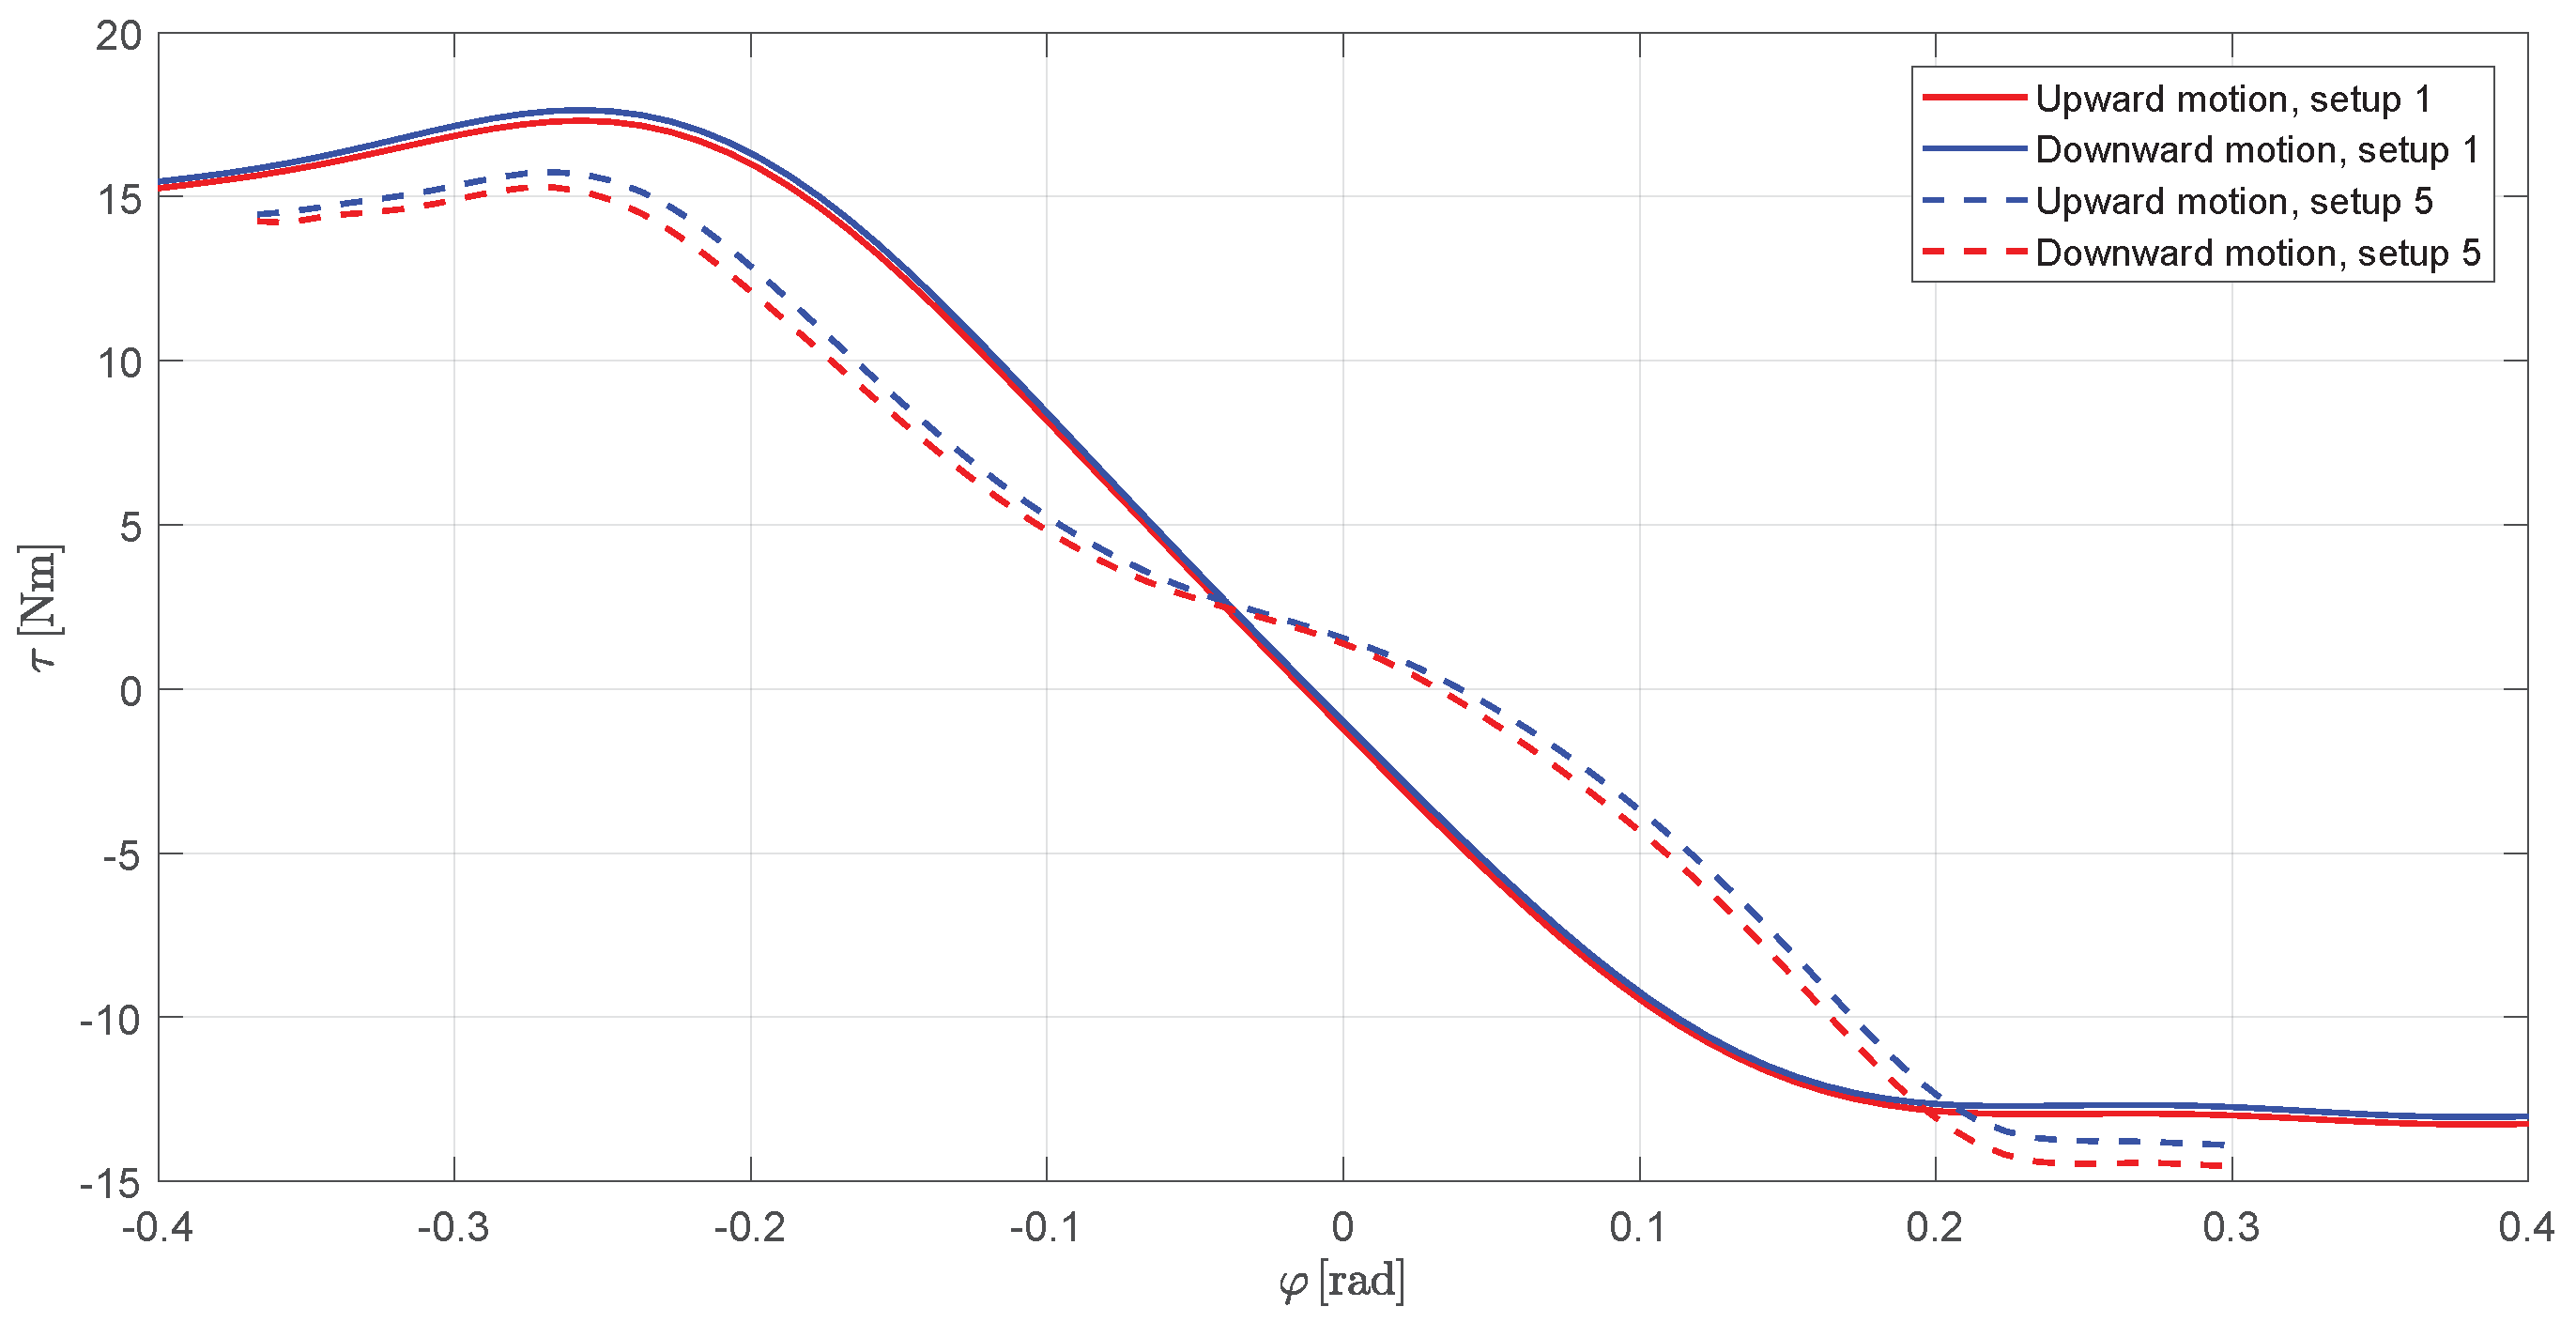
5.2. Hydrostatic Stiffness
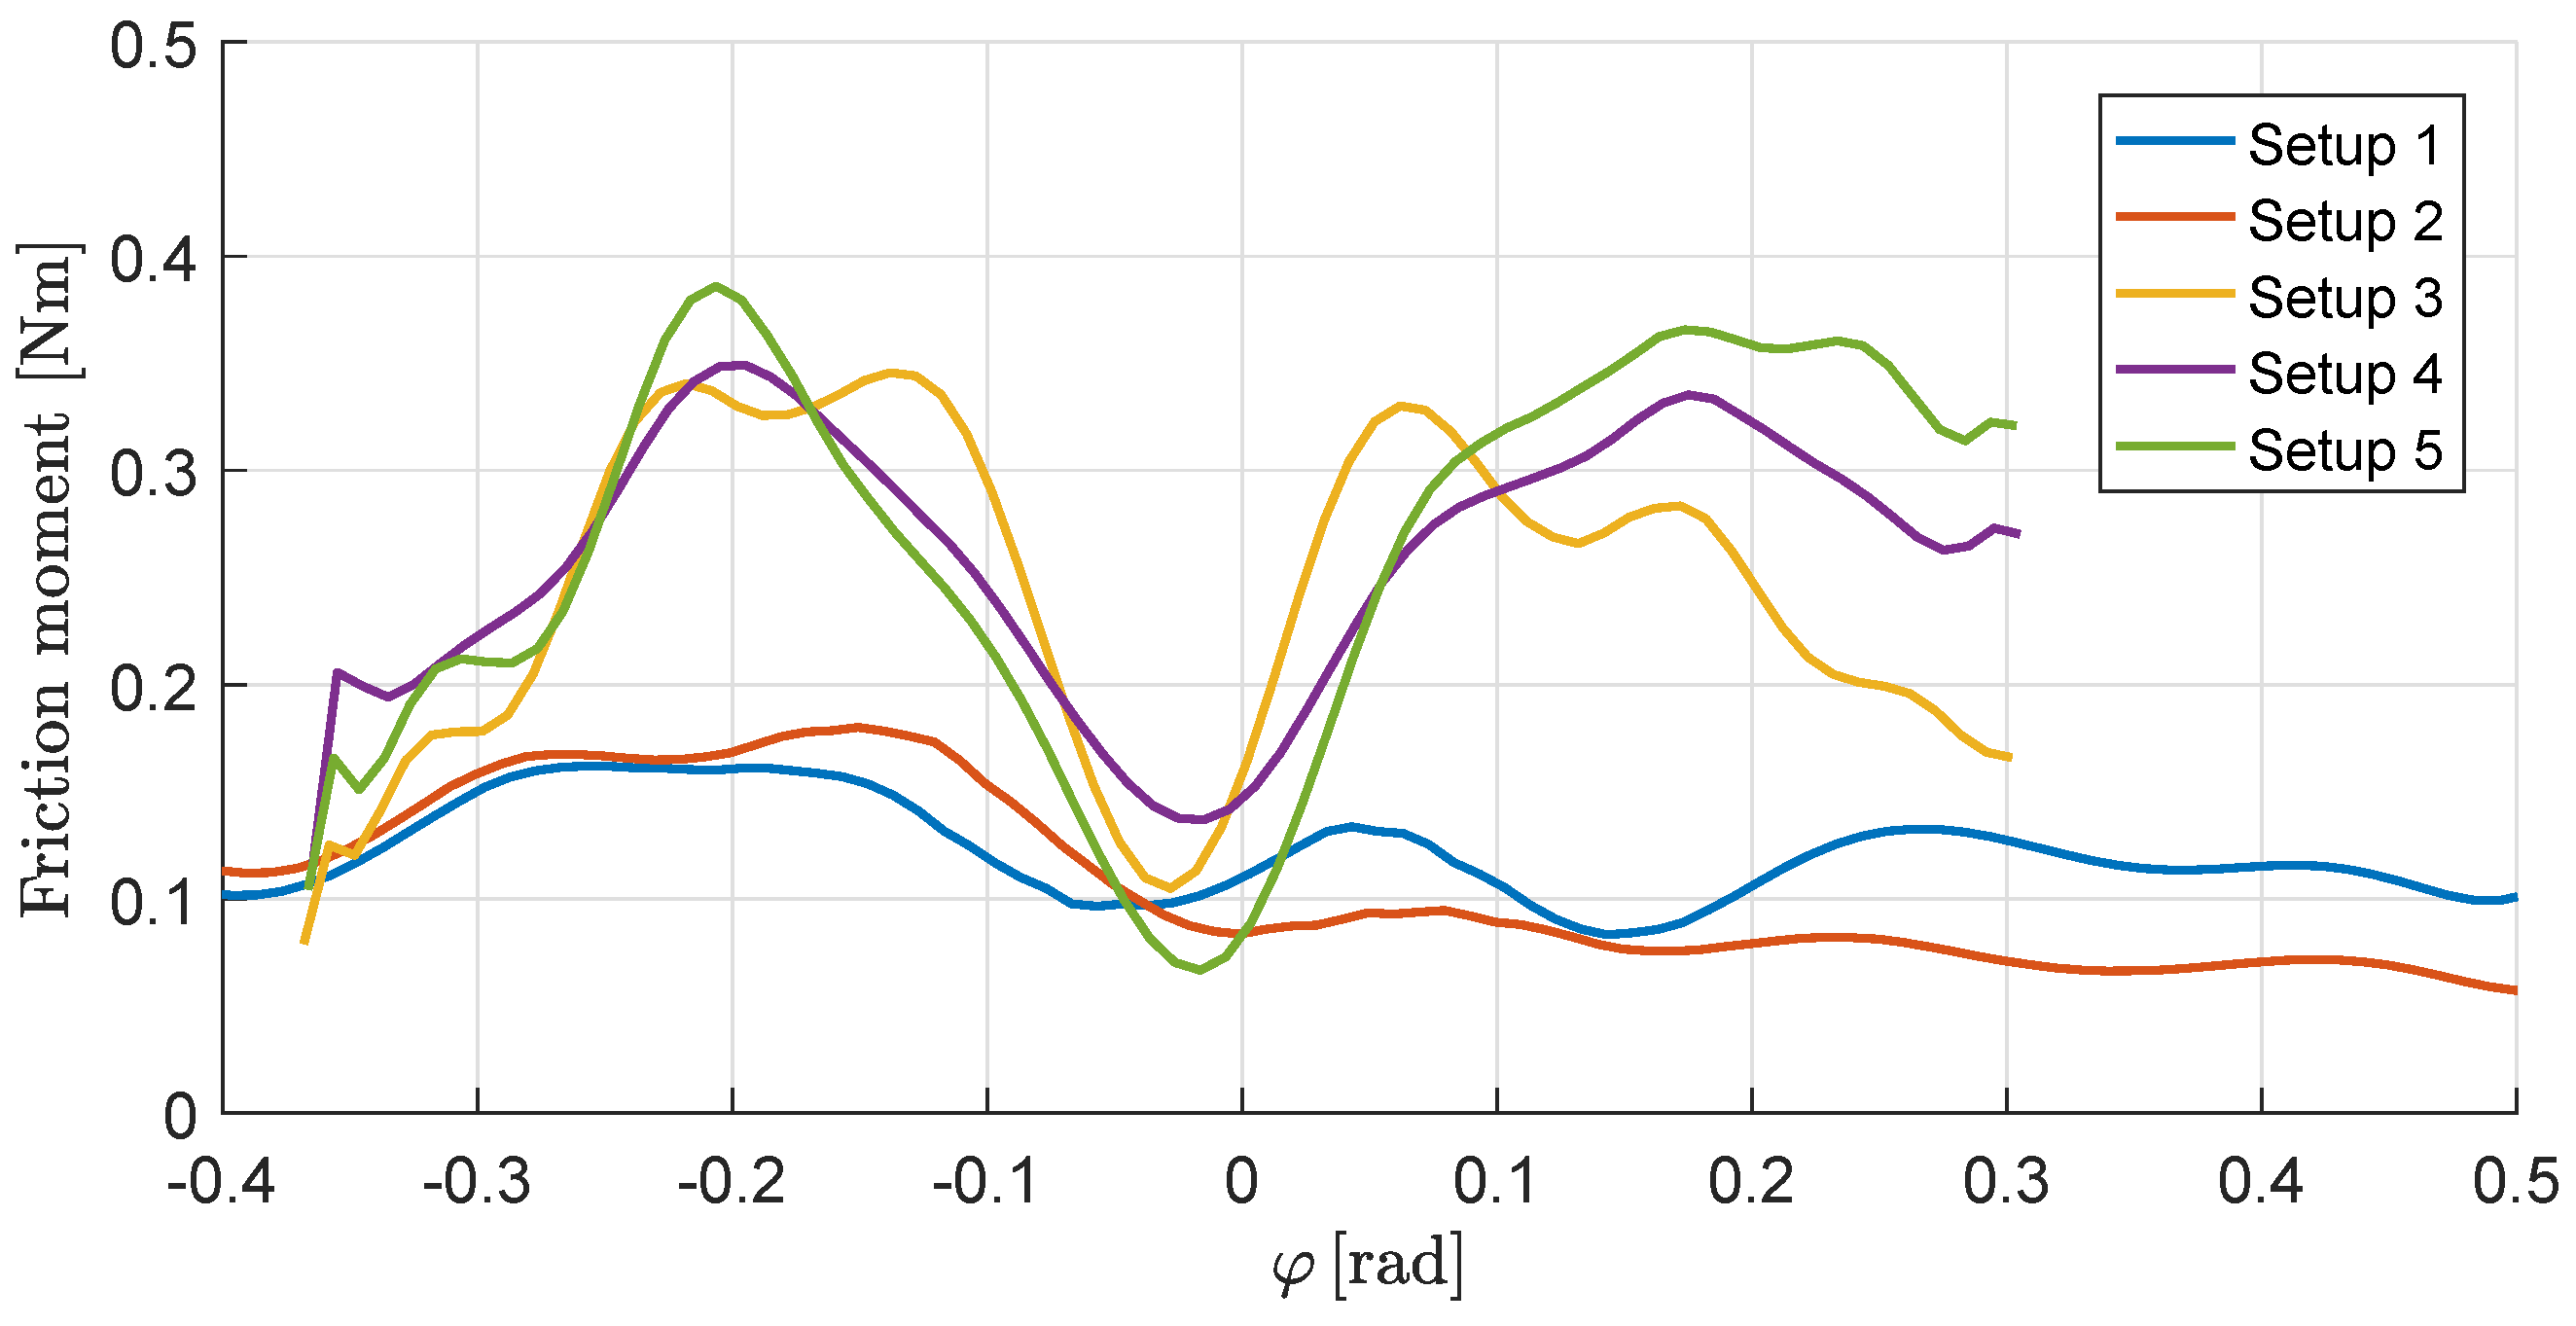
5.3. Friction
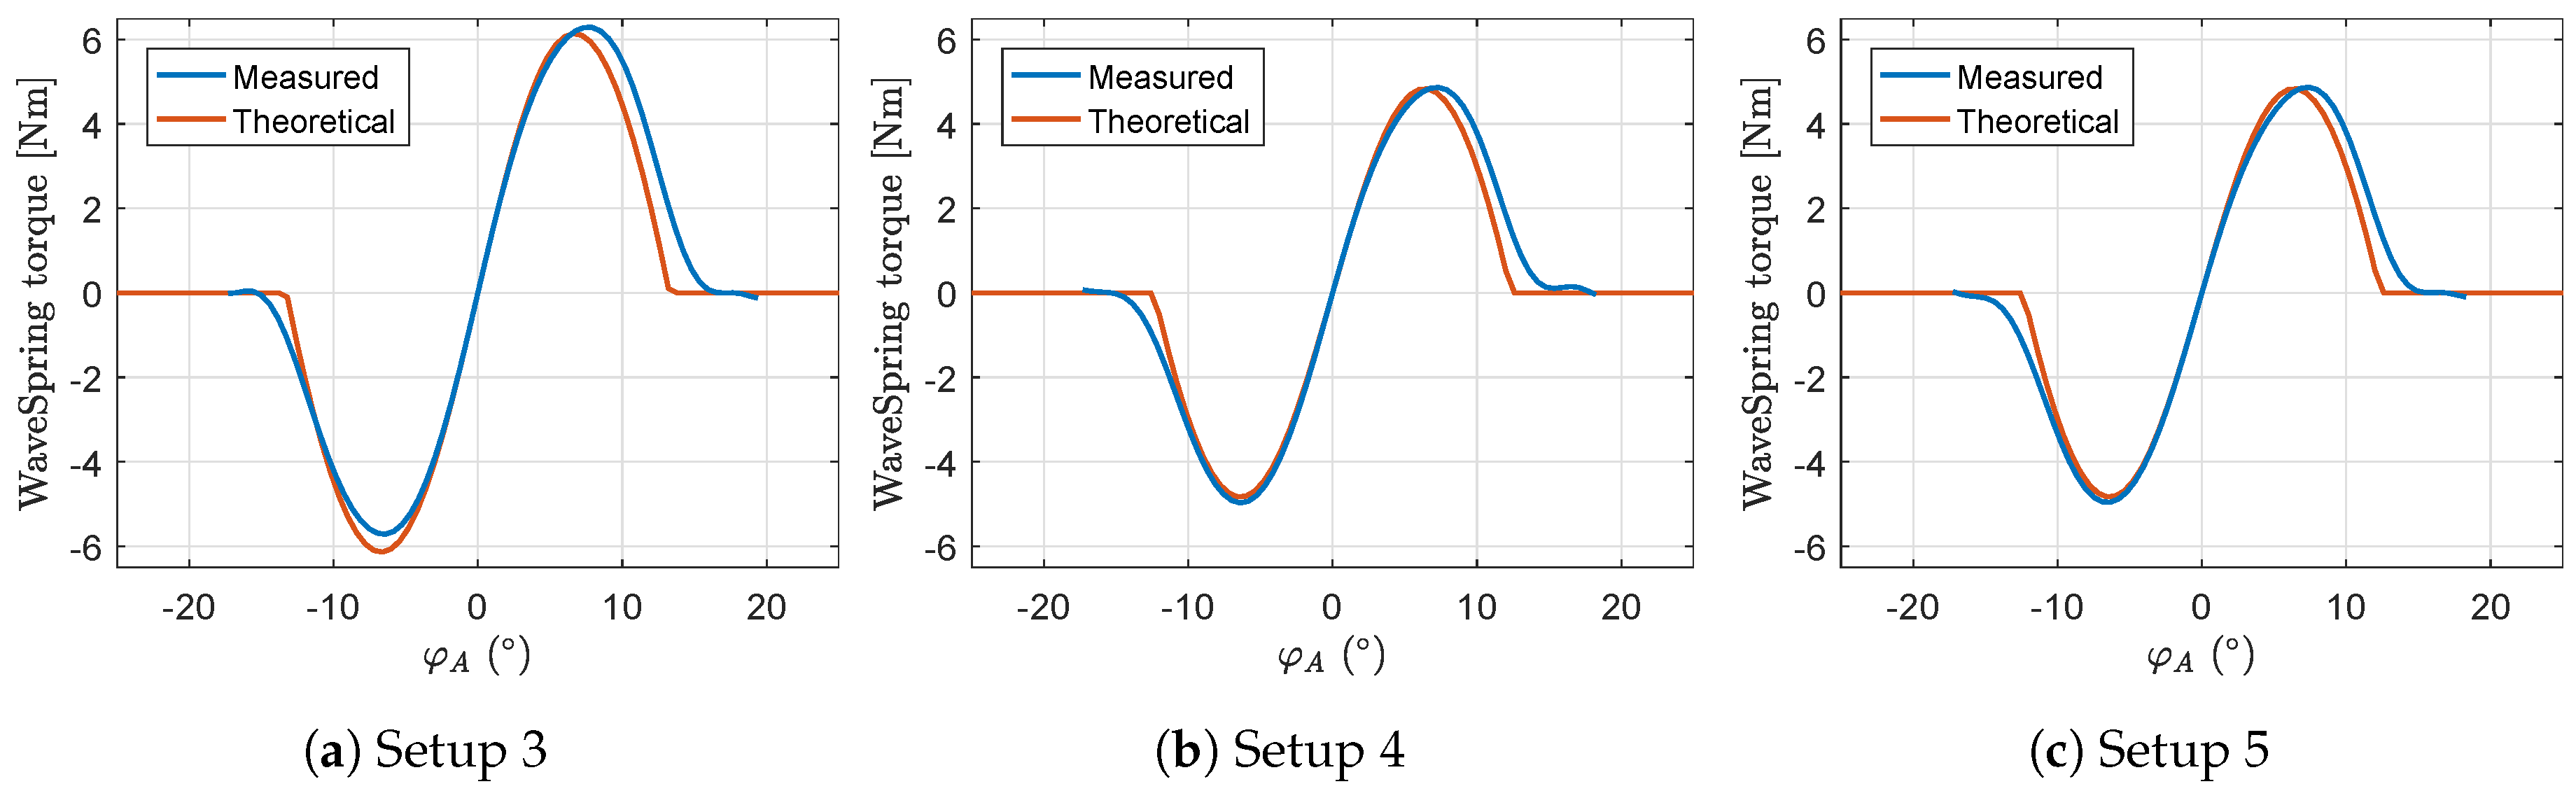
5.4. WaveSpring Torque
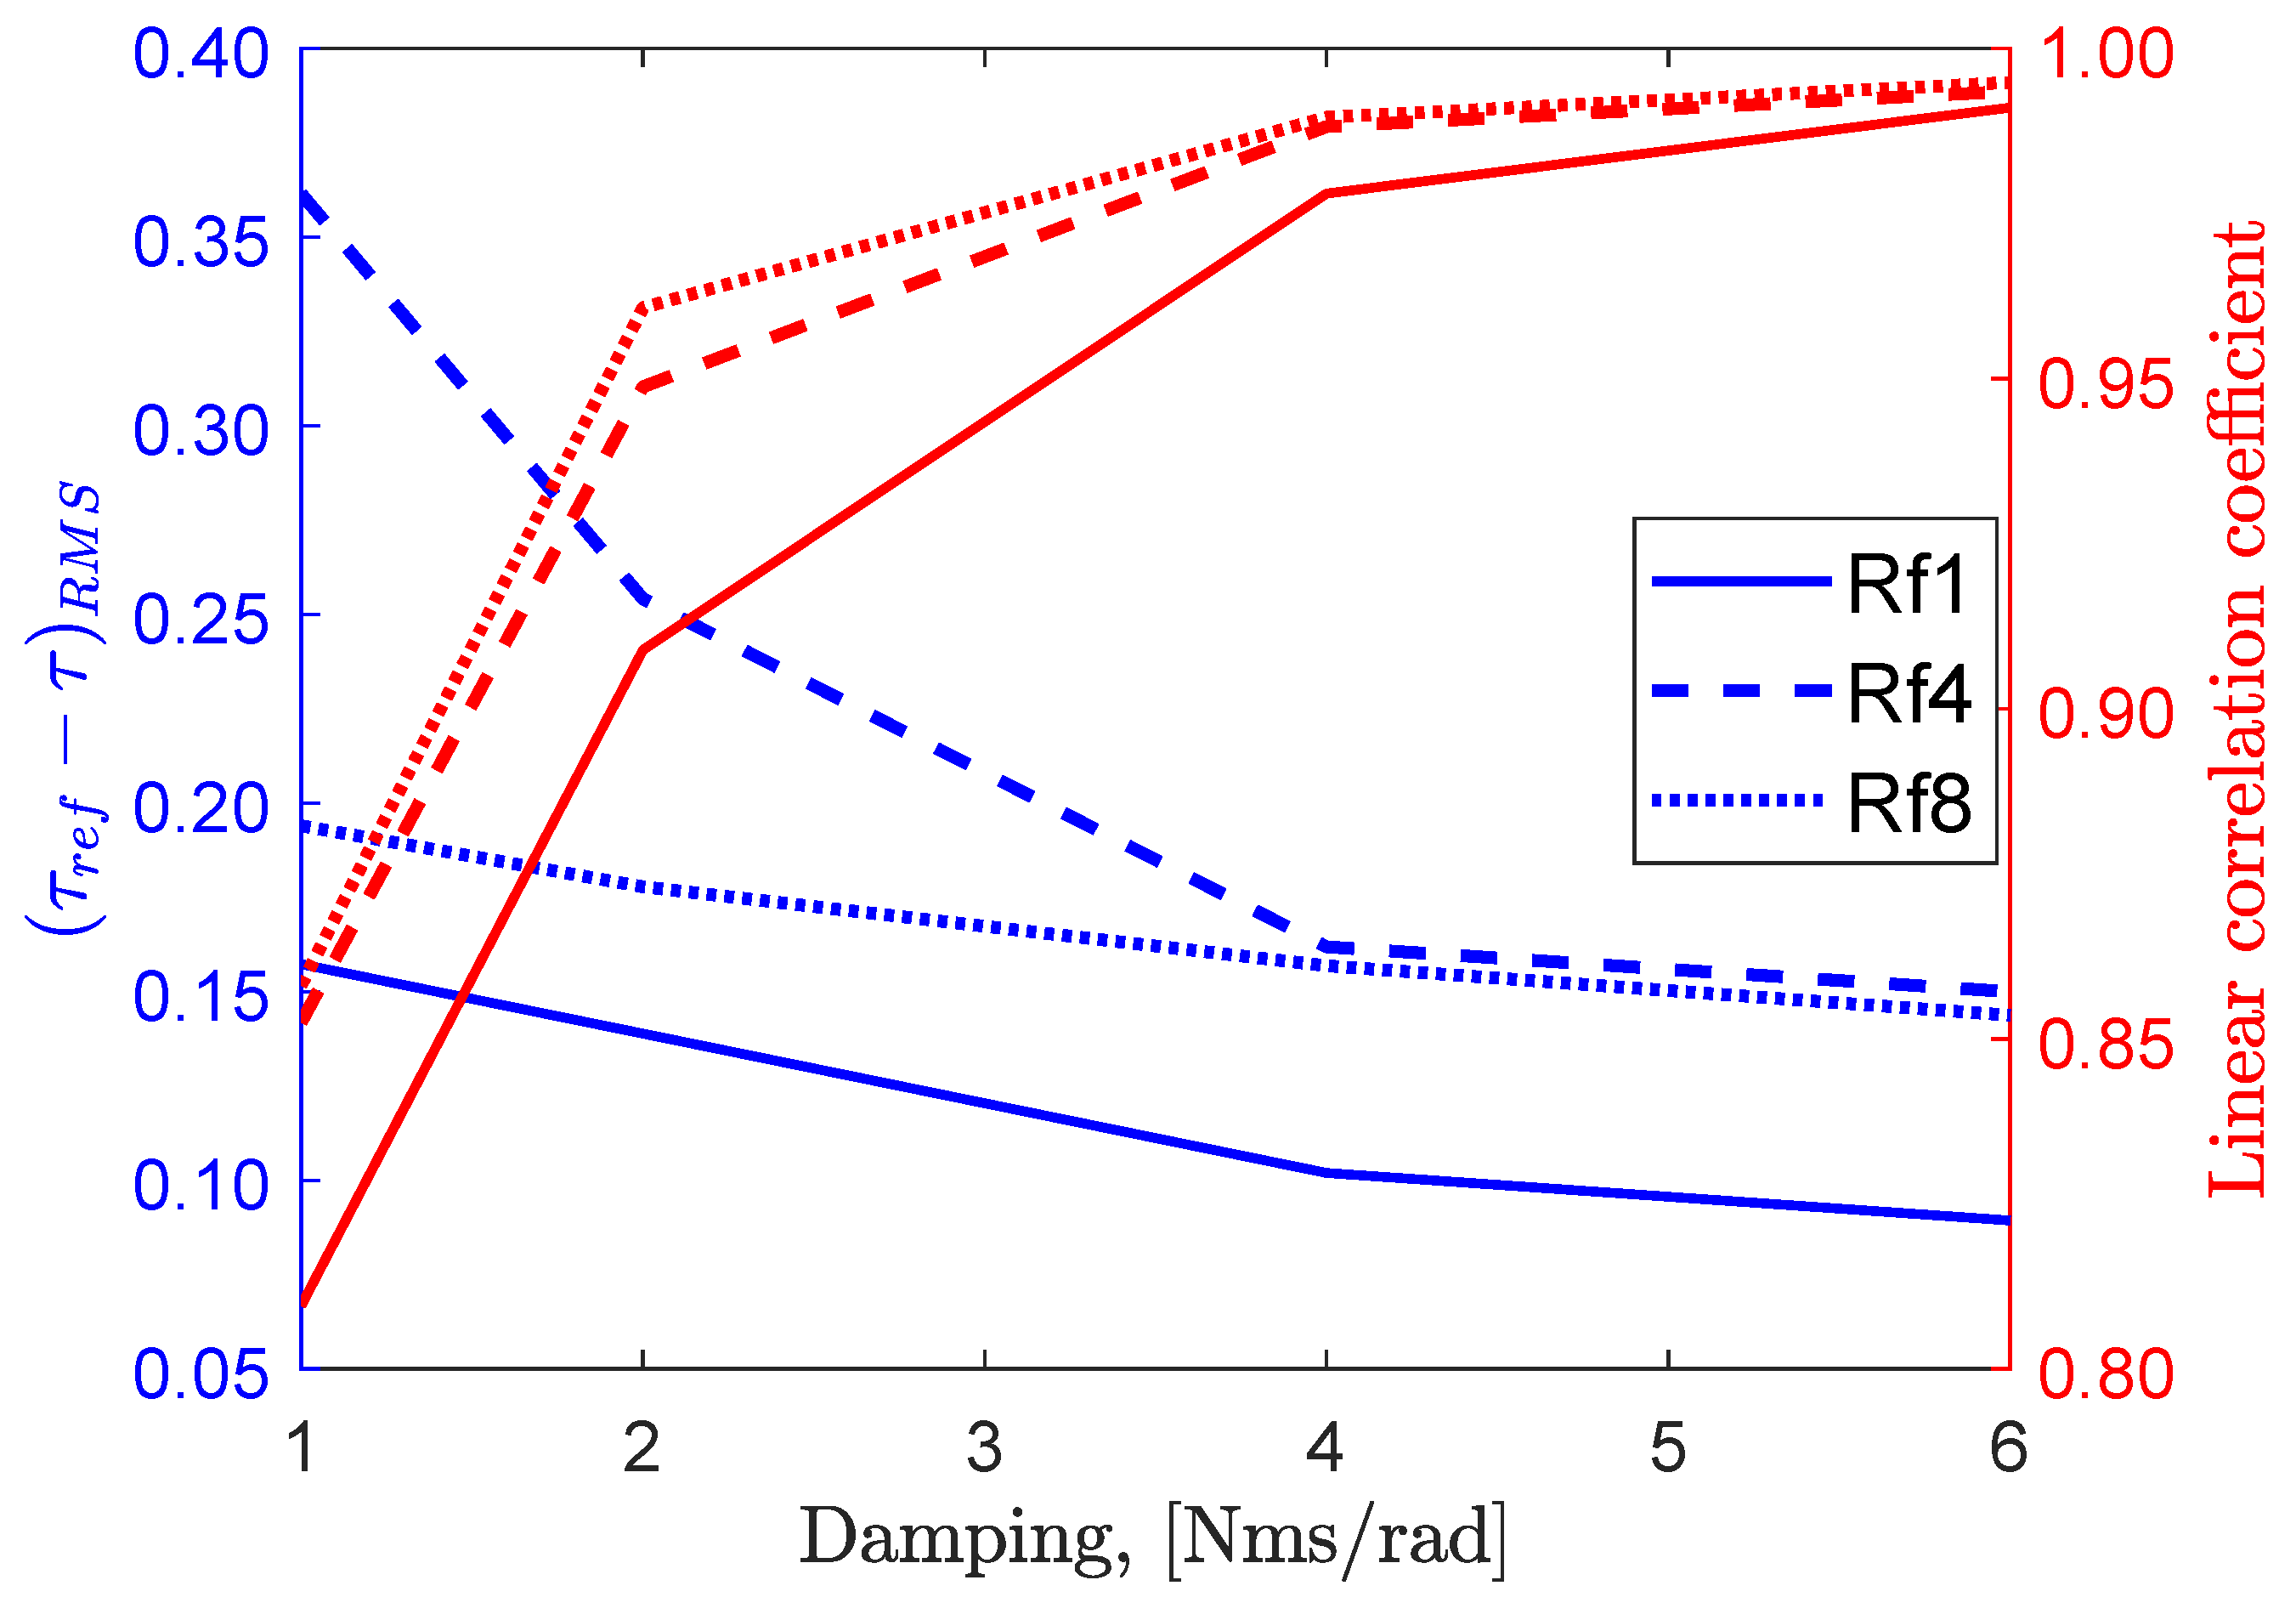
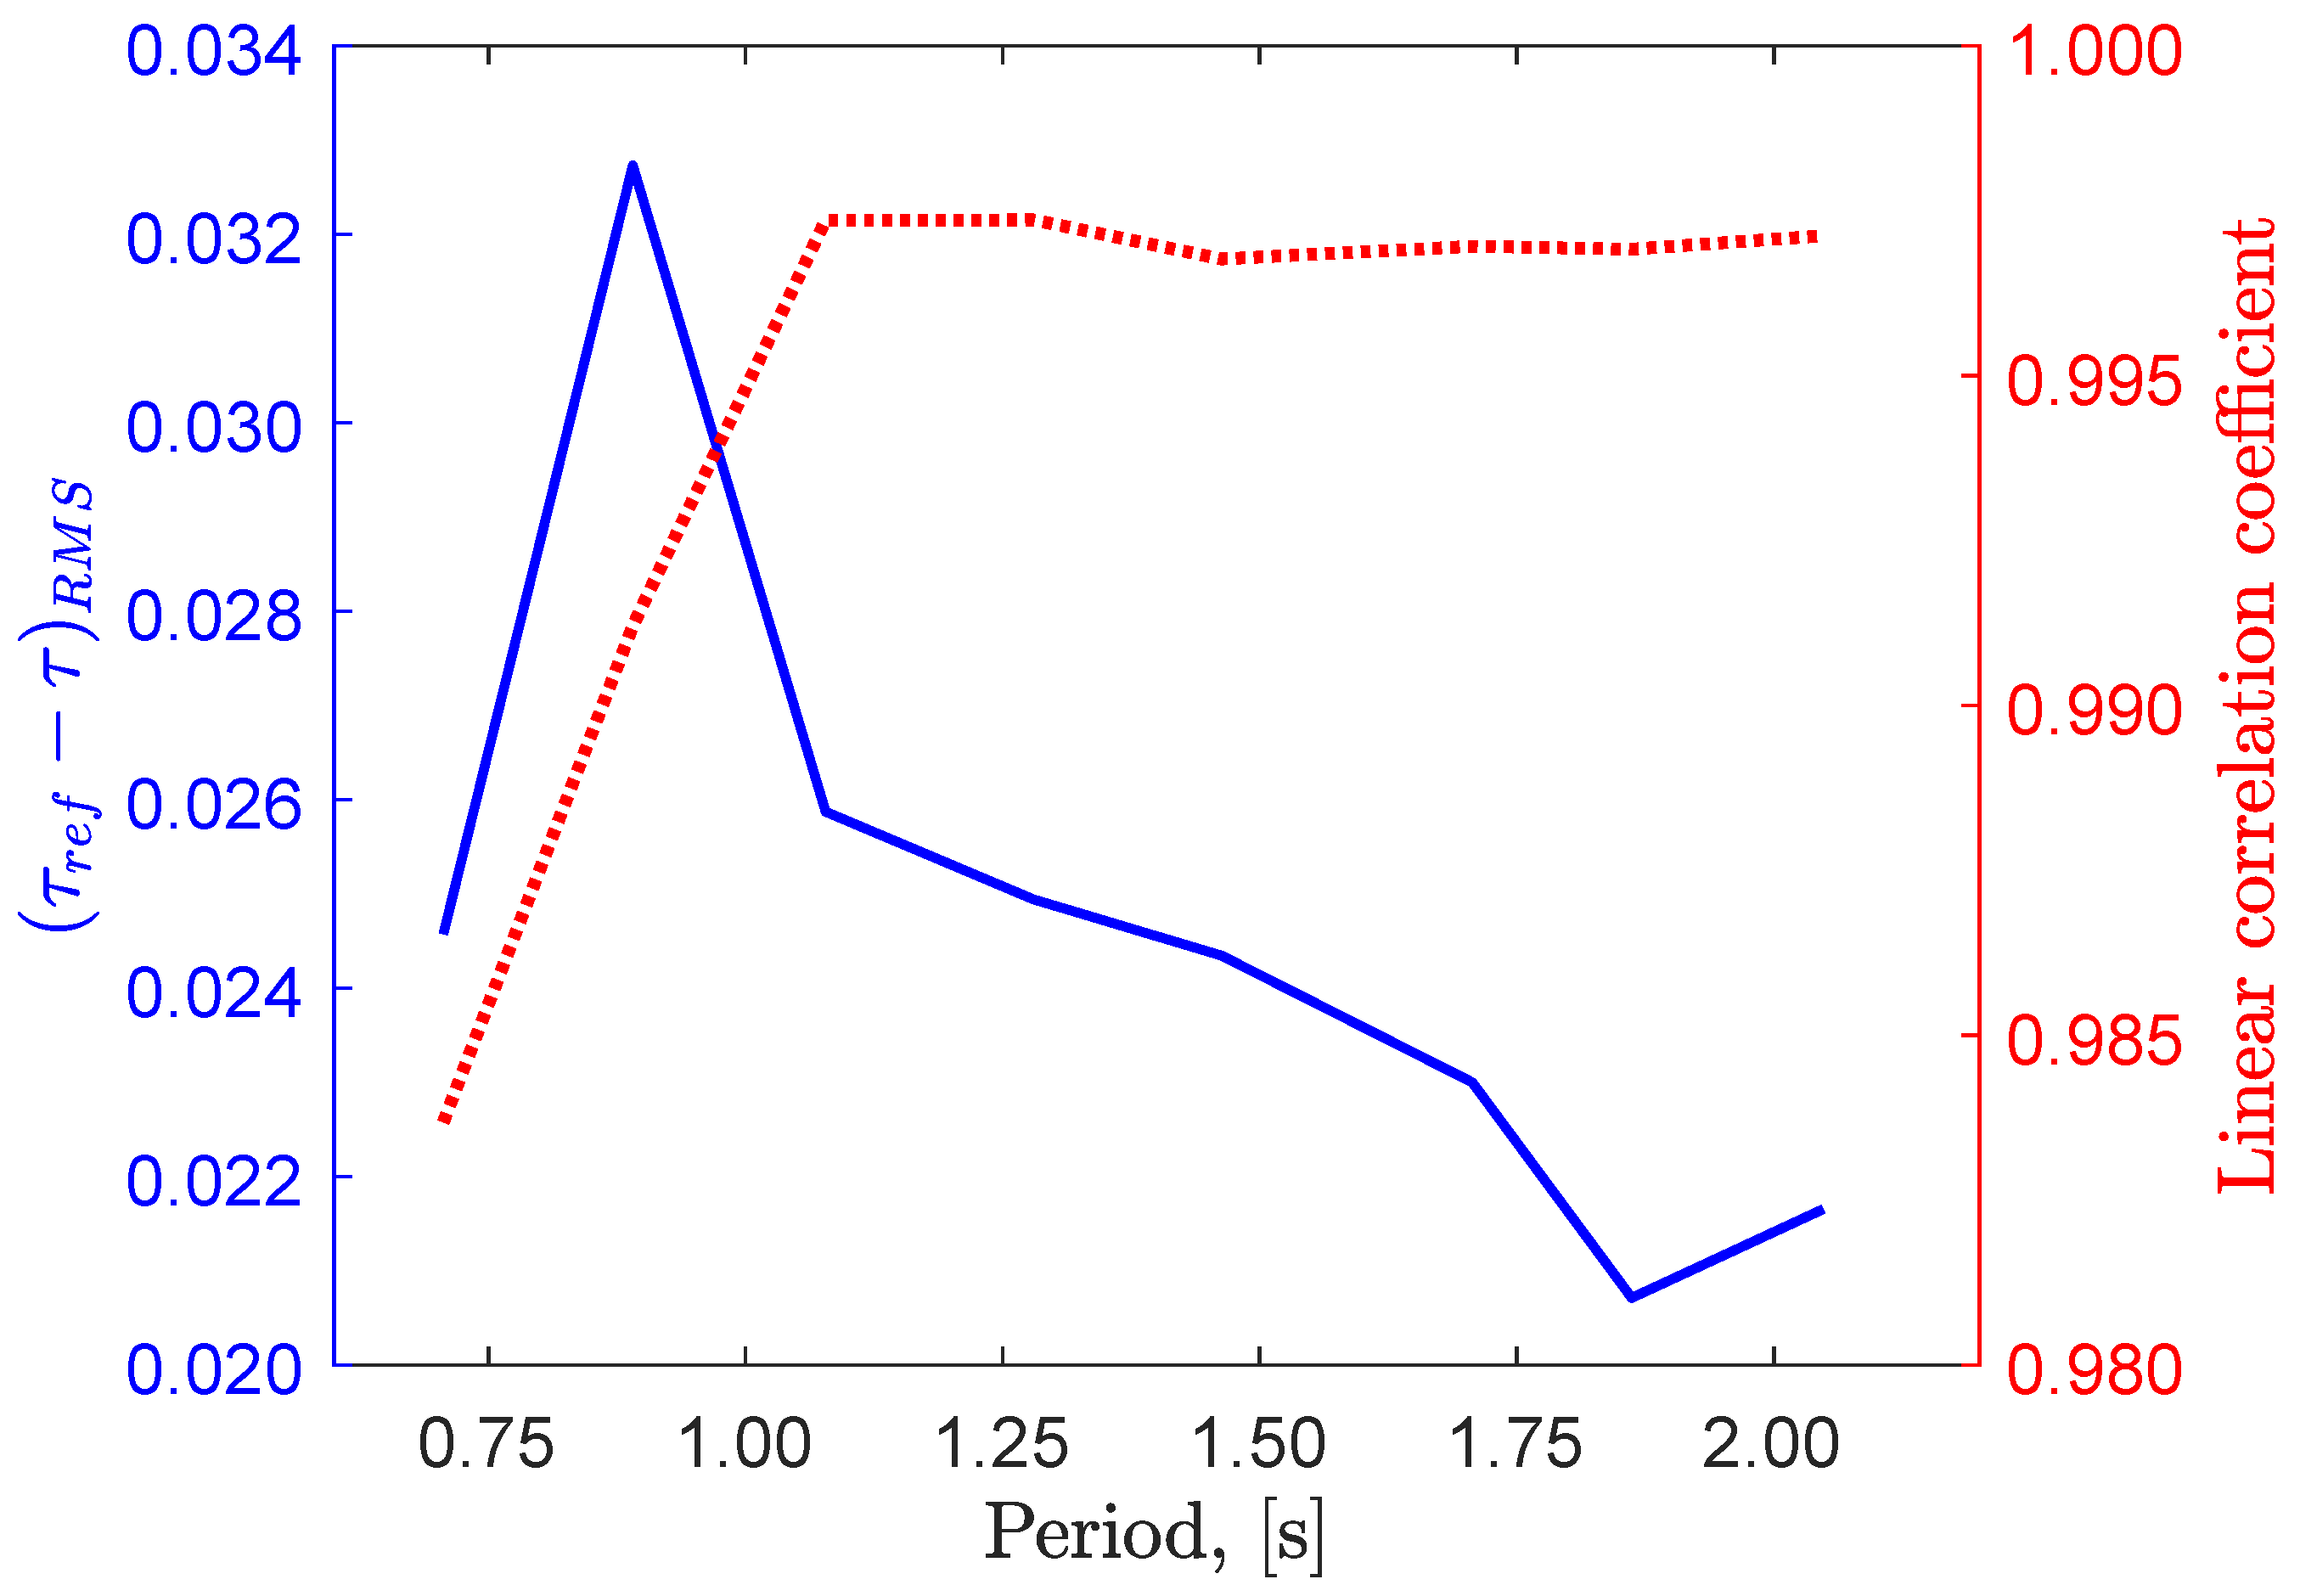
5.5. Actuator Reference Following
5.6. Regular Wave Results
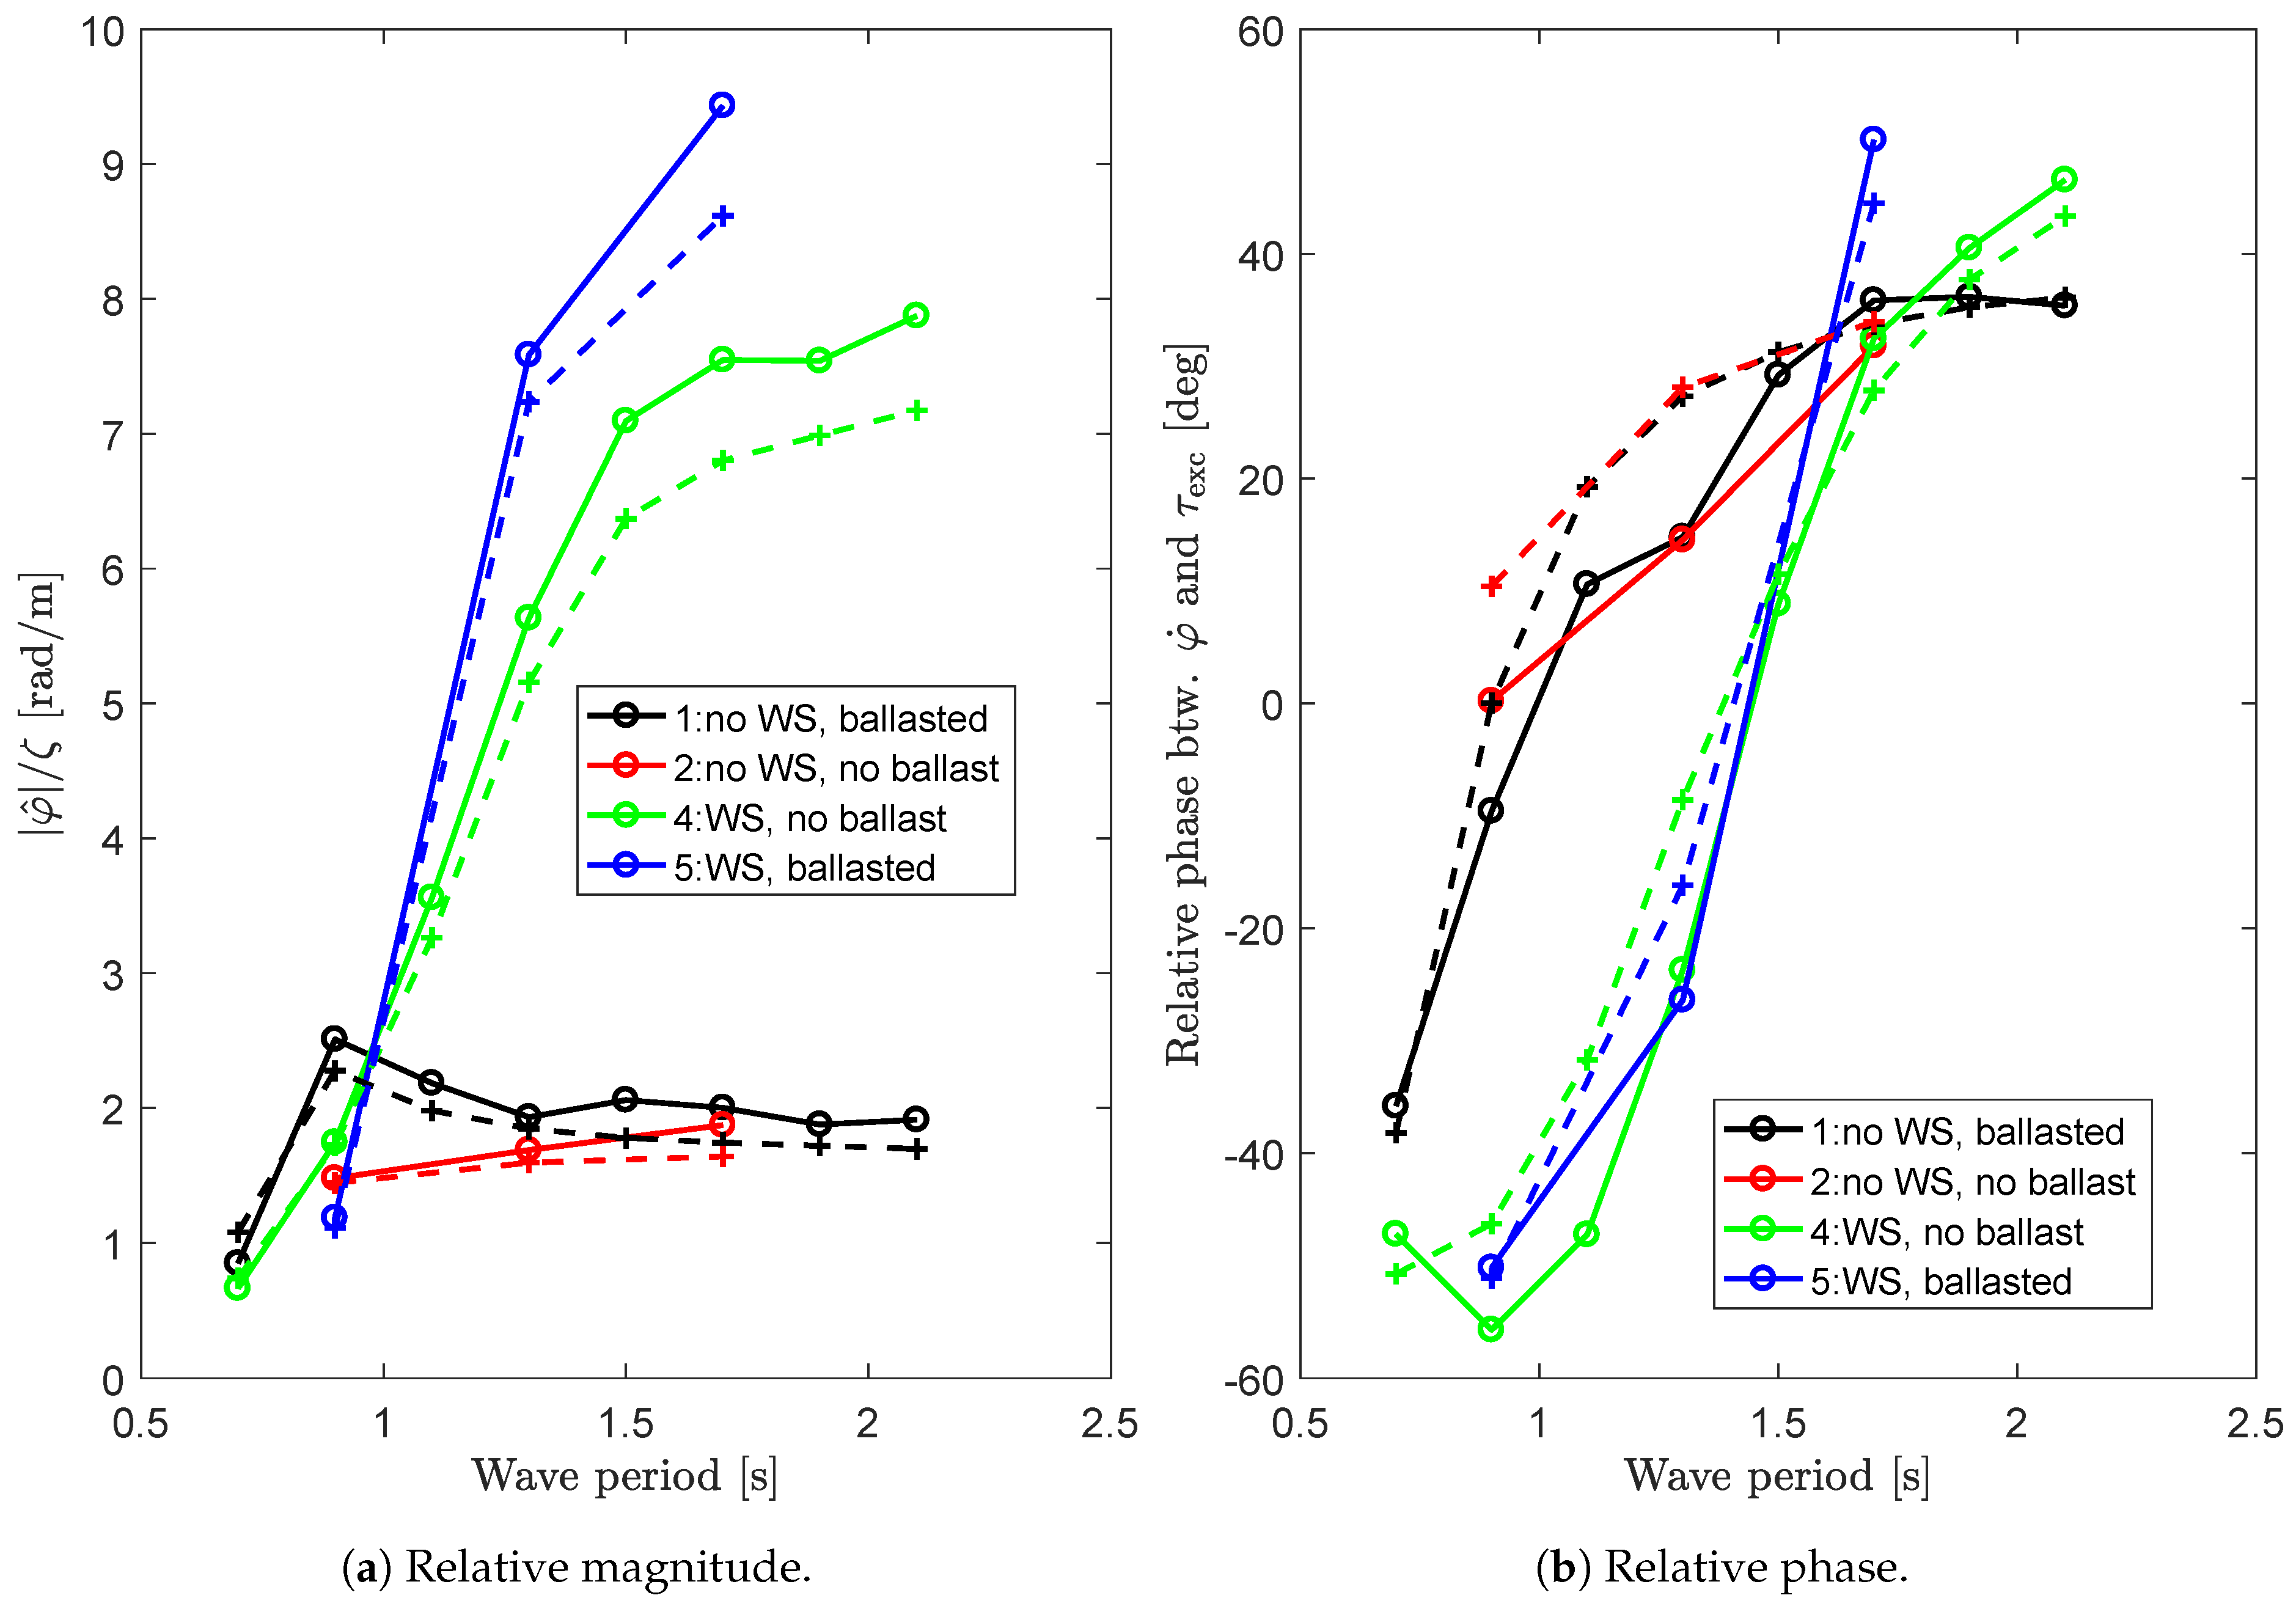
5.6.1. Motion Response in Regular Waves
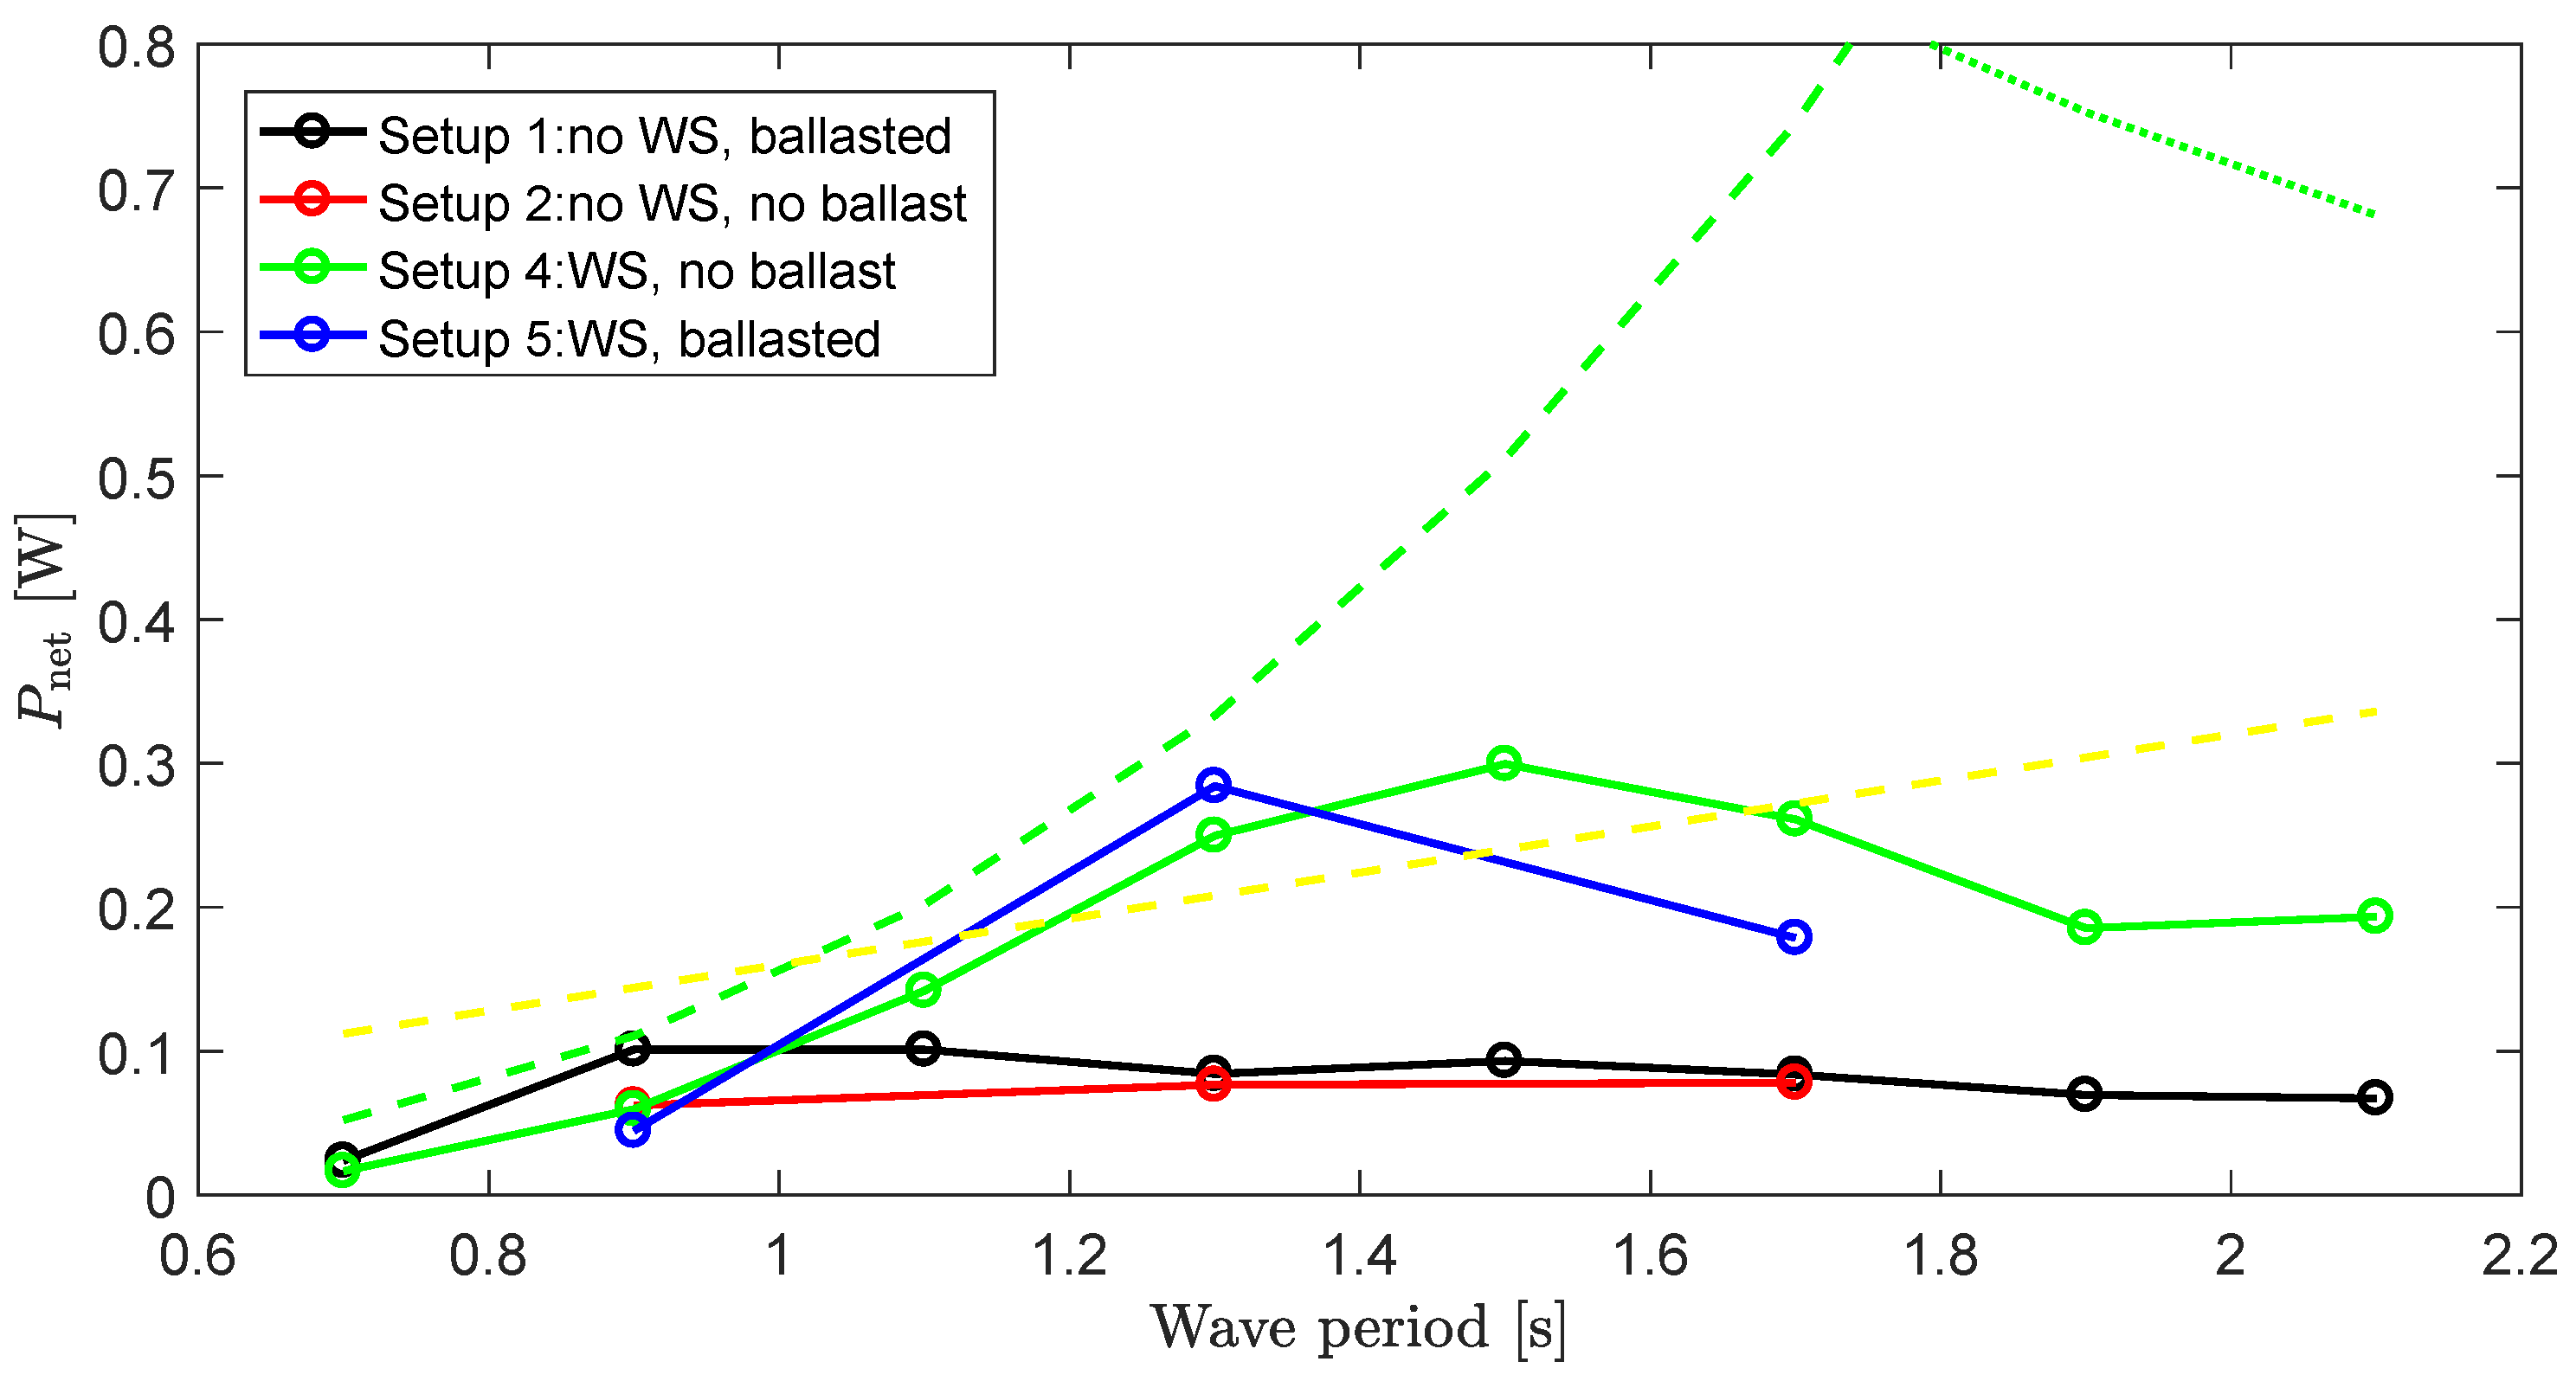
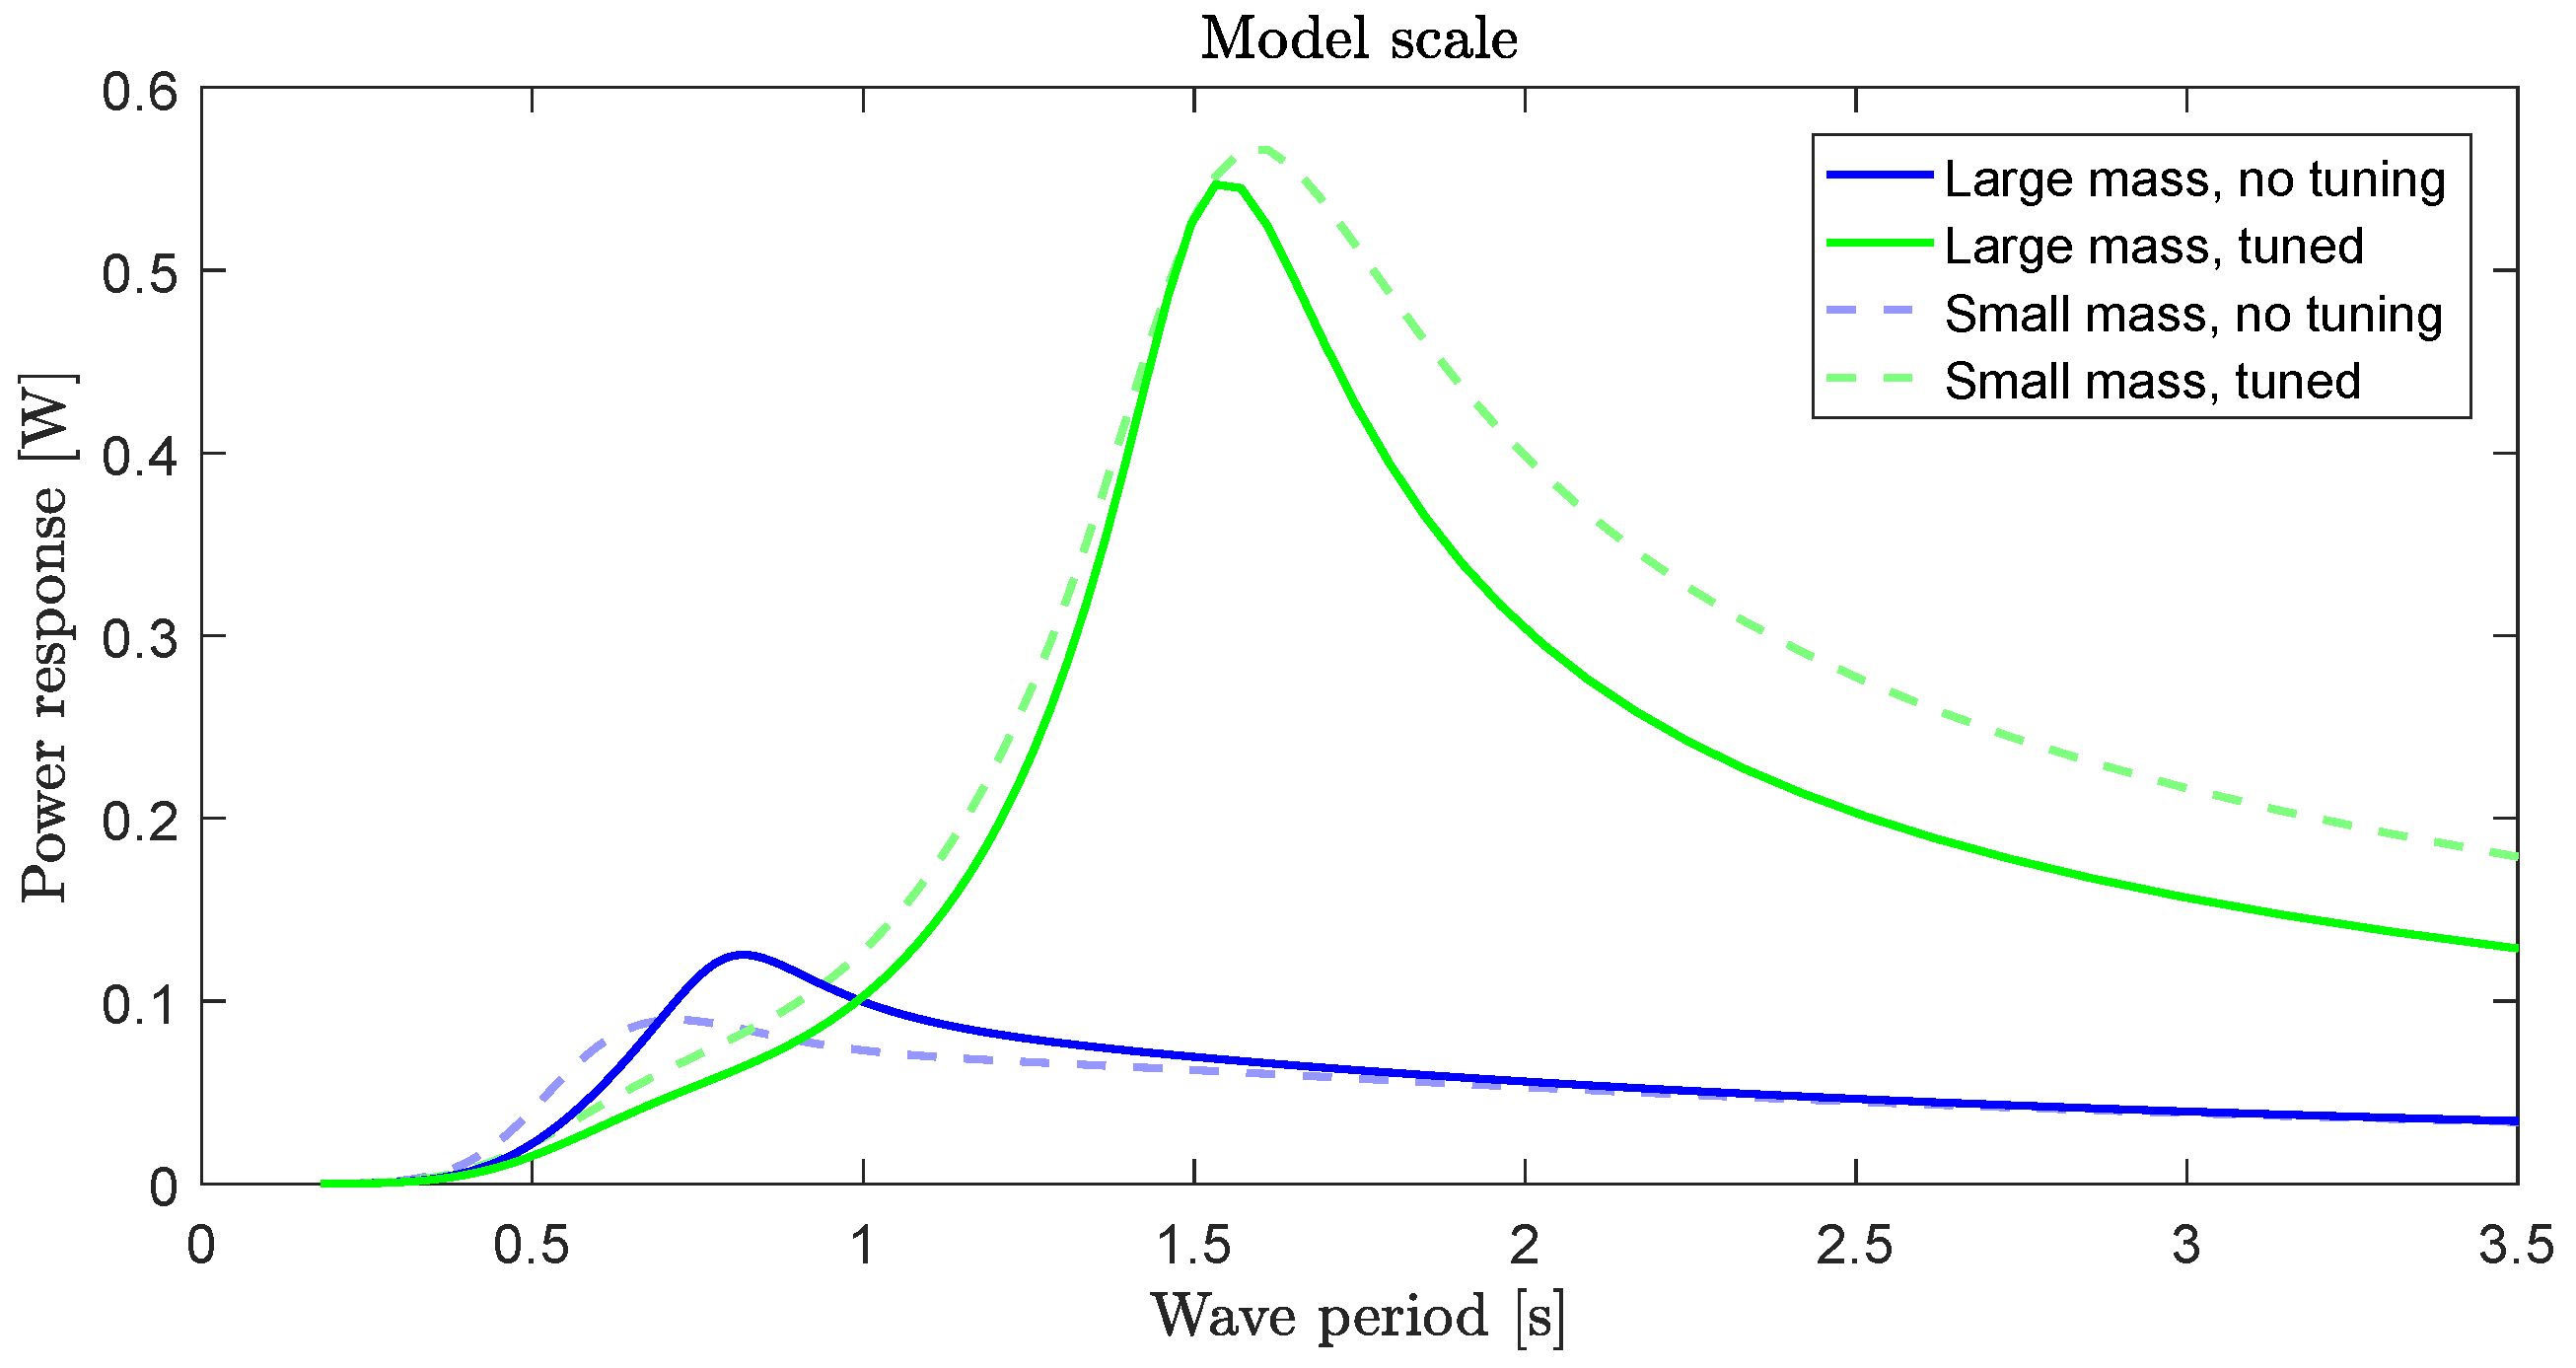
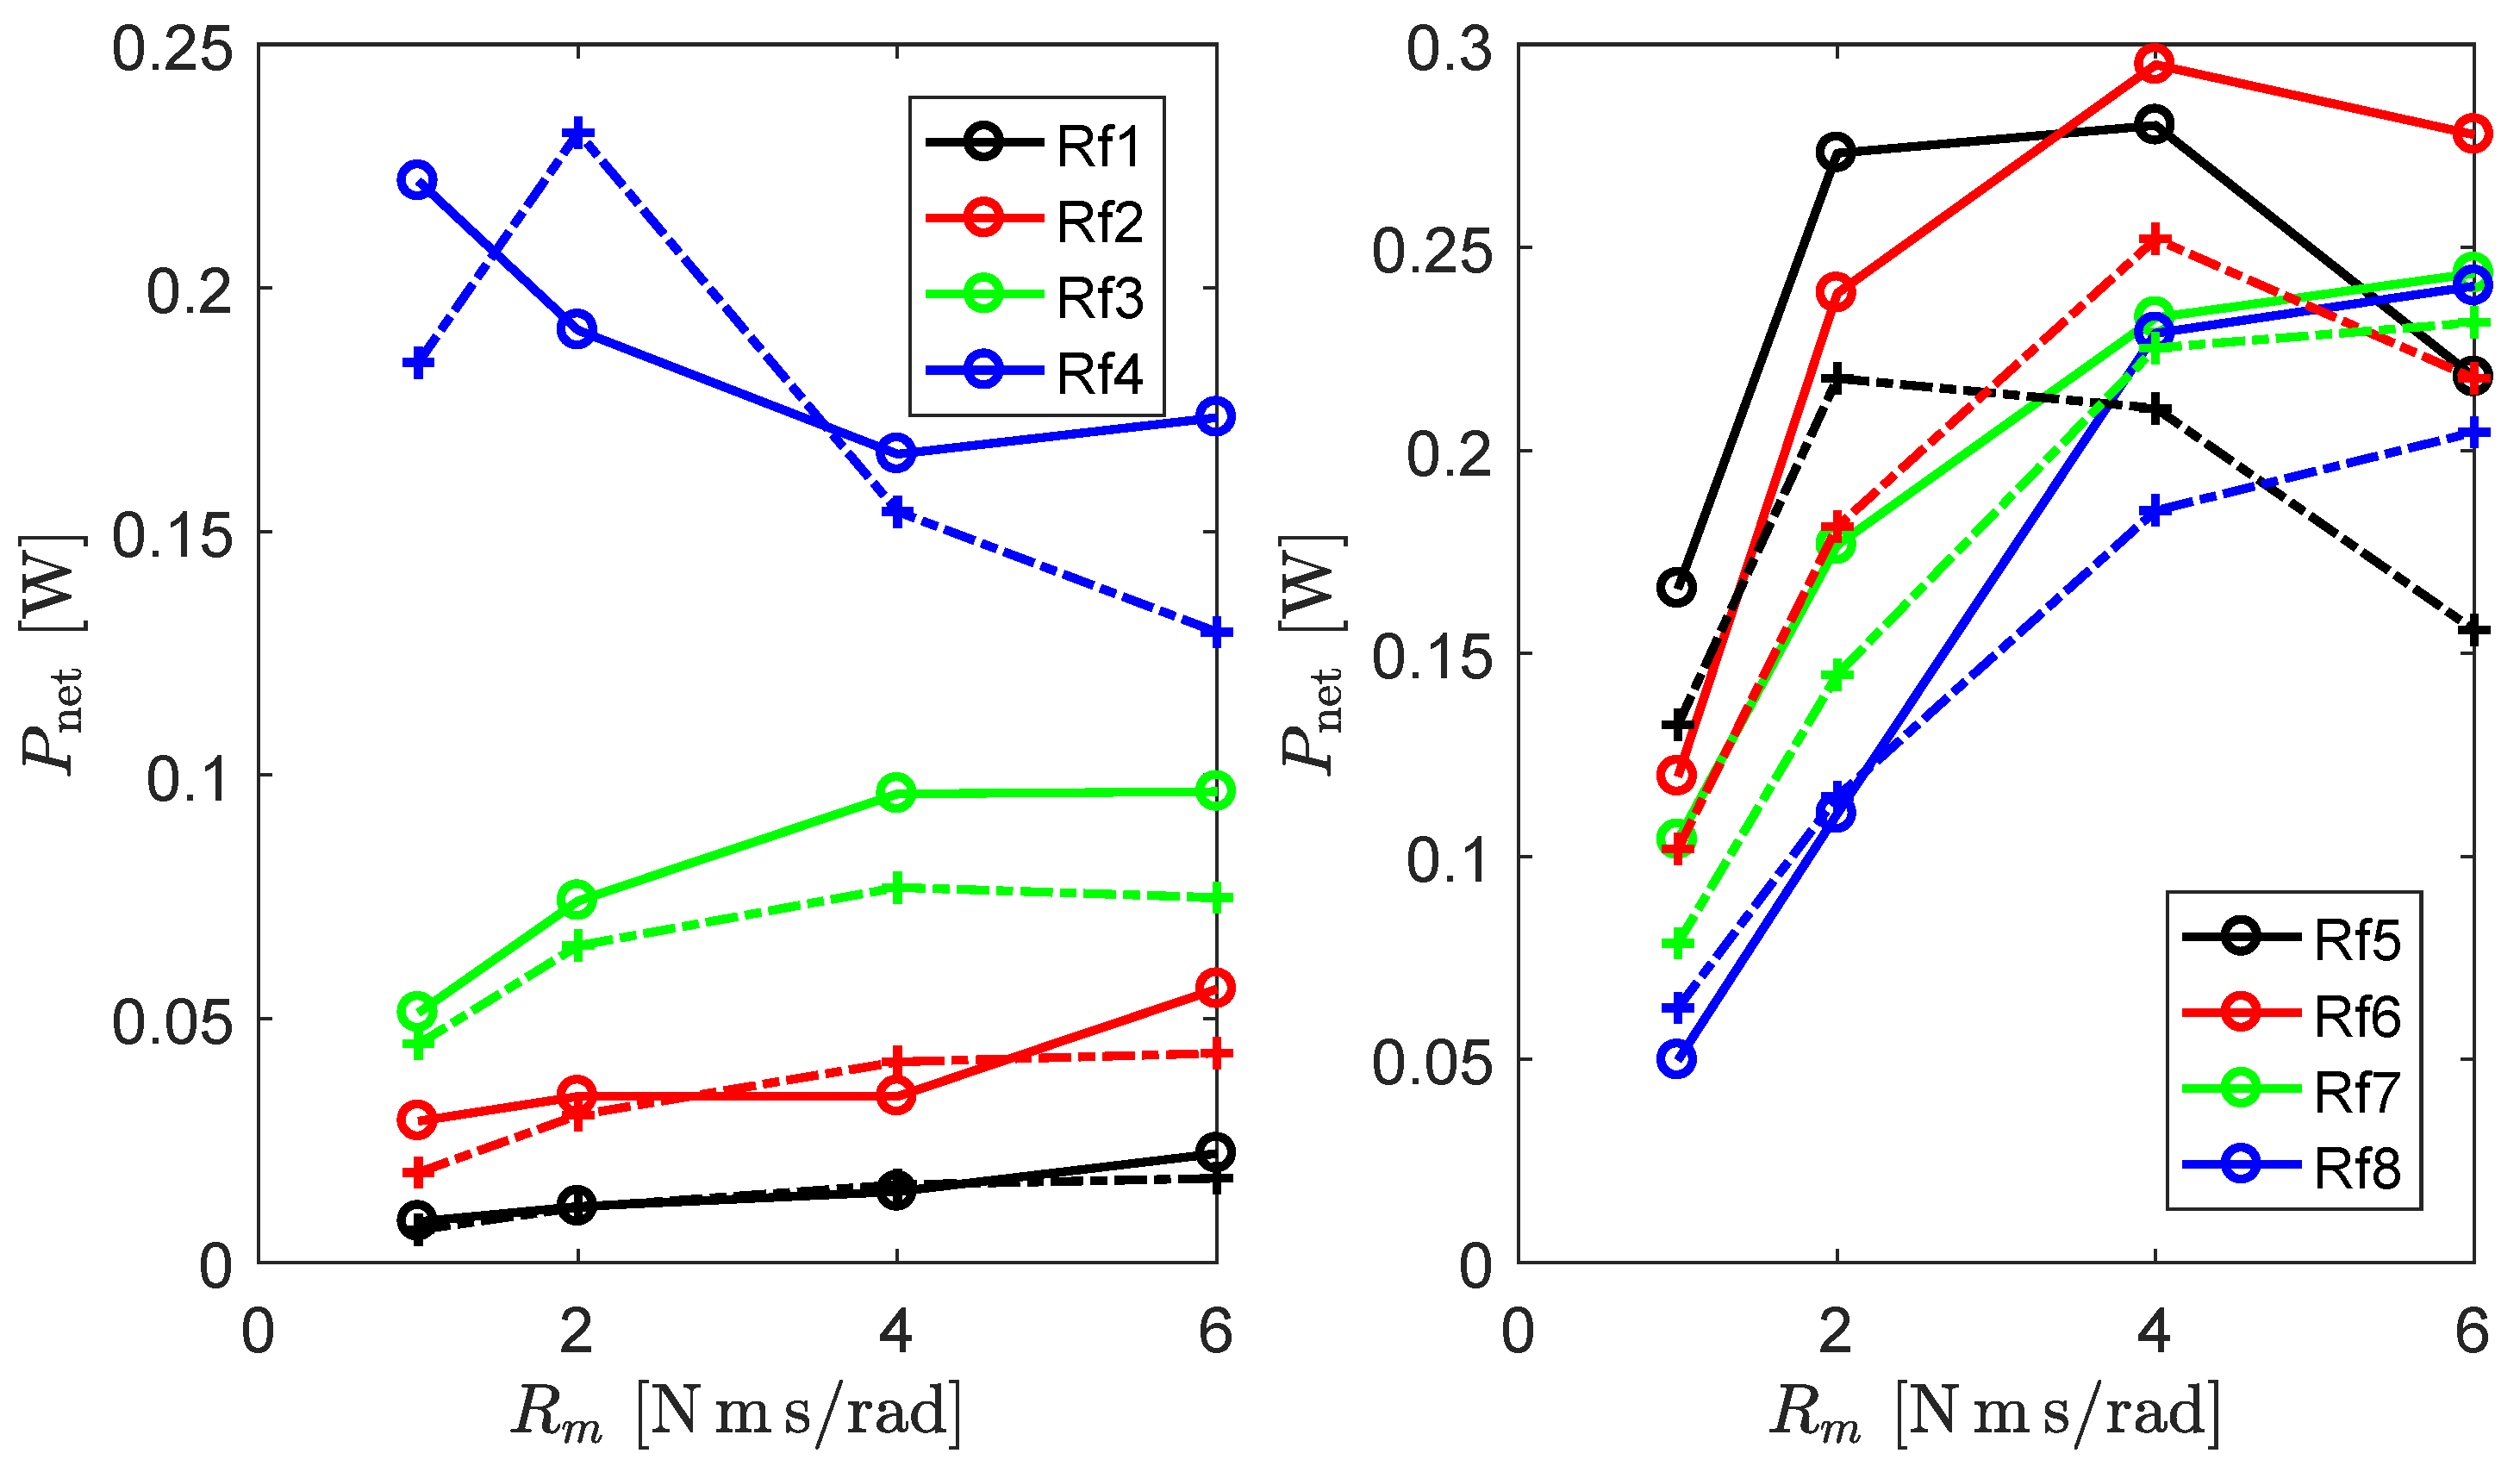
5.6.2. Power Absorption in Regular Waves
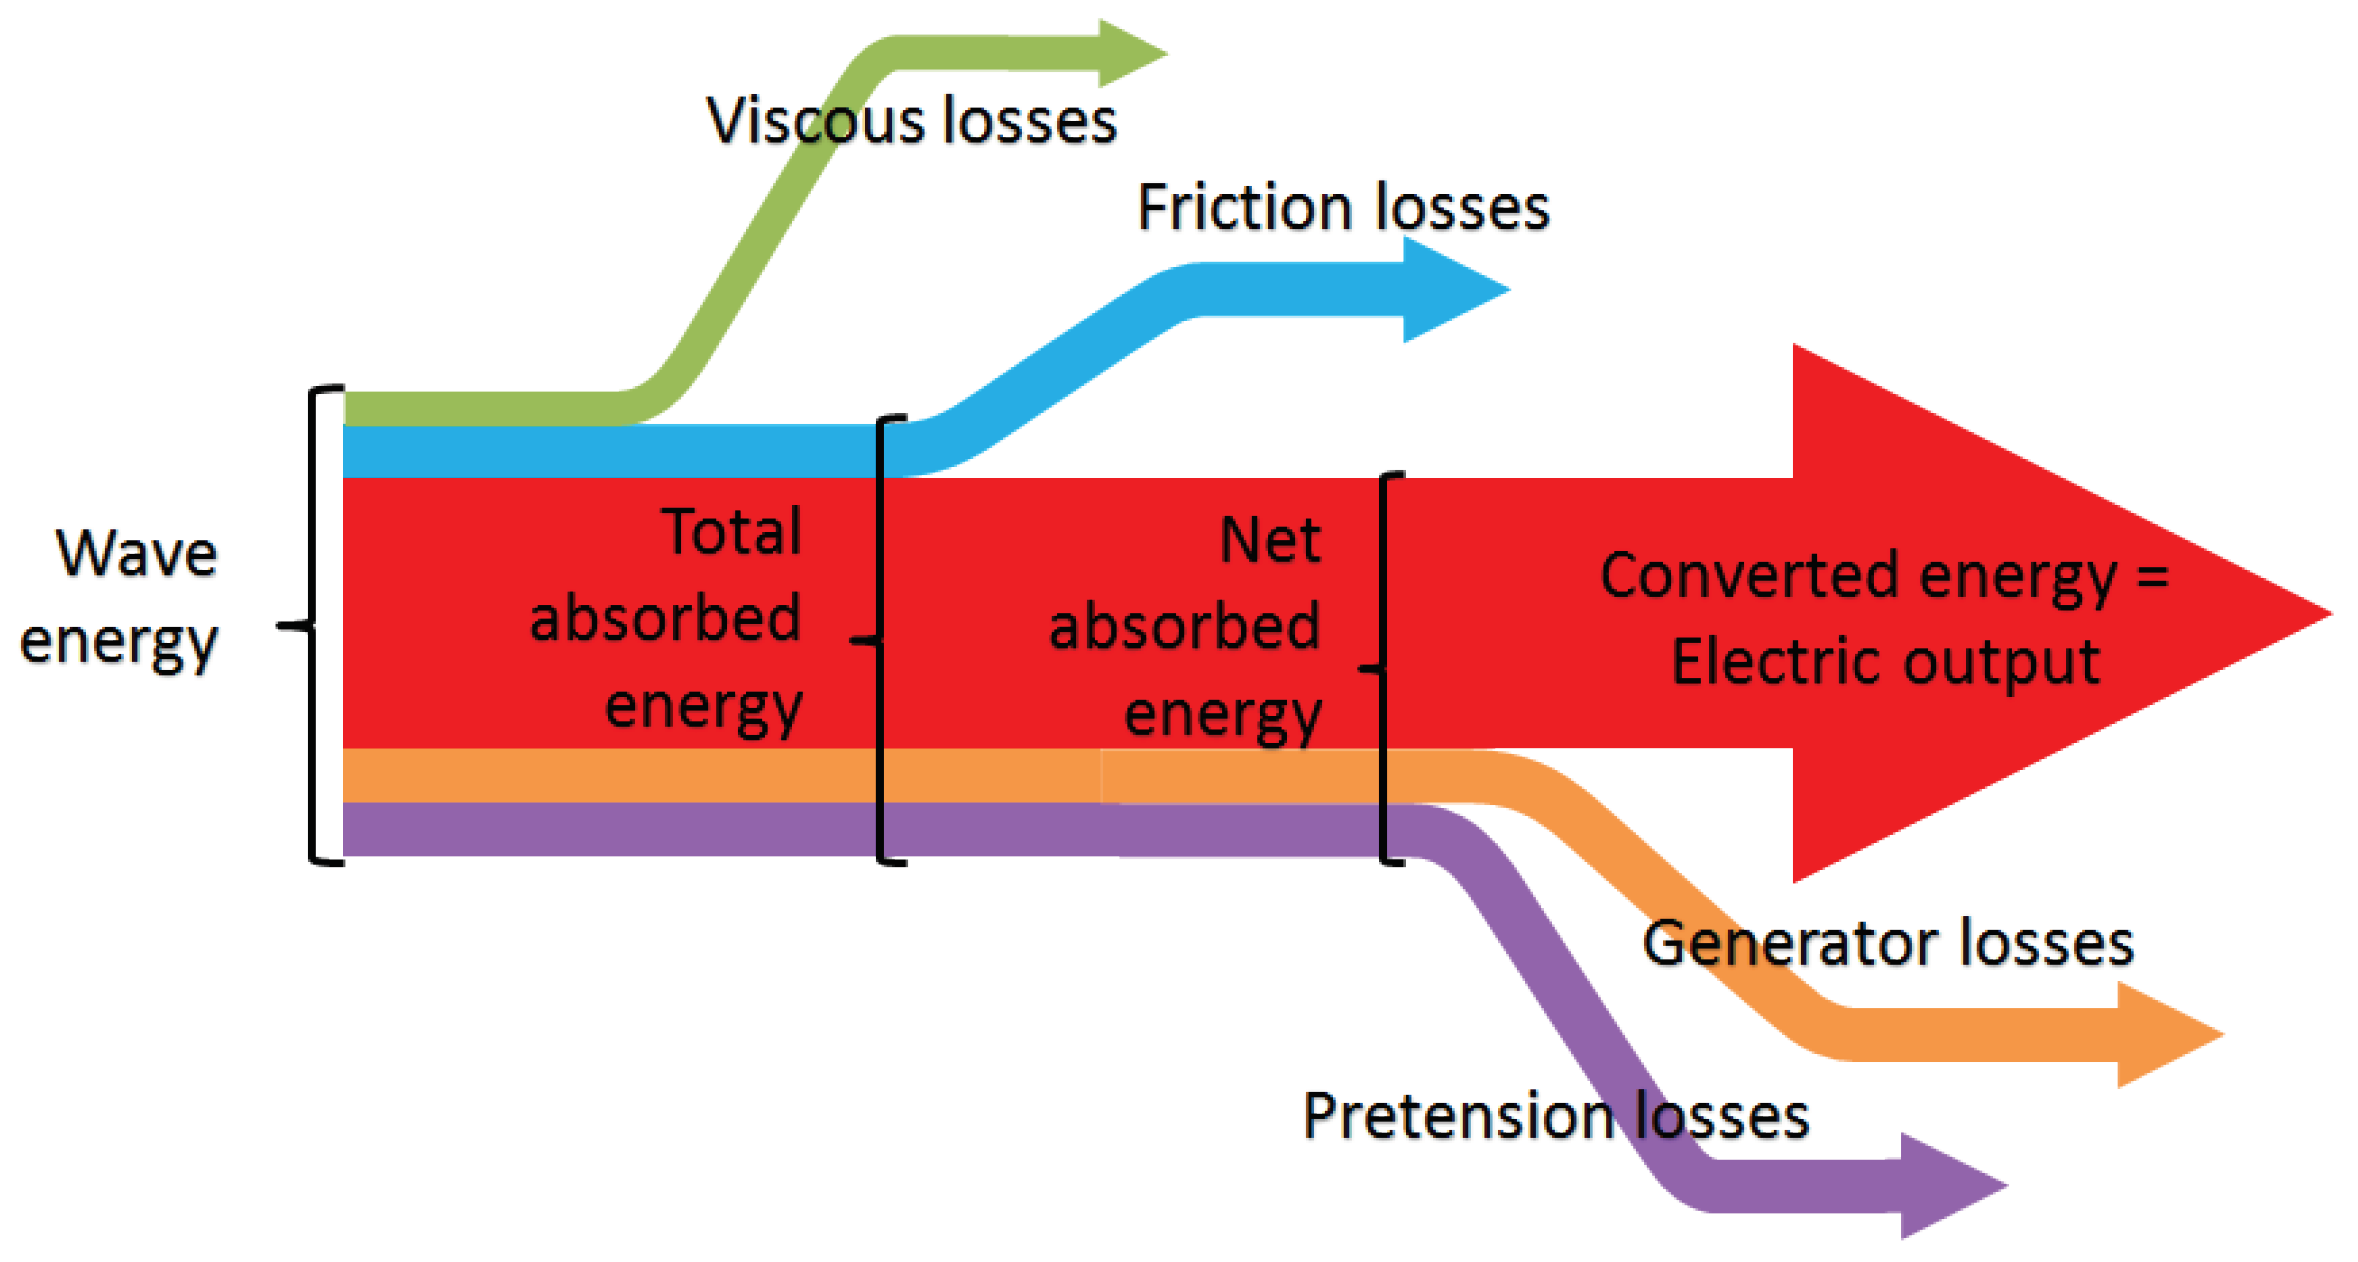
- Wave energy: Total energy taken from the wave field.
- Total absorbed energy: Total energy absorbed into the mechanical system from the water.
- Net absorbed energy: Absorbed energy as measured on the load cell between the actuator and the rotating arm that holds the buoy. Losses between total absorbed energy and net absorbed energy include friction losses in the shaft bearings and the WaveSpring mechanism.
- Converted energy: Derived quantity based on subtracting assumed losses between net absorbed energy and electrical energy output, notably losses in the electric generator and the pretension system. The generator losses are estimated based on the conversion efficiency for a typical electric generator. When the system works with pretension, some energy will be lost in the pretension mechanism. This loss is computed as a loss fraction on the pretension torque, .
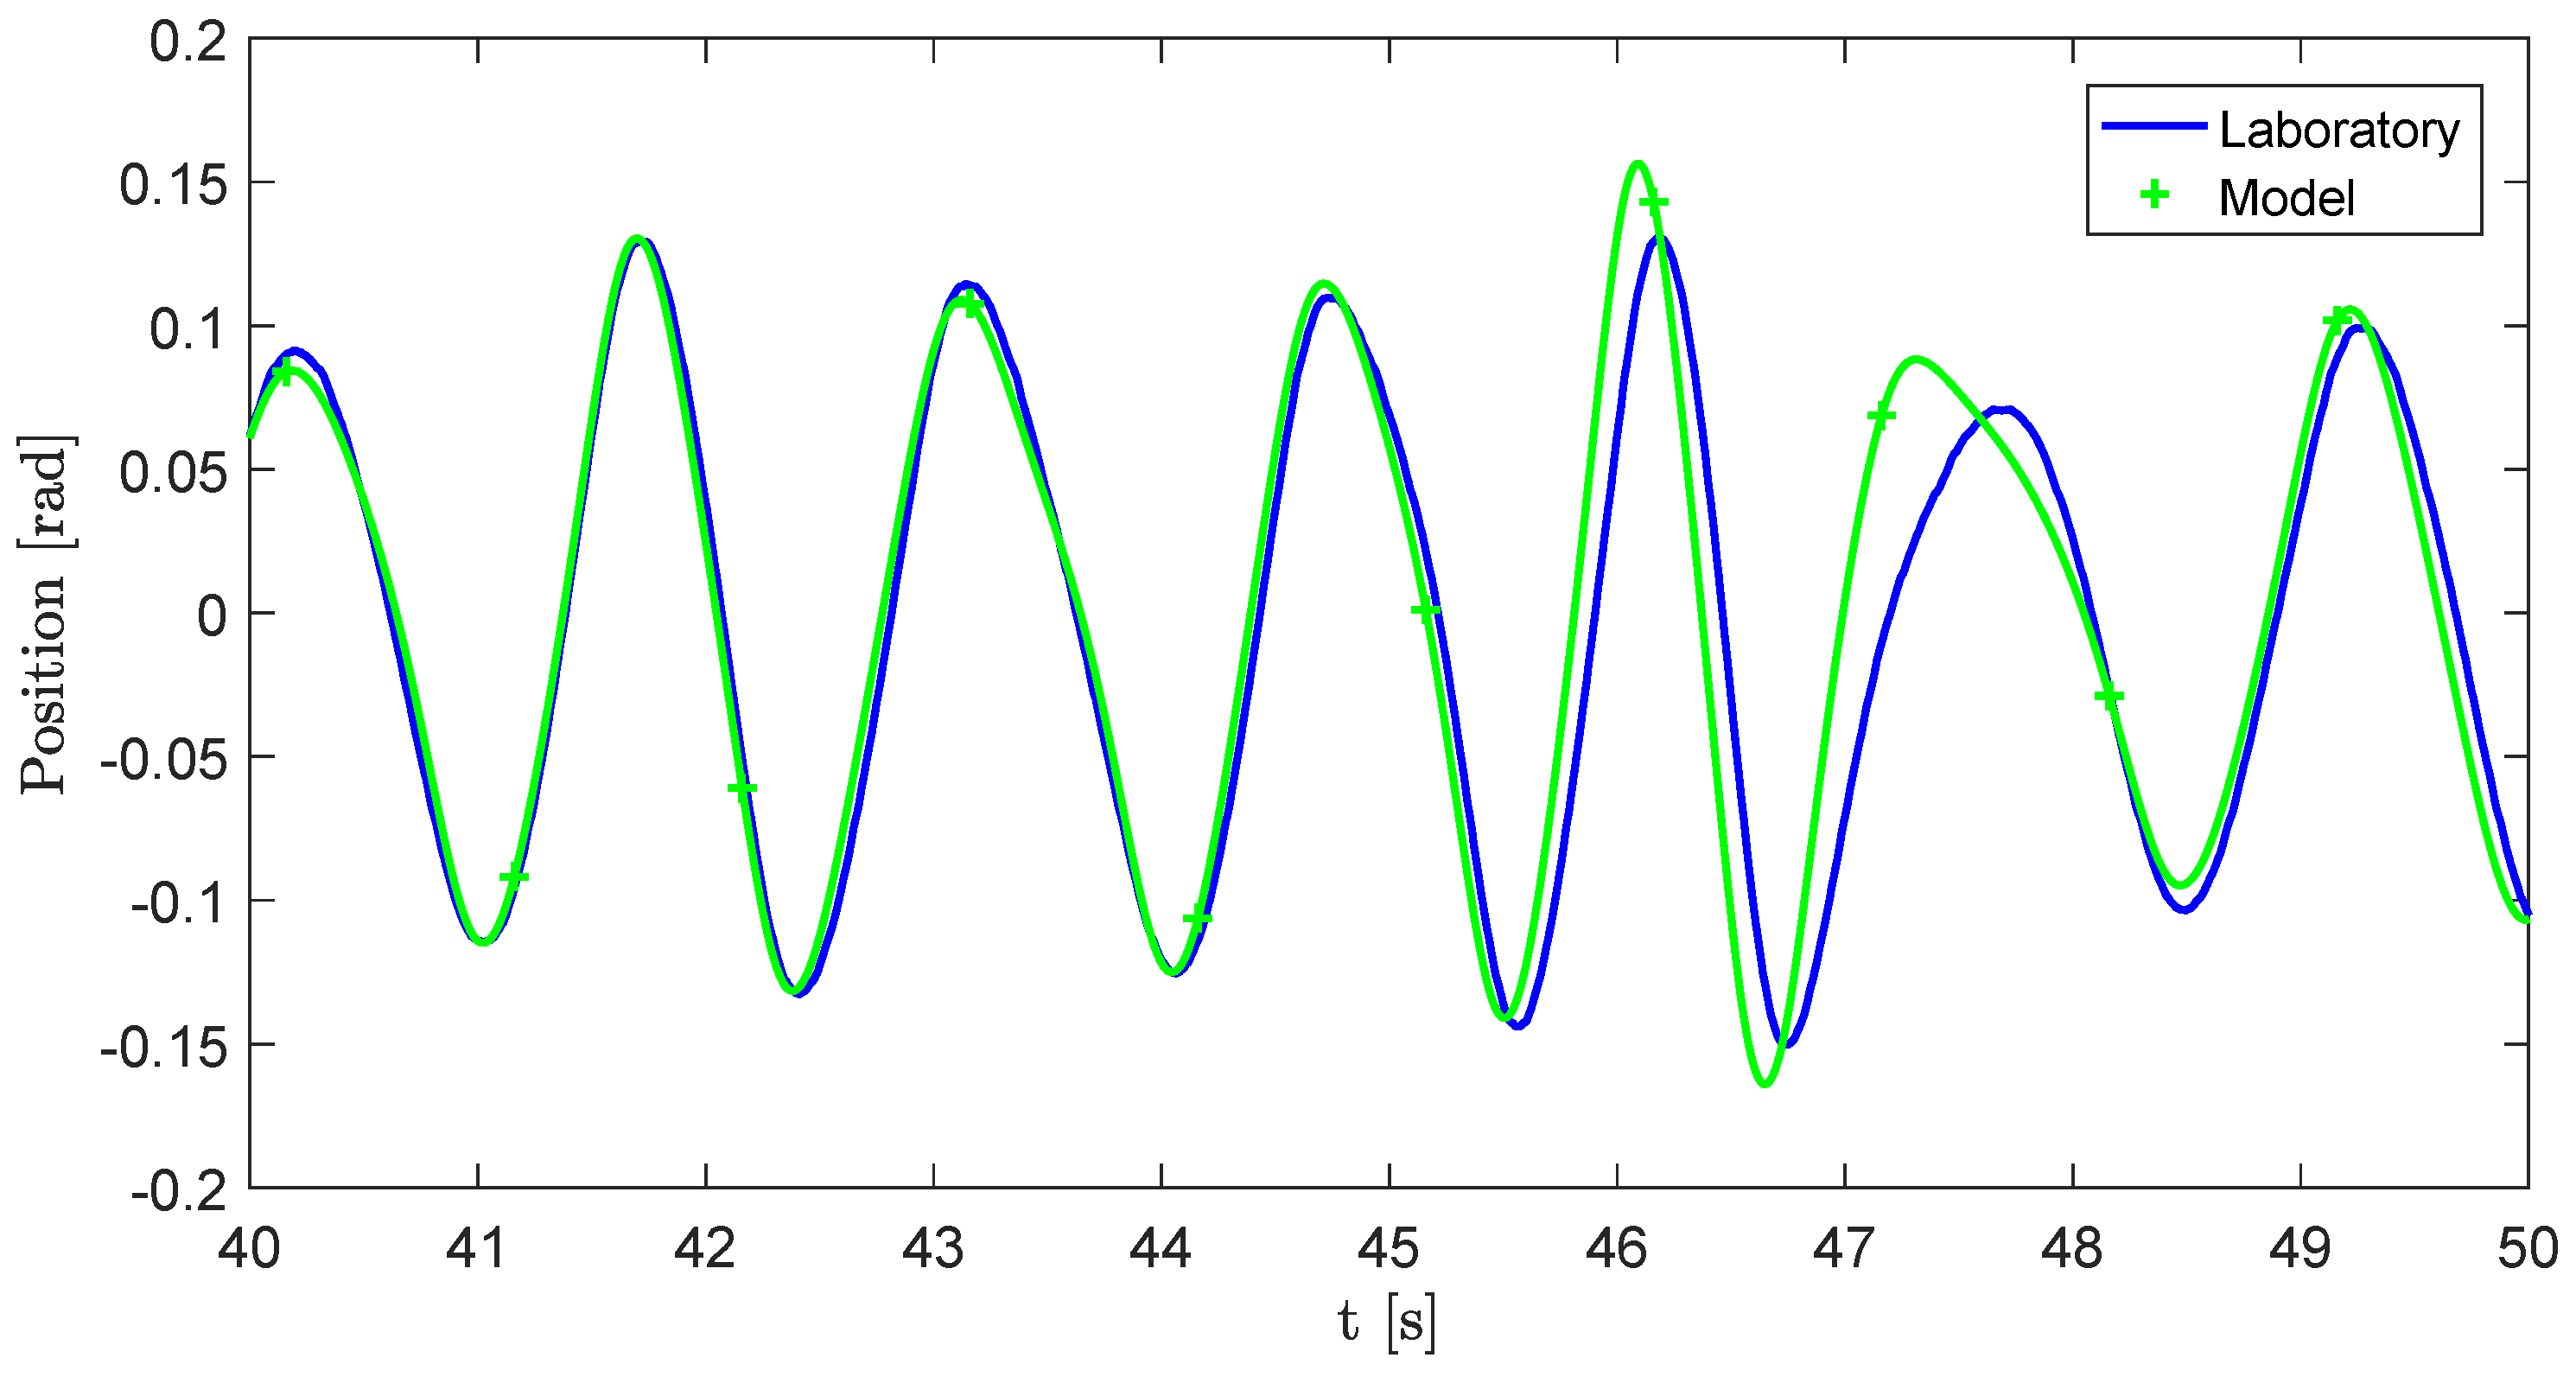
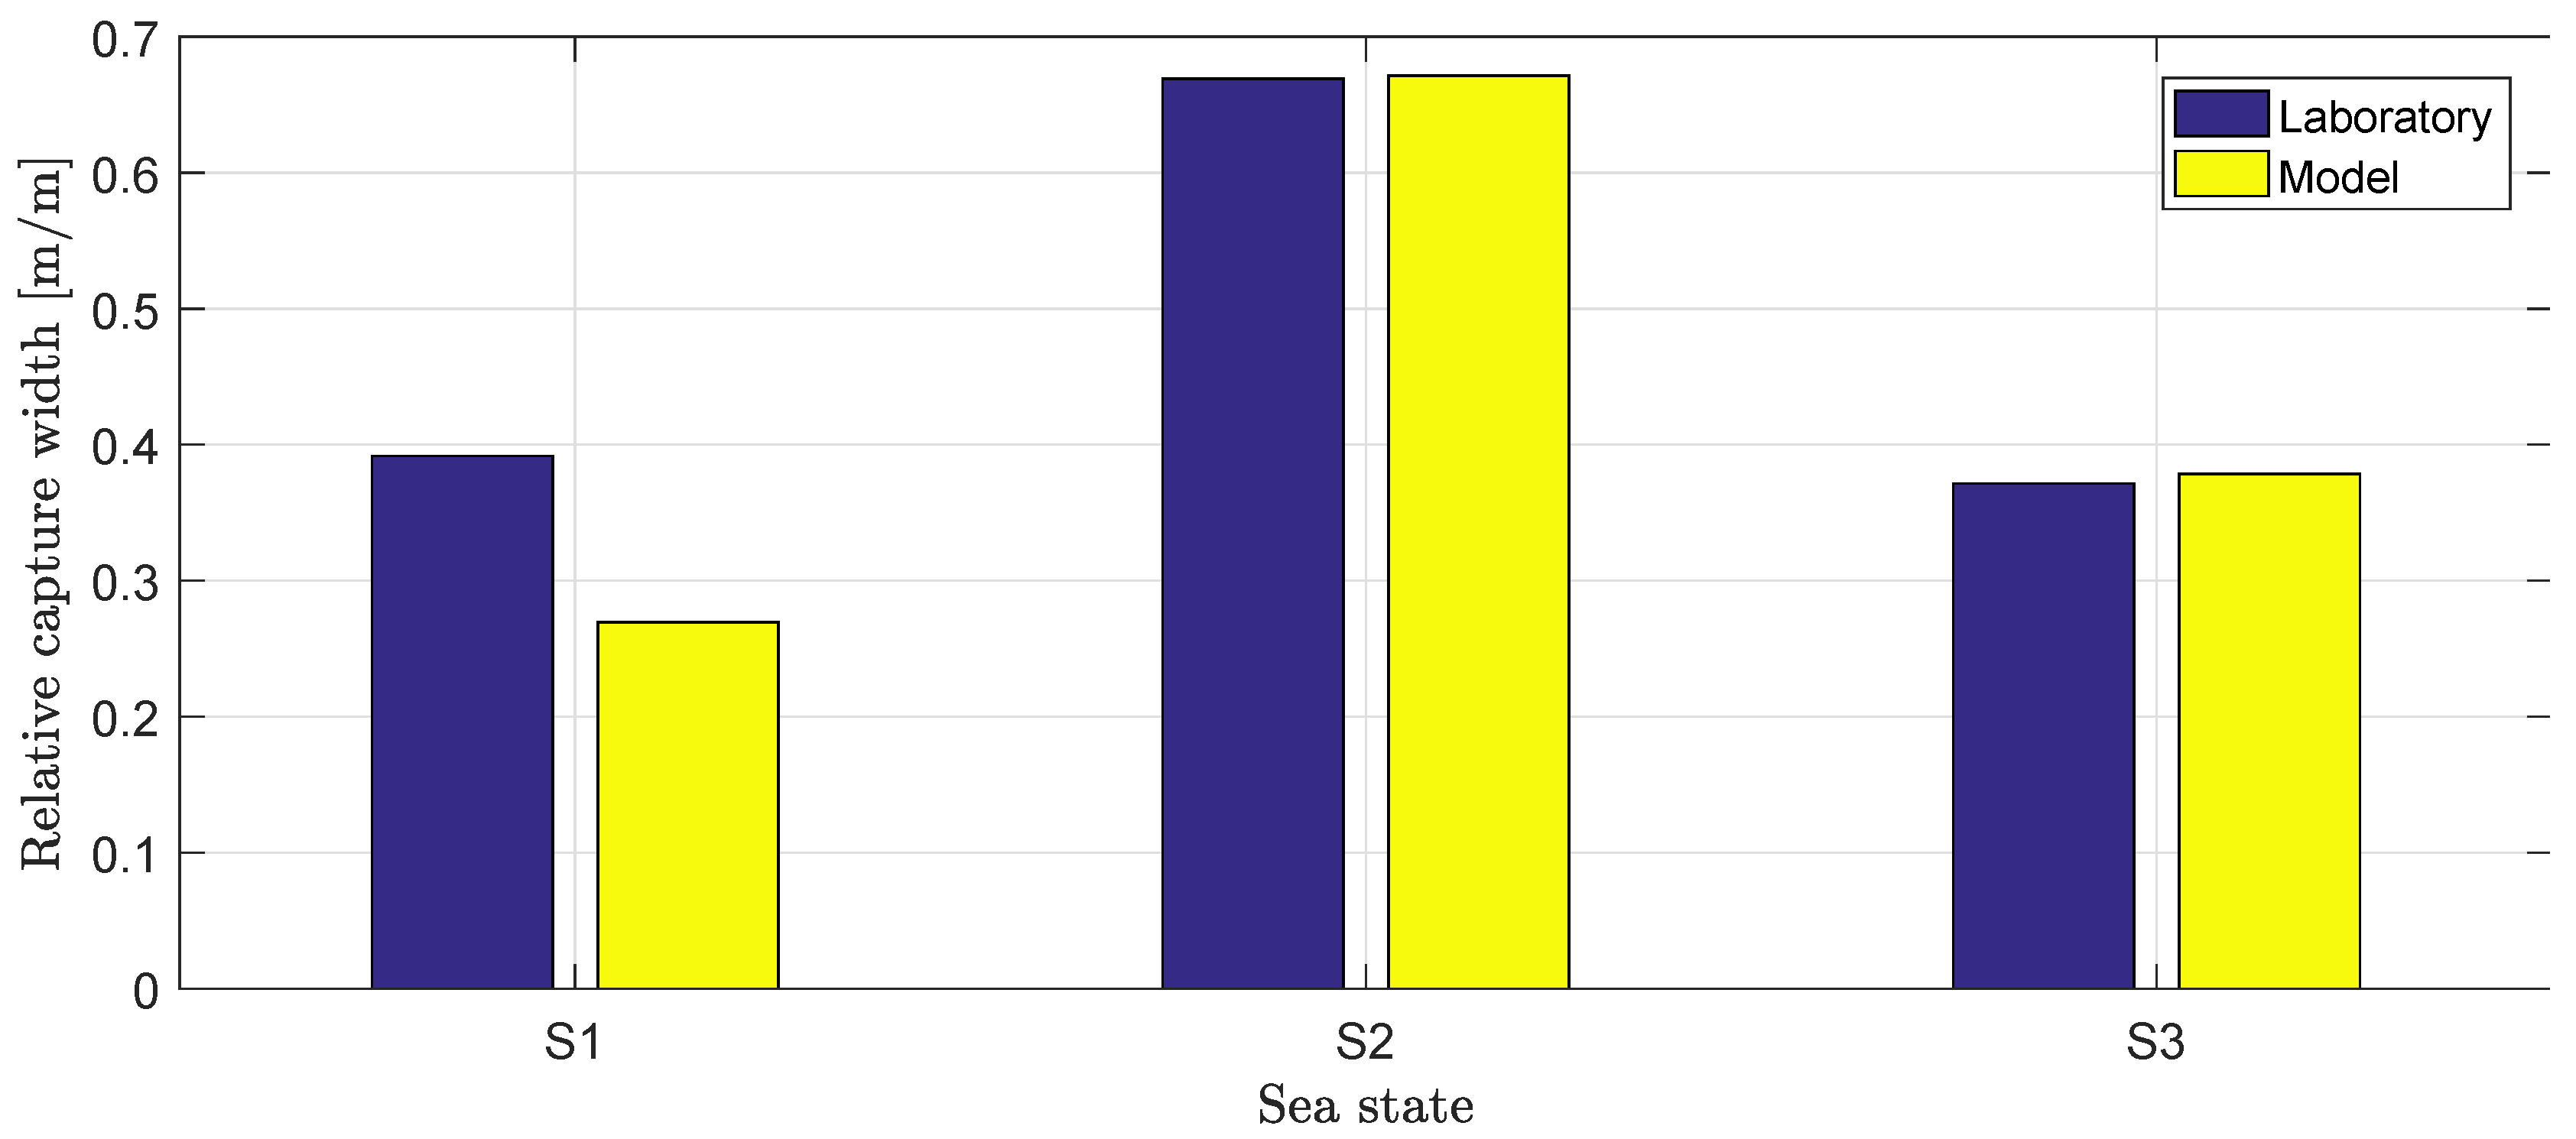
5.6.3. Mathematical Model Validation
5.7. Irregular Wave Results
6. Conclusions
Author Contributions
Funding
Acknowledgments
Conflicts of Interest
Appendix A. List of Tests Performed during the Experimental Campaign

| Run ID | Setup | Wave Type | [Nm/rad] | [Nm s/rad] | [Nm] |
|---|---|---|---|---|---|
| A001 | Setup 1 | Rf1 | 0 | 3.64 | 0 |
| A002 | Setup 1 | Rf2 | 0 | 3.53 | 0 |
| A003 | Setup 1 | Rf3 | 0 | 7.31 | 0 |
| A004 | Setup 1 | Rf4 | 0 | 11.30 | 0 |
| A005 | Setup 1 | Rf5 | 0 | 15.12 | 0 |
| A006 | Setup 1 | Rf6 | 0 | 18.78 | 0 |
| A007 | Setup 1 | Rf7 | 0 | 22.31 | 0 |
| A008 | Setup 1 | Rf8 | 0 | 25.73 | 0 |
| A009 | Setup 2 | S2 | 0 | 11.56 | 8 |
| A010 | Setup 2 | Rf2 | 0 | 6.11 | 8 |
| A011 | Setup 2 | Rf4 | 0 | 13.12 | 8 |
| A012 | Setup 2 | Rf6 | 0 | 19.95 | 8 |
| A013 | Setup 2 | S2 | −59 | 6 | 8 |
| A014 | Setup 2 | S2 | −40 | 4 | 8 |
| A015 | Setup 2 | S2 | −59 | 4 | 8 |
| A016 | Setup 3 | Rf1 | 0 | 1.00 | 7.4 |
| A017 | Setup 3 | Rf1 | 0 | 2.00 | 7.4 |
| A018 | Setup 3 | Rf1 | 0 | 4.00 | 7.4 |
| A019 | Setup 3 | Rf1 | 0 | 6.00 | 7.4 |
| A020 | Setup 3 | Rf2 | 0 | 1.00 | 7.4 |
| A021 | Setup 3 | Rf2 | 0 | 2.00 | 7.4 |
| A022 | Setup 3 | Rf2 | 0 | 4.00 | 7.4 |
| A023 | Setup 3 | Rf2 | 0 | 6.00 | 7.4 |
| A024 | Setup 3 | Rf3 | 0 | 1.00 | 7.4 |
| A025 | Setup 3 | Rf3 | 0 | 2.00 | 7.4 |
| A026 | Setup 3 | Rf3 | 0 | 4.00 | 7.4 |
| A027 | Setup 3 | Rf3 | 0 | 6.00 | 7.4 |
| A028 | Setup 3 | Rf4 | 0 | 1.00 | 7.4 |
| A029 | Setup 3 | Rf4 | 0 | 2.00 | 7.4 |
| A030 | Setup 3 | Rf4 | 0 | 4.00 | 7.4 |
| A031 | Setup 3 | Rf4 | 0 | 6.00 | 7.4 |
| A032 | Setup 3 | Rf5 | 0 | 1.00 | 7.4 |
| A033 | Setup 3 | Rf5 | 0 | 2.00 | 7.4 |
| A034 | Setup 3 | Rf5 | 0 | 4.00 | 7.4 |
| A035 | Setup 3 | Rf5 | 0 | 6.00 | 7.4 |
| A036 | Setup 3 | Rf6 | 0 | 1.00 | 7.4 |
| A037 | Setup 3 | Rf6 | 0 | 2.00 | 7.4 |
| A038 | Setup 3 | Rf6 | 0 | 4.00 | 7.4 |
| A039 | Setup 3 | Rf6 | 0 | 6.00 | 7.4 |
| A040 | Setup 3 | Rf7 | 0 | 1.00 | 7.4 |
| A041 | Setup 3 | Rf7 | 0 | 2.00 | 7.4 |
| A042 | Setup 3 | Rf7 | 0 | 4.00 | 7.4 |
| A043 | Setup 3 | Rf7 | 0 | 6.00 | 7.4 |
| A044 | Setup 3 | Rf8 | 0 | 1.00 | 7.4 |
| A045 | Setup 3 | Rf8 | 0 | 2.00 | 7.4 |
| A046 | Setup 3 | Rf8 | 0 | 4.00 | 7.4 |
| A047 | Setup 3 | Rf8 | 0 | 6.00 | 7.4 |
| A048 | Setup 3 | S1 | 0 | 6.00 | 7.4 |
| A049 | Setup 3 | S2 | 0 | 3.37 | 7.4 |
| A050 | Setup 3 | S3 | 0 | 3.00 | 7.4 |
| A051 | Setup 3 | S4 | 0 | 10.00 | 7.6 |
| A052 | Setup 3 | Sweep | 0 | 3.5 | 7.6 |
| A053 | Setup 4 | S1234 | 0 | 4 | 7.6 |
| A054 | Setup 4 | Sweep1min | 0 | 4 | 7.6 |
| A055 | Setup 4 | Rf1 | 0 | 4 | 7.6 |
| A056 | Setup 4 | Rf2 | 0 | 4 | 7.6 |
| A057 | Setup 4 | Rf3 | 0 | 4 | 7.6 |
| A058 | Setup 4 | Rf4 | 0 | 4 | 7.6 |
| A059 | Setup 4 | Rf5 | 0 | 4 | 7.6 |
| A060 | Setup 4 | Rf6 | 0 | 4 | 7.6 |
| A061 | Setup 4 | Rf7 | 0 | 4 | 7.6 |
| A062 | Setup 4 | Rf8 | 0 | 4 | 7.6 |
| A063 | Setup 4 | S1 | 0 | 4 | 7.6 |
| A064 | Setup 4 | S2 | 0 | 4 | 7.6 |
| A065 | Setup 4 | S3 | 0 | 4 | 7.6 |
| A066 | Setup 5 | S2 | 0 | 4 | −0.6 |
| A067 | Setup 5 | Rf2 | 0 | 6.90 | −0.6 |
| A068 | Setup 5 | Rf4 | 0 | 2.45 | −0.6 |
| A069 | Setup 5 | Rf6 | 0 | 1.72 | −0.6 |
| A070 | Setup 5 | S1234 | 0 | 4 | −0.6 |
| A071 | Setup 5 | Sweep1min | 0 | 4 | −0.6 |
References
- Hals, J.; Bjarte-Larsson, T.; Falnes, J. Optimum reactive control and control by latching of a wave-absorbing semisubmerged heaving sphere. In Proceedings of the International Conference on Offshore Mechanics and Arctic Engineering, Oslo, Norway, 23–28 June 2002. [Google Scholar]
- Cretel, J.; Lightbody, G.; Thomas, G.; Lewis, A. Maximisation of Energy Capture by a Wave-Energy Point Absorber using Model Predictive Control. Available online: http://folk.ntnu.no/skoge/prost/proceedings/ifac11-proceedings/data/html/papers/3255.pdf (accessed on 10 July 2018).
- Ringwood, J.; Bacelli, G.; Francesco, F. Energy-Maximizing Control of Wave-Energy Converters: The Development of Control System Technology to Optimize Their Operation. IEEE Control Syst. Mag. 2014, 6, 30–55. [Google Scholar] [CrossRef]
- Van Niekerk, J.L.; de Fallaux Retief, G. Wave energy convertor, 2015. U.S. Patent 1,313,2206, 10 December 2008. [Google Scholar]
- Zhang, X.; Yang, J.; Xiao, L. Numerical study of an oscillating wave energy converter with nonlinear snap-through Power-Take-Off systems in regular waves. J. Ocean Wind Energy 2014, 10, 225–230. [Google Scholar]
- Todalshaug, J.H.; Ásgeirsson, G.S.; Hjálmarsson, E.; Maillet, J.; Möller, P.; Pires, P.; Guérinel, M.; Lopes, M. Tank testing of an inherently phase-controlled wave energy converter. Int. J. Mar. Energy 2016, 15, 68–84. [Google Scholar] [CrossRef]
- Zhang, X.; Yang, J. Power capture performance of an oscillating-body WEC with nonlinear snap through PTO systems in irregular waves. Appl. Ocean Res. 2015, 52, 261–273. [Google Scholar] [CrossRef]
- Zurkinden, A.; Ferri, F.; Beatty, S.; Kofoed, J.; Kramer, M. Non-linear numerical modeling and experimental testing of a point absorber wave energy converter. Ocean Eng. 2014, 78, 11–21. [Google Scholar] [CrossRef]
- Zurkinden, A.S.; Kramer, M.M.; Ferri, F.; Kofoed, J.P. Numerical Modeling and Experimental Testing of a Wave Energy Converter: Deliverable D4.2; Department of Civil Engineering, Aalborg University: Aalborg, Denmark, 2013. [Google Scholar]
- Kramer, M.; Marquis, L.; Frigaard, P. Performance Evaluation of the Wavestar Prototype. In Proceedings of the 9th European Wave and Tidal Energy Conference, Southampton, UK, 5–9 September 2011. [Google Scholar]
- Wahl, A.M. Mechanical Springs, 2nd ed.; Penton Publishing Company: Cleveland, OH, USA, 1963. [Google Scholar]
- Beatty, S.; Ferri, F.; Bocking, B.; Kofoed, J.P.; Buckham, B. Power Take-Off Simulation for Scale Model Testing of Wave Energy Converters. Energies 2017, 10, 973. [Google Scholar] [CrossRef]
- WAMIT User Manual. 2006. Available online: http://www.wamit.com (accessed on 10 July 2018).
- Jefferys, E.R. Simulation of wave power devices. Appl. Ocean Res. 1984, 6, 31–39. [Google Scholar] [CrossRef]
- Taghipour, R.; Perez, T.; Moan, T. Hybrid Frequency-Time domain models for dynamic response analysis of Marine Structures. Ocean Eng. 2008, 35, 685–705. [Google Scholar] [CrossRef]
- Morison, J.R.; O’Brien, M.P.; Johnson, J.W.; Schaaf, S.A. The forces exerted by surface waves on piles. J. Pet. Technol. 1950, 189, 149–157. [Google Scholar] [CrossRef]
- Falnes, J. Ocean Waves and Oscillating Systems: Linear Interactions Including Wave-Energy Extraction; Cambridge University Press: Cambridge, UK, 2002. [Google Scholar]


| Quantity | Unit | Setup 2/3 | Setup 4 | Setup 1/5 |
|---|---|---|---|---|
| Mass of buoy—lever and attachments | kg | 2.564 | 2.564 | 4.210 |
| Mass of WaveSpring bracket | kg | 0.027 | 0.027 | 0.027 |
| Estimated moment of inertia | kg m | 0.430 | 0.430 | 0.900 |
| Buoy diameter | m | 0.263 | 0.263 | 0.263 |
| Buoy total volume | dm | 7.28 | 7.28 | 7.28 |
| Buoy submerged volume (hemisphere) | dm | 3.45 | 3.45 | 3.45 |
| Waterline beam | m | 0.256 | 0.256 | 0.256 |
| Height of cylindrical part of bouy | m | 0.050 | 0.050 | 0.050 |
| Height of point A above MWL | m | 0.285 | 0.285 | 0.285 |
| Distance : | m | 0.510 | 0.510 | 0.510 |
| Distance | m | 0.470 | 0.470 | 0.470 |
| Distance | m | 0.400 | 0.405 | 0.405 |
| Distance | m | 0.320 | 0.320 | 0.320 |
| Distance | m | 0.090 | 0.090 | 0.090 |
| Distance : | m | 0.306 | 0.306 | 0.400 |
| Angle of line with horizontal | deg | −34.0 | −34.0 | −34.0 |
| Angle of line with horizontal | deg | −28.5 | −28.5 | −25.9 |
| Coil spring natural length | m | 0.165 | 0.165 | 0.165 |
| Shortest spring length | m | 0.130 | 0.135 | 0.135 |
| Coil spring number of turns | m | 58 | 58 | 58 |
| Coil spring thread diameter | mm | 1.50 | 1.50 | 1.50 |
| Inner coil diameter | mm | 7.0 | 7.0 | 7.0 |
| Coil spring fabricant | —– Lesjøfors 3992 —– | |||
| Approximate spring stiffness | kN/m | 1.32 | 1.32 | 1.32 |
| Spring stiffness estimated from measurements, | kN/m | 1.50 | 1.50 | 1.50 |
| Acronym | Description | Mass of the Buoy [kg] | Shortest Spring Length [m] |
|---|---|---|---|
| Setup 1 | No WaveSpring, large mass | 4.210 | - |
| Setup 2 | No WaveSpring, small mass | 2.564 | - |
| Setup 3 | With WaveSpring, small mass | 2.564 | 0.130 |
| Setup 4 | Softer WaveSpring, small mass | 2.564 | 0.135 |
| Setup 5 | Softer WaveSpring, large mass | 4.210 | 0.135 |
| Name | Wave Period | Wave Height | ||
|---|---|---|---|---|
| Target | Measured | Reference | ||
| Rf1 | 0.7 | 0.0300 | 0.0293 | 0.0250 |
| Rf2 | 0.9 | 0.0300 | 0.0270 | 0.0250 |
| Rf3 | 1.1 | 0.0300 | 0.0250 | 0.0250 |
| Rf4 | 1.3 | 0.0300 | 0.0250 | 0.0250 |
| Rf5 | 1.5 | 0.0300 | 0.0230 | 0.0250 |
| Rf6 | 1.7 | 0.0300 | 0.0236 | 0.0250 |
| Rf7 | 1.9 | 0.0300 | 0.0236 | 0.0250 |
| Rf8 | 2.1 | 0.0300 | 0.0225 | 0.0250 |
| Seastate | |||
|---|---|---|---|
| S1 | 0.0193 | 0.778 | 0.869 |
| S2 | 0.0556 | 1.029 | 1.205 |
| S3 | 0.0895 | 1.334 | 1.596 |
| Measurement | Unit | Uncertainty |
|---|---|---|
| Nm | 0.05 | |
| v | rad/s | 0.03 |
| rad/s | 0.02 |
| Configuration | Stiffness [Nm/rad] | Resonance Period [s] | ||||
|---|---|---|---|---|---|---|
| Mean | Peak | at | ||||
| Setup 1 | 88.5 | 95.6 | 91.5 | 0.807 | 0.770 | 0.791 |
| Setup 2 | 85.4 | 93.8 | 89.3 | 0.637 | 0.599 | 0.619 |
| Setup 3 | 33.4 | 9.13 | 21.4 | 1.15 | 2.31 | 1.47 |
| Setup 4 | 42.3 | 23.2 | 29.0 | 1.00 | 1.41 | 1.25 |
| Setup 5 | 45.2 | 26.3 | 32.8 | 1.18 | 1.58 | 1.40 |
© 2018 by the authors. Licensee MDPI, Basel, Switzerland. This article is an open access article distributed under the terms and conditions of the Creative Commons Attribution (CC BY) license (http://creativecommons.org/licenses/by/4.0/).
Share and Cite
Têtu, A.; Ferri, F.; Kramer, M.B.; Todalshaug, J.H. Physical and Mathematical Modeling of a Wave Energy Converter Equipped with a Negative Spring Mechanism for Phase Control. Energies 2018, 11, 2362. https://doi.org/10.3390/en11092362
Têtu A, Ferri F, Kramer MB, Todalshaug JH. Physical and Mathematical Modeling of a Wave Energy Converter Equipped with a Negative Spring Mechanism for Phase Control. Energies. 2018; 11(9):2362. https://doi.org/10.3390/en11092362
Chicago/Turabian StyleTêtu, Amélie, Francesco Ferri, Morten Bech Kramer, and Jørgen Hals Todalshaug. 2018. "Physical and Mathematical Modeling of a Wave Energy Converter Equipped with a Negative Spring Mechanism for Phase Control" Energies 11, no. 9: 2362. https://doi.org/10.3390/en11092362
APA StyleTêtu, A., Ferri, F., Kramer, M. B., & Todalshaug, J. H. (2018). Physical and Mathematical Modeling of a Wave Energy Converter Equipped with a Negative Spring Mechanism for Phase Control. Energies, 11(9), 2362. https://doi.org/10.3390/en11092362