Article

Stress and Deformation Analysis of Buried Gas Pipelines Subjected to Buoyancy in Liquefaction Zones

1
College of Mechanical and Transportation Engineering, China University of Petroleum-Beijing, Beijing 102249, China
2
National Engineering Laboratory for Pipeline Safety, Beijing Key Laboratory of Urban Oil and Gas Distribution Technology, China University of Petroleum-Beijing, Beijing 102249, China
*
Author to whom correspondence should be addressed.
Energies 2018, 11(9), 2334; https://doi.org/10.3390/en11092334
Submission received: 8 August 2018 / Revised: 29 August 2018 / Accepted: 4 September 2018 / Published: 4 September 2018
(This article belongs to the Section D: Energy Storage and Application)

Abstract

:
Buried pipelines are the main means of long distance transportation of natural gas. These pipelines are in high risk crossing liquefaction areas due to large deformations and stresses that may exist in pipe induced by the buoyancy load. In this study, a systematic analytical and numerical analysis were performed to investigate the mechanical behavior of a buried gas pipeline subjected to buoyancy in liquefaction areas. Soil constraints on pipe were considered accurately in the proposed models through soil spring assumptions. Effects of axial forces on pipe’s bending deformation were also considered via the governing equations for beam under bending and tension. Deformation compatibility condition was utilized to derive the axial forces in pipe. The accuracy of the proposed analytical model was validated by comparing its results with those derived by an established rigorous finite element model. In addition, parametric analysis was finally performed using the analytical model to study the influences of pipe diameter, pipe wall thickness, soil spring stiffness and width of liquefaction zone on pipe’s mechanical responses. This study can be referenced in the strength analysis and performance based safety evaluation of buried gas pipelines crossing liquefaction areas.

1. Introduction

As a clean hydrocarbon energy, natural gas’s proportion in the energy consumption in China is growing rapidly in recent years. In 2017, the natural gas production in China is 1480.3 × 108 m3, while the natural gas consumption is 2352 × 108 m3. Due to pipelines play a main role in the transportation of natural gas resources, a large number of pipelines are needed to ensure the continuous supply of natural gas in China [1,2]. These pipelines can be thousands of kilometers long, inevitably crossing some strong seismic areas where liquefaction zones may exist [3]. In liquefaction zones, buried gas pipelines will be subjected to the buoyancy load induced by the liquefied soil, in the potential of leading to larger deformation in the vertical plane and high stresses on the pipe.
A lot of literature is available for buried pipelines subjected to this kind of geo-hazard type environmental load. Wang et al. [4] performed numerical and analytical analysis of floating pipe under distributed line loads induced by floods. In his analytical model pipelines were assumed as cables with no bending stiffness. Li et al. [5] established a refined nonlinear finite element model of pipelines with corrosion defects in a flood. He found that corrosion defects significantly influence a pipe’s structural integrity. Xia et al. [6] proposed a semi-analytical model for buried steel pipelines crossing subsidence areas considering the elastoplasticity of the pipe material and the nonlinear pipe-soil interaction forces. Liu et al. [7,8,9,10,11] studied the strain response of high strength steel pipelines crossing active faults systematically through series of finite element method-based numerical models. In his models, soil constraints on pipe were modeled by nonlinear soil spring elements and pipes were simulated by pipe or shell elements. Semi-empirical models were proposed for pipelines crossing both strike-slip and reverse faults in his studies. Buckling behaviors of pipelines at fault crossings were also elucidated in detail. Uckan et al. [12] and Kaya et al. [13] employed rigorous numerical models to investigate the failure behaviors of steel pipeline exposed to fault displacements. The wrinkling responses of the pipeline in the accident were successfully simulated through their numerical models. Kainat et al. [14] first investigated the local wrinkling behavior of buckling pipeline under compressive stress induced by environmental loads, considering the geometric imperfection of pipeline induced by pipe manufacturing process. Jalali et al. [15,16] studied the mechanical responses of pipes made of different material under fault displacement type go-hazard load. Lu et al. [17] utilized commercial software widely used in pipeline industry, i.e., CAESARII, to analyze the stress results of outlet pipes of LNG storage tanks under external environmental loads. Neupane et al. [18,19] investigated the effects of pipe materials’ plastic anisotropy on the local deformation responses of high strength steel pipelines under environmental bending loads via series of finite element models. Liu et al. [20] studied the stress and deformation response of pipelines with casing under distributed water loads using nonlinear finite element models. Lin et al. [21] investigated the uplift behavior of pipelines crossing liquefaction areas through finite element analysis. Effects of the width of the liquefaction zone on a pipe’s displacement and strain results were discussed. Similar numerical models were established by Ai et al. [22], which focused on investigating the effects of the nonlinear behavior of soils on pipes’ responses. Shang et al. [23] established an analytical stress analysis model on pipelines crossing liquefaction zones without considering the axial force’s influence on a pipe’s bending behavior. Kong et al. [24] performed a parametric analysis on the influences of pipe diameter, pipe burial depth and soil properties on a pipe’s uplift behaviors in liquefaction areas.
The aforementioned studies have illustrated the stress and strain response of pipes under various geo-hazard loads. However, to the best knowledge of the authors, few proposed analytical models are available to analyze the mechanical behavior of pipes subjected to liquefaction induced buoyancy load considering the pipe soil interaction and effects of axial forces on the pipe’s bending deformations. Thus in this presented study, focus was placed on a refined analytical method for pipelines crossing liquefaction areas. Based on the established model, parametric analyses were conducted to study the influences of common engineering parameters on gas pipelines’ mechanical behavior.

2. Performance Based Criteria for Pipelines under Buoyant Forces due to Liquefaction

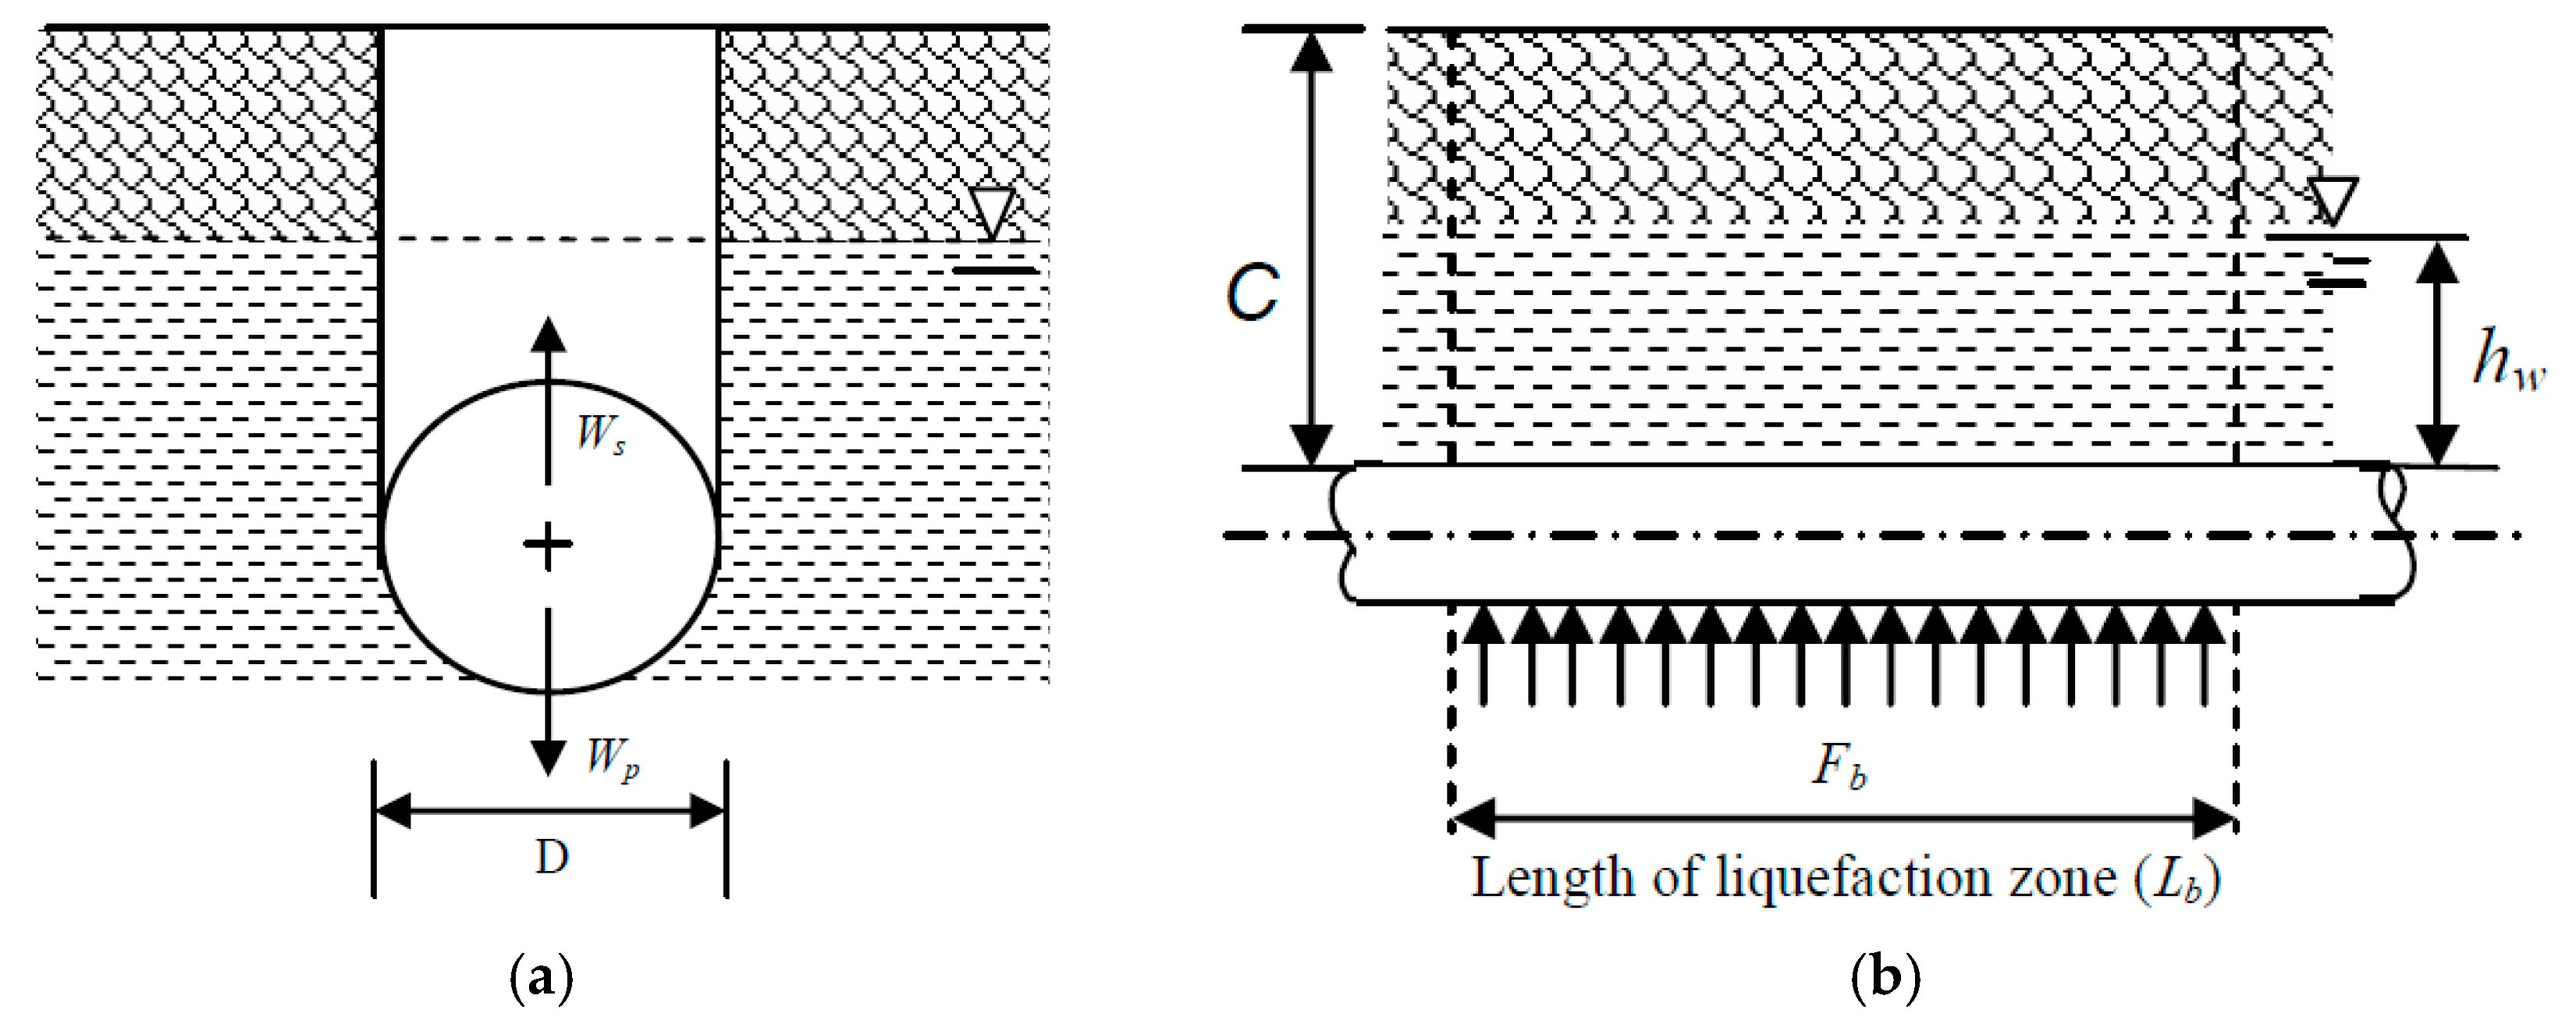
2.1. Buoyant Forces Induce by Liquefaction

Figure 1 shows how the buoyant forces act on pipes. The upward force per unit length of buried pipeline induced by buoyancy in liquefaction area can be calculated as [25]:
F b = W s [ W p + W c + ( P v γ w h w ) D ]  
where Ws is total weight of soil displaced by pipe per unit length; Wp is weight of pipe per unit length; Wc is weight of pipe content per unit length; Pv is vertical earth pressure; D is outside diameter of pipe; γw is unit weight of water; hw is the height of water above the pipeline:
P v = γ w h w + R w γ d C  
where, Rw is a factor for water buoyancy, Rw = 1 − 0.33(hw/C); C is height of soil fill over pipeline; γd is dry unit weight of backfill; hw is height of water over pipeline.

2.2. Strength Based Criteria

For buried steel pipelines, a stress-based failure criterion is generally used for pipes subjected to buoyancy load [27]. Under this circumstance, pipes only undergo elastic deformations. The pipes can be considered to suffer a yield failure when the max von Mises stress in the pipe σMisesMax is equal to the pipe steel’s minimum strength requirement:
σ M i s e s M a x   [ σ ] = F s t r e s s s σ y
where Fstress is the resistance factor, Fstress = 0.9; σy is the minimum yield strength of the pipe material.
For buried pipelines, the principal stresses are the axial stress σax, radial stress σra and hoop stress σho, respectively. The radial stress is always negligible due to the fact pipes are all thin walled vessels [20], the von Mises stress in a pipe can be obtained as:
σ M i s e s   = 1 2 [ ( σ h o σ a x ) 2 + σ h o 2 + σ a x 2 ]
where σax is the axial stress in pipe; σho is the hoop stress in pipe, σho = pD/2t.
According to IITK-GSDMA Guidelines for Seismic Design of Buried Pipelines [26], the compressive axial bending stress for a relatively short section of continuous pipeline subjected to buoyancy can be calculated as:
σ b f   = F b L b 2 10 Z
where Lb is length of pipe in buoyancy zone; Z is section modulus of pipe cross section, Z = Iz/(D/2) = πD3(1−(d/D)4)/32; Fb is buoyant force per unit length on pipeline.
The bending stress derived by Equation (5) is based on the theoretical results of clamped Euler–Bernoulli beam under uniformly distributed load, which ignoring pipe’s large defections and the effects of soil constraints on the pipe. For longer sections of pipeline subjected to buoyancy forces, the pipe can exhibit both cable and beam action to resist the upward force. China National Standard GB50470-2017 Seismic Technical Code for Oil & Gas Transmission Pipeline Engineering suggests an empirical equation for the maximum tensile axial stress in pipe induced by buoyancy in liquefaction areas as [27]:
σ max   L = E ε max L = E [ 1422.7 + 7835.5 L b / ( 0.167 L b 2 8.36 L b + 282.4 ) + 1465 D + 6.16 σ L ] × 10 6
where σ max L is the maximum stress induced by liquefaction buoyancy in pipe; E is Young’s modulus, E = 210,000 MPa; ε max L is the maximum axial strain induced by liquefaction buoyancy in pipe; Lb is length of pipe in liquefaction zone, m; σL is the initial axial stress in pipe induced by service load.
The initial axial stress σL is induced by internal pressure and thermal load in pipe, which can be readily derived through Equation (7):
σ L = μ σ h E α ( T 2 T 1   )
where σL is the initial axial stress, MPa; μ is the Possion’s ratio; α is the thermal expansion coefficient, °C−1; T1 and T2 are the ambient temperature at the time of restraint and the maximum operating temperature, °C.
Finally, the pipe stresses in pipe shall be limited by the following strength requirements:
F y σ y σ M i s e s M a x   = { σ h o 2 + ( σ b f + σ L ) 2 σ h o ( σ b f + σ L )            I I T K G S D M A   G u i d e l i n e s   o r σ h o 2 + ( σ max L + σ L ) 2 σ h o ( σ max L + σ L )      C h i n a   N a t i o n a l   S t a n d a r d   G B 50470 - 2017

2.3. Uplift Displacement Based Criteria

In pipeline engineering, the uplift of buried pipelines above the ground is also has a high risk potential for leading to third-party damage. Thus the maximum uplift displacement of buried pipeline in liquefaction zone Δ should be less than the height of soil fill over pipeline C. Based on this, GB50470-2017 recommends that the pipe length in liquefaction area should be no larger than 180 m in order to prevent pipe uplifted above the ground surface [27]. The IITK-GSDMA guideline proposes a length of 150 m between anchors to prevent uplifting [26].

3. Basic Theory and Analytical Analysis Method

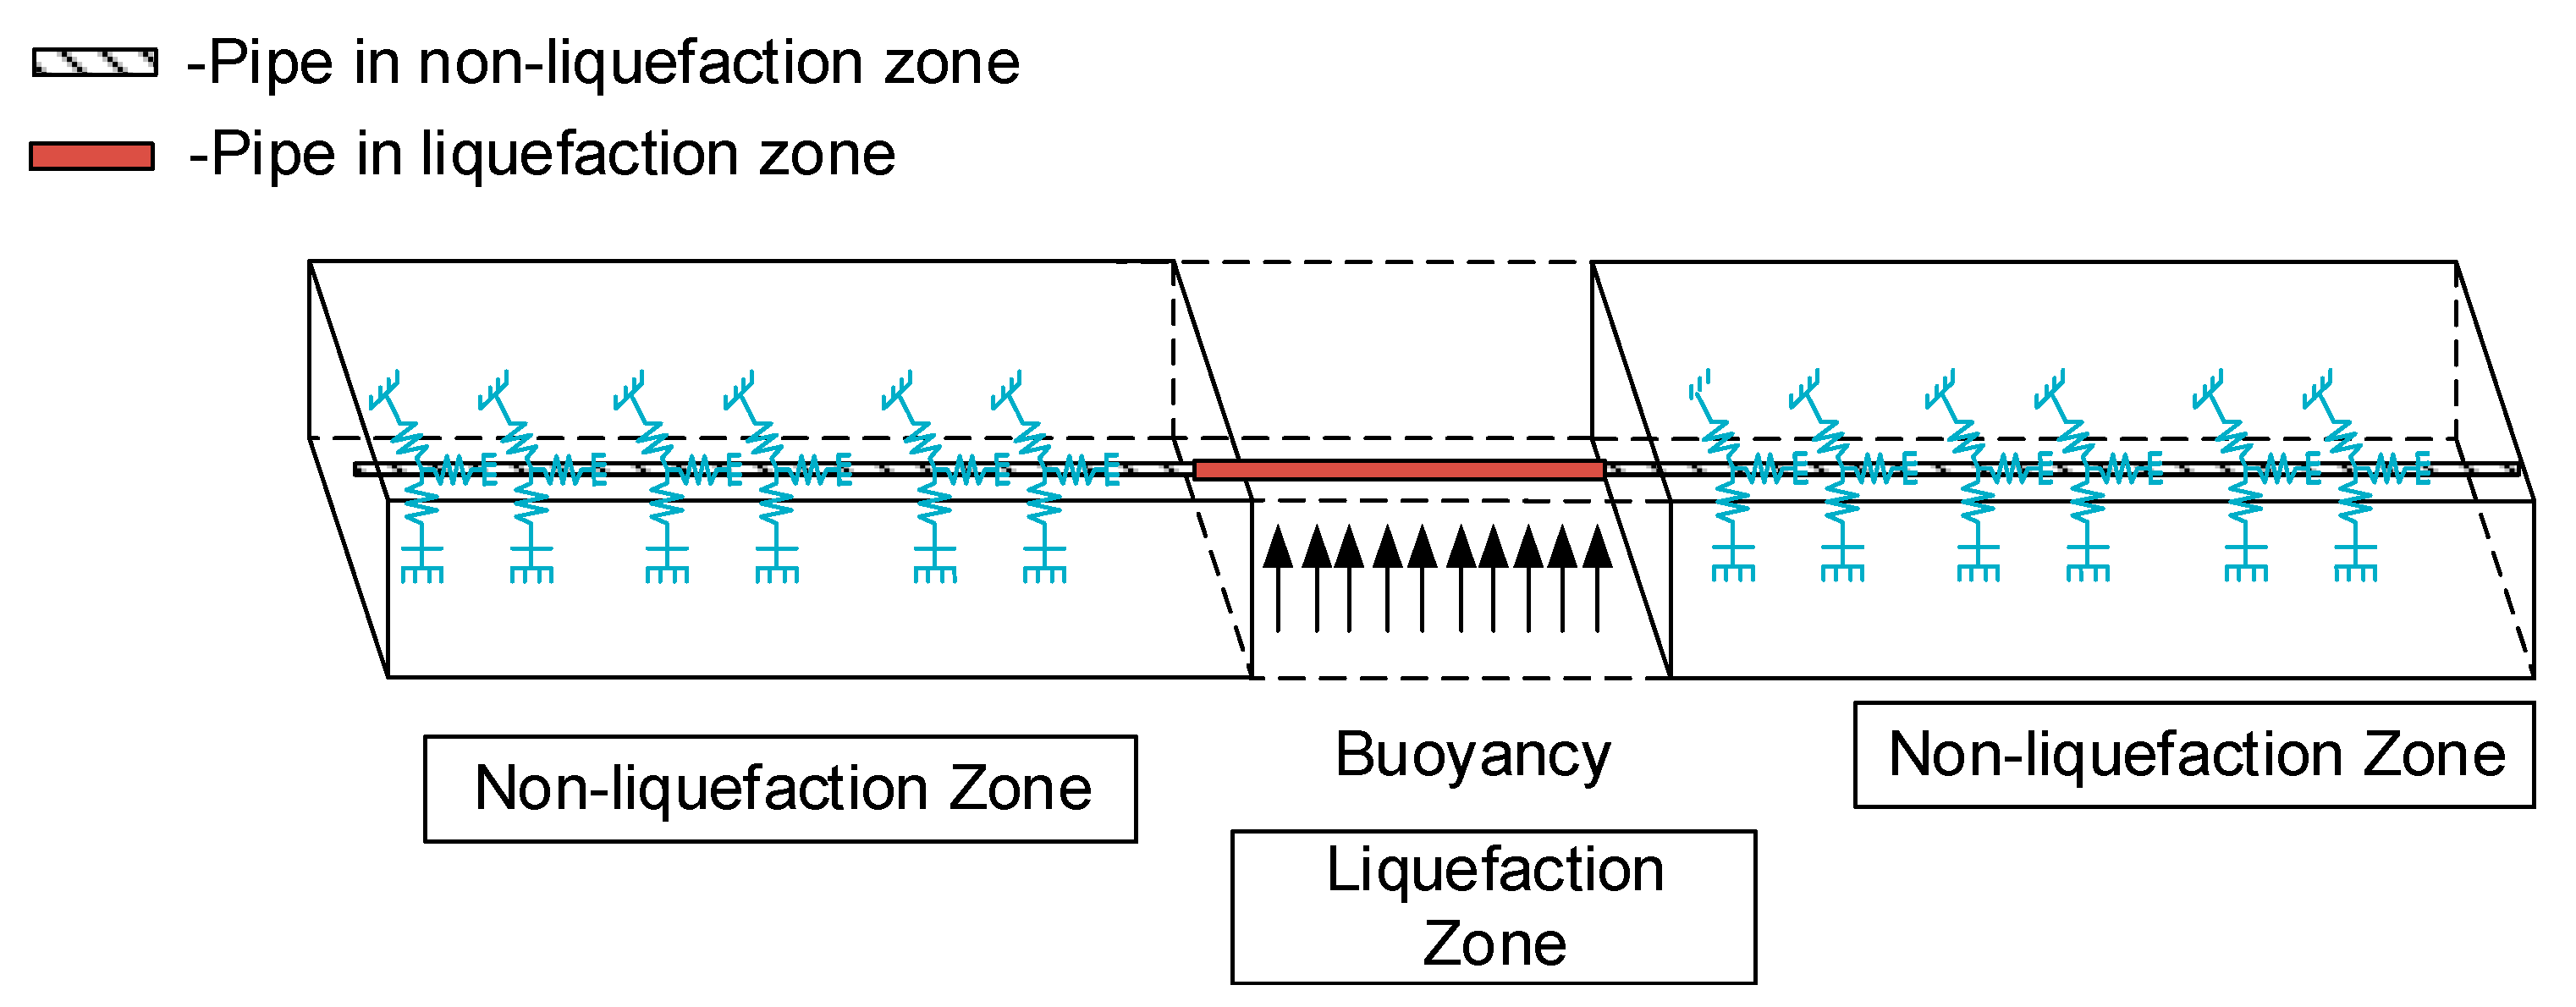
3.1. Mechanical Model

As shown in Figure 2, for buried pipelines crossing liquefaction areas, pipe segments in liquefaction zone will bend due to the buoyancy load.
While the pipe segments in non-liquefaction zones will be restrained by the surrounding soils, which are commonly considered as discrete elastic soil springs. Under this load condition, the pipe should be extended due to the bending deformation, which further induces friction forces exist between pipes and the soils in non-liquefaction zone. In order to the make the analytical solutions of pipe stress and displacement tractable, the following assumptions are introduced:
(1)
The pipe is considered as a beam structure, without considering the radial and shear stress in it.
(2)
The pipe material is assumed to be uniform and purely elastic.
(3)
The soil constraints on pipe in non-liquefaction zone is elastic, described with discrete soil springs.
(4)
Only the pipe deformation in vertical plane is considered here, and the potential lateral pipe deformation induced by lateral spreading is not included.

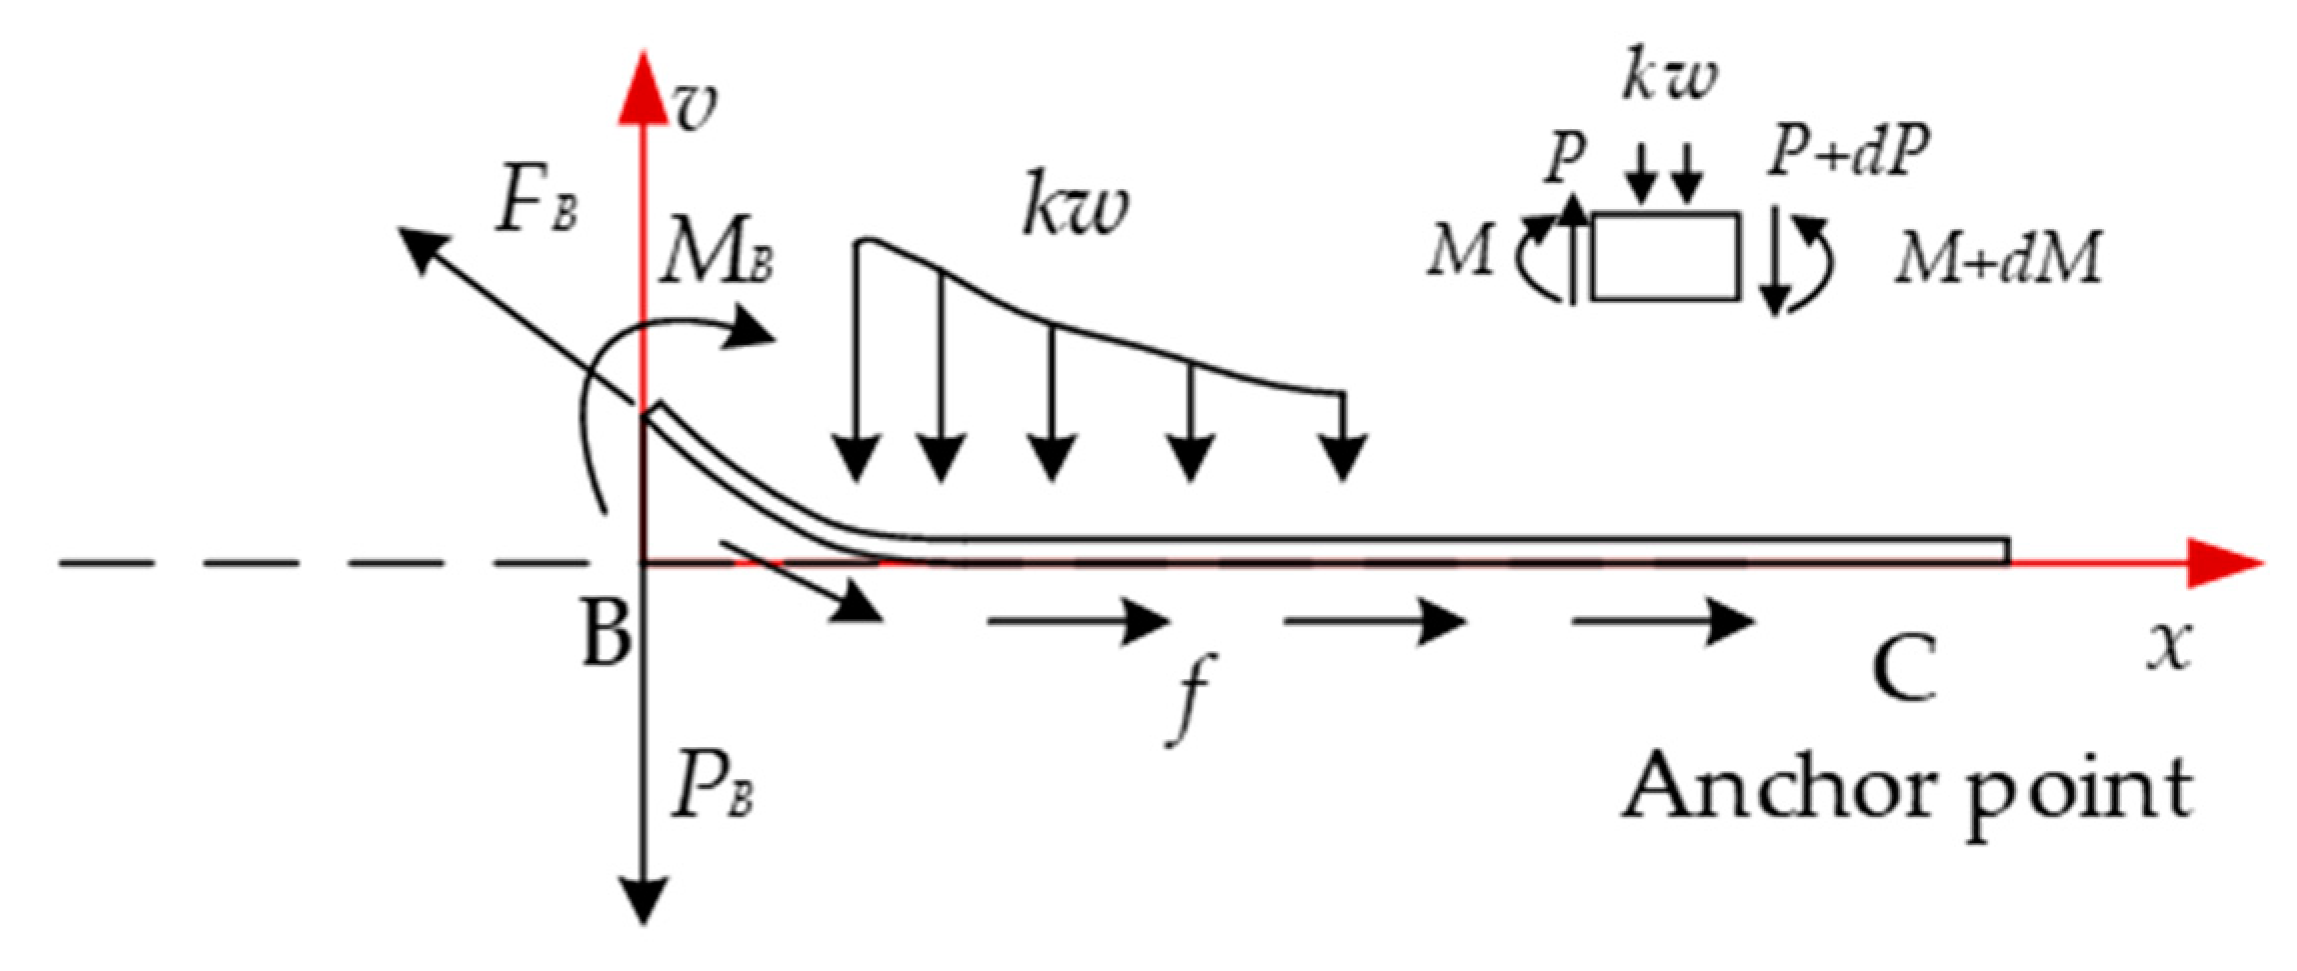
3.1.1. Governing Equations for Pipe Segment in Non-Liquefaction Areas

The mechanical model of pipes in non-liquefaction zone is shown in Figure 3. The governing equation can be derived by the equilibrium of pipe elements:
E I d 4 w 1   d x 4 + k w 1 = 0
where w1 is the pipe configuration in non-liquefaction zone; E is pipe’s initial elastic modulus; I is the inertia moment; k is the stiffness of the elastic soil spring.
Thus the general solution of the pipe’s deflection curve can be obtained as:
w 1 = e λ x   ( C 1 cos λ x + C 2 sin λ x ) + e λ x ( C 3 cos λ x + C 4 sin λ x )
where λ = k / 4 E I 4 , C1~C4 are the unknown coefficients.
Based on the elastic foundation beam theory, the deflection curve equation can be readily further obtained as:
w 1 ( x )   = 2 λ e λ x k [ M B λ ( cos λ x sin λ x ) P B cos λ x ]
where MB and PB are the unknown moment and shear force at point B.

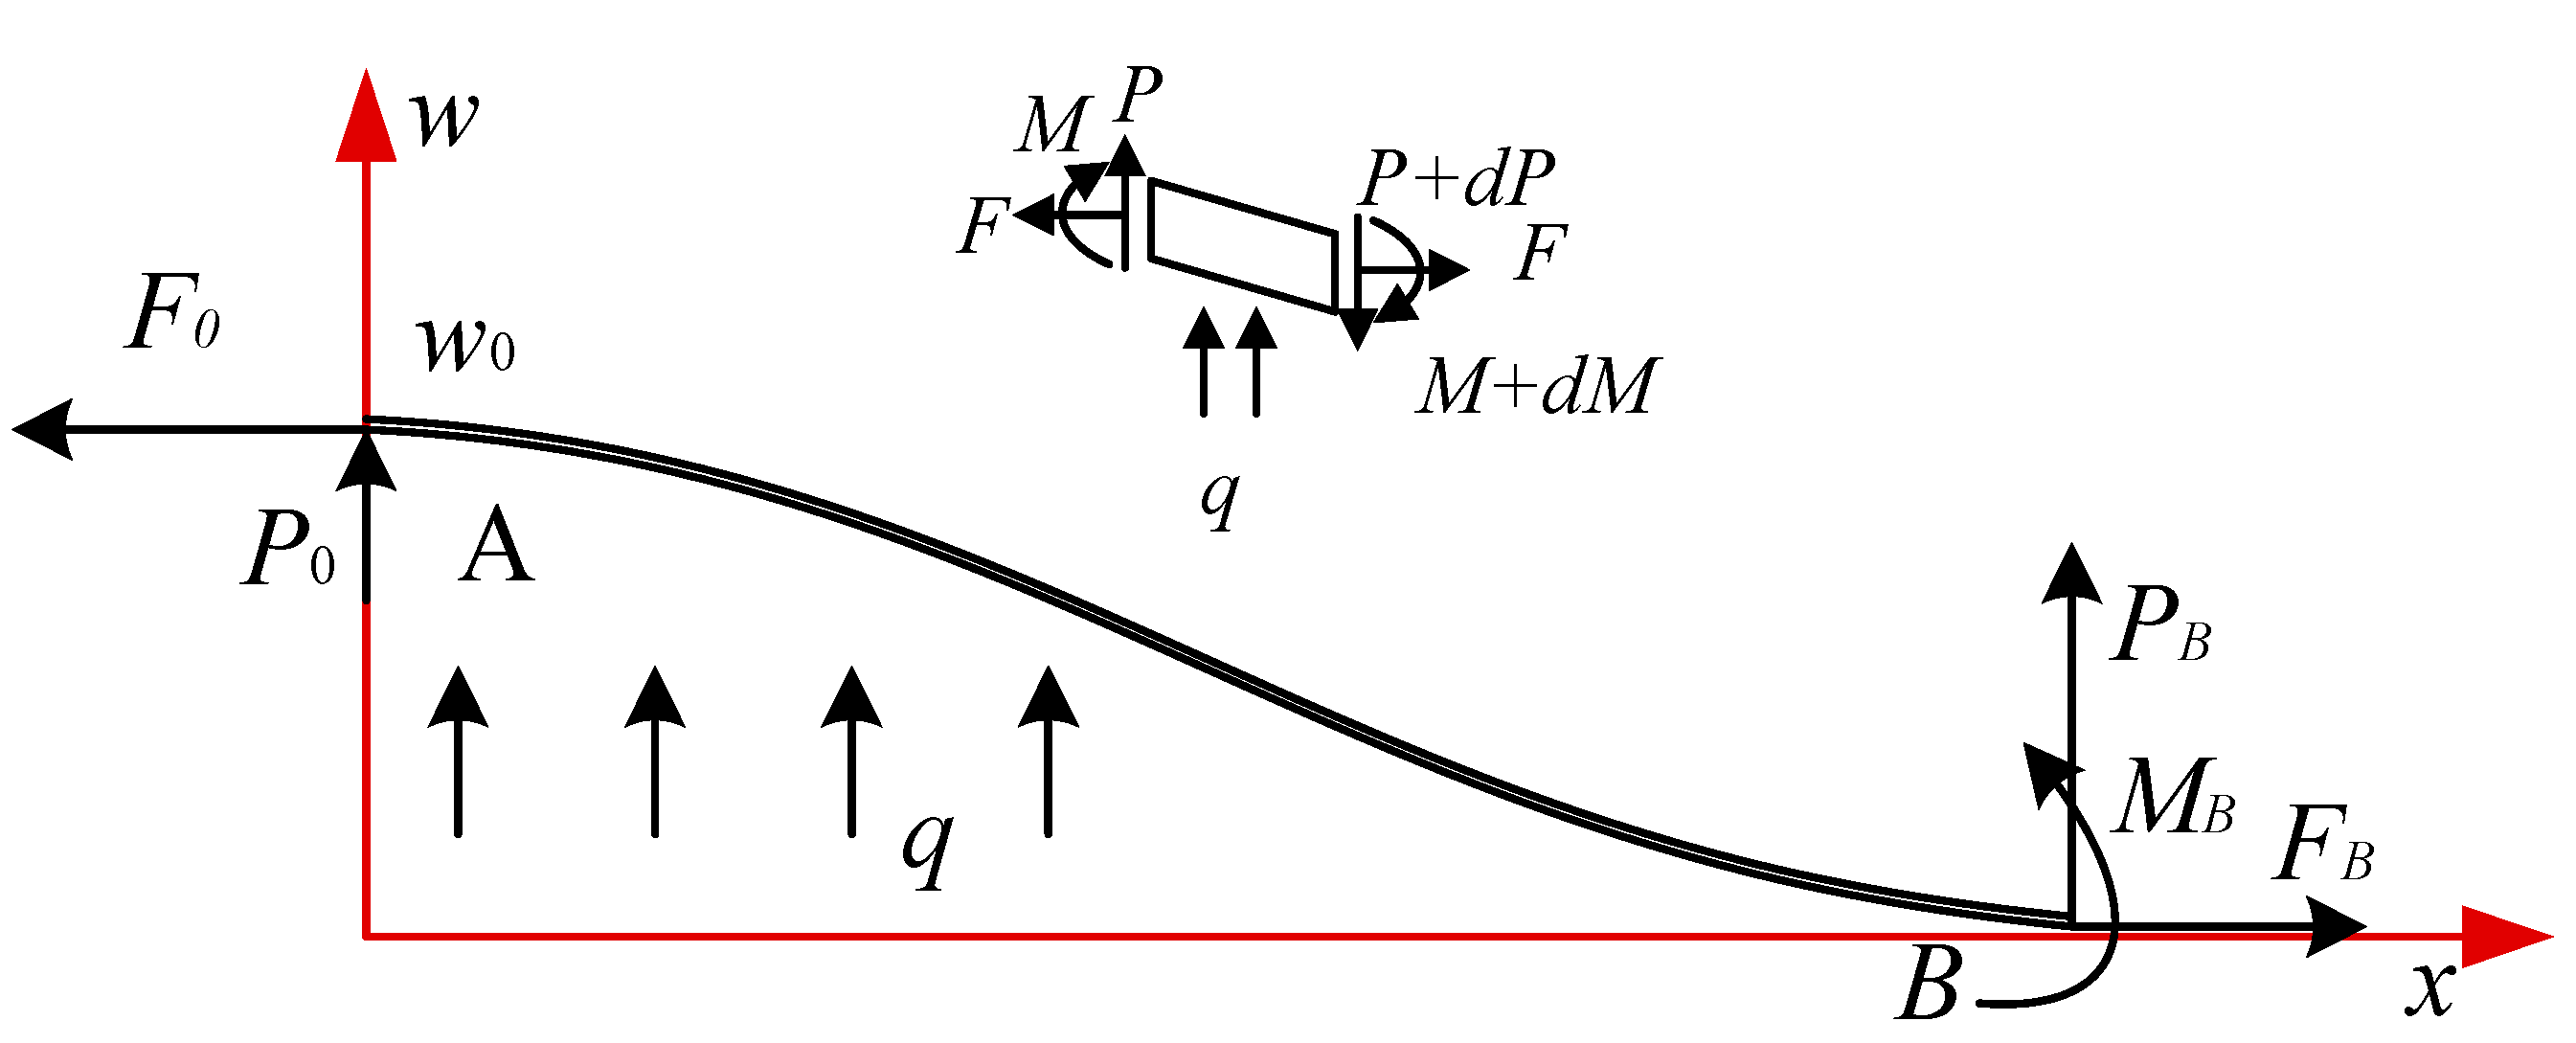
3.1.2. Governing Equations for Pipe Segment in Liquefaction Areas

For the pipes in liquefaction zone, the governing equation also can be obtained by considering the equilibrium of pipe segments (Figure 4):
E I d 4 w 2   d x 2 F d 2 w 2 d x 2 q = 0
where w2 is the pipe configuration in liquefaction area, F is the axial force in pipe, q is the buoyancy load per unit pipe length.
The general solution of the deflection curve for pipe segment AB can be obtained as:
w 2 = q 2 F   x 2 + C 5 α 2 e α x + C 6 α 2 e α x + C 7 x + C 8
where α = F / E I , C5~C8 are the unknown coefficients.
Taking the pipe rotation angle (0), shear force (P0), moment (M0), and pipe deflection (w0) at point A as the boundary condition, the pipe curve can be determined in another form as function of P0, M0 and w0:
w   2 ( x ) = w 0 q x 2 2 F 0 + F 0 M 0 E I q F 0 2 + E I q F 0 M 0 2 F 0 2 ( e α x + e α x )

3.2. Solution Algorithm

Based on the continuous conditions at Point B ( w 1 ( B ) = w 2 ( B ) ;   w 1 ( B ) = w 2 ( B ) ), two equations can be derived:
{ w 0 W 2 q   8 F 0 + F 0 M 0 E I q F 0 2 + ( E I q F 0 M 0 ) 2 F 0 2 ( e α W 2 + e α W 2 ) = 2 M B λ 2 2 P B λ k ( E I q F 0 M 0 ) F 0 E I F 0 ( e α W 2 e α W 2 ) W q 2 F 0 = 2 P B λ 2 4 M B λ 3 k
The bending moment in Beam AB can be derived by the elastic beam theory:
M ( x )   = M B q 2 ( W 2 x ) 2 P B ( W 2 x ) F B v B 1 + v B 2 ( W 2 x ) + F B 1 + v B 2 [ w ( x ) v B ]
Thus, the bending moment at Point A and Point B can also be readily obtained:
{ M 0 = M B P B W   2 q W 2 8 F 0 W ( P B λ 2 2 M B λ 3 ) k + F 0 ( w 0 2 M B λ 2 2 P B λ k ) M B = M 0 q W 2 8 + F 0 ( w 0 2 M B λ 2 2 P B λ k )
The physical elongation Δphy and geometrical elongation Δgeo in pipe can be obtained as:
{ Δ p h y   = 0 F 0 / f f x E A d x + F 0 W 2 E A Δ g e o = 0 W / 2 1 + w 2 ( x ) 2 d x W 2 + 0 + [ 1 + w 1 ( x ) 2 1 ] d x
According to the ALA Guidelines (2001), the peak axial soil resistance per unit length of a pipe f is:
f = π D k 0 c s +   π D H γ 0 1 + K 0   2 tan θ 0
where cs is the soil cohesion representative, k0 is the adhesion factor, H is the depth of the soil from the ground surface to the centerline of pipe, γ0 is the effective unit weight of the soil, K0 is the coefficient of the lateral soil pressure at rest, θ0 is the internal friction angle of the soil.
According to the deformation compatibility equation between pipeline physical elongation and pipeline geometrical elongation, another equation can be formed:
0 W / 2   1 + w 2 ( x ) 2 d x W 2 + 0 + [ 1 + w 1 ( x ) 2 1 ] d x = 0 F 0 / f f x E A d x + F 0 W 2 E A
Thus based on Equations (15), (18) and (20), F0, M0, PB, MB and w0 can be solve iteratively. In this study, the commercial numerical analysis software MATLAB was utilized to ensure the convergence of the iteration.

3.3. Total Additional Longitudinal Stresses in Pipe

With the calculated variables in Section 3.2, the axial and bending stresses in pipe can be obtained readily. The axial stress in pipe can be derived as:
σ a x i s   = { F 0 / A                        For   Pipe   Segement   AB f ( L x ) / A            For   Pipe   Segement   BC
The bending stress can be obtained by the radius of curvature:
σ b e n d   = E D / ( 2 ρ ) = E D / 2 w ( x ) ( 1 + w ( x ) 2 ) 3 / 2 E D / 2 w ( x )
Substitute the Equations (11) and (14) into Equation (22):
σ b e n d   = { E D 2 [ q F 0 + E I q F 0 M 0 2 F 0 E I ( e F 0 E I x + e F 0 E I x ) ]            For   Pipe   Segement   AB 2 E λ 3 D e λ x k [ M B λ ( cos λ x + sin λ x ) P B sin λ x ]      For   Pipe   Segement   BC
The longitudinal stress in pipe can be further derived:
σ long   = σ a x i a l + σ b e n d cos θ
where θ is central angle to the vertical plane crossing pipe axis.

4. Model Validation and Comparison

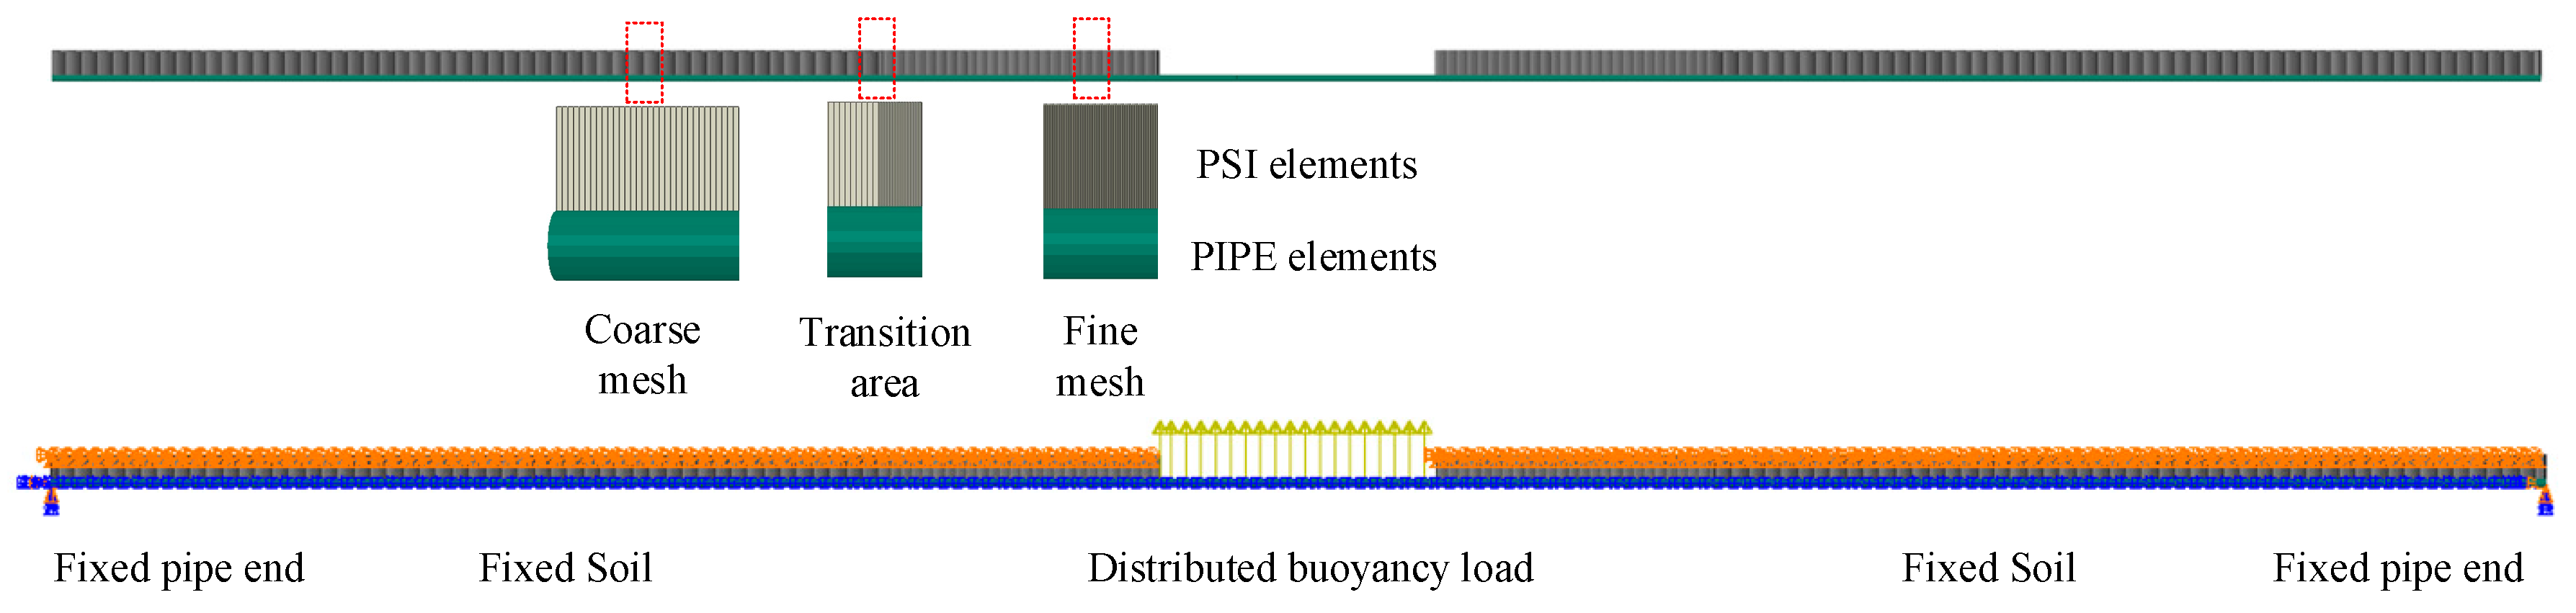
4.1. Finite Element Numerical Model for Validation

Nonlinear finite element method has been widely applied in the stress analysis of buried pipeline subjected to environmental loads due to its accuracy. Thus, a rigorous finite element model was also established by the general code package ABAQUS in this study to validate the established analytical model, as shown in Figure 5. Three dimensional pipe elements (PIPE31) were utilized to model the pipeline. A fine mesh with element size of 0.1 m was set for pipelines near and in the liquefaction zone, as large pipe stress appears in these pipe segments [20]. A coarse mesh with element size of 1 m was set for pipelines far away from the liquefaction zone. The pipe-soil interaction elements (PSI34) developed by ABAQUS were employed to simulated the soil constraints on pipe in non-liquefaction zone. The entire pipe length is nine times of the length of pipe in liquefaction zone in order to eliminate boundary effects on the stress results.

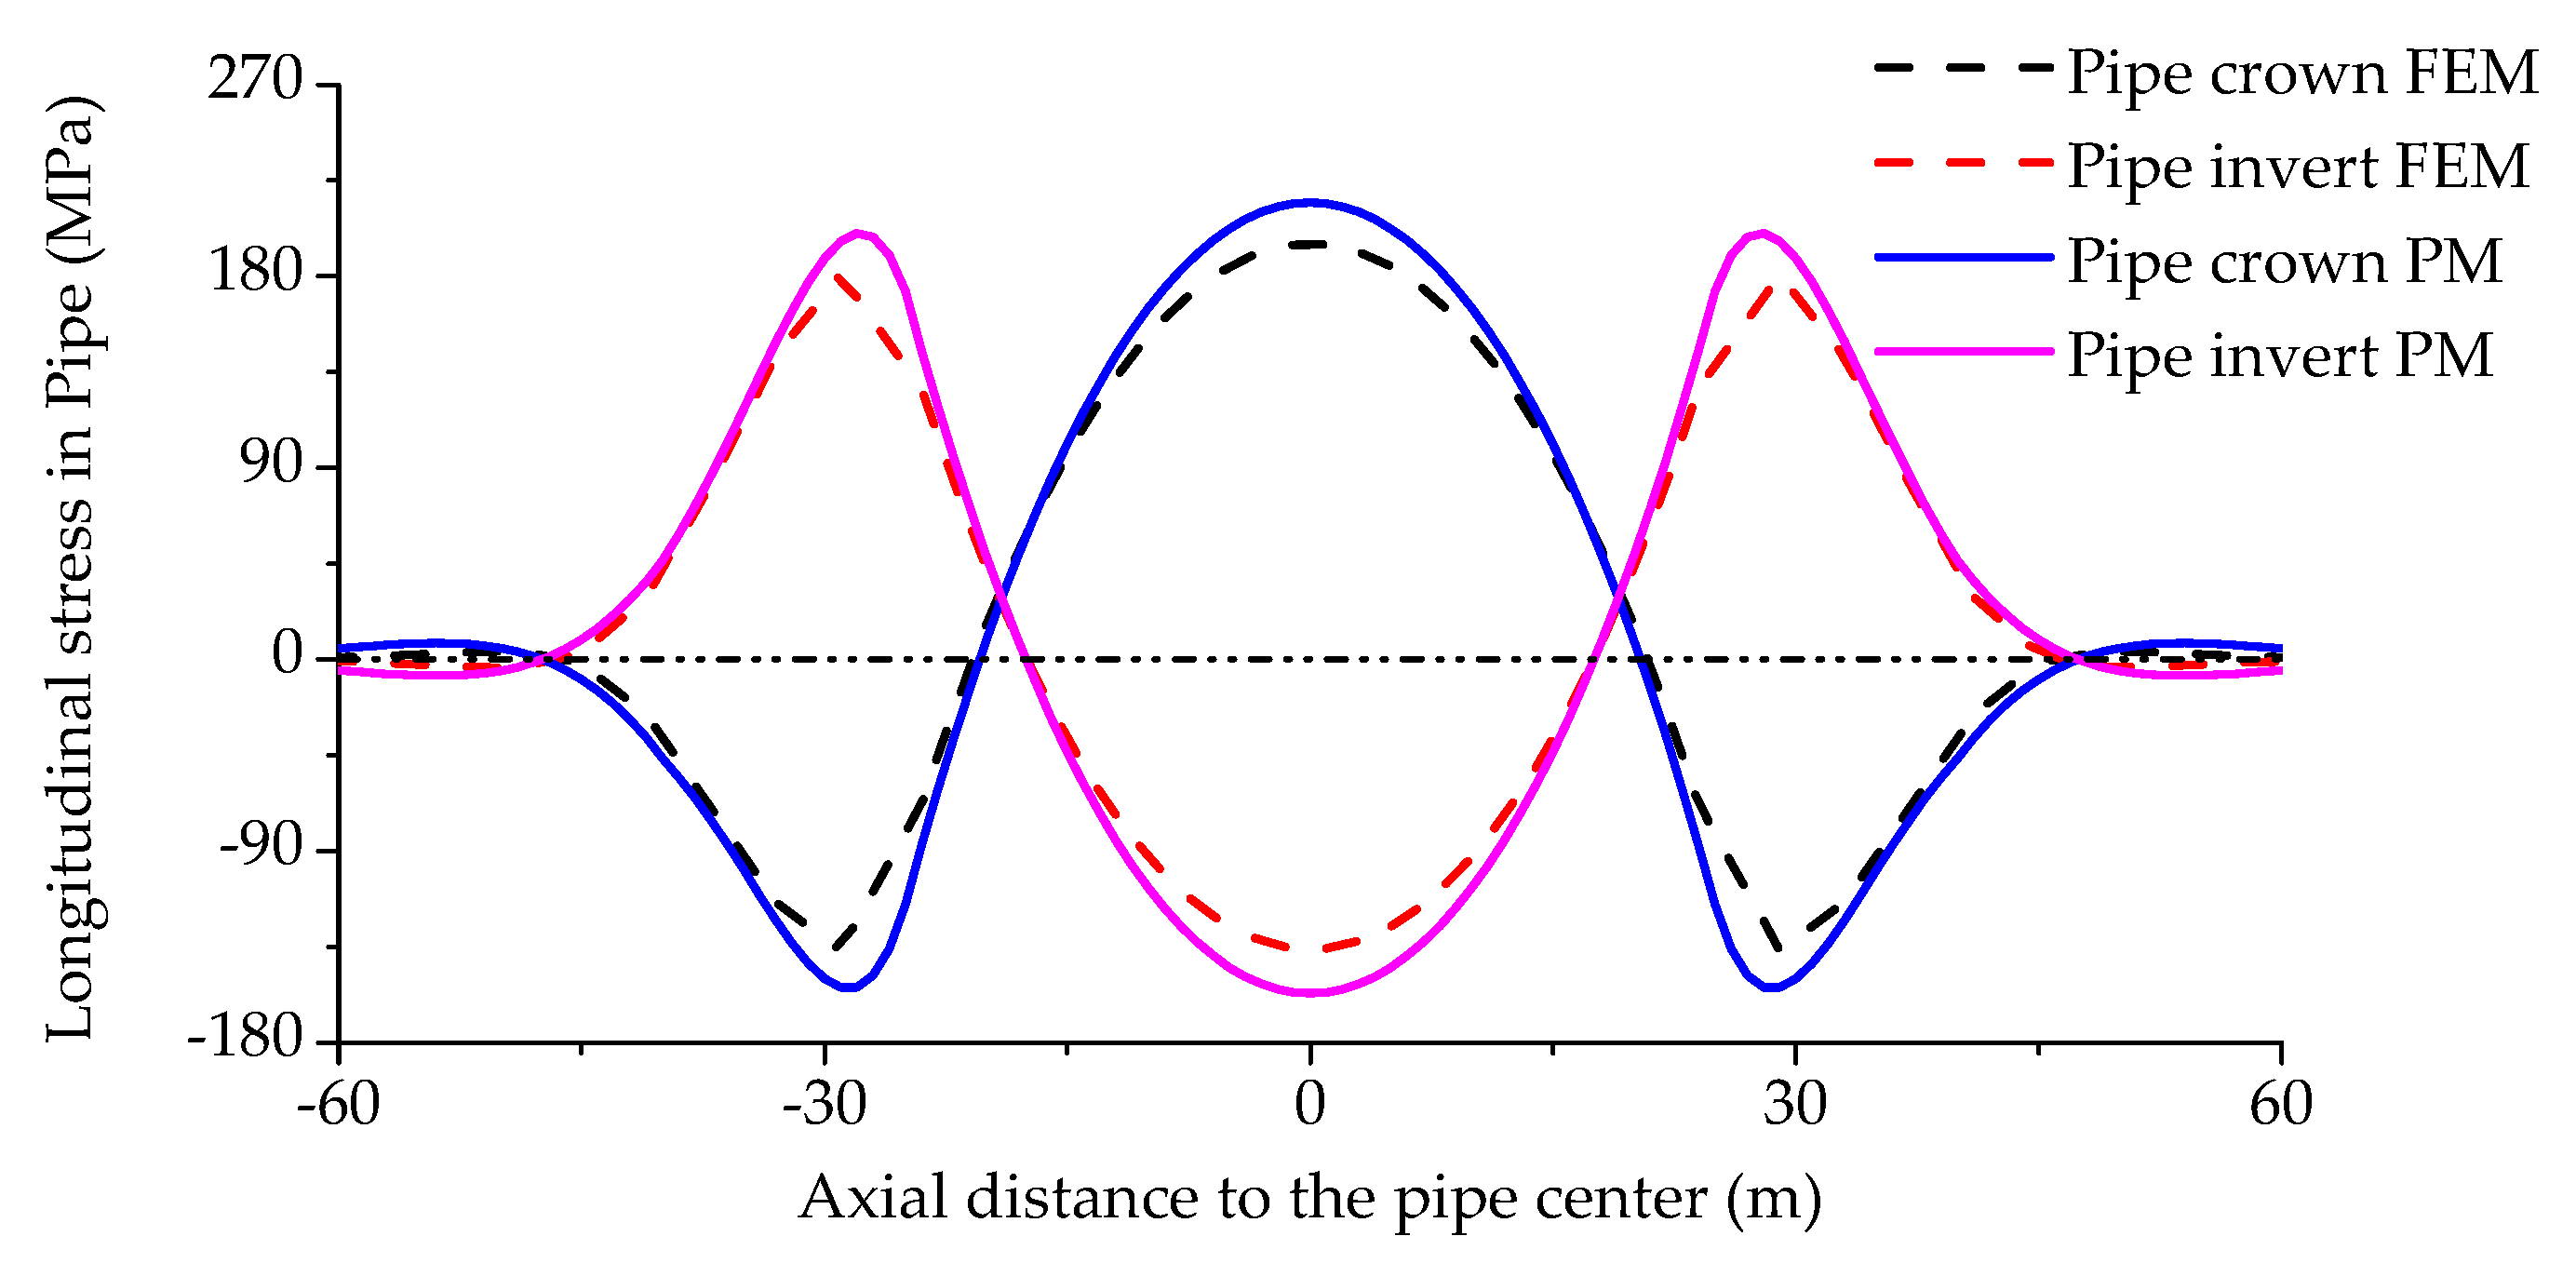
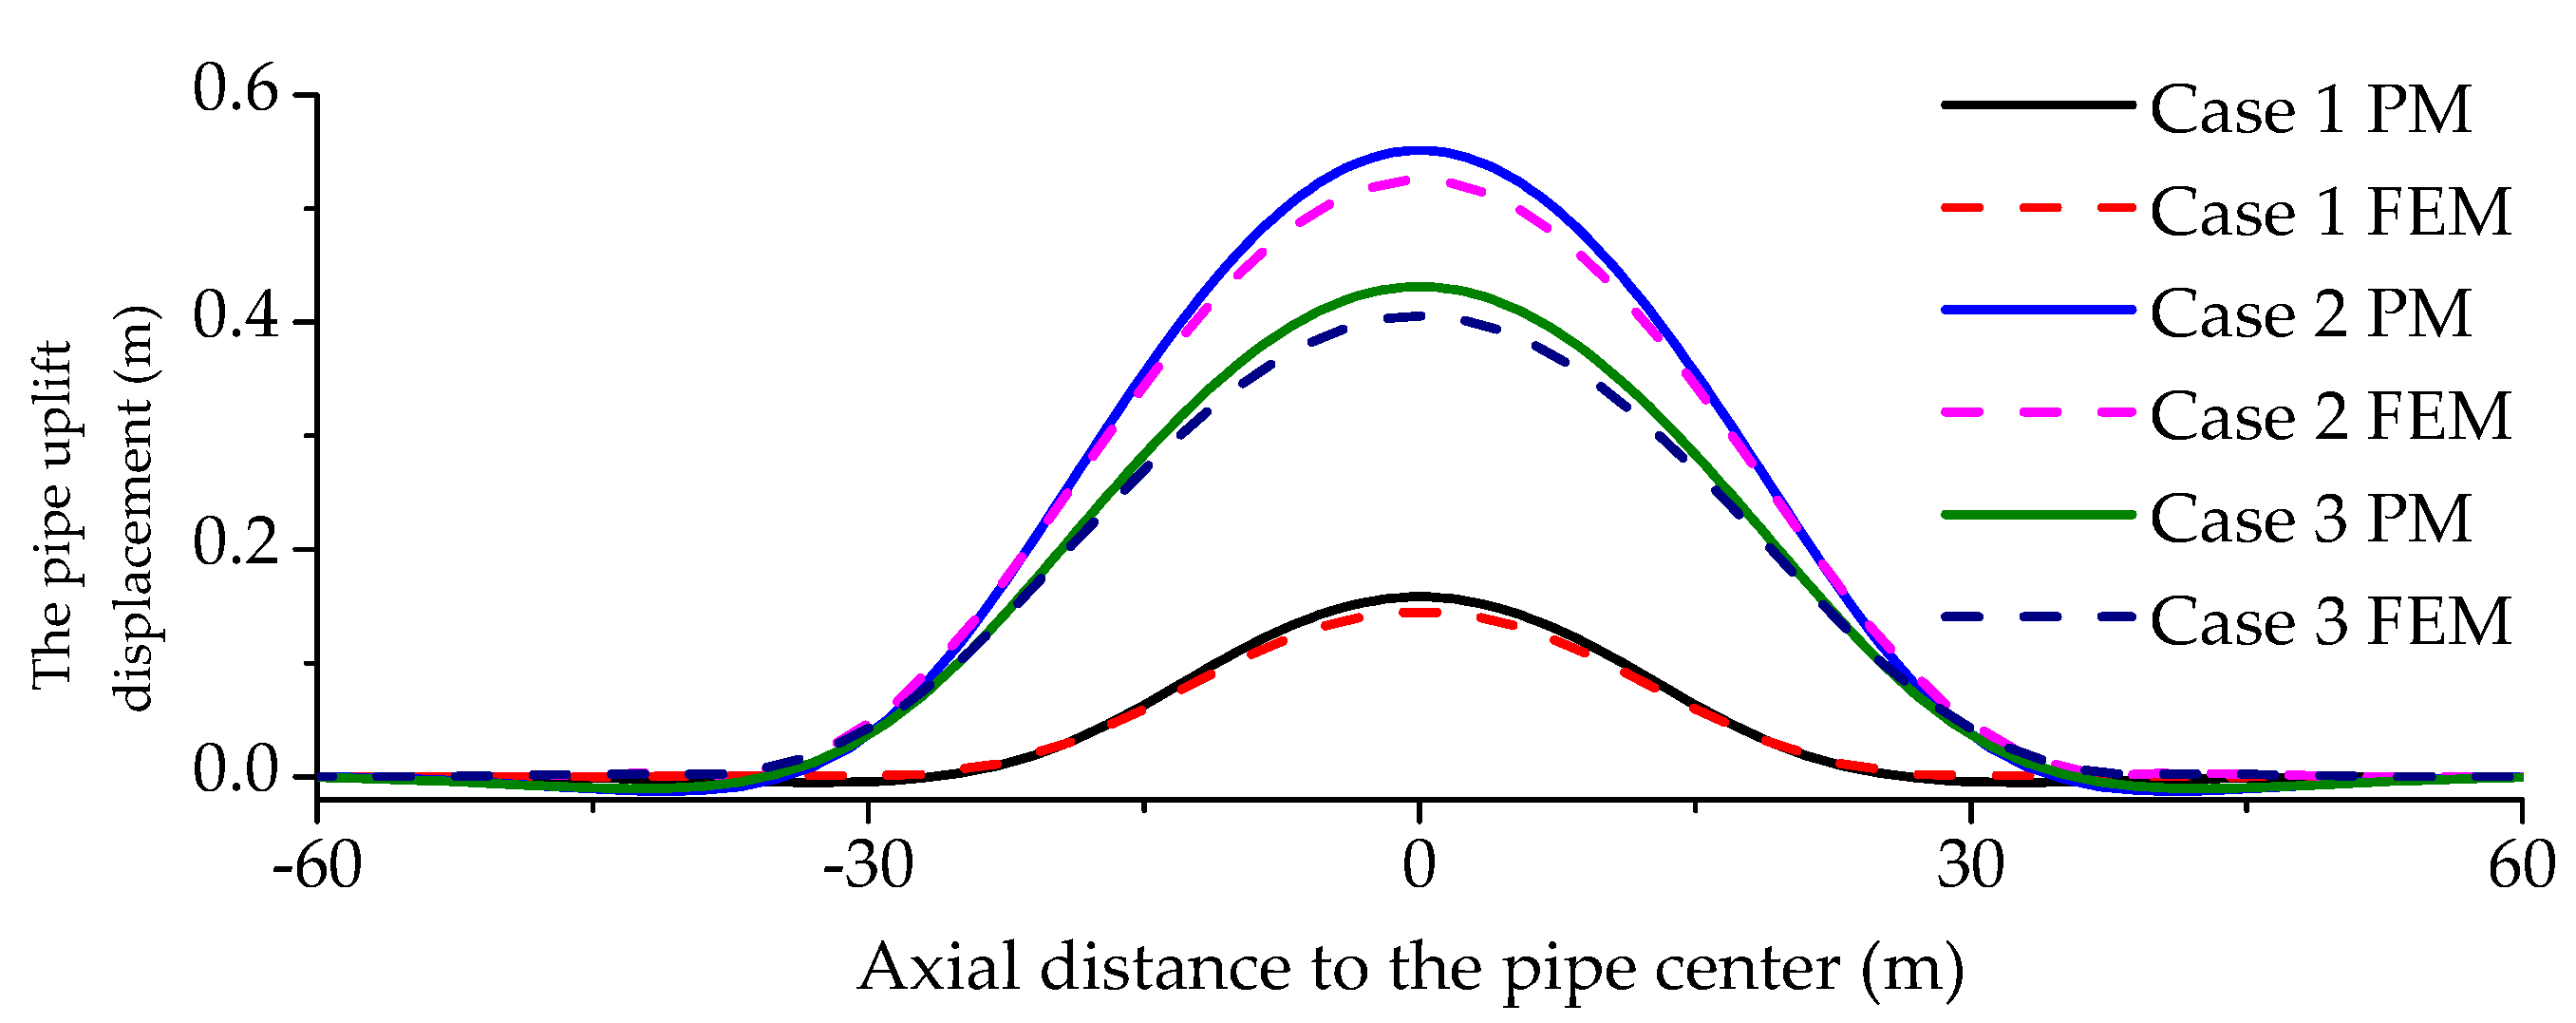
4.2. Comparison Results for FE Model and the Proposed Method

Three cases with various engineering parameters were used here to validate the proposed analytical model. An API Grade X70 steel pipe was selected as a prototype. The peak soil resistance and the corresponding yield displacement for the vertical uplift soil spring considered here are 126.9 kN/m and 0.18 m, which makes the soil spring stiffness equals 700 kN/m2. Detailed parameters for the cases are listed in Table 1.
Figure 6 illustrates the comparison results for pipe uplift displacements between the proposed method (PM) and the finite element method (FEM). The relative errors for case 1, case 2 and case 3 are 8.99%, 4.95% and 6.40%, respectively. Thus, it is obvious that the proposed method can predict pipe’s vertical responses quite accurately.
Longitudinal stress results for Case 2 were also elucidated here to show the accuracy of the proposed analytical model. Figure 7 shows the longitudinal stresses at pipe crown and pipe invert. The relative errors for the maximum strain at pipe crown and pipe invert are 9.92% and 10.84% respectively, which can also prove that the proposed method can accurate calculate the pipe stress results.
The following reasons can induce the relative error of our analytical model results and the FE model results: (i) In the FE model established by ABAQUS, the geometric nonlinearity is considered, which makes the stress components derived are given in local directions that rotate with the material. While this is not considered in the proposed analytical model; (ii) the axial and vertical soil springs used in the finite element model are elastoplastic soil springs. While in the proposed model, the elastic deformation of axial soil spring is ignored, a constant value of peak axial resistance is used to model the axial soil constraint; (iii) only the uplift soil resistance is used in the analytical model.

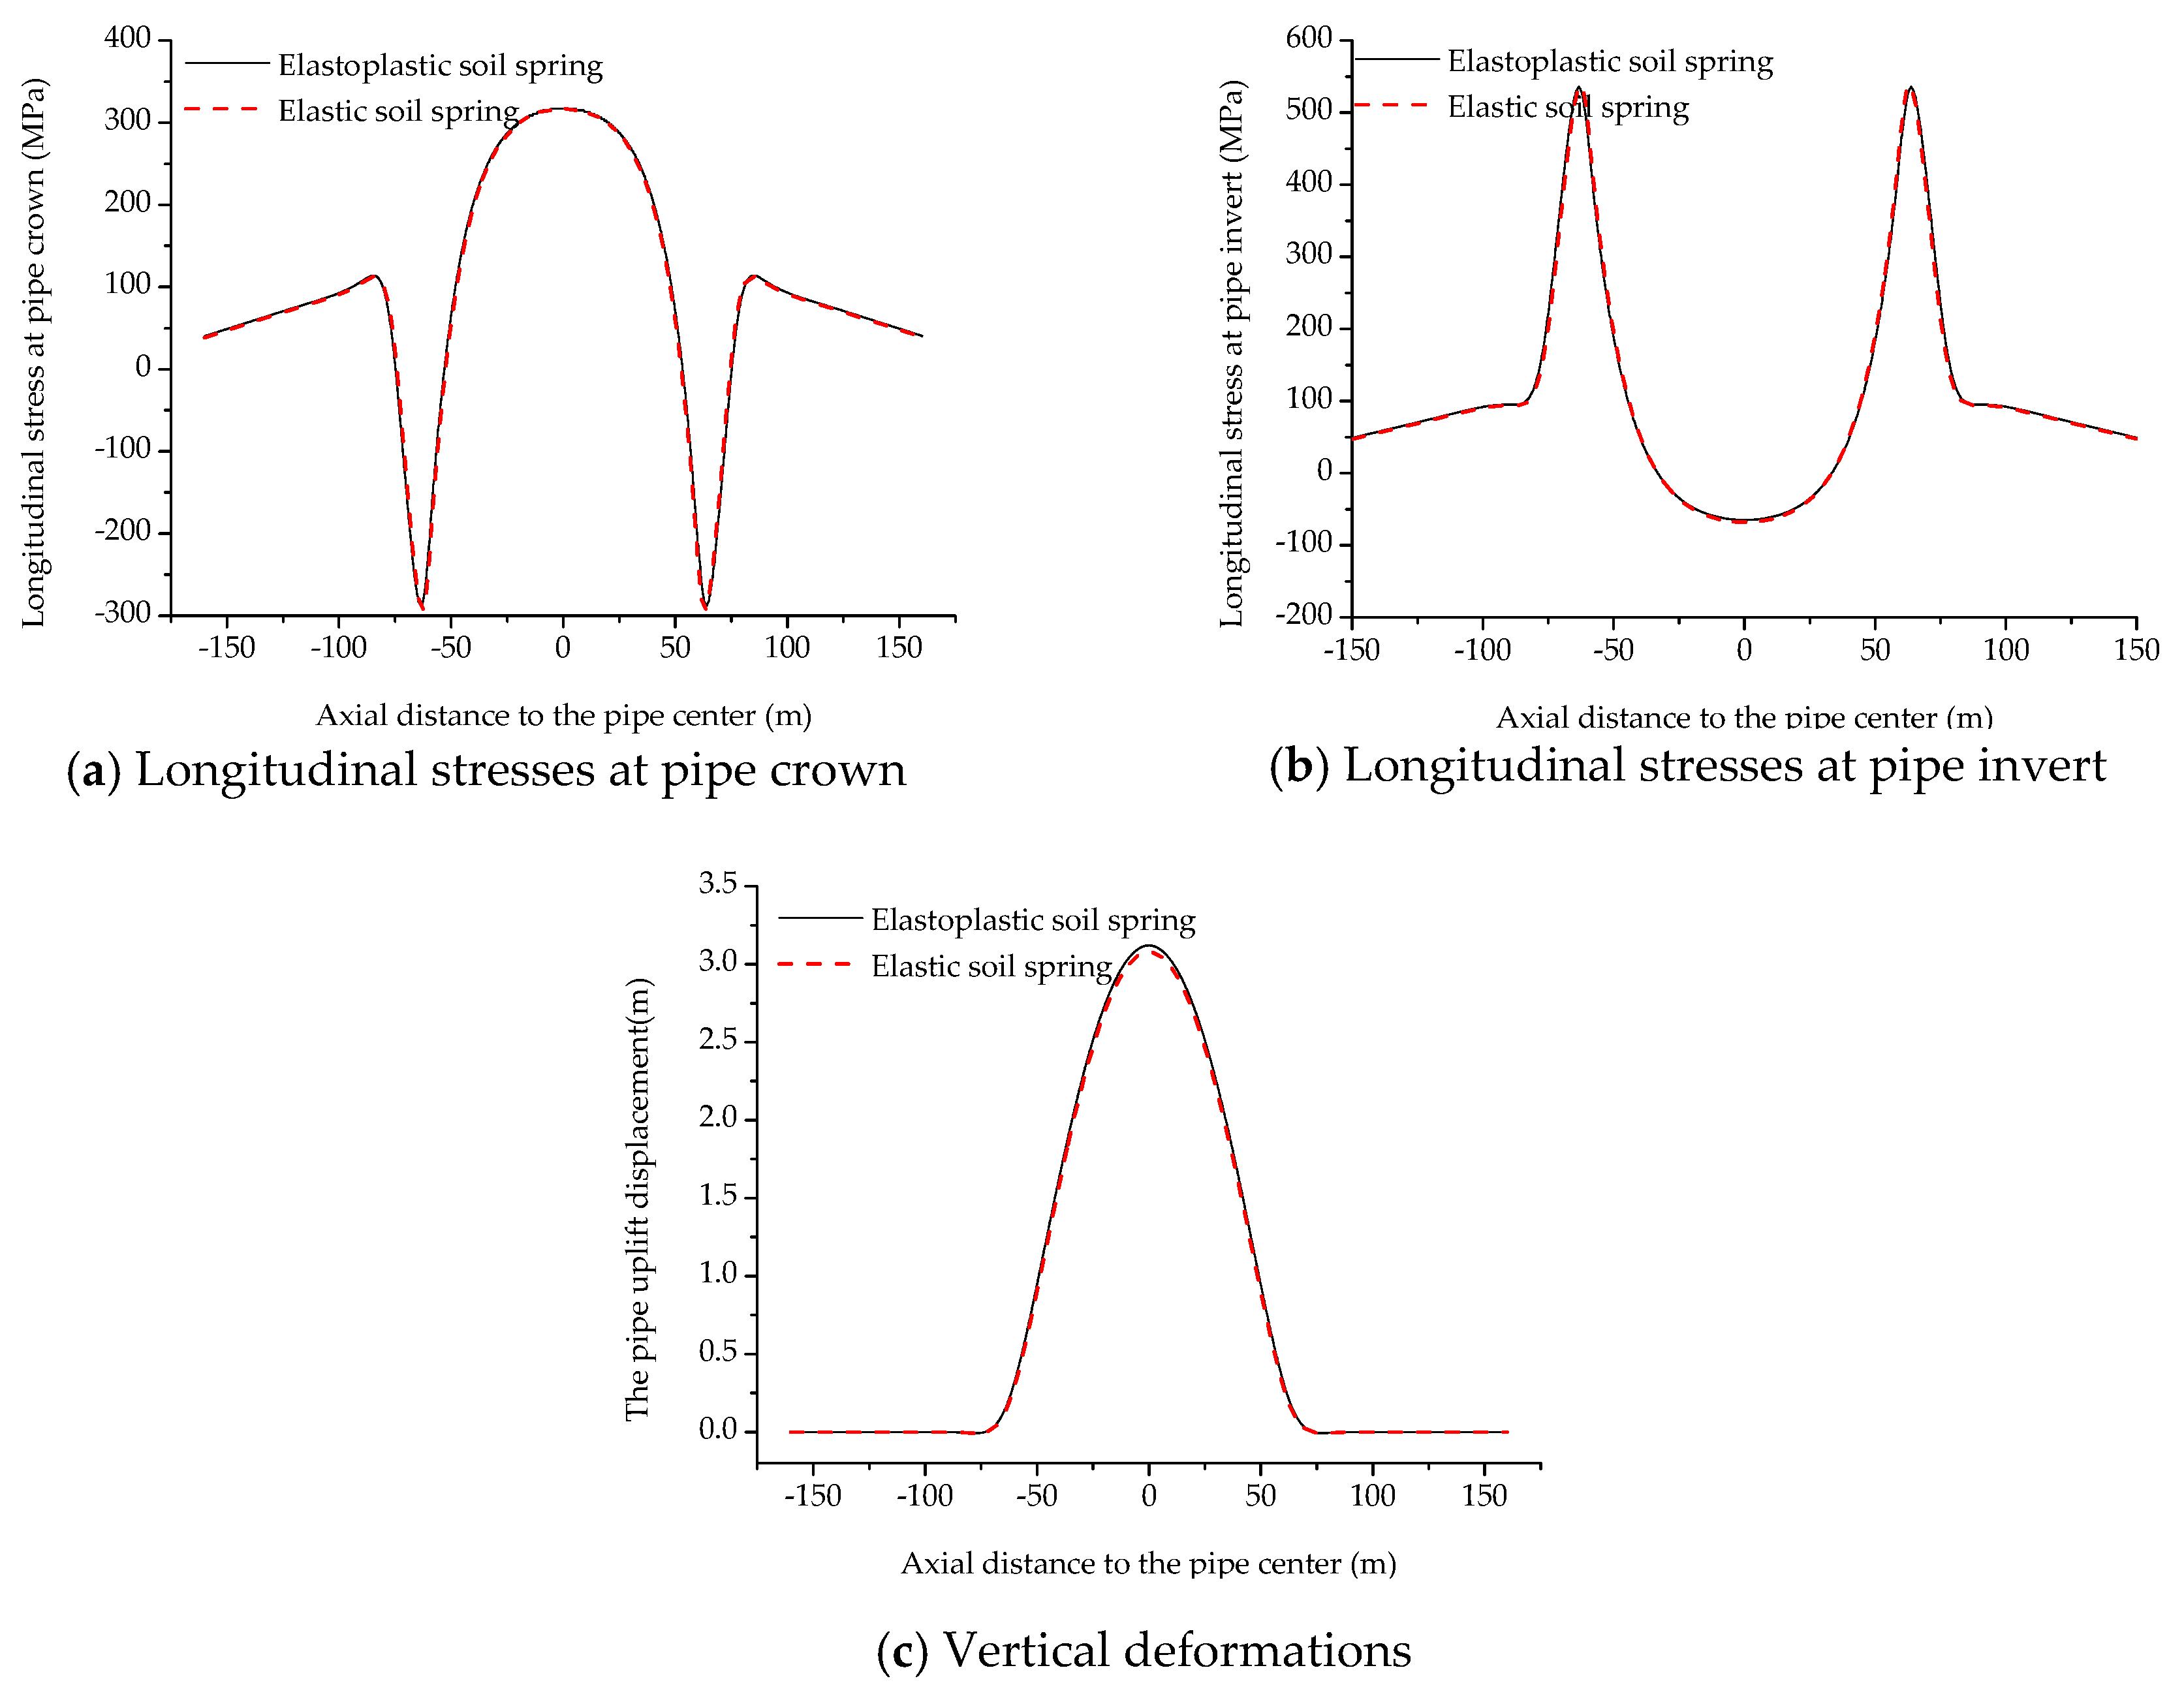
4.3. Discussion of Soil Spring Properties on Pipe’s Mechanical Behaviors

As mentioned in Section 3.1, in this study soil constraints are described by elastic soil springs, while commonly soil constraints on pipe are more likely elastoplastic soil springs. Thus, in this section, a detailed investigation is conducted to determine whether elastic soil springs can effectively simulate the mechanical behaviors of pipes subjected to buoyancy induced by liquefied soil.
In the analysis, for elastoplatic soil springs, the axial peak soil resistance and corresponding yield displacement are selected as 32.32 kN/m and 8 mm. The vertical uplift peak soil resistance and corresponding yield displacement are 126.82 kN/m and 180 mm. The vertical bearing peak soil resistance and corresponding yield displacement are 687 kN/m and 142 mm. For elastic soil springs, soil spring stiffness are determined by the elastic stage of the elastoplastic soil springs. Totally, three models with various liquefaction zone length, i.e., 30 m, 80 m and 120 m, were considered. Pipe vertical displacements, longitudinal stresses at pipe crown and invert for these cases with both elastic and elastoplastic soil springs were derived, as shown in Figure 8, Figure 9 and Figure 10.
It can be derived that, for the cases with liquefaction zone length equals 30 m and 80 m. Displacements and stress results of models with various soil spring properties are visibly same. This is because for these two cases the soils are almost elastic. For the case with liquefaction zone length equals 120 m, the results derived by FE model with elastic soil springs predicts smaller results. This is because the maximum pipe soil relative displacement is 0.32 m, which is much larger than the yield displacement of the soil (0.18 m). However, it is also worthy to mention that, in the last mentioned case, the maximum pipe uplift displacement has become about 3.2 m, which is much larger than the pipe’s buried depth, indicating that this case cannot be actually allowed in pipe design. Thus, for engineering design purposes, using elastic soil spring model can effectively simulate the pipe’s mechanical responses.

5. Parametric Analysis

In this section, parametric analysis was conducted by the proposed analytical method to investigate influences of common engineering parameters, i.e., pipe diameter, pipe wall thickness, soil spring stiffness and width of liquefaction zone, on the mechanical response of buried pipeline in a liquefaction area. An API Grade X70 gas pipe with diameter equals 914.4 mm and pipe wall thickness equals 13.1 mm was selected as a prototype. According to ALA-2001 [25], the soil properties representative of the backfill should be used to compute the axial soil spring forces. Other soil spring forces should generally be based on the native soil properties. In geohazard areas, soft sands are commonly used as backfill soils for pipelines. Based on the following backfill soil parameters: unit weight: 22 kN/m3, friction angle: 37°, friction reduction factor: 0.6, the axial peak soil resistance on pipe is derived as 32.21 kN/m with yield displacement equals 8 mm. Based on the following native soil parameters: soil cohesion representative: 24 kPa, unit weight: 22 kN/m3, friction angle: 25°, friction reduction factor: 0.6, the vertical uplift peak soil resistance on pipe is derived as 126.82 kN/m with yield displacement equals 0.18 m.

5.1. Effects of Pipe Diameter

Pipelines with larger diameters can increase the gas throughput but also increase the construction cost. Thus pipelines with various pipe diameters are in service. In this section, four most common pipe diameters for X70 steel pipe were chosen to discuss its effects on pipe’s mechanical behaviors under buoyancy load in liquefaction areas. The design factor used for these pipes are all set to be 0.72, which ensures that the ratios of pipe diameter to pipe wall thickness are same. Thus all the four pipes has a hoop stress equals 0.72σy.
Figure 11 shows the distribution results of vertical pipeline displacements, which indicates that a smaller pipe diameter can lead to larger uplift displacement. As the buried depth considered here is 1.8 m, the pipes considered here are still under ground.
Figure 12 and Figure 13 illustrate the longitudinal stresses in pipe crown and pipe invert, respectively. For the considered cases here, the tensile stress is much larger than the compressive stress, indicating that the pipes exist large tension deformation under the buoyancy load. It is also worthy to mention that, large tensile stresses appear in various areas along the pipe. For pipe crown, the large tensile stress appears in the pipe segment at the center of liquefaction zone.
For pipe invert, the large stress appears in the pipe segments near the edge of the liquefaction zone. Generally, with the increase of pipe diameter, the longitudinal stresses at both pipe invert and crown decrease. Because pipelines with larger pipe diameter have higher axial and bending stiffness.

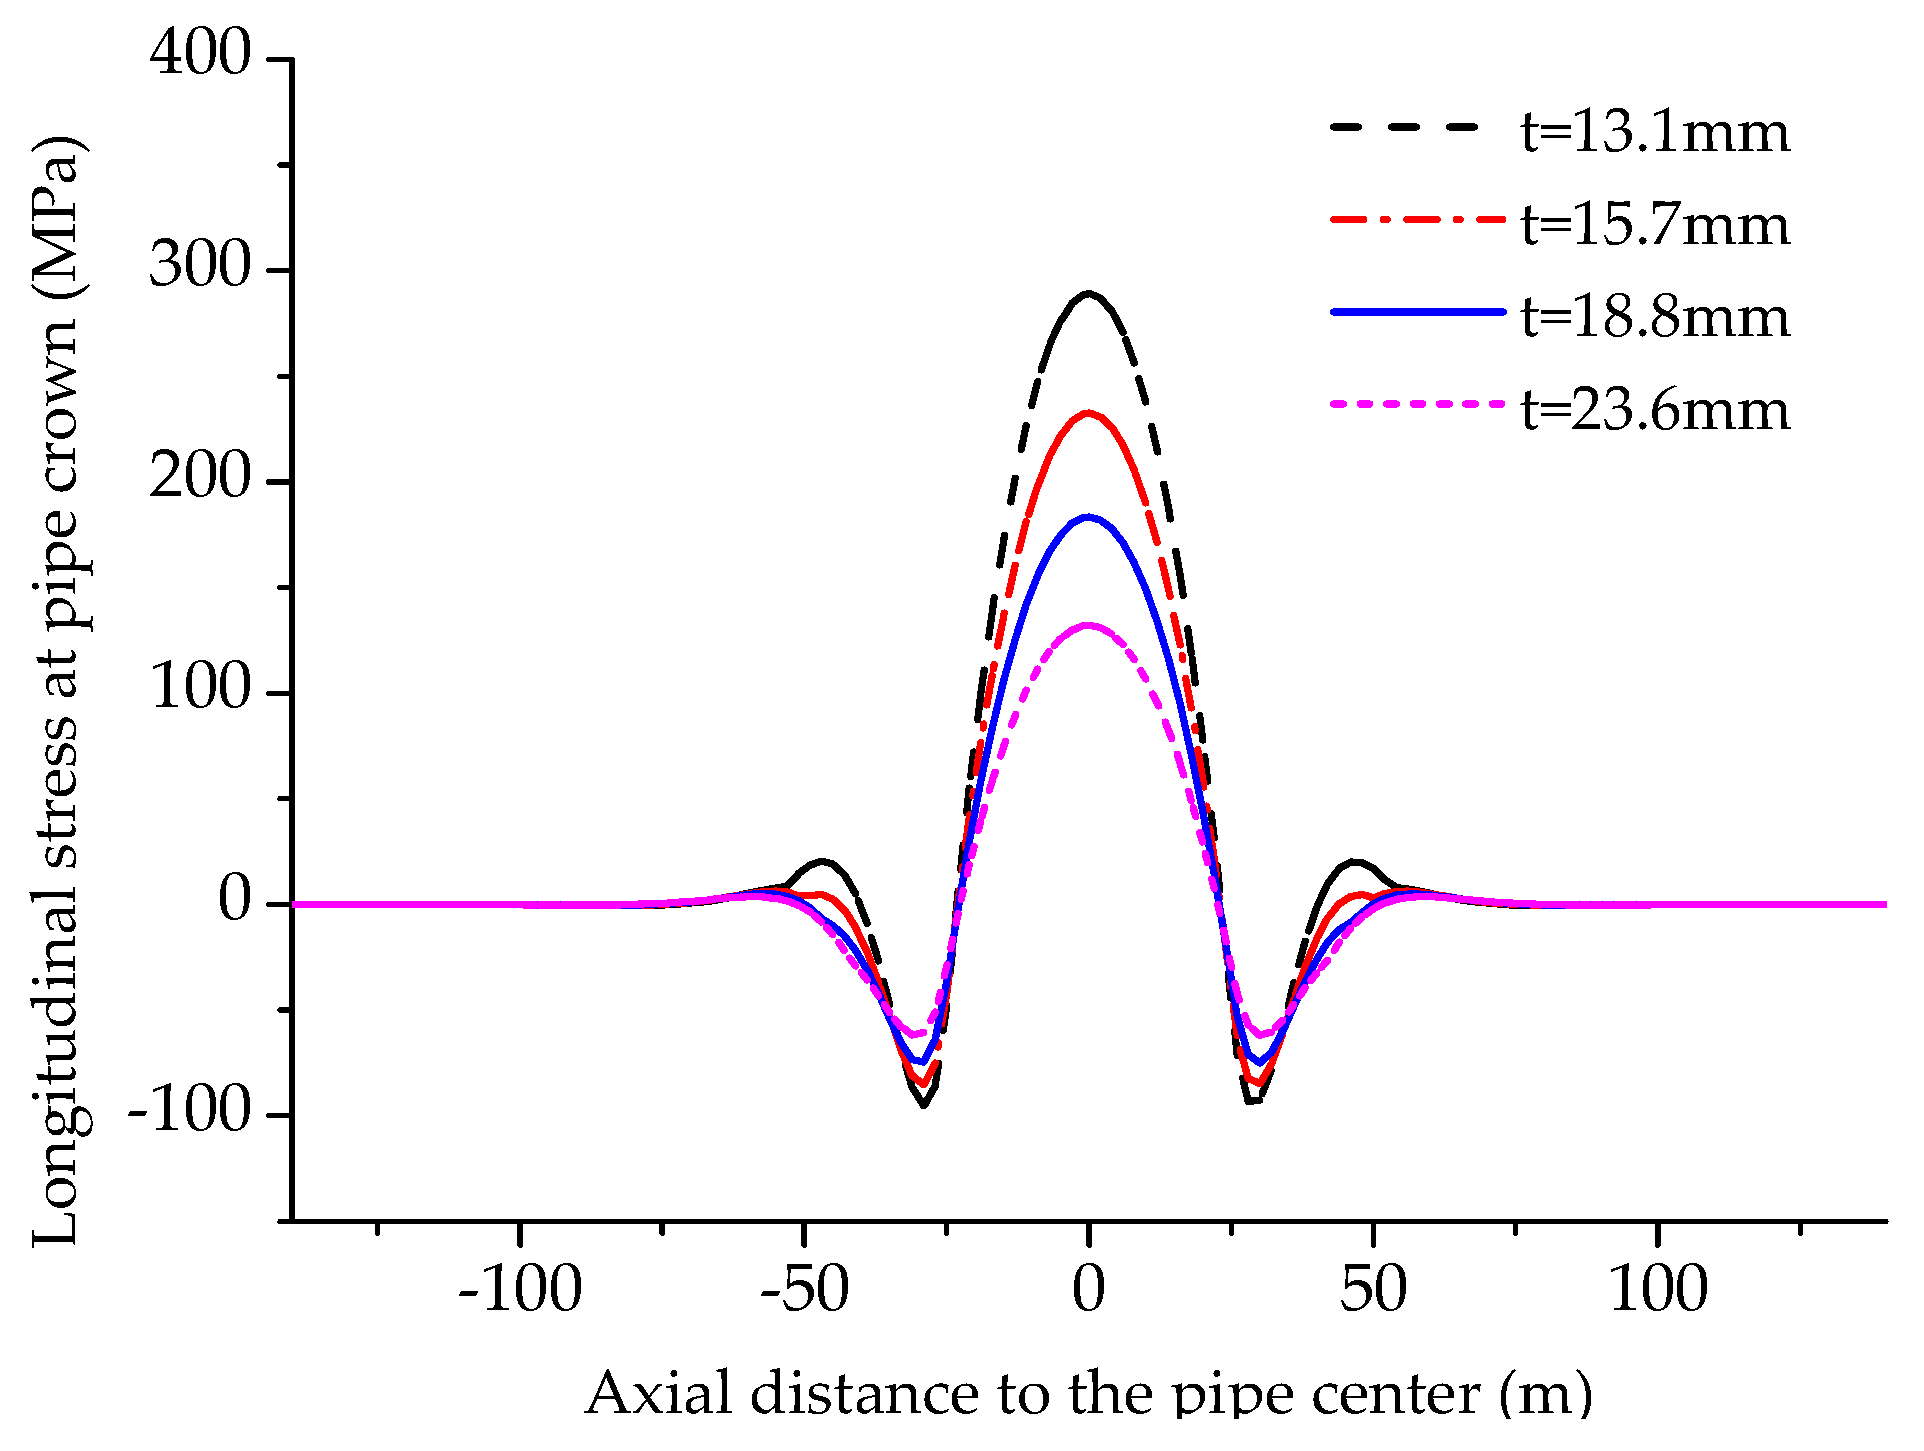
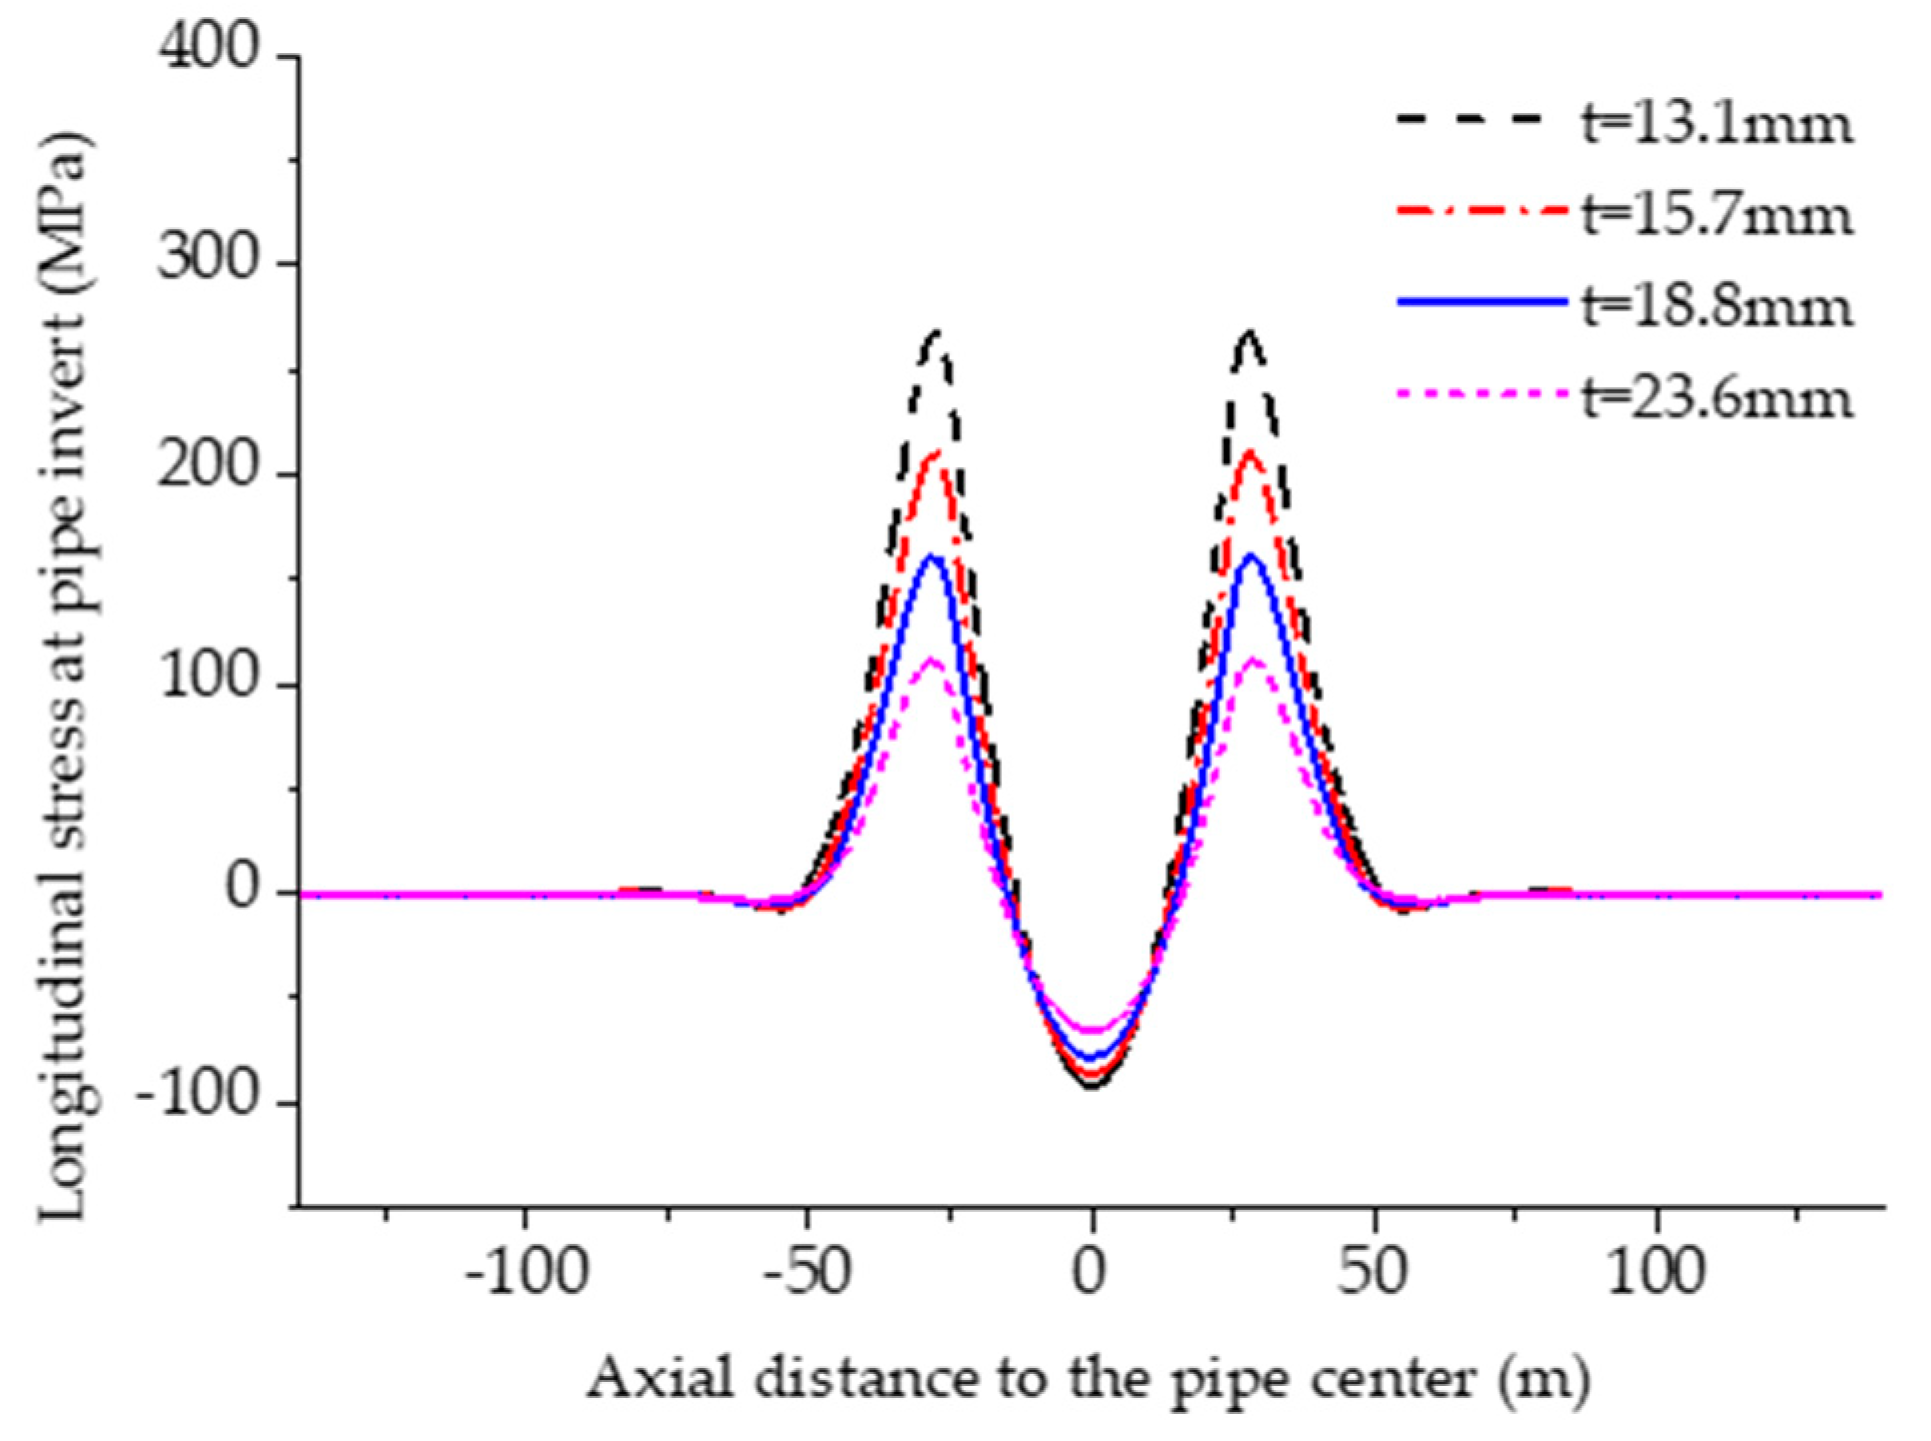
5.2. Effects of Pipe Wall Thickness

In pipeline engineering, various design factors are used for regions with different risk levels, According to ASME B31.8, four design factors i.e., 0.72, 0.6, 0.5 and 0.4 are used [28]. Thus, for X70 steel pipe with diameter equals 0.914 m, four pipe wall thicknesses are designed, i.e., 13.1 mm, 15.7 mm, 18.8 mm and 23.6 mm, respectively.
In this section, the effects of the pipe wall thickness on pipe’s mechanical behaviors are investigated in detail. Figure 14 plots the vertical uplift displacements of X70 pipes with various wall thicknesses. Obviously, the maximum uplift displacement decreases with the increase of wall thickness, since increasing pipe wall thickness increases pipe’s bending stiffness and gravity load.
As shown in Figure 15 and Figure 16, both the longitudinal stresses at pipe crown and pipe invert decrease linearly as the increase of pipe wall thickness. Variation of tensile stresses induced by wall thickness changing is more obvious comparing with that of compressive stresses. For pipe with wall thickness equals 13.1 mm, small tensile stresses occurs at pipe crown in pipe segments near the edge of liquefaction zone. While, for pipes with larger wall thicknesses negligible tensile stresses appear in these areas.

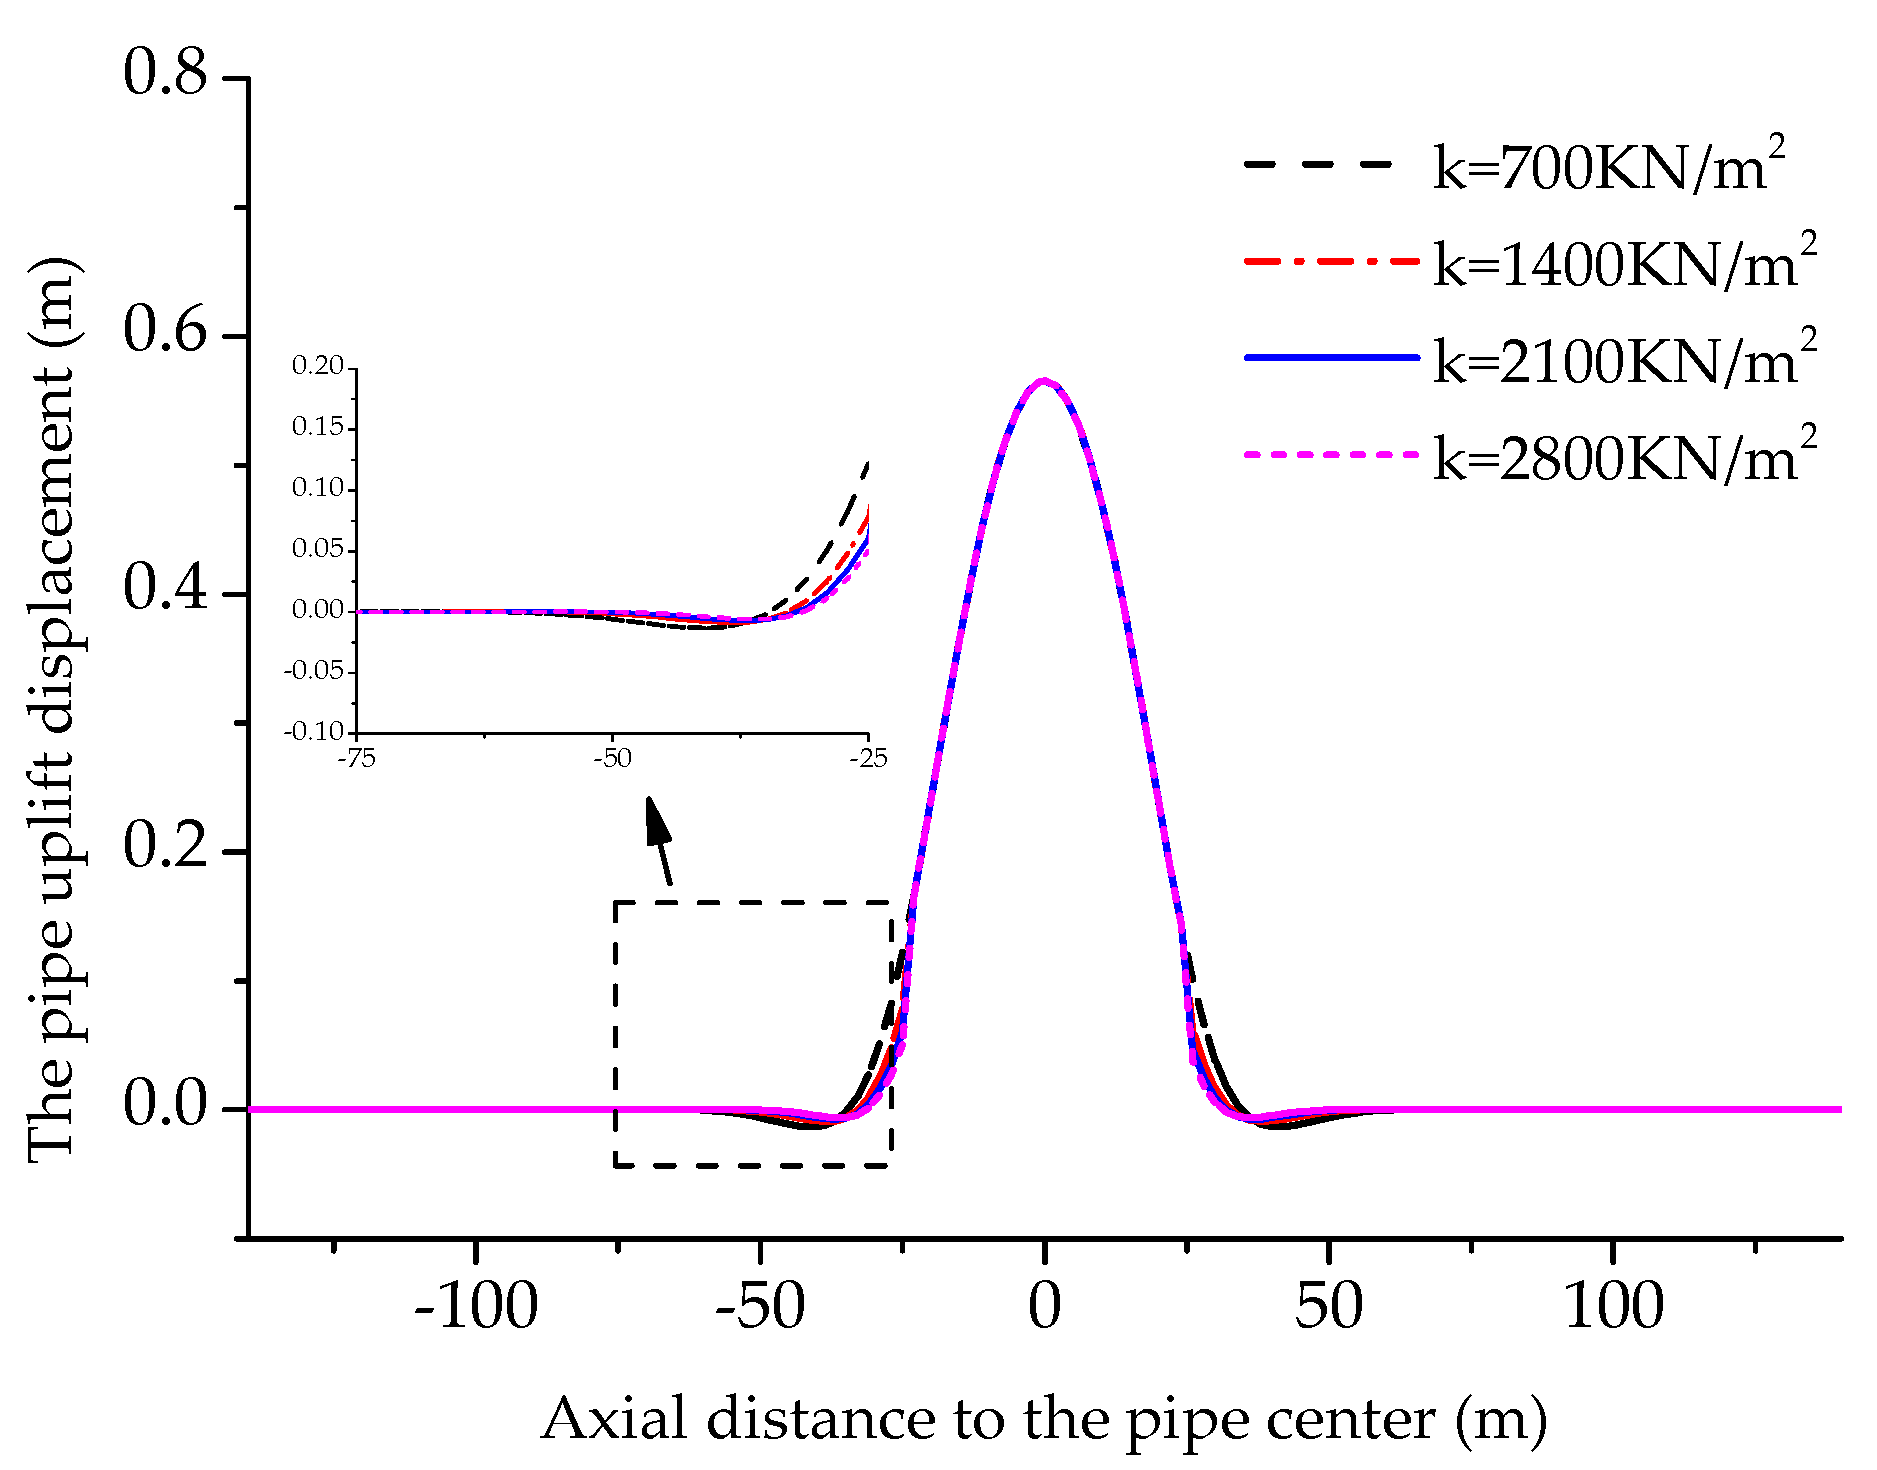
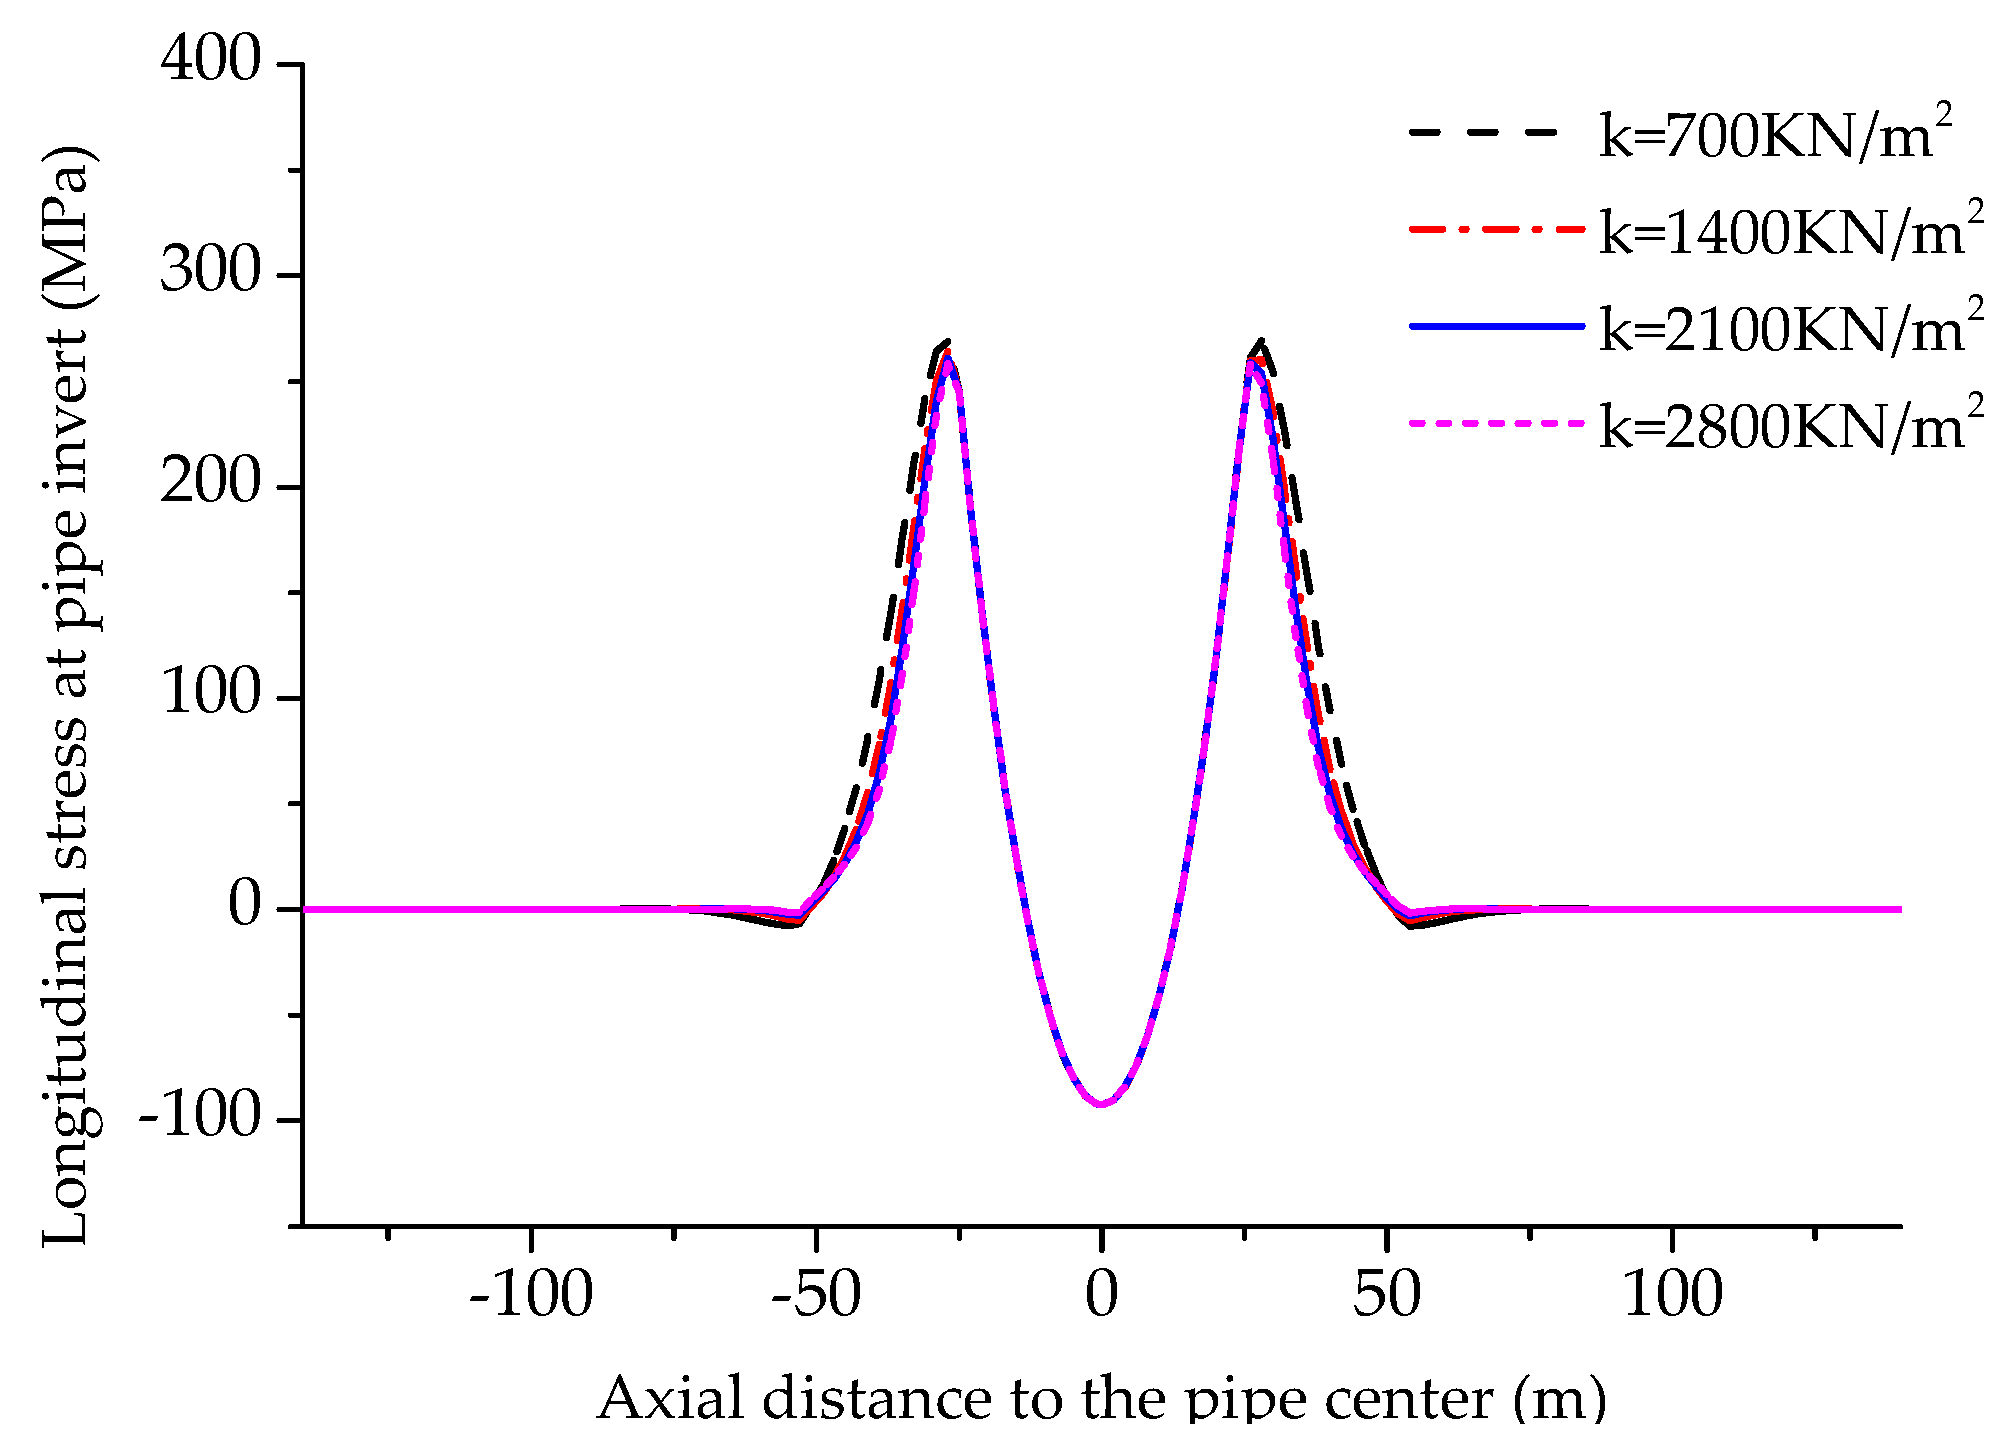
5.3. Effects of Soil Spring Stiffness

The burial depth of pipe and the soil properties can directly influence the soil constraints on pipe [29,30]. In this section, four soil spring stiffness were chosen for soils in non-liquefaction areas to investigate their effects on pipe’s structural response under buoyancy load. The soil spring stiffness values selected are 700, 1400, 2100 and 2800 kN/m2.
Figure 17 illustrates the vertical deformation curves of pipes buried in soils with different soil spring stiffness. The maximum uplift displacements remains the same with the variation of soil spring stiffness. Only the pipe segments near the edge of liquefaction zones have small difference when the soil spring stiffness changes, i.e., with a smaller soil spring stiffness, a relatively larger deformation occurs in this region. This is because soils with smaller soil spring stiffness has smaller reaction forces on pipes when relative movement exist between buried pipe and soil.
Figure 18 and Figure 19 illustrate the longitudinal stresses in pipe crown and pipe invert with various soil spring stiffnesses, respectively. Similar to Figure 14, the longitudinal stresses in pipes in the liquefaction zone almost remain the same when the soil spring stiffness changes. Pipelines buried in soils with smaller soil spring stiffness have a relatively larger longitudinal stresses than pipes near the edge of a liquefaction zone.

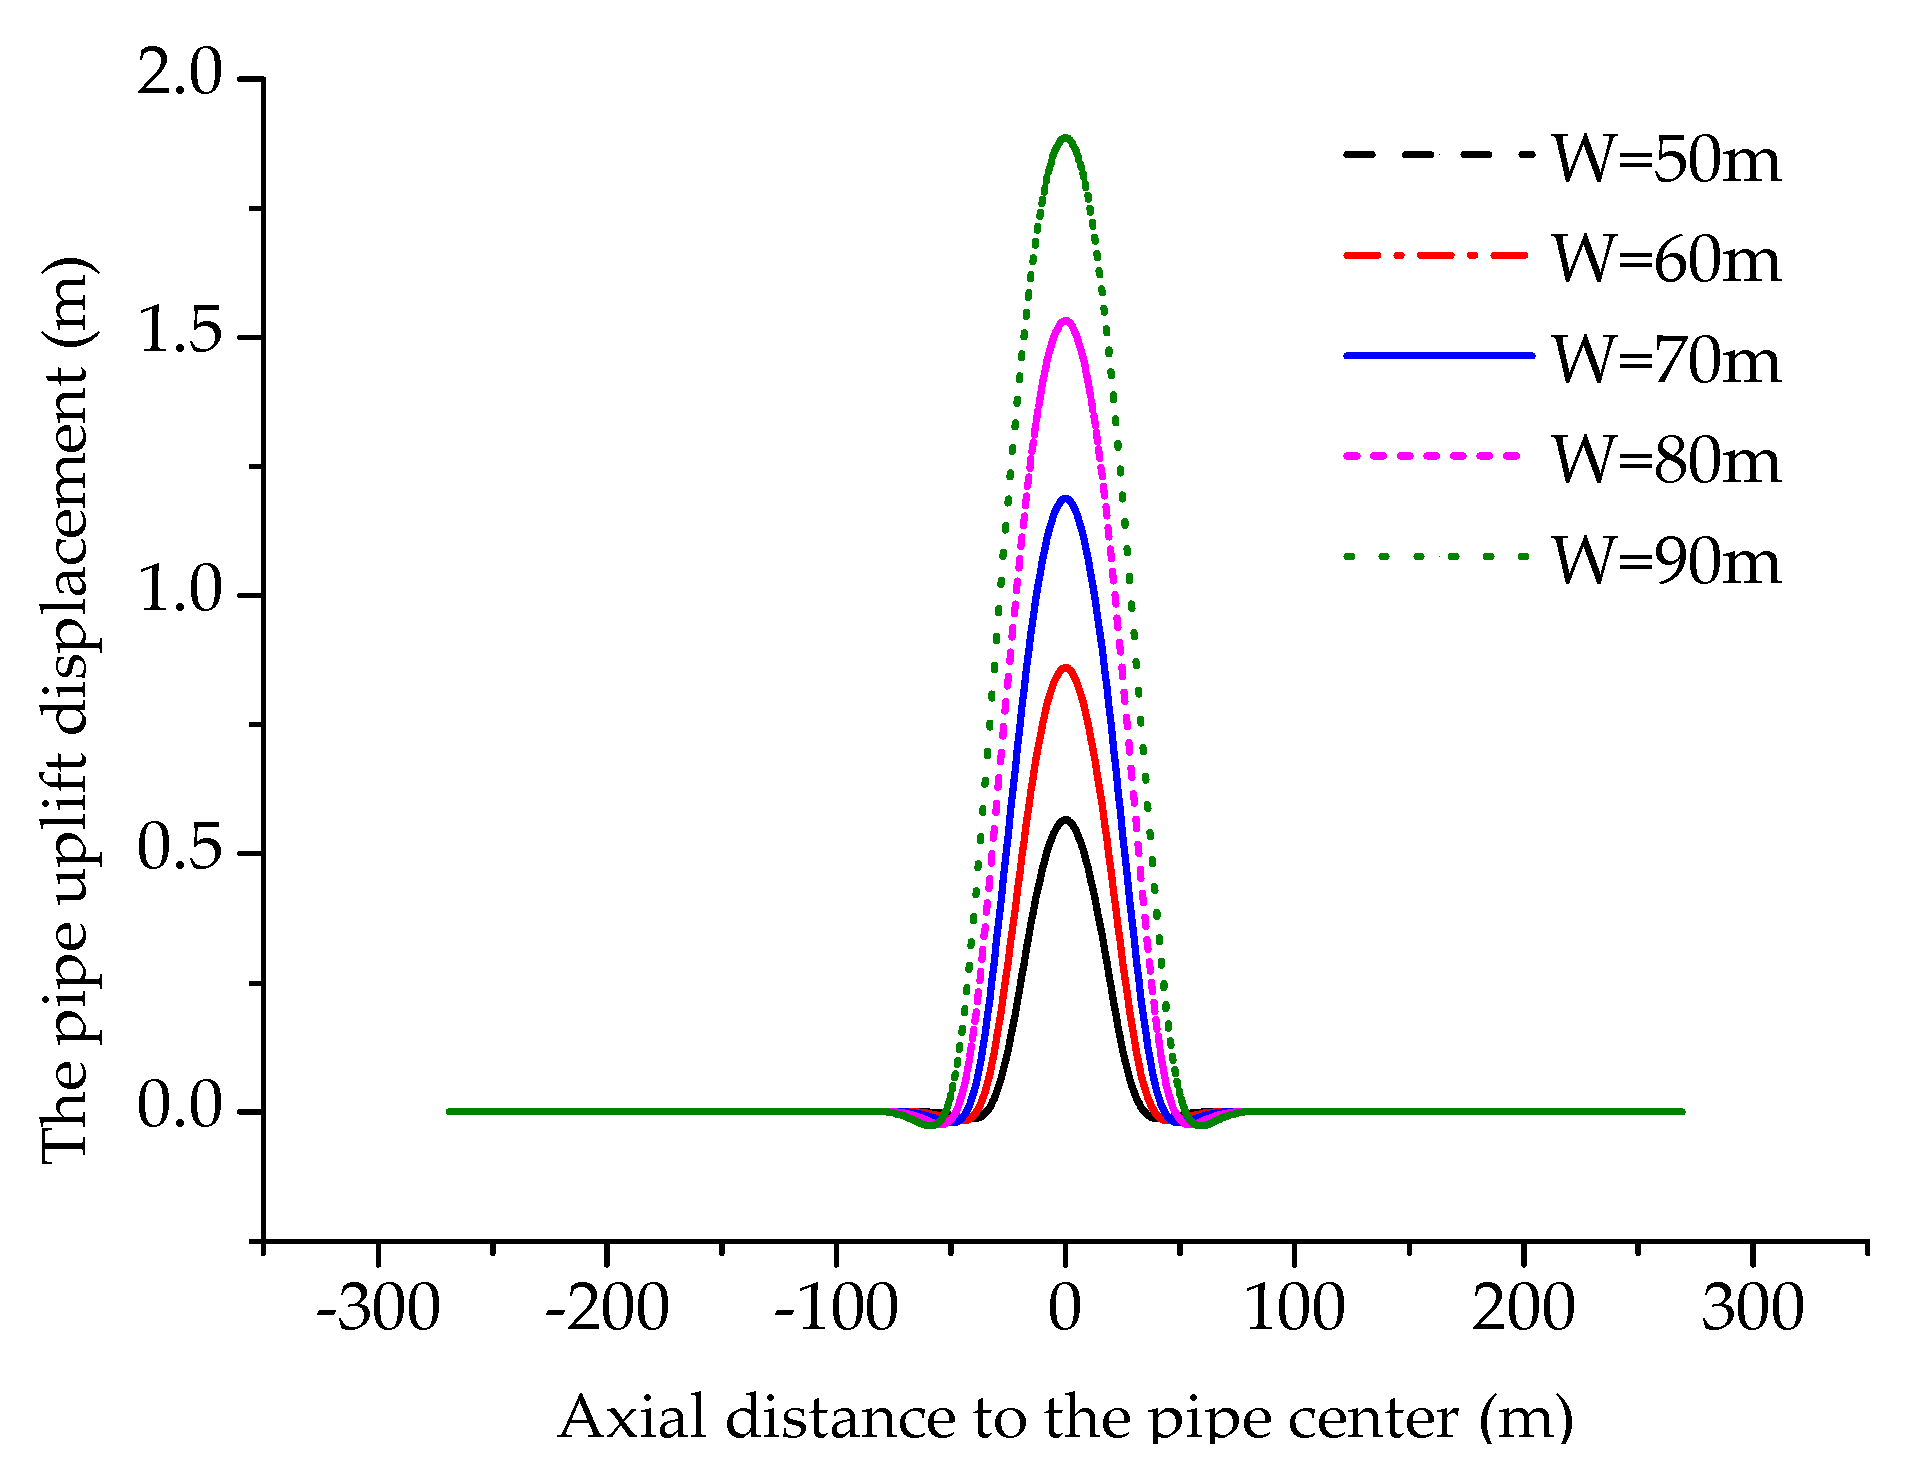
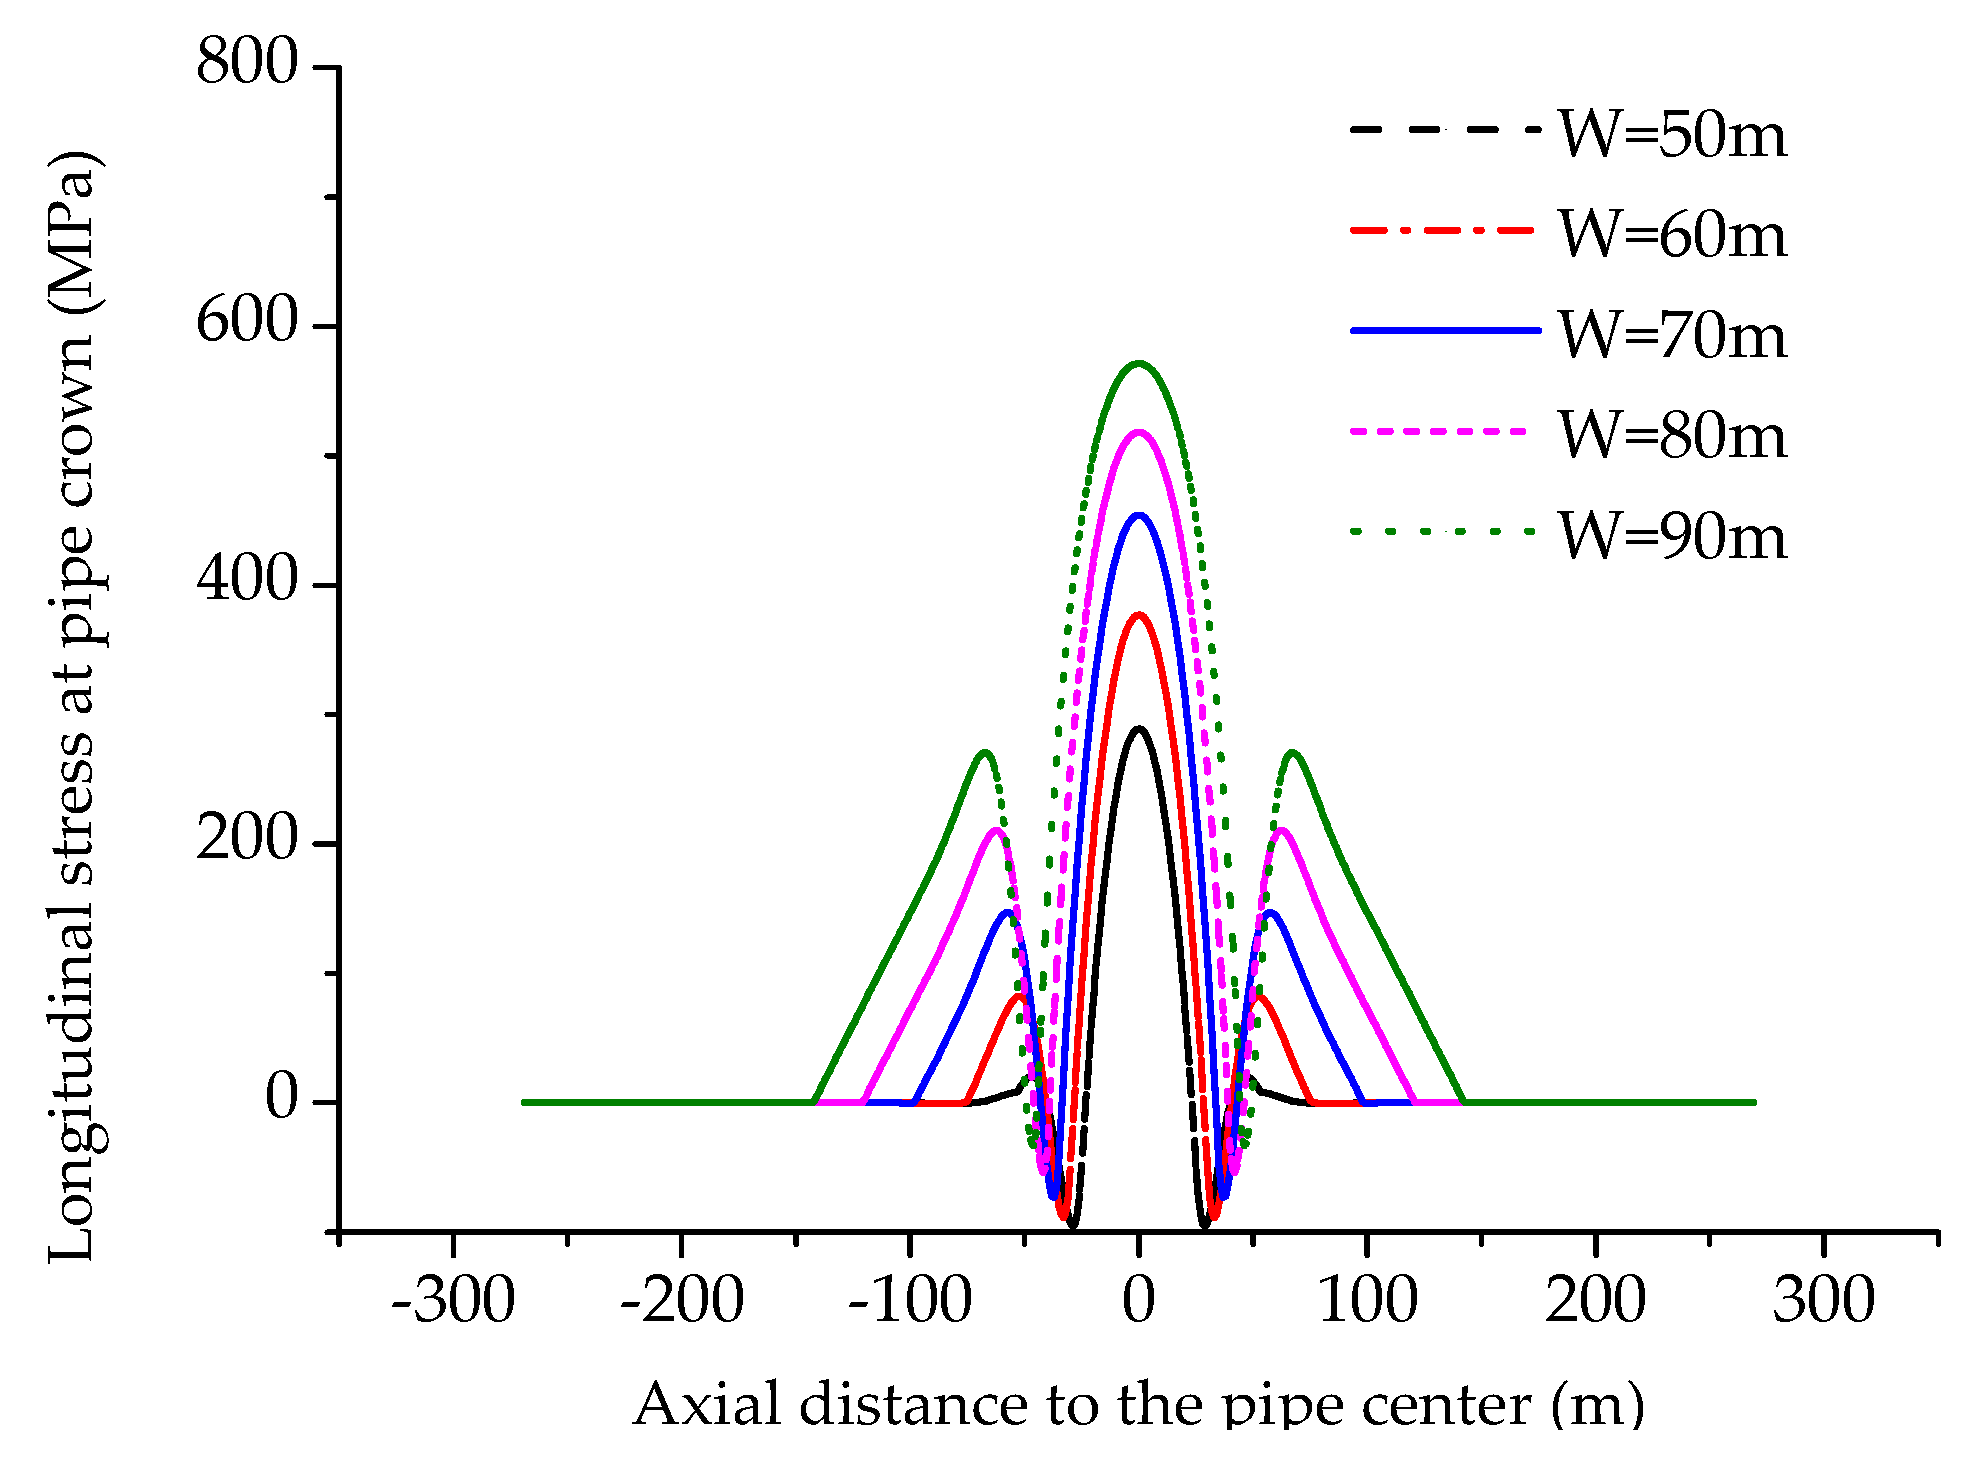
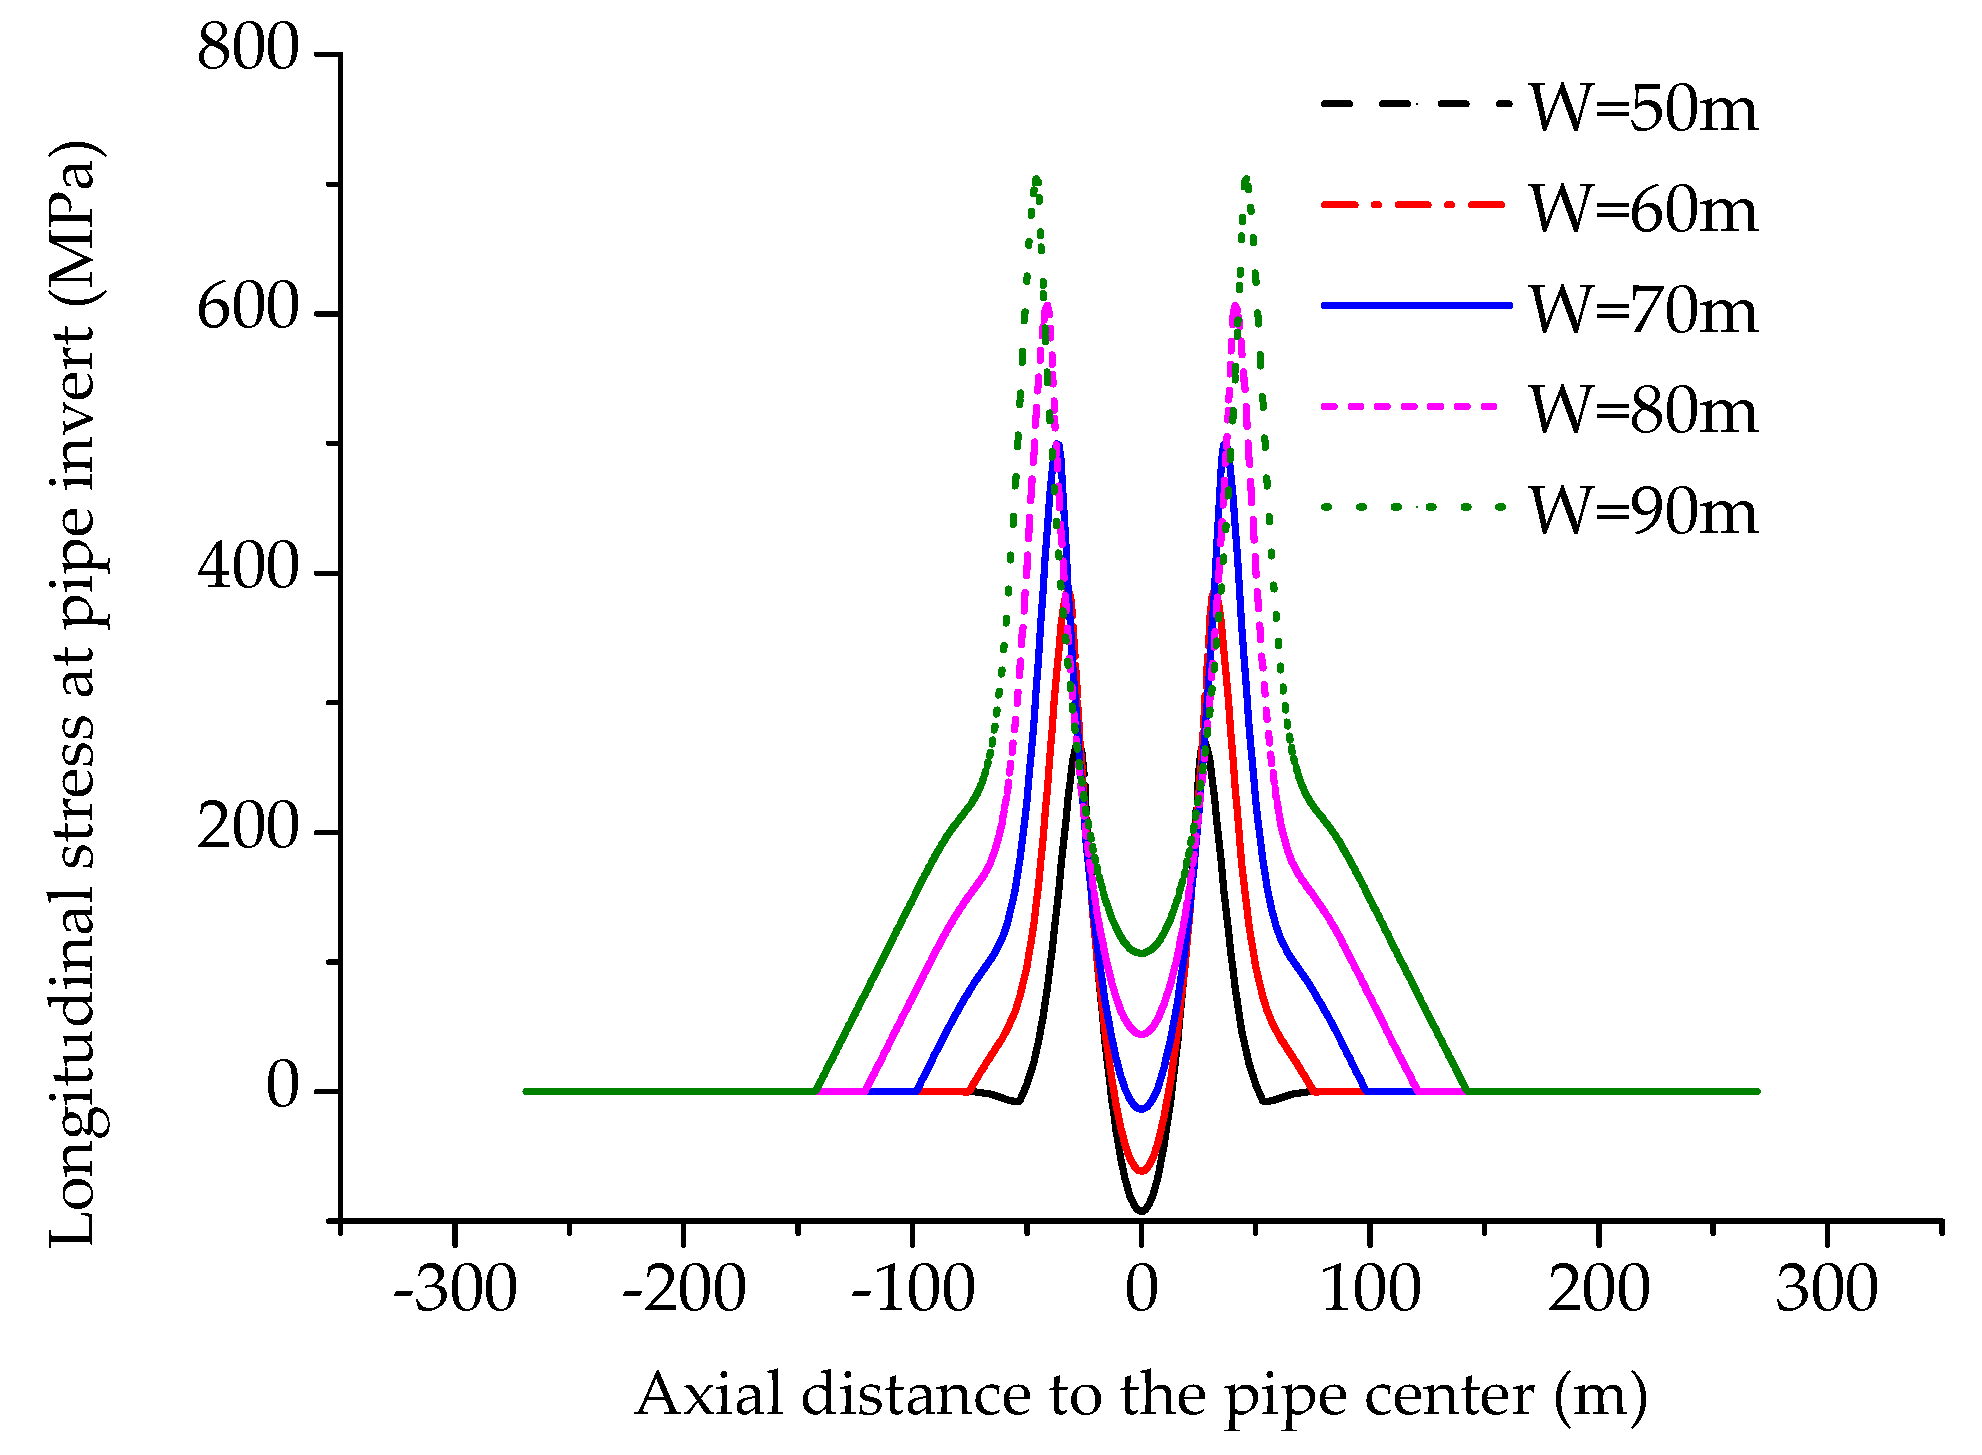
5.4. Effects Width of Liquefaction Zone

In this section, the effects of the width of liquefaction zone on a pipe’s mechanical responses were elucidated. The width values considered here range from 50 m to 90 m. Figure 20 shows that with the increase of width of the liquefaction zone, the pipe uplift displacement increases obviously. For the case where the width of liquefaction zone equals 90 m, the pipe uplift displacement is larger than the buried depth of pipe, which indicates that the pipe has been uplifted above the ground in this condition.
Correspondingly, the influences of width of liquefaction zone on the longitudinal stresses in pipe were also investigated systematically here, as shown in Figure 21 and Figure 22. It can be obtained that, with the increase of width of liquefaction zone, the tensile stresses at both pipe crown and pipe invert increase significantly. This is in good agreement with the deformation analysis results derived by Figure 20. That is with a larger width of liquefaction zone, much larger deformation appears in the pipe, which induces larger tensile axial stress in the pipe leading to the larger tensile longitudinal stresses shown in Figure 21 and Figure 22.

6. Conclusions

A systematica analytical and numerical analysis of buried gas steel pipeline under buoyancy loads due to liquefied soil was performed in this study. A linear elastic model was chosen for the pipe steel, which makes this method mainly suitable for design purposes. Based on the governing equations of beams in bending and tension and beams on an elastic foundation, equations solving pipe deflection values, pipe internal moments and forces were derived. Deformation compatibility equations between pipeline physical elongation and pipeline geometrical elongation was also utilized to obtain the axial force on the pipe. By comparing the derived results of the proposed model with finite element model results for cases with various engineering parameters, the proposed analytical method has proven to be capable of accurately calculating pipe uplift displacements and stresses. Based on the established analytical model, parametric analyses were also conducted to derive how the common engineering parameters influences a pipe’s mechanical behaviors. Results show that smaller pipe diameter can lead to larger uplift displacement and result in larger longitudinal stresses in pipe, especially the large tensile stresses at the center and edge of pipe segment in liquefaction zones. Larger pipe wall thicknesses can efficiently decrease a pipe’s uplift displacement. The effects of pipe wall thickness on the tensile stresses in pipe are more obvious than the effects of pipe wall thickness on compressive stresses in pipes. The stiffness of soils in non-liquefaction zones have a negligible influence on the displacement and stress results of pipe segment in the center of liquefaction zone, while pipelines in liquefaction zones with large widths are extremely dangerous, because pipe uplift risks and pipe tensile stresses in pipe both significantly increase with the increase of the width of the liquefaction zone.

Author Contributions

H.Z. conceived and designed the analysis. M.X. deduced the analytical model, established the numerical model, performed the parametric analysis and wrote the paper.

Acknowledgments

This research has been co-financed by China National Key Research and Development Project (Grant No. 2016YFC0802105), China Scholarship Council (Grant No. 201706440094).

Conflicts of Interest

The authors declare no conflict of interest.

Nomenclature

αthe thermal expansion coefficient
Cheight of soil fill over pipeline (m)
C1~C8the unknown coefficients
Doutside diameter of pipe (m)
Epipe’s initial elastic modulus (MPa)
Fthe axial force in pipe (N)
Fbbuoyant force per unit length on pipeline (N/m)
Fstressthe resistance factor
γddry unit weight of backfill (N/m3)
γwunit weight of water (N/m3)
hwheight of water above pipeline (m)
σyminimum yield strength of the pipe material (MPa)
σaxthe axial stress in pipe (MPa)
σhothe hoop stress in pipe (MPa)
σLinitial axial stress in pipe induced by service load (MPa)
σ max L maximum stress induced by liquefaction buoyancy in pipe (MPa)
Ithe inertia moment (m4)
kstiffness of the elastic soil spring (N/m)
Lblength of pipe in buoyancy zone (m)
MBthe moment at point B (N·M)
PBthe shear force at point B (N)
Pvvertical earth pressure (Pa)
qthe buoyancy load per unit pipe length (N/m)
Rwa factor for water buoyancy
T1the ambient temperature at time of restraint (°C)
T2the maximum operating temperature (°C)
μPossion’s ratio
w1the pipe configuration in non-liquefaction zone (m)
w2the pipe configuration in liquefaction area (m)
Wpweight of pipe per unit length (N/m)
Wcweight of pipe content per unit length (N/m)
ε max L maximum axial strain induced by liquefaction buoyancy in pipe
Zsection modulus of pipe cross section (m3)

References

  1. Wen, K.; Xia, Z.; Yu, W.; Gong, J. A New Lumped Parameter Model for Natural Gas Pipelines in State Space. Energies 2018, 11, 1971. [Google Scholar] [CrossRef]
  2. Wen, K.; He, L.; Yu, W.; Gong, J. A Reliability Assessment of the Hydrostatic Test of Pipeline with 0.8 Design Factor in the West–East China Natural Gas Pipeline III. Energies 2018, 11, 1197. [Google Scholar] [CrossRef]
  3. Liu, X.B.; Zhang, H.; Wu, K.; Xia, M.Y.; Chen, Y.F.; Li, M. Buckling failure mode analysis of buried X80 steel gas pipeline under reverse fault displacement. Eng. Fail. Anal. 2017, 77, 50–64. [Google Scholar] [CrossRef]
  4. Wang, X.; Wang, Z.Y.; Han, B. Mechanical Response Analysis of Pipeline under the Action of Floods. In Proceedings of the International Conference on Pipelines and Trenchless Technology, Xi’an, China, 16–18 October 2013. [Google Scholar]
  5. Li, S.J.; Duan, Q.Q.; Zhang, H.; Wang, J. Failure analysis of the floating pipeline with defect under flooding load. Eng. Fail. Anal. 2017, 77, 65–75. [Google Scholar] [CrossRef]
  6. Xia, M.; Zhang, H. An Analytical Approach for Strain Analysis of Buried Steel Pipeline in Mining Subsidence Areas. In Proceedings of the ASME Pressure Vessel and Piping Conference, Waikoloa, HI, USA, 16–20 July 2017. [Google Scholar]
  7. Liu, X.B.; Zhang, H.; Han, Y.S.; Xia, M.Y.; Zheng, W. A semi-empirical model for peak strain prediction of buried X80 steel pipelines under compression and bending at strike-slip fault crossings. J. Nat. Gas Sci. Eng. 2016, 32, 465–475. [Google Scholar] [CrossRef]
  8. Liu, X.B.; Zhang, H.; Gu, X.T.; Chen, Y.F.; Xia, M.Y.; Wu, K. Strain demand prediction method for buried X80 steel pipelines crossing oblique-reverse faults. Earthq. Struct. 2017, 12, 321–332. [Google Scholar] [CrossRef]
  9. Liu, X.B.; Zhang, H.; Li, M.; Xia, M.Y.; Zheng, W.; Wu, K.; Han, Y.S. Effects of steel properties on the local buckling response of high strength pipelines subjected to reverse faulting. J. Nat. Gas Sci. Eng. 2016, 33, 378–387. [Google Scholar] [CrossRef]
  10. Liu, X.B.; Zhang, H.; Xia, M.Y. Buckling behavior of buried steel pipeline under compression strike-slip fault. In Proceedings of the 2017 ASME Pressure Vessels & Piping Conference, Waikoloa, HI, USA, 16–20 July 2017. [Google Scholar]
  11. Liu, X.B.; Zhang, H.; Onyekachi, N.; Xia, M.Y.; Cheng, J.J.; Li, Y.; Adeeb, S. Effects of Stress–Strain Characteristics on Local Buckling of X80 Pipe Subjected to Strike-Slip Fault Movement. J. Press. Vessel Technol. 2018, 140. [Google Scholar] [CrossRef]
  12. Uckan, E.; Akbas, B.; Shen, J.; Rou, W.; Paolacci, W.; O’Rourke, M. A simplified analysis model for determining the seismic response of buried steel pipes at strike-slip fault crossings. Soil Dyn. Earthq. Eng. 2015, 75, 55–65. [Google Scholar] [CrossRef]
  13. Kaya, E.S.; Uckan, E.; O’Rourke, M.J.; Karamanos, S.A.; Akbas, B.; Cakir, F.; Cheng, Y. Failure analysis of a welded steel pipe at Kullar fault crossing. Eng. Fail. Anal. 2016, 71, 43–62. [Google Scholar] [CrossRef]
  14. Kainat, M.; Lin, M.; Cheng, J.R.; Martens, M.; Adeeb, S. Effects of the initial geometric imperfections on the buckling behavior of high-strength UOE manufactured steel pipes. J. Press. Vessel Technol. 2016, 138. [Google Scholar] [CrossRef]
  15. Hojat Jalali, H.; Rofooei, F.R.; Attari, N.K.A. Performance of Buried Gas Distribution Pipelines Subjected to Reverse Fault Movement. J. Earthq. Eng. 2017, 10, 1–24. [Google Scholar] [CrossRef]
  16. Hojat, J.H.; Rofooei, F.R.; Attari, N.K.A.; Samadian, M. Experimental and finite element study of the reverse faulting effects on buried continuous steel gas pipelines. Soil Dyn. Earthq. Eng. 2016, 86, 1–14. [Google Scholar] [CrossRef]
  17. Lu, H.; Ma, G.; Li, X.; Wu, S. Stress Analysis of LNG Storage Tank Outlet Pipes and Flanges. Energies 2018, 11, 877. [Google Scholar] [CrossRef]
  18. Neupane, S.; Adeeb, S.; Cheng, R.; Ferguson, J.; Martens, M. Modeling the deformation response of high strength steel pipelines—Part I: Material characterization to model the plastic anisotropy. J. Appl. Mech. 2012, 136, 272–275. [Google Scholar] [CrossRef]
  19. Neupane, S.; Adeeb, S.; Cheng, R.; Ferguson, J.; Martens, M. Modeling the deformation response of high strength steel pipelines—Part II: Effects of material characterization on the deformation response of pipes. J. Appl. Mech. 2012, 79. [Google Scholar] [CrossRef]
  20. Liu, X.B.; Zhang, H.; Xia, M.; Chen, Y.F.; Wu, K.; Wang, B.D. Numerical Analysis and Strength Evaluation of an Exposed River Crossing Pipeline with Casing Under Flood Load. Available online: https://doi.org/10.3311/PPci.11605 (accessed on 1 June 2018).
  21. Lin, J.Q.; Xiong, J.G. Analysis for floating response of buried pipeline in liquefied soil. Earthq. Eng. Eng. Vib. 2000, 20, 97–100. [Google Scholar]
  22. Ai, X.Q.; Li, J. Analysis of Seismic Response of Underground Pipelines in Terms of Effective Stress. J. Disaster Prev. Mitig. Eng. 2005, 25, 1–7. [Google Scholar]
  23. Shang, E.J. Safety Assessment of Pipeline in Region of Stratum Collapse and Soil Liquefaction for Sichuan-East Gas Transportation Project. Master’s Thesis, China University of Petroleum (EastChina), Qingdao, China, 2009. [Google Scholar]
  24. Kong, X.J.; Zou, D.G. Study on uplift behavior of pipelines based on post-liquefaction deformation method. Chin. J. Geol. Eng. 2007, 29, 1199–1204. [Google Scholar]
  25. American Society of Civil Engineers, Guidelines for the Design of Buried Steel Pipe; American Lifelines Alliance: Reston, VA, USA, 2005.
  26. Indian Institute of Technology Kanpur. IITK-GSDMA Guidelines for Seismic Design of Buried Pipelines, Gandhinagar: Gujarat State Disaster Management Authority; Indian Institute of Technology Kanpur: Kalyanpur, India, 2007. [Google Scholar]
  27. Codeofchina Inc. GB 50470-2008 Seismic Technical Code for Oil and Gas Transmission Pipeline Engineering; Codeofchina Inc.: Beijing, China, 2017. [Google Scholar]
  28. American Society of Mechanical Engineers. Gas Transmission and Distribution Piping Systems; ANSI/ASME2016, B31:8; American Society of Mechanical Engineers: New York, NY, USA, 2016. [Google Scholar]
  29. Canadian Standard Association (CSA). Oil and Gas Pipeline Systems; CSA Standard; CSA Z662-11; Canadian Standard Association: Mississauga, ON, Canada, 2015. [Google Scholar]
  30. Committee on Gas and Liquid Fuel Lifelines of the American Society of Civil Engineers Technical Council on Lifeline Earthquake Engineering. Guidelines for the Seismic Design of Oil and Gas Pipeline Systems; ASCE: Reston, VA, USA, 1984; pp. 10–12. [Google Scholar]
Figure 1. Buoyancy load acting on the pipeline [26] (a) Cross section of the pipeline showing the forces acting on it due to buoyancy; (b) Longitudinal section of the pipeline showing the forces acting on it due to buoyancy.
Energies 11 02334 g001
Figure 2. Schematic diagram of buried pipeline crossing liquefaction area.
Energies 11 02334 g002
Figure 3. Mechanical model for pipe segment (BC) in non-liquefaction zone.
Energies 11 02334 g003
Figure 4. Mechanical model for pipe segment (AB) in liquefaction zone.
Energies 11 02334 g004
Figure 5. Sketch of the finite element model for buried pipeline subjected to buoyancy load.
Energies 11 02334 g005
Figure 6. Pipe vertical deformation results for the considered cases.
Energies 11 02334 g006
Figure 7. Comparative results of longitudinal stresses in pipe for Case 2 listed in Table 1.
Energies 11 02334 g007
Figure 8. Results for a liquefaction zone length equal to 30 m.
Energies 11 02334 g008aEnergies 11 02334 g008b
Figure 9. Results for a liquefaction zone length equal to 80 m.
Energies 11 02334 g009
Figure 10. Results for a liquefaction zone length equal to 120 m.
Energies 11 02334 g010
Figure 11. Vertical deformations for pipes with various diameters.
Energies 11 02334 g011
Figure 12. Longitudinal stresses at pipe crown for pipes with various diameters
Energies 11 02334 g012
Figure 13. Longitudinal stresses at pipe invert for pipes with various diameters.
Energies 11 02334 g013
Figure 14. Vertical deformations for pipes with various wall thicknesses.
Energies 11 02334 g014
Figure 15. Longitudinal stresses at pipe crown for pipes with various wall thicknesses.
Energies 11 02334 g015
Figure 16. Longitudinal stresses at pipe invert for pipes with various wall thicknesses.
Energies 11 02334 g016
Figure 17. Vertical deformations for pipes buried in soils with various soil spring stiffness.
Energies 11 02334 g017
Figure 18. Longitudinal stresses at pipe crown for pipes with various wall thicknesses.
Energies 11 02334 g018
Figure 19. Longitudinal stresses at pipe invert for pipes with various wall thicknesses.
Energies 11 02334 g019
Figure 20. Vertical deformations for pipes buried in soils with various soil spring stiffnesses.
Energies 11 02334 g020
Figure 21. Longitudinal stresses at pipe crown for pipes with various wall thicknesses.
Energies 11 02334 g021
Figure 22. Longitudinal stresses at pipe invert for pipes with various wall thicknesses.
Energies 11 02334 g022
Table 1. Engineering parameters for the three different cases.
Case NumberYield Strength of Pipe Material (MPa)Pipe Diameter (mm)Pipe Wall Thickness (mm)Pipe Buried Depth (m)Pipe Length in Liquefaction Zone (m)
Case 148391413.11.830
Case 248391413.11.850
Case 348391417.51.850

