Article

Investigation of the Effect of Winding Clamping Structure on Frequency Response Signature of 11 kV Distribution Transformer

by
Avinash Srikanta Murthy
1,
Norhafiz Azis
1,2,*,
Salem Al-Ameri
3,
Mohd Fairouz Mohd Yousof
3,*,
Jasronita Jasni
1 and
Mohd Aizam Talib
4
1
Centre of Electromagnetics and Lightning Protection Research (CELP), Department of Electrical and Electronics Engineering, Faculty of Engineering, Universiti Putra Malaysia, UPM Serdang, Selangor 43400, Malaysia
2
Institute of Advanced Technology (ITMA), Department of Electrical and Electronics Engineering, Faculty of Engineering, Universiti Putra Malaysia, UPM Serdang, Selangor 43400, Malaysia
3
Faculty of Electrical and Electronics Engineering, Universiti Tun Hussein Onn Malaysia, Parit Raja, Johor 86400, Malaysia
4
TNB Research, Kajang, Selangor 43000, Malaysia
*
Authors to whom correspondence should be addressed.
Energies 2018, 11(9), 2307; https://doi.org/10.3390/en11092307
Submission received: 16 July 2018 / Revised: 2 August 2018 / Accepted: 6 August 2018 / Published: 2 September 2018

Abstract

:
This paper presents an investigation on the sensitivity of frequency response of a 500 kVA, 11/0.433 kV distribution transformer with and without the presence of a winding clamping structure. Frequency response analysis (FRA) measurements of multiple test configurations were carried out with and without the presence of a winding clamping structure. Statistical analyses based on Pearson’s correlation coefficient (PCC), Spearman’s correlation coefficient (SCC), Kendall’s correlation coefficient (KCC), cross-correlation coefficient (CCF), root mean square error (RMSE), absolute sum of logarithmic error (ASLE), hypothesis test (F-test) and relative factor (RF) were applied to determine the effect of the winding clamping structure. It was found that the removal of the winding clamping structure has an impact on the frequency response signature at the frequency less than 2 kHz during offline measurement. It was found that ASLE and F-test are suitable methods that can be used to indicate the variation of frequency response caused by clamping structure removal of the distribution transformer under study.

1. Introduction

Frequency response analysis (FRA) is a common non-destructive testing method used by utilities to monitor the mechanical integrity of transformer windings [1]. FRA is often used to diagnose various types of windings issues such as winding deformation, displacement, buckling, tilting, short circuit of turns, clamping structure looseness and core movement [2]. FRA measurement is sensitive towards mechanical changes in the winding. Several statistical and artificial intelligence (AI) techniques have been proposed for interpretation of mechanical changes in transformer windings based on FRA. Statistical techniques such as correlation coefficient (CC), absolute sum of logarithmic error (ASLE), minimum-maximum ratio (MM) and absolute average difference (DABS) have been proposed for the interpretation purpose in [3,4,5,6,7,8,9]. The Pearson’s correlation coefficient (PCC), Spearman’s correlation coefficient (SCC) and Kendall’s correlation coefficient (KCC) are compared in [10,11,12] using distributed dataset variables to distinguish the correlation characteristics. Expert techniques such as data mining and artificial neural network (ANN) have also been proposed for monitoring the condition of transformer windings [13]. In addition, evidential reasoning (ER) has been proposed to interpret the failure in clamping [14].
Previously, it was shown that movement of clamping structure can lead to the variation of the frequency response [15,16,17,18]. The clamping structure is used in the transformer for the stabilization of the winding assembly on the transformer core. In addition, it can also reduce the vibrations caused by electro-dynamic forces that exist during a transformer’s operations [19]. The effect of clamping is normally represented by an increment of shunt capacitance in the FRA equivalent circuit [17,20]. End-to-end open circuit and short circuit tests are recommended by IEEE Std C57.149-2012 [21] for FRA measurement of the transformer winding. A few studies have analyzed that looseness or breaking of the clamping structure can lead to mechanical changes in the windings [22,23,24,25]. The effects due to clamping faults are simulated based on lumped circuit model and the shunt conductance is varied for both end-to-end open circuit and short-circuit tests in order to analyze the degree of clamping faults [26].
This study aims to investigate the effect of clamping on the frequency response signature of a distribution transformer. The frequency responses of the transformer winding based on multiple test configurations with and without clamping are measured and analyzed based on different types of statistical methods.

2. Methodology

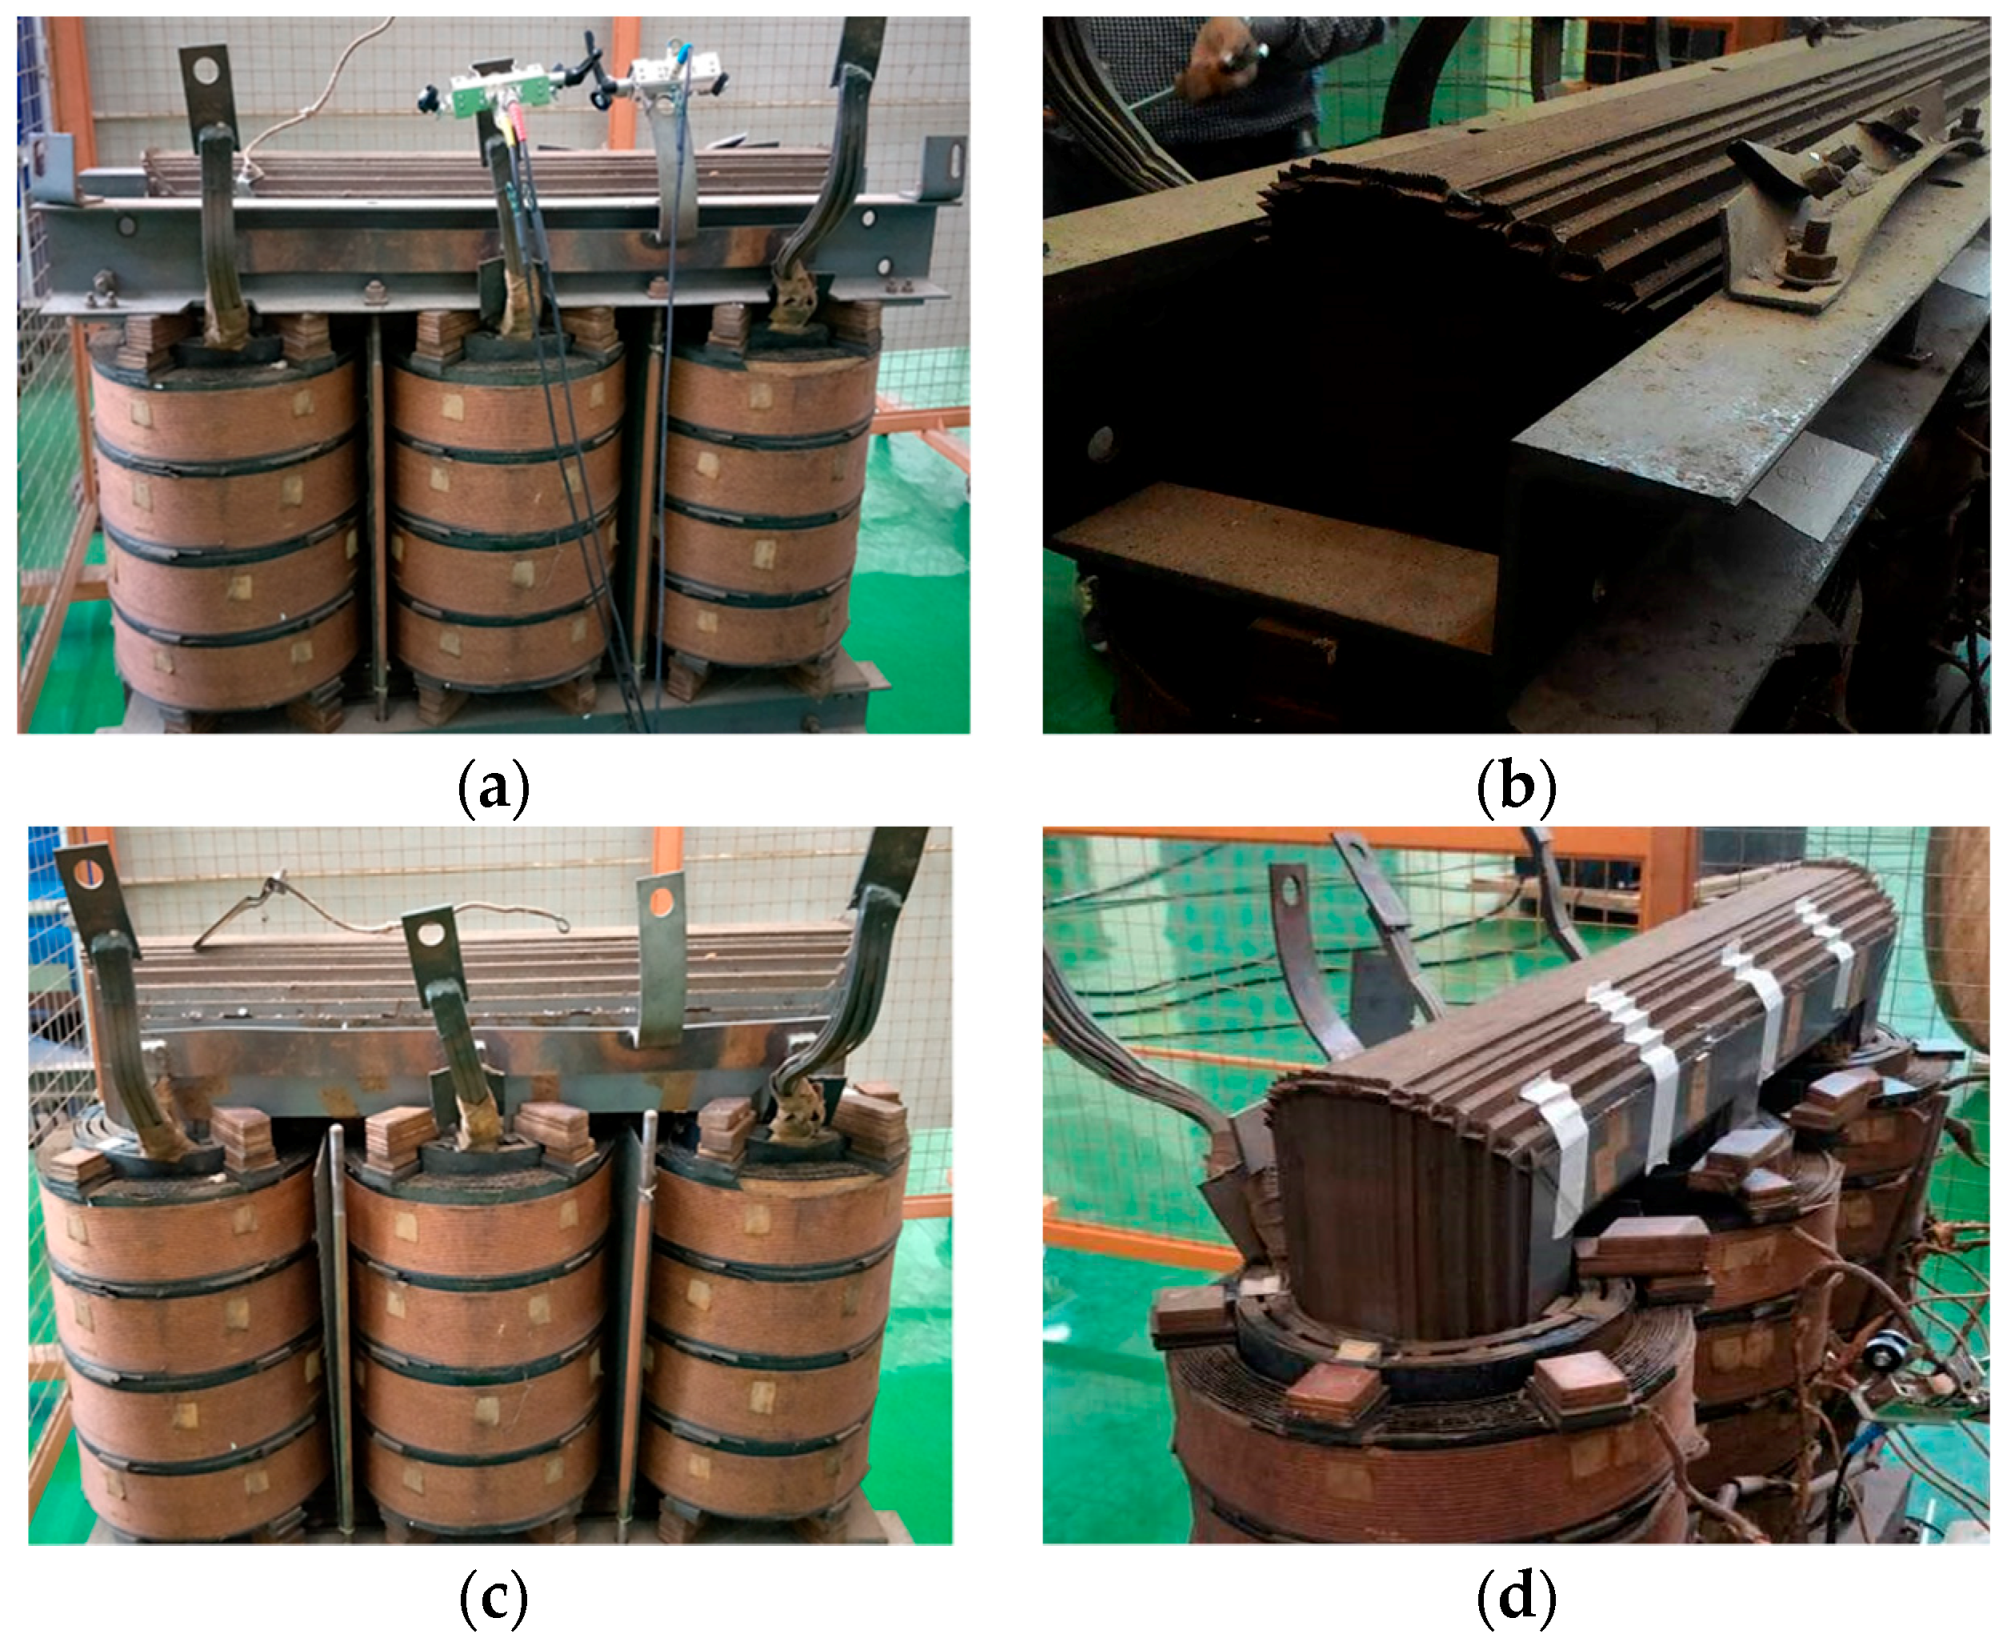
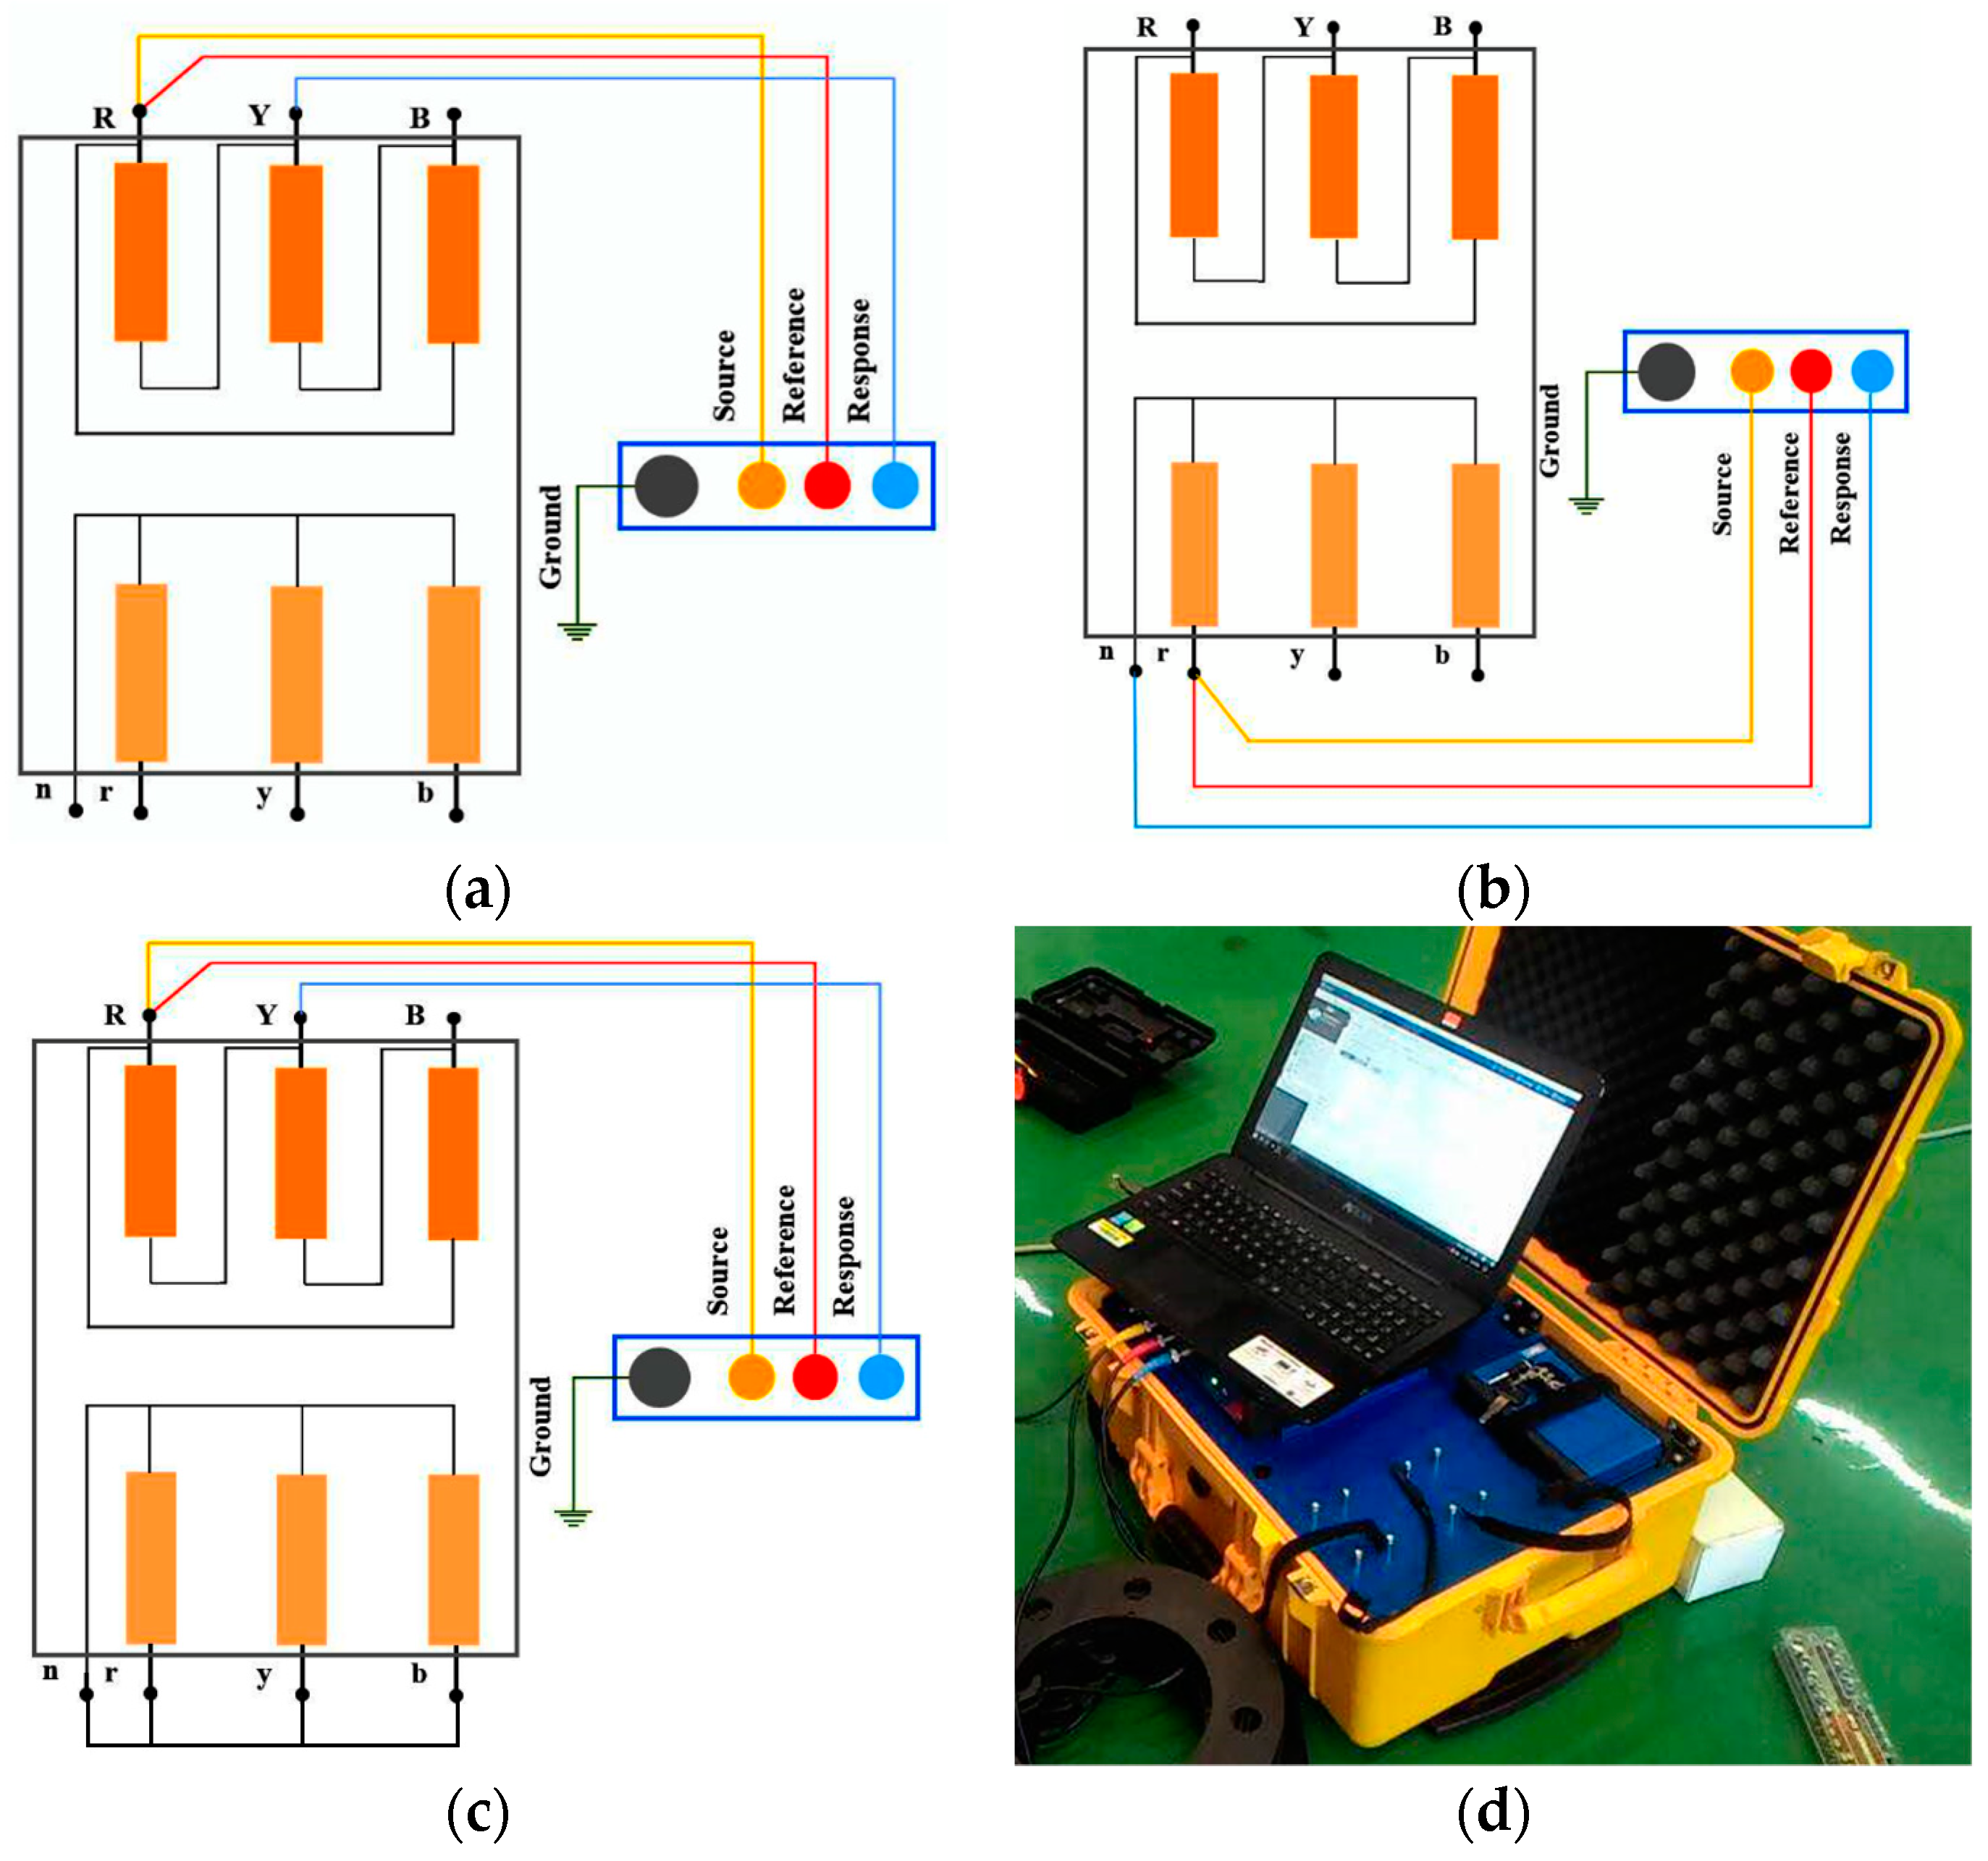
2.1. Experiment Setup

The transformer under study was a 500 kVA, 11/0.433 kV distribution transformer as shown in Figure 1. The vector type of the transformer is Delta (Δ)–Wye (Y)–11. The tank was removed before the FRA measurement was carried out. Figure 1 shows the images of the transformer with and without the clamping structure. The transformer winding with the clamping structure can be seen in Figure 1a,b. In this study, only the top clamping structure was removed as shown in Figure 1c,d. Other elements remained unchanged and no other components had been loosened. The motivation of the study was not to simulate the damage on the clamping structure but to reduce or loosen the clamping pressure on the winding and core which can represent the condition of aged transformers. Although the winding and core clamping pressure has been loosened, a transformer may continue to operate normally. However, it is now highly vulnerable to radial and axial forces from large fault current which may physically damage the winding.
According to CIGRE WG A2/26 [19], IEEE Std C57.149-2012 [21] and IEC 60076-18 [27], there are 4 test connections for FRA measurement. In this study, both end-to-end open circuit and short circuit tests were conducted according to IEEE Std C57.149-2012 [21]. However, the capacitive and inductive inter-winding tests were not carried out in this study. The FRA measurement was carried out by Omicron FRANEO 800 for both high-voltage (HV) and low-voltage (LV) windings in the frequency range from 20 Hz to 2 MHz. The test configurations between the transformer and FRA analyzer for end-to-end open circuit test on HV and LV windings are shown in Figure 2a,b. Under end-to-end open circuit test, magnetizing inductance of the core has an effect on the frequency response [28,29,30,31]. On the other hand, under an end-to-end short circuit test, the effect of the mutual coupling between HV and LV windings is neutralized for frequency below 2 kHz as shown in Figure 2c. For this reason, the response at low-frequency range would be only influenced by the winding inductance, and therefore the FRA plot of the end-to-end short circuit test was expected to be similar for both the with and without clamping structure. The end-to-end open circuit response of phase R-Y HV winding was measured by injection of a 10 V AC input signal at different frequencies (20 Hz to 2 MHz) at terminal R through source cable. The response cable measured the output signal at terminal Y as shown in Figure 2a. The other terminals were left open. The same approach was carried out for end-to-end open circuit LV winding with the source and reference cables connected to the r terminal for measurement of the r phase while the response cable was connected to the neutral terminal as shown in Figure 2b. For an end-to-end short circuit test of the HV winding, the same connection as in the end-to-end open circuit test was applied except for LV winding terminals, which were short-circuited as shown in Figure 2c. The FRA analyzer used in this study can be seen in Figure 2d.

2.2. Statistical Analysis

Statistical methods such as Pearson’s/Spearman’s/Kendall’s tau/cross correlation coefficients, relative factor (RF), absolute sum of logarithmic error (ASLE), root mean square error (RMSE), hypothesis test (F-test) were used for interpretation of the changes observed in the winding structure before and after removal of the clamping structure. These methods were proposed by various standards such as Chinese standard DL/T 911, CIGRE WG A2.26, and IEEE Std C59.149-2012 [18,19,21]. To use the statistical methods, the frequency range of the response needs to be divided into three frequency bands: low, medium and high. The frequency range of each band considered in this study was based on measured FRA plots. On the other hand, the RF method in the Chinese standard DL/T 911 used a predefined frequency band.

2.2.1. Pearson’s Correlation Coefficient (PCC)

The Pearson’s correlation coefficient (PCC) can be used to identify the linear potential association between two continuous data variables [32]. It is defined as the ratio between two set of data variables covariance ( σ x , y ) and product of its individual standard deviations ( ρ ). PCC can be obtained based on Equation (1):
P C C = n i = 1 n [ x i · y i ] i = 1 n x i · i = 1 n y i [ n i = 1 n x i 2 ( i = 1 n x i ) 2 ] · [ n i = 1 n y i 2 ( i = 1 n y i ) 2 ] ,
where n is the total points of the dataset variables and x i and y i are the i-th value of two dataset variables x and y . The range of CC can be from −1 to +1. If CC is −1 or +1, a good positive or negative correlation between two data variables is obtained. If the value of CC is 0, no linear correlation between the data variables is found.

2.2.2. Spearman’s Correlation Coefficient (SCC)

The Spearman’s correlation coefficient (SCC), rs computes the correlation between two ranked variables which is obtained from PCC [33,34]. The calculation can be computed by Equation (2):
r s = i = 1 n ( ( rank ( x i )   rank ( x ) ¯ )   ×   ( rank ( y i )   rank ( y ) ¯ ) ) [ i = 1 n ( rank ( x i )   rank ( x ) ¯ ) 2 ]   ×   [ i = 1 n ( rank ( y i )   rank ( y ) ¯ ) 2 ] ,
where rank(xi) and rank(yi) are the ranks of the selected sample. SCC can be from −1 to +1 which indicates the correlation of the absolute value of r s . The positive and negative sign indicate the direction of the variables either associated to x or y. If rs is 0 or near to 0, there is no correlation, or the correlation is weak between the two datasets. SCC can be 0, if there is no monotonic relationship between two datasets, similar to PCC. However, SCC can still be 1 if the two datasets are non-linear but monotonically related, unlike in PCC [10].

2.2.3. Kendall’s Tau Correlation Coefficient (KCC)

The Kendall’s tau correlation coefficient (KCC) is used to compute the correlation between two variables which have independent intervals [10,11,12]. KCC is denoted by τ and is given by Equation (3):
τ =   i = 1 n j = 1 n s g n ( X i   X j )   ×   s g n ( Y i   Y j ) n ( n 1 ) ,
where s g n ( x i x j ) = { 1 , i f   ( X i X j ) > 0 0 , i f   ( X i X j ) = 0 1 , i f   ( X i X ) < 0 ; and s g n ( y i y j ) = { 1 , i f   ( Y i Y ) > 0 0 , i f   ( Y i Y ) = 0 1 , i f   ( Y i Y j ) < 0 .
The range of KCC correlation coefficients can be between −1 to +1. τ indicates the strength of correlation between two datasets.

2.2.4. Cross-Correlation Coefficient (CCF)

The cross-correlation coefficient (CCF) [31] computes the correlations between two datasets to determine the dependency between actual and predicted dataset variables. CCF can be in the range −1 to +1. CCF will be +1 for positive correlation, 0 for no correlation, and −1 for negative correlation. CCF is given by Equation (4):
C C F =   i = 1 n ( X i X ¯ )   ×   ( Y i Y ¯ ) i n ( X i X ¯ ) 2   ×   i n ( Y i Y ¯ ) 2 ,
where X and Y are the two dataset variables.

2.2.5. Root Mean Square Error (RMSE)

It is defined as the standard deviation (SD) of the residual errors which is the measure of the differences between regression data points. RMSE should be 1 if the 2 dataset variables have a good correlation. RMSE can be determined based on Equation (5):
R M S E =   i = 1 N ( X ( i ) Y ( i ) ) 2 N 1 ,
where N is the total number of points in two dataset variables and X(i) and Y(i) are the i-th value of the two dataset variables X and Y.

2.2.6. Absolute Sum of Logarithmic Error (ASLE)

ASLE compares two dataset variables in logarithmic scale which includes the property of mean square error (MSE). ASLE can be determined based on Equation (6). The ASLE output should be close to zero if two dataset variables are similar:
A S L E ( X , Y ) =   i = 1 N | 20 l o g 10 Y i 20 l o g 10 X i | N ,
where X i and Y i are the i-th value of the two dataset variables x and y.

2.2.7. F-Test

F-test is normally used to compare the SD of two dataset variables. The F-test performs analysis of variance (ANOVA) to compare the mean of two datasets. A statistical hypothesis is taken into consideration while performing the F-test [5]. Null hypothesis (H0) is the case when the variances of the two dataset samples correlate and will be one. Otherwise, alternate hypothesis (H1) is given and the variances will be close to either 1 or 0. The output depends on the specific confidence level of either 95% or 99% set by the user. The hypothesis used for the F-test is given by Equations (7) and (8):
null   hypothesis :   σ 1 2 =   σ 2 2 ,
alternate   hypothesis :   σ 1 2   σ 2 2 .
The ratio of variances of two dataset variables, FValue is given by Equation (9):
F V a l u e =   σ 1 2 σ 2 2 ,
where H0 is not considered when F v a l u e < F n 1 1 , n 2 1 , α / 2 or F v a l u e > F n 1 1 , n 2 1 , α / 2 , α is the confidence level, and n1 and n2 are the total points in the dataset variables.

2.2.8. Relative Factor (RF)

Relative factor method is given in Chinese standard DL/T 911 [18]. Based on the computed relative factor, the condition of the transformer can be classified according to Table 1 [33,35]. The relative factor Rxy of the two data variables X and Y can be calculated based on Equation (10):
R x y = { 10 , 1 L R X Y < 10 10 l o g 10 ( 1 L R X Y ) , o t h e r s .
The normalization covariance factor LRXY, can be carried out based on Equations (11)–(14):
L R X Y = C X Y D X D Y ,
C X Y = 1 N k = 0 N 1 [ X ( k ) 1 N k = 0 N 1 X ( k ) ] 2 ×   [ Y ( k ) 1 N k = 0 N 1 Y ( k ) ] 2 ,
D X =   1 N k = 0 N 1 [ X ( k ) 1 N k = 0 N 1 X ( k ) ] 2 ,
D Y =   1 N k = 0 N 1 [ Y ( k ) 1 N k = 0 N 1 Y ( k ) ] 2 ,
where X(k) and Y(k) are the kth values of two data variables X and Y.
The frequency bands of RF method at low (RLF), medium (RMF) and high frequencies (RHF) are (1 kHz–100 kHz), (100 kHz–600 kHz) and (600 kHz–1000 kHz) respectively.

3. Frequency Response Plot

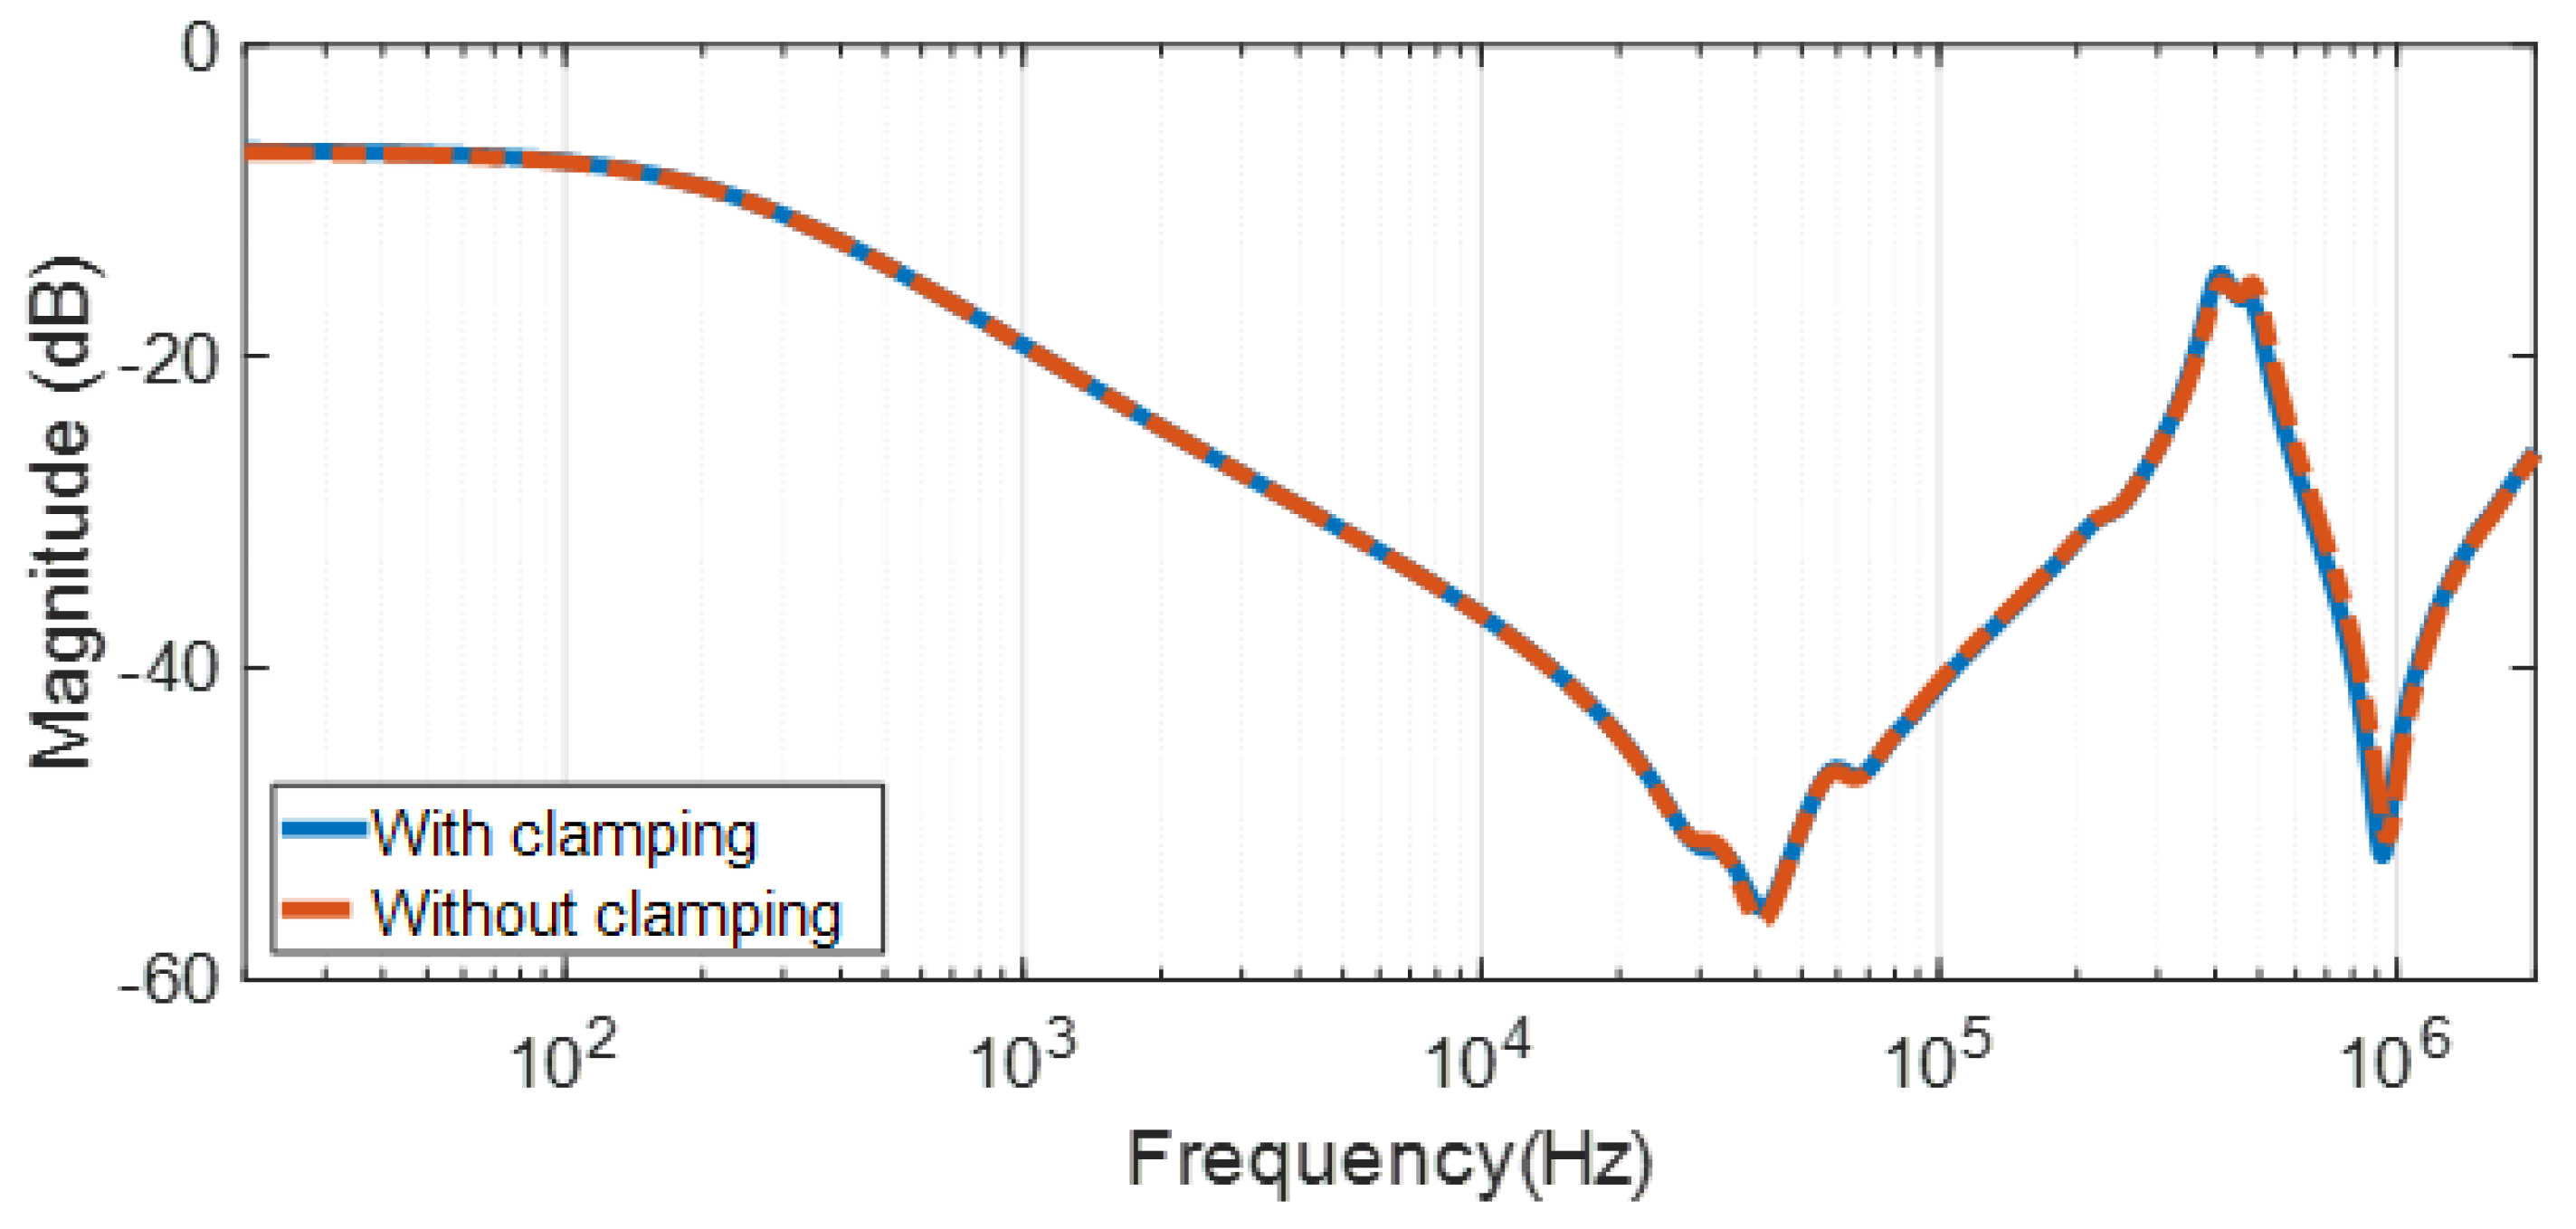
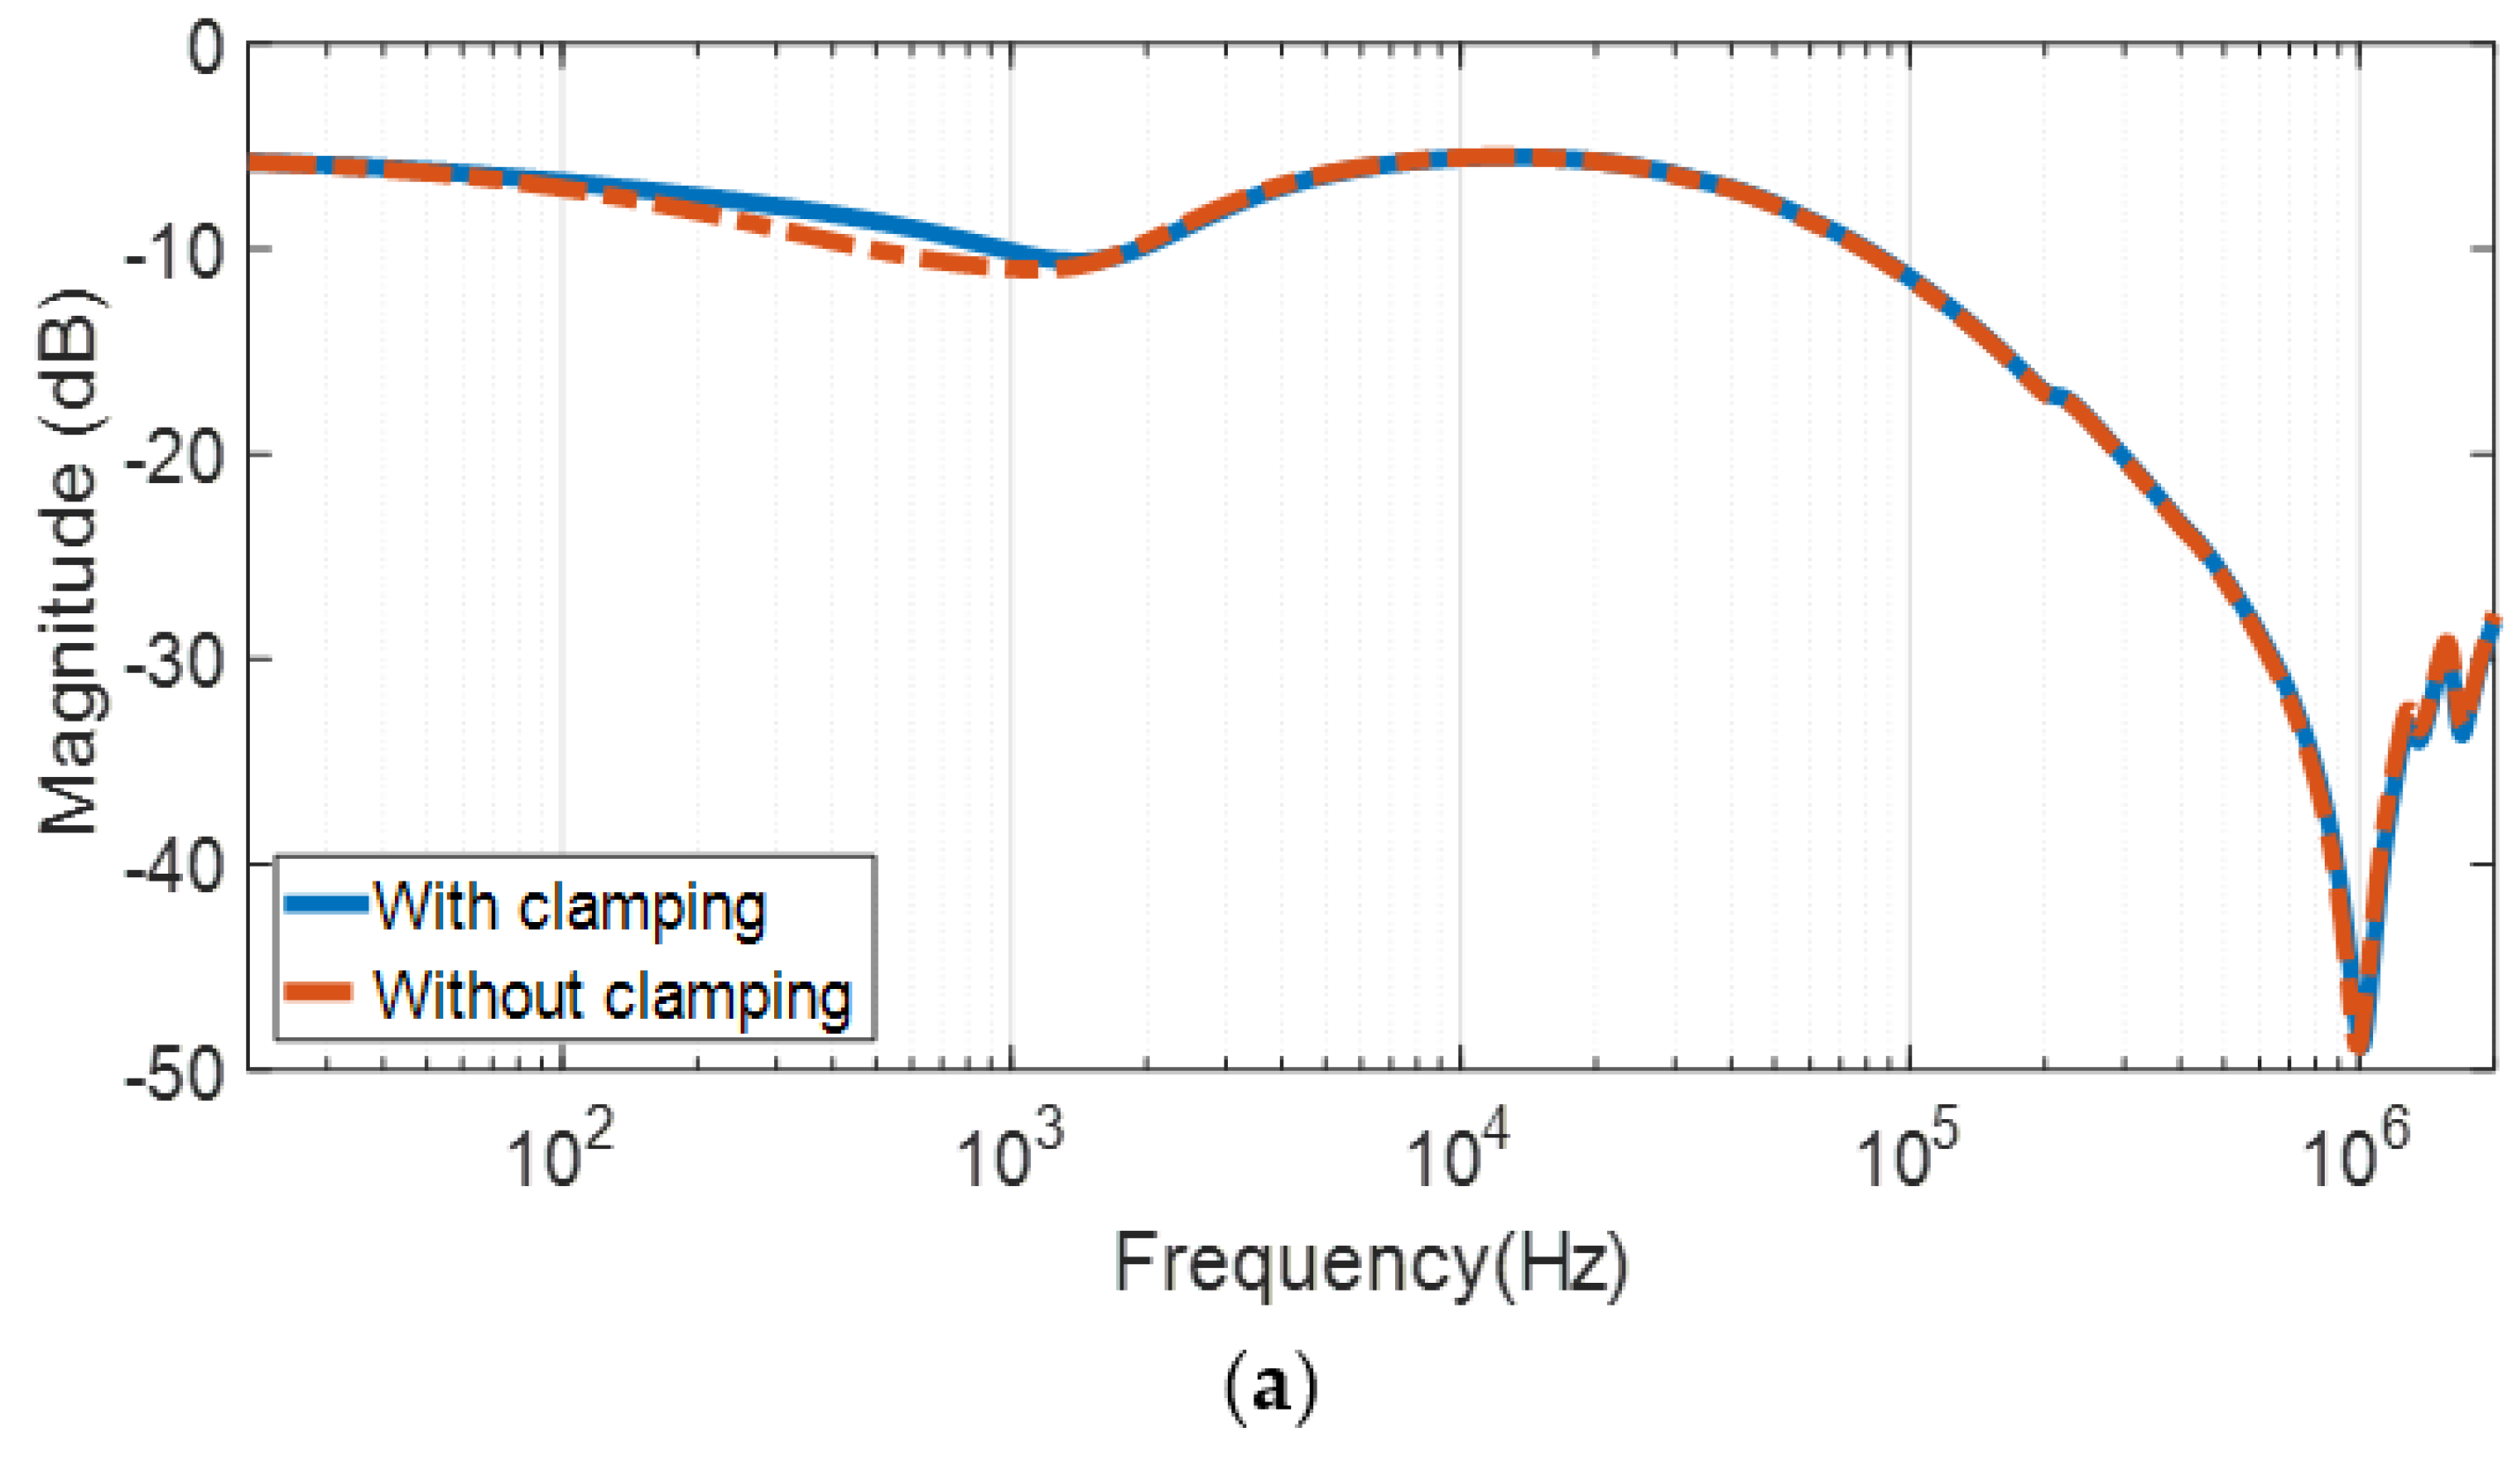
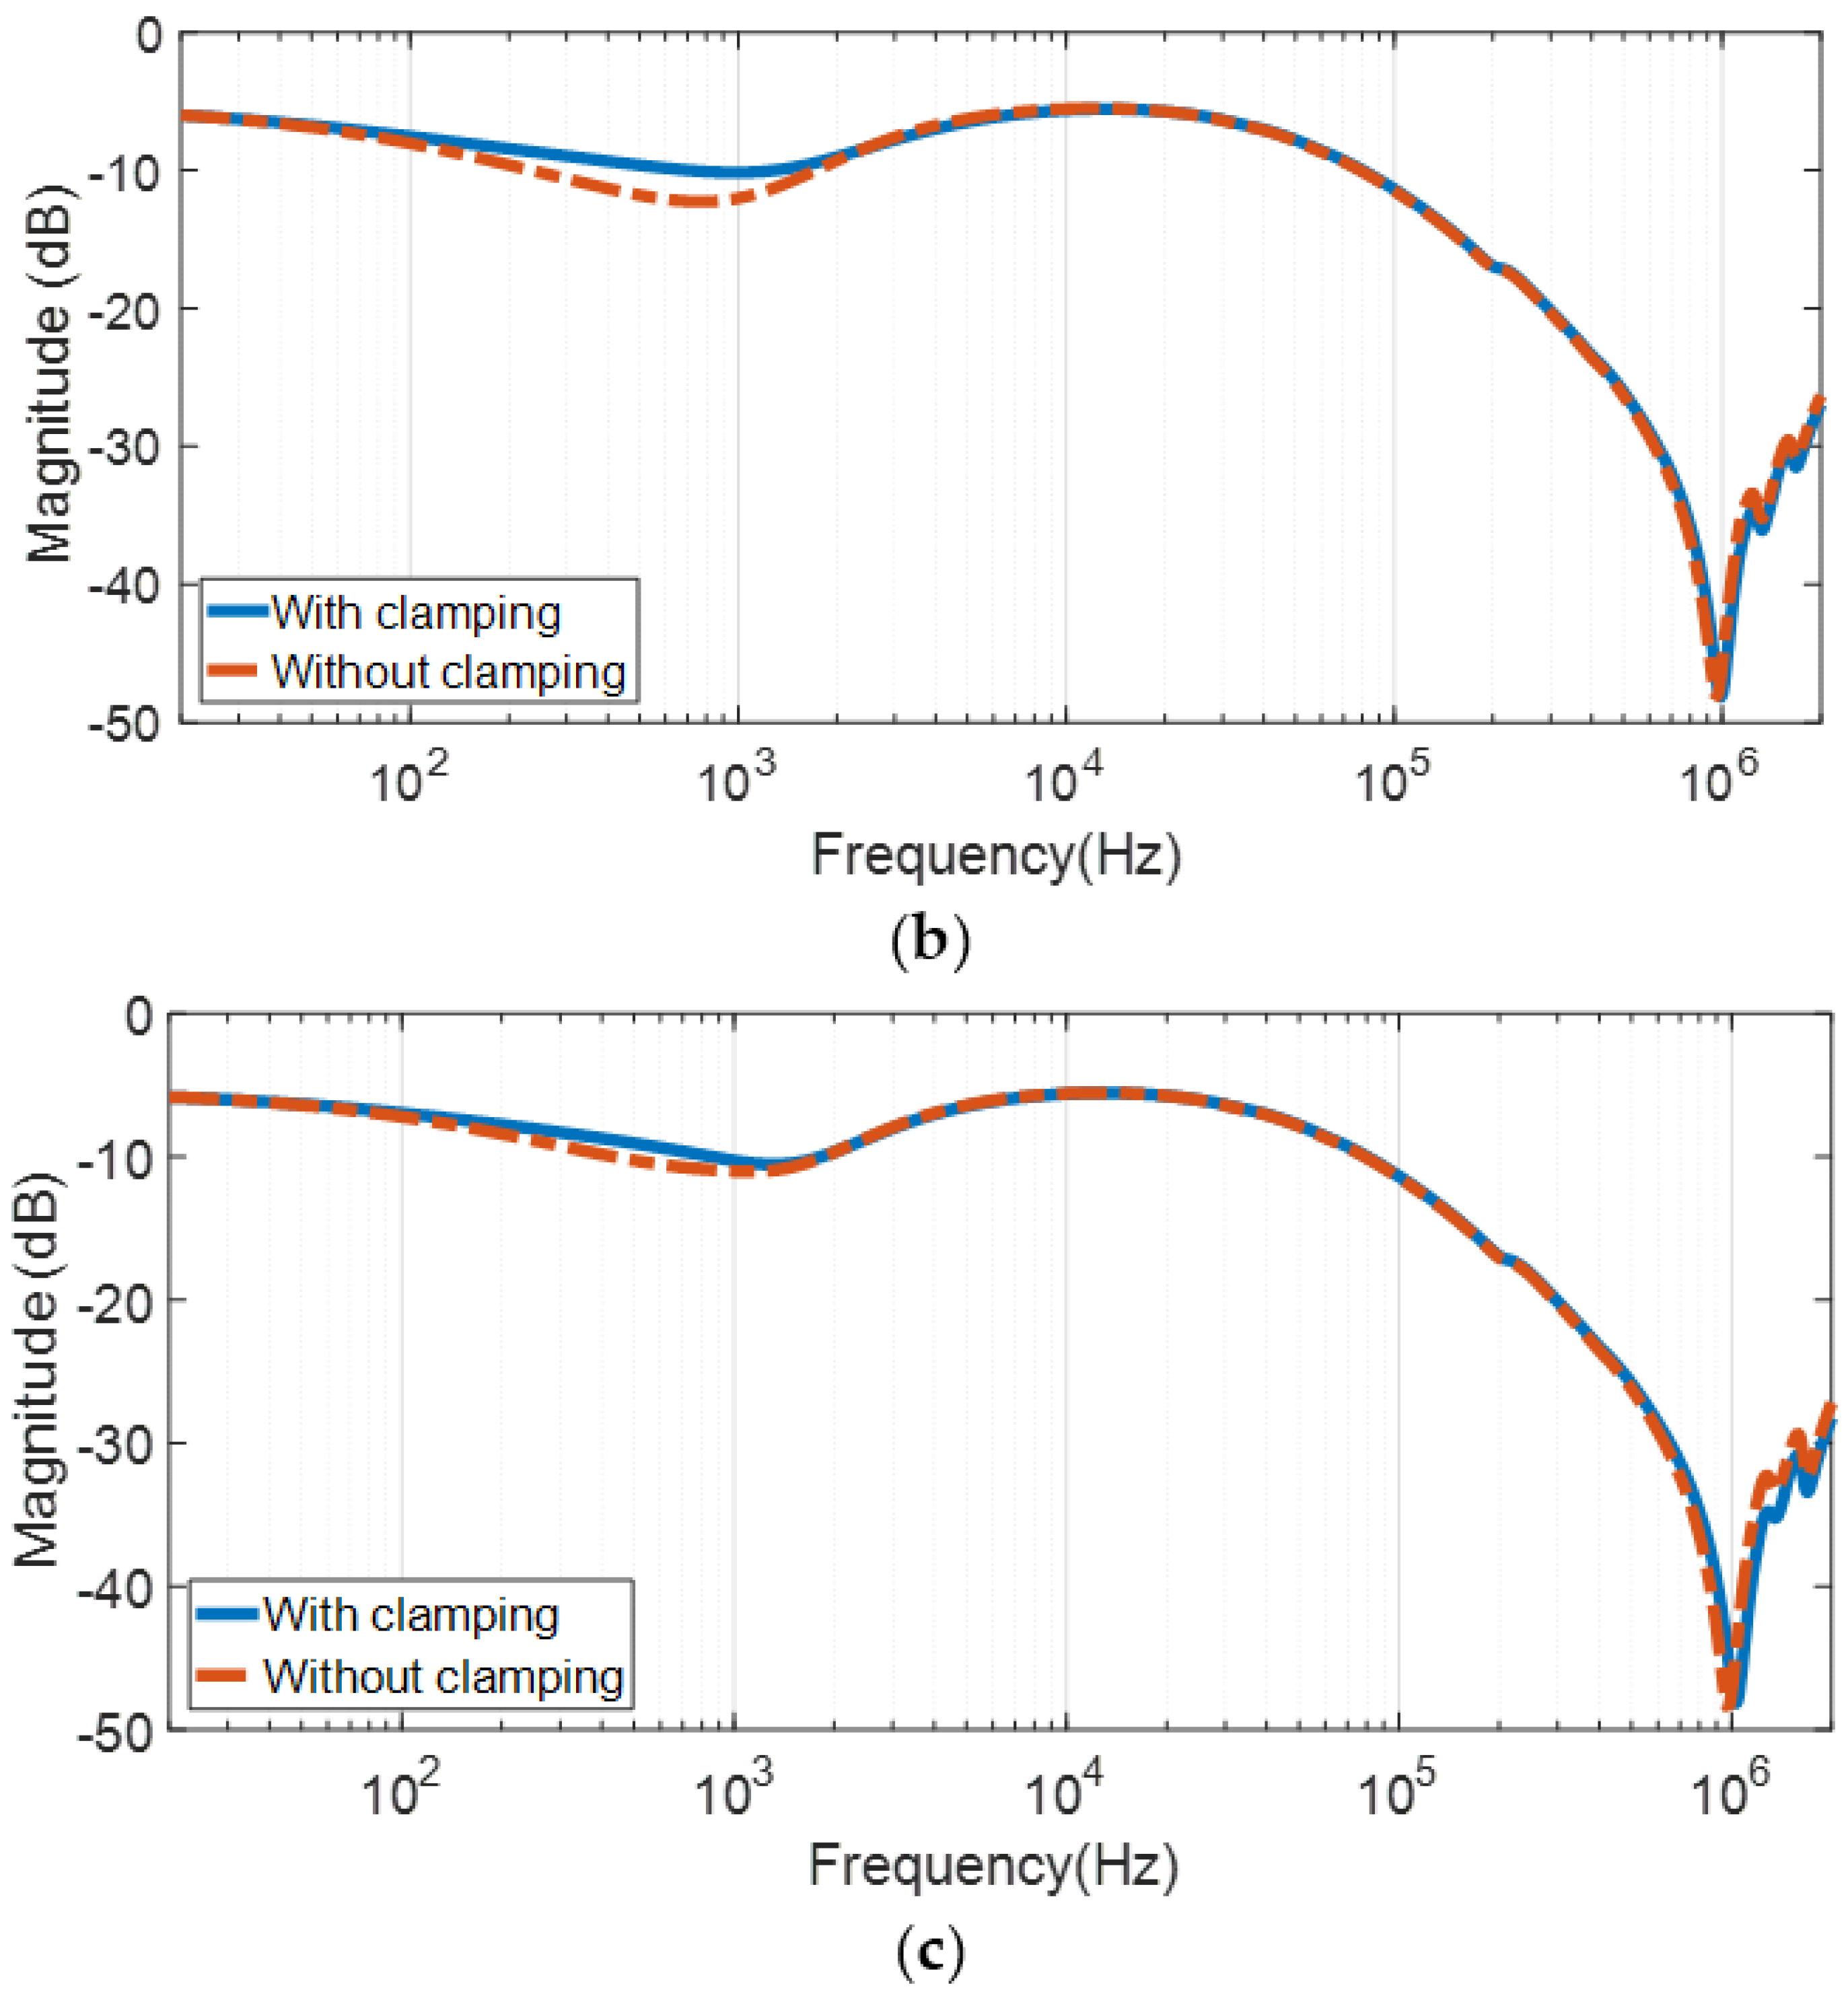
3.1. End-to-End Open Circuit Test

The frequency response plot at terminals R-Y, Y-B, and B-R of a HV winding based on an end-to-end open circuit test connection can be seen in Figure 3a–c. Since the HV winding was delta connected, the input voltage was applied at terminal phase R and measured at terminal phase Y. Similarly, measurements were taken at terminals Y-B and B-R. At terminals R-Y, the frequency response plot magnitude of without clamping structure is slightly lower than with clamping structure at frequency less than 2 kHz as shown in Figure 3a. At terminals Y-B, the frequency response plot magnitude of without the clamping structure is lower than with clamping structure at frequency around 2 kHz as shown in Figure 3b. The same pattern as terminals R-Y is observed at terminals B-R as shown in Figure 3c.
The frequency response plot of without clamping structure is almost the same as with clamping structure under an LV end-to-end open circuit test as shown in Figure 4a–c. There is a slight deviation of response between without and with clamping structures at a frequency range between 150 Hz–1.5 kHz as shown in Figure 4a. At the same frequency range, the magnitude of that without a clamping structure is lower than that with a clamping structure, as shown in Figure 4b. The same pattern as phase r is observed for phase b, as shown in Figure 4c. In addition, there is a slight deviation of frequency response between without and with clamping structures at a higher frequency range between 1 MHz and 2 MHz.

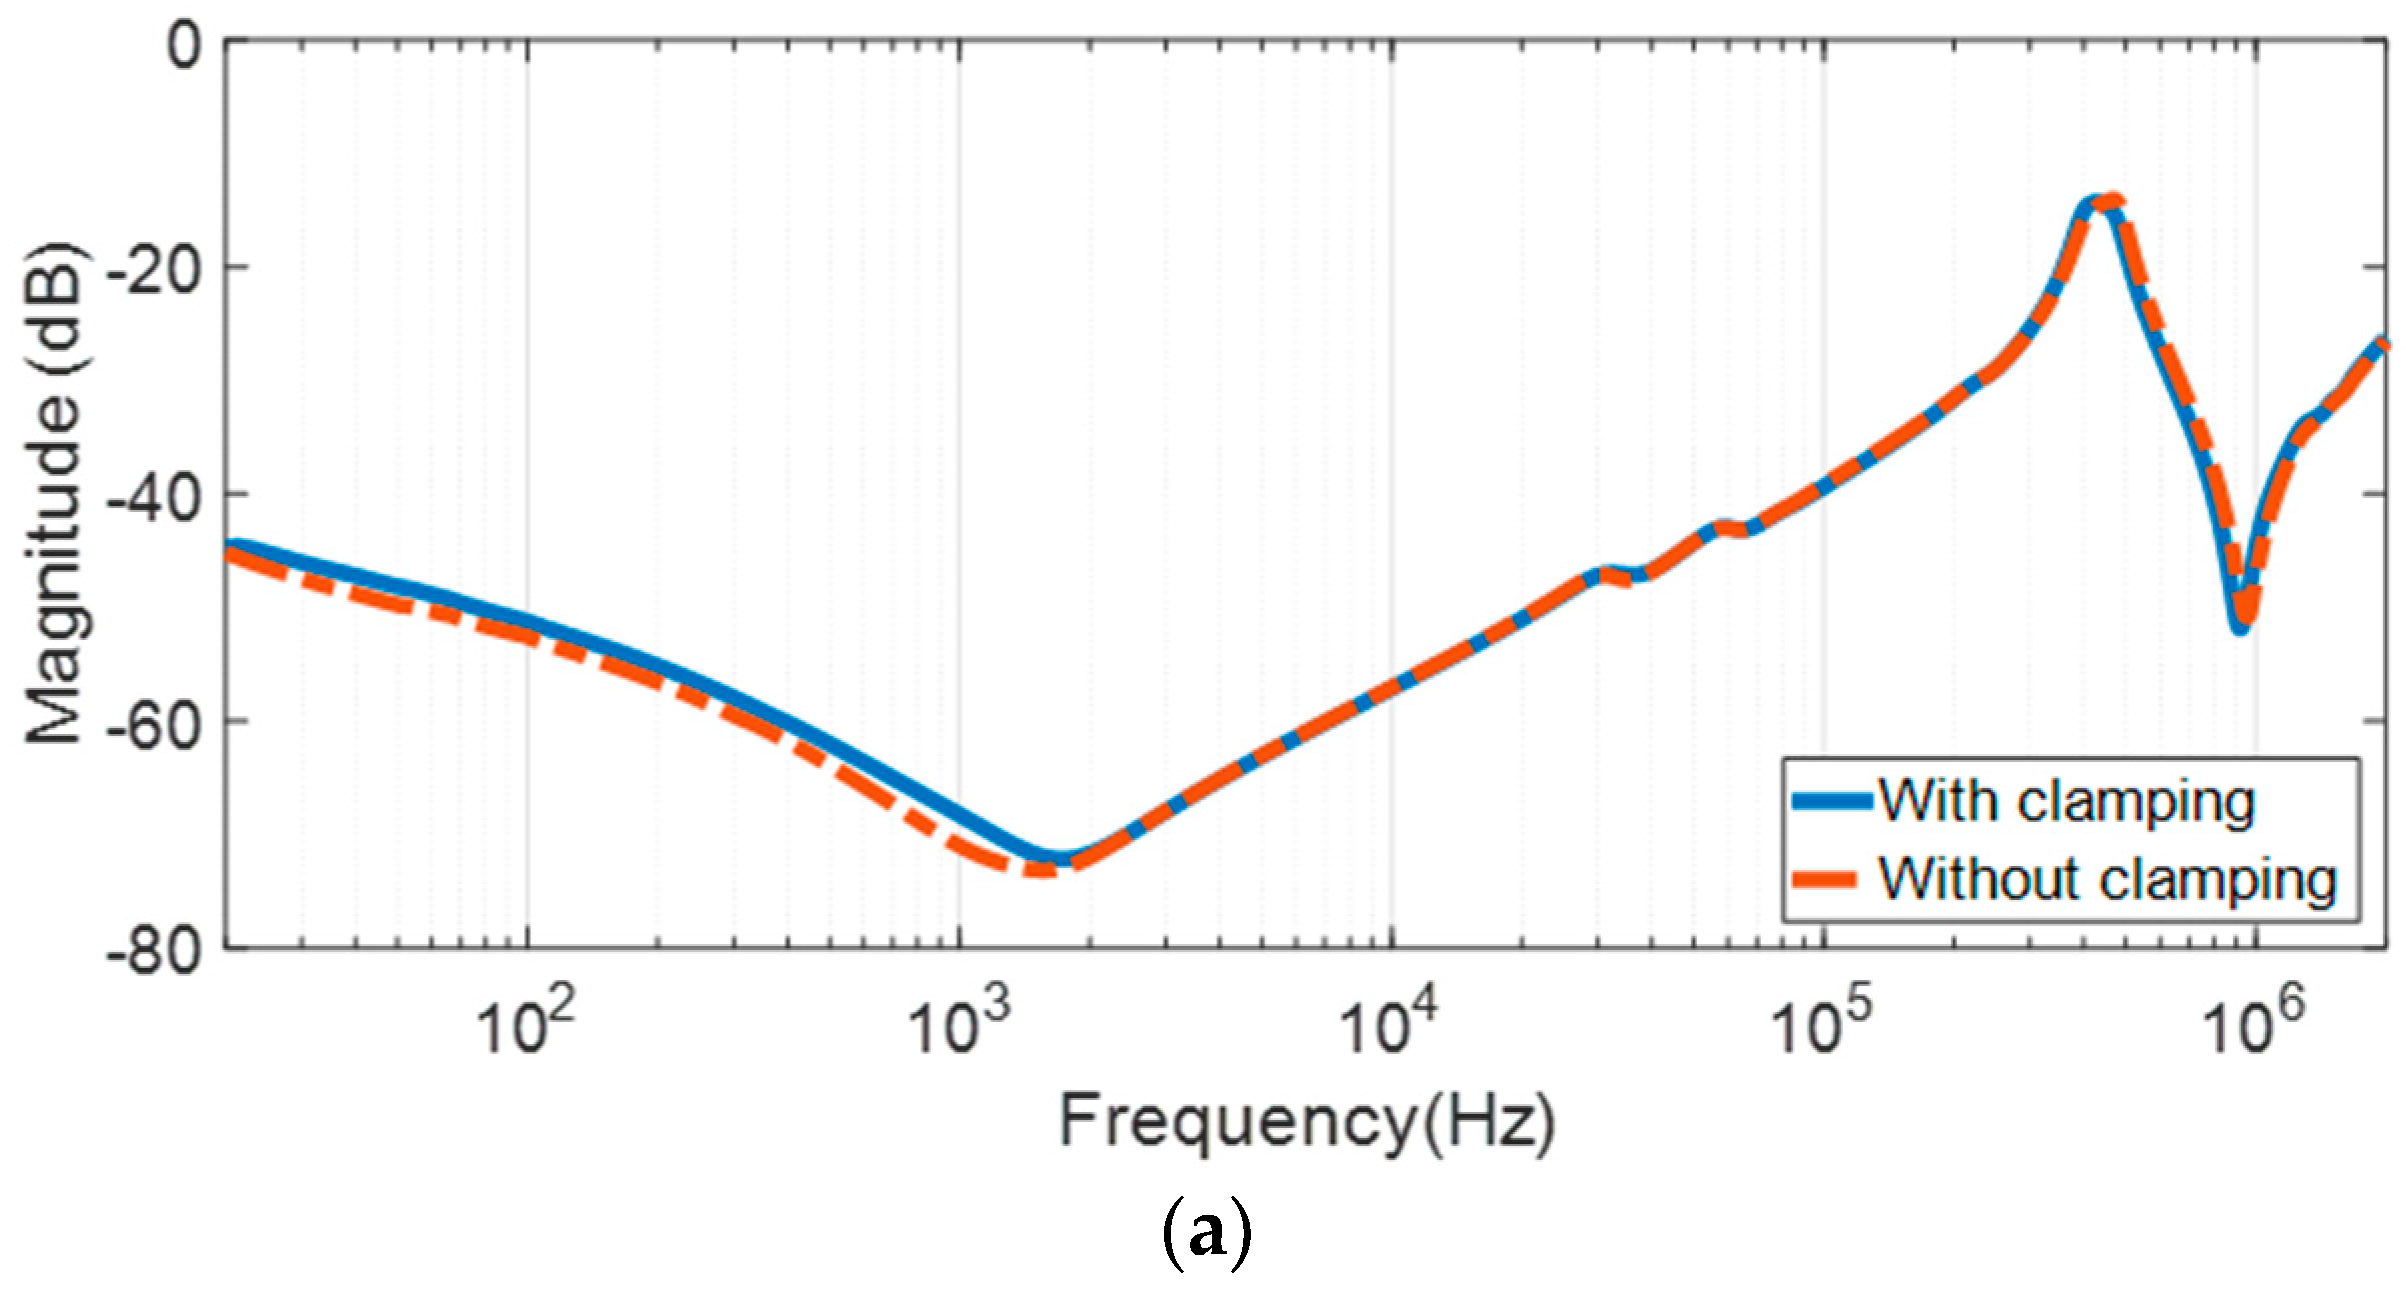
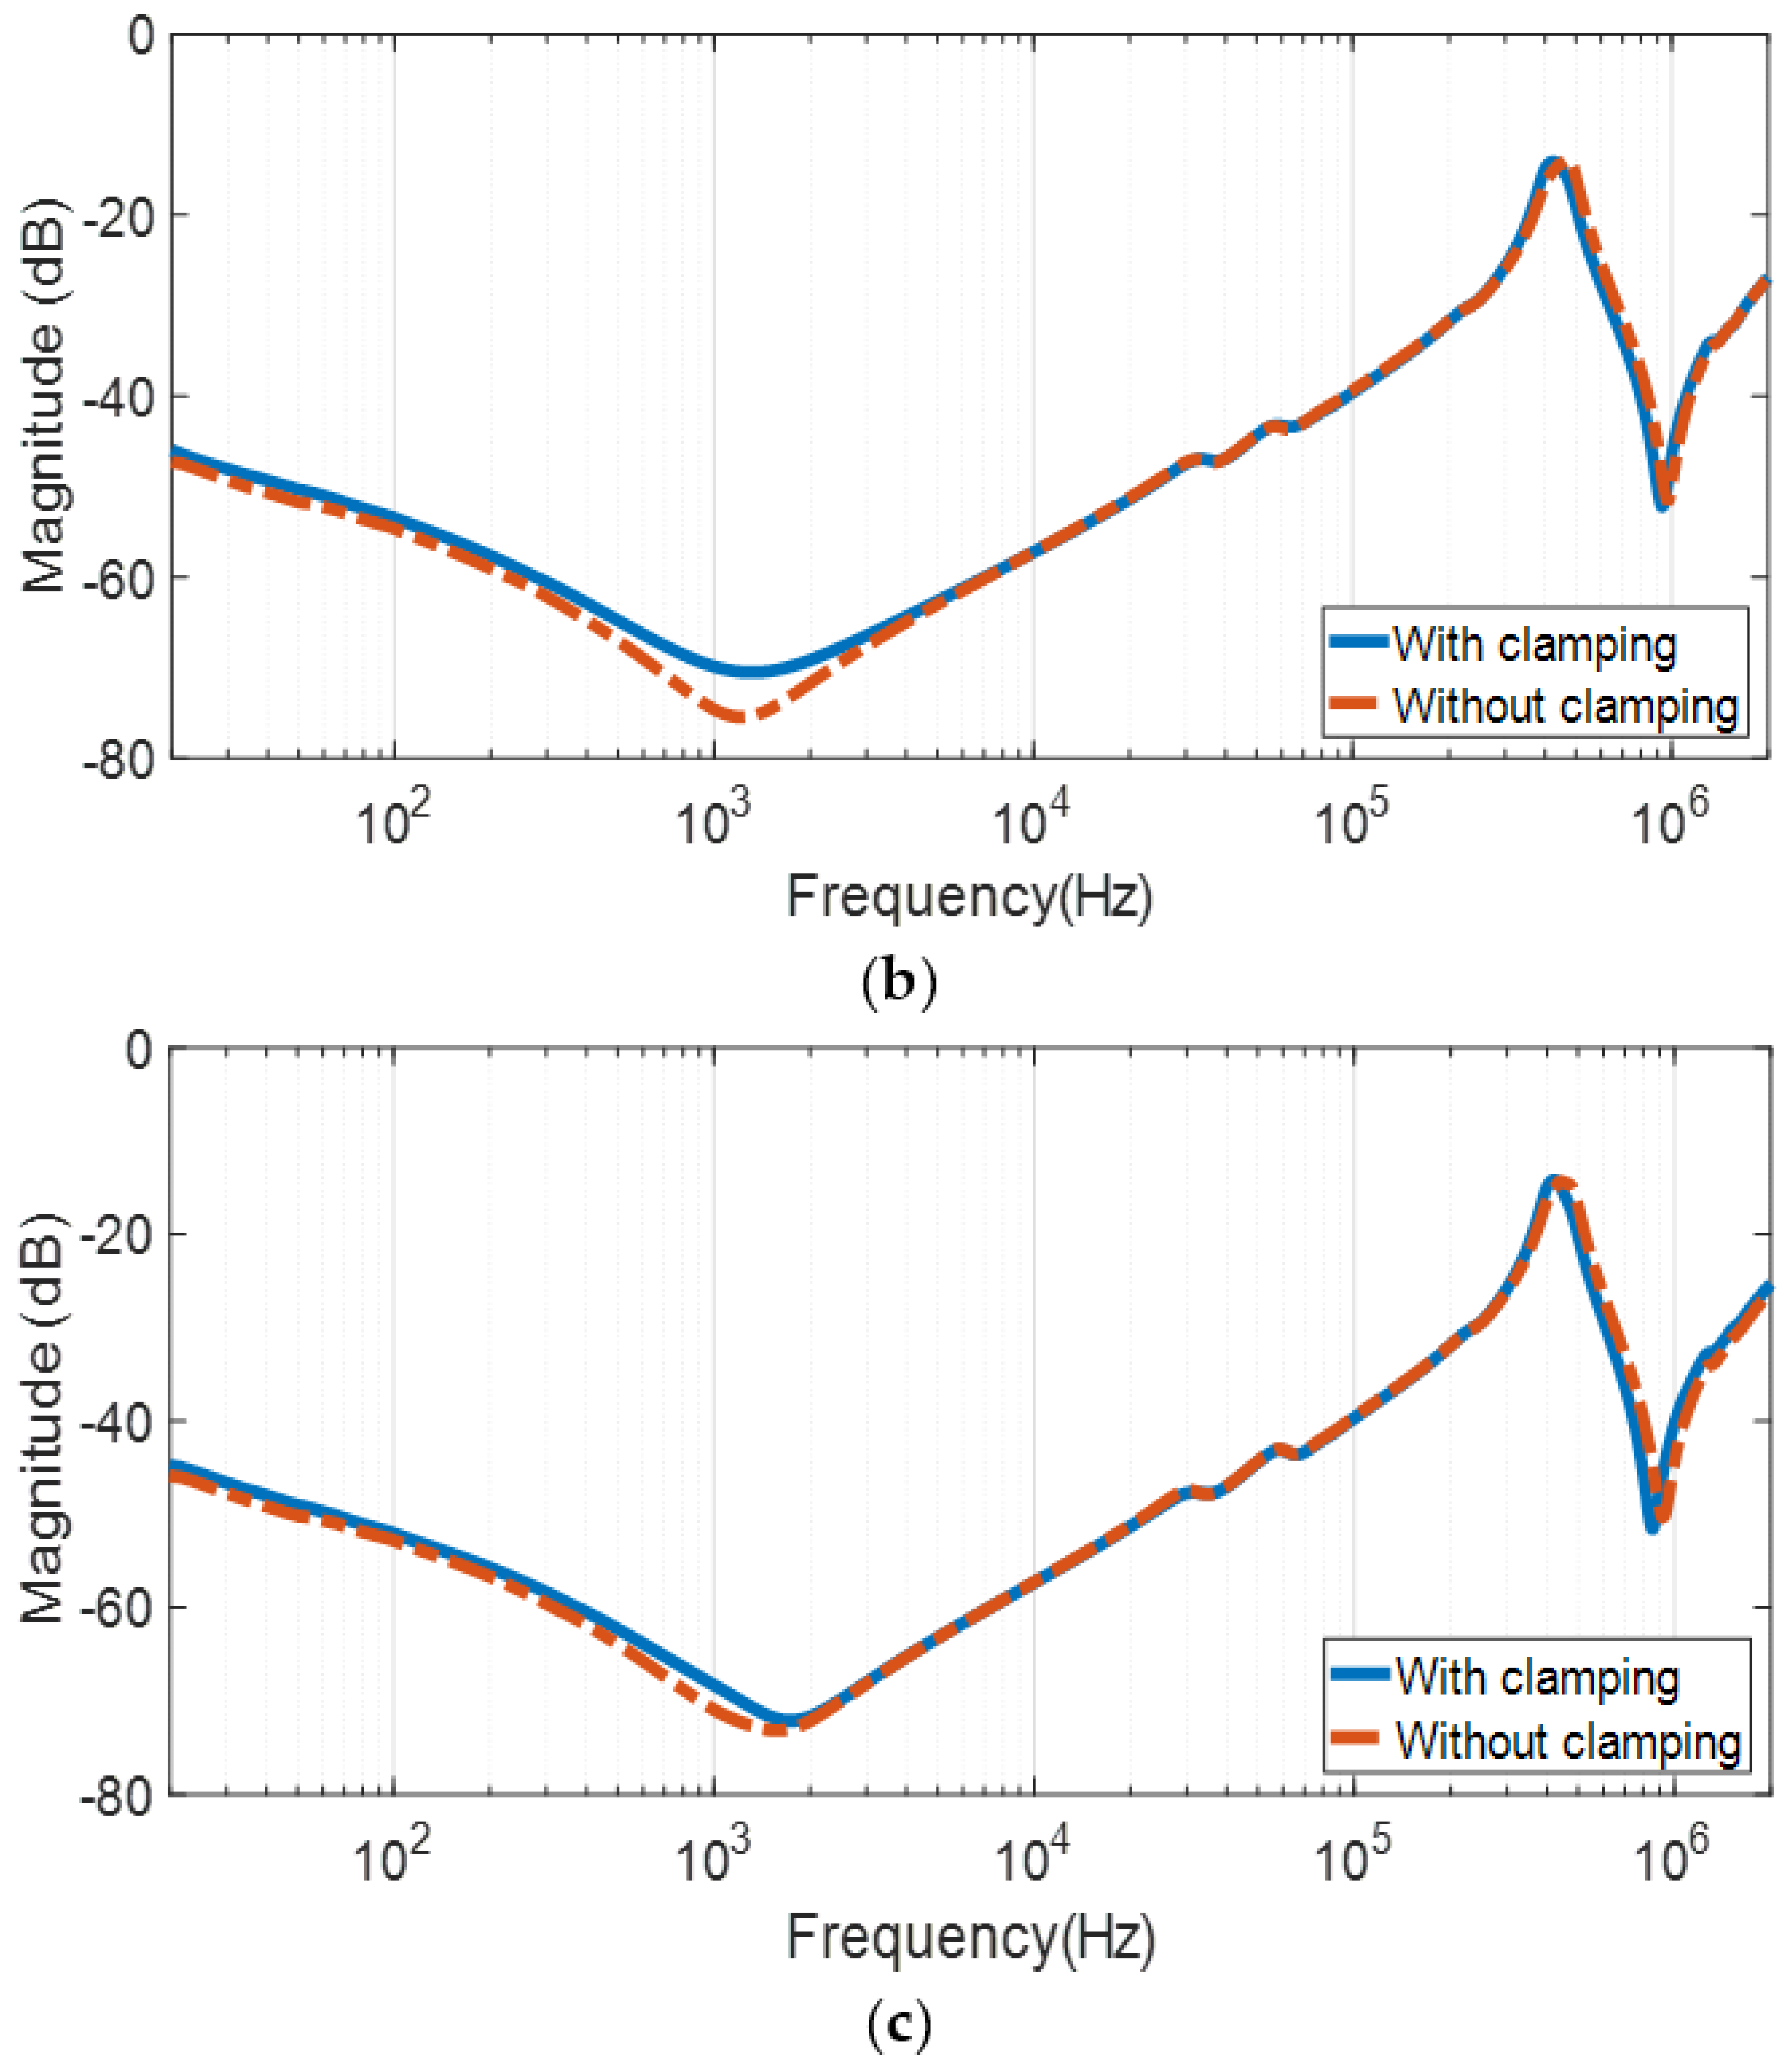
3.2. End-to-End Short Circuit Test

The frequency response of the equipment without clamping structure matches quite well that with clamping structure for HV winding end-to-end short circuit tests at terminals R-Y as shown in Figure 5. Under the end-to-end short circuit test, the effect of mutual coupling between HV and LV windings is neutralized due to the fact that the LV terminal is short-circuited which leads to the same frequency responses between without and with clamping structures. The FRA responses for Y-B and B-Y phases are not shown, since both would be similar to R-Y.

4. Statistical Analysis

The FRA response obtained with a clamping structure is considered as the fingerprint response or reference. The frequency responses of the 3 phases for both the LV and HV windings slightly deviate from its fingerprint responses at a low frequency band less than 2 kHz. One of the reasons for these variations is due to the difference in flux for the middle and side phases of the transformer [9]. The effect of the clamping structure is normally detected at the frequency region less than 20 kHz [17,36,37].
Statistical tests such as the PCC, SCC, KCC, CCF, RMSE, ASLE, F-test and RF are conducted to examine the extent of the variations. For this purpose, only outputs from the end-to-end open circuit test is taken since there is no deviation of the frequency response between without and with clamping structure for the end-to-end short circuit test. The frequency range and sub band under study is based on measured FRA plots except for the RF method. The outputs of the PCC, SCC, KCC, CCF, RMSE, ASLE, F-test and RF are given in Table 2, Table 3 and Table 4. For PCC, SCC and KCC, the suggested coefficient should be higher than 0.98 for a normal condition [36]. For CCF, the normal condition is defined based on a coefficient higher than 0.95 where values between 0.95 and 0.7 indicate slight deformation in the winding [31]. RMSE defines ranges between 0–3 as the normal condition [38]. The threshold for normal condition ASLE was proposed at a value less than 0.6 [36]. The F-test should be 1 for a normal condition and 0 for certain deformations of the winding structure [5].
The coefficients of PCC and SCC indicate that there is no effect of clamping structure removal for the majority of the frequency ranges, as shown in Table 2 and Table 3. Only HV B-R (450 kHz–2 MHz), LV r-n (20 Hz–1.5 kHz) and LV y-n (20 Hz–1.5 kHz) indicate that there is a slight deviation in the winding. KCC shows that a slight deviation in the winding exists at high frequency range (450 kHz–2 MHz). For CCF, most of the values show no deviation in the winding except for HV B-R (450 kHz–2 MHz). RMSE indicates the normal condition for both HV and LV windings. It is known that RMSE underestimates the frequency variations especially in the low frequency regions [39]. Loose connections in the measuring instrument can contribute to the variation of the frequency responses [8]. In addition, noises due to the connection cables and difference in grounding systems can also affect the frequency responses [4,21]. These factors could be the possible reasons for the frequency response variations computed by PCC, SCC, KCC and CCF.
Considering these factors, ASLE is quite a promising approach to determine the effect of clamping structure based on the frequency responses measurement. ASLE estimates the correlation of two dataset variables based on similarity in shapes and not magnitudes. The coefficients for ASLE is highest for the low frequency region followed by medium and high frequency regions for both HV and LV windings. It is also found that an existing ASLE limit of 0.6 may not be practical in the current study. Therefore, new ASLE limits are suggested for HV and LV windings which are 1.37 and 0.66, respectively. These limits are proposed based on the lowest coefficients of the low-frequency region (20 Hz–1.5/2 kHz) for both HV and LV windings. However, in order to draw any conclusion on the proposed limits, it can be validated based on the frequency response measurements of other transformers with similar or different types of faults.
The values of the F-test at the low-frequency region are closer to 0 for both HV and LV windings. This signifies changes in the mechanical structure of the winding. Based on the case study, the statistical analyses reveal that ASLE and F-tests are the most sensitive approaches that can be used to detect mechanical changes in the windings related to clamping structure.
There is no effect of clamping structure removal based on the RF method. The relative factor Rxy is 10 for all phases, as shown in Table 4. This complies with the condition of RLF ≥ 2.0, RMF ≥ 1.0 and RHF ≥ 0.6 as in Table 1 which suggests that the winding is in a normal condition. This is true since the RF method is only accurate for winding damage analyses and not faulty core or clamping structure.

5. Conclusions

The study indicates that the frequency responses of the transformer winding without clamping structure has variations at a frequency less than 2 kHz under an end-to-end open circuit test for both HV and LV windings. Under a end-to-end short circuit test, the frequency response of the without a clamping structure has no variation as compared to that with a clamping structure. Statistical methods such as PCC, SCC, KCC, CCF, RMSE and RF methods are not sensitive to indicate frequency response variation caused by removal of the clamping structure based on the case study. Only the ASLE and F-tests are sensitive enough to indicate changes in the winding that are caused by the clamping structure. For the ASLE method, updated threshold limits of 1.37 and 0.66 are proposed for HV and LV windings. However, further validation on the threshold limits will be carried out in future for transformers with a similar condition or different types of faults. The outcome of the study can assist engineers and technical personnel to interpret winding conditions, especially for aged transformers.

Author Contributions

The research study was carried out successfully with contributions from all authors. The main research idea, simulation/experimental works and manuscript preparation were contributed by A.S.M. and S.A.-A. N.A. and M.F.M.Y. contributed on the manuscript preparation and research idea. J.J. assisted in finalizing the research work and manuscript. M.A.T. gave several suggestions from the industrial perspective. All authors revised and approved the publication of the paper.

Funding

The research was funded by PUTRA Berimpak (GPB/2017/9570300) and the FRGS scheme (03-01-16-1787FR).

Acknowledgments

The authors would like to express their sincere gratitude to the Ministry of Education Malaysia, CELP UPM and UTHM for technical and financial support to this research.

Conflicts of Interest

The authors declare no conflicts of interest.

References

  1. Amini, A.; Das, N.; Islam, S. Impact of buckling deformation on the FRA signature of power transformer. In Proceedings of the 2013 Australasian Universities Power Engineering Conference (AUPEC), Hobart, TAS, Australia, 29 September–3 October 2013; pp. 1–4. [Google Scholar]
  2. Bagheri, M.; Naderi, M.S.; Blackburn, T. Advanced transformer winding deformation diagnosis: Moving from off-line to on-line. IEEE Trans. Dielectr. Electr. Insul. 2012, 19, 1860–1870. [Google Scholar] [CrossRef]
  3. Reykherdt, A.A.; Davydov, V. Case studies of factors influencing frequency response analysis measurements and power transformer diagnostics. IEEE Electr. Insul. Mag. 2011, 27, 22–30. [Google Scholar] [CrossRef]
  4. Bagheri, M.; Phung, B.; Blackburn, T.; Naderian, A. Influence of temperature on frequency response analysis of transformer winding. In Proceedings of the 2013 IEEE Electrical Insulation Conference (EIC), Ottawa, ON, Canada, 2–5 June 2013; pp. 1393–1404. [Google Scholar]
  5. Behjat, V.; Mahvi, M. Statistical approach for interpretation of power transformers frequency response analysis results. IET Sci. Meas. Technol. 2015, 9, 367–375. [Google Scholar] [CrossRef]
  6. Nirgude, P.M.; Ashokraju, D.; Rajkumar, A.D.; Singh, B.P. Application of numerical evaluation techniques for interpreting frequency response measurements in power transformers. IET Sci. Meas. Technol. 2008, 2, 275–285. [Google Scholar] [CrossRef]
  7. Tang, W.H.; Shintemirov, A.; Wu, Q.H. Detection of minor winding deformation fault in high frequency range for power transformer. In Proceedings of the IEEE PES General Meeting, Providence, RI, USA, 25–29 July 2010; pp. 1–6. [Google Scholar]
  8. Ryder, S.A. Diagnosing Transformer Faults Using Frequency Response Analysis. IEEE Electr. Insul. Mag. 2003, 19, 16–22. [Google Scholar] [CrossRef]
  9. Wimmer, R.; Tenbohlen, S.; Feser, K.; Kraetge, A.; Krüger, M.; Christian, J. Development of algorithms to assess the FRA. In Proceedings of the 15th International Symposium on High Voltage Engineering, Ljubljana, Slovenia, 27–31 August 2007; pp. 1–6. [Google Scholar]
  10. Bolboaca, S.D.; Jäntschi, L. Pearson versus Spearman and Kendall’s tau correlation analysis on structure-activity relationships of biologic active compounds. Leonardo J. Sci. 2006, 5, 179–200. [Google Scholar]
  11. Hauke, J.; Kossowski, T. Comparison of values of Pearson’s and Spearman’s correlation coefficients on the same sets of data. Quaest. Geogr. 2011, 30, 87–93. [Google Scholar] [CrossRef]
  12. Shong, N. Pearson’s Versus Spearman’s and Kendall’s Correlation Coefficients for Continuous Data. Master’s Thesis, University of Pittsburgh, Pittsburgh, PA, USA, 2010. [Google Scholar]
  13. Vaca Vargas, P.; Mombello, E. Time-Frequency Analysis for the Interpretation of FRA Measurements. In Proceedings of the VDE High Voltage Technology 2016, ETG-Symposium, Berlin, Germany, 14–16 November 2016; pp. 390–394. [Google Scholar]
  14. Shintemirov, A.; Tang, W.H.; Wu, Q.H. Transformer winding condition assessment using frequency response analysis and evidential reasoning. IET Electr. Power Appl. 2010, 4, 198–212. [Google Scholar] [CrossRef]
  15. Abu-Siada, A.; Islam, S. A novel online technique to detect power transformer winding faults. IEEE Trans. Power Deliv. 2012, 27, 849–857. [Google Scholar] [CrossRef]
  16. Yousof, M.F.M.; Ekanayake, C.; Saha, T.K. Study of transformer winding deformation by frequency response analysis. In Proceedings of the IEEE Power and Energy Society General Meeting, Vancouver, BC, Canada, 21–25 July 2013; pp. 1–5. [Google Scholar]
  17. Abu-Siada, A.; Hashemnia, N.; Islam, S.; Masoum, M. Understanding power transformer frequency response analysis signatures. IEEE Electr. Insul. Mag. 2013, 29, 48–56. [Google Scholar] [CrossRef]
  18. Kraetge, A.; Krüger, M.; Fong, P. Frequency response analysis—Status of the worldwide standardization activities. In Proceedings of the International Conference on Condition Monitoring and Diagnosis CMD, G-05, Beijing, China, 21–24 April 2008; pp. 651–654. [Google Scholar]
  19. Picher, P.; Lapworth, J.; Noonan, T.; Christian, J. Mechanical Condition Assessment of Transformer Windings Using Frequency Response Analysis (FRA); CIGRE: Paris, France, 2008. [Google Scholar]
  20. Islam, S.M. Detection of shorted turns and winding movements in large power transformers using frequency response analysis. In Proceedings of the 2000 IEEE Power Engineering Society Winter Meeting, Singapore, 23–27 January 2000; pp. 2233–2238. [Google Scholar]
  21. Institute of Electrical and Electronics Engineers. IEEE Std. C57.149-2012—IEEE Guide for the Application and Interpretation of Frequency Response Analysis for Oil-Immersed Transformers; IEEE Power and Energy Society: Park Avenue, NY, USA, 2013; pp. 1–72. [Google Scholar]
  22. Mohammad, M.S.; Samimi, H.; Tenbohlen, P.S. The Numerical Indices Proposed for the Interpretation of the FRA Results: A Review. In Proceedings of the VDE High Voltage Technology 2016, ETG-Symposium, Berlin, Deutschland, 14–16 November 2016; pp. 377–383. [Google Scholar]
  23. Sardar, S.; Kumar, A.; Chatterjee, B.; Dalai, S. Application of Statistical Interpretation Technique for Frequency Response Analysis and Detection of Axial Displacement in Transformer Winding. In Proceedings of the 2017 IEEE Calcutta Conference (CALCON), Kolkata, India, 2–3 December 2017; pp. 461–464. [Google Scholar]
  24. Patel, M.R. Dynamic Response of Power Transformers Under Axial Short Circuit Forces Part II—Windings and Clamps as a Combined System. IEEE Trans. Power Appar. Syst. 1973, PAS-92, 1567–1576. [Google Scholar] [CrossRef]
  25. Patel, M.R. Dynamic Response of Power Transformers Under Axial Short Circuit Forces Part I—Winding and Clamp as Individual Components. IEEE Trans. Power Appar. Syst. 1973, PAS-92, 1558–1566. [Google Scholar] [CrossRef]
  26. Hashemnia, N.; Abu-Siada, A.; Masoum, M.A.S.; Islam, S.M. Characterization of transformer FRA signature under various winding faults. In Proceedings of the 2012 IEEE International Conference on Condition Monitoring and Diagnosis (CMD), Bali, Indonesia, 23–27 September 2012; pp. 446–449. [Google Scholar]
  27. International Electrotechnical Commission. IEC 60076-18, Power Transformers—Part 18: Measurement of Frequency Response; International Electrotechnical Commission: Geneva, Switzerland, 2012. [Google Scholar]
  28. Mukherjee, P.; Satish, L. Estimating the Equivalent Air-cored Inductance of Transformer Winding from Measured FRA. IEEE Trans. Power Deliv. 2018, 33, 1620–1627. [Google Scholar] [CrossRef]
  29. Yousof, M.F.M. Frequency Response Analysis for Transformer Winding Condition Monitoring. Ph.D. Thesis, The University of Queensland, St Lucia, QLD, Australia, 2015. [Google Scholar]
  30. Myers, J.L.; Well, A.; Lorch, R.F. Research Design and Statistical Analysis; Routledge: Abingdon, UK, 2012. [Google Scholar]
  31. Saleh, S.M.; EL-Hoshy, S.H.; Gouda, O.E. Proposed diagnostic methodology using the cross-correlation coefficient factor technique for power transformer fault identification. IET Electr. Power Appl. 2017, 11, 412–422. [Google Scholar] [CrossRef]
  32. Mahvi, M.; Behjat, V.; Rahimpour, E. New statistical approach to interpret power transformer frequency response analysis: Non-parametric statistical methods. IET Sci. Meas. Technol. 2016, 10, 364–369. [Google Scholar]
  33. Yousof, M.F.M.; Riang, S.; Uyup, M.K.A. The influence of data size in statistical analysis of power transformer frequency response. In Proceedings of the 2016 IEEE International Conference on Power and Energy (PECon), Melaka, Malaysia, 28–29 November 2016; pp. 595–599. [Google Scholar]
  34. Tarimoradi, H.; Gharehpetian, G.B. Novel calculation method of indices to improve classification of transformer winding fault type, location, and extent. IEEE Trans. Ind. Inform 2017, 13, 1531–1540. [Google Scholar] [CrossRef]
  35. Kennedy, G.M.; Mcgrail, A.J.; Lapworth, J.A. Using Cross-Correlation Coefficients to Analyze Transformer Sweep Frequency Response Analysis. In Proceedings of the IEEE Power Engineering Society Conference and Exposition in Africa—PowerAfrica, Johannesburg, South Africa, 16–20 July 2007; pp. 1–6. [Google Scholar]
  36. Yousof, M.F.M.; Ekanayake, C.; Saha, T.K. Frequency response analysis to investigate deformation of transformer winding. IEEE Trans. Dielectr. Electr. Insul. 2015, 22, 2359–2367. [Google Scholar] [CrossRef]
  37. Yousof, M.F.M.; Ekanayake, C.; Saha, T.K. Locating inter-disc faults in transformer winding using frequency response analysis. In Proceedings of the 2013 Australasian Universities Power Engineering Conference (AUPEC), Hobart, TAS, Australia, 29 September–3 October 2013; pp. 1–6. [Google Scholar]
  38. Badgujar, K.P.; Kulkarni, S.V. Fuzzy Logic Based Identification of Deviations in Frequency Response of Transformer Windings. pp. 1–6. Available online: http://www.iitk.ac.in/npsc/Papers/NPSC2012/papers/12145.pdf (accessed on 5 April 2018).
  39. Kim, J.W.; Park, B.; Jeong, S.C.; Kim, S.W.; Park, P. Fault diagnosis of a power transformer using an improved frequency-response analysis. IEEE Trans. Power Deliv. 2005, 20, 169–178. [Google Scholar] [CrossRef]
Figure 1. 500 kVA, 11/0.433 kV distribution transformer: (a) with top clamping—front view; (b) with top clamping—side view; (c) without top clamping—front view; (d) without top clamping—side view.
Energies 11 02307 g001
Figure 2. Frequency response analysis (FRA) measurement configurations: (a) end-to-end open circuit high-voltage (HV) winding; (b) end-to-end open circuit low-voltage (LV) winding; (c) end-to-end short circuit HV; (d) FRA analyzer.
Energies 11 02307 g002
Figure 3. End-to-end open circuit test on HV winding. Measurement at terminals: (a) R-Y for phase R; (b) Y-B for phase Y; (c) B-R for phase B.
Energies 11 02307 g003aEnergies 11 02307 g003b
Figure 4. End-to-end open circuit test on the LV winding. Measurement at terminals (a) r-n for phase r; (b) y-n for phase y; (c) b-n for phase b.
Energies 11 02307 g004aEnergies 11 02307 g004b
Figure 5. End-to-end short circuit test on HV winding. Measurement at terminals R-Y for phase R.
Energies 11 02307 g005
Table 1. The relationship between the winding deformation degree and relative factor.
Degree of Winding DeformationRelative Factors, Rxy
Severe DeformationRLF < 0.6
Obvious Deformation1.0 > RLF ≥ 0.6 or RMF < 0.6
Slight Deformation2.0 > RLF ≥ 1.0 or 0.6 ≤ RMF < 1.0
Normal WindingRLF ≥ 2.0, RMF ≥ 1.0 and RHF ≥ 0.6
Table 2. Comparison of statistical methods for frequency response interpretation of HV winding.
Test ConfigurationFrequency RangePCCSCCKCCCCFRMSEASLEF-Test
HV R-Y20 Hz–2 kHz0.99810.99770.98410.99820.48161.67150.6742
2 kHz–400 kHz0.99990.99980.99650.99940.17220.74070.9397
400 kHz–2 MHz0.98720.99050.93120.97661.42030.81550.7324
HV Y-B20 Hz–1.5 kHz0.99710.99900.99070.9970.53082.26330.0072
1.5 kHz–450 kHz0.99860.99990.99710.99850.78561.15320.5466
450 kHz–2 MHz0.97660.98410.91580.97661.75131.2130.3021
HV B-R20 Hz–2 kHz0.99820.99820.98650.99820.45991.36650.3748
2 kHz–450 kHz0.99980.99980.99710.99980.27350.63460.9014
450 kHz–2 MHz0.93450.95910.86660.93442.70980.94460.4024
Table 3. Comparison of statistical methods for frequency response interpretation of LV winding.
Test ConfigurationFrequency RangePCCSCCKCCCCFRMSEASLEF-Test
LV r-n20 Hz–1.5 kHz0.97010.99310.96790.97070.33770.77390.0000
1.5 kHz–1 MHz0.99990.99970.98970.99990.14700.33840.6274
1 MHz–2 MHz0.99860.99680.96560.99860.29710.37910.5096
LV y-n20 Hz–1.5 kHz0.98580.95730.88480.98630.19541.32300.0002
1.5 kHz–1 MHz0.99950.99870.97830.99950.29450.58480.5205
1 MHz–2 MHz0.99760.99540.96130.99760.34190.64920.1454
LV b-n20 Hz–1.5 kHz0.98270.99190.96560.98290.25330.66250.0029
1.5 kHz–1 MHz0.99920.99980.99150.99920.37470.37480.2105
1 MHz–2 MHz0.98650.99060.93580.98650.91790.57420.0426
Table 4. Relative factors at different frequency regions/test configurations and the suggested winding condition.
Test ConfigurationRelative Factor, RxySuggested Winding Condition
LFMFHF
HV R-Y101010Normal
HV Y-B101010
HV B-R101010
LV r-n101010
LV y-n101010
LV b-n101010

