Article

Investigating the Dehumidification Characteristics of Turbine Stator Cascades with Parallel Channels

Key Lab of Condition Monitoring and Control for Power Plant Equipment, North China Electric Power University, Ministry of Education, Baoding 071003, China
*
Author to whom correspondence should be addressed.
Energies 2018, 11(9), 2306; https://doi.org/10.3390/en11092306
Submission received: 5 August 2018 / Revised: 24 August 2018 / Accepted: 25 August 2018 / Published: 2 September 2018

Abstract

:
Steam turbines play a vital role in the power industry. The efficiency of the steam turbine can be improved by reforming the flow structure. For the White cascade, a parallel channel which is an additional steam passage was designed to connect adjacent steam flow channels. In view of the steepening and sensitive characteristics of the steam condensation parameters in the White cascade, the two-fluid model was applied to study the condensation and aerodynamic characteristics of the prototype cascade and the modified cascade. Wetness losses were regarded as the evaluation standard, and the optimum design of the parallel channel was obtained. The influence of channel width was also studied. The location of the suction surface (D point) has great influence on the dehumidification performance of the cascade. On the contrary, the location of the pressure surface (C point) has no significant effect on dehumidification performance. Moreover, it is necessary to select the width of the parallel channel in combination with the cascade performance. It is suggested that the parallel channel width should be between 3 and 5 mm. The research results can provide a reference for the optimal design of a turbine stator cascade.

1. Introduction

In the 21st century, demand for electricity is increasing with rapid economic development. As the main energy conversion device for thermal power and nuclear power generation, the steam turbine plays an important role in electricity supply. Furthermore, to a certain extent, rational transformations of the internal structure of steam turbines contribute to an increase in steam turbine efficiency and a decrease in energy loss. The last few stages of a steam turbine low-pressure cylinder usually work in the wet steam region. In the course of rapid expansion of steam, due to the non-equilibrium condensation characteristics, the steam reaches the supersaturated state below the saturation line. When the expansion reaches a certain degree, the thermodynamic equilibrium state of steam is broken, and many small water droplets, so-called condensation nucleus, are generated in the steam flow. At the same time, the steam condensation zone experiences significant disturbance, called condensation shock. The condensation latent heat generated by the aggregation of vapor molecules makes the pressure and temperature rise and the Mach number decrease. The gradient of the steam parameters varies abruptly, resulting in the deterioration of steam flow. Moreover, the difference of temperature and inertia between the gas and liquid phases leads to irreversible thermodynamic loss during the heat transfer process and loss of dynamics due to the departure of the phase trajectories. The formation of water droplets will also cause erosion of the last stage of the steam turbine, resulting in significant economic loss. Therefore, dehumidification is necessary for wet steam flow in steam turbines. Besides, dehumidification is also needed in other devices, such as solar-powered refrigeration systems [1], falling film dehumidifiers [2,3], and so on.
In principle, describing the water droplet nucleation and growth process is key to studying wet steam flow, which is the basis for analyzing the source of loss. A model describing the process of steam condensation nucleation, the classical nucleation theory, was put forward, which laid a solid foundation for research on wet steam two-phase condensation flow [4]. When the classical nucleation theory was applied to practical calculation, it was found that the relevant assumptions did not match the real situation, making the calculation accuracy poor. Therefore, in order to develop and improve the classical nucleation theory, the corresponding equations were corrected by Kantrowitz [5] and Courtney [6], which made the prediction more accurate in a wide pressure range. However, although the accuracy of the modeling results was partially improved, the model did not yet reach the desired level. It was generally believed that this discrepancy stemmed mainly from the difficulties encountered in the water droplet growth model [7]. Consequently, Gyarmathy [8] proposed a theoretical method for predicting nucleation evolution. It was considered that the growth/decay of droplets was controlled by the droplet growth equation. Unfortunately, it was assumed that the steam condensation process of the wet steam flow was continuous, which led to inaccuracy in the calculation of the transition zone. Hence, based on the energy conservation equation and molecular dynamics theory, the Gyarmathy model was corrected by Hill [9], but its complexity restricted its application. The water droplet growth model provided by Young [10] was widely used, which was based on the heat transfer condition between the two phases. According to the Young model, a significant number of experimental and numerical studies have been carried out [11,12,13,14].
How to improve the efficiency of the steam turbine has been the focus of many researchers. A considerable number of studies on gas-liquid mixing flows have been carried out. Starzmann [15] applied the two-phase computational fluid dynamics model to study the components of wetness losses, indicating that the thermodynamic loss might account for more than 90% of wetness losses. Harris [16] applied a dehumidification baffle device to the actual operation unit and significantly reduced the wetness. By optimizing the profile of a stator cascade, Li [17] reduced the boundary layer separation and limited secondary flow loss, thus improving the aerodynamic efficiency and greatly reducing the primary and secondary droplets. An internal CFD (Computational Fluid Dynamics) code was developed by Abadi [18] in order to solve the governing equations of two-phase flow and verify the existing experimental data. The shape of a turbine cascade was optimized in accordance with the interaction between the nuclear droplets and the continuous vapor, and the unsteady, turbulent, supersonic, and compressible flow was simulated by a two-fluid model. The results showed that the blade optimization promoted the efficiency of the steam turbine. An experimental study was carried out by Gribin [19] to analyze the effect of steam injection on the flow path and radius of water droplets. Afterwards, Mirhoseini [20,21] studied the effect of high-temperature steam injection on steam flow in the de Laval nozzle. The multiobjective genetic algorithm was applied to figure out the optimal design. The calculation results showed that the water droplet radius and steam wetness could be significantly reduced by high-temperature steam injection. Based on the two-phase Eulerian–Eulerian description and the SST (Shear-Stress Transport) k-omega turbulence model, Vatanmakan [22] studied the effect of volume heating on the parameters of the condensate flow in a turbine stator cascade, indicating that proper volume heating could prevent corrosion of the liquid phase and total entropy generation. A new type of dehumidification structure was proposed by Zhang [23], which inhibited steam nucleation and reduced steam wetness. Esfe [24] analytically investigated the gas-liquid mixing flow and pointed out that the influence of surface roughness on subsonic flow was greater than the supersonic flow. Thus, in actual operation, it is necessary to consider cleaning the subsonic part of the steam turbine.
To the best of our knowledge, no previous effort has been made to add parallel channels that connect the adjacent flow channels to the steam passage of steam turbines. Therefore, on the basis of the existing research, the White cascade [11] was taken as the major object in this paper. Through the opening of a parallel channel on the cascade, the purpose of reducing the losses associated with wetness was achieved, and the distributions of the parameters of the condensing flow under different schemes were compared to determine the best design scheme. The final results can provide a scientific basis and reference for the optimal design of a turbine stator cascade.

2. Model Building

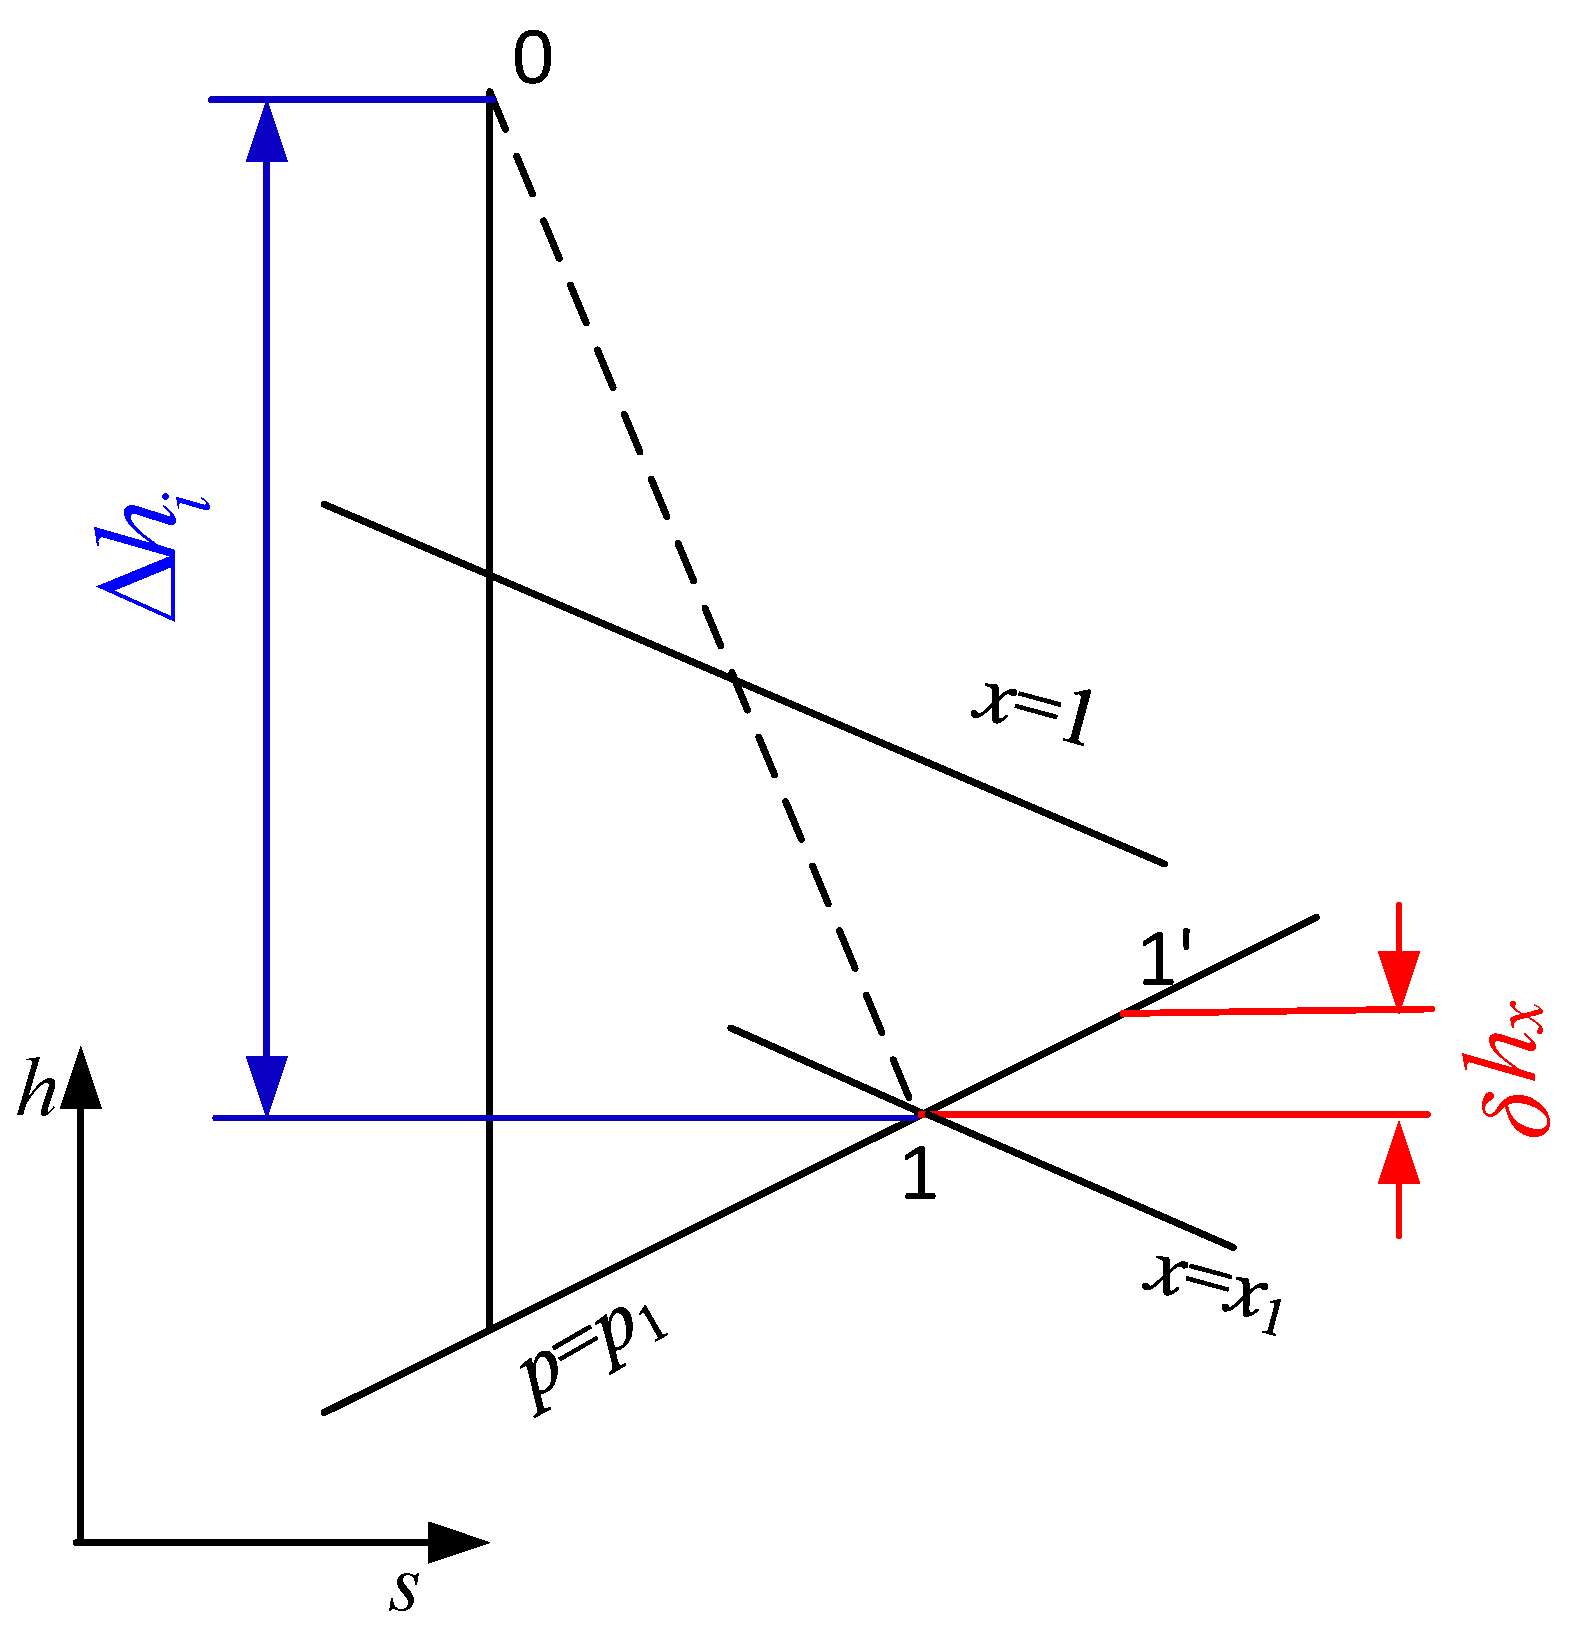
2.1. Mechanism of Wetness Losses

Compared to superheated steam, the existence of water droplets in wet steam unfavorably affects the thermodynamic and dynamic characteristics and weakens the ability of steam to generate useful energy, resulting in wetness losses. Wetness losses mainly include the following: Supercooling loss, viscosity loss, heat transfer loss, entrainment loss, brake loss, disturbance loss, working medium loss, and so on. Supercooling loss results from a decrease in the ideal specific enthalpy drop caused by supersaturated steam. Viscosity loss is derived from the friction between the two phases. Heat transfer loss stems from interphase differences in temperature. Entrainment loss is caused by the slip between the two phases. Brake loss is the energy consumption generated from water droplets impinging on the rotor blades irregularly. Disturbance loss comes from changes in the primary flow caused by water droplets. Working medium loss arises from useful steam being attached to the process of capturing water droplets, thus causing some favorable energy to not be utilized.
Due to the complexity of geometric channels inside steam turbines and the three-dimensional flow characteristics, it is not possible to assess the additional loss related to wet steam from the mechanism layer by rule and line. For different types of steam turbines, according to turbine experiments, the Baumann factor is approximately equal to 1 [25], so the Baumann formula is used to calculate wetness losses in steam turbines, which is defined as:
δ h x = ( 1 x m ) Δ h i
where δhx is wetness losses, Δhi is effective enthalpy drop without taking wetness losses into account, and xm corresponds to mean dry degree within a cascade.
Figure 1 indicates wetness losses on the h-s diagram. As can be seen, 0 is the actual state point of steam of the inlet and 1 is the hypothetical state point without considering wetness loss. When considering wetness losses, the actual state of steam at the outlet of the stator cascade is 1’. From Equation (1), it is certain that wetness leads to decreased efficiency. In engineering, this method is usually applied to evaluate the superiority of different working conditions and schemes.

2.2. Governing Equations

For the equation of steam nucleation, the widely used corrected model proposed by Wölk [26,27] is adopted, with the definition of:
J WS = q c ρ g 2 ρ d ( 2 σ π m 3 ) 1 / 2 exp ( 4 π r c 2 σ 3 k T g ) exp ( 27.56 + 6.5 × 10 3 T g )
where JWS, qc, ρg, ρd, σ, m, rc, k, and Tg denote nucleation rate per unit volume, condensation coefficient, density of gas, density of liquid, liquid surface tension, single molecular mass, critical droplet radius, Boltzmann constant, and gas temperature, respectively. Critical droplet radius rc is defined as follows [28]:
r c = 2 σ   ρ d R T g ln S
S = P P S ( T g )
where S is supersaturation ratio and R is gas constant.
Droplet growth is modelled with Young’s modified form of Gyarmathy’s growth law [29], which is defined as:
d r d t = λ g Δ T ( 1 r c r ) ρ d h fg r [ 1 1 + 1.5 K n + 3.78 ( 1 δ ) K n P rg ]
δ = R T S h fg [ φ ( P ) 0.5 2 q c 2 q c γ + 1 2 ( γ 1 ) R T S h fg ]
φ ( P ) = 3.25 [ 1 tanh ( p 10 4 ) 2 ]
where λg, ΔT, r, hfg, Kn, δ, p, TS, γ, φ(P) and Prg correspond to thermal conductivity of gas, supercooling degree of gas, droplet radius, condensation latent heat, Knudsen number, semi-empirical correction coefficient of droplet growth, gas pressure, saturation temperature, gas adiabatic constant, correction coefficient of droplet growth model, and Prandtl number, respectively.
According to references [30,31], the continuity equation is in the following form:
{ ρ g t + ( ρ g u j ) x j = m ˙ ρ d t + ( ρ d u d j ) x j = m ˙
The equation of conservation of gas momentum is as follows:
( ρ g u i ) t + ( ρ g u i u j ) x j = p x i + τ i j x j + Δ ρ g i F D + u i S
The equation of conservation of liquid momentum is:
( ρ d u d i ) t + ( ρ d u d i u d j ) x j = ρ d g i + F D + ( u i u d i ) S
The energy equation is expressed as:
( ρ g e ) t + ( ρ g u j e ) x j = x i ( λ T x j ) ( p u j ) x j + ( τ k j i u k i ) x j m ˙ ( h t h fg )
where m ˙ , u, x, τ, FD, S, and ht stand for mass generation rate, velocity component, Cartesian direction, viscous stress tensor, viscous resistance, calculation source term, and total enthalpy of gas, respectively.
Combined with reference [32], the calculation formula for wetness is written as:
Y = 4 3 π ρ d r   3 N
The calculation formula for mass generation rate is:
m ˙ = 4 π ρ [ 1 3 ( 1 Y ) J r c 3 + r c 2 N d r d t ]
where Y is wetness of flow and N denotes the amount of droplets in a unit volume.
The state equation can be used to obtain vapor properties, which is defined as [22]:
p = ρ g R T ( 1 + B ρ g + C ρ g 2 )
where B and C are the second and the third Virial coefficients.

3. Numerical Method

In the current study, all the numerical calculations were based on the two-dimensional Reynolds averaged Navier Stokes (RANS) equation. The implicit density-based coupled solver was used in the simulation, and convective flux was calculated by the Roe [33] method. In addition, SST (Shear-Stress Transport) k-ω-kd was employed to calculate adhesion flow in the two-phase turbulence model. Meanwhile, the control equations of the vapor phase flow were discretized using a second-order explicit TVD (Total Variation Diminishing) scheme. Since the pressure coupling was not involved in the fluid flow control equations, the second-order precision QUICK scheme was imposed to disperse, and the alternating direction implicit iteration method was adopted to solve this problem.

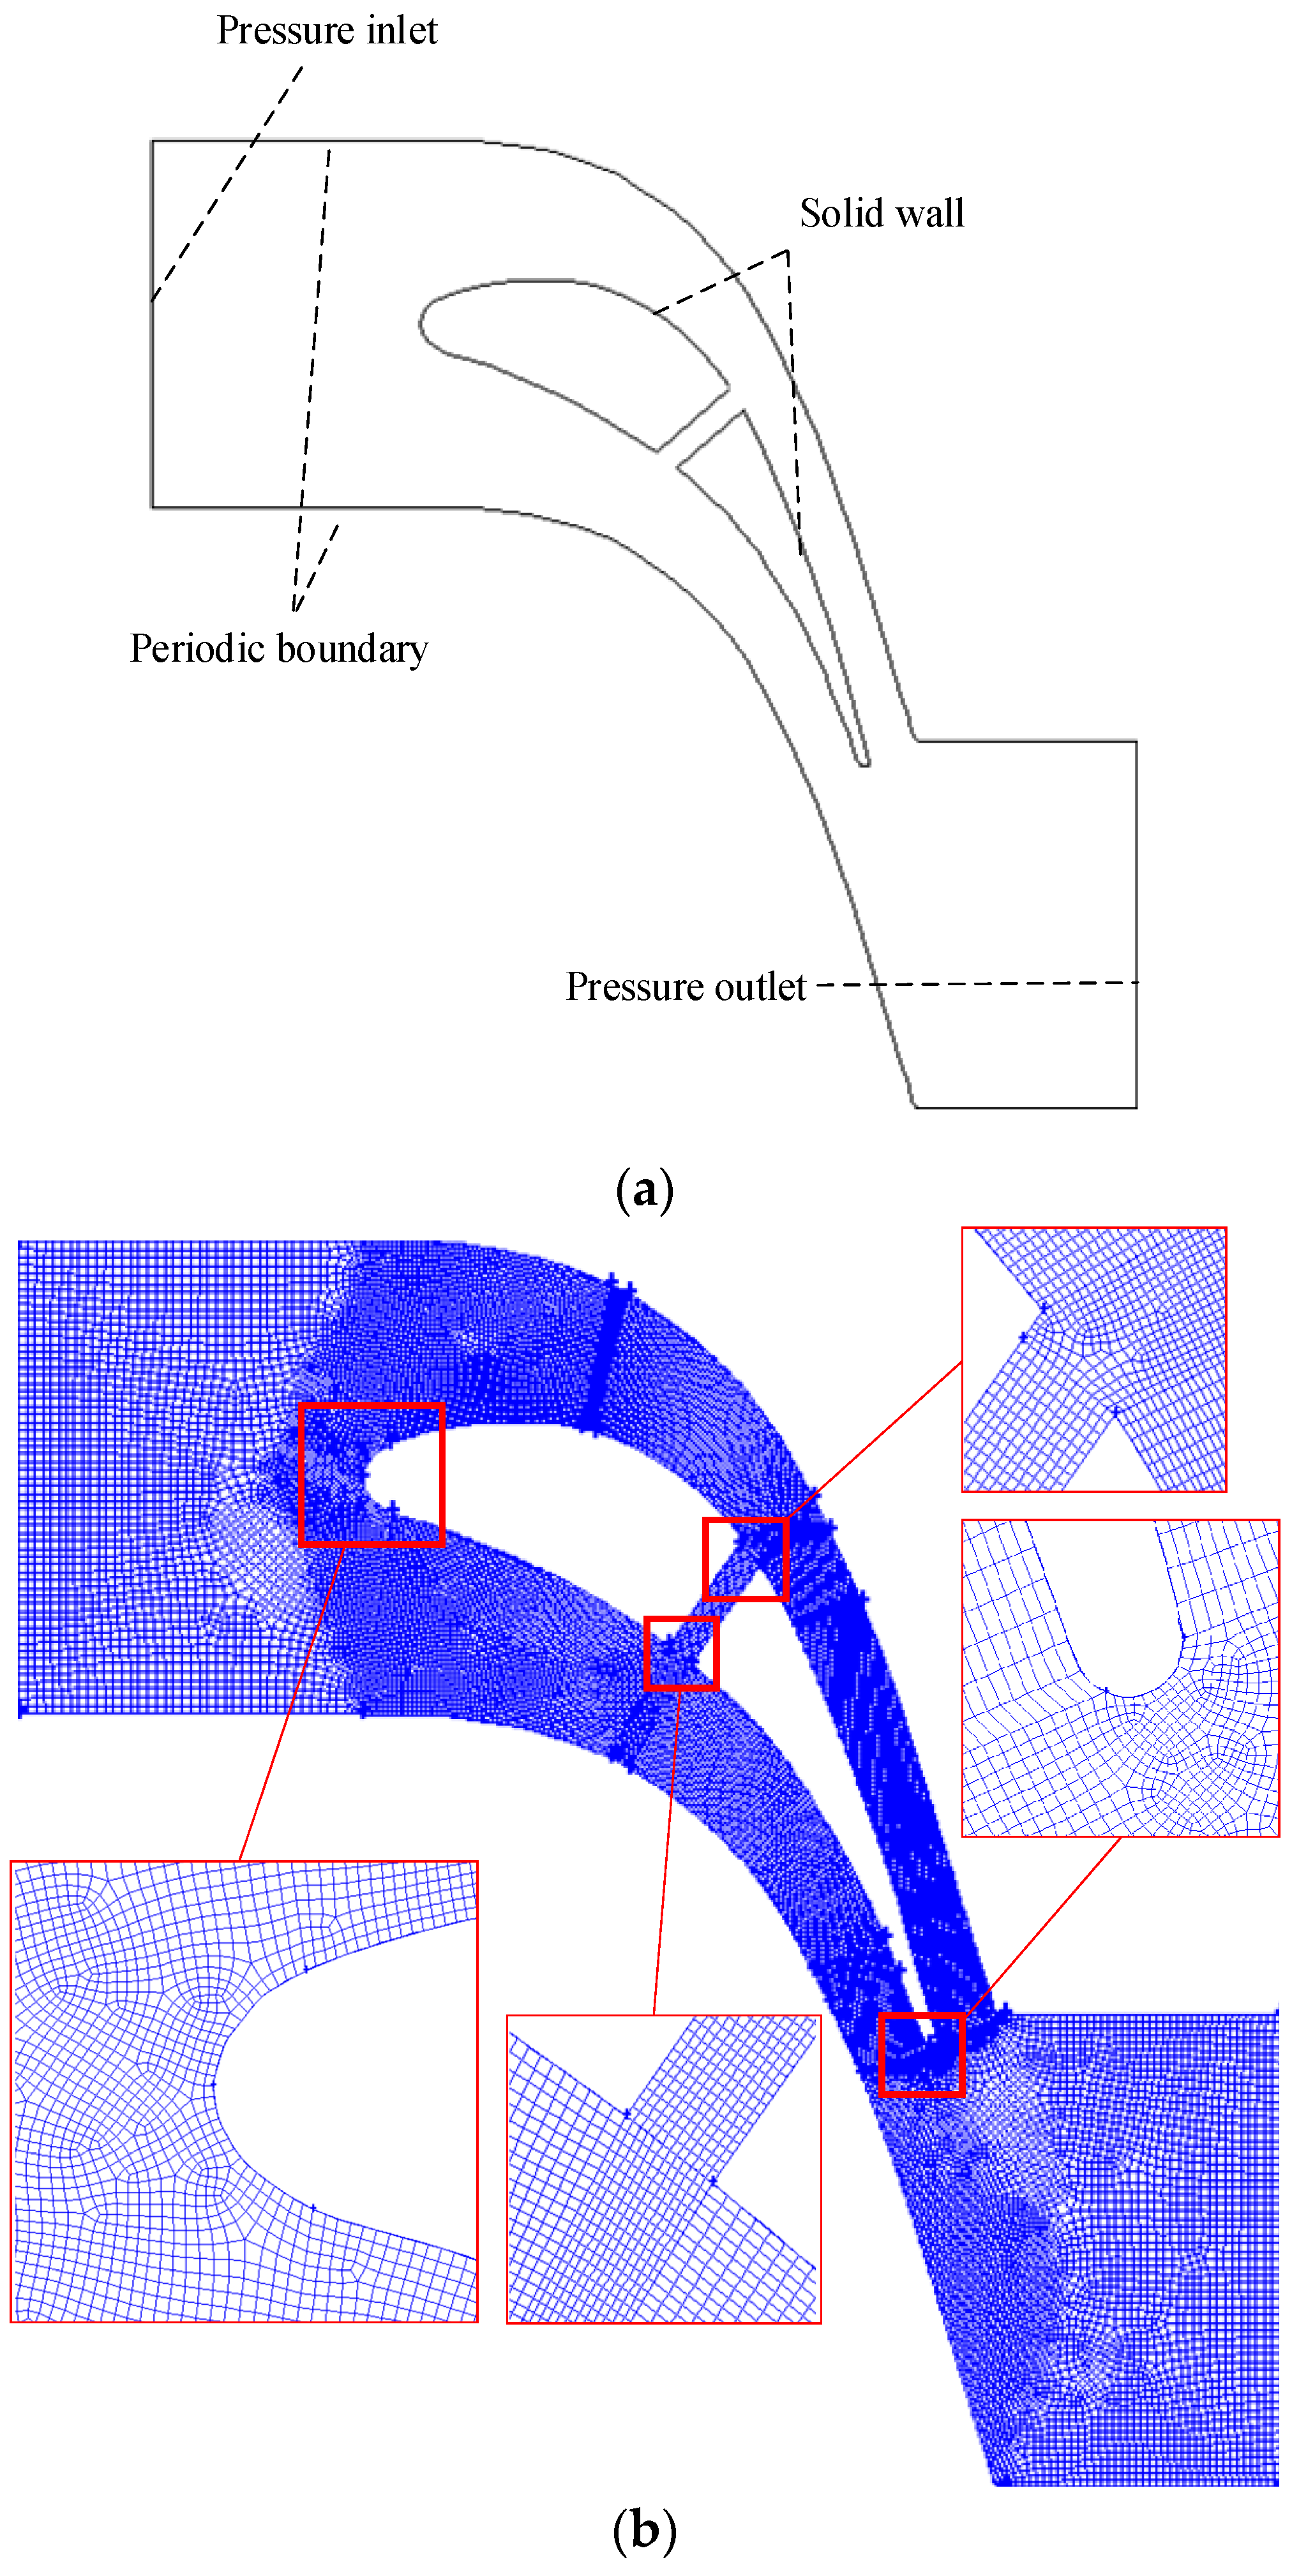
4. Physical Model Description
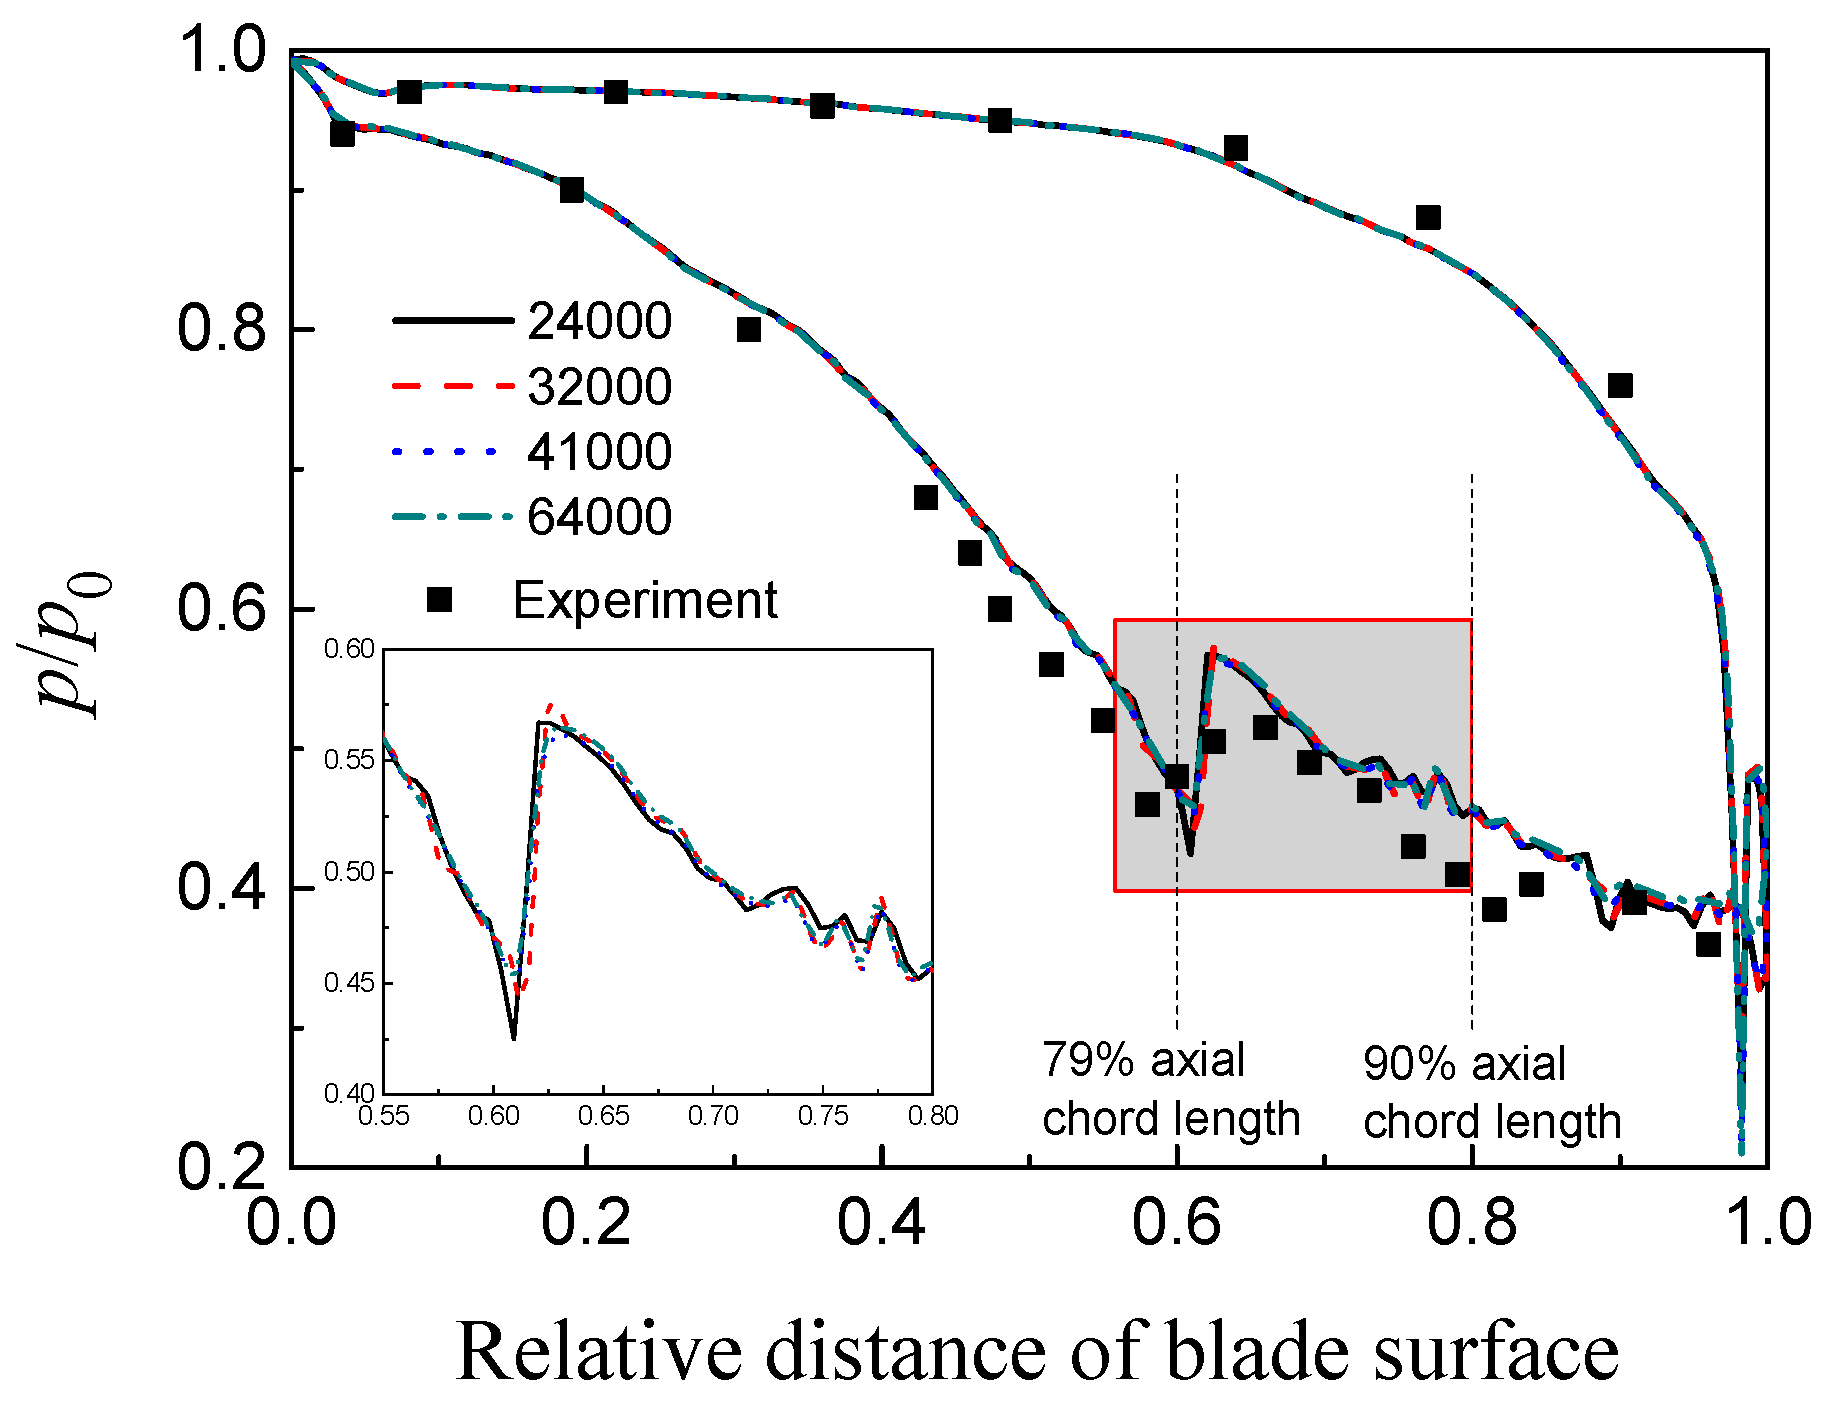
4.1. Validation

In this section, to ensure the accuracy of the numerical model, the White cascade [11] was used to calculate the L2 case. The blade pitch was 87.59 mm, the blade axial chord length was 106.48 mm, and the blade chord length was 149.02 mm. For the L2 case, the inlet steam temperature was 354 K and the steam pressure was 40.9 kPa, while the outlet steam static pressure was 19.4 kPa. By importing the in-house CFD code, ANSYS-Fluent 17.0 was used to carry out a numerical calculation of the 2D White cascade investigated in this paper. Grid structures with different grid quantities (24,000, 32,000, 41,000, and 64,000) were utilized to implement the current numerical calculation. The resulting pressure ratio distribution of the blade surface is shown in Figure 2. As observed in Figure 2, apart from the relative distance between 0.75 and 0.85, the calculated values of the pressure ratio are in good agreement with the experimental values obtained from reference [11], which indicates that the calculation model in this paper cannot capture the characteristics of the droplet growth process well. However, in general, the difference between the calculated values and the experimental values is not significant in engineering terms. Besides, in accordance with references [7,12], due to the difficulty in describing the droplet growth process, the present numerical calculation will deviate from the experiment to a certain extent, therefore a certain accuracy is obtained in this paper. In order to eliminate the impact of grid density on calculating the results and enhancing calculating efficiency, the physical model with a grid number of 41,000 was selected for subsequent calculation.

4.2. Physical Model and Experimental Method

In an attempt to facilitate analysis and discussion, the prototype White cascade was named ORI (representing the original cascade case). The naming rule for different parallel channels is exhibited in Figure 3. The naming rule is p-s-d, in which p is the axial chord length of the C point on the pressure surface, s is the axial chord length of the D point of the suction surface, and d is the width of the parallel channel in mm. The design case given in Figure 3 was named 0.57-0.72-5. After the C and D points were selected, the d mm was moved to upstream of the cascade with the line CD as the reference. The intersections of the pressure surface and the suction surface were points M and N, and the parallel channels were set up on the basis of lines CD and MN.
The boundary conditions of the calculation model are presented in Figure 4a. The pressure inlet and pressure outlet boundary conditions were installed at the entrance and outlet of the cascade, respectively, while the blade surface and parallel channels were the solid wall boundary and the cascade channel was set to a periodic boundary. Besides, the cascade channel was divided into several parts properly. The irregular parts were divided into unstructured quadrilateral meshes, and structured quadrilateral meshes were imposed for the regular parts. At the same time, mesh refinement was carried out at the front edge, the trailing edge, the blade surface, and the parallel channel to improve the calculation accuracy. The specific mode of division and the distribution of the grid are shown in Figure 4b.

5. Results and Discussion

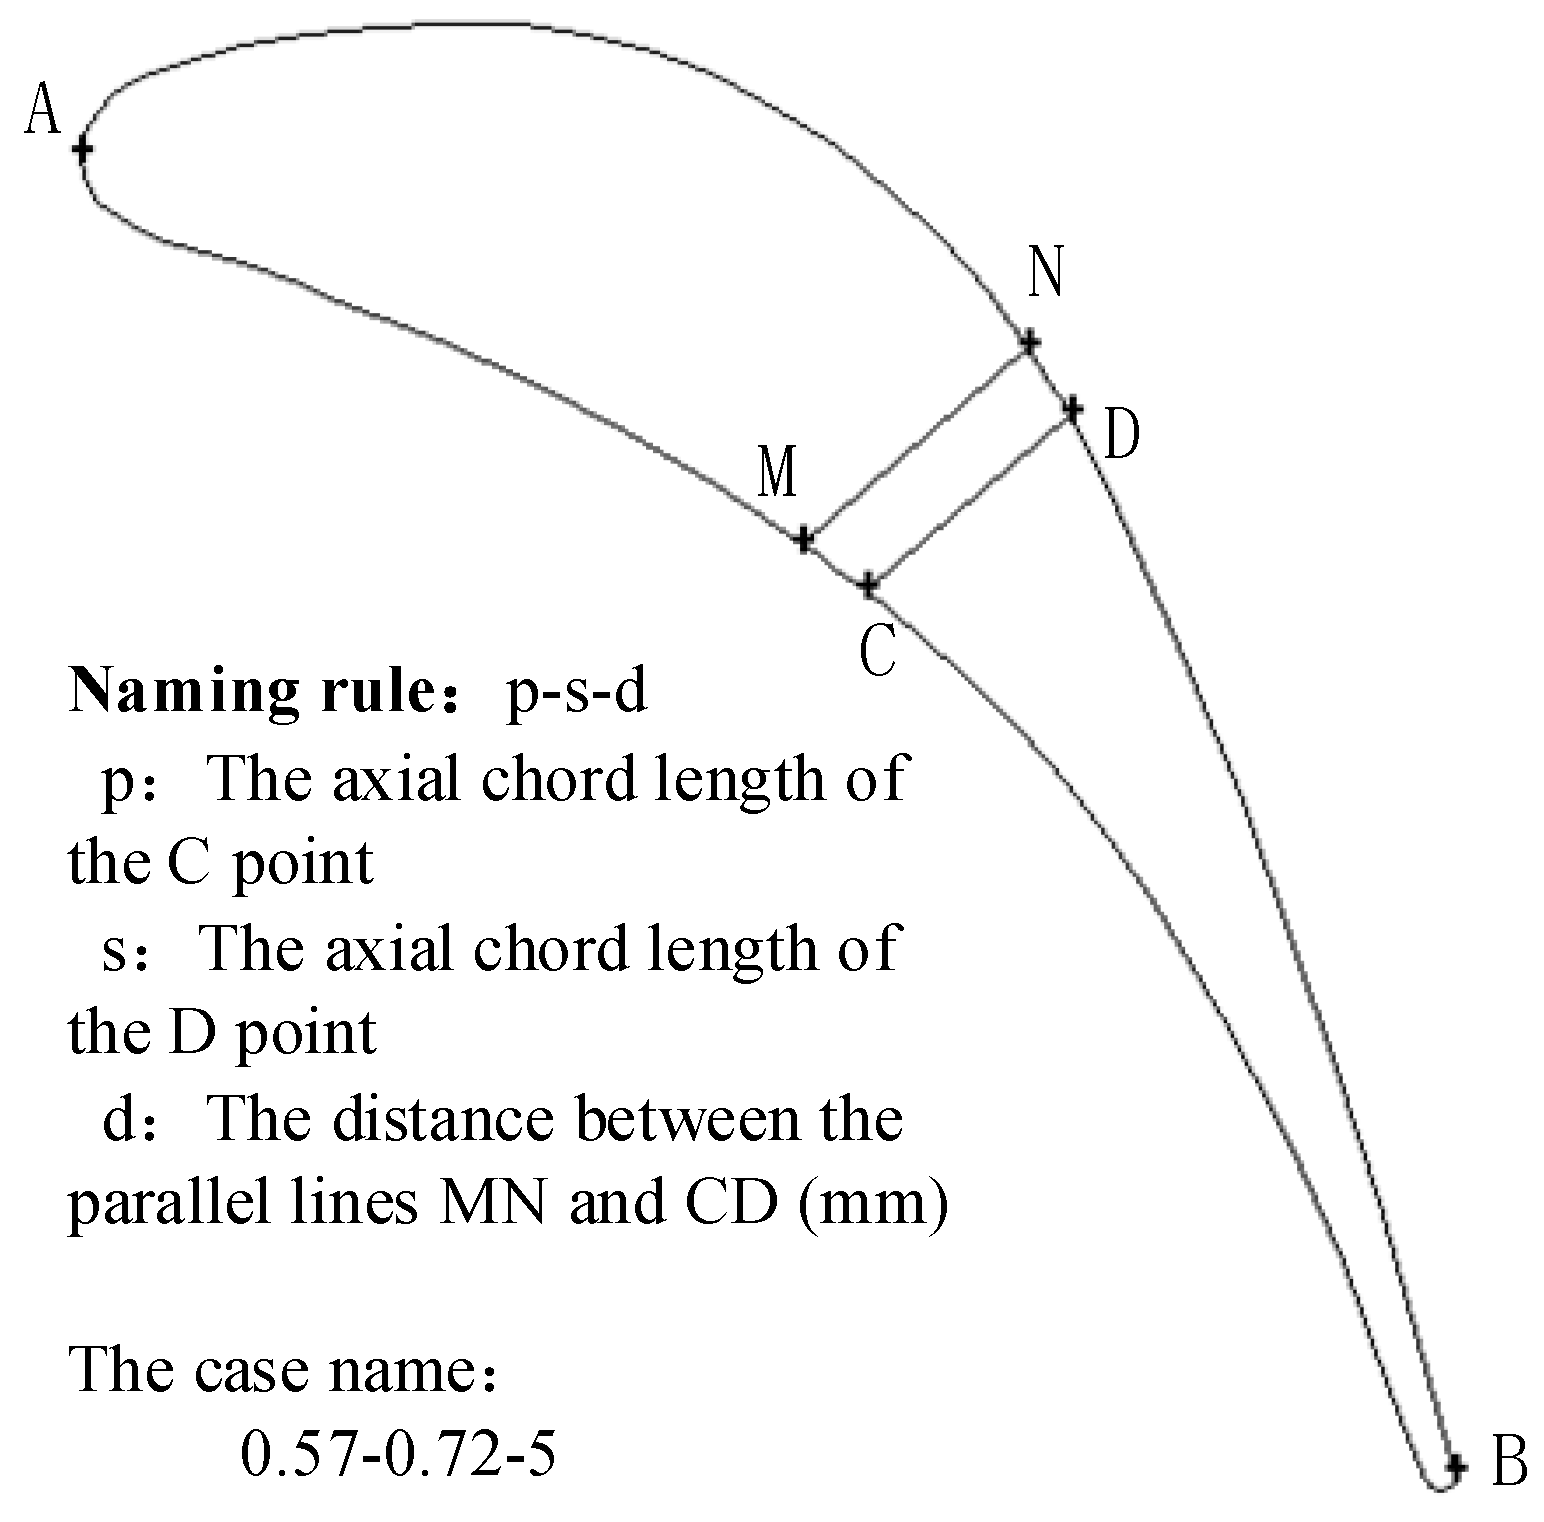
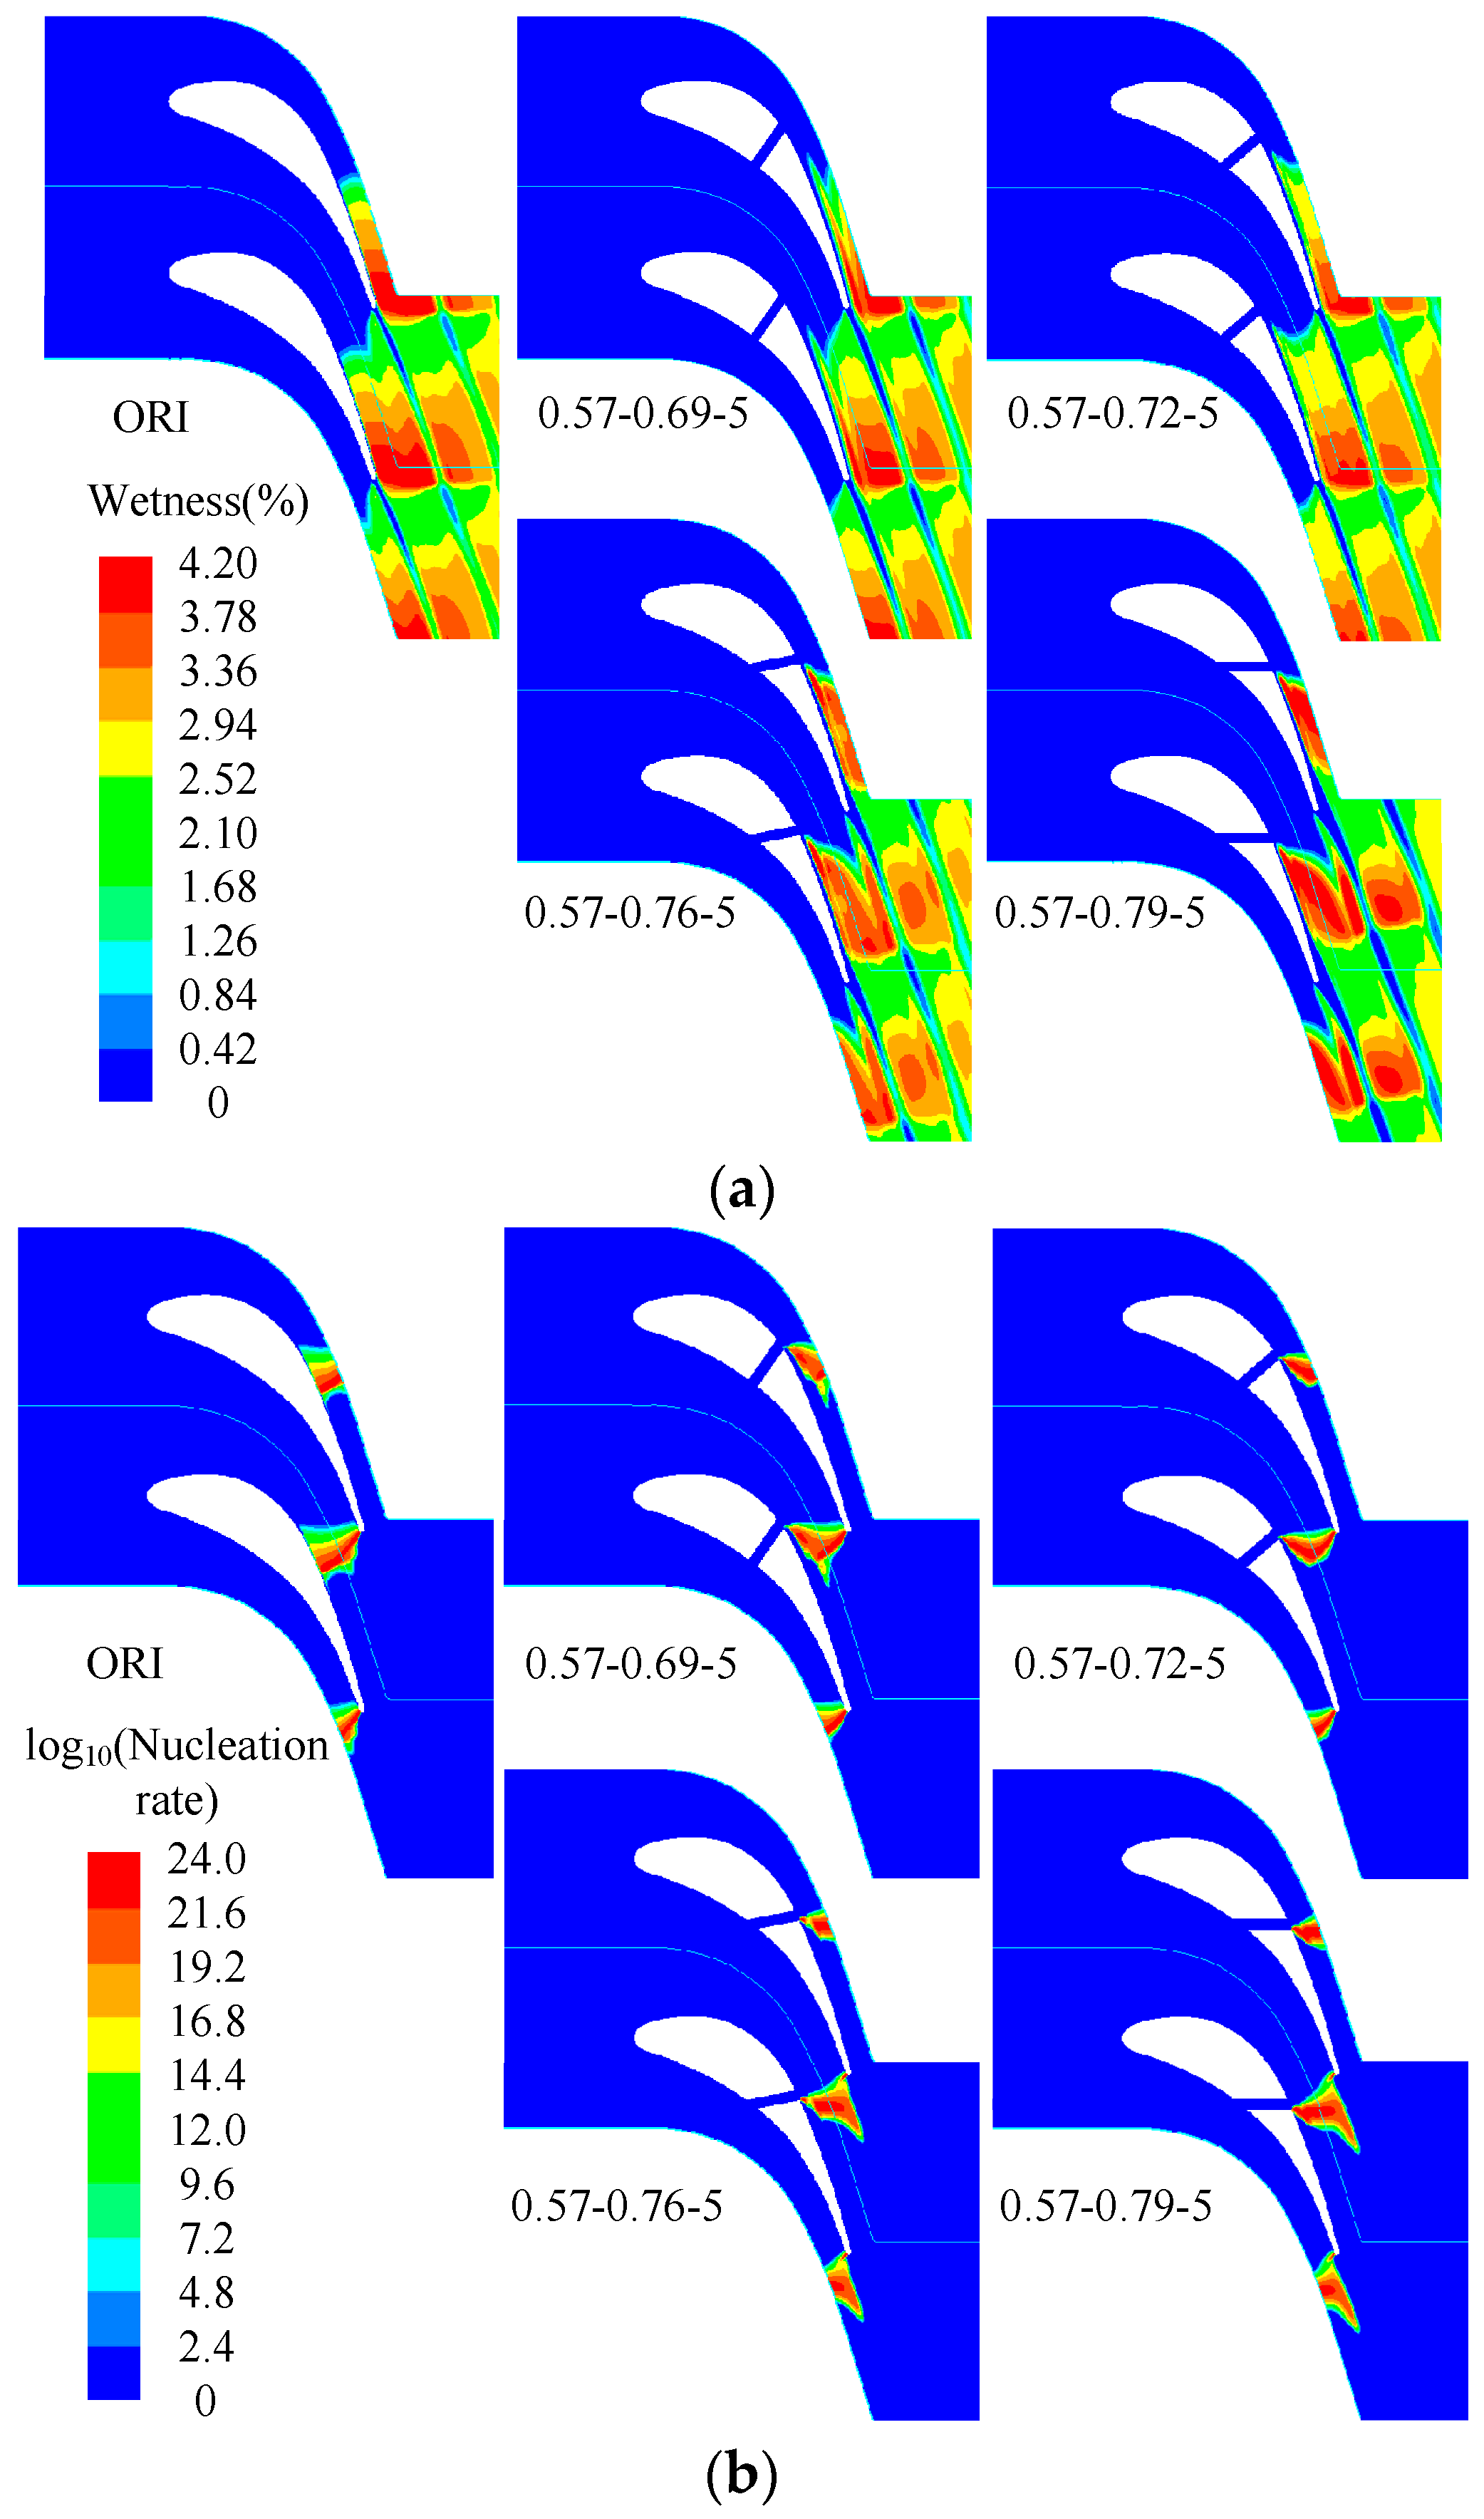
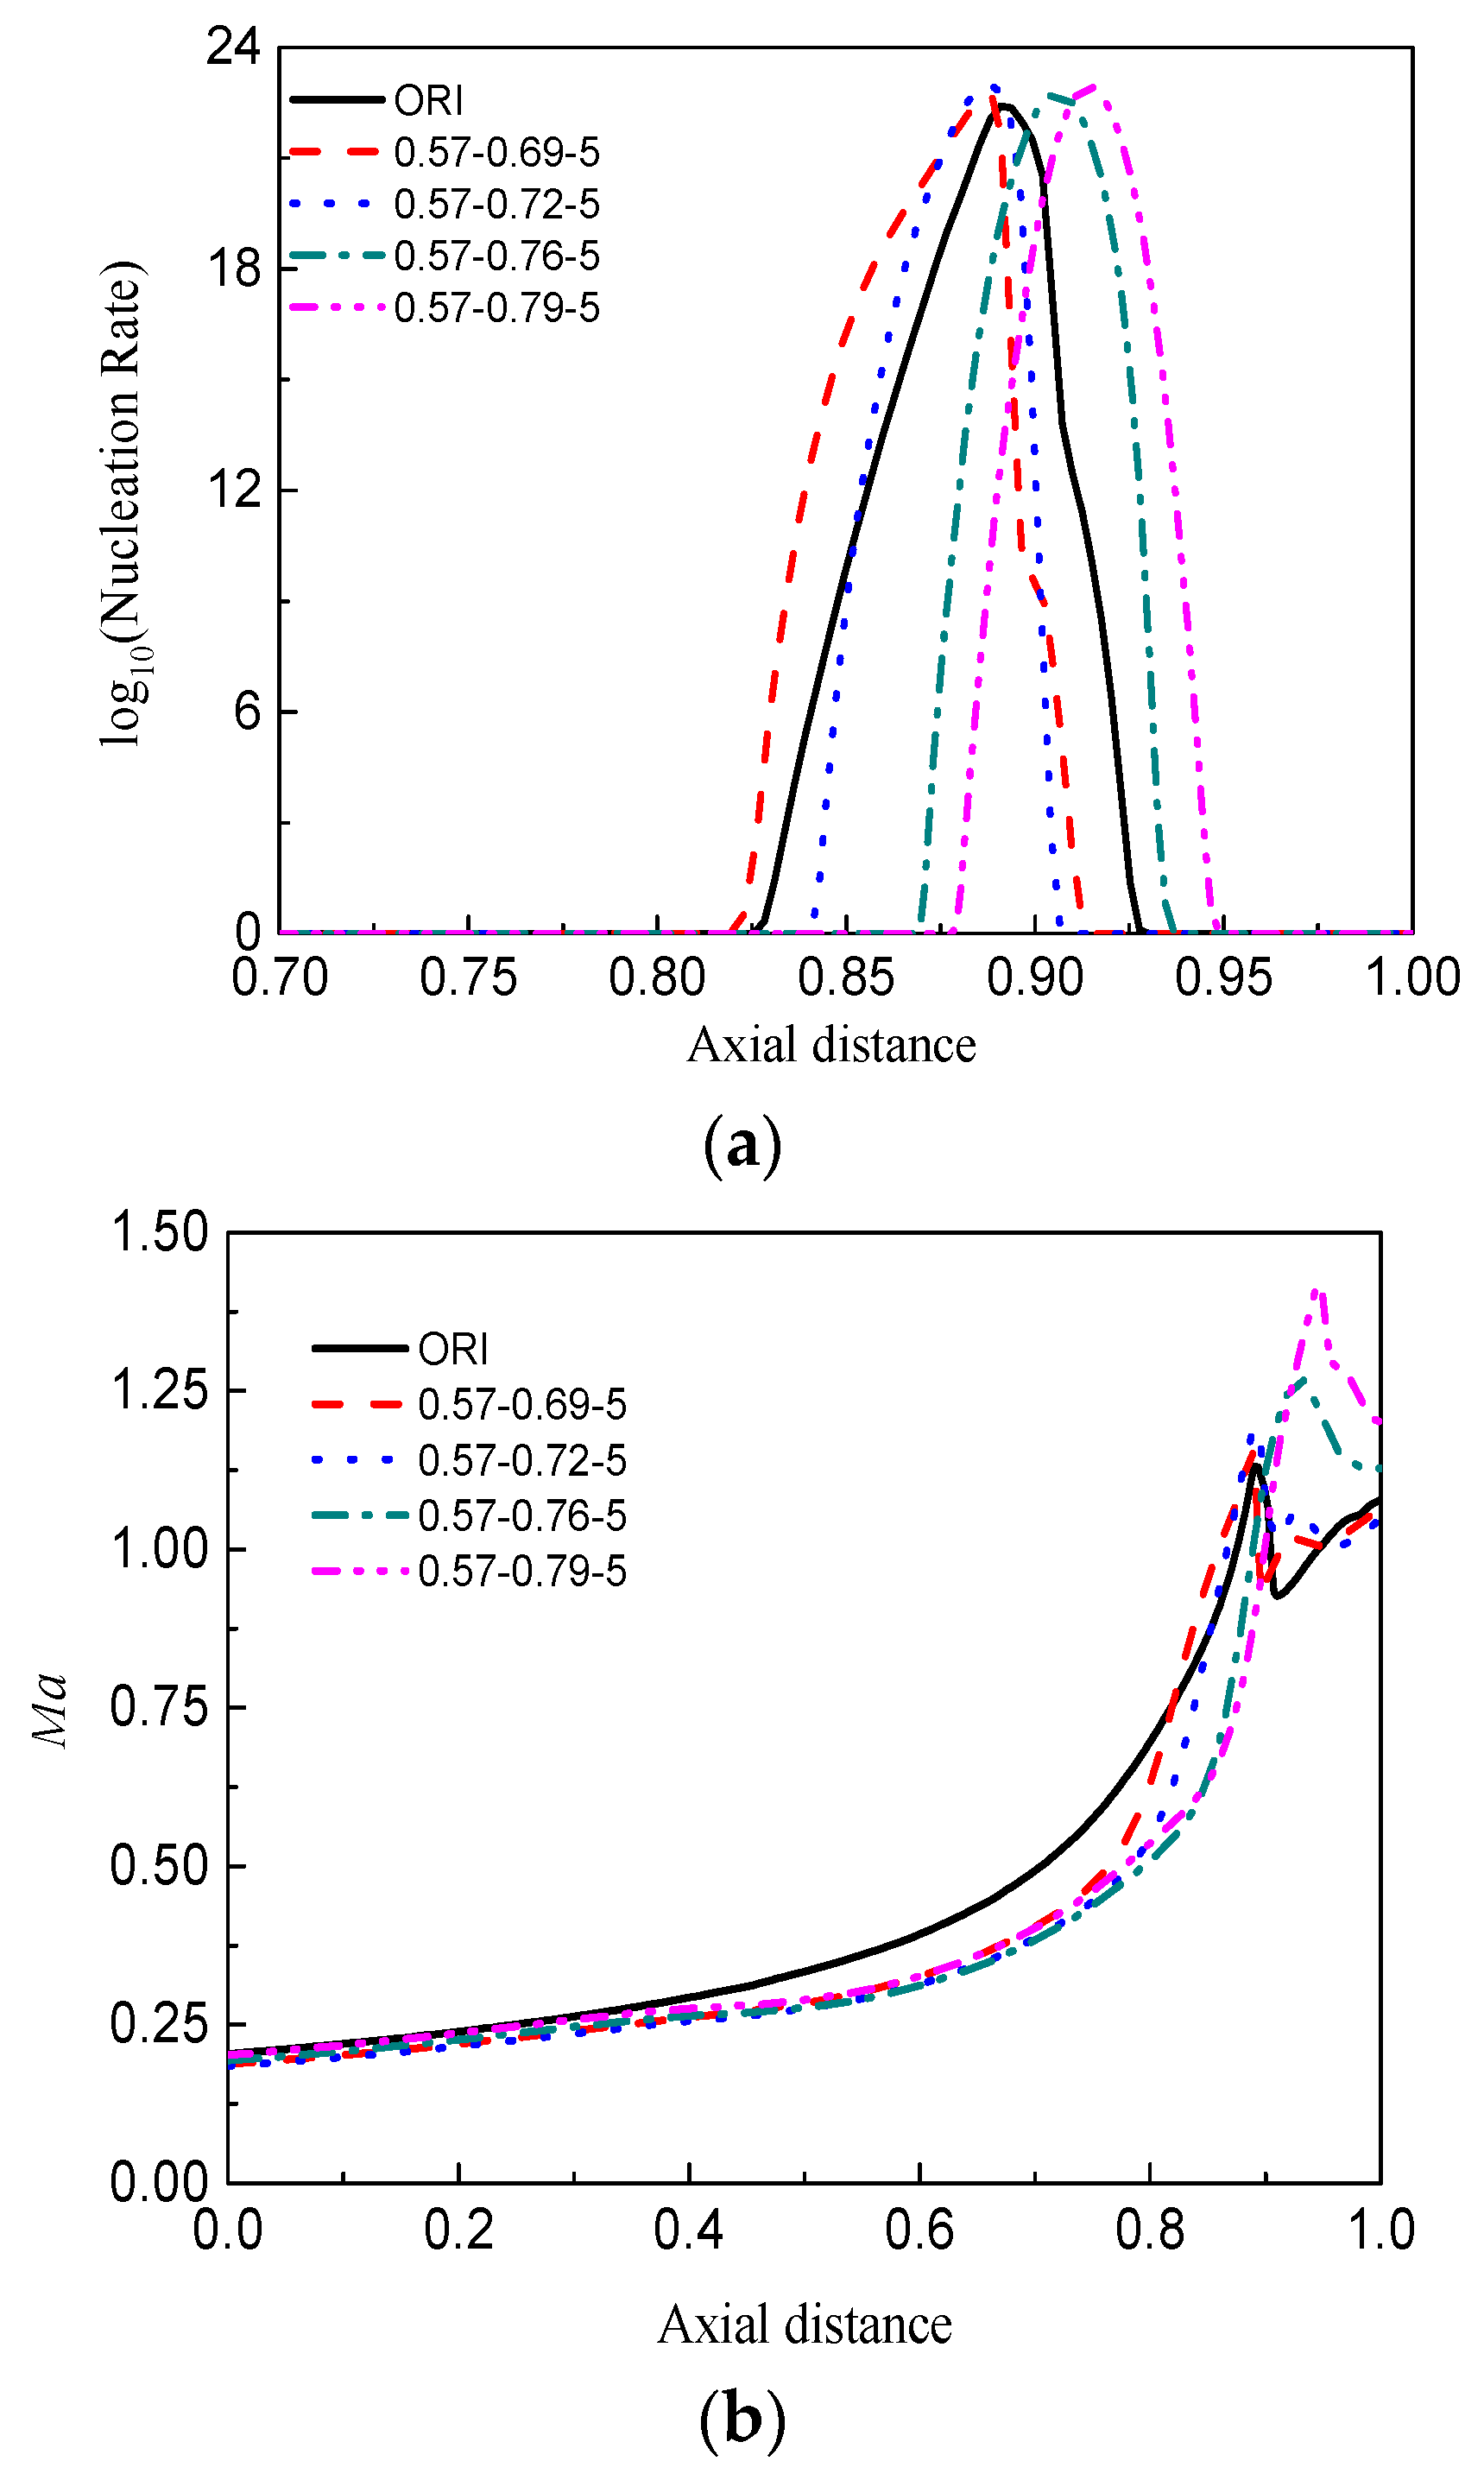
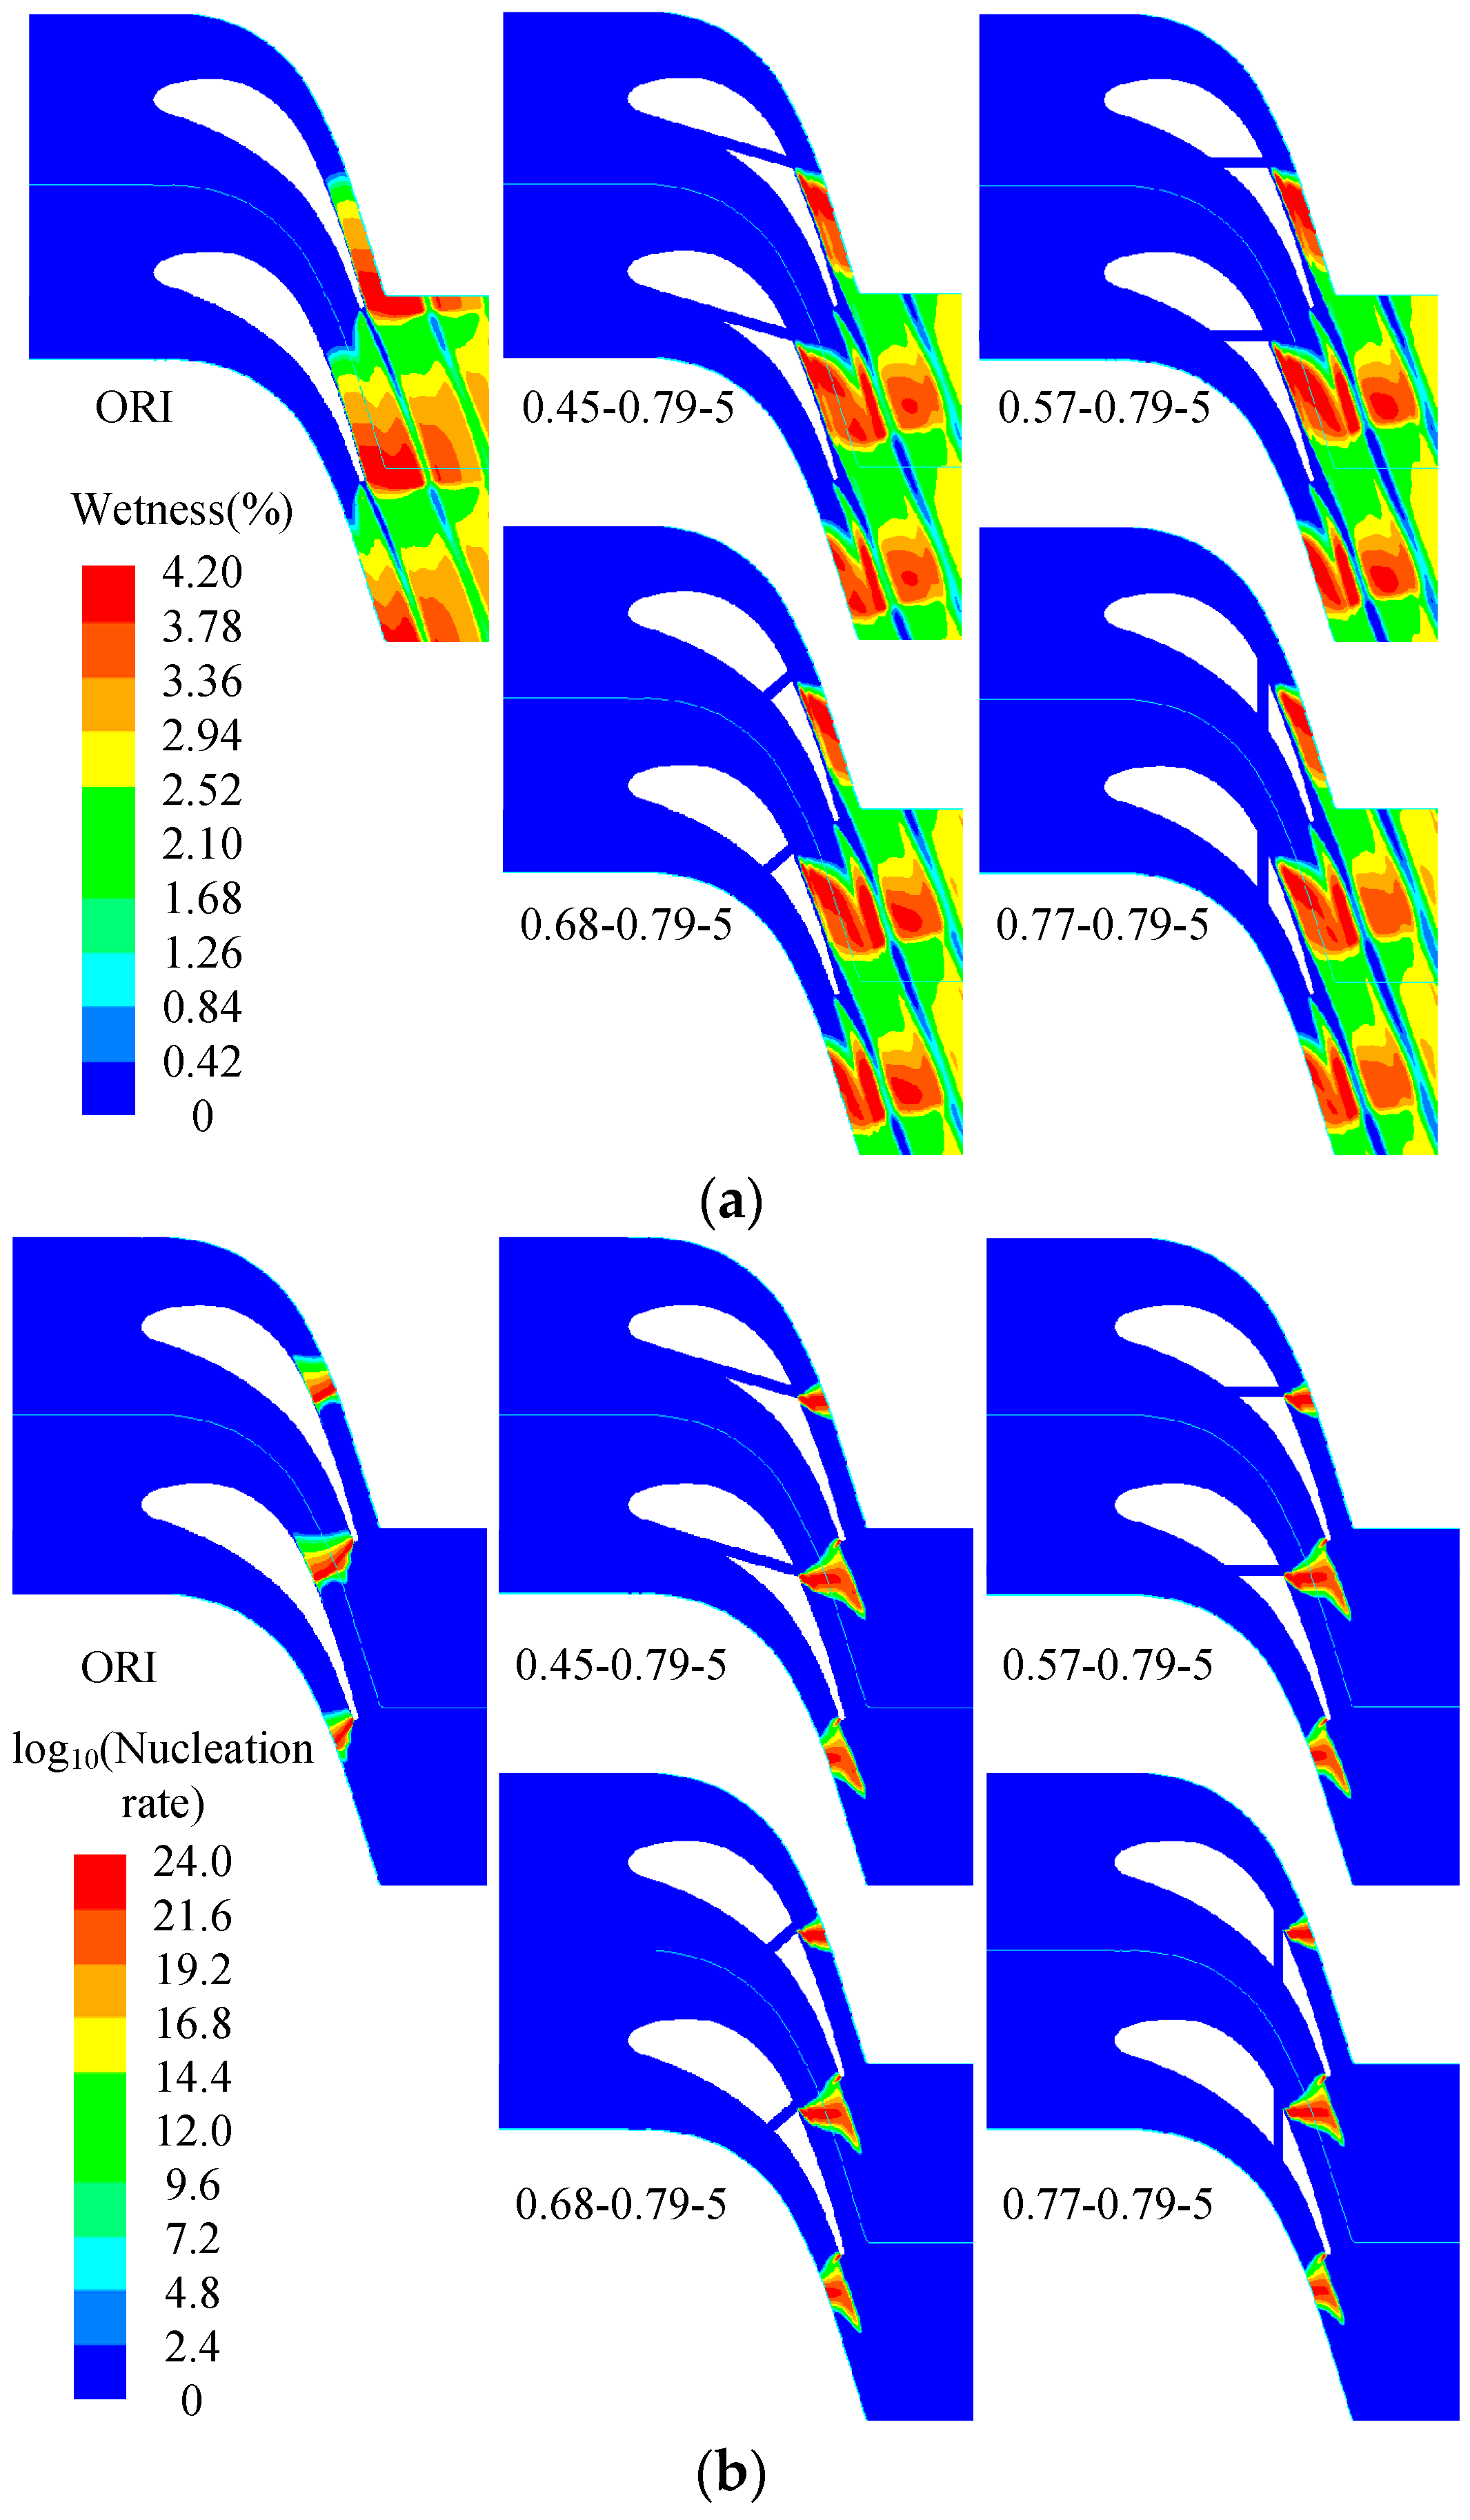
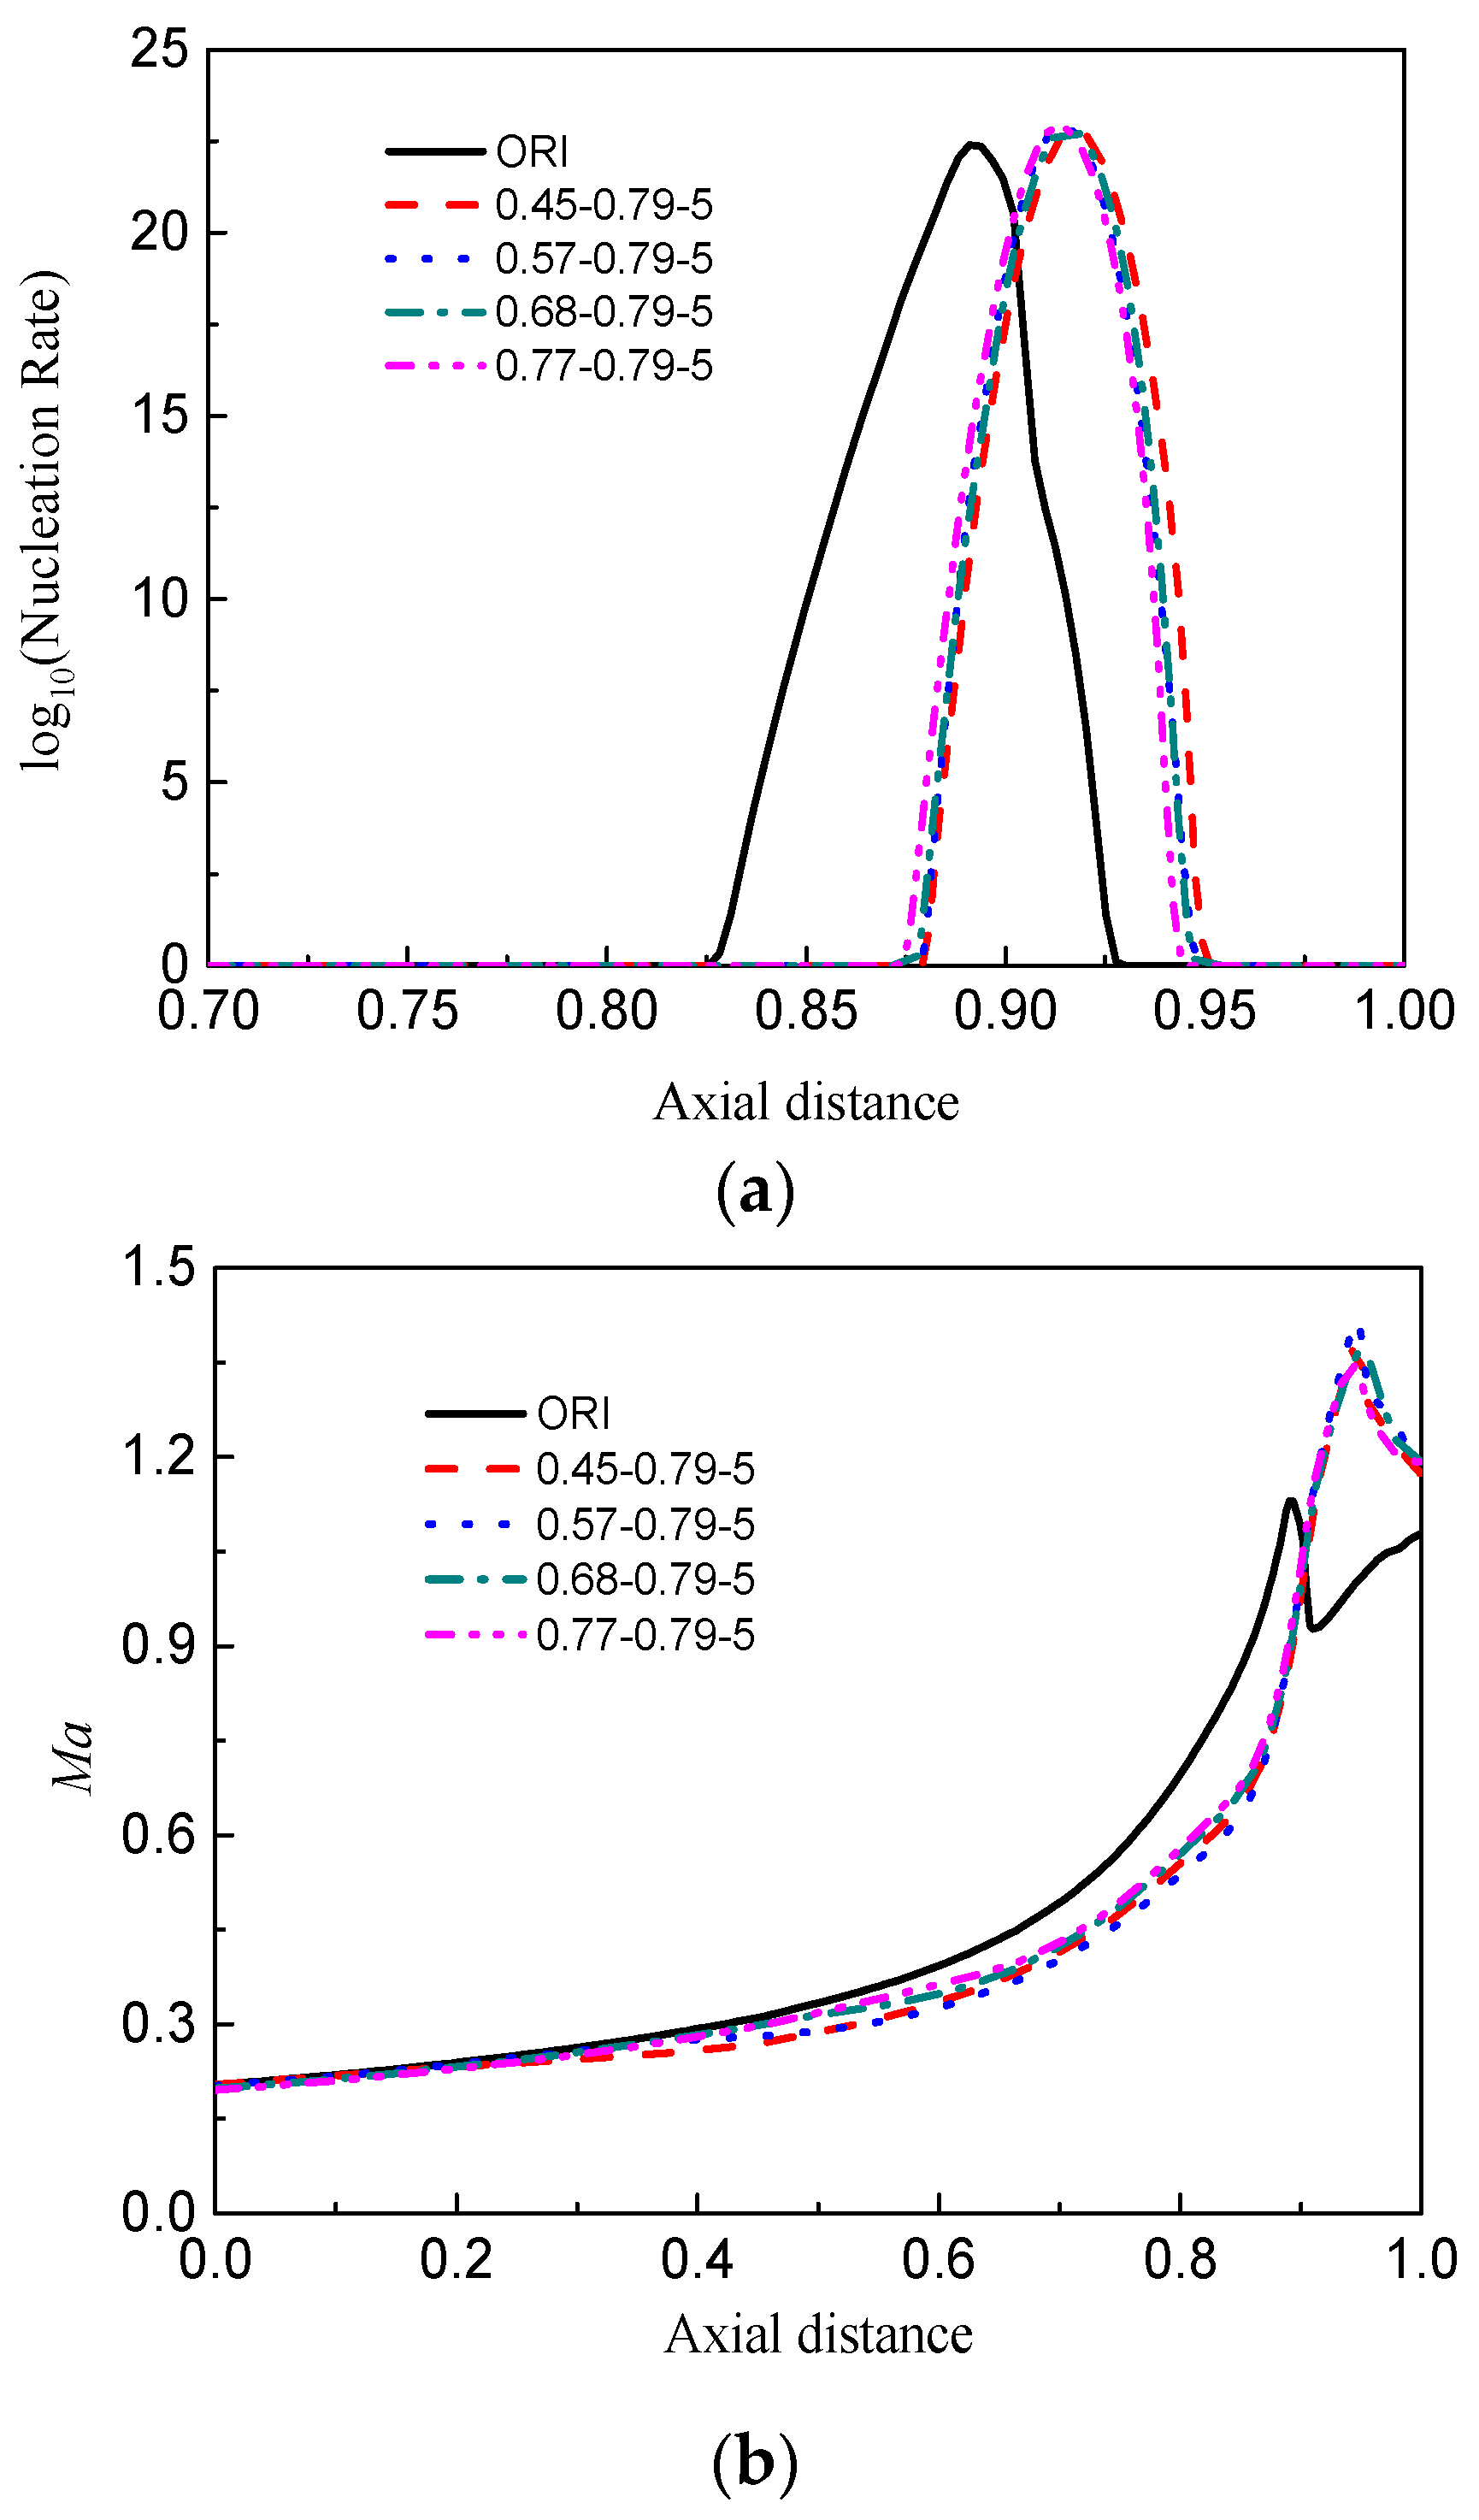
5.1. Effect of the Location of Suction Surface (D point) on Condensation Flow

In light of the control variable method, the axial chord length of the location of pressure surface (C point) was set to 0.57, the width of the parallel channel was fixed at 5 mm, and the remaining boundary conditions with relevant parameter settings were kept constant. Based on the parameters listed in Table 1, when compared to ORI, the outlet average wetness and wetness losses of the modified cascades are reduced, among which the values of the 0.57-0.79-5 case are minimal. In addition, it is interesting to note that the closer the location of the D point to the trailing edge of the cascade, the more obvious the decreasing trend of outlet average wetness and wetness losses is. However, for the total pressure loss coefficient, there is a phenomenon contrary to the above situation. Figure 5 compares the distribution of wetness and nucleation rate in the five cases. As can be seen, with the D point close to the trailing edge, the difference between the distribution characteristics of the modified cases and the ORI case is more prominent. Besides, at the D point, the nucleation rate of steam increases sharply, and the shape of the nucleation zone also changes distinctly. The parallel channel guides a high-temperature steam flow, and its heating effect makes the large wetness region move upstream and lets the nucleation region shift downstream.
Figure 6 depicts the distribution of nucleation rate and Mach number on the center line of the cascade. As illustrated in Figure 6a, the selection of D point location hardly affects the nucleation peak value, but has a significant effect on the onset of nucleation. The primary steam flow is heated by the high-temperature steam derived from the parallel channel, which increases the steam temperature near the D point and inhibits nucleation of the steam. It is worth noting that increasing the axial chord length of the D point will delay the steam nucleation process, restricting the growth of water droplets.
When it comes to the distribution of Mach number in Figure 6b, partitioning is needed. In the 0 to 0.3 interval, the Mach number curves of the five cases almost coincide and the parallel channels have little influence. In the 0.3 to 0.7 interval, the steam Mach number lines of the four modified cases basically coincide, but their slopes are less than that of ORI, which is mainly due to the parallel channel increasing the local temperature. That is to say, the increase of temperature leads to a rise in the local sound velocity, and the Mach number decreases when the velocity of flow changes little. In the 0.7 to 1.0 interval, because of the influence of cascade back pressure, the steam expansion and diffusion of the modified cascade are aggravated, and the slopes of Mach number line of the modified cases are larger than that of ORI before the occurrence of the condensation peak.

5.2. Effect of the Location of Pressure Surface (C Point) on Condensation Flow

According to the previous analysis, the axial chord length of the location of the suction surface (D point) was set to 0.79 and the width of the parallel channel was fixed at 5 mm. The comparison of outlet mean wetness, wetness losses, and total pressure loss coefficient between the four C point setting cases and the ORI case are gathered in Table 2. Compared with ORI, the four modified cases can effectively control the average wetness of the cascade outlet while the total pressure loss increases to a certain extent. The outlet average wetness, wetness losses, and total pressure loss of the four modified cases are not very different, and the distribution characteristics of wetness and nucleation rate are extremely similar, as shown in Figure 7.
The distribution of nucleation rate and Mach number on the center line of the cascade is shown in Figure 8. It can be seen that the steam nucleation process of the modified cases is obviously postponed. Moreover, the Mach number of the four modified cases at the outlet is greater than that of ORI, which indicates that the parallel channel can improve the aerodynamic performance of the cascade to some degree. The nucleation rate and Mach number distribution of the four modified cases are in good agreement, and the reason for the deviation from ORI is as described in the previous section. Generally speaking, the four locations of C point selected in this section have little effect on the distribution of steam parameters.

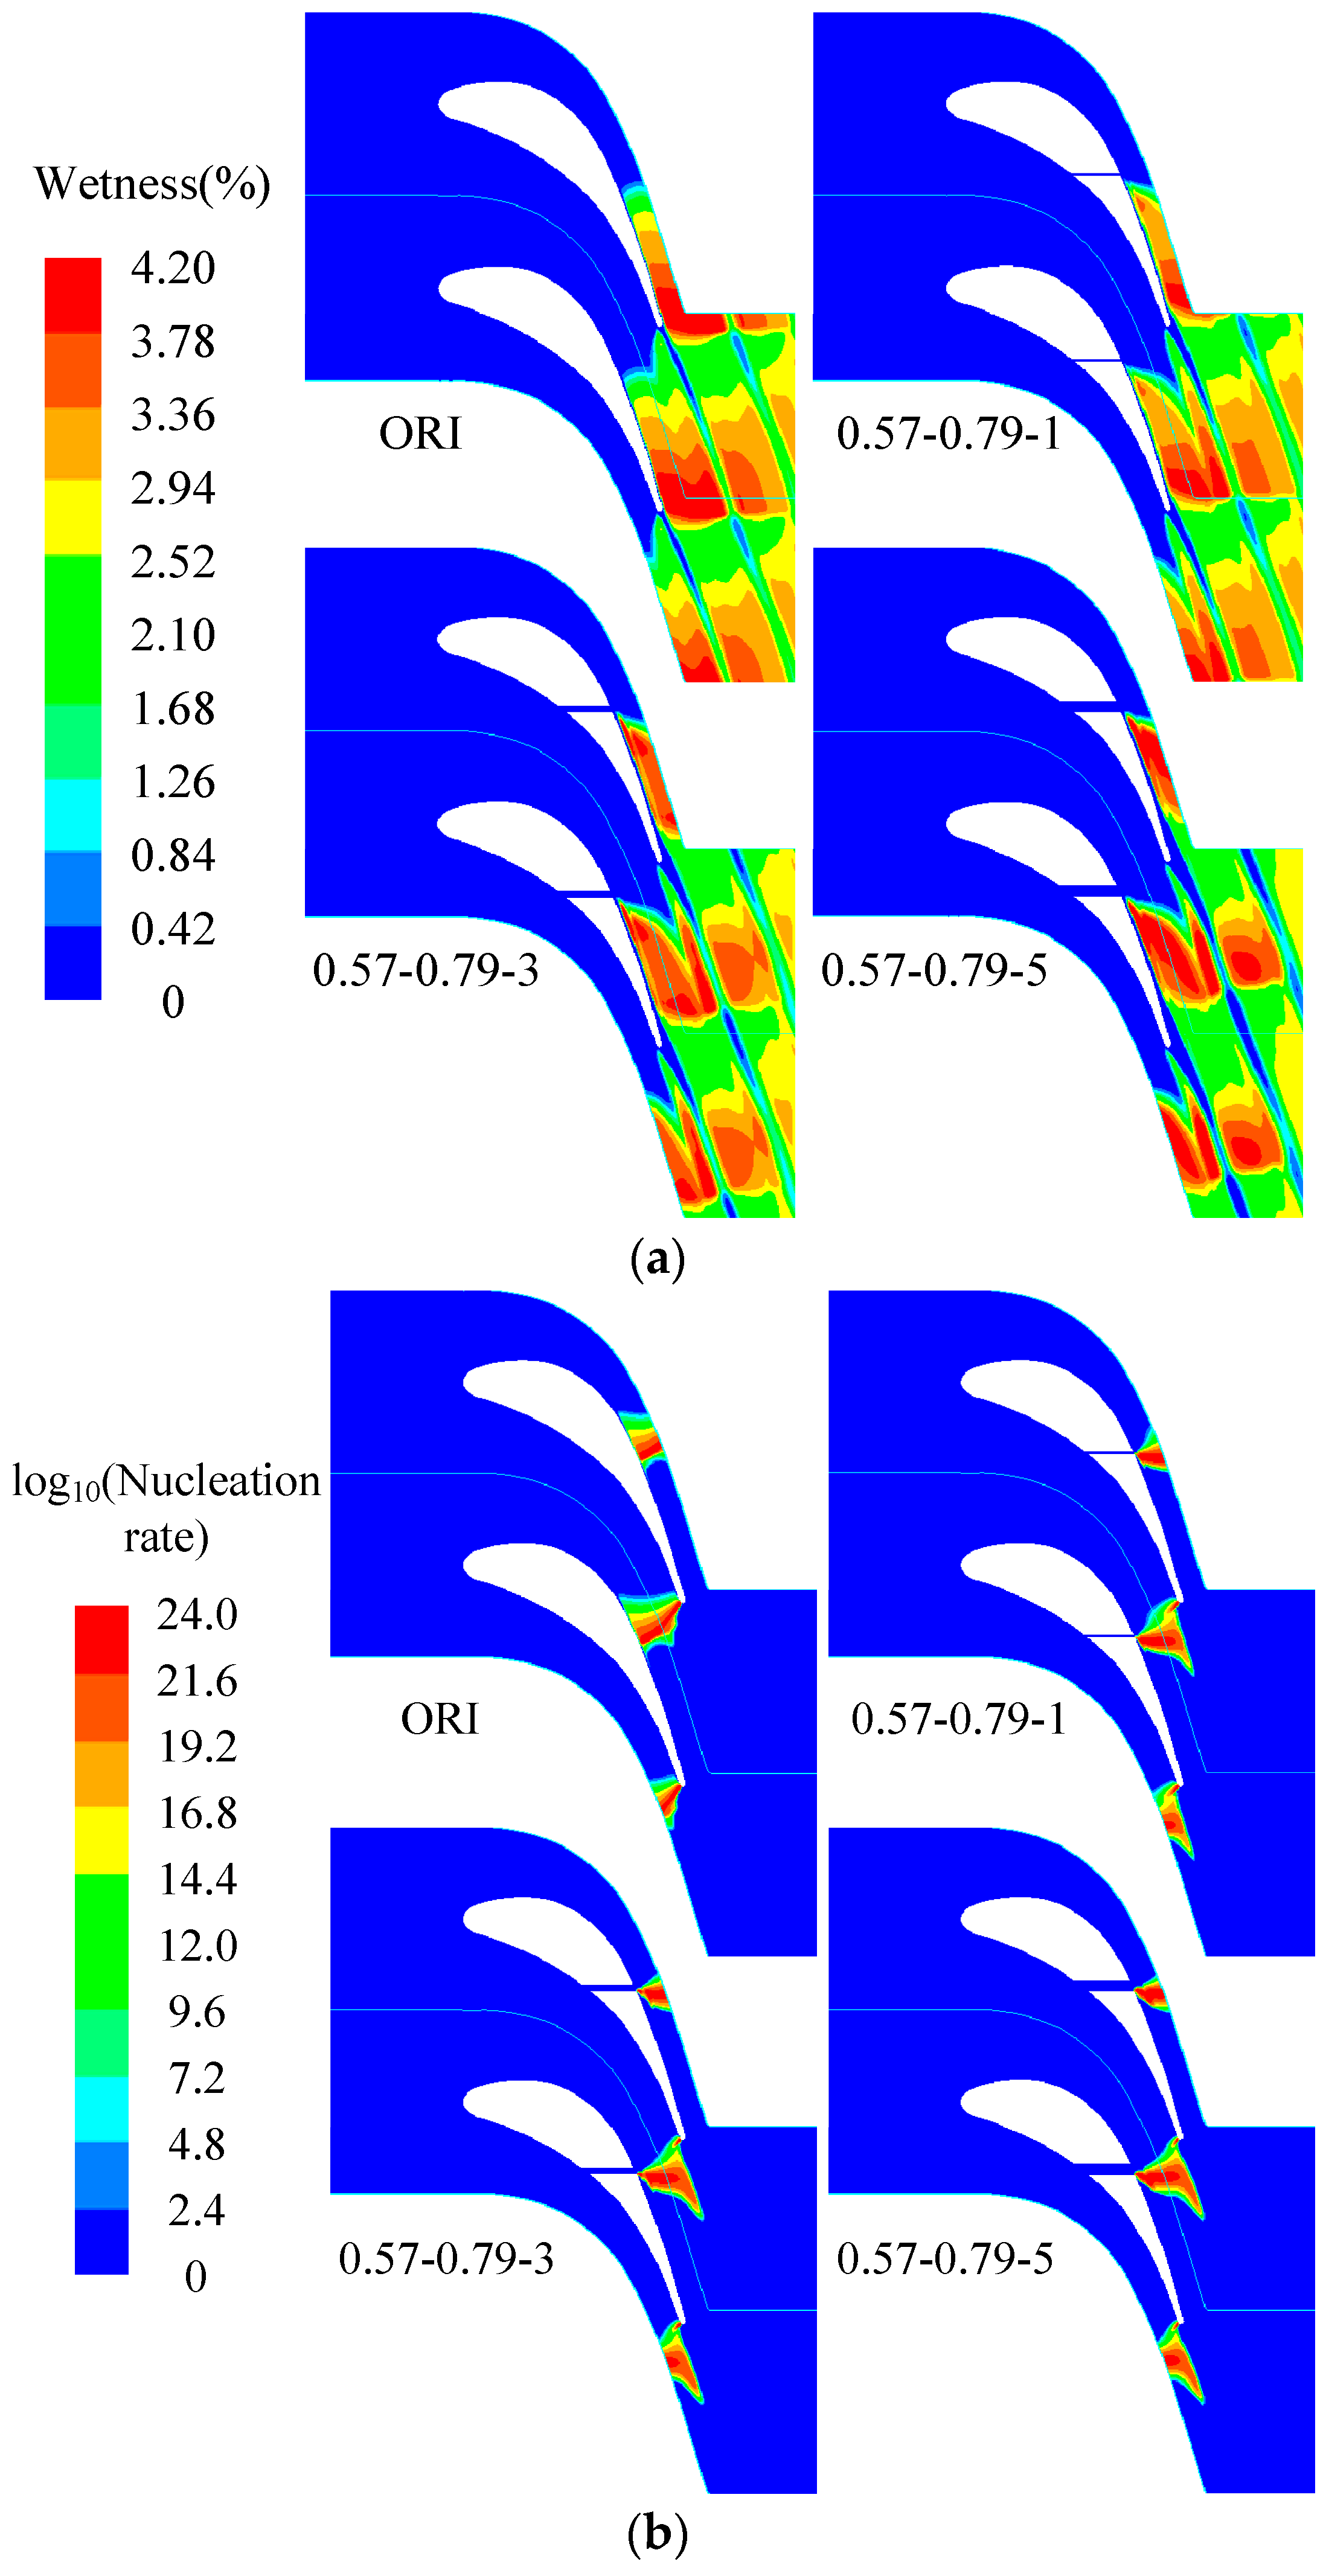
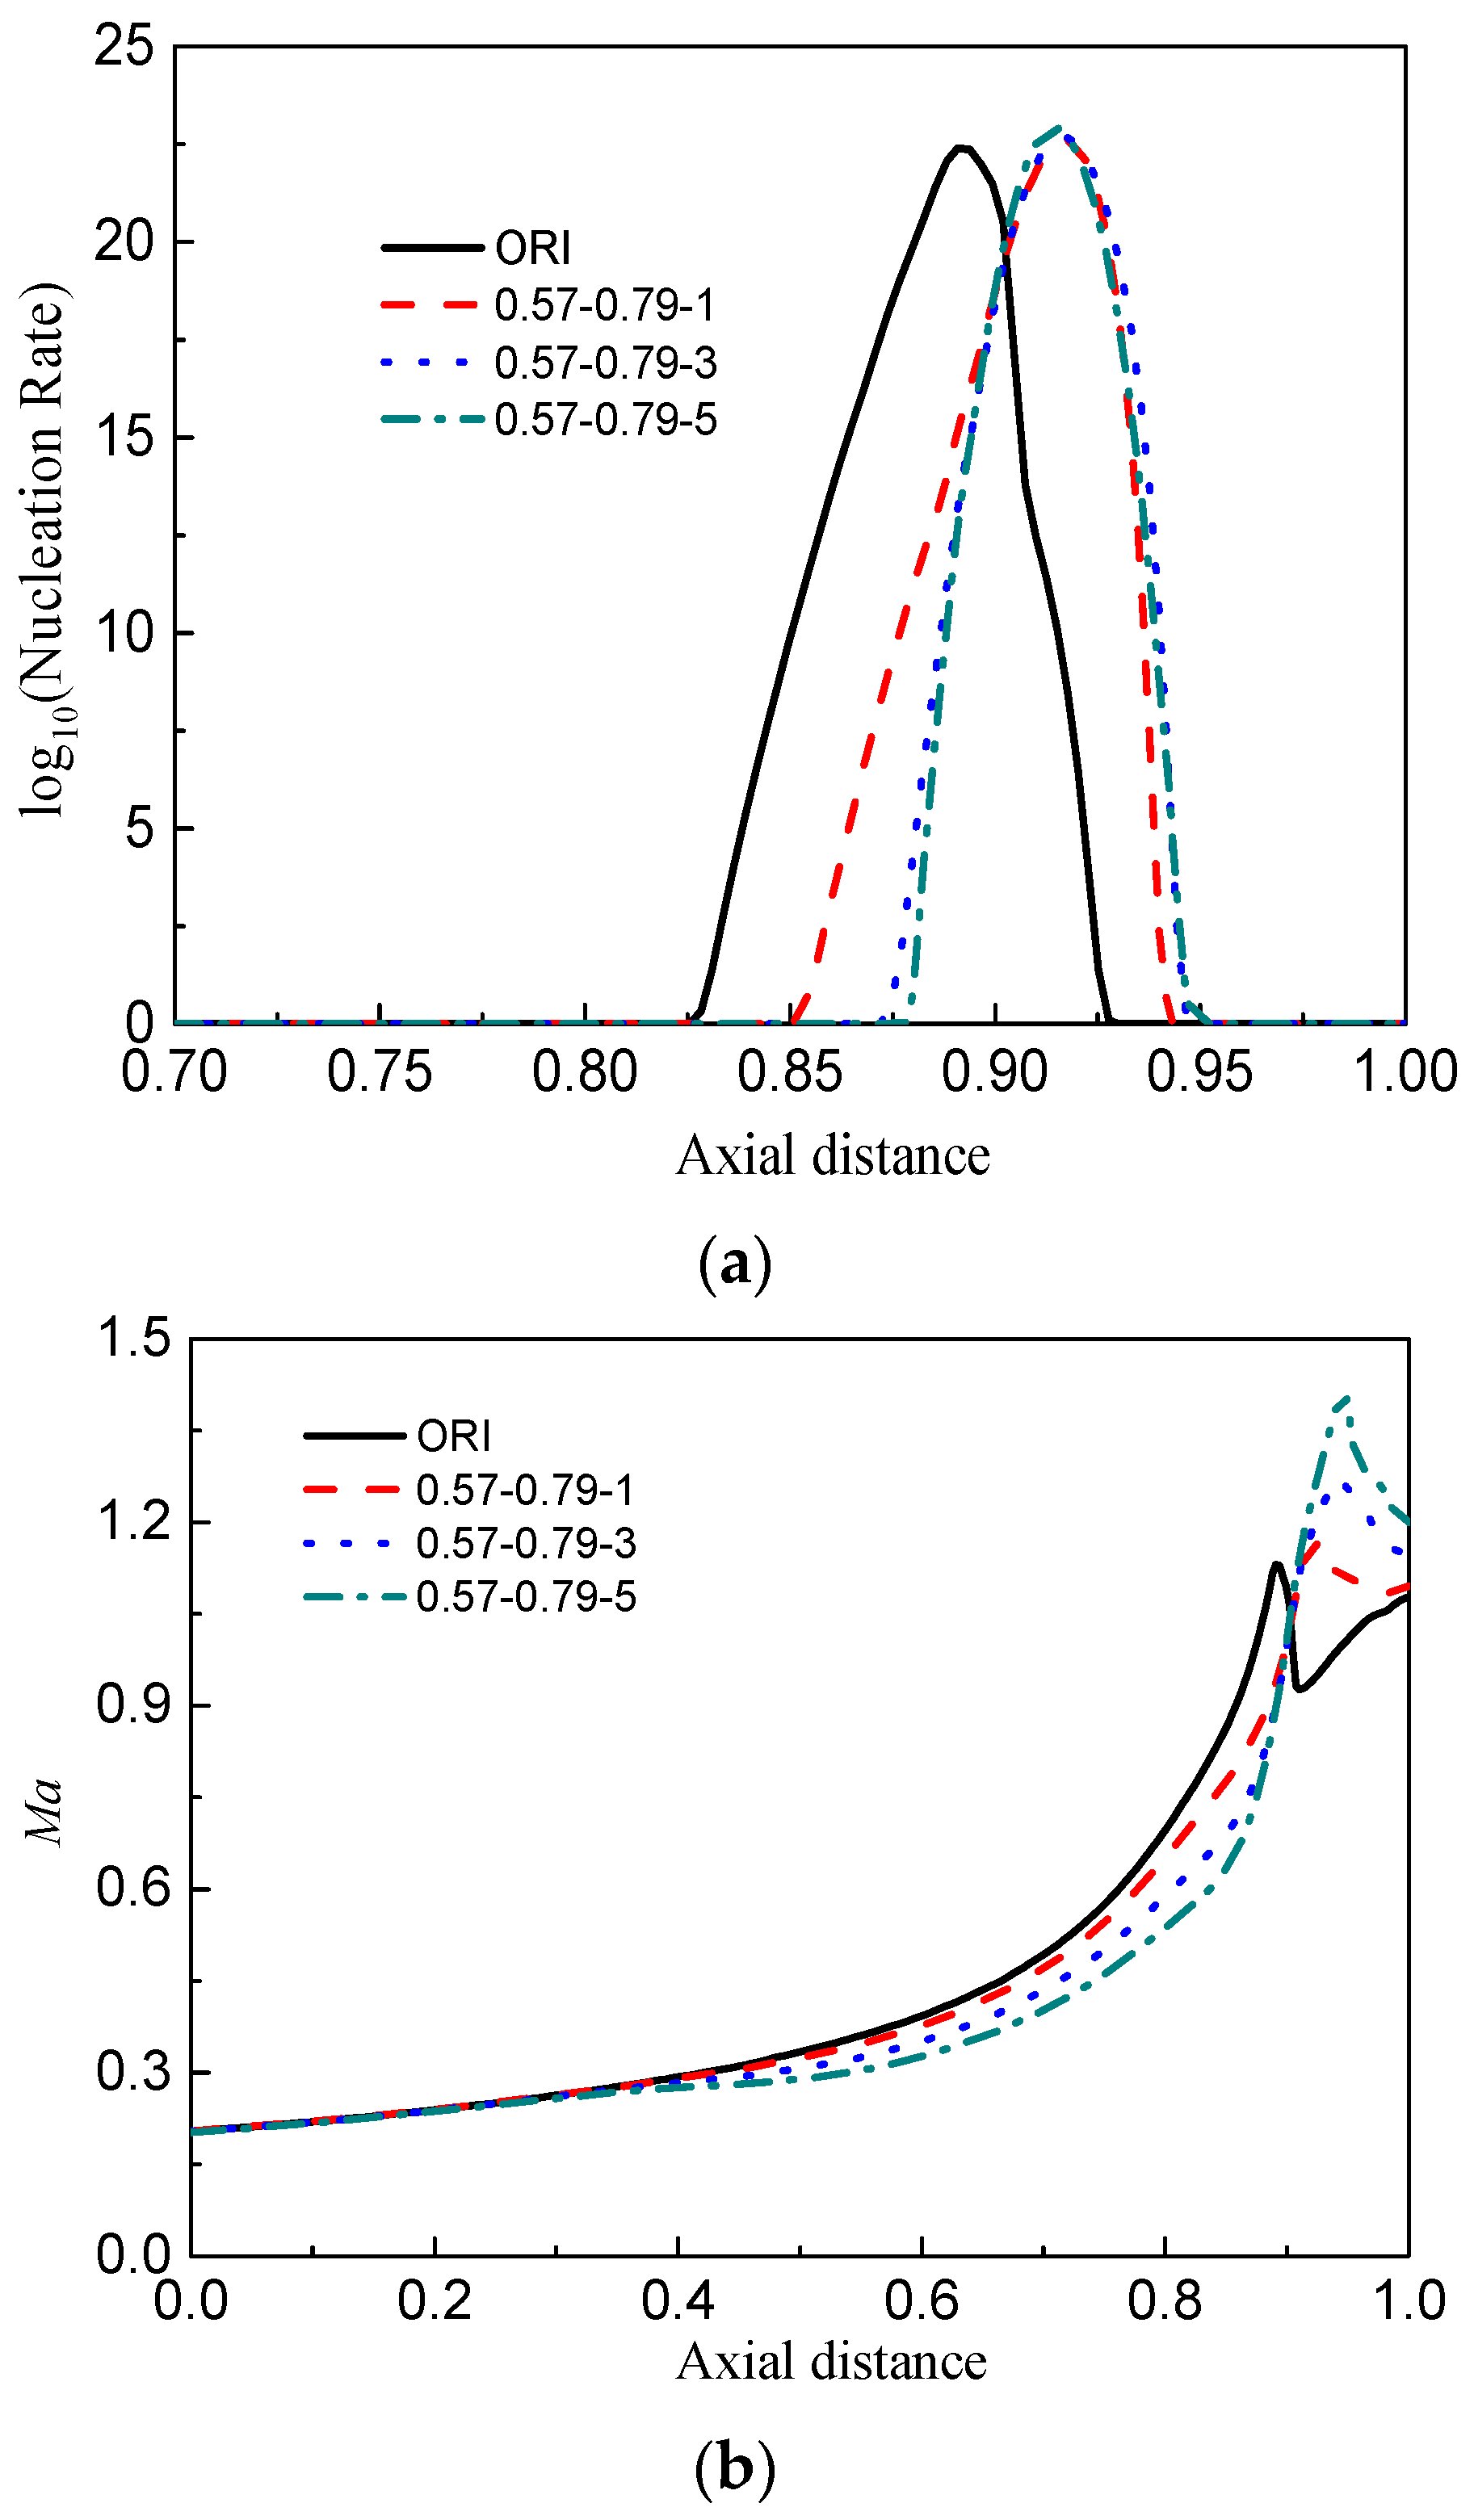
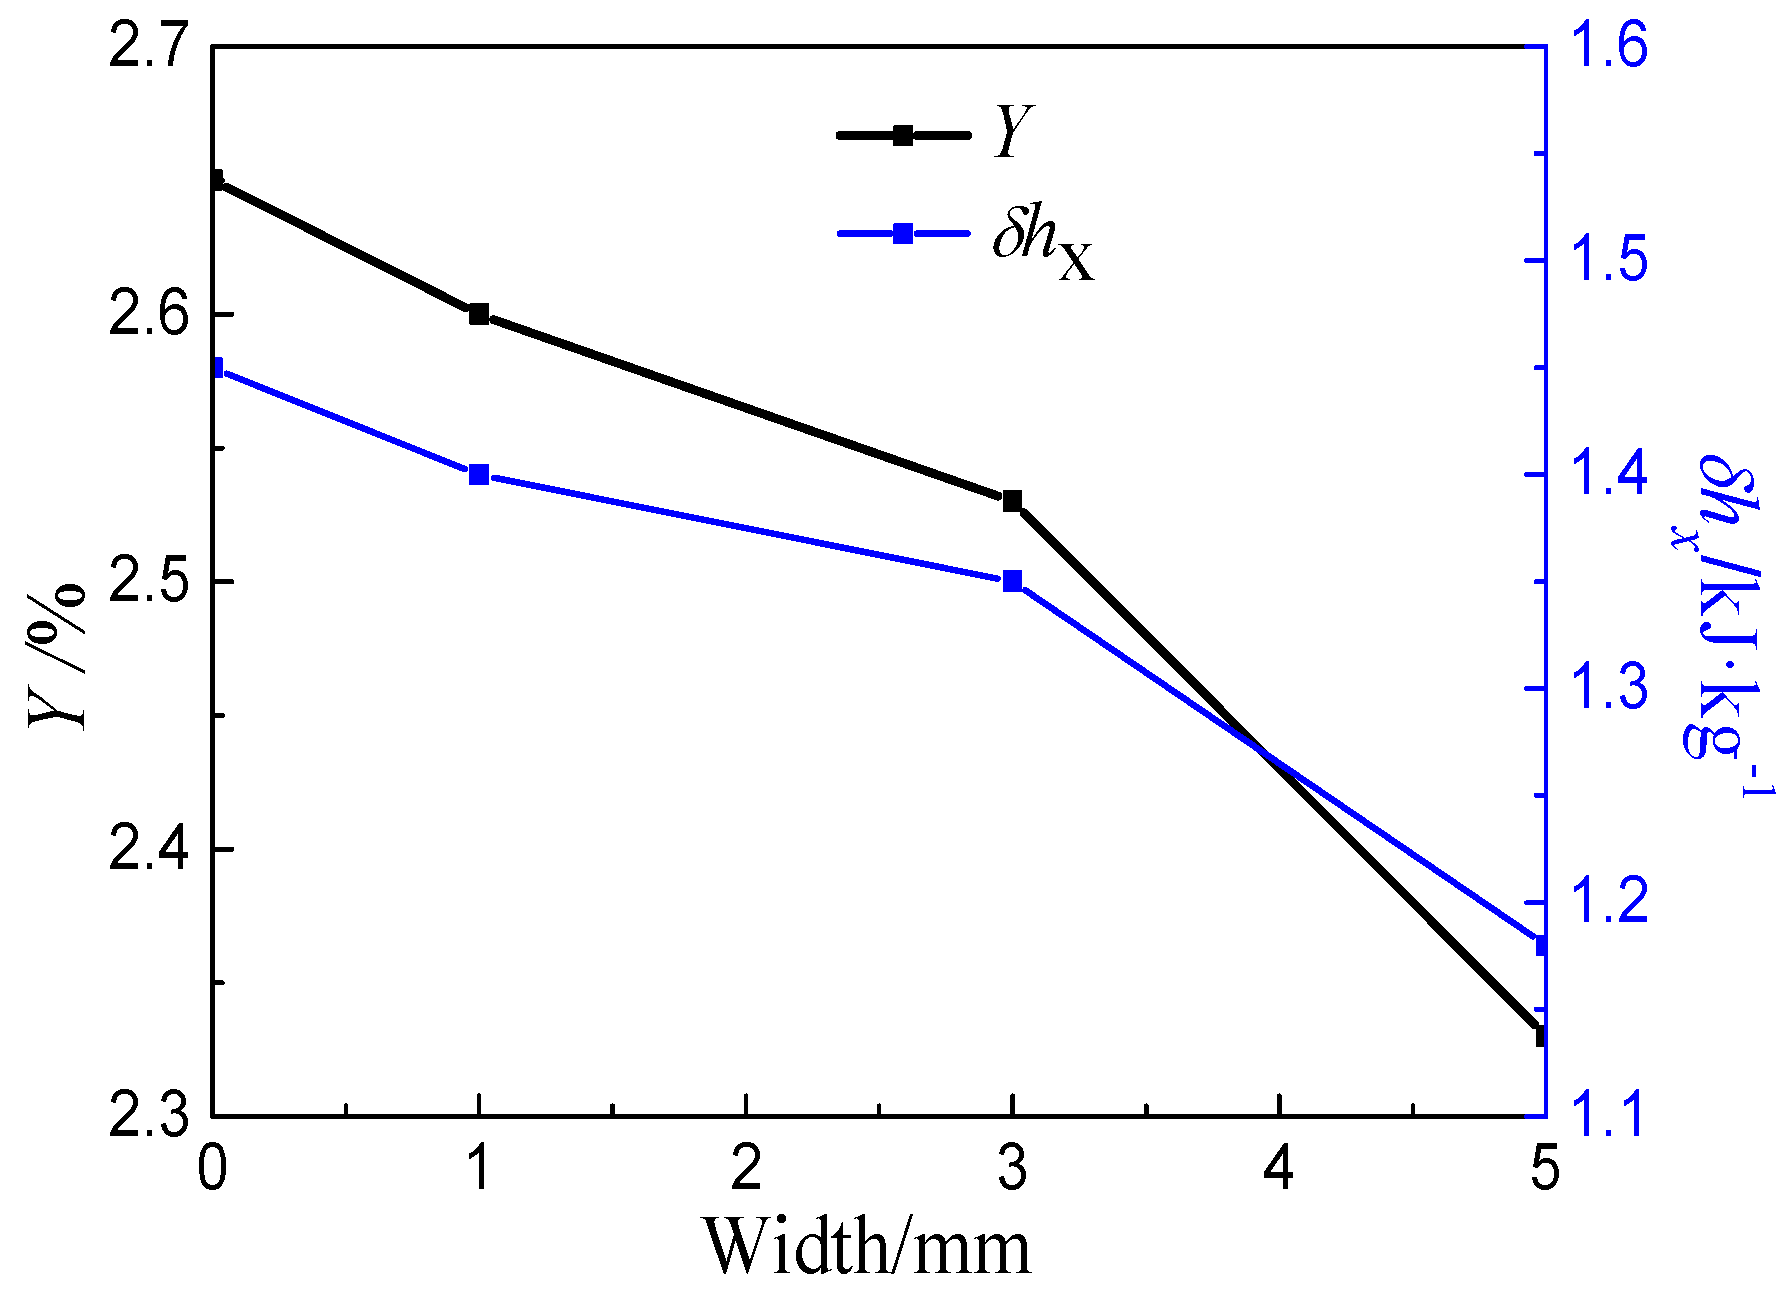
5.3. Effect of Parallel Channel Width on Condensate Flow

In view of the better dehumidification characteristics of the 0.57-0.79-5 case, an analysis of parallel channel width was carried out based on this case. The relevant parameters of the parallel channel widths of 1 mm, 3 mm, and 5 mm are listed in Table 3. It is found that increasing the parallel channel width can reduce the average wetness and wetness losses of the outlet with an increase in the total pressure loss. From the wetness distribution of Figure 9a, compared with ORI, the distinction in the wetness distribution characteristics of the modified cases is greater with the increase of parallel channel width, and the large wetness region moves upstream with a decrease in overall wetness of the cascade. When observing the Figure 9b, it is found that there are only slight differences in the distribution of nucleation rate between the three modified cases.
As shown in Figure 10a, the peak values of nucleation in the three modified cases are almost the same, and the nucleation process is obviously delayed compared with ORI. As the parallel channel width decreases, the onset of nucleation moves upstream, because the width determines the magnitude of the guiding flow.
According to Figure 10b, it is interesting to note that the wider the parallel channel, the more steeply the slope of the Mach number curve varies in the 0.8 to 0.95 interval (nucleation zone). The variation of the slope of the Mach number reflects the intensity of the condensation shock. Therefore, when selecting the parallel channel width, the comprehensive performance of the cascade should be taken into account.
The average wetness and wetness losses of the cascade outlet with different parallel channel widths are compared in Figure 11. When the parallel channel width is less than 3 mm, the change in amplitude of wetness and wetness losses is relatively small, and when the width is more than 3 mm, the variation is larger. The main cause of this phenomenon is the viscous resistance between the steam and the inner wall of the parallel channel. When the parallel channel width is small, the viscous resistance has a great influence on the steam flow in the parallel channel, and with increased width, the influence is reduced accordingly. In general, the parallel channel can significantly reduce the average wetness of the cascade outlet and improve the efficiency of the turbine stage. After considering the cascade performance, it is suggested that the parallel channel width is between 3 and 5 mm.

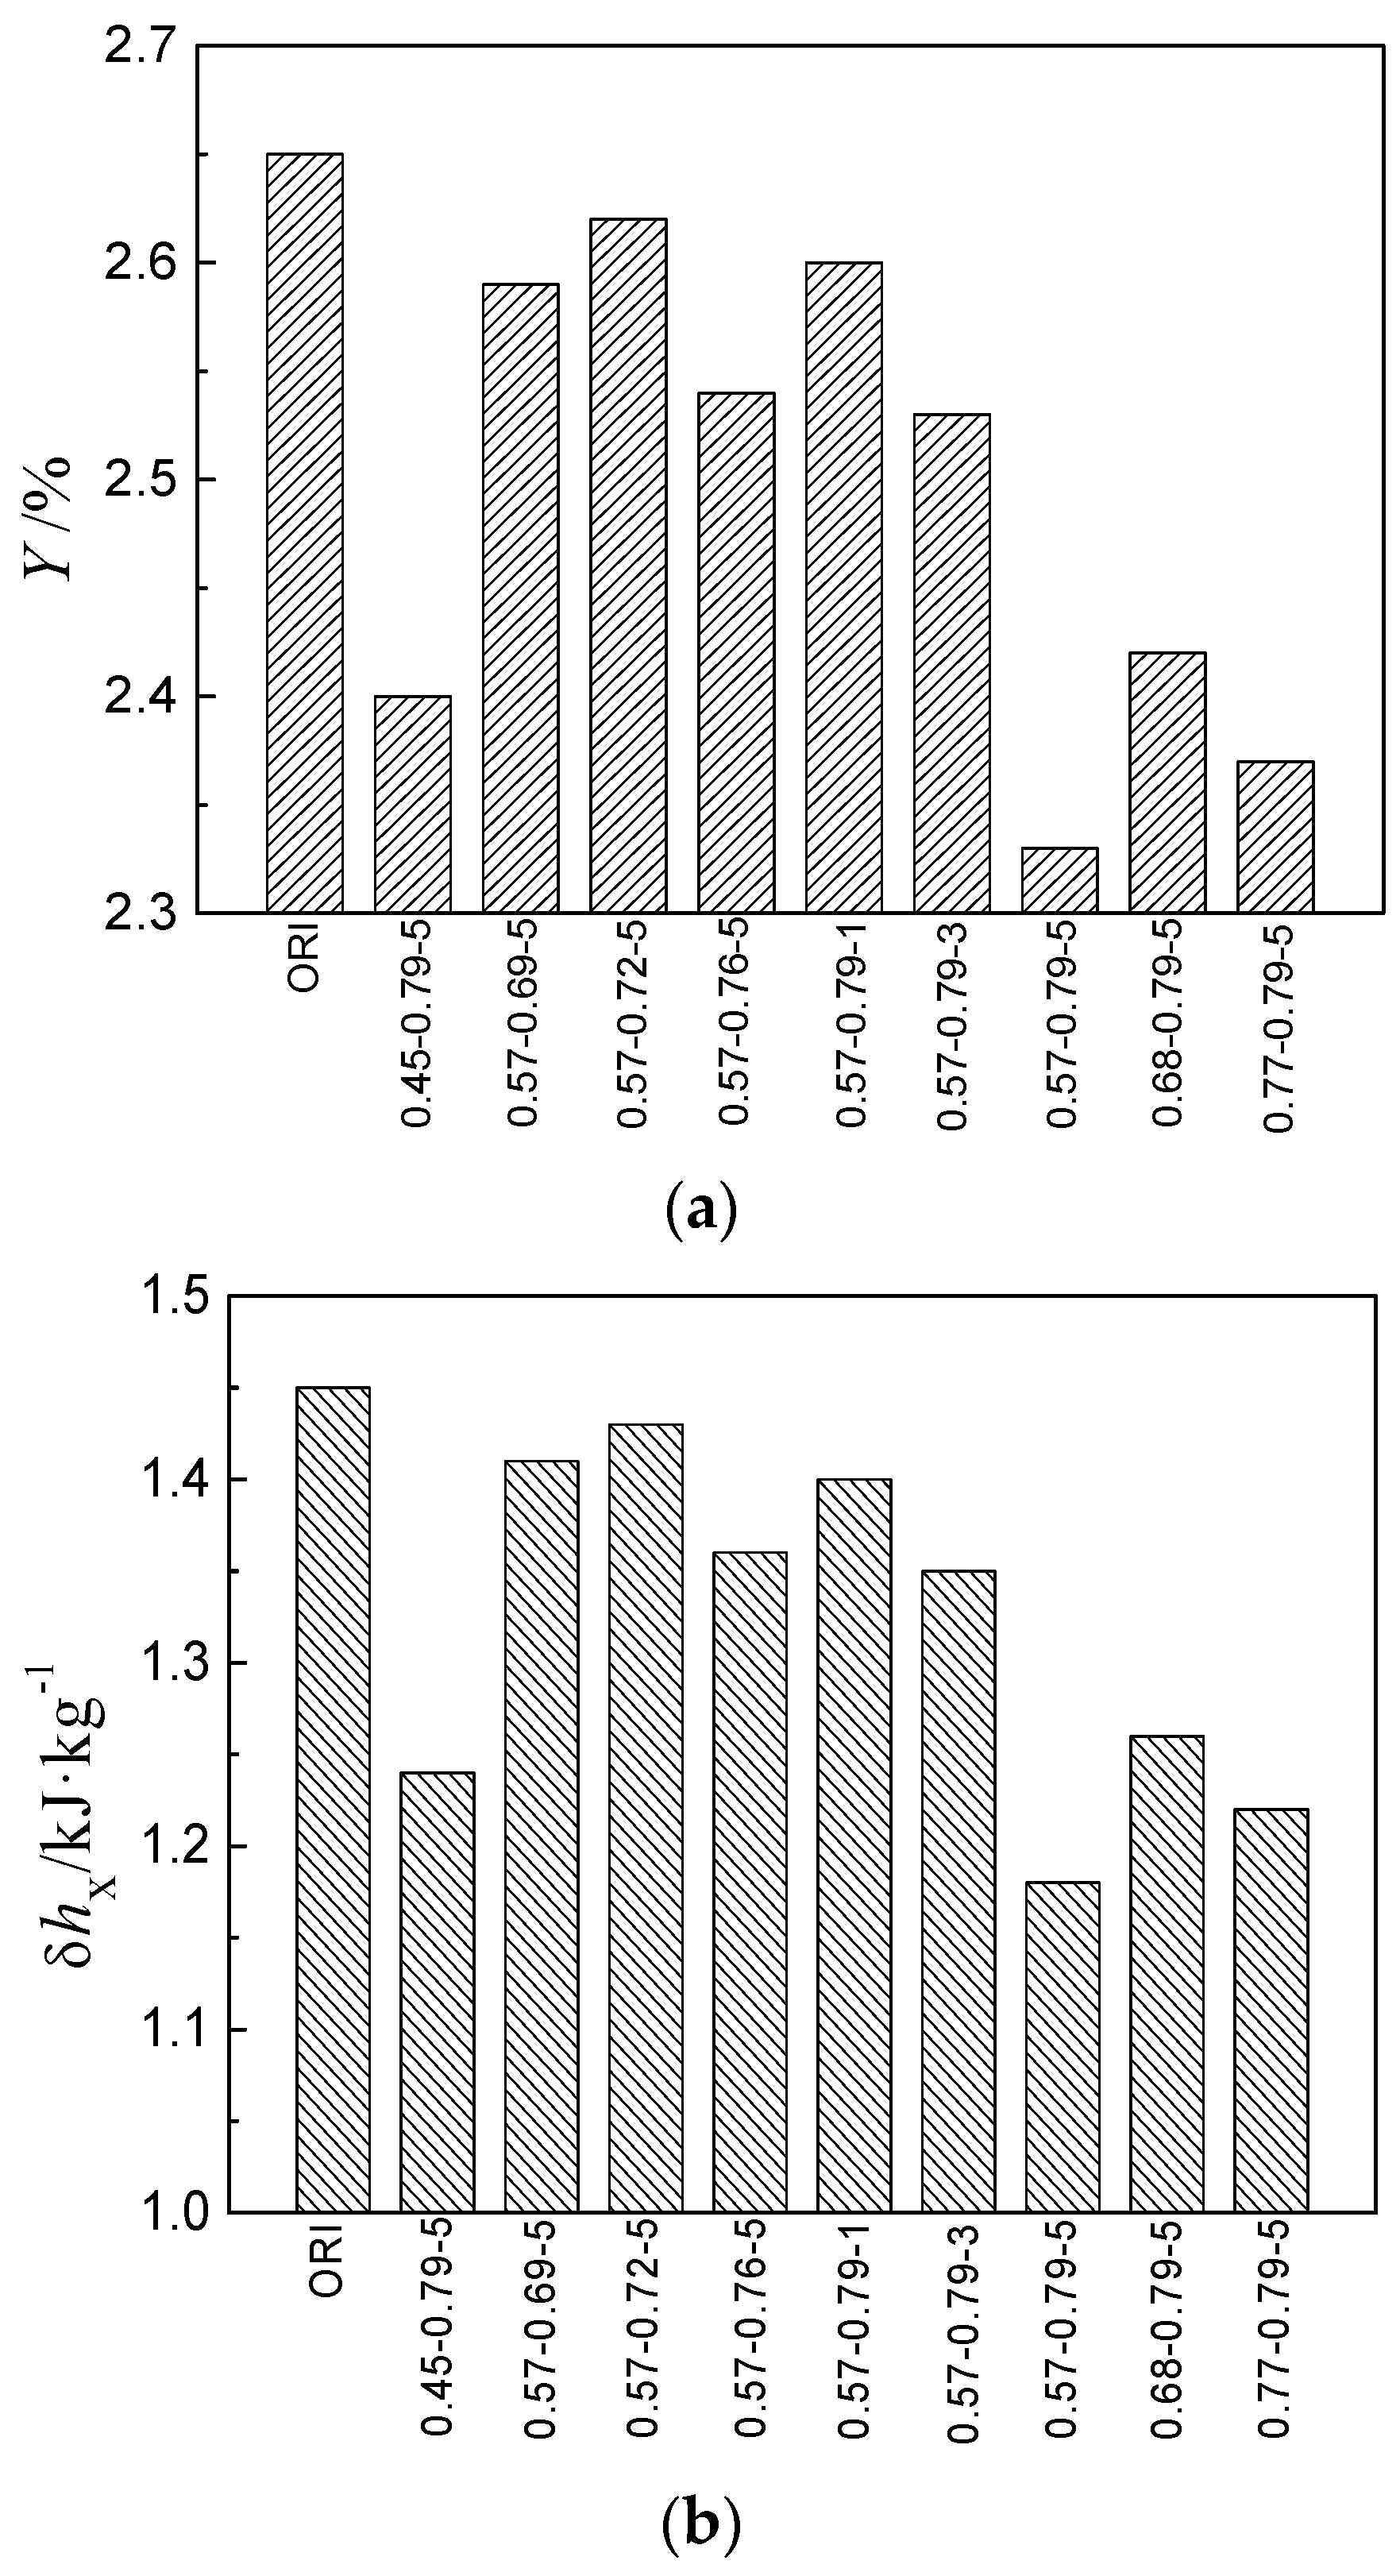
5.4. Performance Comparison of Modified Cases

The average wetness and wetness losses of the cascade outlet in all cases are shown in Figure 12. It is obvious that the modified cases are superior to the ORI case in terms of average wetness and wetness loss, which indicates that the parallel channel can effectively control steam wetness and improve efficiency. Among the nine modified cases, the 0.57-0.79-5 case’s outlet average wetness and wetness losses are the smallest. After comprehensive consideration, the 0.57-0.79-5 case is regarded as the best of those detailed in this paper, and the results can provide a reference for the optimal design of turbine stator cascades.

6. Conclusions

The study of wet steam two-phase condensation flow is of great significance to improve the efficiency of steam turbines. This paper presents a new dehumidification method to improve turbine efficiency. The main conclusions are as follows:
(1)
The location of the suction surface (D point) can significantly affect the distribution of steam nucleation rate and Mach number. The closer the D point is to the trailing edge of the cascade, the more prominently the steam nucleation is delayed, the smaller the average wetness at the cascade outlet is, and the better the dehumidification performance of the cascade is.
(2)
The location of the pressure surface (C point) has little effect on the distribution of steam nucleation rate and Mach number. The location of C point causes no significant difference in the average wetness of cascade outlet, indicating that it has little effect on cascade dehumidification performance.
(3)
It is necessary to choose suitable widths for parallel channels. A small parallel channel width corresponds to weak condensation shock intensity and poor dehumidification characteristics, while a large parallel channel width is associated with strong condensation shock intensity and better dehumidification characteristics. Considering the comprehensive performance of the cascade, it is suggested that the parallel channel width should be between 3 and 5 mm.
The future work will focus on the three-dimensional numerical simulation of parallel channels, with emphasis on the determination of the height of parallel channels. According to the actual standard, the more advantageous parallel design will be determined. The research will concentrate on how to avoid the unfavorable effects of parallel channels on steam flow. In addition, it is necessary to carry out the practical experiments associated with parallel channels. Obtained experimental data will be helpful in the future work on the model validation.

Author Contributions

All authors contributed to this work. Z.H. is main author of this work. W.Z. guided the analysis and the writing of the paper. X.H. assisted with the modeling. P.X. provided suggestions with respect to article modification.

Funding

This research was funded by the Science and Technology Planning Project of Guangdong Province, China (grant no. 2015B010101002), the National Science and Technology Support Program of China (grant no. 2014BAA06B01), and the Fundamental Research Funds for the Central Universities of China (grant no. 2016XS106).

Acknowledgments

The authors are thankful for the support provided by the Science and Technology Planning Project of Guangdong Province, China (grant no. 2015B010101002), the National Science and Technology Support Program of China (grant no. 2014BAA06B01), and the Fundamental Research Funds for the Central Universities of China (grant no. 2016XS106).

Conflicts of Interest

The authors declare that there are no conflicts of interest regarding the publication of this paper.

Nomenclature

δhxwetness loss
xmmean dry degree
Δhieffective enthalpy drop (kJ·kg–1)
eenergy density, (kJ·kg–1·m–3)
FDviscous resistance (N)
httotal enthalpy (kJ·kg–1)
hfgcondensation latent heat (kJ·kg–1)
Jnucleation rate (m3·s)–1
kBoltzmann constant
KnKnudsen number
msingle molecular mass (kg)
m ˙ mass generation rate (kg·s–1)
MaMach number
Namount of droplets (m–3)
ppressure (Pa)
PrgPrandtl number
qccondensation coefficient
rdroplet radius (m)
rccritical droplet radius (m)
Rgas constant (J·(kg·K)–1)
Ssupersaturation ratio
TSsaturation temperature
γgas adiabatic constant
φ(P)correction coefficient of droplet growth model
Ttemperature (K)
ΔTdegree of supercooling (K)
uvelocity component (m·s–1)
Ywetness
σliquid surface tension (N·m–1)
λgthermal conductivity of gas (W·(m·K)–1)
δsemi-empirical correction coefficient
ρdensity (kg·m–3)
Subscript
ggas
dliquid

References

  1. Su, B.; Han, W.; Jin, H. An innovative solar-powered absorption refrigeration system combined with liquid desiccant dehumidification for cooling and water. Energy Convers. Manag. 2017, 153, 515–525. [Google Scholar] [CrossRef]
  2. Wen, T.; Lu, L.; Zhong, H. Investigation on the dehumidification performance of LiCl/H2O-MWNTs nanofluid in a falling film dehumidifier. Build. Environ. 2018, 139, 8–16. [Google Scholar] [CrossRef]
  3. Wen, T.; Lu, L.; Dong, C. Development and experimental study of a novel plate dehumidifier made of anodized aluminum. Energy 2018, 144, 169–177. [Google Scholar] [CrossRef]
  4. Yang, Y.; Walther, J.H.; Yan, Y.; Wen, C. CFD modelling of condensation process of water vapor in supersonic flows. Appl. Therm. Eng. 2017, 115, 1357–1362. [Google Scholar] [CrossRef]
  5. Kantrowitz, A. Nucleation in very rapid vapor expansions. J. Chem. Phys. 1951, 19, 1097–1100. [Google Scholar] [CrossRef]
  6. Courtney, W.G. Remarks on homogeneous nucleation. J. Chem. Phys. 1961, 35, 2249–2250. [Google Scholar] [CrossRef]
  7. Afzalifar, A.; Turunen-Saaresti, T.; Grönman, A. Origin of droplet size underprediction in modeling of low pressure nucleating flows of steam. Int. J. Multiph. Flow 2016, 86, 86–98. [Google Scholar] [CrossRef]
  8. Gyarmathy, G. The spherical droplet in gaseous carrier streams: Review and synthesis. Multiph. Sci. Technol. 1982, 1, 99–279. [Google Scholar] [CrossRef]
  9. Hill, P.G. Condensation of water vapour during supersonic expansion in nozzles. J. Fluid Mech. 1966, 25, 593–620. [Google Scholar] [CrossRef]
  10. Young, J.B. The spontaneous condensation of steam in supersonic nozzle. Phys. Chem. Hydrodyn. 1982, 3, 57–82. [Google Scholar]
  11. White, A.J.; Young, J.B.; Walters, P.T. Experimental validation of condensing flow theory for a stationary cascade of steam turbine blades. Philos. Trans. R. Soc. Lond. 1996, 354, 59–88. [Google Scholar] [CrossRef]
  12. Bakhtar, F.; Young, J.B.; White, A.J.; Simpson, D.A. Classical nucleation theory and its application to condensing steam flow calculations. Proc. Inst. Mech. Eng. C J. Mech. Eng. Sci. 2005, 219, 1315–1333. [Google Scholar] [CrossRef]
  13. Dykas, S.; Majkut, M.; Smołka, K. Study of the wet steam flow in the blade tip rotor linear blade cascade. Int. J. Heat Mass Transf. 2018, 120, 9–17. [Google Scholar] [CrossRef]
  14. Hoznedl, M.; Kolovratník, M.; Bartoš, O. Experimental research on the flow at the last stage of a 1090 MW steam turbine. J. Power Energy 2018. [Google Scholar] [CrossRef]
  15. Starzmann, J.; Casey, M.M.; Mayer, J.F. Wetness loss prediction for a low pressure steam turbine using computational fluid dynamics. J. Power Energy 2014, 228, 216–231. [Google Scholar] [CrossRef]
  16. Harris, F.R. Sghwr: Steam turbine for the 100 mw(e) prototype. Nucl. Eng. 1967, 12. Available online: https://www.osti.gov/biblio/4363266 (accessed on 4 August 2018).
  17. Li, L.; Du, C.; Fan, X.; Zhong, G. Optimisation of a low-pressure multistage steam turbine towards decreasing the wetness losses and aerodynamic losses. Proc. Inst. Mech. Eng. Part A-J. Power Energy 2016, 230, 51–54. [Google Scholar] [CrossRef]
  18. Noori Rahim Abadi, S.M.A.; Abadi, S.M.N.R.; Meyer, J.P. CFD-based shape optimization of steam turbine blade cascade in transonic two phase flows. Appl. Therm. Eng. 2017, 112, 1575–1589. [Google Scholar] [CrossRef]
  19. Gribin, V.; Tishchenko, A.; Tishchenko, V.; Gavrilov, I.; Khomiakov, S.; Popov, V. An experimental study of influence of the steam injection on the profile surface on the turbine nozzle cascade performance. In Proceedings of the ASME Turbo Expo 2014: Turbine Technical Conference and Exposition, Düsseldorf, Germany, 16–20 June 2014. [Google Scholar] [CrossRef]
  20. Mirhoseini, M.S.; Boroomand, M. Multi-objective optimization of hot steam injection variables to control wetness parameters of steam flow within nozzles. Energy 2017, 141, 1027–1037. [Google Scholar] [CrossRef]
  21. Mirhoseini, M.S.; Boroomand, M. Control of wetness fraction and liquid droplet size in wet steam two phase flows with hot steam injection. Meccanica 2017, 53, 1–15. [Google Scholar] [CrossRef]
  22. Vatanmakan, M.; Lakzian, E.; Mahpeykar, M.R. Investigating the entropy generation in condensing steam flow in turbine blades with volumetric heating. Energy 2018, 147, 701–714. [Google Scholar] [CrossRef]
  23. Zhang, G.; Wang, L.; Zhang, S. Effect evaluation of a novel dehumidification structure based on the modified model. Energy Convers. Manag. 2018, 159, 65–75. [Google Scholar] [CrossRef]
  24. Esfe, H.B.; Kermani, M.J.; Avval, M.S. Effects of surface roughness on deviation angle and performance losses in wet steam turbines. Appl. Therm. Eng. 2015, 90, 158–173. [Google Scholar] [CrossRef]
  25. Moore, M.J.; Sieverding, C.H. Two-Phase Steam Flow in Turbines and Separators: Theory, Instrumentation, Engineering; Hemisphere Publishing Corporation: Washington, DC, USA, 1976. [Google Scholar]
  26. Moore, M.J.; Sieverding, C.H. Aerothermodynamics of Low Pressure Steam Turbines and Condensers; Hemisphere Publishing Corporation: Washington, DC, USA, 1987; pp. 12–14. [Google Scholar]
  27. Wölk, J.; Strey, R.; Heath, C.H.; Wyslouzil, B.E. Empirical function for homogeneous water nucleation rates. J. Chem. Phys. 2002, 117, 4954–4960. [Google Scholar] [CrossRef]
  28. Young, J.B. Two-Dimensional, Nonequilibrium, Wet-Steam Calculations for Nozzles and Turbine Cascades. J. Turbomach. 1992, 114, 569–579. [Google Scholar] [CrossRef]
  29. Chandler, K.; White, A.; Young, J. Non-equilibrium wet-steam calculations of unsteady low-pressure turbine flows. J. Power Energy 2014, 228, 143–152. [Google Scholar] [CrossRef]
  30. White, A.J. A comparison of modeling methods for polydispersed wet-steam flow. Int. J. Numer. Meth. Eng. 2003, 57, 819–834. [Google Scholar] [CrossRef]
  31. White, A.J.; Hounslow, M.J. Modelling droplet size distributions in polydispersed wet-steam flows. Int. J. Heat Mass Trans. 2000, 43, 1873–1884. [Google Scholar] [CrossRef]
  32. Xu, H.; Zhonghe, H.; Wei, Z.; Jiangbo, Q. Coupled Model of Heat and Mass Balance for Droplet Growth in Wet Steam Non-Equilibrium Homogeneous Condensation Flow. Energies 2017, 12, 2033. [Google Scholar] [CrossRef]
  33. Roe, P.L. Characteristic-Based Schemes for the Euler Equations. Ann. Rev. Fluid Mech. 1986, 18, 337–365. [Google Scholar] [CrossRef]
Figure 1. Schematic diagram of wetness losses.
Energies 11 02306 g001
Figure 2. Comparison of pressure ratio and experimental value of the blade surface.
Energies 11 02306 g002
Figure 3. Naming rule.
Energies 11 02306 g003
Figure 4. Setting of (a) boundary conditions and (b) mesh partition.
Energies 11 02306 g004
Figure 5. Distribution of (a) wetness distribution and (b) nucleation rate (part 1).
Energies 11 02306 g005
Figure 6. Distribution of steam parameters in the middle of the cascade passage (part 1): (a) nucleation rate; (b) Mach number.
Energies 11 02306 g006
Figure 7. Distribution of (a) wetness and (b) nucleation rate (part 2).
Energies 11 02306 g007
Figure 8. Distribution of steam parameters in the middle of the cascade passage (part 2): (a) nucleation rate; (b) Mach number.
Energies 11 02306 g008
Figure 9. Distribution of (a) wetness and (b) nucleation rate (part 3).
Energies 11 02306 g009
Figure 10. Distribution of steam parameters in the middle of the cascade passage (part 3): (a) nucleation rate; (b) Mach number.
Energies 11 02306 g010
Figure 11. Dehumidification performance of cascade.
Energies 11 02306 g011
Figure 12. Comparison of comprehensive performance of (a) wetness and (b) wetness losses of cascade model.
Energies 11 02306 g012
Table 1. Parameters related to suction surface.
Case NumberAverage Wetness of Cascade Outlet (%)Wetness Losses (kJ/kg)Total Pressure
Loss Coefficient
ORI2.651.450.073
0.57-0.69-52.591.410.087
0.57-0.72-52.621.430.083
0.57-0.76-52.541.360.094
0.57-0.79-52.331.180.113
Table 2. Parameters related to pressure surface.
Case NumberAverage Wetness of Cascade Outlet (%)Wetness Losses (kJ/kg)Total Pressure
Loss Coefficient
ORI2.651.450.073
0.45-0.79-52.401.240.104
0.57-0.79-52.331.180.113
0.68-0.79-52.421.260.114
0.77-0.79-52.371.220.119
Table 3. Parameters of three cascades.
Case NumberAverage Wetness of Cascade Outlet (%)Wetness Losses (kJ/kg)Total Pressure
Loss Coefficient
ORI2.651.450.073
0.57-0.79-12.601.400.082
0.57-0.79-32.531.350.094
0.57-0.79-52.331.180.113

