Determining Equipment Capacity of Electric Vehicle Charging Station Operator for Profit Maximization


Abstract
:1. Introduction
2. Regulatory Background
2.1. Charging Fee of EV
2.2. Charge Discount
2.3. Infrastructure Linkage Fee
3. Optimization Formulation
4. Case Descriptions
4.1. Simulation Setup
4.2. Unit Price of Equipment
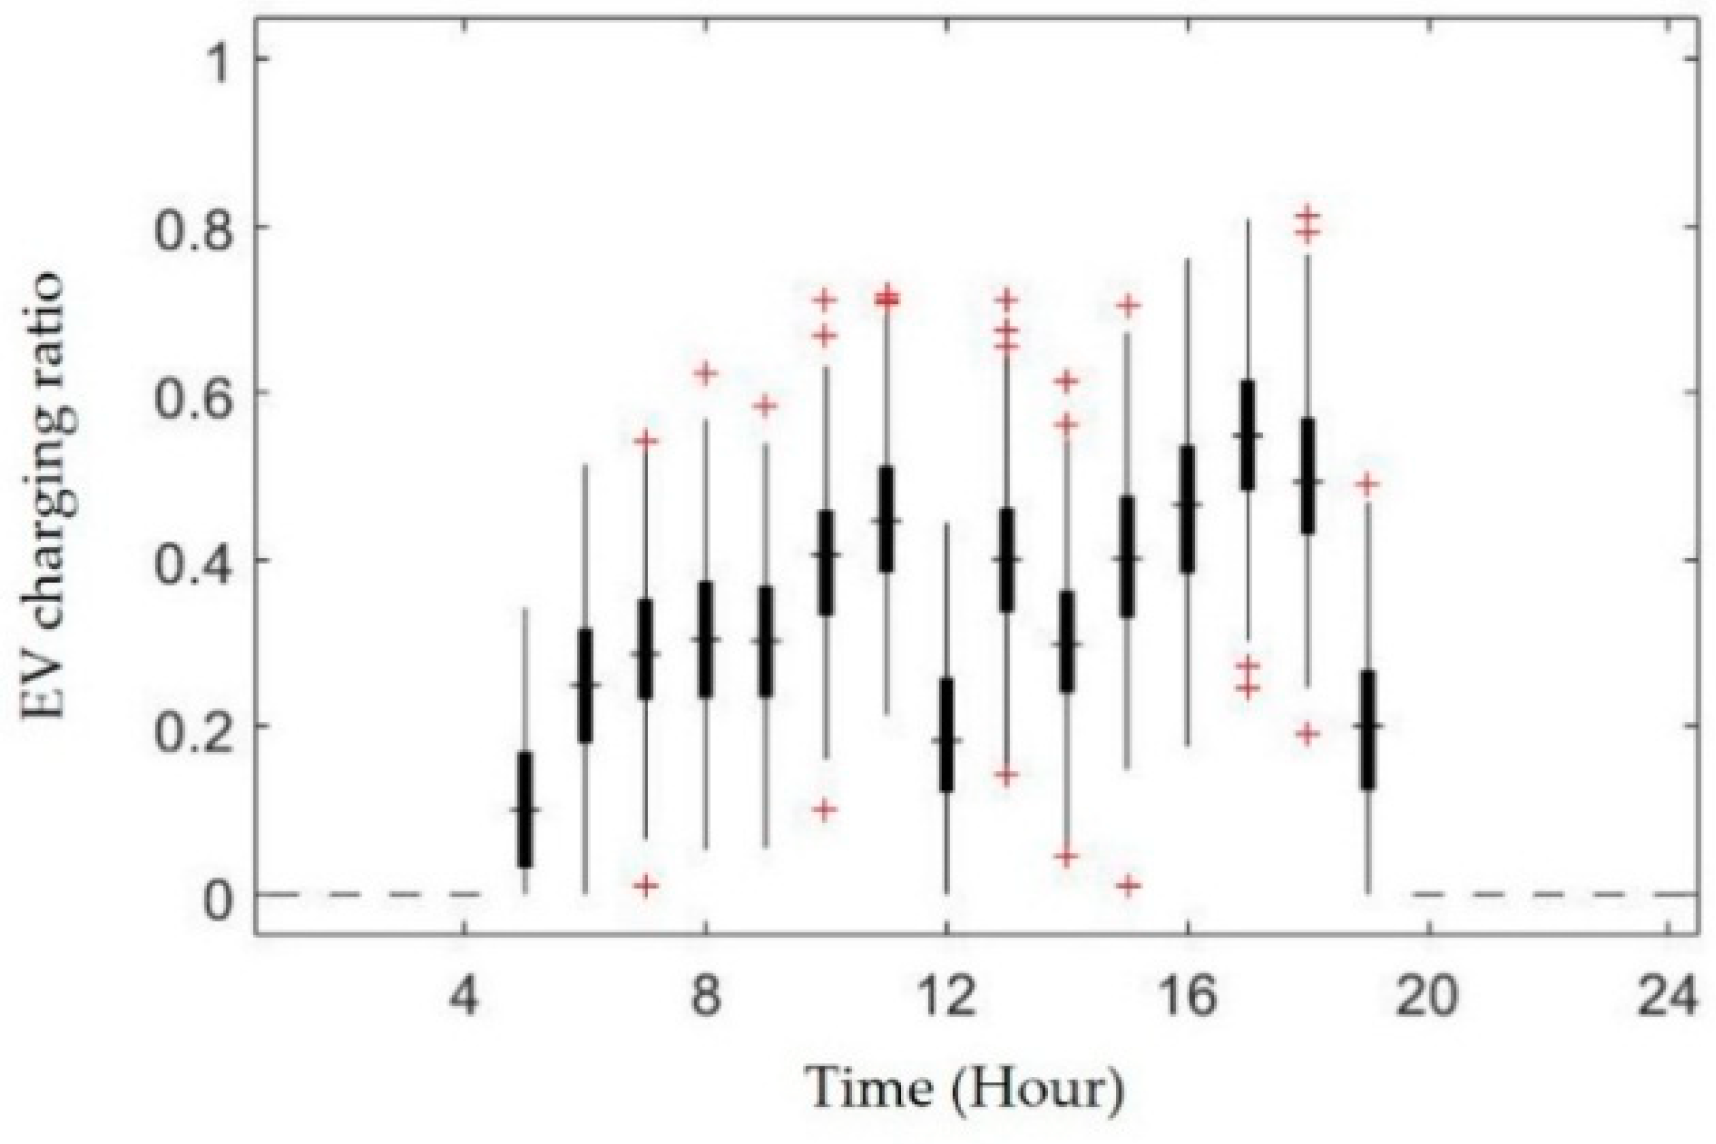
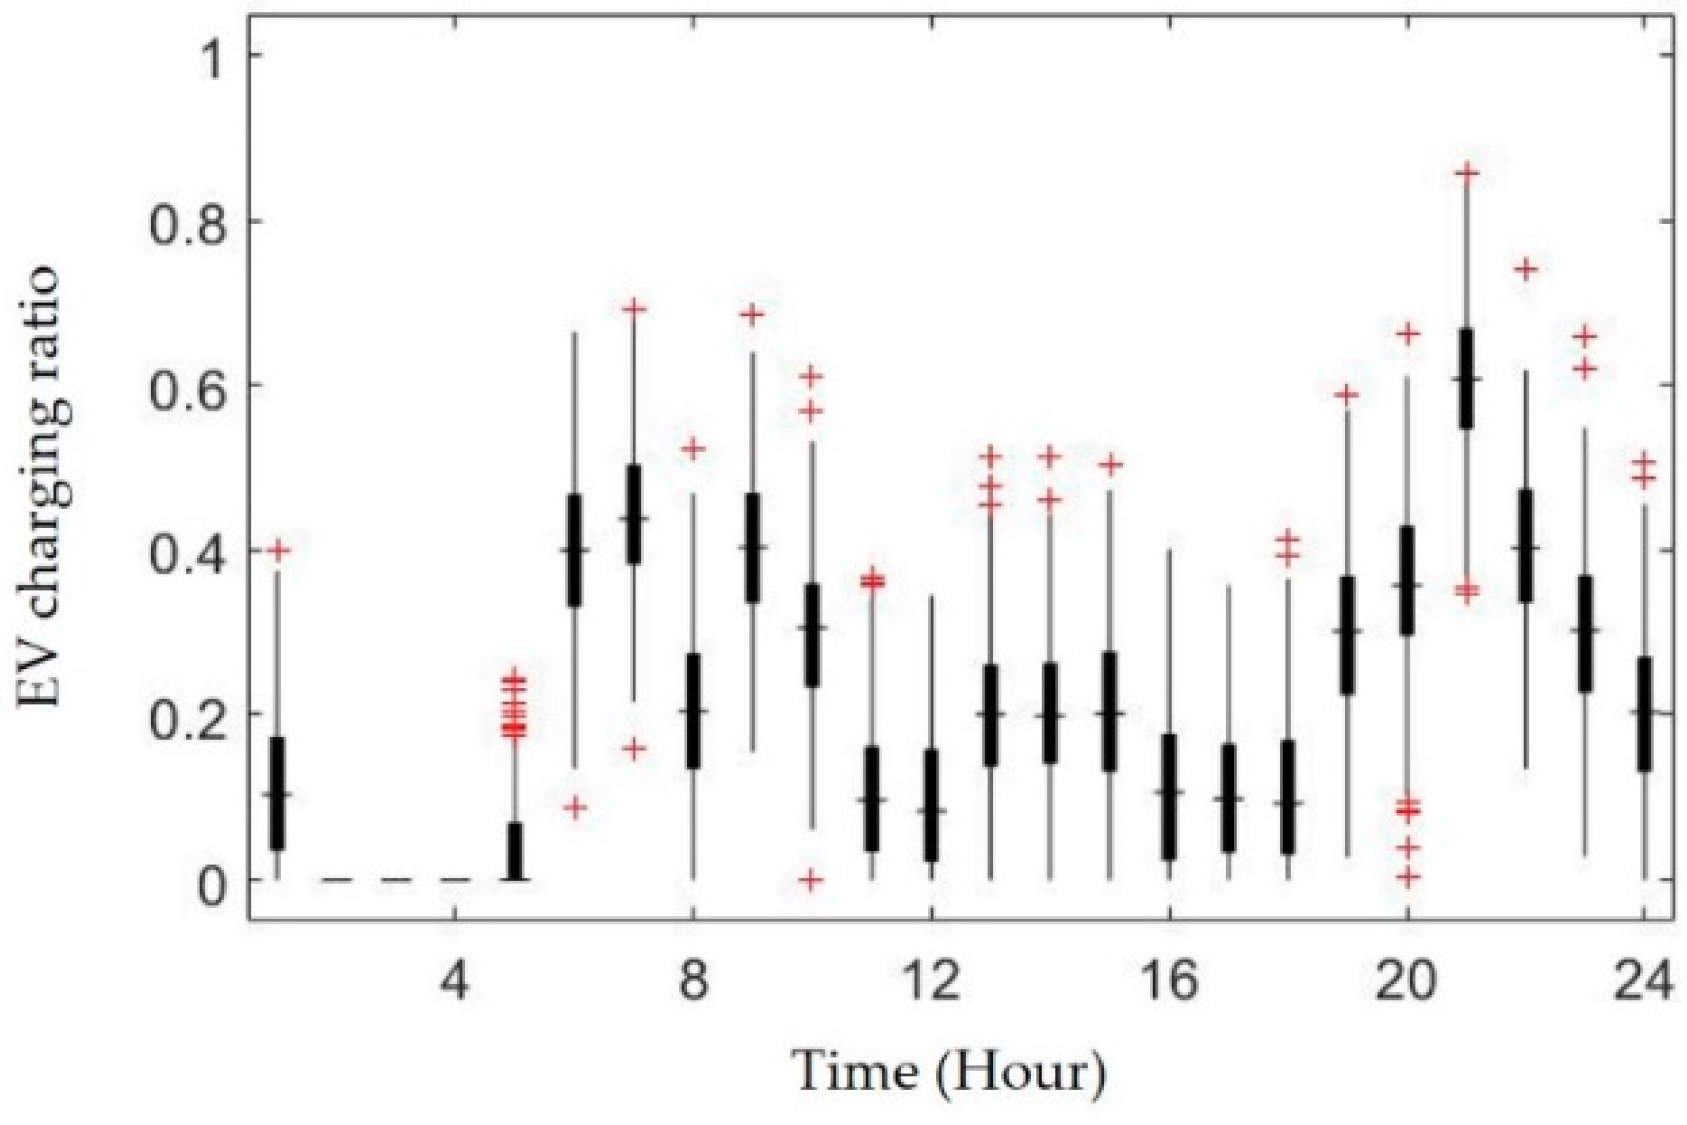
4.3. Patterns of EV Charging Demand
4.3.1. Case A
4.3.2. Case B
4.3.3. Case C
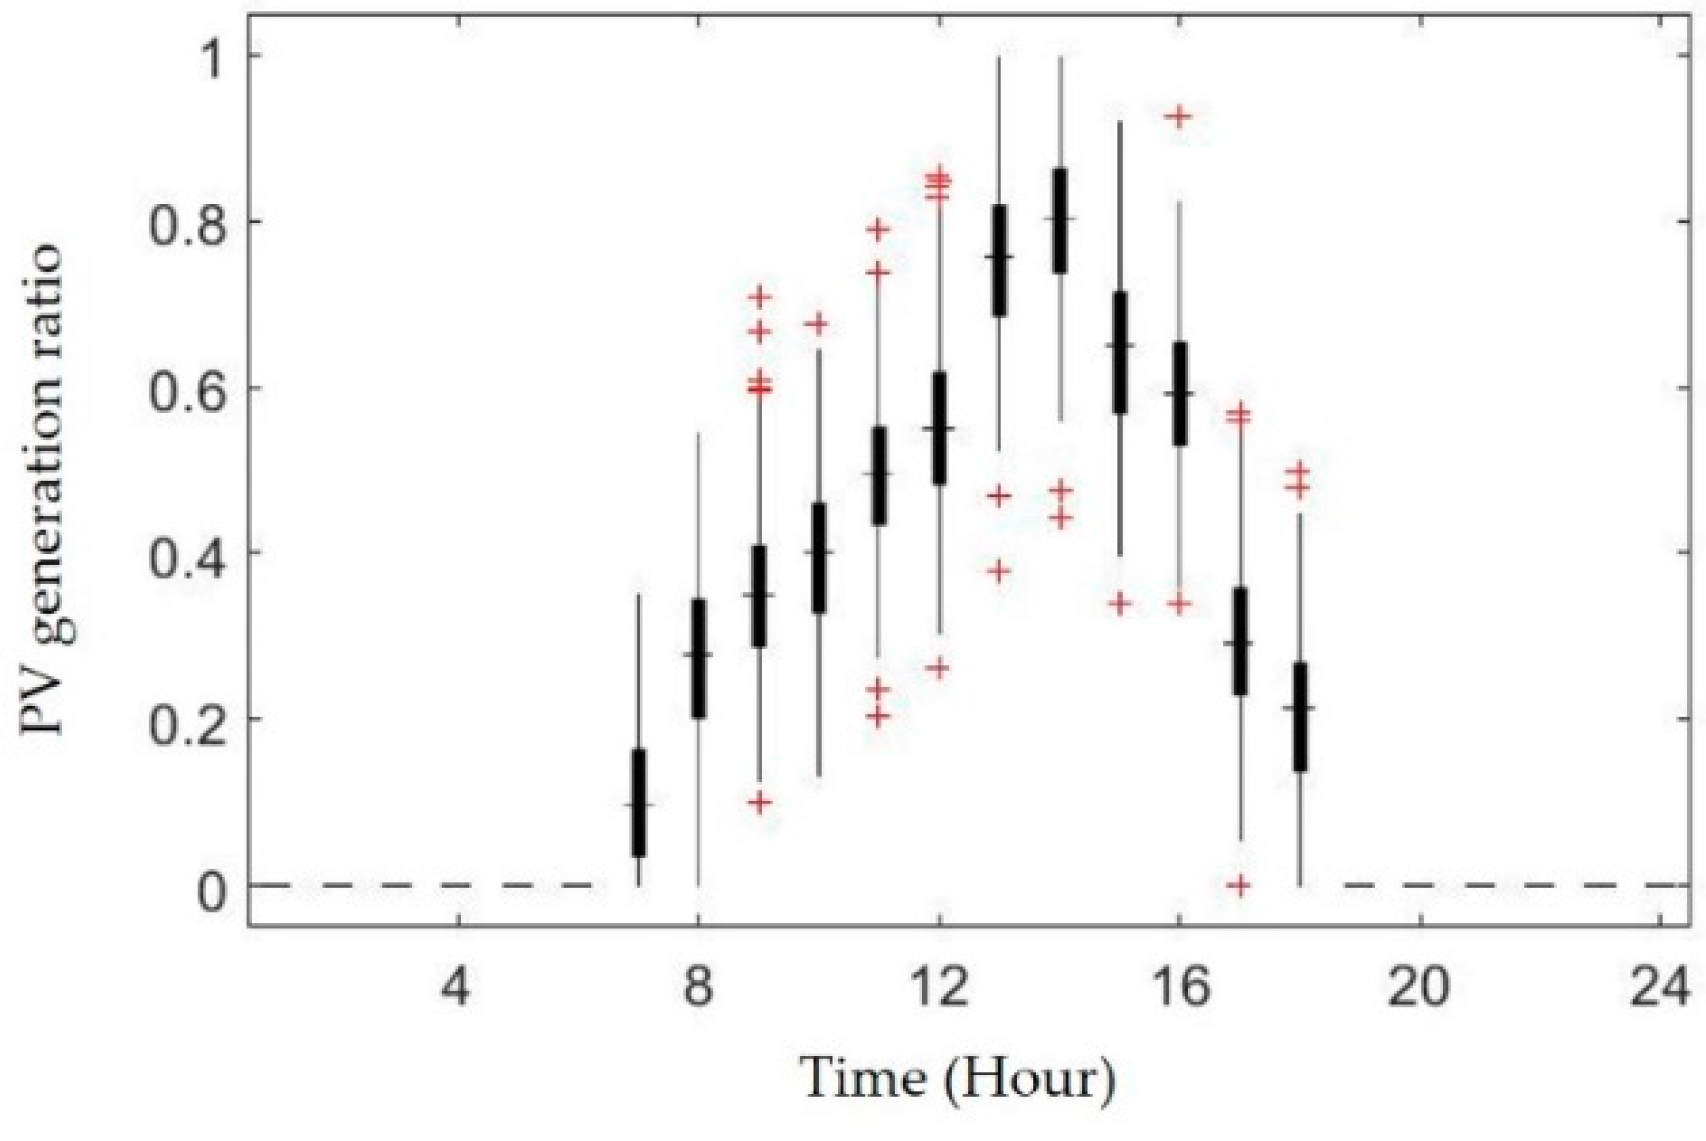
4.4. PV Generation
4.5. Relationship between Selling Price and EV Charging Demand
4.6. Conditions of Budget, Area, and Desired Profit Margin
5. Results and Discussion
5.1. Simulation Results
5.2. Discussion
5.3. Model Statistics
6. Conclusions
Author Contributions
Funding
Conflicts of Interest
Nomenclature
| Acronyms | |
| EV | Electric vehicle |
| PCS | Power conditioning system |
| BESS | Battery energy storage system |
| PV | Photovoltaic |
| CSO | Charging station operator |
| ESS | Energy storage system |
| NPV | Net present value |
| SOC | State of charge |
| Indices | |
| Index of hour | |
| Index of day | |
| Parameters | |
| Unit price of the PCS (KRW/kW) | |
| Unit price of the BESS (KRW/kWh) | |
| Unit price of the PV system (KRW/kW) | |
| Unit price of the EV charger (KRW/kW) | |
| Infrastructure linkage fee (KRW/kW) | |
| Unit price of the monthly capacity charge for a CSO to buy electricity from the utility (KRW/kW) | |
| Ratio of capacity of grid connection equipment to that of the EV chargers (%) | |
| Maximum available area of EV charging station () | |
| Required area for a single EV charger () | |
| Required area for a 1 kW PV generation system () | |
| Ratio of area allowed for the EV chargers to area of EV charging station (%) | |
| Capacity of a single EV charger (kW) | |
| Allowed budget for the initial capital investment (KRW) | |
| Number of years in the CSO business | |
| Annual discount rate (%) | |
| Charging efficiency of the PCS (%) | |
| Discharging efficiency of the PCS (%) | |
| Initial SOC of the BESS (%) | |
| Minimum SOC of the BESS (%) | |
| Maximum SOC of the BESS (%) | |
| Uniform selling price of electricity from a CSO to EV users on day (KRW/kWh) | |
| Buying price of electricity from utility to a CSO at hour (KRW/kWh) | |
| Desired profit margin added to the price | |
| Forecasted EV charging demand in the ratio of capacity of the EV chargers at hour on day (%) | |
| Forecasted PV generation in the ratio of capacity of the PV system at hour on day (%) | |
| Auxiliary big number | |
| Variables | |
| NPV of CSO during the period of the CSO business (KRW) | |
| Initial capital expenditure of a CSO (KRW) | |
| Revenue of a CSO on day (KRW) | |
| Operating expenditure of a CSO on day (KRW) | |
| Charge discount for the operation and installation of the PV system or ESS during a year (KRW) | |
| Electrical power provided by the utility (kW) | |
| Charging power of the PCS at hour on day (kW) | |
| Discharging power of the PCS at hour on day (kW) | |
| Remaining energy of the BESS at hour on day (kWh) | |
| Capacity of the PCS (kW) | |
| Capacity of the BESS (kWh) | |
| Capacity of the PV system (kW) | |
| Capacity of the EV chargers (kW) | |
| Number of EV chargers | |
| Auxiliary binary variable for charging/discharging status of PCS at hour on day | |
References
- Bandivadekar, A.; Bodek, K.; Cheah, L.; Evans, C.; Groode, T.; Heywood, J.; Kasseris, E.; Kromer, M.; Weiss, M. On the Road in 2035: Reducing Transportation’s Petroleum Consumption and GHG Emissions; Massachusetts Institute of Technology: Cambridge, MA, USA, July 2008. [Google Scholar]
- Shiau, C.-S.N.; Kaushal, N.; Hendrickson, C.T.; Peterson, S.B.; Whitacre, J.F.; Michalek, J.J. Optimal plug-in hybrid electric vehicle design and allocation for minimum life cycle cost, petroleum consumption, and greenhouse gas emissions. J. Mech. Des. 2010, 132, 091013. [Google Scholar] [CrossRef]
- EPRI. Environmental Assessment of Plug-in Hybrid Electric Vehicles. Volume 1: Nationwide Greenhouse Gas Emissions; Electric Power Research Institute: Palo Alto, CA, USA, July 2007. [Google Scholar]
- IEA. Global EV Outlook 2016; International Energy Agency: Pairs, France, 2016. [Google Scholar]
- Ministry of Environment, Republic of Korea. EV Purchase Subsidy Provision. Available online: https://ev.or.kr/portal/buyersGuide/incenTive?pMENUMST_ID=21549 (accessed on 29 July 2018).
- Ministry of Environment, Republic of Korea. EV Supply and Charging Infrastructure Construction Status. 2017. Available online: http://www.me.go.kr//home/web/public_info/read.do;jsessionid=EAg1BATPzfXt48Hdey7ttoTnITniAaGD0DUUBchv1eFcPg4T9WOeSoCqHloCRG9I.meweb1vhost_servlet_engine1?&publicInfoId=41&menuId=10357 (accessed on 29 July 2018).
- Dong, J.; Liu, C.; Lin, Z. Charging infrastructure planning for promoting battery electric vehicles: An activity-based approach using multiday travel data. Transp. Res. Part C Emerg. Technol. 2014, 38, 44–55. [Google Scholar] [CrossRef]
- Kontou, E.; Yin, Y.; Lin, Z.; He, F. Socially optimal replacement of conventional with electric vehicles for the US household fleet. Int. J. Sustain. Transp. 2017, 11, 749–763. [Google Scholar] [CrossRef]
- Luo, L.; Gu, W.; Zhou, S.; Huang, H.; Gao, S.; Han, J.; Wu, Z.; Dou, X. Optimal planning of electric vehicle charging stations comprising multi-types of charging facilities. Appl. Energy 2018, 226, 1087–1099. [Google Scholar] [CrossRef]
- Román, T.G.S.; Momber, I.; Abbad, M.R.; Miralles, Á.S. Regulatory framework and business models for charging plug-in electric vehicles: Infrastructure, agents, and commercial relationships. Energy Policy 2011, 39, 6360–6375. [Google Scholar] [CrossRef]
- Madina, C.; Zamora, I.; Zabala, E. Methodology for assessing electric vehicle charging infrastructure business models. Energy Policy 2016, 89, 284–293. [Google Scholar] [CrossRef]
- Sweda, T.; Klabjan, D. An agent-based decision support system for electric vehicle charging infrastructure deployment. In Proceedings of the 7th IEEE Vehicle Power and Propulsion Conference, Chicago, IL, USA, 6–9 September 2011. [Google Scholar]
- Liu, J. Electric vehicle charging infrastructure assignment and power grid impacts assessment in Beijing. Energy Policy 2012, 51, 544–557. [Google Scholar] [CrossRef]
- Trivedi, A.; Menon, B.; Srinivasan, D.; Sharma, A.; Nicholas, W.F.D. Multi-Objective Siting and Sizing of E Charging Stations in the Distribution System. In Proceedings of the IEEE Smart Grid Technologies-Asia (ISGT ASIA), Bangkok, Thailand, 3–6 November 2015; pp. 1–6. [Google Scholar]
- Liu, Z.; Wen, F.; Ledwich, G. Optimal planning of electric-vehicle charging stations in distribution systems. IEEE Trans. Power Deliv. 2013, 28, 102–110. [Google Scholar] [CrossRef]
- Sadeghi-Barzani, P.; Rajabi-Ghahnavieh, A.; Kazemi-Karegar, H. Optimal fast charging station placing and sizing. Appl. Energy 2014, 125, 289–299. [Google Scholar] [CrossRef]
- Jia, L.; Hu, Z.; Song, Y.; Luo, Z. Optimal siting and sizing of electric vehicle charging stations. In Proceedings of the IEEE International Electric Vehicle Conference, Greenville, SC, USA, 4–8 March 2012; pp. 1–6. [Google Scholar]
- Liu, Z.; Wen, F.; Ledwich, G. Optimal siting and sizing of distributed generators in distribution systems considering uncertainties. IEEE Trans. Power Deliv. 2011, 26, 2541–2551. [Google Scholar] [CrossRef]
- Chandra Mouli, G.R.; Bauer, P.; Zeman, M. System design for a solar powered electric vehicle charging station for workplaces. Appl. Energy 2016, 168, 434–443. [Google Scholar] [CrossRef]
- Bai, S.; Yu, D.; Lukic, S. Optimum design of an EV/PHEV charging station with DC bus and storage system. In Proceedings of the Energy Conversion Congress and Exposition (ECCE), Atlanta, GA, USA, 12–16 September 2010. [Google Scholar]
- The Manual of Korea Power Market Operation. Available online: http://www.kpx.or.kr/www/selectBbsNttList.do?bbsNo=114&key=29 (accessed on 29 July 2018).
- Enforcement Decree of Electricity Business Act. Available online: http://www.law.go.kr/lsInfoP.do?lsiSeq=200249&efYd=20171226#0000 (accessed on 29 July 2018).
- KEPCO. Detailed Regulations for Billing Provisions for Electricity Supply. Available online: https://cyber.kepco.co.kr/ckepco/front/jsp/CY/D/C/CYDCHP00201.jsp (accessed on 29 July 2018).
- KEPCO. Notification of Changed Fee Discount Regulation for Renewable Energy Resources and Energy Storage System. Available online: http://home.kepco.co.kr/kepco/CU/A/B/CUABPP00102.do?pageIndex=1&boardSeq=21029313&menuCd=FN1201 (accessed on 29 July 2018).
- KEPCO. Billing Provisions for Electricity Supply. Available online: http://cyber.kepco.co.kr/ckepco/front/jsp/CY/D/C/CYDCHP00101.jsp (accessed on 29 July 2018).
- Khalilpour, R.; Vassallo, A. Planning and operation scheduling of PV-battery systems: A novel methodology. Renew. Sustain. Energy Rev. 2016, 53, 194–208. [Google Scholar] [CrossRef]
- Ministry of Environment, Republic of Korea. Instruction for Installation and Operation of EV Charging Infrastructure. 2018. Available online: https://ev.or.kr/portal/board/14/2447/?pMENUMST_ID=21552 (accessed on 29 July 2018).
- PRPA. Battery Energy Storage Technology Assessment; Platte River Power Authority: Fort Collins, CO, USA, 2017. [Google Scholar]
- Fu, R.; Feldman, D.J.; Margolis, R.M.; Woodhouse, M.A.; Ardani, K.B. U.S. Solar Photovoltaic System Cost Benchmark: Q1 2017; National Renewable Energy Laboratory: Golden, CO, USA, September 2017. [Google Scholar]
- U.S. Energy Information Administration. Today in Energy. Available online: https://www.eia.gov/todayinenergy/detail.php?id=35432 (accessed on 29 July 2018).
- OhmHome. EV Charging Station Cost. Available online: https://www.ohmhomenow.com/electric-vehicles/ev-charging-station-cost/ (accessed on 29 July 2018).
- Fesharaki, V.J.; Dehghani, M.; Fesharaki, J.J.; Tavasoli, H. The effect of temperature on photovoltaic cell efficiency. In Proceedings of the 1st international conference on emerging trends in energy conservation–ETEC, Tehran, Iran, 21–22 November 2011. [Google Scholar]
- NOAA. Quality Controlled Datasets. Available online: https://www.ncdc.noaa.gov/crn/qcdatasets.html (accessed on 29 July 2018).


| Category | Summer (1 June–31 August) | Spring/Fall (1 March–31 May, 1 September–31 October) | Winter (1 November–28 February) |
|---|---|---|---|
| Light load hours | 23:00–09:00 | 23:00–09:00 | 23:00–09:00 |
| Heavy load hours | 09:00–10:00 | 09:00–10:00 | 09:00–10:00 |
| 12:00–13:00 | 12:00–13:00 | 12:00–17:00 | |
| 17:00–23:00 | 17:00–23:00 | 20:00–22:00 | |
| Peak load hours | 10:00–12:00 13:00–17:00 | 10:00–12:00 13:00–17:00 | 10:00–12:00 17:00–20:00 22:00–23:00 |
| Category | Summer | Spring/Fall | Winter | ||
|---|---|---|---|---|---|
| Low voltage customer | Energy fee (KRW/kWh) | Light load hours | 57.6 | 58.7 | 80.7 |
| Heavy load hours | 145.3 | 70.5 | 128.2 | ||
| Peak load hours | 232.5 | 75.4 | 190.8 | ||
| Capacity charge (KRW/kW) | 2390 | ||||
| High voltage customer | Energy fee (KRW/kWh) | Light load hours | 52.5 | 53.5 | 69.9 |
| Heavy load hours | 110.7 | 64.3 | 101 | ||
| Peak load hours | 163.7 | 68.2 | 138.8 | ||
| Capacity charge (KRW/kW) | 2580 | ||||
| Ratio of the Capacity of the BESS and Contract Demand | Weight Factor A | Weight Factor B |
|---|---|---|
| Over 10% | 1.2 | 0.5 |
| Over 5% and less than 10% | 1 | 0.2 |
| Less than 5% | 0.8 | 0 |
| Category | Overhead | Underground | |
|---|---|---|---|
| Low voltage linkage fee (KRW) | Per contract, up to 5 kW contract demand | 220,000 | 421,000 |
| Per kW, over 5 kW contract demand | 86,000 | 98,000 | |
| High or extra high voltage linkage fee (KRW) | Per kW of contract demand | 17,000 | 35,000 |
| Category | Overhead | Underground | |||
|---|---|---|---|---|---|
| Single Phase | Three Phase | ||||
| Construction linkage fee (KRW) | Per m, over basic distance | Low voltage | 39,000 | 43,000 | 60,000 |
| High or extra high voltage | 43,000 | 110,000 | |||
| Reinforcement linkage fee (KRW) | Per m, over basic distance | Low voltage | 5000 | - | |
| High or extra high voltage | 10,000 | - | |||
| Equipment | Unit Price |
|---|---|
| PCS | 160,000 (KRW/kW) |
| BESS | 400,000 (KRW/kWh) |
| PV | 1,500,000 (KRW/kW) |
| EV charger | 450,000 (KRW/kW) |
| Budget (1000 KRW) | Desired Profit Margin Added to the Price (%) | PCS Capacity (kW) | BESS Capacity (kWh) | PV Capacity (kW) | EV Charger Capacity (kW) | NPV (1000 KRW) | |
|---|---|---|---|---|---|---|---|
| 50,000 | 200 | 10 | 12.87 | 28 | 14.17 | 30.8 | 14,990 |
| 20 | 12.56 | 28.4 | 14.1 | 30.8 | 20,718 | ||
| 30 | 12.57 | 28.9 | 13.96 | 30.8 | 25,331 | ||
| 40 | 11.6 | 20.72 | 13.67 | 38.5 | 29,199 | ||
| 50 | 11.44 | 21.79 | 13.4 | 38.5 | 33,404 | ||
| 60 | 11.76 | 22.97 | 13.05 | 38.5 | 36,120 | ||
| 70 | 10.34 | 16.66 | 12.3 | 46.2 | 36,726 | ||
| 80 | 10.2 | 18.47 | 11.84 | 46.2 | 36,684 | ||
| 90 | 10.1 | 20.74 | 11.24 | 46.2 | 33,321 | ||
| 200,000 | 1500 | 10 | 48.7 | 122.04 | 56.9 | 115.5 | 63,010 |
| 20 | 49.95 | 113.68 | 56.41 | 123.2 | 83,238 | ||
| 30 | 50.27 | 106.37 | 55.75 | 130.9 | 102,085 | ||
| 40 | 48.93 | 100.45 | 54.89 | 138.6 | 118,674 | ||
| 50 | 45.91 | 87.16 | 53.6 | 154 | 133,206 | ||
| 60 | 44.1 | 83.96 | 52.06 | 161.7 | 144,353 | ||
| 70 | 43 | 82.03 | 50.12 | 169.4 | 148,923 | ||
| 80 | 42.73 | 81.45 | 47.72 | 177.1 | 146,268 | ||
| 90 | 41.19 | 75.22 | 44.39 | 192.5 | 132,576 |
| Budget (1000 KRW) | Desired Profit Margin Added to the Price (%) | PCS Capacity (kW) | BESS Capacity (kWh) | PV Capacity (kW) | EV Charger Capacity (kW) | NPV (1000 KRW) | |
|---|---|---|---|---|---|---|---|
| 50,000 | 200 | 10 | - | - | - | - | - |
| 20 | 14.49 | 30.59 | 8.15 | 46.2 | 3,484 | ||
| 30 | 14.86 | 31.38 | 7.89 | 46.2 | 10,906 | ||
| 40 | 11.3 | 21.7 | 8.28 | 53.9 | 17,447 | ||
| 50 | 11.91 | 22.07 | 8.11 | 53.9 | 23,709 | ||
| 60 | 12.47 | 23.25 | 7.74 | 53.9 | 27,847 | ||
| 70 | 11.16 | 17.49 | 6.84 | 61.6 | 29,834 | ||
| 80 | 9.56 | 18.16 | 6.83 | 61.6 | 29,973 | ||
| 90 | 10.59 | 20.26 | 6.16 | 61.6 | 25,773 | ||
| 200,000 | 1500 | 10 | - | - | - | - | - |
| 20 | 57.98 | 122.42 | 32.59 | 184.8 | 12,677 | ||
| 30 | 52.82 | 98.99 | 34.23 | 200.2 | 44,019 | ||
| 40 | 52.79 | 104.47 | 32.77 | 200.2 | 71,127 | ||
| 50 | 54.88 | 96.32 | 32.14 | 207.9 | 94,200 | ||
| 60 | 49.86 | 93.11 | 30.95 | 215.6 | 111,475 | ||
| 70 | 39.27 | 82.16 | 29.84 | 231 | 121,325 | ||
| 80 | 42.96 | 78.73 | 27.78 | 238.7 | 119,969 | ||
| 90 | 36.7 | 70.81 | 25.41 | 254.1 | 105,246 |
| Budget (1000 KRW) | Desired Profit Margin Added to the Price (%) | PCS Capacity (kW) | BESS Capacity (kWh) | PV Capacity (kW) | EV Charger Capacity (kW) | NPV (1000 KRW) | |
|---|---|---|---|---|---|---|---|
| 50,000 | 200 | 10 | 14.54 | 29.78 | 10.94 | 38.5 | 7149 |
| 20 | 14.89 | 30.42 | 10.73 | 38.5 | 13,680 | ||
| 30 | 14.96 | 29.06 | 10.4 | 38.5 | 18,907 | ||
| 40 | 12.08 | 24.15 | 10.12 | 46.2 | 25,137 | ||
| 50 | 12.13 | 24.68 | 9.97 | 46.2 | 30,023 | ||
| 60 | 12.25 | 25.3 | 9.8 | 46.2 | 33,109 | ||
| 70 | 10.72 | 20.17 | 8.75 | 53.9 | 35,123 | ||
| 80 | 10.23 | 20.94 | 8.6 | 53.9 | 34,206 | ||
| 90 | 9.94 | 22.13 | 8.31 | 53.9 | 30,262 | ||
| 200,000 | 1500 | 10 | 59.83 | 118.43 | 43.77 | 154 | 28,157 |
| 20 | 53.06 | 113.61 | 43.2 | 161.7 | 54,036 | ||
| 30 | 53.27 | 107.74 | 42.16 | 169.4 | 78,265 | ||
| 40 | 50.65 | 96.25 | 40.35 | 184.8 | 99,332 | ||
| 50 | 48.47 | 91.95 | 39.15 | 192.5 | 119,606 | ||
| 60 | 46.52 | 88.38 | 37.73 | 200.2 | 134,464 | ||
| 70 | 43.37 | 85.77 | 36.18 | 207.9 | 141,093 | ||
| 80 | 39.73 | 77.77 | 33.54 | 223.3 | 138,194 | ||
| 90 | 39.38 | 76.11 | 31.45 | 231 | 122,574 |
| Budget (1000 KRW) | Desired Profit Margin Added to the Price (%) | PCS Capacity (kW) | BESS Capacity (kWh) | PV Capacity (kW) | EV Charger Capacity (kW) | NPV (1000 KRW) | |
|---|---|---|---|---|---|---|---|
| 50,000 | 200 | 50 | 18 | 40 | 10 | 30.8 | 24,142 |
| 11 | 15 | 7 | 61.6 | 11,627 | |||
| 12 | 17 | 12 | 46.2 | 28,464 | |||
| 11 | 22 | 13 | 38.5 | 32,514 | |||
| 11.44 | 21.79 | 13.4 | 38.5 | 33,404 | |||
| 200,000 | 1500 | 70 | 70 | 150 | 40 | 130.9 | 110,981 |
| 24 | 45 | 23 | 284.9 | 66,217 | |||
| 60 | 83 | 45 | 146.3 | 132,437 | |||
| 44 | 84 | 49 | 169.4 | 147,482 | |||
| 43 | 82.03 | 50.12 | 169.4 | 148,923 |
| Unit Price of Equipment | Capacity of Equipment | NPV (1000 KRW) | ||||||
|---|---|---|---|---|---|---|---|---|
| PCS (1000 KRW/kW) | BESS (1000 KRW/kW) | PV (1000 KRW/kWh) | EV Charger (1000 KRW/kW) | PCS (kW) | BESS (kWh) | PV (kW) | EV Charger (kW) | |
| 160 (base) | 400 (base) | 1500 (base) | 450 (base) | 11.44 | 21.79 | 13.4 | 38.5 | 33,404 |
| 200 (pes) | 400 (base) | 1500 (base) | 450 (base) | 11.16 | 21.24 | 13.28 | 38.5 | 32,566 |
| 120 (opt) | 400 (base) | 1500 (base) | 450 (base) | 13.08 | 22.15 | 13.48 | 38.5 | 34,321 |
| 160 (base) | 500 (pes) | 1500 (base) | 450 (base) | 11.15 | 19.22 | 12.83 | 38.5 | 29,915 |
| 160 (base) | 300 (opt) | 1500 (base) | 450 (base) | 12.06 | 25.1 | 14.12 | 38.5 | 37,766 |
| 160 (base) | 400 (base) | 1875 (pes) | 450 (base) | 11.34 | 24.37 | 12.24 | 30.8 | 25,424 |
| 160 (base) | 400 (base) | 1125 (opt) | 450 (base) | 13.16 | 29.14 | 15.01 | 38.5 | 42,626 |
| 160 (base) | 400 (base) | 1500 (base) | 563 (pes) | 11.16 | 25.95 | 12.59 | 30.8 | 27,031 |
| 160 (base) | 400 (base) | 1500 (base) | 338 (opt) | 12.32 | 20.05 | 14.65 | 46.2 | 41,050 |
| Model Statistics | Value |
|---|---|
| Number of equations | 78,885 |
| Number of variables | 43,834 |
| Non-zero elements | 210,869 |
| Discrete variables | 8761 |
| Average execution time | 1334.664 (s) |
© 2018 by the authors. Licensee MDPI, Basel, Switzerland. This article is an open access article distributed under the terms and conditions of the Creative Commons Attribution (CC BY) license (http://creativecommons.org/licenses/by/4.0/).
Share and Cite
Baik, S.H.; Jin, Y.G.; Yoon, Y.T. Determining Equipment Capacity of Electric Vehicle Charging Station Operator for Profit Maximization. Energies 2018, 11, 2301. https://doi.org/10.3390/en11092301
Baik SH, Jin YG, Yoon YT. Determining Equipment Capacity of Electric Vehicle Charging Station Operator for Profit Maximization. Energies. 2018; 11(9):2301. https://doi.org/10.3390/en11092301
Chicago/Turabian StyleBaik, Se Hoon, Young Gyu Jin, and Yong Tae Yoon. 2018. "Determining Equipment Capacity of Electric Vehicle Charging Station Operator for Profit Maximization" Energies 11, no. 9: 2301. https://doi.org/10.3390/en11092301
APA StyleBaik, S. H., Jin, Y. G., & Yoon, Y. T. (2018). Determining Equipment Capacity of Electric Vehicle Charging Station Operator for Profit Maximization. Energies, 11(9), 2301. https://doi.org/10.3390/en11092301