The Effect of Thermal Shocking with Nitrogen Gas on the Porosities, Permeabilities, and Rock Mechanical Properties of Unconventional Reservoirs


Abstract
:1. Introduction
- Natural fracture network: Existence of natural fracture in a rock decreases the rock tensile strength and assists creating new fractures.
- Rapid thermal load: Applying rapid thermal load results in a steep temperature gradient between the body and the surface of rock and helps to create fractures.
- Low rock thermal conductivity and high thermal expansion coefficient. These are both rock intrinsic properties.
- Brittleness of rock sample: There is a direct relationship between the brittleness of rock sample and successfully creating fractures while using thermal shock technique.
- Fracture toughness: There is an inverse relationship between fracture toughness and successfully creating fractures while using thermal shock technique.
2. Experimental Work
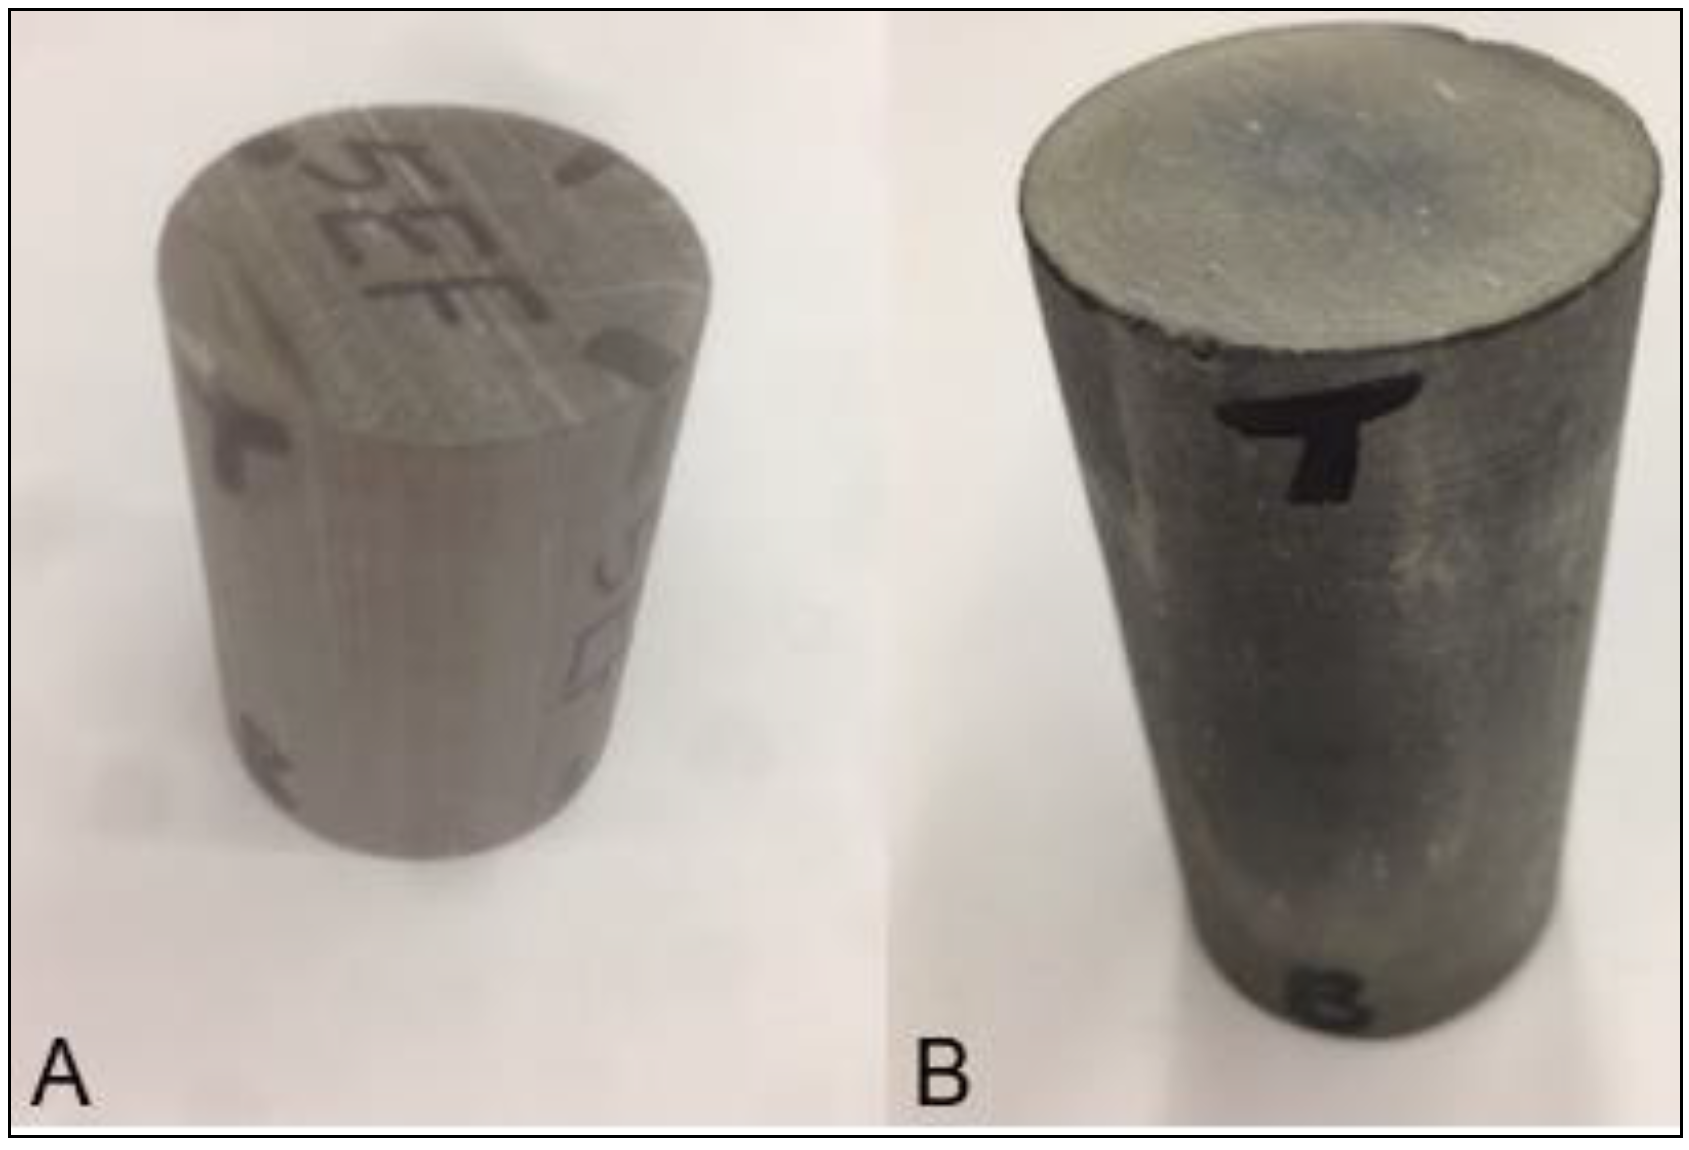
2.1. Core Preparation
2.2. Porosity Measurement
2.3. Permeability Measurement
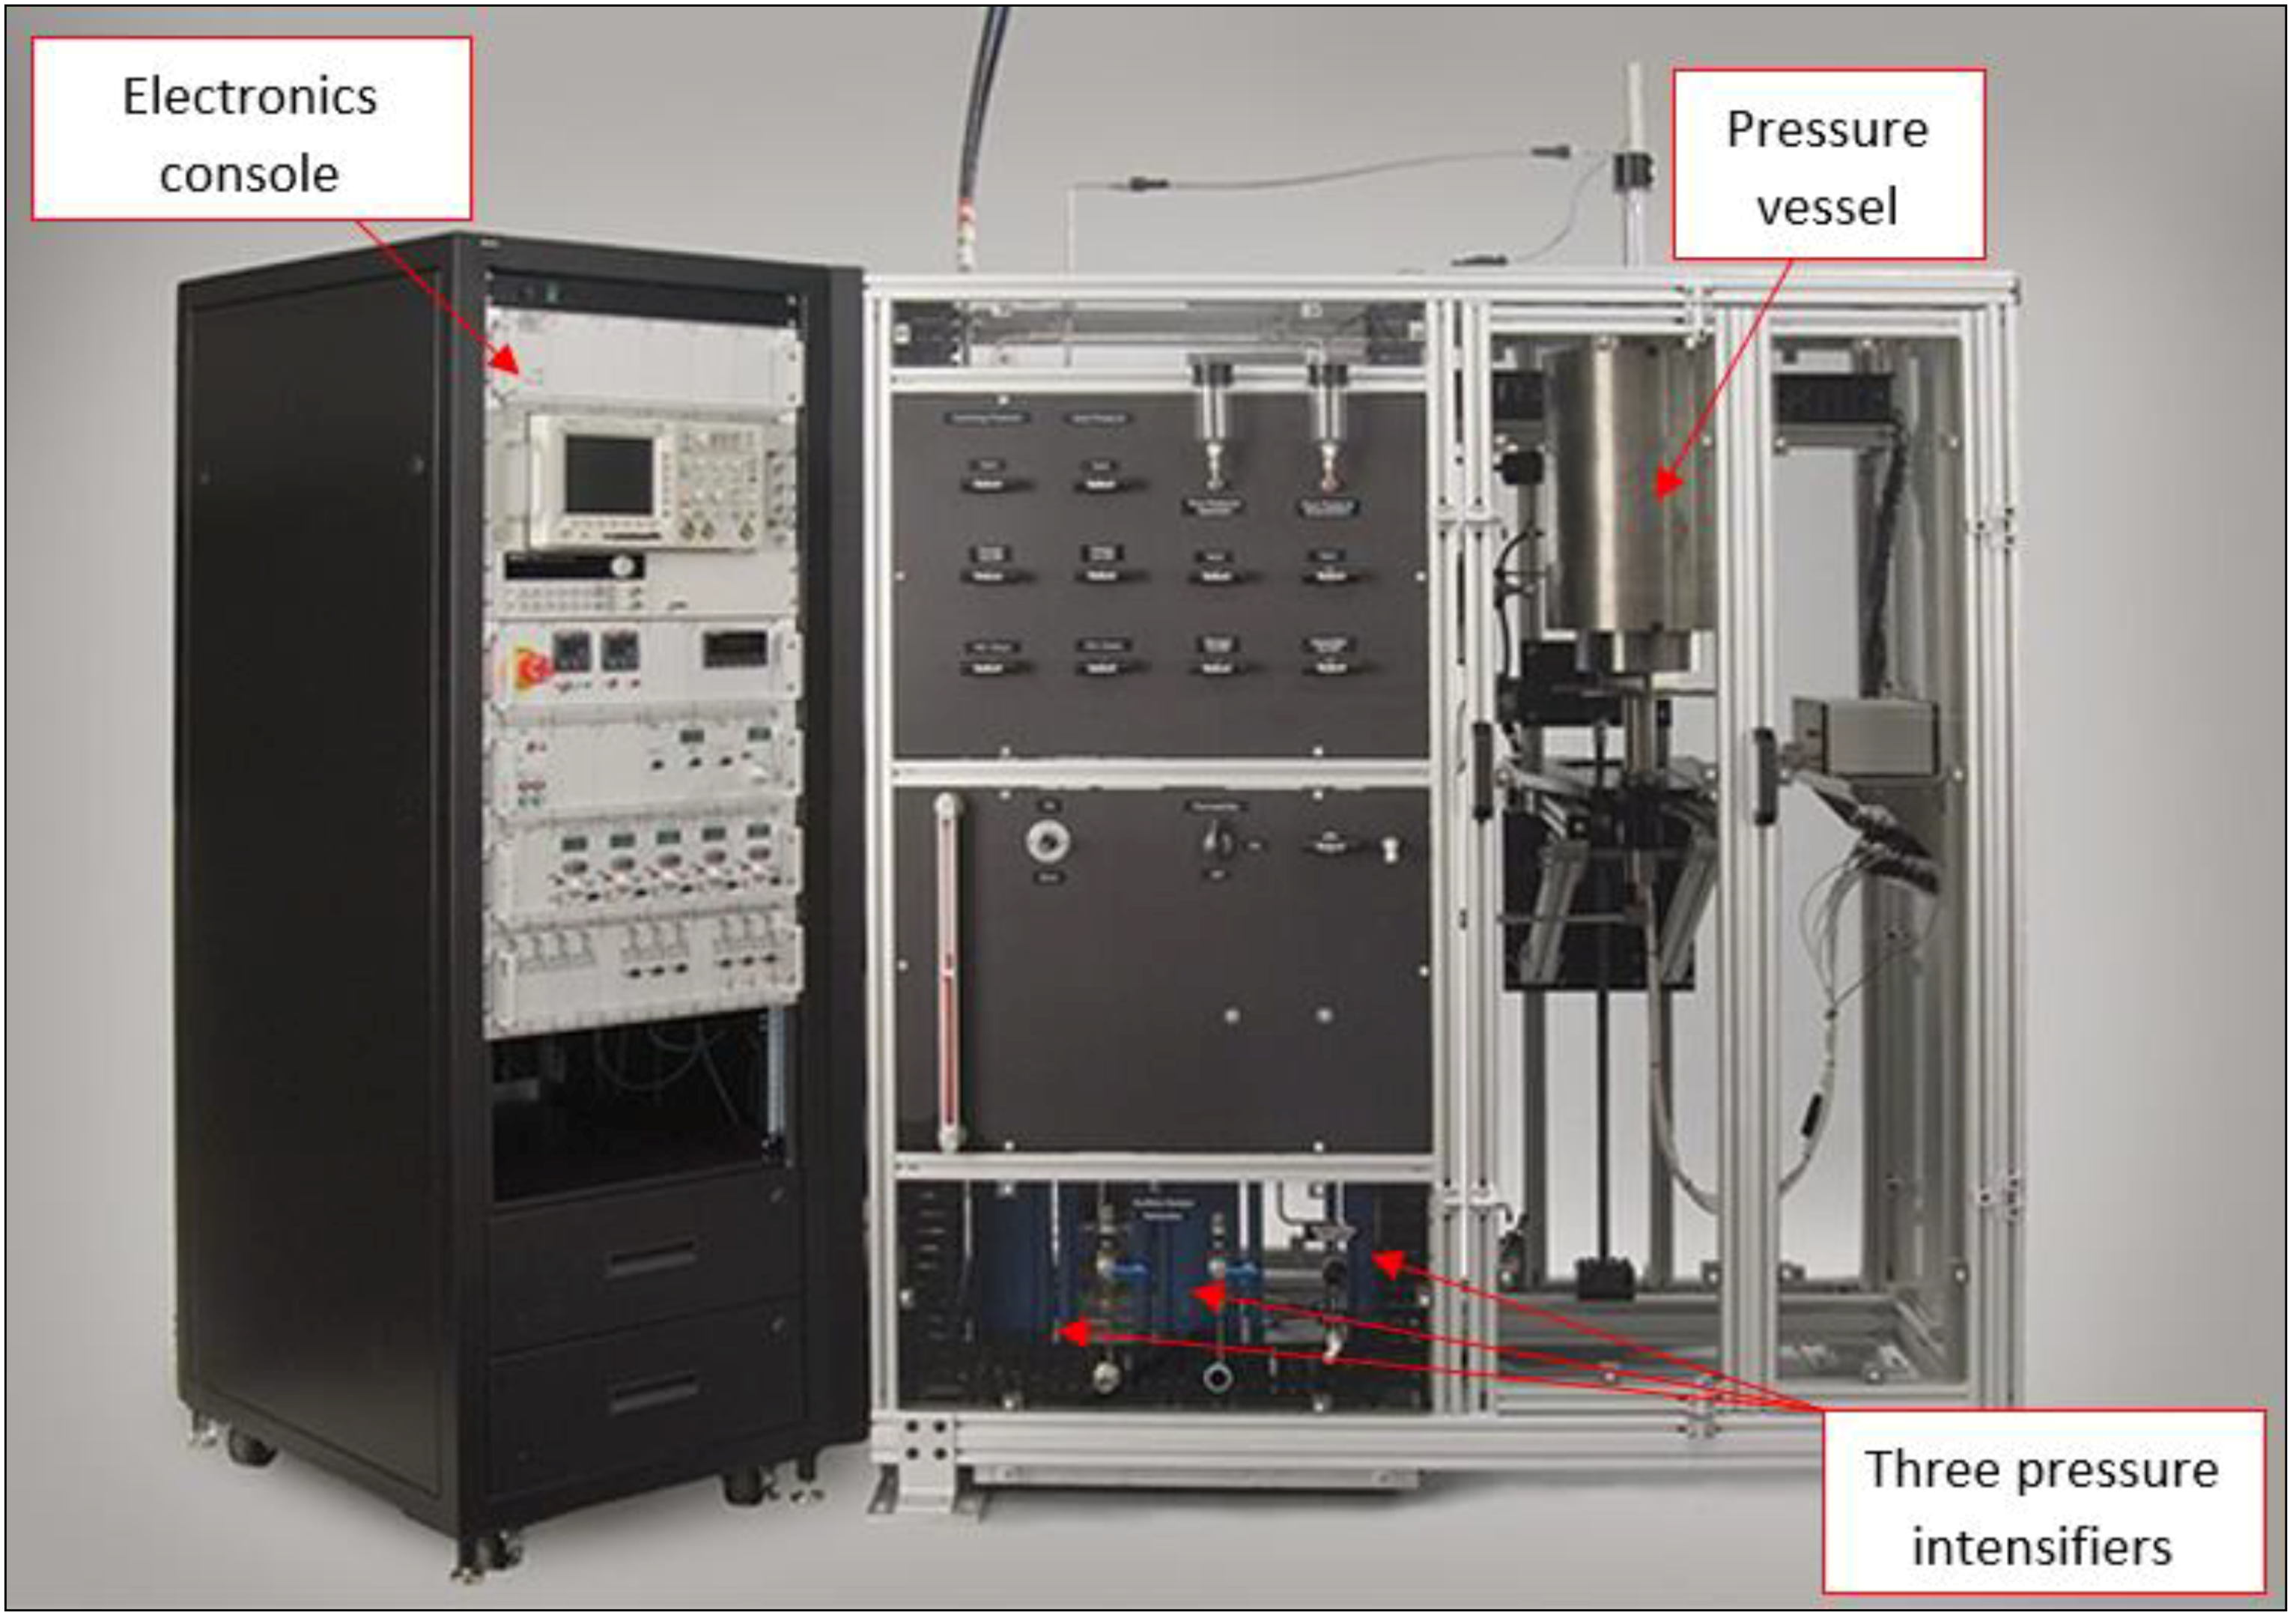
- A high-pressure vessel with a base plug to hold a core sample and three pressure intensifiers to apply pore pressure, confining pressure and axial load on the core sample.
- An electronic console to accurately control the pressures (pore pressure, confining pressure and axial load) using the panel mode. Additionally, the electronic console is utilized to adjust and amplify signals from the transducers to measure the following: axial load, pressure, displacement, temperature, and velocity.
- AutoLab acquisition system that controls the experiment, acquires and processes the data after completing the experiment.
- After sample jacketing and preparation (Figure 3), the sample was inserted in the high-pressure (HP) vessel and secured.
- A confining pressure was applied manually using a panel mode on the electronic console up to 3.45 MPa.
- The vent valve was opened to load the pore pressure intensifier with gas.
- On the data acquisition system, permeability experiment was selected and the sample information was loaded to the system.
- A computer mode was used instead of the panel mode to easily control both confining and pore pressures.
- The pore pressure valve was opened and then the gas flew inside the sample from the upstream side.
- Using the data acquisition system to monitor the pore pressure at both ends of the sample (upstream and downstream). After both pressures became almost equal, permeability measurement starts and the system measures the permeability at the conditions, as shown in Table 2.
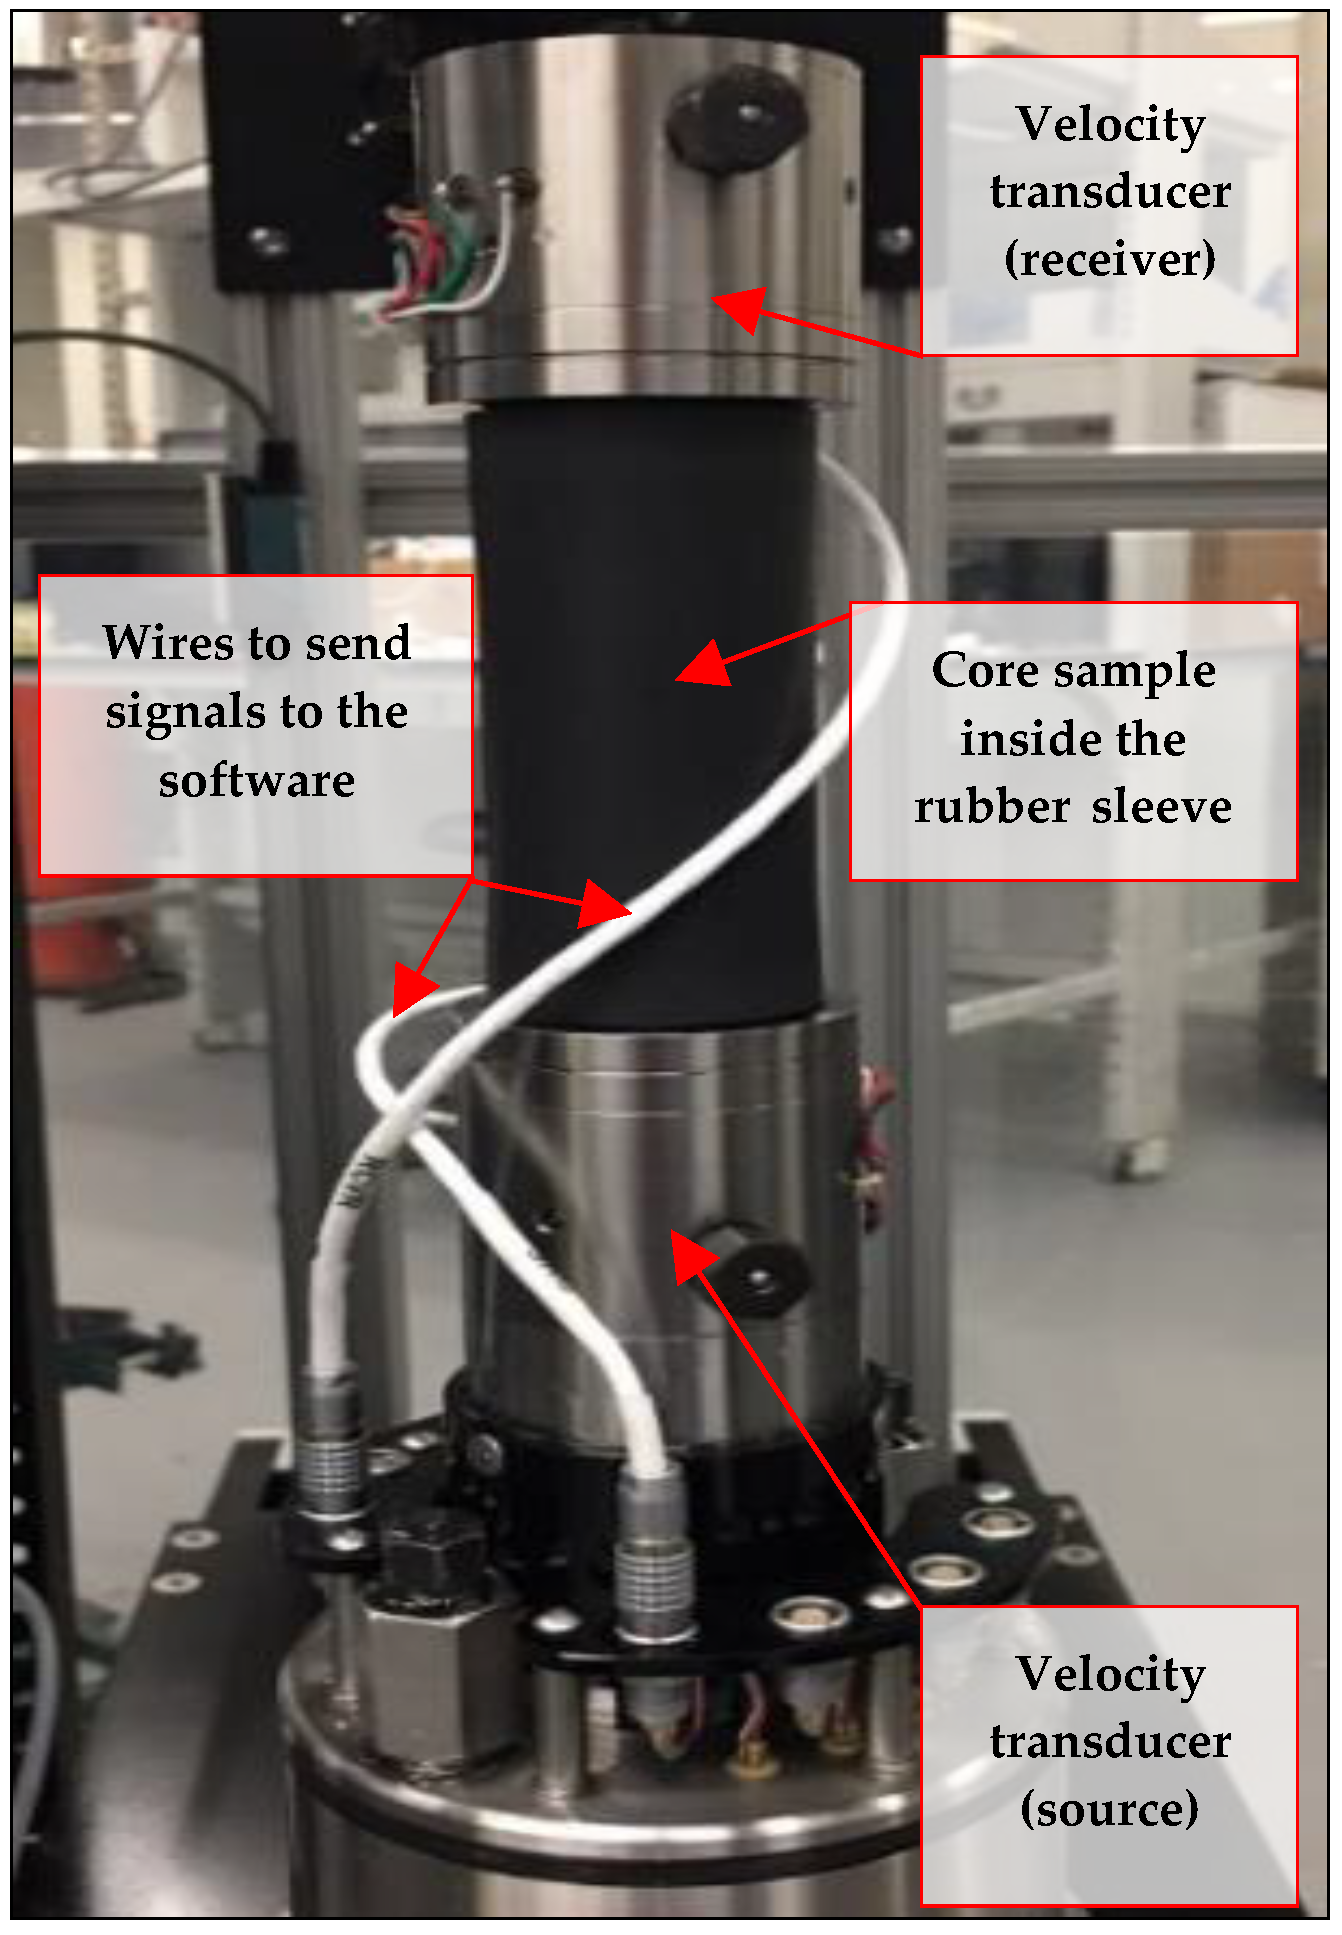
2.4. Axial Velocity Measurement
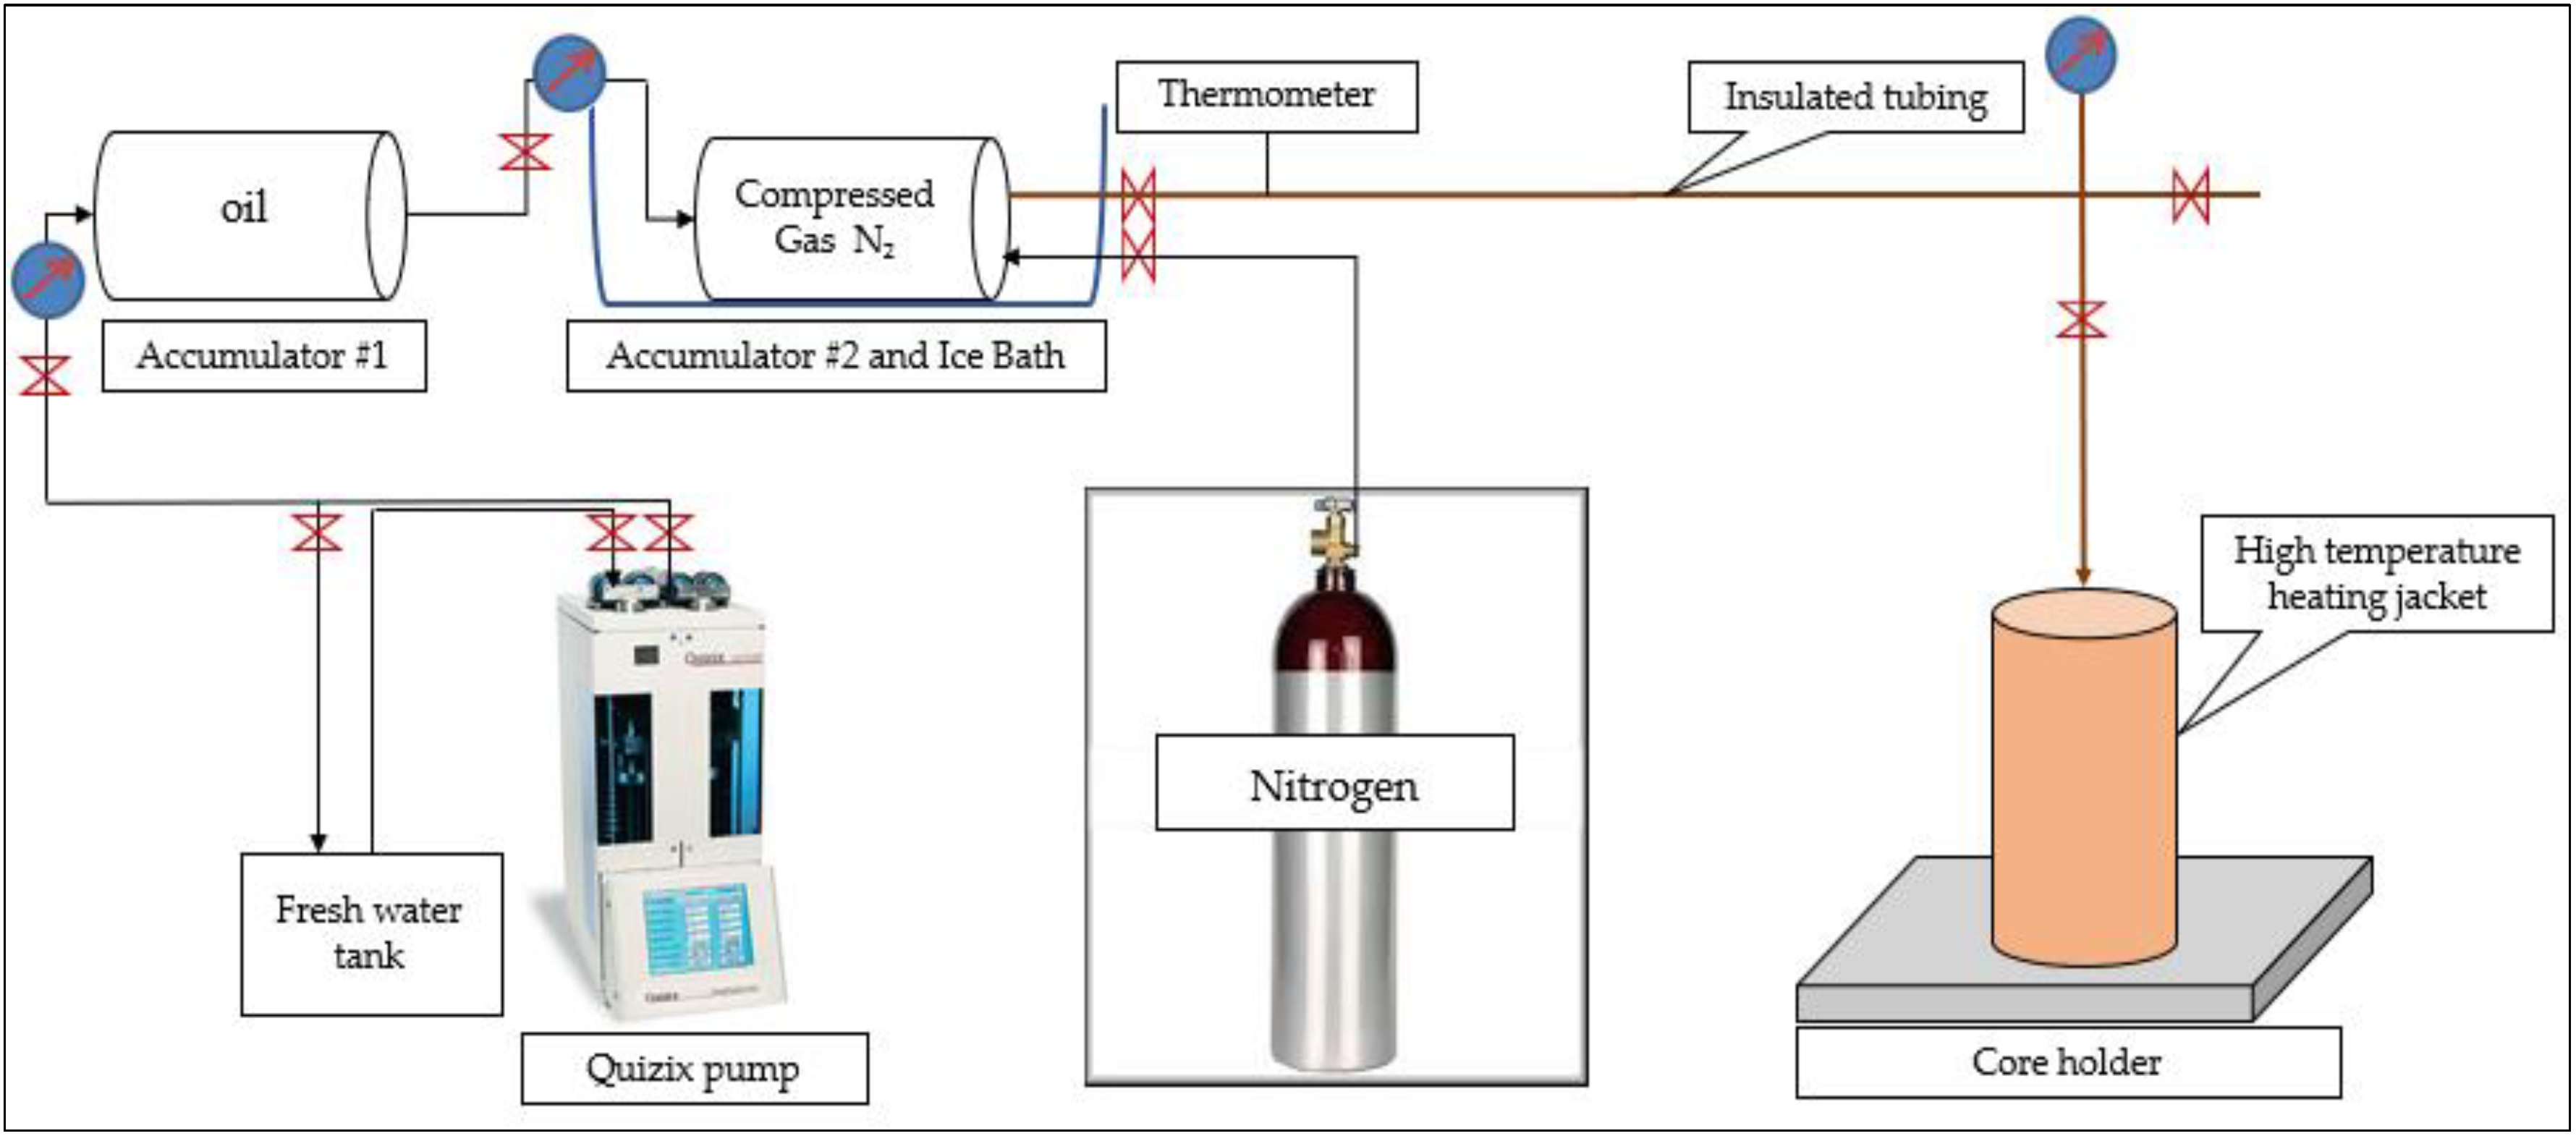
2.5. Thermal Shock Experiment
Thermal Shock Procedure
- The core plug was placed into the core holder, and the core holder was secured and connected to the HP gas accumulator. Then, the heating jacket was turned on to heat the core to 82 °C.
- The cooling bath was prepared by mixing ice with the sodium chloride (NaCl) crystals to achieve the desired temperature (−18 °C). Meanwhile, the temperature was measured while using a thermometer. The HP gas accumulator was then surrounded by the ice-salt cooling mixture.
- The nitrogen cylinder valve was opened to let the gas flow and accumulate in the second HP gas accumulator. Then, the gas was left in the cooling mixture for 30 min to reach the desirable temperature (−18 °C).
- After heating the core sample at the temperature of 82 °C for 60 min, the valve between the core holder and the second gas accumulator was opened and the core sample was subjected to the cold nitrogen for 15 min. Meanwhile, the pump was set to deliver the water from the fresh water tank to the first HP accumulator, which contained the hydraulic oil till the injection pressure reached 6.89 MPa.
- The pump was turned off and the bleeding valve was opened gradually to release the pressure in the core holder.
3. Results and Discussion
3.1. Porosity Results
3.2. Permeability Results
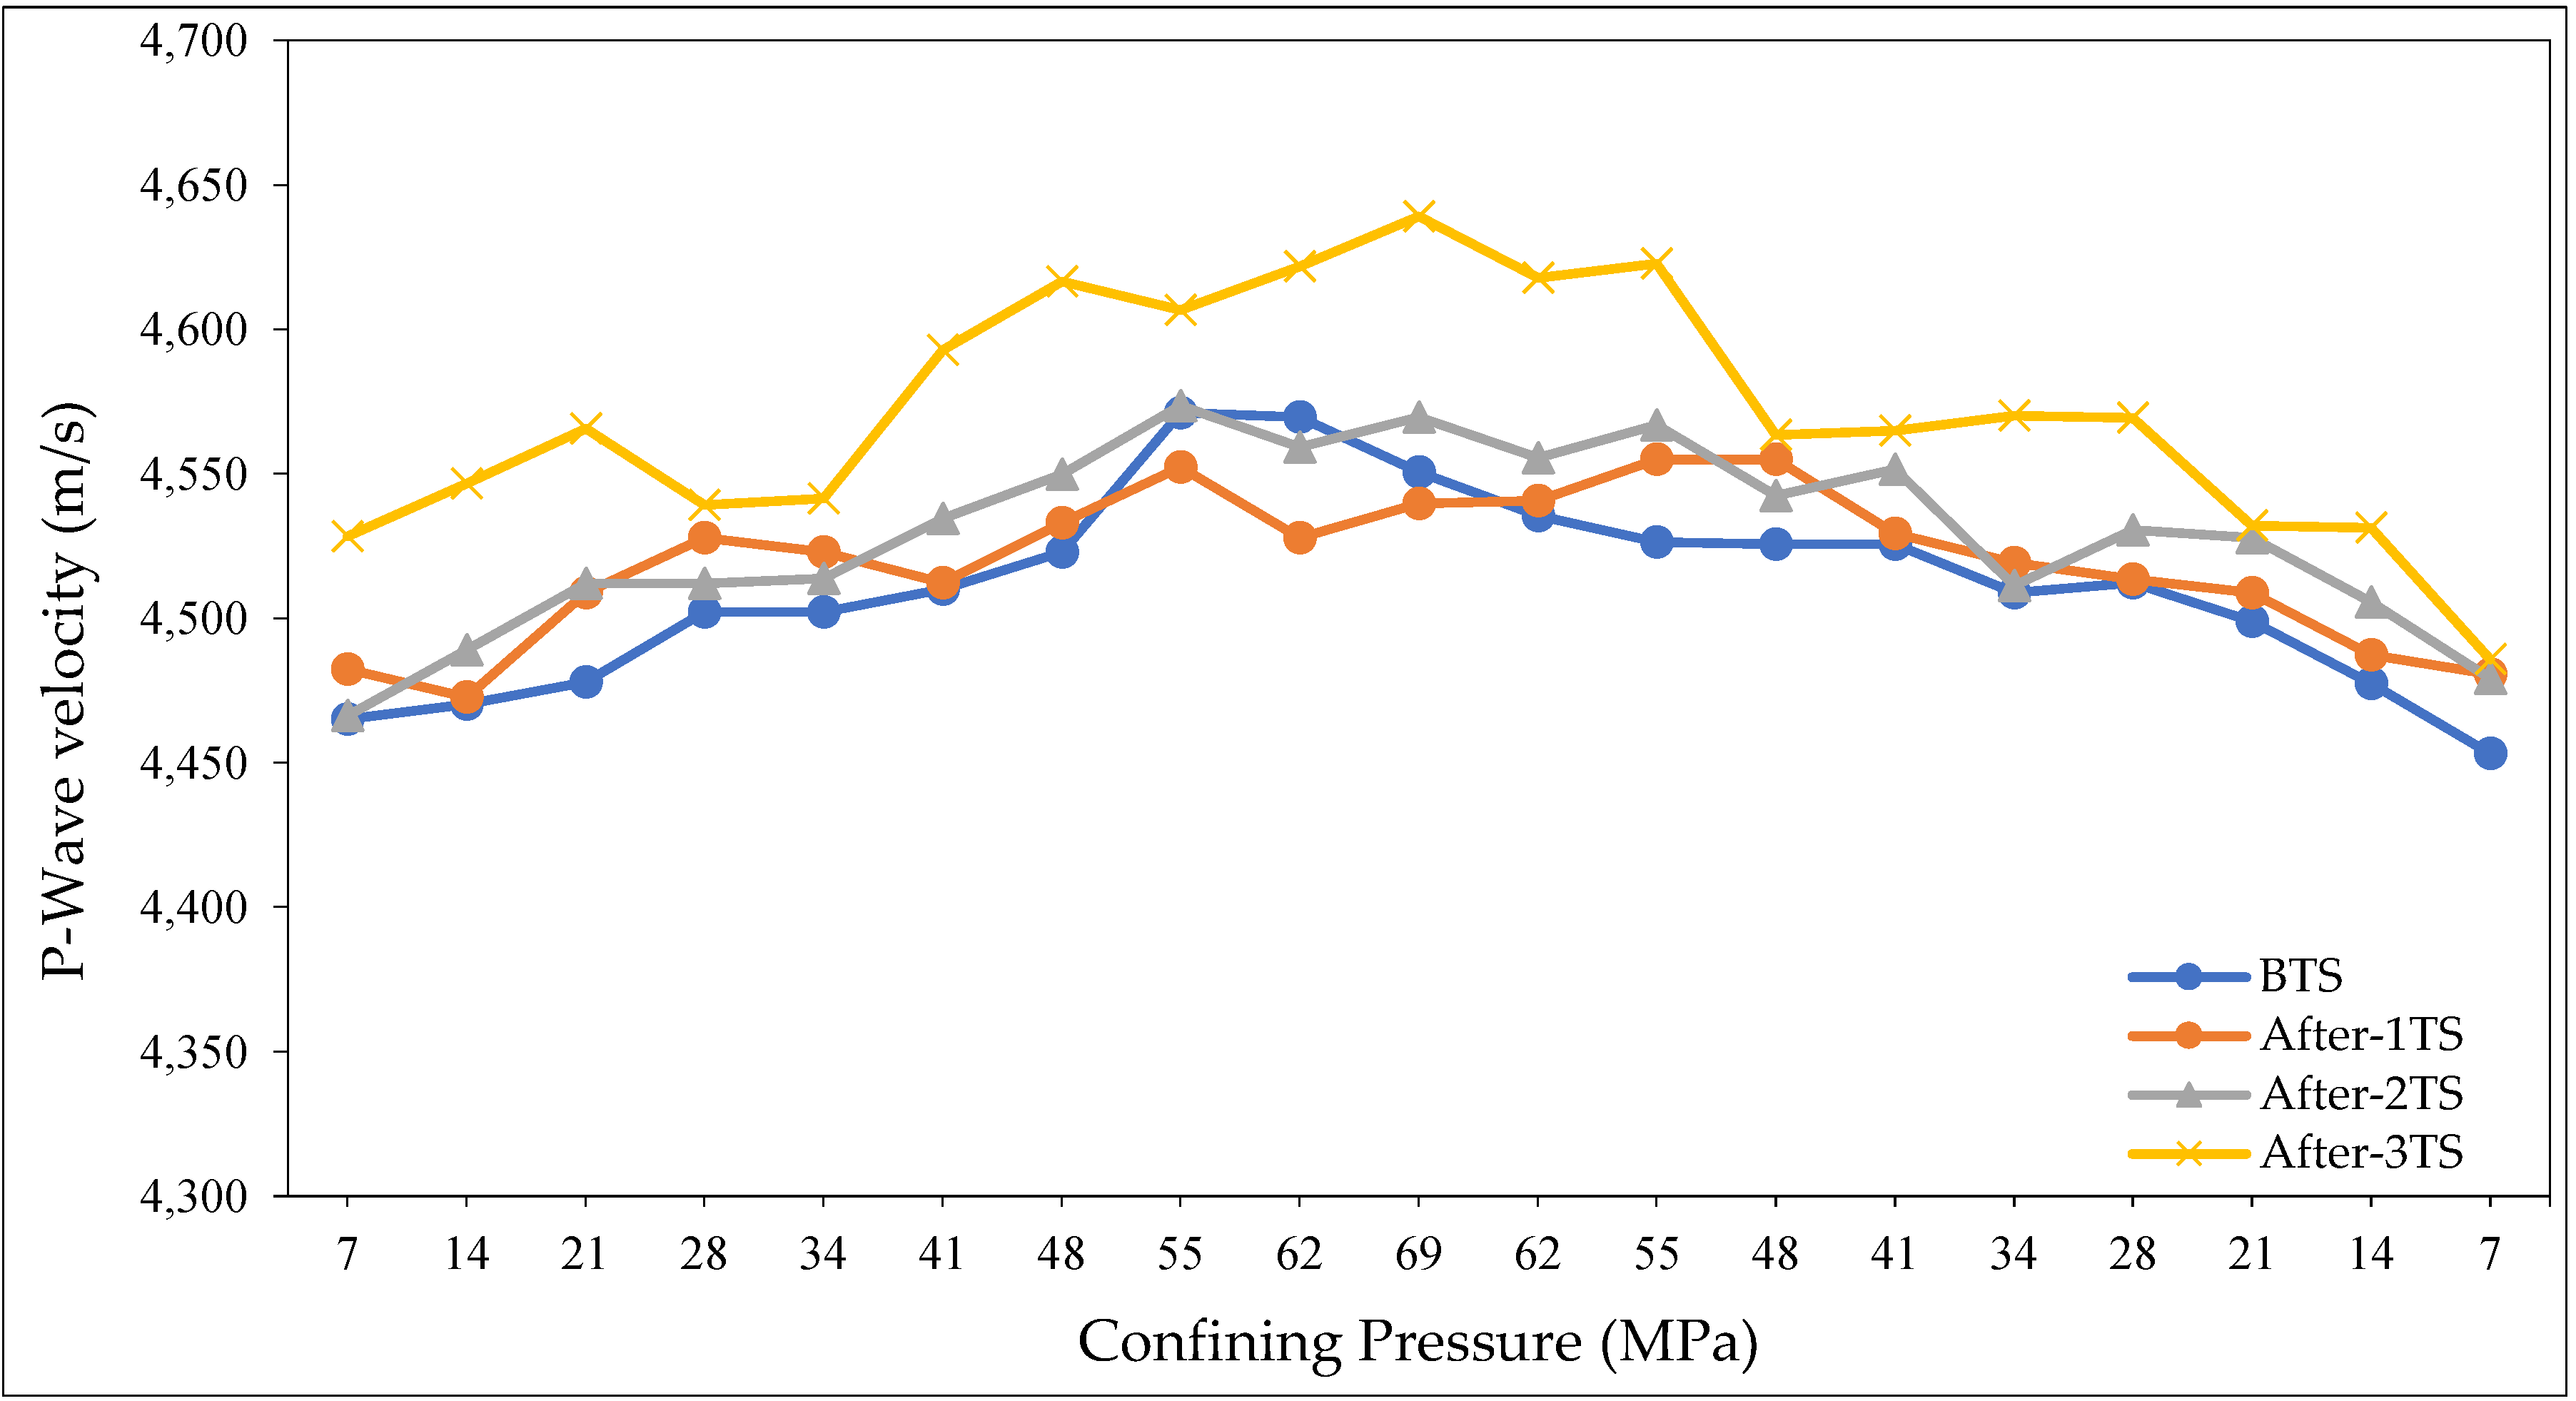
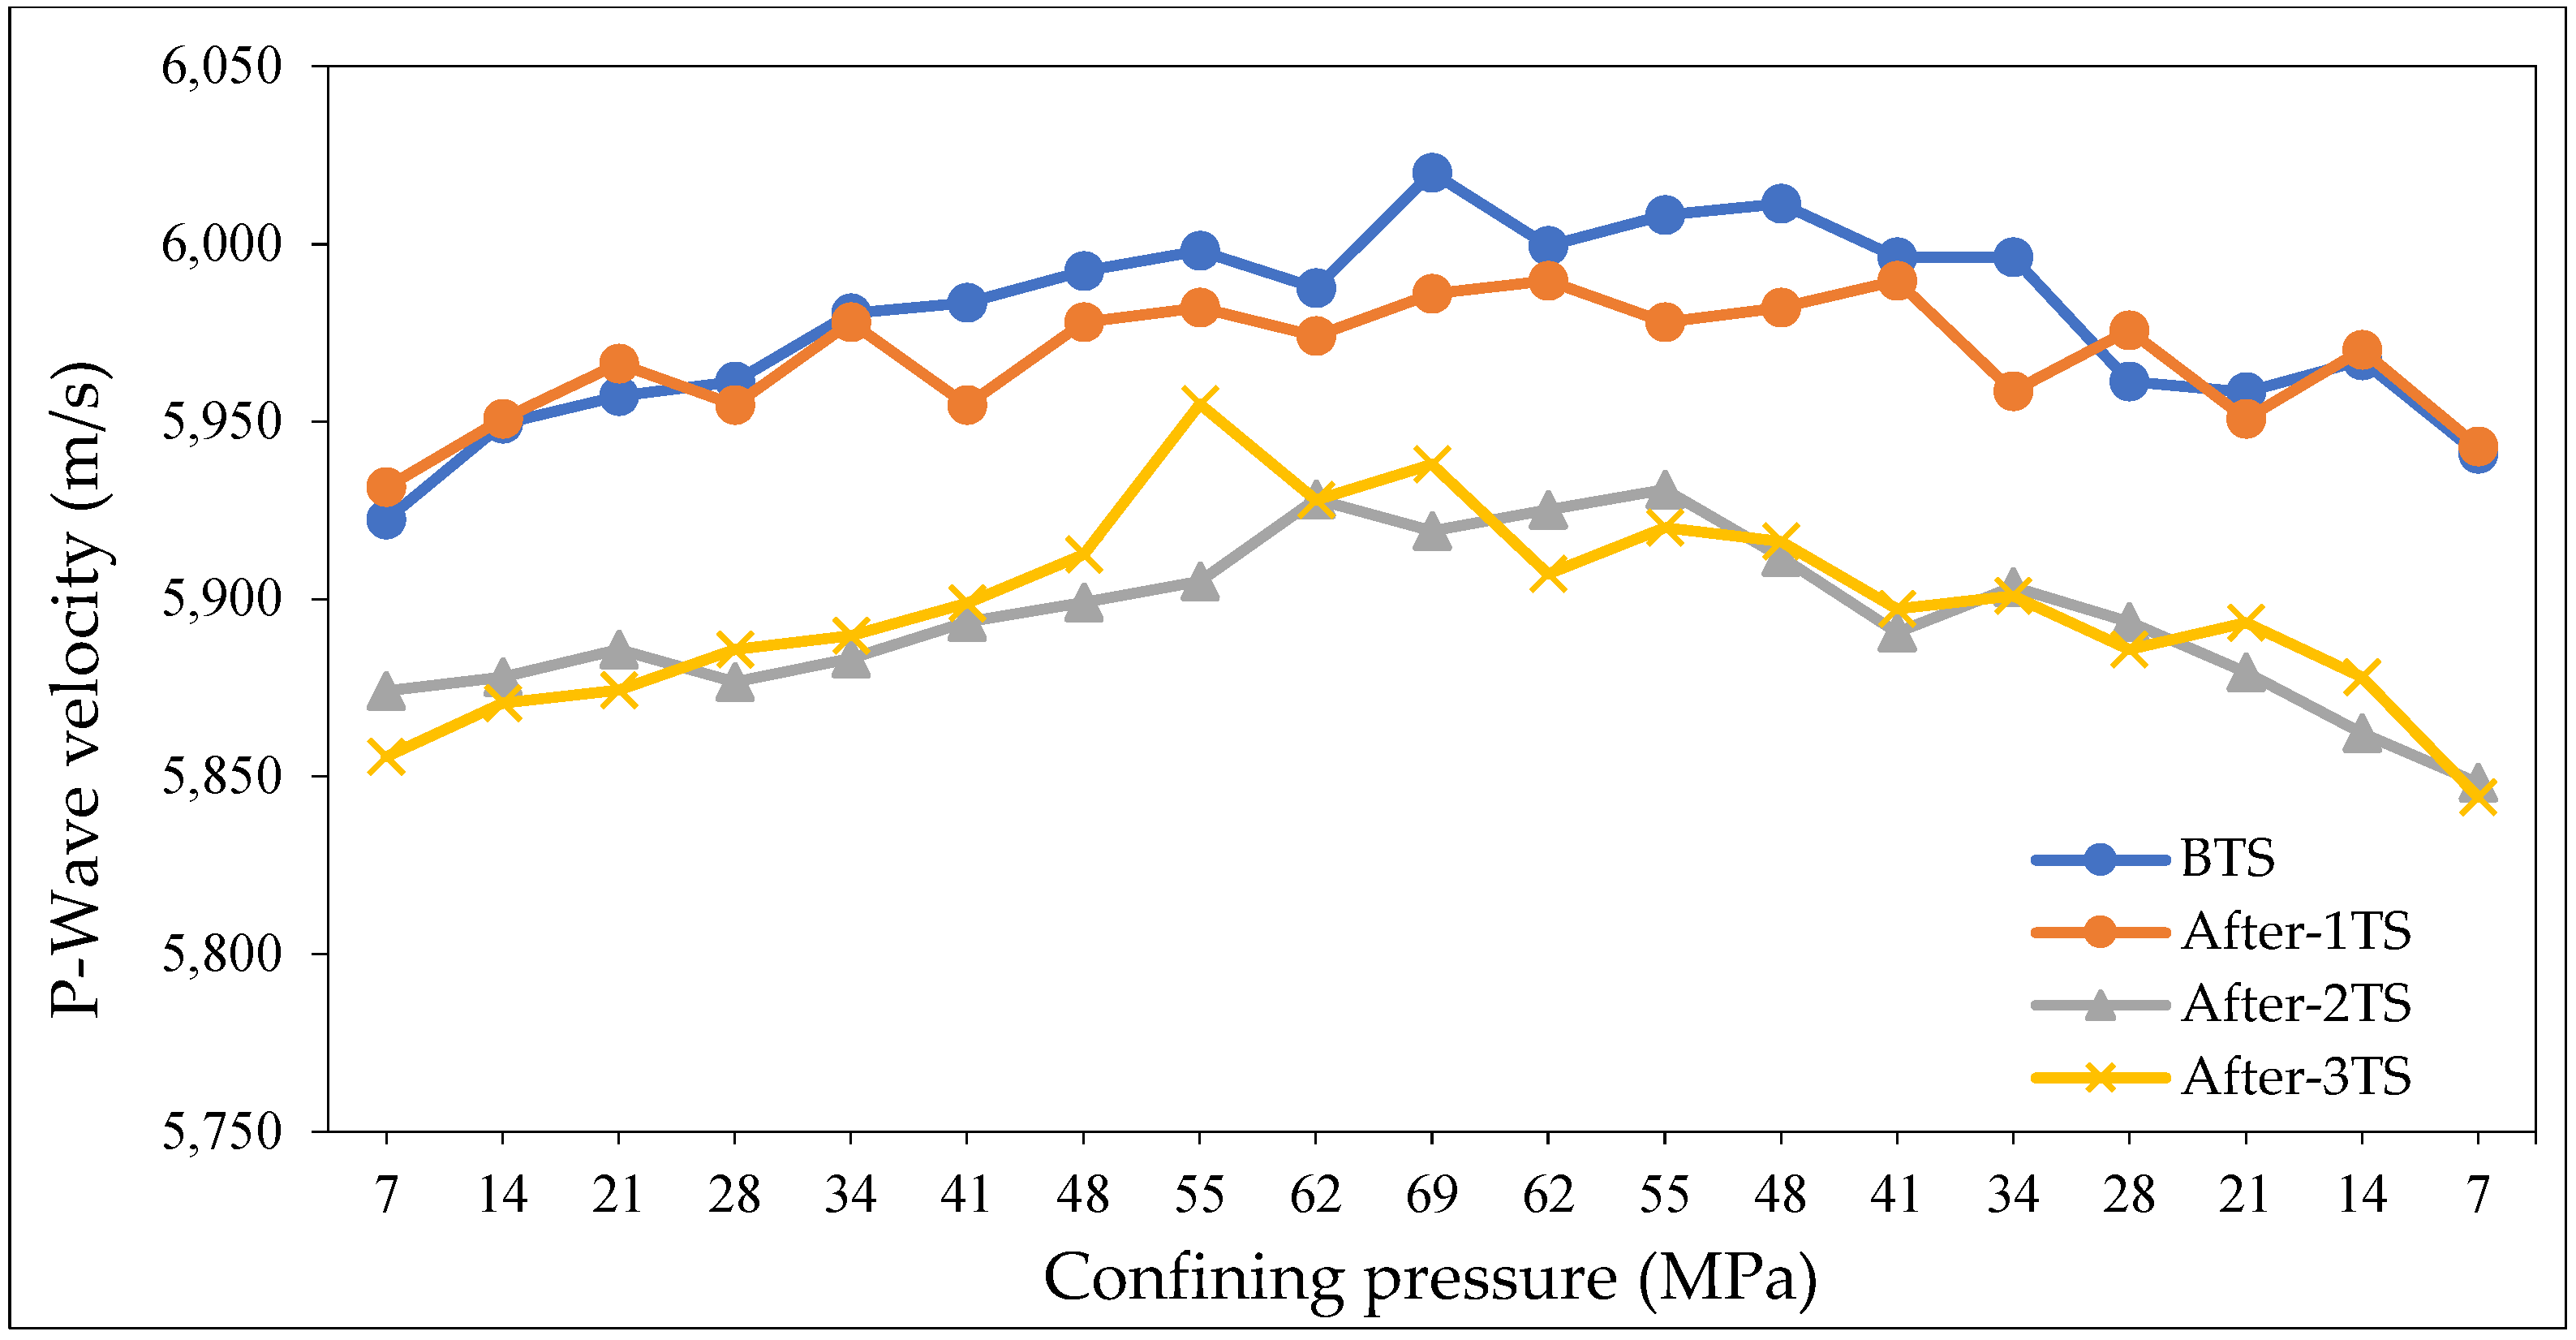
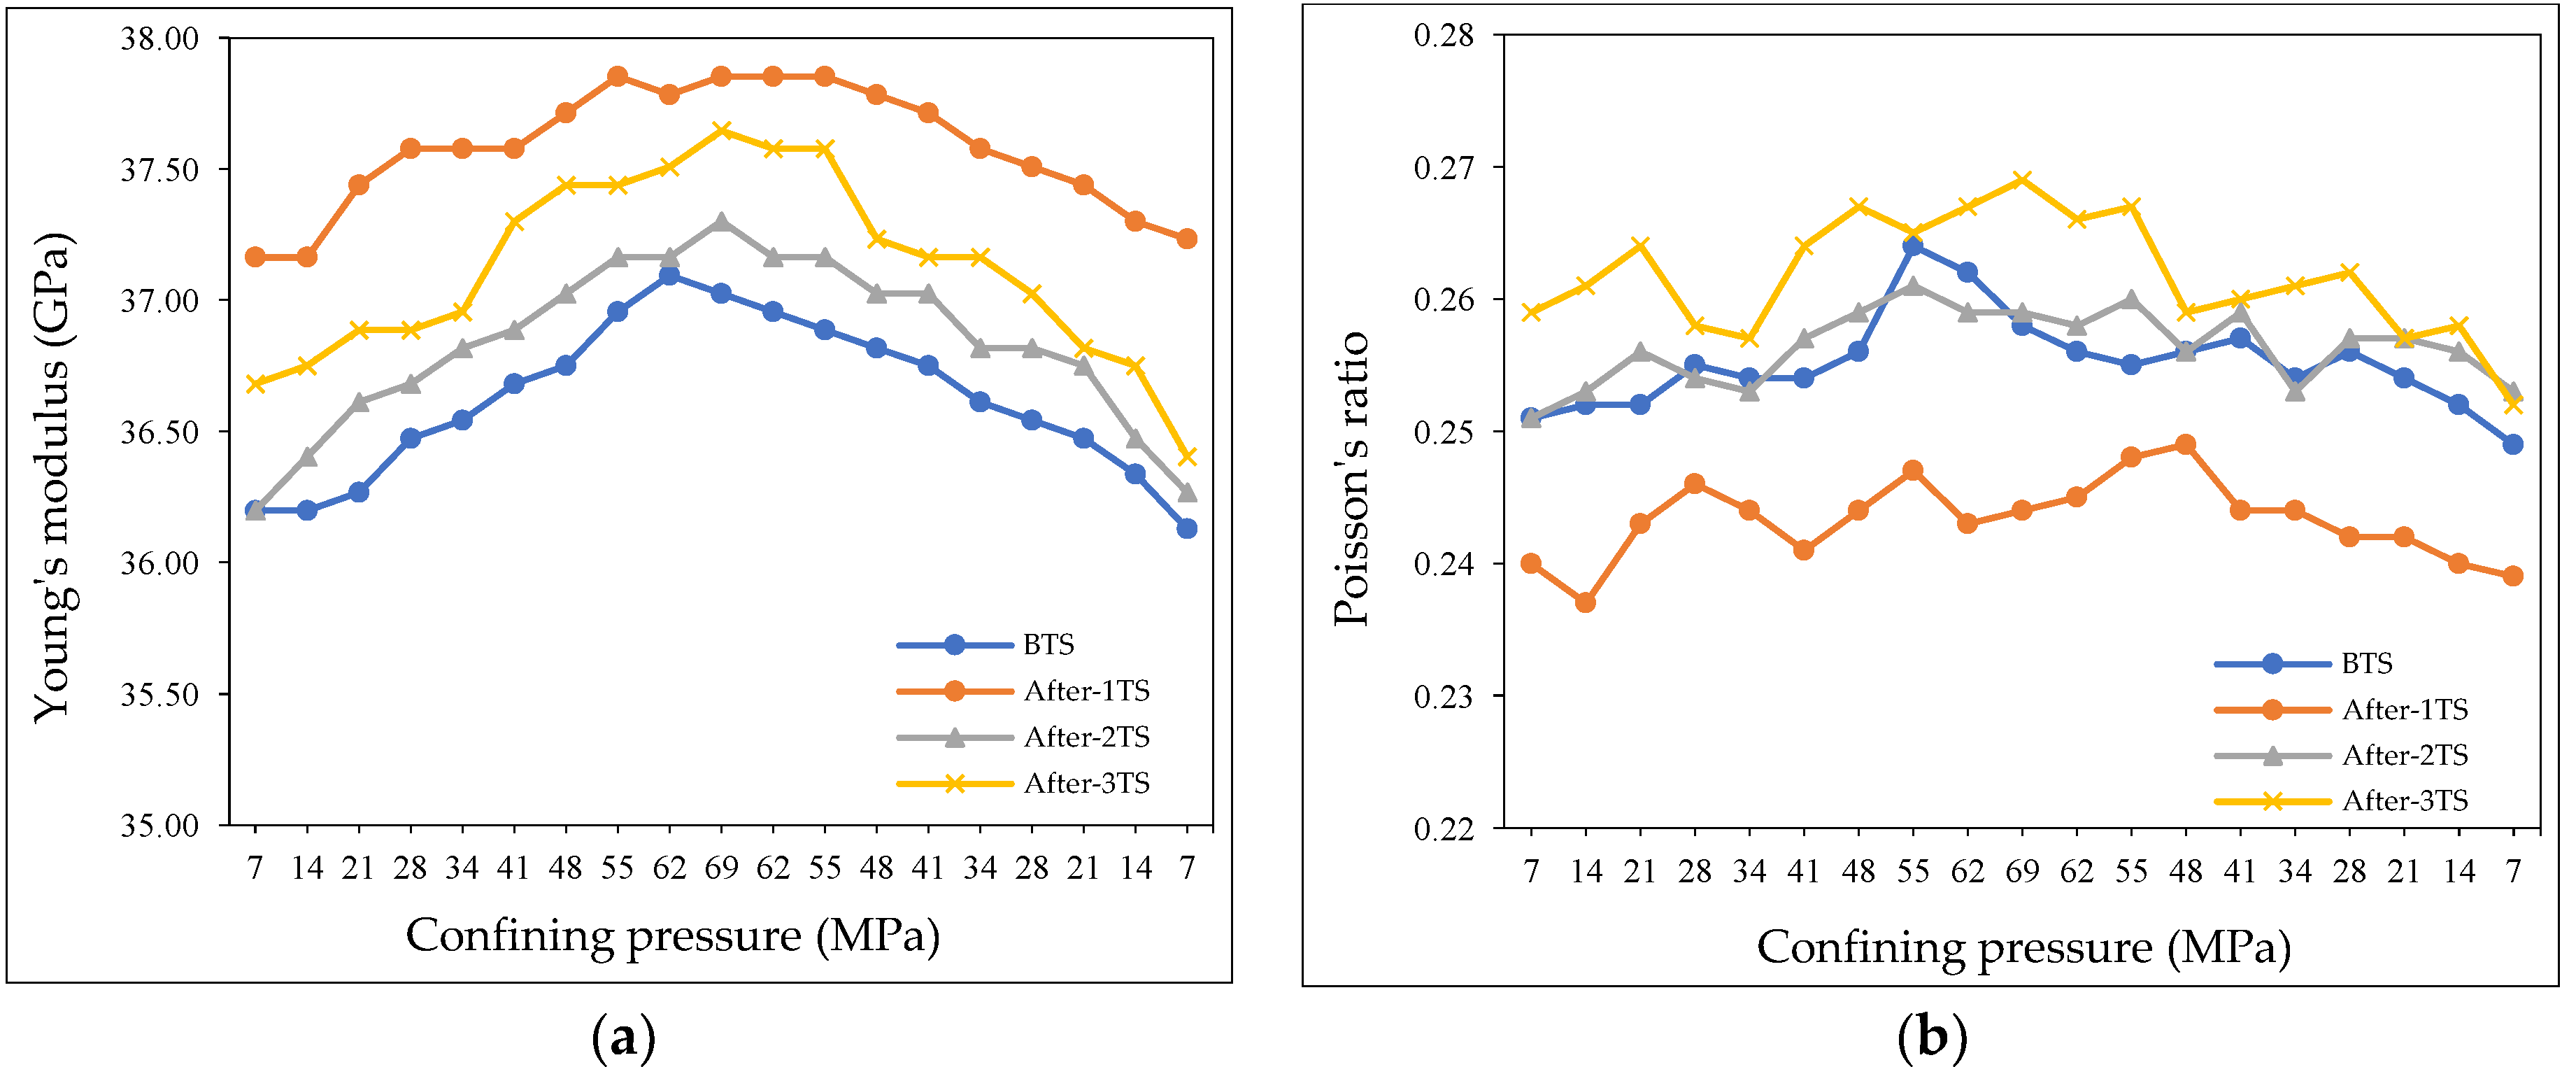
3.3. Axial Velocity Test Results
4. Conclusions
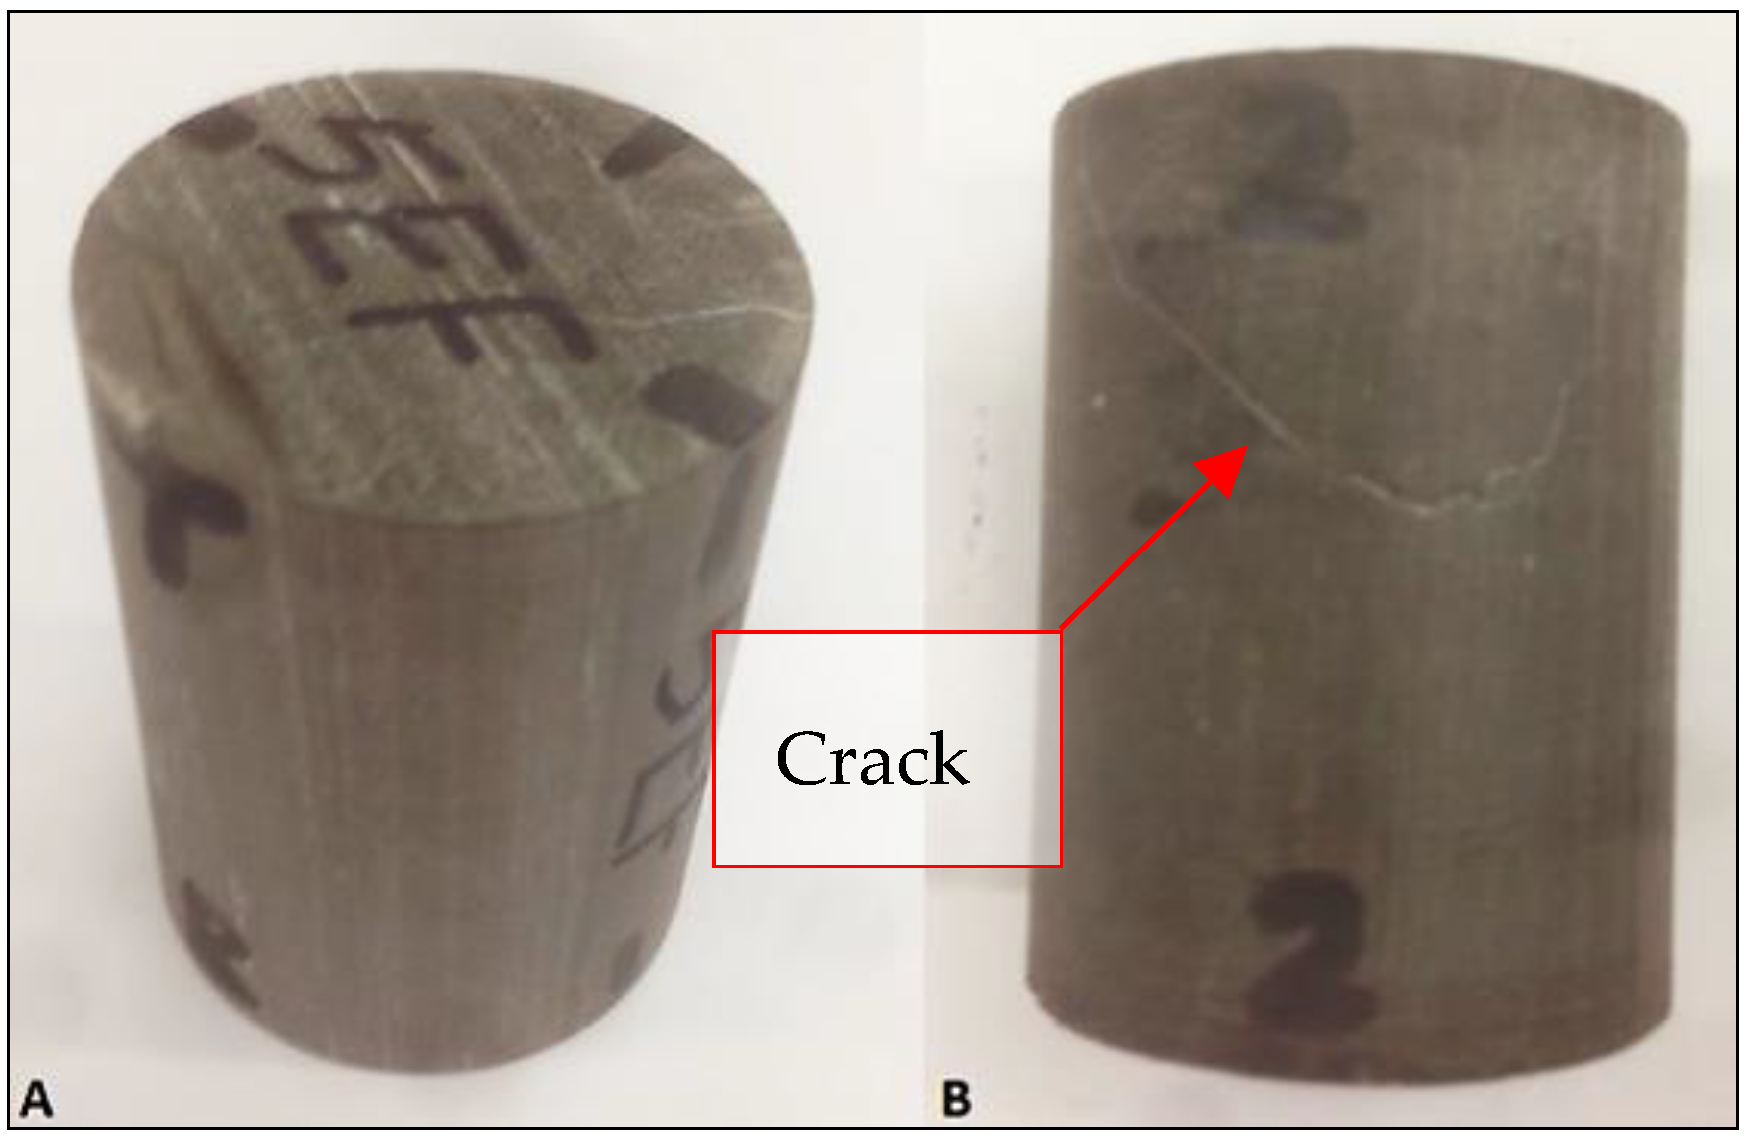
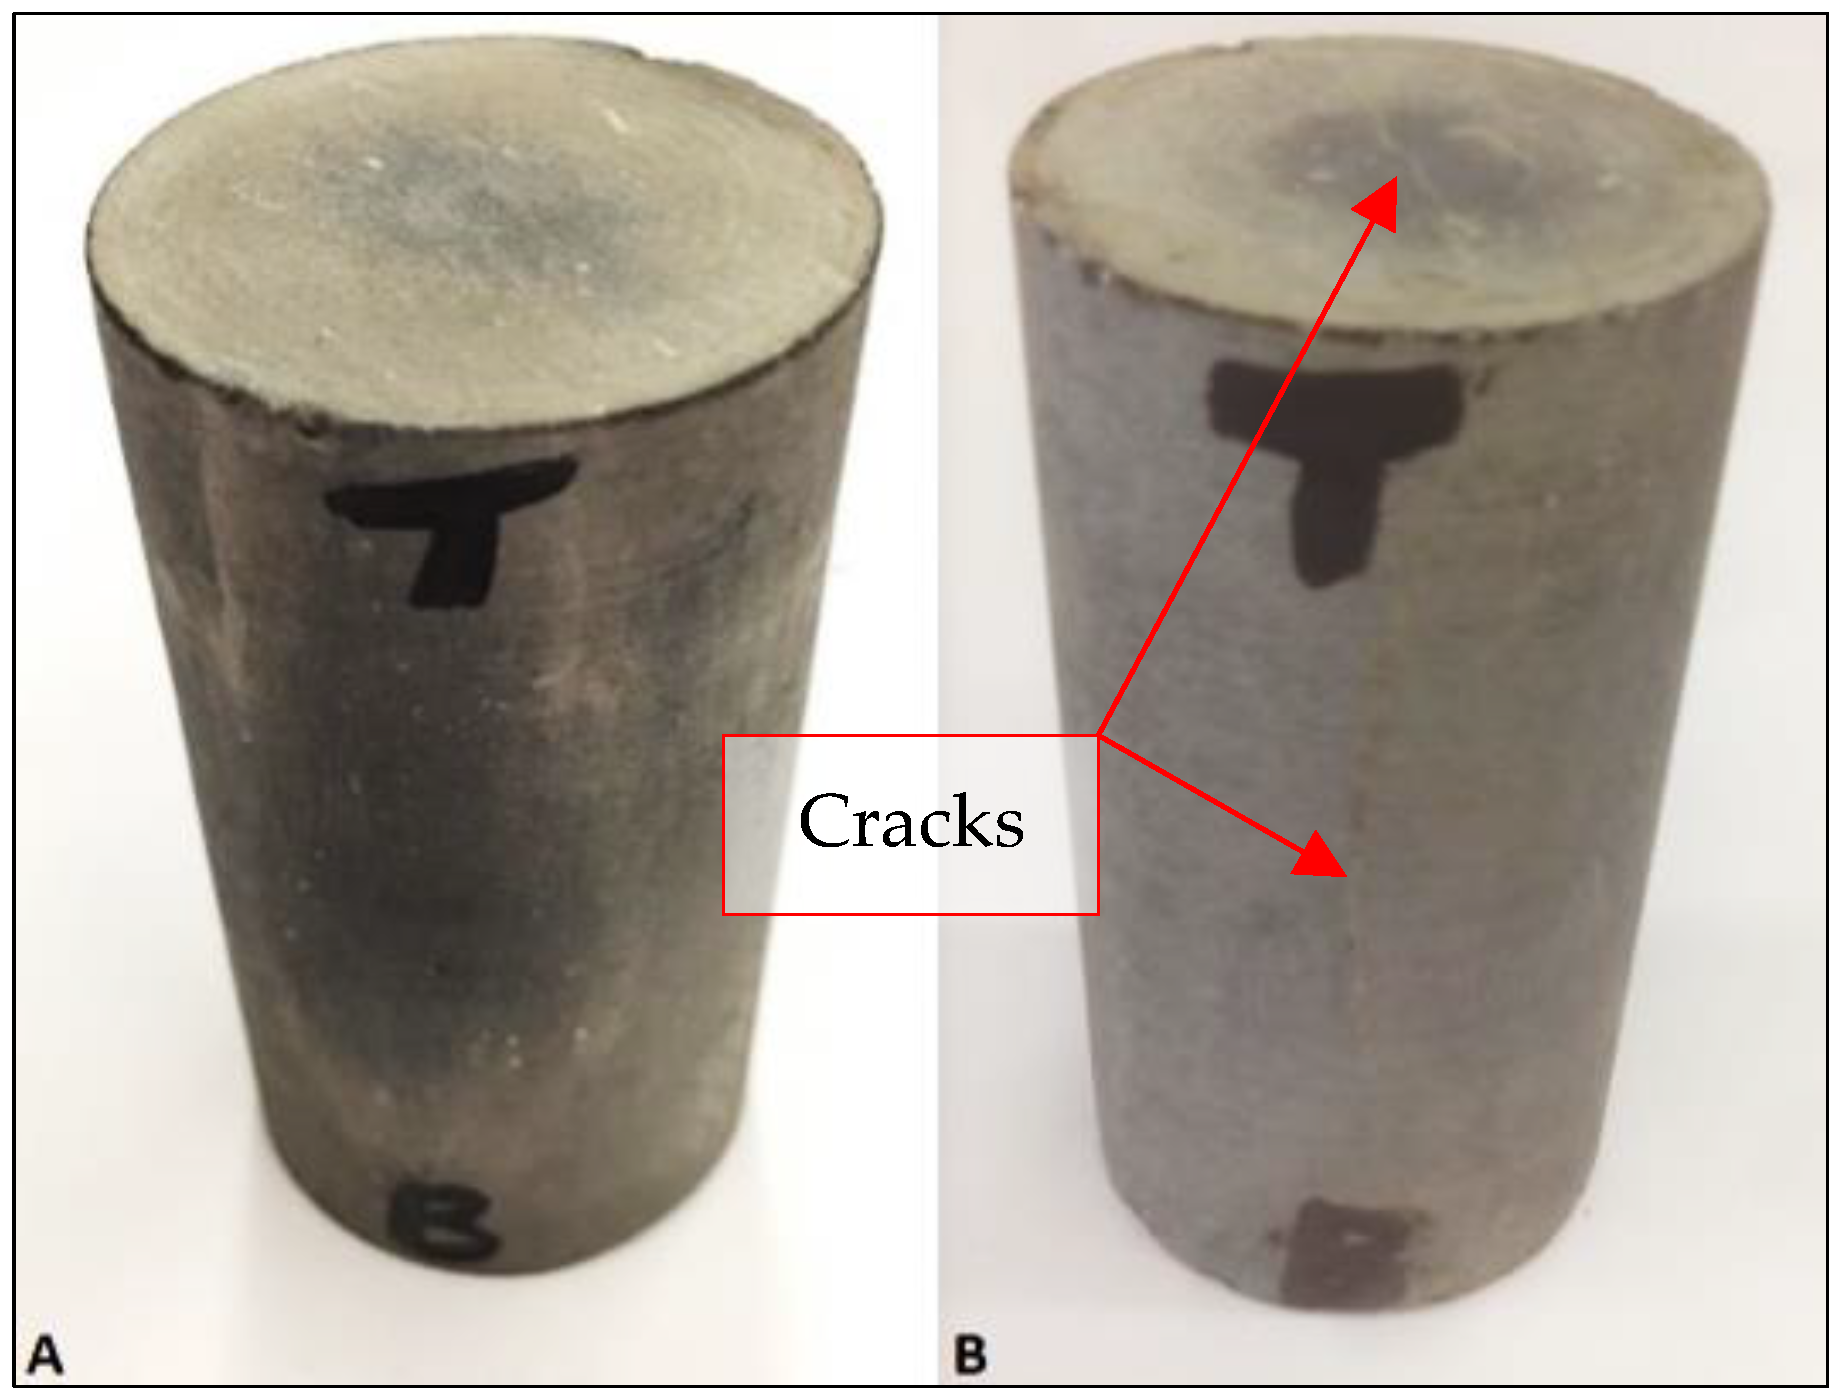
- The results strongly suggest that the thermal shocking produced cracks. The porosity increased by between 1.34% and 14.3%, the permeability increased by between 17.4% and 920%, and the average P-wave velocity decreased by up to 100 m/s.
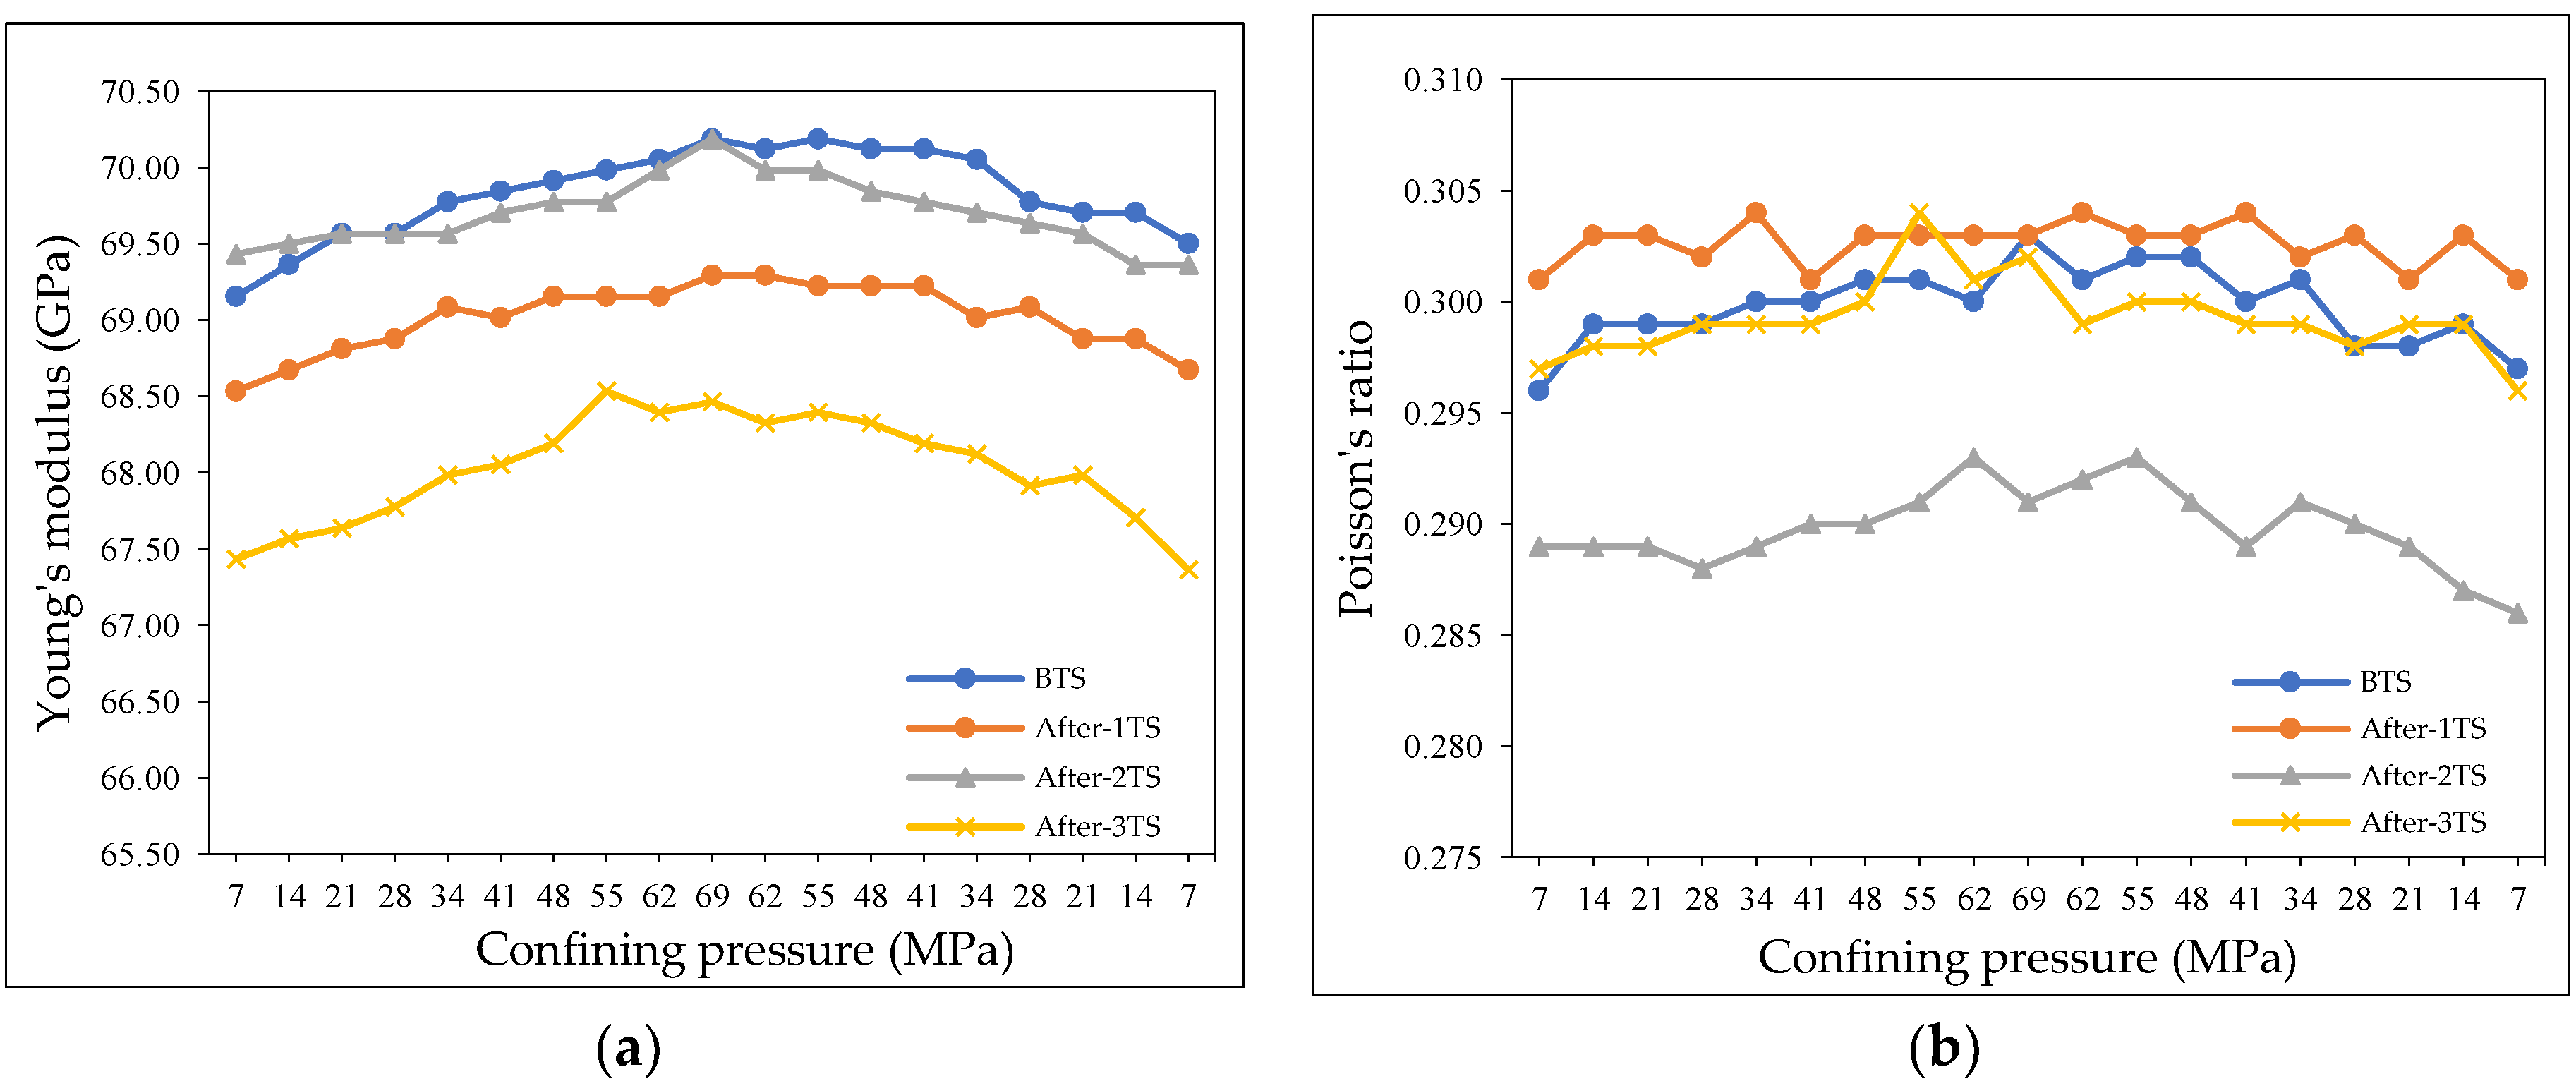
- Young’s modulus increased by between 0.5 GPa and 2 GPa, and the poison’s ratio decreased by between 0.01 and 0.02.
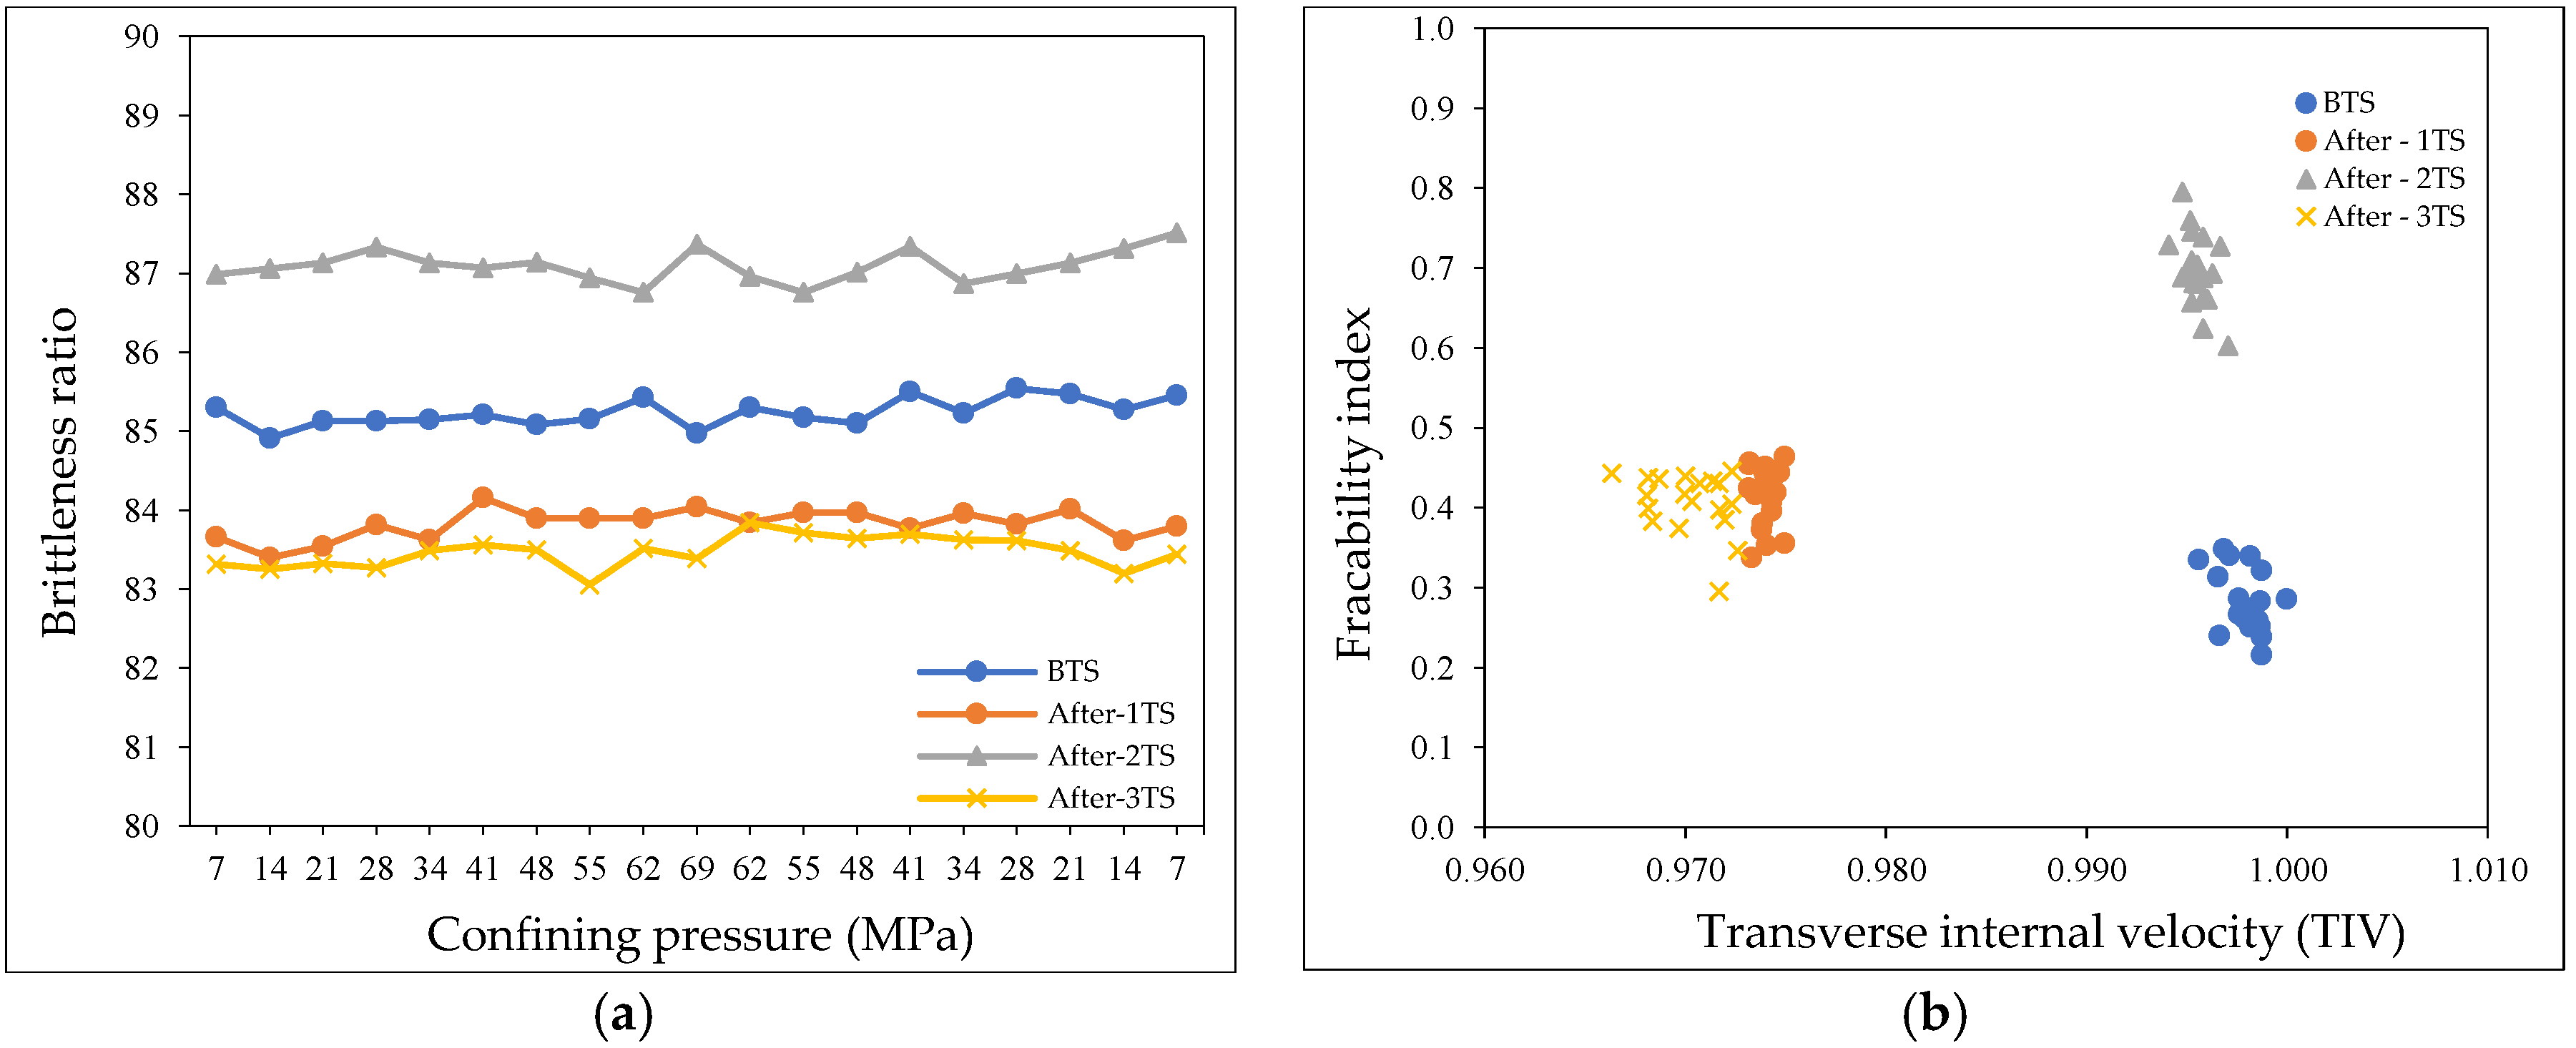
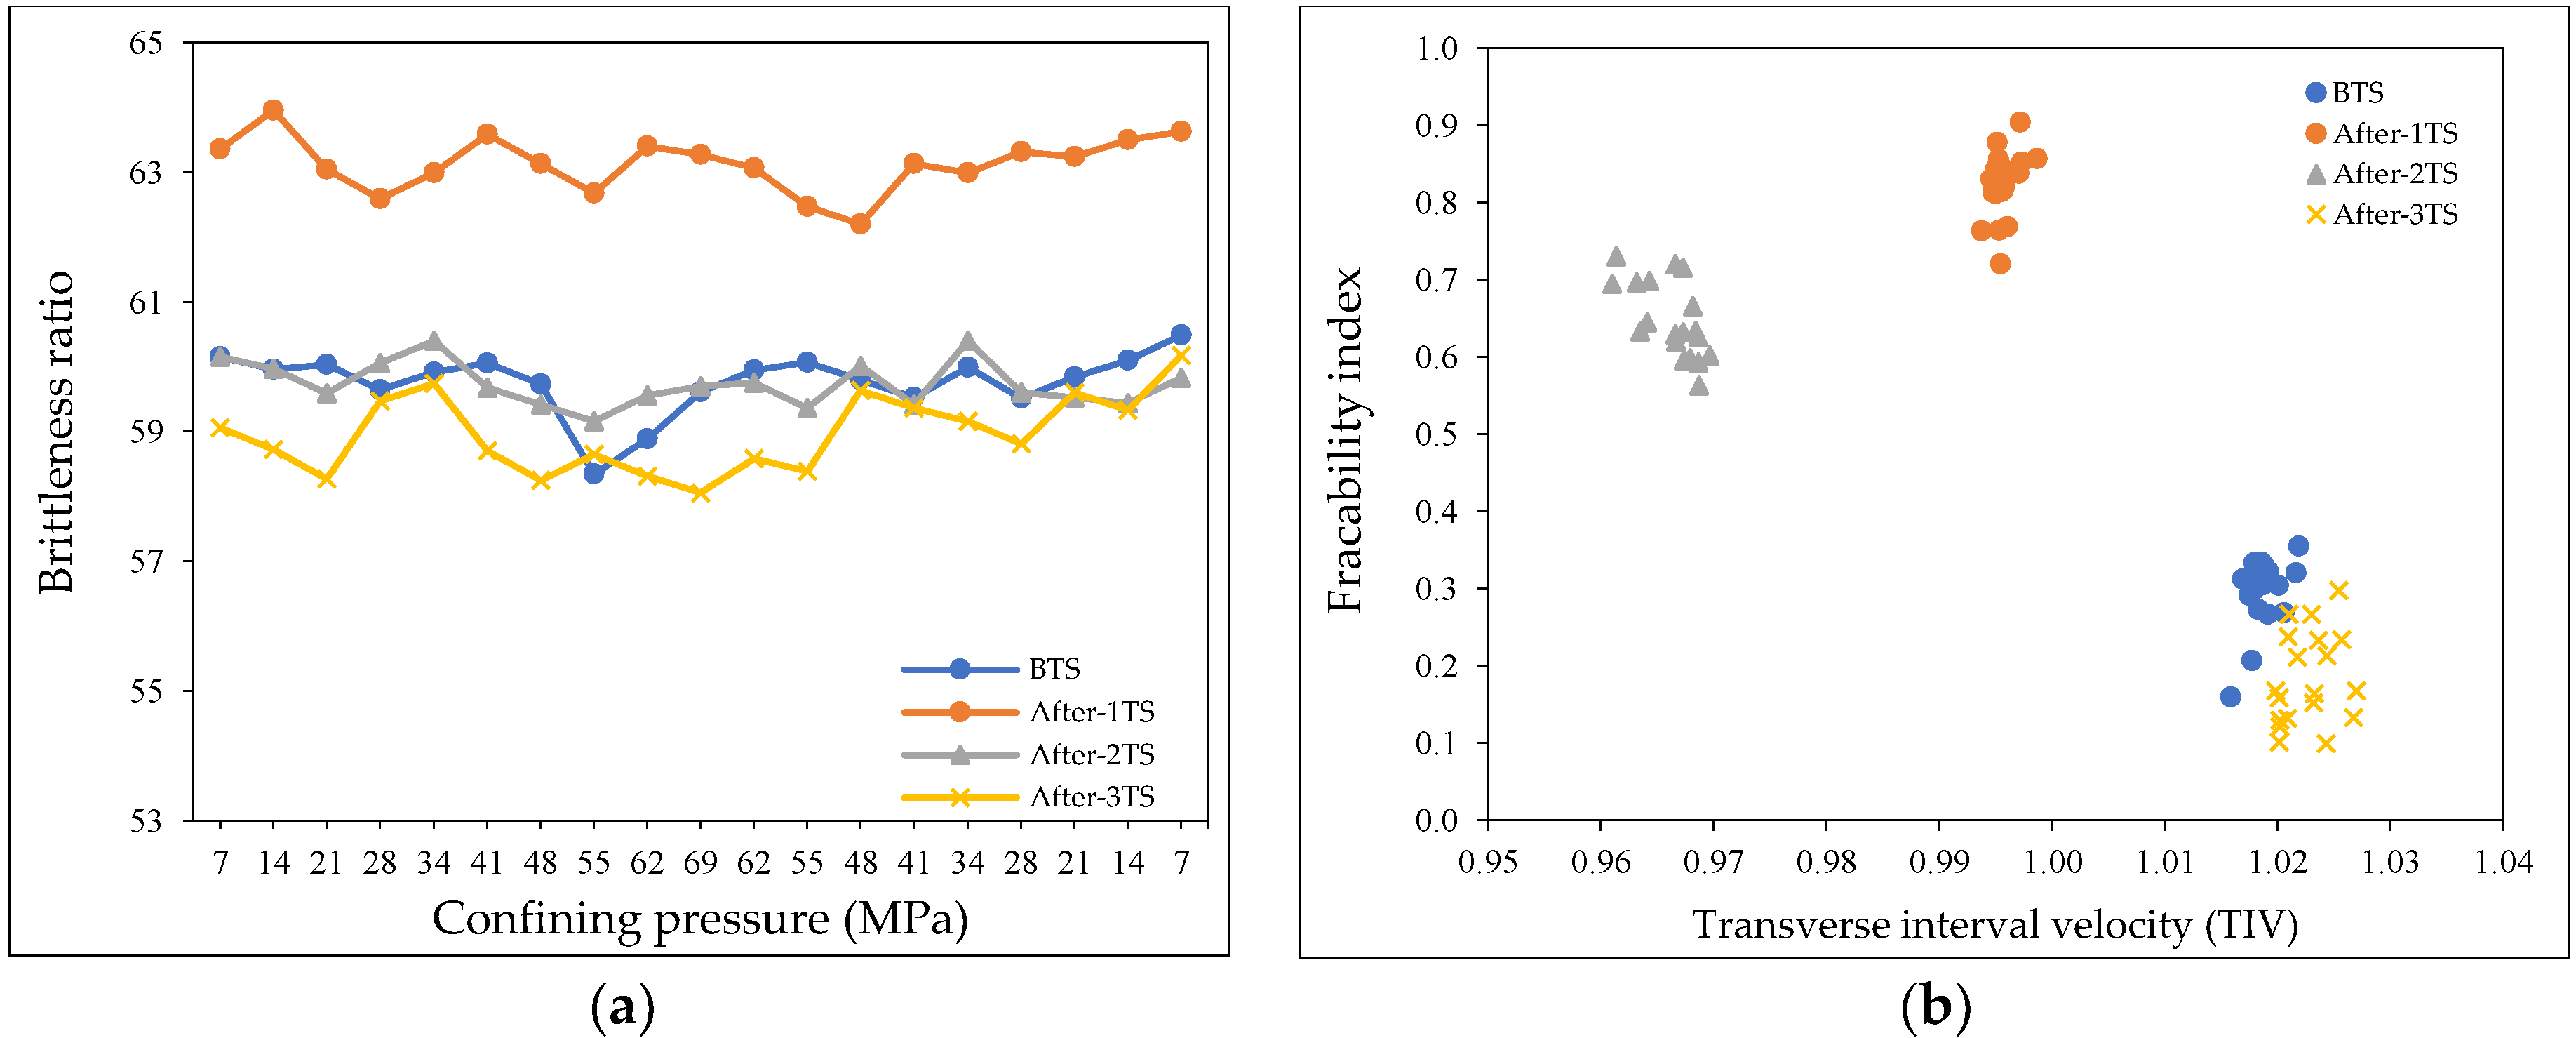
- From the reduction in P-wave velocity and the changes in Young’s modulus and Poison’s ratio, it was determined that the brittleness ratio increased by between 2 and 4 and the fracability index increased by between 0.2 and 0.8.
- Optimum number of thermal shock cycles varies from one formation to another, depending on the mineralogy and rock type. The results showed that EF#5 became more brittle after 1st thermal shock, whereas brittleness of SH#5 increased after completing the second thermal shock.
- The results of this experimental study demonstrated that thermal shock technique may be used as an effective method to enhance the porosities and permeabilities of unconventional reservoirs, and thus minimize formation damage.
- Cryogenic fracturing (thermal shocking with cold fluid) could be used in the future to improve oil/gas recovery from unconventional reservoirs.
Author Contributions
Funding
Conflicts of Interest
References
- Gutierrez, G.; Ramirez, L.; Sierra, J.R.; Medina, E.; Gutierrez, L.J.; Salguero, J. Improvements in Multistage Fracturing, Remolino Field, Mexico. In Proceedings of the SPE Hydraulic Fracturing Technology Conference, The Woodlands, TX, USA, 4–6 February 2014. [Google Scholar]
- Janszen, M.; Bakker, T.; Zitha, P.L.J. Hydraulic Fracturing in the Dutch Posedonia Shale. In Proceedings of the SPE European Formation Damage Conference and Exhibition, Budapest, Hungary, 3–5 June 2015. [Google Scholar]
- Ajayi, B.T.; Walker, K.J.; Wutherich, K.; Sink, J. Channel Hydraulic Fracturing and Its Applicability in the Marcellus Shale. In Proceedings of the SPE Eastern Regional Meeting, Columbus, OH, USA, 17–19 August 2011. [Google Scholar]
- Morsy, S.; Sheng, J.J.; Soliman, M.Y. Improving Hydraulic Fracturing of Shale Formations by Acidizing. In Proceedings of the SPE Eastern Regional Meeting, Pittsburgh, PA, USA, 20–22 August 2013. [Google Scholar]
- Morsy, S.; Gomaa, A.; Sheng, J.J. Improvement of Eagle Ford Shale Formations Water Imbibition by Mineral Dissolution and Wettability Alteration. In Proceedings of the SPE Unconventional Resources Conference, The Woodlands, TX, USA, 1–3 April 2014. [Google Scholar]
- Finnie, I.; Cooper, J.; Berlie, J. Fracture Propagation in Rock by Transient Cooling. Int. J. Rock Mech. Min. Sci. 1979, 16, 11–21. [Google Scholar] [CrossRef]
- Geyer, J.F.; Nemat-Nasser, S. Experimental Investigation of Thermally Induced Interacting Cracks in Brittle Solids. Int. J. Solids Struct. 1982, 18, 349–356. [Google Scholar] [CrossRef]
- Grundmann, S.; Rodvelt, G.; Dials, G.; Allen, R. Cryogenic Nitrogen as a Hydraulic Fracturing Fluid in the Devonian Shale. In Proceedings of the SPE Eastern Regional Meeting, Pittsburgh, PA, USA, 9–11 November 1998. [Google Scholar]
- Kim, K.; Kemeny, J. Effect of Thermal Shock and Rapid Unloading on Mechanical Rock Properties. In Proceedings of the 43rd U.S. Rock Mechanics Symposium, Asheville, NC, USA, 28 June–1 July 2009. [Google Scholar]
- Kocabas, I. An Analytical Model of Temperature and Stress Fields During Cold-Water Injection into an Oil Reservoir. In Proceedings of the SPE International Conference and Exhibition, Abu Dhabi, UAE, 10–13 October 2004. [Google Scholar]
- Tarasovs, S.; Ghassemi, A. Propagation of a System of Cracks Under Thermal Stress. In Proceedings of the 45th U.S. Rock Mechanics/Geomechanics Symposium, San Francisco, CA, USA, 26–29 June 2011. [Google Scholar]
- Kumar, D.; Gutierrez, M. Effects of Temperature on Two-Dimensional Hydraulic Fracturing in Impermeable Rocks. In Proceedings of the 45th U.S. Rock Mechanics/Geomechanics Symposium, San Francisco, CA, USA, 26–29 June 2011. [Google Scholar]
- Tran, D.; Settari, A.; Nghiem, L. Initiation and Propagation of Secondary Cracks in Thermo-Poroelastic Media. In Proceedings of the 46th U.S. Rock Mechanics/Geomechanics Symposium, Chicago, IL, USA, 24–27 June 2012. [Google Scholar]
- Alqahtani, N. Experimental Study and Finite Element Modeling of Cryogenic Fracturing in Unconventional Reservoirs. Ph.D. Thesis, Colorado School of Mines, Golden, CO, USA, 2015. [Google Scholar]
- Zhao, B.; Zhang, G.; Lin, Q. The Application of Cryogenic Treatment during Refracture Process—Laboratory Studies. In Proceedings of the 50th U.S. Rock Mechanics/Geomechanics Symposium, Houston, TX, USA, 26–29 June 2016. [Google Scholar]
- Yao, B.; Wang, L.; Patterson, T.; Kneafsey, T.J.; Yin, X.; Wu, Y. Experimental Study and Modeling of Cryogenic Fracturing Treatment of Synthetic Rock Samples Using Liquid Nitrogen under Tri-Axial Stresses. In Proceedings of the SPE Unconventional Resources Conference, Calgary, AB, Canada, 15–16 February 2017. [Google Scholar]
- Carpenter, C. Cryogenic-Fracturing Treatment of Synthetic-Rock with Liquid Nitrogen. J. Pet. Technol. 2017, 69, 70–71. [Google Scholar] [CrossRef]
- Cha, M.; Alqahtani, N.B.; Yao, B.; Yin, X.; Kneafsey, T.J.; Wang, L.; Miskimins, J.L. Cryogenic Fracturing of Wellbores Under True Triaxial-Confining Stresses: Experimental Investigation. SPE J. 2018. [Google Scholar] [CrossRef]
- Wang, L.; Yao, B.; Cha, M.; Alqahtani, N.B.; Patterson, T.W.; Kneafsey, T.J.; Miskimins, J.L.; Yin, X.; Wu, Y.S. Waterless Fracturing Technologies for Unconventional Reservoirs-Opportunities for Liquid Nitrogen. J. Nat. Gas Sci. Eng. 2016, 35, 160–174. [Google Scholar] [CrossRef]
- Smith, D. Methods and Apparatus to Enhance Oil Recovery in Wells. Available online: https://patents.google.com/patent/US8490696B2/en (accessed on 15 January 2014).
- Kemeny, J.; Apted, M.; Martin, D. Rockfall at Yucca Mountain due to Thermal, Seismic and Time-Dependance. In Proceedings of the 11th International High Level Radioactive Waste Management, Las Vegas, NV, USA, 30 April–4 May 2006. [Google Scholar]
- Glamheden, R.; Lindblom, U. Thermal and Mechanical Behavior of Refrigerated Caverns in Hard Rock. Tunn. Undergr. Space Technol. 2002, 17, 341–353. [Google Scholar] [CrossRef]
- Bellopede, R.; Ferrero, A.; Manfredotti, L.; Marini, P.; Migliazza, M. The Effect of Thermal Stresses on the Mechanical Behavior of Natural Building Stones. In Fracture and Failure of Natural Building Stones; Springer: Dordrecht, The Netherlands, 2006; pp. 397–425. ISBN 978-1-4020-5077-0. [Google Scholar]
- Yavuz, H.; Altindag, R.; Sarac, S.; Ugur, I.; Sengun, N. Estimating the Index Properties of Deteriorated Carbonate Rocks due to Freeze-Thaw and Thermal Shock Weathering. Int. J. Rock Mech. Min. Sci. 2006, 43, 767–775. [Google Scholar] [CrossRef]
- Kingery, W.D. Factors Affecting Thermal Stress Resistance of Ceramic Materials. J. Am. Ceram. Soc. 1955, 38, 3–15. [Google Scholar] [CrossRef]
- Kim, K.M.; Kemeny, J. Effect of Thermal Loading on Compressional Wave Velocity, Mode I Fracture Toughness and Tensile Strength. In Proceedings of the 42nd U.S. Rock Mechanics Symposium, San Francisco, CA, USA, 29 June–2 July 2008. [Google Scholar]
- Enayatpour, S.; Patzek, T. Thermal Shock in Reservoir Rock Enhances the Hydraulic Fracturing of Gas Shales. In Proceedings of the Unconventional Resources Technology Conference, Denver, CO, USA, 12–14 August 2013. [Google Scholar]
- Wang, X.; Schubnel, A.; Fortin, J.; Guéguen, Y.; Ge, H. Physical Properties and Brittle Strength of Thermally Cracked Granite Under Confinement. J. Geophys. Res. Solid Earth 2013, 118, 6099–6112. [Google Scholar] [CrossRef]
- Bai, M. Why Are Brittleness and Fracability Not Equivalent In Designing Hydraulic Fracturing In Tight Shale Gas Reservoirs. Petroleum 2016, 2, 1–19. [Google Scholar] [CrossRef]
- Boitnott, G.N. Use of Complex Pore Pressure Transients to Measure Permeability of Rocks. In Proceedings of the SPE Annual Technical Conference and Exhibition, San Antonio, TX, USA, 5–8 October 1997. [Google Scholar]
- Rickman, R.; Mullen, M.; Petre, E.; Grieser, B.; Kundert, D. A Practical Use of Shale Petrophysics for Stimulation Design Optimization: All Shale Plays Are Not Clones of the Barnett Shale. In Proceedings of the SPE Annual Technical Conference and Exhibition, Denver, CO, USA, 21–24 September 2008. [Google Scholar]
- Buller, D.; Hughes, S.; Market, J.; Petre, E.; Spain, D.; Odumosu, T. Petrophysical Evaluation for Enhancing Hydraulic Stimulation in Horizontal Shale Gas Wells. In Proceedings of the SPE Annual Technical Conference and Exhibition, Florence, Italy, 19–22 September 2010. [Google Scholar]
- Hardage, B. Fracture Identification and Evaluation Using S Waves. Available online: http://www.searchanddiscovery.com/documents/2011/40792hardage/images/hardage (accessed on 15 August 2011).


| Core Name | Length | Diameter | Bulk Volume (cm3) | Dry Bulk Density (g/cm3) |
|---|---|---|---|---|
| cm | cm | |||
| EF#5 | 5.12 | 3.81 | 58.42 | 2.18 |
| SH#5 | 7.62 | 3.78 | 85.72 | 2.59 |
| Method | Confining Pressure (MPa) | Pore Pressure (MPa) | Injected Gas | Core Holder Temperature (°C) |
|---|---|---|---|---|
| Complex transient (multi-pulse) | 13.8 | 6.89 | Helium | 21 |
| TS Cycles | Porosity (%) | Percent of Increase or Decrease (%) |
|---|---|---|
| BTS | 11.95 | - |
| After 1st TS | 12.11 | +1.34 |
| After 2nd TS | 12.43 | +2.64 |
| After 3rd TS | 12.38 | −0.4 |
| TS Cycles | Porosity (%) | Percent of Increase or Decrease (%) |
|---|---|---|
| BTS | 1.83 | - |
| After 1st TS | 1.74 | −4.92 |
| After 2nd TS | 1.99 | +14.3 |
| After 3rd TS | 1.93 | −3.01 |
| TS Cycles | Confining Pressure (MPa) | Pore Pressure (MPa) | Permeability (1019 m2) | Percent of Increase or Decrease (%) |
|---|---|---|---|---|
| BTS | 13.79 | 6.89 | 4.18 | - |
| After 1st TS | 5.55 | +32.7 | ||
| After 2nd TS | 6.52 | +17.4 | ||
| After 3rd TS | 4.75 | −27.1 |
| TS Cycles | Confining Pressure (MPa) | Pore Pressure (MPa) | Permeability (1019 m2) | Percent of Increase or Decrease (%) |
|---|---|---|---|---|
| BTS | 13.79 | 6.89 | 5.19 | - |
| After 1st TS | 4.19 | −19.2 | ||
| After 2nd TS | 42.80 | +920 | ||
| After 3rd TS | 1.47 | −96.5 |
© 2018 by the authors. Licensee MDPI, Basel, Switzerland. This article is an open access article distributed under the terms and conditions of the Creative Commons Attribution (CC BY) license (http://creativecommons.org/licenses/by/4.0/).
Share and Cite
Elwegaa, K.; Emadi, H. The Effect of Thermal Shocking with Nitrogen Gas on the Porosities, Permeabilities, and Rock Mechanical Properties of Unconventional Reservoirs. Energies 2018, 11, 2131. https://doi.org/10.3390/en11082131
Elwegaa K, Emadi H. The Effect of Thermal Shocking with Nitrogen Gas on the Porosities, Permeabilities, and Rock Mechanical Properties of Unconventional Reservoirs. Energies. 2018; 11(8):2131. https://doi.org/10.3390/en11082131
Chicago/Turabian StyleElwegaa, Khalid, and Hossein Emadi. 2018. "The Effect of Thermal Shocking with Nitrogen Gas on the Porosities, Permeabilities, and Rock Mechanical Properties of Unconventional Reservoirs" Energies 11, no. 8: 2131. https://doi.org/10.3390/en11082131
APA StyleElwegaa, K., & Emadi, H. (2018). The Effect of Thermal Shocking with Nitrogen Gas on the Porosities, Permeabilities, and Rock Mechanical Properties of Unconventional Reservoirs. Energies, 11(8), 2131. https://doi.org/10.3390/en11082131