Regional Energy, CO2, and Economic and Air Quality Index Performances in China: A Meta-Frontier Approach

Abstract
1. Introduction
2. Materials and Methods
2.1. Environmental Production Technology
2.2. Non-Radial Directional Distance Functions
2.3. Meta-Frontier Non-Radial Directional Distance Function
Technology Gap Ratio (TGR):
2.4. Urban Energy Environmental, CO2, AQI, and GDP Efficiencies
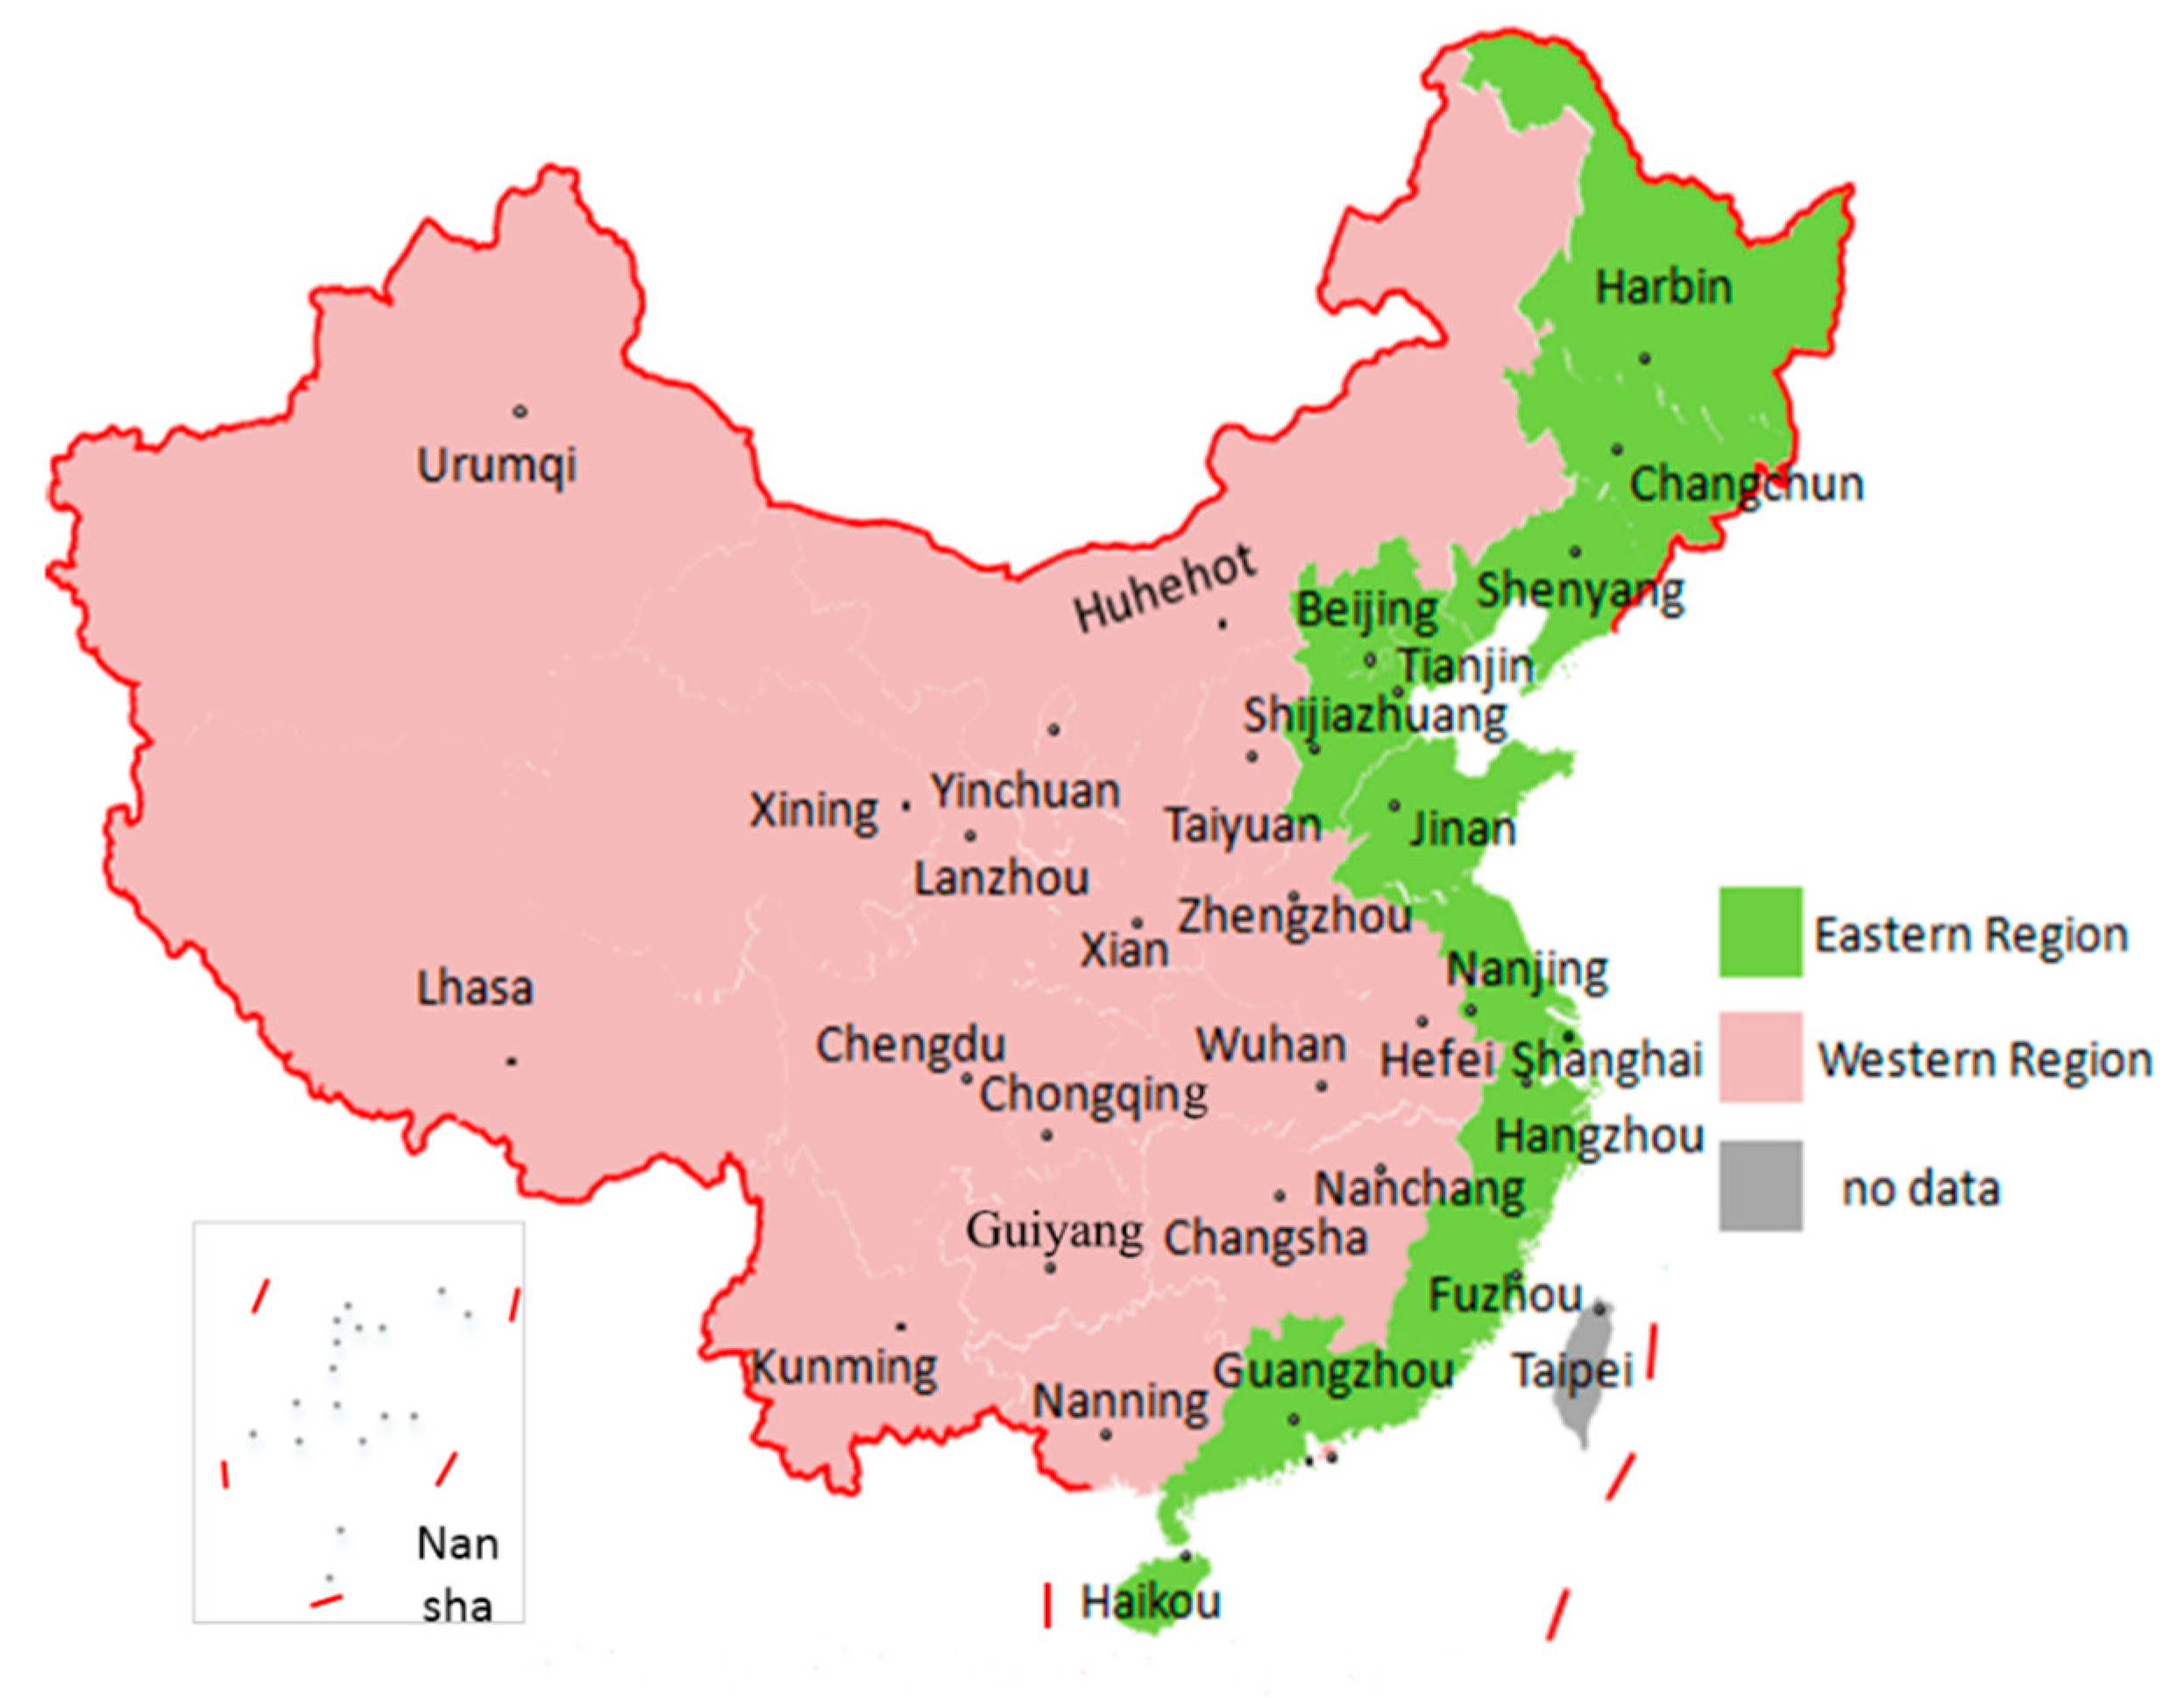
2.5. Data and Variables
2.5.1. Input Variables
2.5.2. Output Variable
2.5.3. Undesirable Output Variables
- Step 1:
- To compare the concentration limits of the various pollutants; the fine particulate matter (PM2.5), inhalable particulate matter (PM10), sulfur dioxide (SO2), nitrogen dioxide (NO2), ozone (O3), carbon monoxide (CO2) and other measured concentration values (including PM2.5, PM10 by 24 h average concentration) were calculated separately for the Air Quality Index (Individual Air Quality Index, referred to as IAQI).
- Step 2:
- To select the maximum value from the IAQI for each pollutant and determine its AQI; if the AQI was greater than 50, the largest IAQI pollutant was identified as the primary pollutant.
- Step 3:
- To establish the AQI grading standard air quality level, type, color, health impact and recommended actions were determined.
3. Results and Discussion
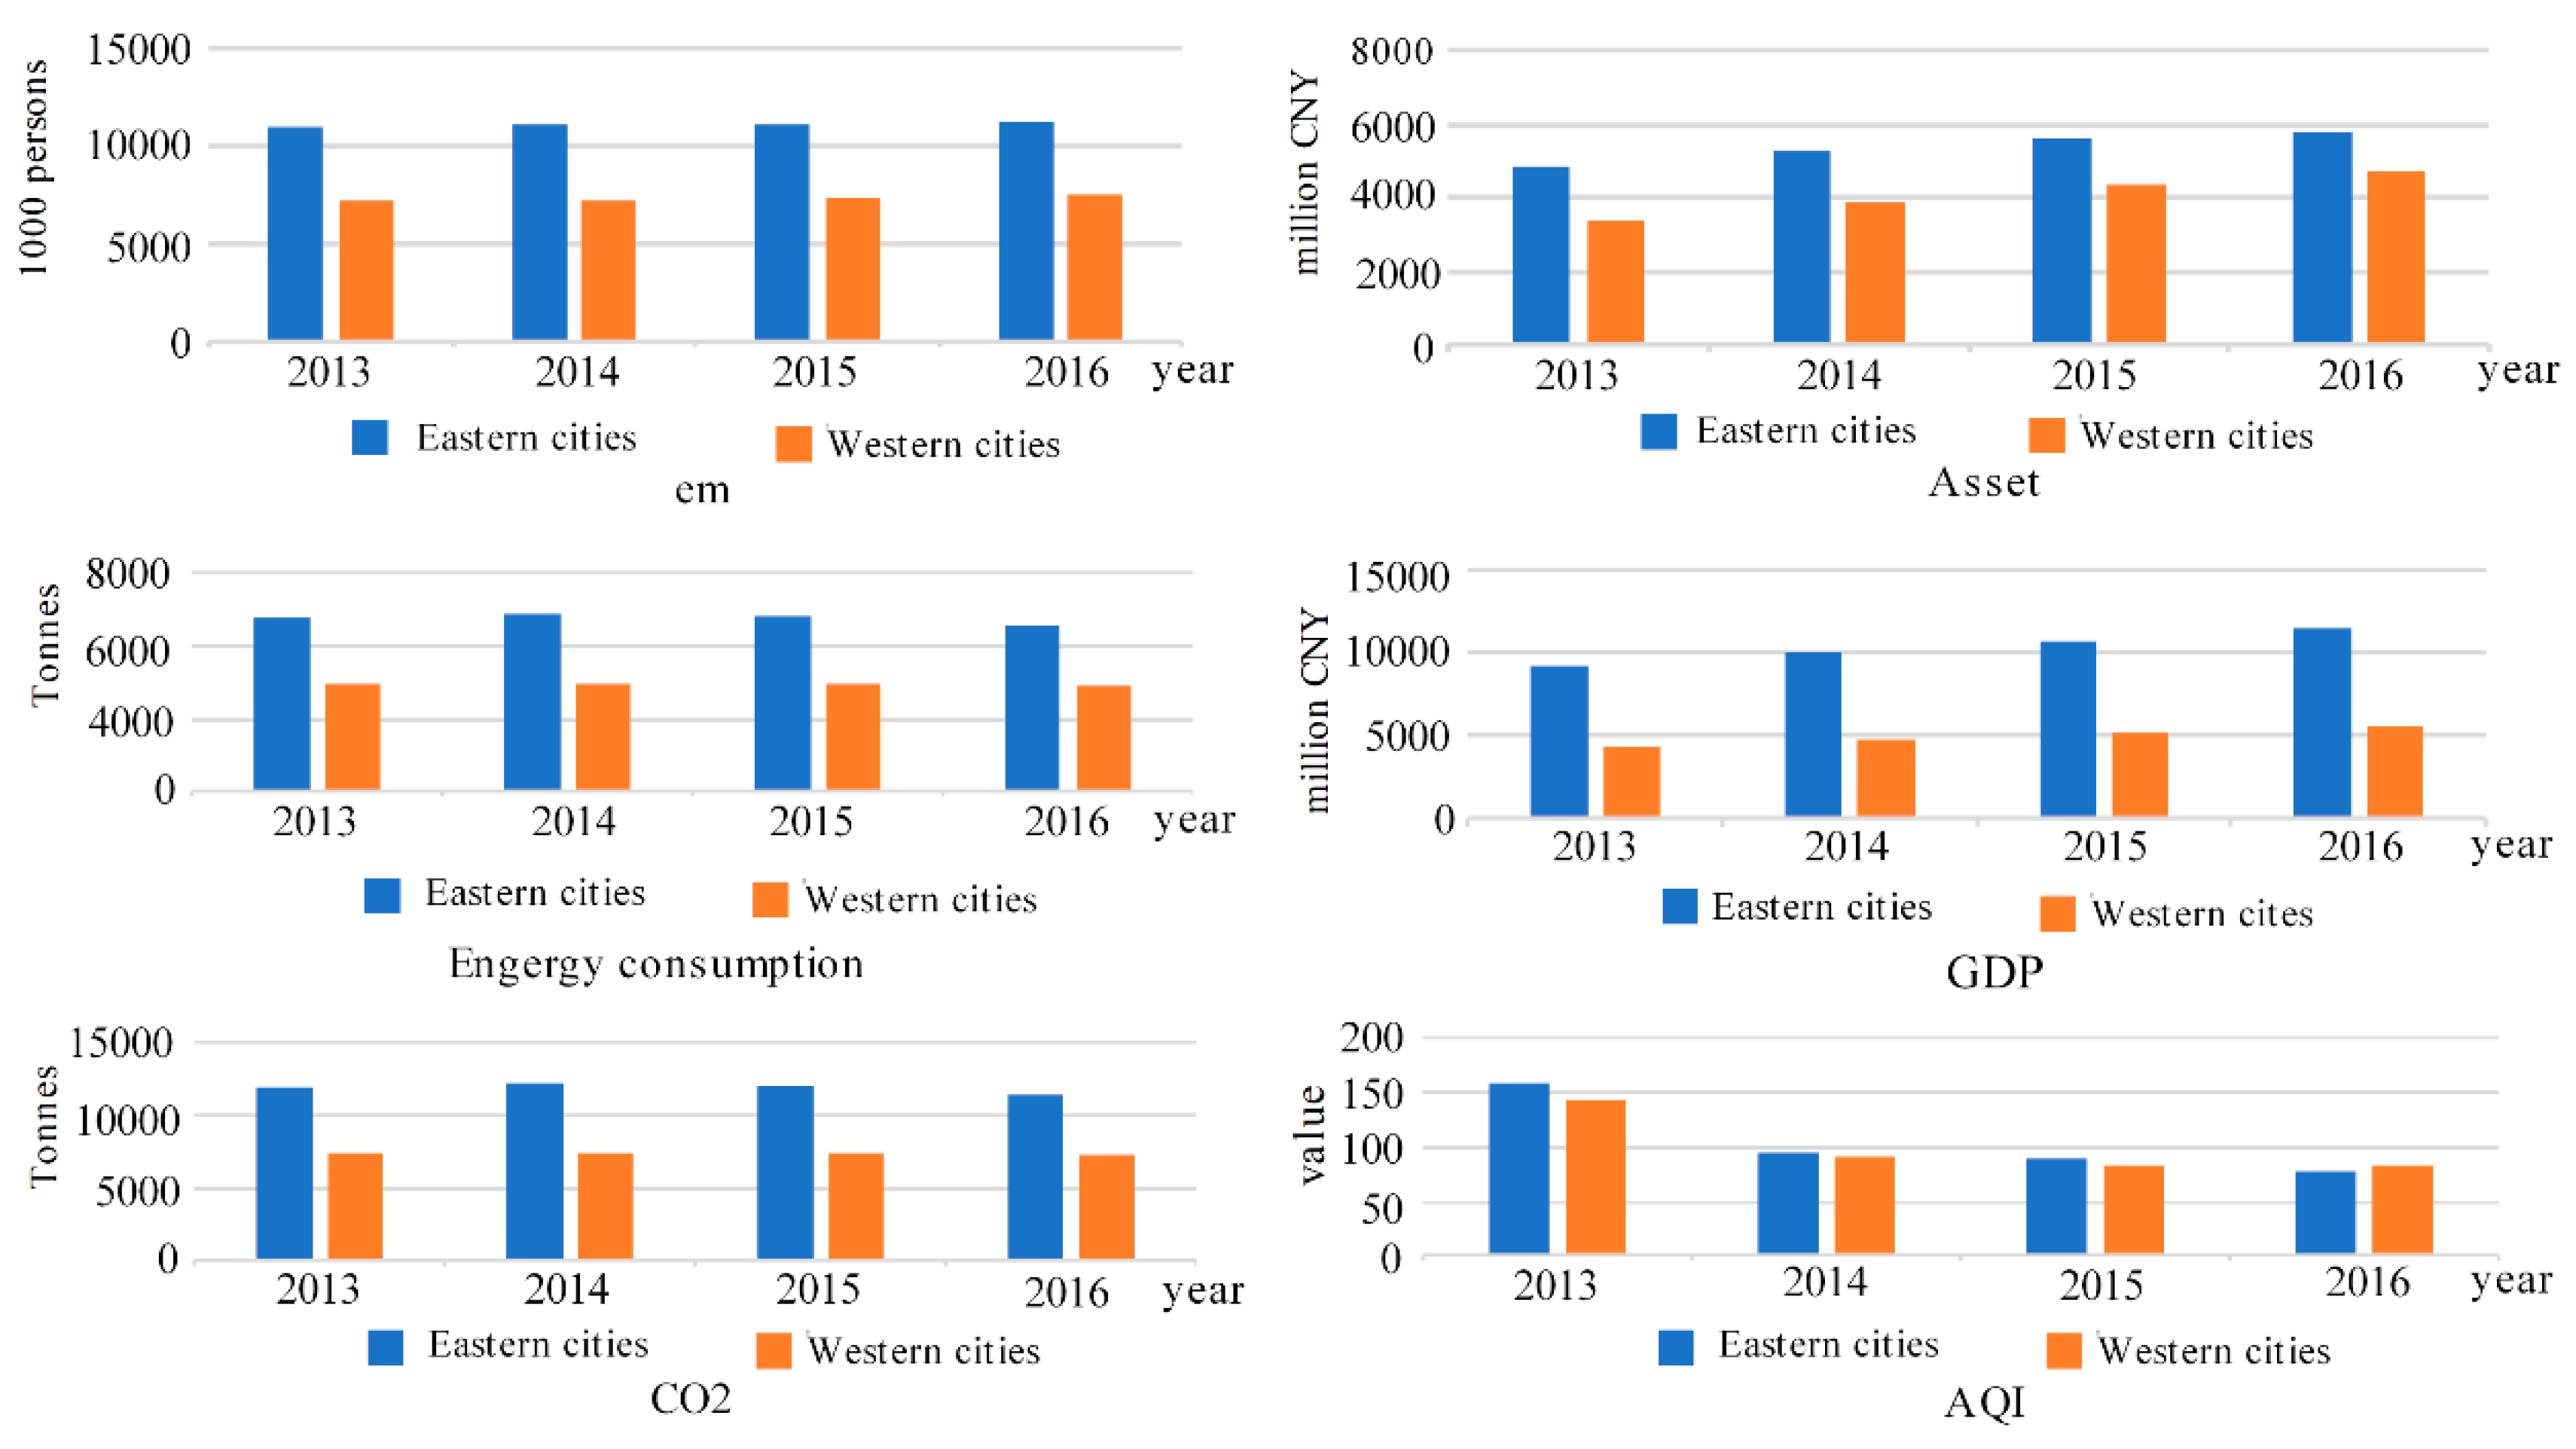
3.1. Input-Output Index Statistical Analyses
3.2. Overall Efficiency Score Ranking from 2013–2016
3.3. Efficiency Scores and Rankings for Energy Consumption, GDP, CO2, and AQI from 2013 to 2016.
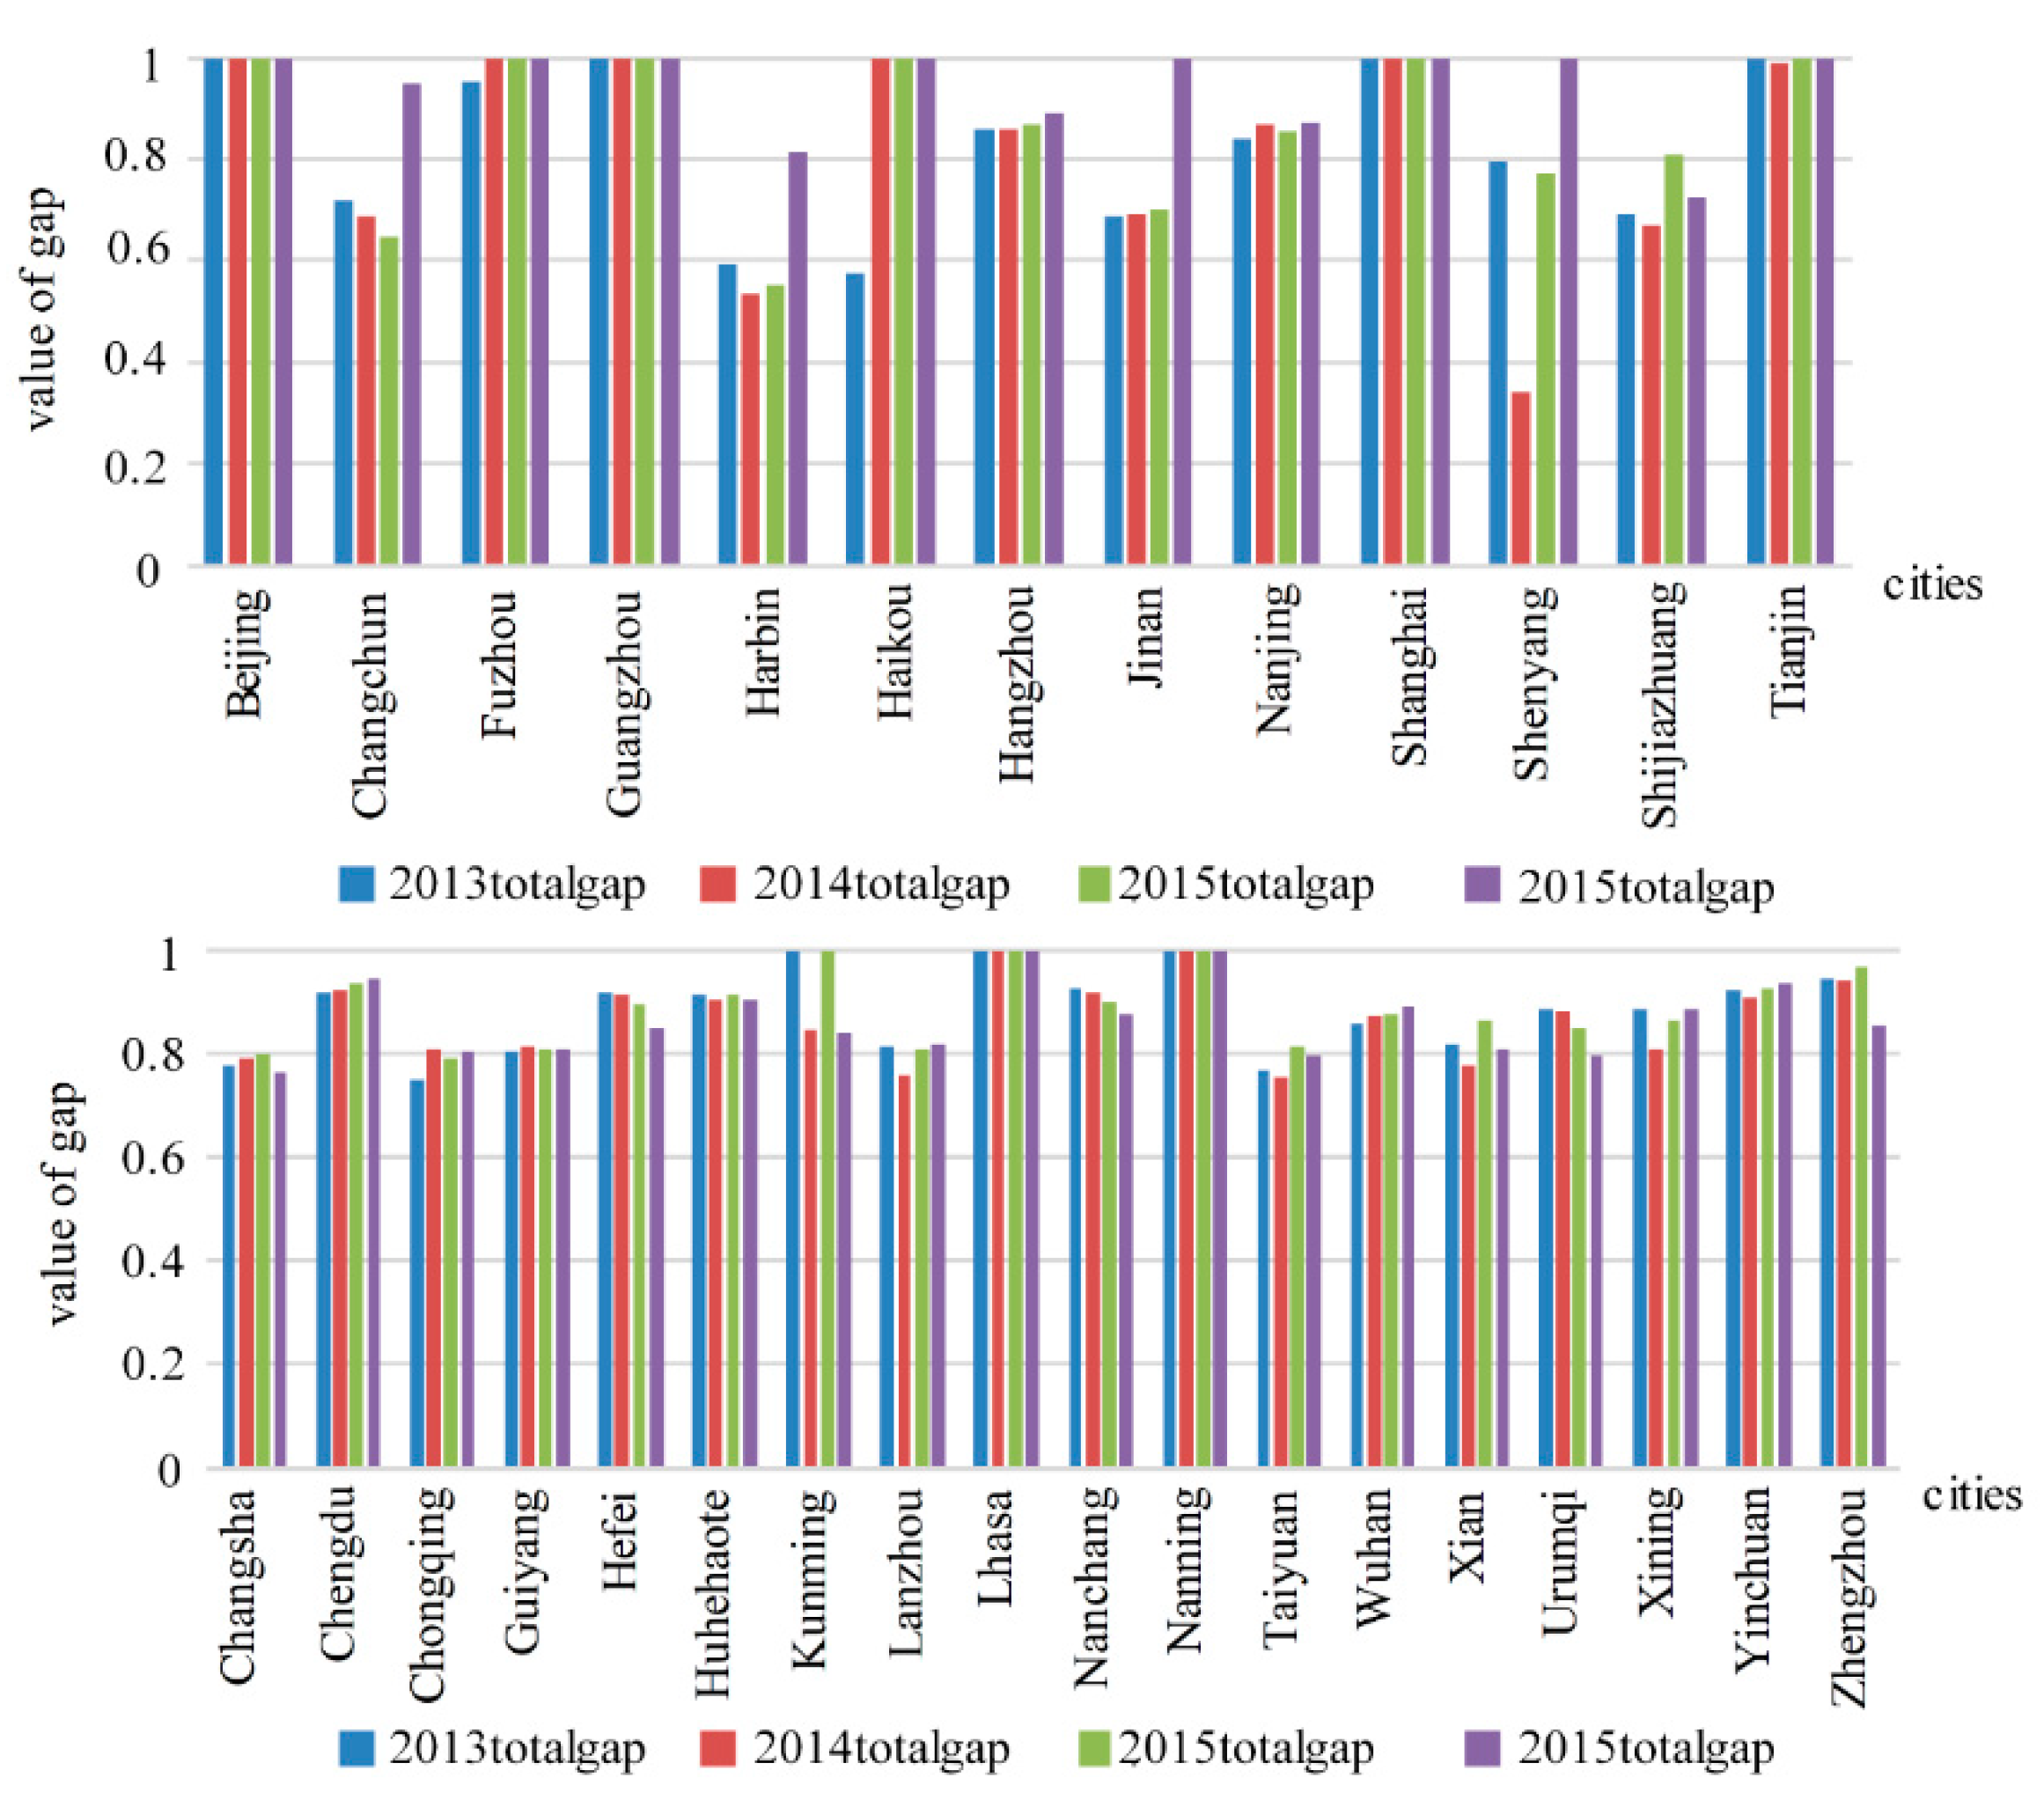
3.4. Comparison of Meta-Frontier and Group Frontiers
3.5. Comparative Gaps between the CO2 and AQI Efficiencies
4. Conclusions and Policy Recommendations
4.1. Conclusions
4.2. Policy Recommendations
Author Contributions
Funding
Conflicts of Interest
References
- Lvovsky, K.; Hughes, G.; Maddison, D.; Ostro, B.; Pearce, D. Environmental Costs of Fossil Fuels: A Rapid Assessment Method with Application to Six Cities; The World Bank Environment Department, Pollution Management Series: Washington, DC, USA, 2000; p. 78. [Google Scholar]
- World Energy Statistics. Role of the International Energy Agency. 2017. Available online: https://doi.org/10.1111/j.1467-9701.1985.tb00423.x (accessed on 4 April 2018).
- Annual Energy Outlook. USA Energy Information Administration—EIA. 2017. Available online: https://doi.org/10.1787/weo-2017-9-en (accessed on 6 March 2018).
- Sustainable Development Goals (SDGs). World Bank. 2017. Available online: https://doi.org/10.1596/978-1-4648-1080-0 (accessed on 8 March 2018).
- Zhang, Q.; Streets, D.G.; Carmichael, G.R.; He, K.B.; Huo, H.; Kannari, A.; Klimont, Z.; Park, I.S.; Reddy, S.; Fu, J.S.; et al. Asian emissions in 2006 for the NASA INTEX-B mission. Atmos. Chem. Phys. 2009, 9, 5131–5153. [Google Scholar] [CrossRef]
- Lin, J.; Nielsen, C.P.; Zhao, Y.; Lei, Y.; Liu, Y.; McElroy, M.B. Recent changes in particulate air pollution over China observed from space and the ground: Effectiveness of emission control. Environ. Sci. Technol. 2010, 44, 7771–7776. [Google Scholar] [CrossRef] [PubMed]
- Bell, M.L.; Dominici, F.; Ebisu, K.; Zeger, S.L.; Samet, J.M. Spatial and temporal variation in PM2.5 chemical composition in the United States for health effects studies. Environ. Health Perspect. 2007, 115, 989–995. [Google Scholar] [CrossRef] [PubMed]
- Yang, G.; Wang, Y.; Zeng, Y.; Gao, G.F.; Liang, X.; Zhou, M.; Wan, X.; Yu, S.; Jiang, Y.; Naghavi, M. Rapid health transition in China, 1990–2010: Findings from the Global Burden of Disease Study 2010. Lancet 2013, 381, 1987–2015. [Google Scholar] [CrossRef]
- Wu, J.; Lv, L.; Sun, J. A comprehensive analysis of China’s regional energy saving and emission reduction efficiency: From production and treatment perspectives. Energy Policy 2015, 84, 166–176. [Google Scholar] [CrossRef]
- Hailu, A.; Veeman, T. Non-parametric productivity analysis with undesirable outputs: An application to Canadian pulp and paper industry. Am. J. Agric. Econ. 2001, 83, 605–616. [Google Scholar] [CrossRef]
- Dyckhoff, H.; Allen, K. Measuring ecological efficiency with data envelopment analysis (DEA). Eur. J. Oper. Res. 2001, 132, 312–325. [Google Scholar] [CrossRef]
- Li, K.; Lin, B. Metafroniter energy efficiency with CO2 emissions and its convergence analysis for China. Energy Econ. 2015, 48, 230–241. [Google Scholar] [CrossRef]
- Li, L.B.; Hu, J.L. Ecological total-factor energy efficiency of regions in China. Energy Policy 2012, 46, 216–224. [Google Scholar] [CrossRef]
- Choi, Y.; Zhang, N.; Zhou, P. Efficiency and abatement costs of energy-related CO2 emissions in China: A slacks-based efficiency measure. Appl. Energy 2012, 98, 198–208. [Google Scholar] [CrossRef]
- Bian, Y.W.; He, P.; Xu, H. Estimation of potential energy saving and carbon dioxide emission reduction in China based on an extended non-radial DEA approach. Energy Policy 2013, 63, 962–971. [Google Scholar] [CrossRef]
- Apergis, N.; Aye, G.C.; Barros, C.P.; Gupta, R.; Wanke, P. Energy efficiency of selected OECD countries: A slacks based model with undesirable outputs. Energy Econ. 2015, 51, 45–53. [Google Scholar] [CrossRef]
- Zhang, N.; Zhou, P.; Choi, Y. Energy efficiency, CO2 emission performance and technology gaps in fossil fuel electricity generation in Korea: A meta-frontier non-radial directional distance function analysis. Energy Policy 2013, 56, 653–662. [Google Scholar] [CrossRef]
- Zhou, G.; Chung, W.; Zhang, X. A study of carbon dioxide emissions performance of China’s transport sector. Energy 2013, 50, 302–314. [Google Scholar] [CrossRef]
- Zhou, G.; Chung, W.; Zhang, Y. Measuring energy efficiency performance of China’s transport sector: A data envelopment analysis approach. Expert Syst. Appl. 2014, 41, 709–722. [Google Scholar] [CrossRef]
- Wang, K.; Wei, Y.M.; Zhang, X. A comparative analysis of China’s regional energy and emission performance: Which is the better way to deal with undesirable outputs? Energy Policy 2012, 46, 574–584. [Google Scholar] [CrossRef]
- Lin, B.; Fei, R. Regional differences of CO2 emissions performance in China’s agricultural sector: A Malmquist index approach. Eur. J. Agron. 2015, 70, 33–40. [Google Scholar] [CrossRef]
- Fan, M.; Shao, S.; Yang, L. Combining global Malmquist–Luenberger index and generalized method of moments to investigate industrial total factor CO2 emission performance: A case of Shanghai (China). Energy Policy 2015, 79, 189–201. [Google Scholar] [CrossRef]
- Emrouznejad, A.; Yang, G.L. CO2 emissions reduction of Chinese light manufacturing industries: A novel RAM-based global Malmquist–Luenberger productivity index. Energy Policy 2016, 96, 397–410. [Google Scholar] [CrossRef]
- Guo, X.Y.; Lu, C.C.; Lee, J.H.; Chiu, Y.H. Applying the dynamic DEA model to evaluate the energy efficiency of OECD countries and China Energy. Energy 2017, 134, 392–399. [Google Scholar] [CrossRef]
- Wu, F.; Fan, L.W.; Zhou, P. Industrial energy efficiency with CO2 emissions in China: A nonparametric analysis. Energy Policy 2012, 49, 164–172. [Google Scholar] [CrossRef]
- Zhang, N.; Wei, X. Dynamic total factor carbon emissions performance changes in the Chinese transportation industry. Appl. Energy 2015, 146, 409–420. [Google Scholar] [CrossRef]
- Yao, X.; Zhou, H.; Zhang, A. Regional energy efficiency, carbon emission performance and technology gaps in China: A meta-frontier non-radial directional distance function analysis. Energy Policy 2015, 84, 142–154. [Google Scholar] [CrossRef]
- Yang, L.; Wang, K.L. Regional differences of environmental efficiency of China’s energy utilization and environmental regulation cost based on provincial panel data and DEA method. Math. Comput. Model. 2013, 58, 1074–1083. [Google Scholar] [CrossRef]
- Duan, N.; Guo, J.P.; Xie, B.C. Is there a difference between the energy and CO2 emission performance for China’s thermal power industry? A bootstrapped directional distance function approach. Appl. Energy 2015, 162, 1552–1563. [Google Scholar] [CrossRef]
- Zhang, N.; Zhou, P.; Kung, C.C. Total-factor carbon emission performance of the Chinese transportation industry: A bootstrapped non-radial Malmquist index analysis. Renew. Sustain. Energy Rev. 2015, 41, 584–593. [Google Scholar] [CrossRef]
- Mekaroonreung, M.; Johnson, A.L. Estimating the shadow prices of SO2 and NOx for U.S. coal power plants: A convex nonparametric least squares approach. Energy Econ. 2012, 34, 723–732. [Google Scholar] [CrossRef]
- Chang, Y.T.; Zhang, N.; Danao, D. Environmental efficiency analysis of transportation system in China: A non-radial DEA approach. Energy Policy 2013, 58, 277–283. [Google Scholar] [CrossRef]
- Song, X.; Hao, Y.; Zhu, X. Analysis of the environmental efficiency of the Chinese transportation sector using an undesirable output slacks-based measure data envelopment analysis model. Sustainability 2015, 7, 9187–9206. [Google Scholar] [CrossRef]
- Bi, G.B.; Song, W.; Zhou, P. Does environmental regulation affect energy efficiency in China’s thermal power generation? Empirical evidence from a slacks-based DEA model. Energy Policy 2014, 66, 537–546. [Google Scholar] [CrossRef]
- Wang, Z.; Feng, C. A performance evaluation of the energy, environmental, and economic efficiency and productivity in China: An application of global data envelopment analysis. Appl. Energy 2015, 147, 617–626. [Google Scholar] [CrossRef]
- Vardanyan, M.; Noh, D. Approximating pollution abatement costs via alternative specifications of a multi-output production technology: A case of the US electric utility industry. J. Environ. Manag. 2006, 80, 177–190. [Google Scholar] [CrossRef] [PubMed]
- Rao, X.; Wu, J.; Zhang, Z. Energy efficiency and energy saving potential in China: An analysis based on slacks-based measure model. Comput. Ind. Eng. 2012, 63, 578–584. [Google Scholar] [CrossRef]
- Wang, Q.; Zhao, Z.; Shen, N.; Liu, T. Have Chinese cities achieved the win–win between environmental protection and economic development? From the perspective of environmental efficiency. Ecol. Indic. 2015, 51, 151–158. [Google Scholar] [CrossRef]
- Bian, Y.; Liang, N.; Xu, H. Efficiency evaluation of Chinese regional industrial systems with undesirable factors using a two-stage slacks-based measure approach. J. Clean. Prod. 2015, 87, 348–356. [Google Scholar] [CrossRef]
- Long, X.; Oh, K.; Cheng, G. Are stronger environmental regulations effective in practice? The case of China’s accession to the WTO. J. Clean. Prod. 2013, 39, 161–167. [Google Scholar] [CrossRef]
- Matsushita, K.; Yamane, F. Pollution from the electric power sector in Japan and efficient pollution reduction. Energy Econ. 2012, 34, 1124–1130. [Google Scholar] [CrossRef]
- Rezek, J.P.; Campbell, R.C. Cost estimates for multiple pollutants: A maximum entropy approach. Energy Econ. 2007, 29, 503–519. [Google Scholar] [CrossRef]
- Zhang, N.; Choi, Y. Environmental Energy Efficiency of China’s Regional Economies: A non-oriented slacks-based measure analysis. Soc. Sci. J. 2013, 50, 225–234. [Google Scholar] [CrossRef]
- Wang, K.; Wei, Y.M. China’s regional industrial energy efficiency and carbon emissions abatement costs. Appl. Energy 2014, 130, 617–631. [Google Scholar] [CrossRef]
- Qin, Q.; Li, X.; Li, L.; Zhen, W.; Wei, Y.M. Air Emission perspective on energy efficiency: A empirical analysis of China’s coastal area. Appl. Energy 2017, 185, 604–614. [Google Scholar] [CrossRef]
- Yu, F.; Ma, G.; Zhang, Y.; Cao, D.; Gao, F.; Wang, J. Several issues about health impact assessment of China’s air pollution. Nat. Med. J. China. 2013, 93, 2695–2698. [Google Scholar] [CrossRef]
- Charnes, A.; Cooper, W.; Rhodes, E. Measuring the Efficiency of Decision-Making Units. Eur. J. Oper. Res. 1978, 2, 429–444. [Google Scholar] [CrossRef]
- Banker, R.D.; Charnes, R.F.; Cooper, W.W. Some Models for Estimating Technical and Scale Inefficiencies in Data Envelopment Analysis. Manag. Sci. 1984, 30, 1078–1092. [Google Scholar] [CrossRef]
- Fukuyama, H.; Matousek, R. Modelling bank performance: A network DEA approach. Eur. J. Oper. Res. 2017, 2, 712–732. [Google Scholar] [CrossRef]
- Chang, Y.T.; Park, H.S.; Jeong, J.; Lee, B.W. Valuating Economic and Environmental Efficiency of Global Airlines: A SBM-DEA Approach. Transp. Res. D Transp. Environ. 2014, 27, 46–50. [Google Scholar] [CrossRef]
- Huang, C.W.; Ho, F.N.; Chiu, Y.H. Measurement of Tourist Hotels’ Productive Efficiency, Occupancy, And Catering Service Effectiveness Using A Modified Two-Stage DEA Model In Taiwan. Omega 2014, 48, 49–59. [Google Scholar] [CrossRef]
- Li, L.-B.; Liu, B.L.; Liu, W.L.; Chiu, Y.H. Efficiency Evaluation of the Regional High-Tech Industry in China: A New Framework Based on Meta-frontier Dynamic DEA Analysis. Socio-Econ. Plan. Sci. 2017, 60, 24–33. [Google Scholar] [CrossRef]
- Luenberger, D.G. Benefit functions and duality. J. Math. Econ. 1992, 21, 461–481. [Google Scholar] [CrossRef]
- Chung, Y.H.; Färe, R.; Grosskopf, S. Productivity and undesirable outputs: A directional distance function approach. J. Environ. Manag. 1997, 51, 229–240. [Google Scholar] [CrossRef]
- Shephard, R.W. Theory of Cost and Production Functions; Princeton University Press: Princeton, NJ, NSA, 1970. [Google Scholar] [CrossRef]
- Fare, R.; Grossopf, S. Directional distance functions and slacks-based measures of efficiency. Eur. J. Oper. Res. 2010, 200, 320–322. [Google Scholar] [CrossRef]
- Zhou, P.; Ang, B.W.; Wang, H. Energy and CO2 emission performance in electricity generation: A non-radial directional distance function approach. Eur. J. Oper. Res. 2012, 221, 625–635. [Google Scholar] [CrossRef]
- Chiu, C.R.; Liou, J.L.; Wu, P.I.; Fang, C.L. Decomposition of the environmental inefficiency of the meta-frontier with undesirable output. Energy Econ. 2012, 34, 1392–1399. [Google Scholar] [CrossRef]
- Barros, C.P.; Managi, S.; Matousek, R. The technical efficiency of the Japanese banks: Non-radial directional performance measurement with undesirable output. Omega 2012, 40, 1–8. [Google Scholar] [CrossRef]
- Färe, R.; Grosskopf, S.; Pasurka, C.A. Environmental production functions and environmental directional distance functions. Energy 2007, 32, 1055–1066. [Google Scholar] [CrossRef]
- Battese, G.E.; Rao, D.S.P. Technology gap, efficiency and a stochastic metafrontier function. Int. J. Bus. Econ. 2002, 1, 87–93. [Google Scholar]
- Battese, G.E.; Rao, D.S.P.; O’Donnell, C.J. Metafrontier Production Function for Estimation of Technical Efficiencies and Technology Gaps for Firms Operating under Different Technologies. J. Prod. Anal. 2004, 21, 91–103. [Google Scholar] [CrossRef]
- O’Donnell, C.J.; Rao, D.S.P.; Battese, G.E. Metafrontier frameworks for the study of firm-level efficiencies and technology ratios. Empir. Econ. 2008, 34, 231–255. [Google Scholar] [CrossRef]
- Hu, J.L.; Wang, S.C. Total-factor energy efficiency of regions in China. Energy Policy 2006, 34, 3206–3217. [Google Scholar] [CrossRef]
- National Bureau of Statistics of China. China Statistical Yearbook. 2017. Available online: http://www.stats.gov.cn/ (accessed on 8 April 2018).
- China Statistical Yearbooks Database. Demographics and the Employment Statistical Yearbook of China, and the Statistical Yearbooks of All Cities. China Academic Journals Electronic Publishing House. 2017. Available online: http://www.stats.gov.cn/ (accessed on 8 April 2018).
- China’s Environmental and Protection Bureau Reports. Ministry of Ecology and Environment of the People’s Republic of China. 2017. Available online: http://www.mep.gov.cn/ (accessed on 26 March 2018).


| No. | DMU | 2013 | 2014 | 2015 | 2016 | ||||
|---|---|---|---|---|---|---|---|---|---|
| Score | Rank | Score | Rank | Score | Rank | Score | Rank | ||
| 1 | Chengdu | 0.7777 | 24 | 0.788 | 24 | 0.7996 | 21 | 0.762 | 26 |
| 2 | Changsha | 0.9183 | 10 | 0.9233 | 9 | 0.934 | 9 | 0.945 | 10 |
| 3 | Chongqing | 0.7496 | 26 | 0.8102 | 21 | 0.7915 | 23 | 0.803 | 22 |
| 4 | Guiyang | 0.676 | 30 | 0.7556 | 27 | 0.7909 | 24 | 0.789 | 24 |
| 5 | Hefei | 0.8554 | 19 | 0.8607 | 18 | 0.8601 | 18 | 0.821 | 21 |
| 6 | Huhehot | 0.9113 | 12 | 0.9039 | 12 | 0.9123 | 11 | 0.904 | 12 |
| 7 | Kunming | 0.9999 | 6 | 0.8432 | 19 | 0.8583 | 19 | 0.842 | 20 |
| 8 | Lanzhou | 0.7302 | 28 | 0.6511 | 29 | 0.6705 | 30 | 0.667 | 30 |
| 9 | Lhasa | 1 | 1 | 1 | 1 | 1 | 1 | 1 | 1 |
| 10 | Nanchang | 0.9191 | 9 | 0.917 | 10 | 0.9001 | 13 | 0.874 | 16 |
| 11 | Nanning | 1 | 1 | 1 | 1 | 1 | 1 | 1 | 1 |
| 12 | Taiyuan | 0.6855 | 29 | 0.7027 | 28 | 0.7009 | 28 | 0.729 | 28 |
| 13 | Wuhan | 0.8564 | 18 | 0.8708 | 16 | 0.874 | 17 | 0.89 | 14 |
| 14 | Urumqi | 0.8185 | 21 | 0.7761 | 25 | 0.7855 | 25 | 0.784 | 25 |
| 15 | Xian | 0.7769 | 25 | 0.7886 | 23 | 0.7699 | 27 | 0.734 | 27 |
| 16 | Xining | 0.737 | 27 | 0.6407 | 30 | 0.686 | 29 | 0.709 | 29 |
| 17 | Yinchuan | 0.7817 | 23 | 0.7641 | 26 | 0.7754 | 26 | 0.791 | 23 |
| 18 | Zhengzhou | 0.9435 | 8 | 0.9407 | 8 | 0.9678 | 7 | 0.852 | 18 |
| 19 | Beijing | 1 | 1 | 1 | 1 | 1 | 1 | 1 | 1 |
| 20 | Changchun | 0.9016 | 14 | 0.8941 | 14 | 0.9117 | 12 | 0.882 | 15 |
| 21 | Fuzhou | 0.9882 | 7 | 0.864 | 17 | 0.8799 | 16 | 0.861 | 17 |
| 22 | Guangzhou | 1 | 1 | 1 | 1 | 1 | 1 | 1 | 1 |
| 23 | Harbin | 0.8983 | 15 | 0.8838 | 15 | 0.8887 | 15 | 0.848 | 19 |
| 24 | Haikou | 0.8933 | 16 | 1 | 1 | 0.9999 | 6 | 1 | 8 |
| 25 | Hangzhou | 0.8929 | 17 | 0.9031 | 13 | 0.9163 | 10 | 0.934 | 11 |
| 26 | Jinan | 0.7864 | 22 | 0.7959 | 22 | 0.7967 | 22 | 1 | 1 |
| 27 | Nanjing | 0.9133 | 11 | 0.9666 | 7 | 0.9462 | 8 | 0.963 | 9 |
| 28 | Shanghai | 1 | 1 | 1 | 1 | 1 | 1 | 1 | 1 |
| 29 | Shenyang | 0.8245 | 20 | 0.8353 | 20 | 0.8042 | 20 | 1 | 1 |
| 30 | Shijiazhuang | 0.5708 | 31 | 0.5588 | 31 | 0.5825 | 31 | 0.574 | 31 |
| 31 | Tianjin | 0.9091 | 13 | 0.9096 | 11 | 0.893 | 14 | 0.902 | 13 |
| Years | Average of Eastern | Average of Western | Wilcoxon Scorer Test |
|---|---|---|---|
| 2013 | 0.8907 | 0.8409 | 0.1011 |
| 2014 | 0.8932 | 0.8298 | 0.0454 * |
| 2015 | 0.8938 | 0.8376 | 0.0422 * |
| 2016 | 0.9203 | 0.8275 | 0.007 ** |
| DMU | 2013 | 2014 | 2015 | 2016 | ||||||||||||
|---|---|---|---|---|---|---|---|---|---|---|---|---|---|---|---|---|
| com | GDP | CO2 | AQI | com | GDP | CO2 | AQI | com | GDP | CO2 | AQI | com | GDP | CO2 | AQI | |
| Chengdu | 0.778 | 0.818 | 0.715 | 0.786 | 0.714 | 0.825 | 0.788 | 0.692 | 0.8 | 0.8331 | 0.8 | 0.603 | 0.762 | 0.808 | 0.762 | 0.762 |
| Changsha | 0.657 | 0.924 | 0.198 | 0.116 | 0.664 | 0.929 | 0.203 | 0.121 | 0.665 | 0.938 | 0.195 | 0.192 | 0.656 | 0.948 | 0.177 | 0.022 |
| Chongqing | 0.75 | 0.8 | 0.757 | 0.75 | 0.742 | 0.84 | 0.618 | 0.81 | 0.791 | 0.8275 | 0.791 | 0.791 | 0.803 | 0.835 | 0.803 | 0.803 |
| Guiyang | 0.446 | 0.755 | 0.274 | 0.676 | 0.547 | 0.804 | 0.202 | 0.756 | 0.599 | 0.8271 | 0.513 | 0.791 | 0.63 | 0.826 | 0.324 | 0.789 |
| Hefei | 0.855 | 0.874 | 0.761 | 0.124 | 0.858 | 0.878 | 0.861 | 0.148 | 0.86 | 0.8773 | 0.86 | 0.235 | 0.821 | 0.848 | 0.808 | 0.821 |
| Huhehot | 0.384 | 0.919 | 0.32 | 0.302 | 0.748 | 0.912 | 0.101 | 0.158 | 0.725 | 0.9194 | 0.281 | 0.224 | 0.692 | 0.913 | 0.242 | 0.052 |
| Kunming | 1 | 1 | 0.929 | 1 | 0.489 | 0.864 | 0.148 | 0.843 | 0.664 | 0.8759 | 0.271 | 0.858 | 0.727 | 0.863 | 0.451 | 0.842 |
| Lanzhou | 0.32 | 0.788 | 0.125 | 0.73 | 0.358 | 0.741 | 0.183 | 0.768 | 0.302 | 0.7522 | 0.143 | 0.612 | 0.319 | 0.75 | 0.147 | 0.284 |
| Lhasa | 1 | 1 | 0.993 | 0.997 | 1 | 1 | 1 | 0.994 | 1 | 1 | 1 | 0.992 | 1 | 1 | 1 | 0.991 |
| Nanchang | 0.919 | 0.925 | 0.778 | 0.386 | 0.897 | 0.923 | 0.917 | 0.735 | 0.9 | 0.9092 | 0.9 | 0.553 | 0.874 | 0.888 | 0.842 | 0.874 |
| Nanning | 1 | 1 | 1 | 1 | 1 | 1 | 1 | 1 | 1 | 1 | 1 | 1 | 1 | 1 | 1 | 1 |
| Taiyuan | 0.164 | 0.761 | 0.101 | 0.739 | 0.185 | 0.771 | 0.1 | 0.344 | 0.176 | 0.7698 | 0.1 | 0.532 | 0.23 | 0.787 | 0.103 | 0.035 |
| Wuhan | 0.736 | 0.874 | 0.359 | 0.104 | 0.725 | 0.886 | 0.435 | 0.128 | 0.76 | 0.8881 | 0.464 | 0.167 | 0.747 | 0.901 | 0.359 | 0.011 |
| Urumqi | 0.653 | 0.846 | 0.383 | 0.212 | 0.652 | 0.817 | 0.332 | 0.135 | 0.699 | 0.8234 | 0.486 | 0.2 | 0.784 | 0.822 | 0.784 | 0.019 |
| Xian | 0.777 | 0.818 | 0.792 | 0.145 | 0.765 | 0.826 | 0.789 | 0.182 | 0.77 | 0.813 | 0.77 | 0.342 | 0.734 | 0.79 | 0.734 | 0.067 |
| Xining | 0.217 | 0.792 | 0.1 | 0.737 | 0.25 | 0.736 | 0.133 | 0.734 | 0.261 | 0.761 | 0.124 | 0.686 | 0.62 | 0.774 | 0.578 | 0.709 |
| Yinchuan | 0.37 | 0.821 | 0.116 | 0.716 | 0.34 | 0.809 | 0.134 | 0.722 | 0.275 | 0.8166 | 0.105 | 0.442 | 0.277 | 0.827 | 0.1 | 0.04 |
| Zhengzhou | 0.942 | 0.947 | 0.943 | 0.194 | 0.939 | 0.944 | 0.941 | 0.1 | 0.968 | 0.9688 | 0.968 | 0.1 | 0.852 | 0.871 | 0.852 | 0.079 |
| Beijing | 1 | 1 | 1 | 1 | 1 | 1 | 0.999 | 1 | 1 | 1 | 1 | 1 | 1 | 1 | 1 | 1 |
| Changchun | 0.872 | 0.91 | 0.902 | 0.427 | 0.894 | 0.904 | 0.716 | 0.181 | 0.912 | 0.9188 | 0.912 | 0.171 | 0.882 | 0.894 | 0.86 | 0.882 |
| Fuzhou | 0.988 | 0.988 | 0.717 | 0.988 | 0.696 | 0.88 | 0.391 | 0.864 | 0.716 | 0.8927 | 0.321 | 0.88 | 0.746 | 0.878 | 0.45 | 0.861 |
| Guangzhou | 1 | 1 | 1 | 1 | 1 | 1 | 1 | 1 | 1 | 1 | 1 | 1 | 1 | 1 | 1 | 1 |
| Harbin | 0.892 | 0.908 | 0.898 | 0.215 | 0.884 | 0.896 | 0.718 | 0.367 | 0.889 | 0.8999 | 0.889 | 0.205 | 0.848 | 0.868 | 0.844 | 0.848 |
| Haikou | 0.811 | 0.904 | 0.541 | 0.893 | 1 | 1 | 1 | 1 | 1 | 0.9999 | 1 | 1 | 1 | 1 | 1 | 1 |
| Hangzhou | 0.739 | 0.903 | 0.372 | 0.127 | 0.759 | 0.912 | 0.332 | 0.227 | 0.798 | 0.9227 | 0.447 | 0.201 | 0.804 | 0.938 | 0.397 | 0.03 |
| Jinan | 0.518 | 0.824 | 0.192 | 0.129 | 0.525 | 0.83 | 0.195 | 0.109 | 0.555 | 0.8311 | 0.218 | 0.136 | 1 | 1 | 1 | 1 |
| Nanjing | 0.643 | 0.92 | 0.171 | 0.1 | 0.601 | 0.968 | 0.157 | 0.967 | 0.885 | 0.9489 | 0.869 | 0.178 | 0.862 | 0.964 | 0.511 | 0.02 |
| Shanghai | 1 | 1 | 1 | 1 | 1 | 1 | 1 | 1 | 1 | 1 | 1 | 1 | 1 | 1 | 1 | 1 |
| Shenyang | 0.64 | 0.851 | 0.316 | 0.216 | 0.644 | 0.859 | 0.249 | 0.835 | 0.64 | 0.8363 | 0.321 | 0.198 | 1 | 1 | 1 | 1 |
| Shijiazhuang | 0.39 | 0.7 | 0.339 | 0.168 | 0.41 | 0.694 | 0.299 | 0.197 | 0.368 | 0.7055 | 0.582 | 0.465 | 0.388 | 0.701 | 0.276 | 0.029 |
| Tianjin | 0.708 | 0.917 | 0.25 | 0.227 | 0.719 | 0.917 | 0.288 | 0.111 | 0.709 | 0.9033 | 0.286 | 0.149 | 0.713 | 0.91 | 0.273 | 0.01 |
| DMU | 2013 Rank by Meta-Frontier | 2013 Rank by Group-Frontier | 2014 Rank by Meta-Frontier | 2014 Rank by Group-Frontier | 2015 Rank by Meta-Frontier | 2015 Rank by Group-Frontier | 2016 Rank by Meta-Frontier | 2016 Rank by Group-Frontier |
|---|---|---|---|---|---|---|---|---|
| Chengdu | 29 | 1 | 28 | 1 | 30 | 1 | 31 | 1 |
| Changsha | 18 | 1 | 12 | 1 | 15 | 1 | 15 | 1 |
| Chongqing | 31 | 1 | 26 | 1 | 31 | 1 | 28 | 1 |
| Guiyang | 28 | 17 | 25 | 14 | 28 | 11 | 26 | 11 |
| Hefei | 19 | 12 | 17 | 12 | 21 | 12 | 23 | 13 |
| Huhehot | 20 | 1 | 19 | 1 | 18 | 1 | 18 | 1 |
| Kunming | 7 | 1 | 23 | 1 | 9 | 1 | 24 | 1 |
| Lanzhou | 27 | 13 | 30 | 16 | 29 | 17 | 25 | 17 |
| Lhasa | 1 | 1 | 1 | 1 | 1 | 1 | 1 | 1 |
| Nanchang | 14 | 11 | 16 | 1 | 20 | 1 | 21 | 1 |
| Nanning | 1 | 1 | 1 | 1 | 1 | 1 | 1 | 1 |
| Taiyuan | 30 | 14 | 31 | 1 | 27 | 15 | 29 | 15 |
| Wuhan | 25 | 1 | 22 | 1 | 23 | 1 | 19 | 1 |
| Urumqi | 26 | 1 | 29 | 1 | 24 | 13 | 27 | 12 |
| Xian | 23 | 15 | 21 | 15 | 26 | 14 | 30 | 14 |
| Xining | 24 | 18 | 27 | 18 | 25 | 18 | 20 | 18 |
| Yinchuan | 17 | 16 | 18 | 17 | 17 | 16 | 16 | 16 |
| Zhengzhou | 12 | 1 | 11 | 1 | 10 | 1 | 22 | 1 |
| Beijing | 1 | 1 | 1 | 1 | 1 | 1 | 1 | 1 |
| Changchun | 13 | 7 | 14 | 5 | 19 | 1 | 11 | 10 |
| Fuzhou | 8 | 6 | 1 | 8 | 1 | 10 | 1 | 12 |
| Guangzhou | 1 | 1 | 1 | 1 | 1 | 1 | 1 | 1 |
| Harbin | 21 | 1 | 20 | 1 | 22 | 1 | 14 | 11 |
| Haikou | 22 | 1 | 1 | 1 | 8 | 1 | 10 | 1 |
| Hangzhou | 9 | 9 | 10 | 6 | 11 | 8 | 12 | 8 |
| Jinan | 16 | 12 | 13 | 9 | 16 | 11 | 1 | 1 |
| Nanjing | 10 | 8 | 9 | 1 | 12 | 7 | 13 | 7 |
| Shanghai | 1 | 1 | 1 | 1 | 1 | 1 | 1 | 1 |
| Shenyang | 11 | 11 | 24 | 1 | 14 | 12 | 1 | 1 |
| Shijiazhuang | 15 | 13 | 15 | 10 | 13 | 13 | 17 | 13 |
| Tianjin | 1 | 10 | 8 | 7 | 1 | 9 | 1 | 9 |
| Years | Eastern | Western | Wilcoxon Scorer Test |
|---|---|---|---|
| 2013 | 0.9561 | 0.8827 | 0.01 ** |
| 2014 | 0.9547 | 0.8669 | 0.005 ** |
| 2015 | 0.9655 | 0.8887 | 0.006 ** |
| 2016 | 0.9855 | 0.8641 | 0.0005 ** |
| DMU | 2013 Gap Rank (Not Including CO2) | 2013 Gap Rank (Not Including AQI) | 2014 Gap Rank (Not Including CO2) | 2014 Gap Rank (Not Including AQI) | 2015 Gap Rank (Not Including CO2) | 2015 Gap Rank (Not Including AQI) | 2016 Gap Rank (Not Including CO2) | 2016 Gap Rank (Not Including AQI) |
|---|---|---|---|---|---|---|---|---|
| Chengdu | 29 | 28 | 31 | 25 | 30 | 30 | 31 | 29 |
| Changsha | 18 | 17 | 12 | 11 | 14 | 12 | 15 | 10 |
| Chongqing | 31 | 31 | 26 | 29 | 31 | 31 | 28 | 31 |
| Guiyang | 28 | 27 | 25 | 26 | 27 | 25 | 26 | 17 |
| Hefei | 19 | 18 | 18 | 17 | 21 | 17 | 23 | 19 |
| Huhehot | 20 | 19 | 19 | 18 | 18 | 18 | 18 | 14 |
| Kunming | 7 | 30 | 23 | 31 | 9 | 28 | 24 | 25 |
| Lanzhou | 27 | 26 | 29 | 28 | 29 | 26 | 25 | 23 |
| Lhasa | 1 | 1 | 1 | 1 | 1 | 1 | 1 | 1 |
| Nanchang | 14 | 12 | 17 | 10 | 20 | 14 | 21 | 18 |
| Nanning | 1 | 1 | 1 | 1 | 1 | 1 | 1 | 30 |
| Taiyuan | 30 | 29 | 30 | 30 | 28 | 27 | 29 | 26 |
| Wuhan | 25 | 22 | 22 | 21 | 23 | 22 | 19 | 15 |
| Urumqi | 26 | 25 | 28 | 27 | 24 | 23 | 27 | 24 |
| Xian | 23 | 21 | 21 | 19 | 26 | 24 | 30 | 27 |
| Xining | 24 | 24 | 27 | 24 | 25 | 21 | 20 | 21 |
| Yinchuan | 17 | 16 | 16 | 16 | 16 | 16 | 16 | 11 |
| Zhengzhou | 12 | 11 | 11 | 9 | 10 | 7 | 22 | 20 |
| Beijing | 1 | 1 | 1 | 1 | 1 | 1 | 1 | 1 |
| Changchun | 13 | 13 | 14 | 14 | 19 | 19 | 11 | 13 |
| Fuzhou | 8 | 9 | 1 | 8 | 1 | 13 | 1 | 16 |
| Guangzhou | 1 | 1 | 1 | 1 | 1 | 1 | 1 | 1 |
| Harbin | 21 | 20 | 20 | 20 | 22 | 20 | 14 | 22 |
| Haikou | 22 | 23 | 7 | 22 | 8 | 29 | 10 | 28 |
| Hangzhou | 9 | 7 | 10 | 7 | 11 | 8 | 12 | 8 |
| Jinan | 16 | 15 | 13 | 12 | 15 | 15 | 1 | 1 |
| Nanjing | 10 | 8 | 9 | 13 | 12 | 9 | 13 | 9 |
| Shanghai | 1 | 1 | 1 | 1 | 1 | 1 | 1 | 1 |
| Shenyang | 11 | 10 | 24 | 23 | 13 | 11 | 1 | 1 |
| Shijiazhuang | 15 | 14 | 15 | 15 | 17 | 10 | 17 | 12 |
| Tianjin | 1 | 1 | 8 | 6 | 1 | 1 | 1 | 1 |
© 2018 by the authors. Licensee MDPI, Basel, Switzerland. This article is an open access article distributed under the terms and conditions of the Creative Commons Attribution (CC BY) license (http://creativecommons.org/licenses/by/4.0/).
Share and Cite
Li, Y.; Chiu, Y.-H.; Lu, L.C. Regional Energy, CO2, and Economic and Air Quality Index Performances in China: A Meta-Frontier Approach. Energies 2018, 11, 2119. https://doi.org/10.3390/en11082119
Li Y, Chiu Y-H, Lu LC. Regional Energy, CO2, and Economic and Air Quality Index Performances in China: A Meta-Frontier Approach. Energies. 2018; 11(8):2119. https://doi.org/10.3390/en11082119
Chicago/Turabian StyleLi, Ying, Yung-Ho Chiu, and Liang Chun Lu. 2018. "Regional Energy, CO2, and Economic and Air Quality Index Performances in China: A Meta-Frontier Approach" Energies 11, no. 8: 2119. https://doi.org/10.3390/en11082119
APA StyleLi, Y., Chiu, Y.-H., & Lu, L. C. (2018). Regional Energy, CO2, and Economic and Air Quality Index Performances in China: A Meta-Frontier Approach. Energies, 11(8), 2119. https://doi.org/10.3390/en11082119