Article

Green Production Planning and Control for the Textile Industry by Using Mathematical Programming and Industry 4.0 Techniques

Department of Business Administration, National Central University, 300, Jhongda Rd., Jhongli, Taoyuan 32001, Taiwan
Energies 2018, 11(8), 2072; https://doi.org/10.3390/en11082072
Submission received: 4 July 2018 / Revised: 30 July 2018 / Accepted: 3 August 2018 / Published: 9 August 2018
(This article belongs to the Special Issue Modeling and Simulation of Carbon Emission Related Issues)

Abstract

:
The textile industry is one of the world’s major sources of industrial pollution, and related environmental issues are becoming an ever greater concern. This paper considers the environmental issues of carbon emissions, energy recycling, and waste reuse, and uses a mathematical programming model with Activity-Based Costing (ABC) and the Theory of Constraints (TOC) to achieve profit maximization. This paper discusses the combination of mathematical programming and Industry 4.0 techniques to achieve the purpose of green production planning and control for the textile industry in the new era. The mathematical programming model is used to determine the optimal product mix under various production constraints, while Industry 4.0 techniques are used to control the production progress to achieve the planning targets. With the help of an Industry 4.0 real-time sensor and detection system, it can achieve the purposes of recycling waste, reducing carbon emission, saving energy and cost, and finally achieving a maximization of profit. The main contributions of this research are using mathematical programming approach to formulate the decision model with ABC cost data and TOC constraints for the textile companies and clarifying the relation between mathematical programming models and Industry 4.0 techniques. Managers in the textile companies can apply this decision model to achieve the optimal product-mix under various constraints and to evaluate the effect on profit of carbon emissions, energy recycling, waste reuse, and material quantity discount.

1. Introduction

The traditional textile industry has always been labor-intensive and highly polluting [1]. In the past, the textile industry production process was very complicated. Many detailed actions needed to be executed; this caused a production trend of large volume but less variety [2]. Now people are paying more attention to product quality and unique requirements due to technology and people’s living habits change. As a result, the manufacturing industry has moved toward customized production [3,4]. Technology has also been strengthened in response to such changes. Recently, many manufactures have been influenced by Industry 4.0. They are not only optimizing the manufacturing processes, but also effectively controlling industrial pollution with the assistance of data maintenance and monitoring [5,6].
The Industry 4.0 smart manufacturing concept was first presented at the Hanover Fair (Germany) in 2011, where it received great attention from different industry sectors in various nations [7,8]. Some researchers claim that the main essentials of Industry 4.0 are the integration of system components and the digitalization of manufacturing/service operations [9,10]. However, most companies in the textile industry are hesitant to introduce Industry 4.0 because of serious concerns about the uncertain financial benefits and lack of professional knowledge. Thus, a Textile Learning Factory 4.0 was set up and open in March 2017 by the Institut für Textiltechnik der RWTH Aachen University in Aachen, Germany [9]. The Textile Learning Factory 4.0 is a building with two implementation levels: Level 1 demonstrates the current state operation (lean production) and Level 2 demonstrates the future state operation (Industry 4.0) for the textile industry. The purpose of the factory is to provide a real-life demonstration and learning environment to teach textile companies how to plan the digital transformation to Industry 4.0. The factory is also used as a base for piloting new digital solutions for the textile industry. This may promote the applications of Industry 4.0 in textile companies around the world.
Industry 4.0 will use various sensor systems to real-timely monitor and collect the operations data of production systems and return immediate responses to various problems that may arise during production by using the results of real-timely analyzing big data. Finally, mass customization can be achieved by fine-tuning or adjusting the production process differently with the customer needs [7,11]. Industry 4.0 has been applied in various industries, including textile [9,10,12,13] and other process industries [8,14,15]. This research focuses on the textile industry.
In response to the current situation, this research uses the Activity-Based Costing (ABC) method to enhance the accuracy of cost estimates [16], in conjunction with the Theory of Constraints (TOC) to consider the possible constraints of production and sales, to achieve maximum profit under various constraints [17]. ABC and TOC are combined to deal with the problem of short-term operations and long-term cost management [18,19]. ABC uses two-stage cost assignment to compute the accurate costs of cost objects. ABC calculates the costs of activities in the first stage and the costs of the cost objects in the second stage [20]. Thus, textile processes/activity costs can be achieved in the first stage. TOC uses five steps to identify and eliminate the bottlenecks one by one to increase business performance. TOC can be used in the mathematical programming models for various kinds of problem [21,22,23,24,25,26,27]. In this research, TOC is used to form the various production and sales constraints. In summary, the mathematical programming model with ABC costs and TOC constraints is used for production planning to derive maximum profit [28,29,30]. In the literature, the mathematical programming approach has been applied in the textile industry for inventory [31], scheduling [32], and product-mix problems [33,34].
In this paper, Industry 4.0, activity-based costing and environmental issues are combined to improve the efficiency of green production. This paper considers the environmental issues of carbon emissions, energy recycling, and waste reuse, and uses a mathematical programming model with Activity-Based Costing (ABC) and the Theory of Constraints (TOC) to achieve profit maximization. This paper discusses the combination of mathematical programming and Industry 4.0 techniques to achieve the purpose of green production planning and control for the textile industry in the new era. The mathematical programming model is used to determine the optimal product mix under various production constraints, while Industry 4.0 techniques are used to control the production progress to achieve the planning targets. With the help of an Industry 4.0 real-time sensor and detection system, it can achieve the purposes of recycling waste, reducing carbon emission, saving energy and cost, and finally achieving a maximization of profit. With the approach proposed in this paper, corporations can simultaneously control the impact on the environment and ensure their profitability.
The remainder of this paper is organized into five sections. Section 2 describes the research background of this research. Section 3 develops the green production planning model under ABC. An illustrative case study is presented in Section 4 to demonstrate how to apply the model proposed in this paper and to conduct the sensitivity analysis of the direct material discount. Manufacturing execution system for production control under Industry 4.0 in the textile industry is explained in Section 5. Finally, discussions and conclusions are presented in Section 6 and Section 7, respectively.

2. Research Background

2.1. Brief of Industry 4.0

From the eighteenth century up to today, there have been four industrial revolutions. The first industrial revolution started with the invention of the steam engine and led to a manual-production industry. The second included the use of electrical energy and assembly lines for mass production. The third was marked by the emergence of the computer, IT systems and automation. The fourth industrial revolution is called Industry 4.0; it combines the new technologies of Cyber-Physical Systems (CPS), Internet of Things (IoT), big data and cloud computing to enhance production efficiency [35,36]. Industry 4.0 is a new developmental stage rather than an extension of the third industrial revolution. It is especially suited to mass customization production. By means of CPS and IOT, machines can communicate with each other and send data in real time to systems and people [37,38].
Manufacturing operations have been transformed from traditional production into intelligent production. Industry 4.0 faces increased competitiveness and more complex challenges in dealing with the status of demographic changes, production processes, resources and the environment [39,40]. Hence, Industry 4.0 will solve problems with the use of CPS and IoT. Enterprises need vertical integration by the use of networks. CPS can connect resources and products through large data analysis and intelligent sensing technology to automate the monitoring of plant inventory, demand and equipment failure, and is well suited for maintenance management. At the same time, all the processing stages of the production process are recorded, including product variability, order modification, quality instability or machine failure, and other factors. As a result, material wear can be more effectively controlled, and waste in the production process will be reduced, thus increasing efficiency. However, enterprises also need horizontal integration of the production process, from purchasing, production and even sales, or from suppliers to the company, and finally to the customer. It is not only applicable to the production stage, but also extends to commodity development, subscriptions, plans, assembly and distribution, to ensure quality, time control, risk, price and environmental protection; in so doing, other factors in the entire value chain of each link are immediately controlled [5,38,41].
For the textile industry, Küsters et al. claimed that there are the following Industry 4.0 applications: (1) Status monitoring for real-time process parameters; (2) Product shadow for tracking the product production cycle; (3) Digital assistant system for instructing operators; (4) Digital performance management for problem solving by providing the digital Key Performance Indicator (KPI) board; (5) Automated Guided Vehicles (AGV) for material handling; (6) YET for analyzing Yield, Energy, and Throughput; (7) iCycle time for real-time line balancing; (8) Real-time WIP for real-time tracking of the Work-In-Process; (9) Predictive maintenance for breakdown prevention by the analysis of Big Data; (10) Smart routing and work station setup for self-adjusting work stations; (11) In-line Quality Control (QC) and adaptive machining by using the parameter or image analysis of Big Data; (12) Human-machine collaboration; (13) 3D printing for tailored production components; and so on [9].

2.2. The Influence of Industry 4.0 and Green Production on the Textile Industry

The textile industry is one of the major sources of environmental pollution in the industrial world [42]. The main environmental problems are those attributable to carbon emissions and the discharge of untreated wastewater. Recently, there has been an increased awareness of the need for environmental protection and green production. It is therefore obligatory that the textile production process must conform to the required standards of emissions.
The textile industry’s Industry 4.0 requires the digital factory. Its core technology is Cyber-Physical Systems (CPS). This is the real equipment’s computer software mapping. Every step of the production process is compiled in the virtual world to establish a high simulation of digitalism in the virtual and real worlds; this process will be simulated and optimized on the materials, products and factories in the real physical world. Next, the Internet of Things (IoT) is used to gather information by sensor, Programmable Logic Controller (PLC), visual equipment, etc., to transfer information through the Internet to accomplish Human-Computer Interaction (HCT) [43,44,45]. Then, using the Internet to transmit information, people or machines can be operate based on the data collected for analysis and decision-making, with objects controlled by connection to the Internet for the implementation of the tasks and decision-making; objects connected with the Internet can even communicate and cooperate with each other directly.
The textile industry is a labor-intensive industry, and its complex manufacturing processes and long supply chain characteristics mean that large variety and small volume customized production requires an “intelligent” factory [46,47]. Industry 4.0, as it relates to the textile industry, has three characteristics: production network, Cyber-Physical Systems (CPS) and Internet of Things (IoT). In the smart factory, CPS is the real equipment’s software mapping in the computer. Every step of the production process may be compiled in the virtual world to establish high level digital simulation of in the virtual and real world. The process will simulate and optimize the materials, products and factories of the real physical world. Manufacture execution systems (MES) will manage the master data, situation and maintenance records of equipment, like helping suppliers in the production value chain obtain and exchange real-time production information, and ensure that all of the components supplied by the supplier will arrive at the right time in the right order [48,49].
Industry 4.0 is more than machine automation; it involves the whole production process. First, there is real-time monitoring, digitizing and the setting up of the cyber-physical systems for the plant’s machinery. The manufacturer sets the sensors on the machines and concatenates all of them via a network to continuously collect production data and send the data to the enterprise resource planning system (ERP) [50,51,52,53,54]. Then there is the gathering and organizing of data to be sent to the cloud platform to analyze the big data [37,55]. Cloud platforms serve just like human vertebra; they are vertical integrations of systems from upstream to downstream. According to customer demand, material supply may be changed via machine-to-machine conversation and real-time status monitoring [55,56,57]. In the past, production was limited by the extant technology. Since different lengths of cloth consume almost the same amount of dye and water, the product yield is less and the cost is higher. While it was very difficult to achieve large variety and small volume manufacturing, the smart factory solves the problem of the cost of customized production, matching the cost of mass production [58].

3. Green Production Planning Model under ABC by Using Mathematical Programming

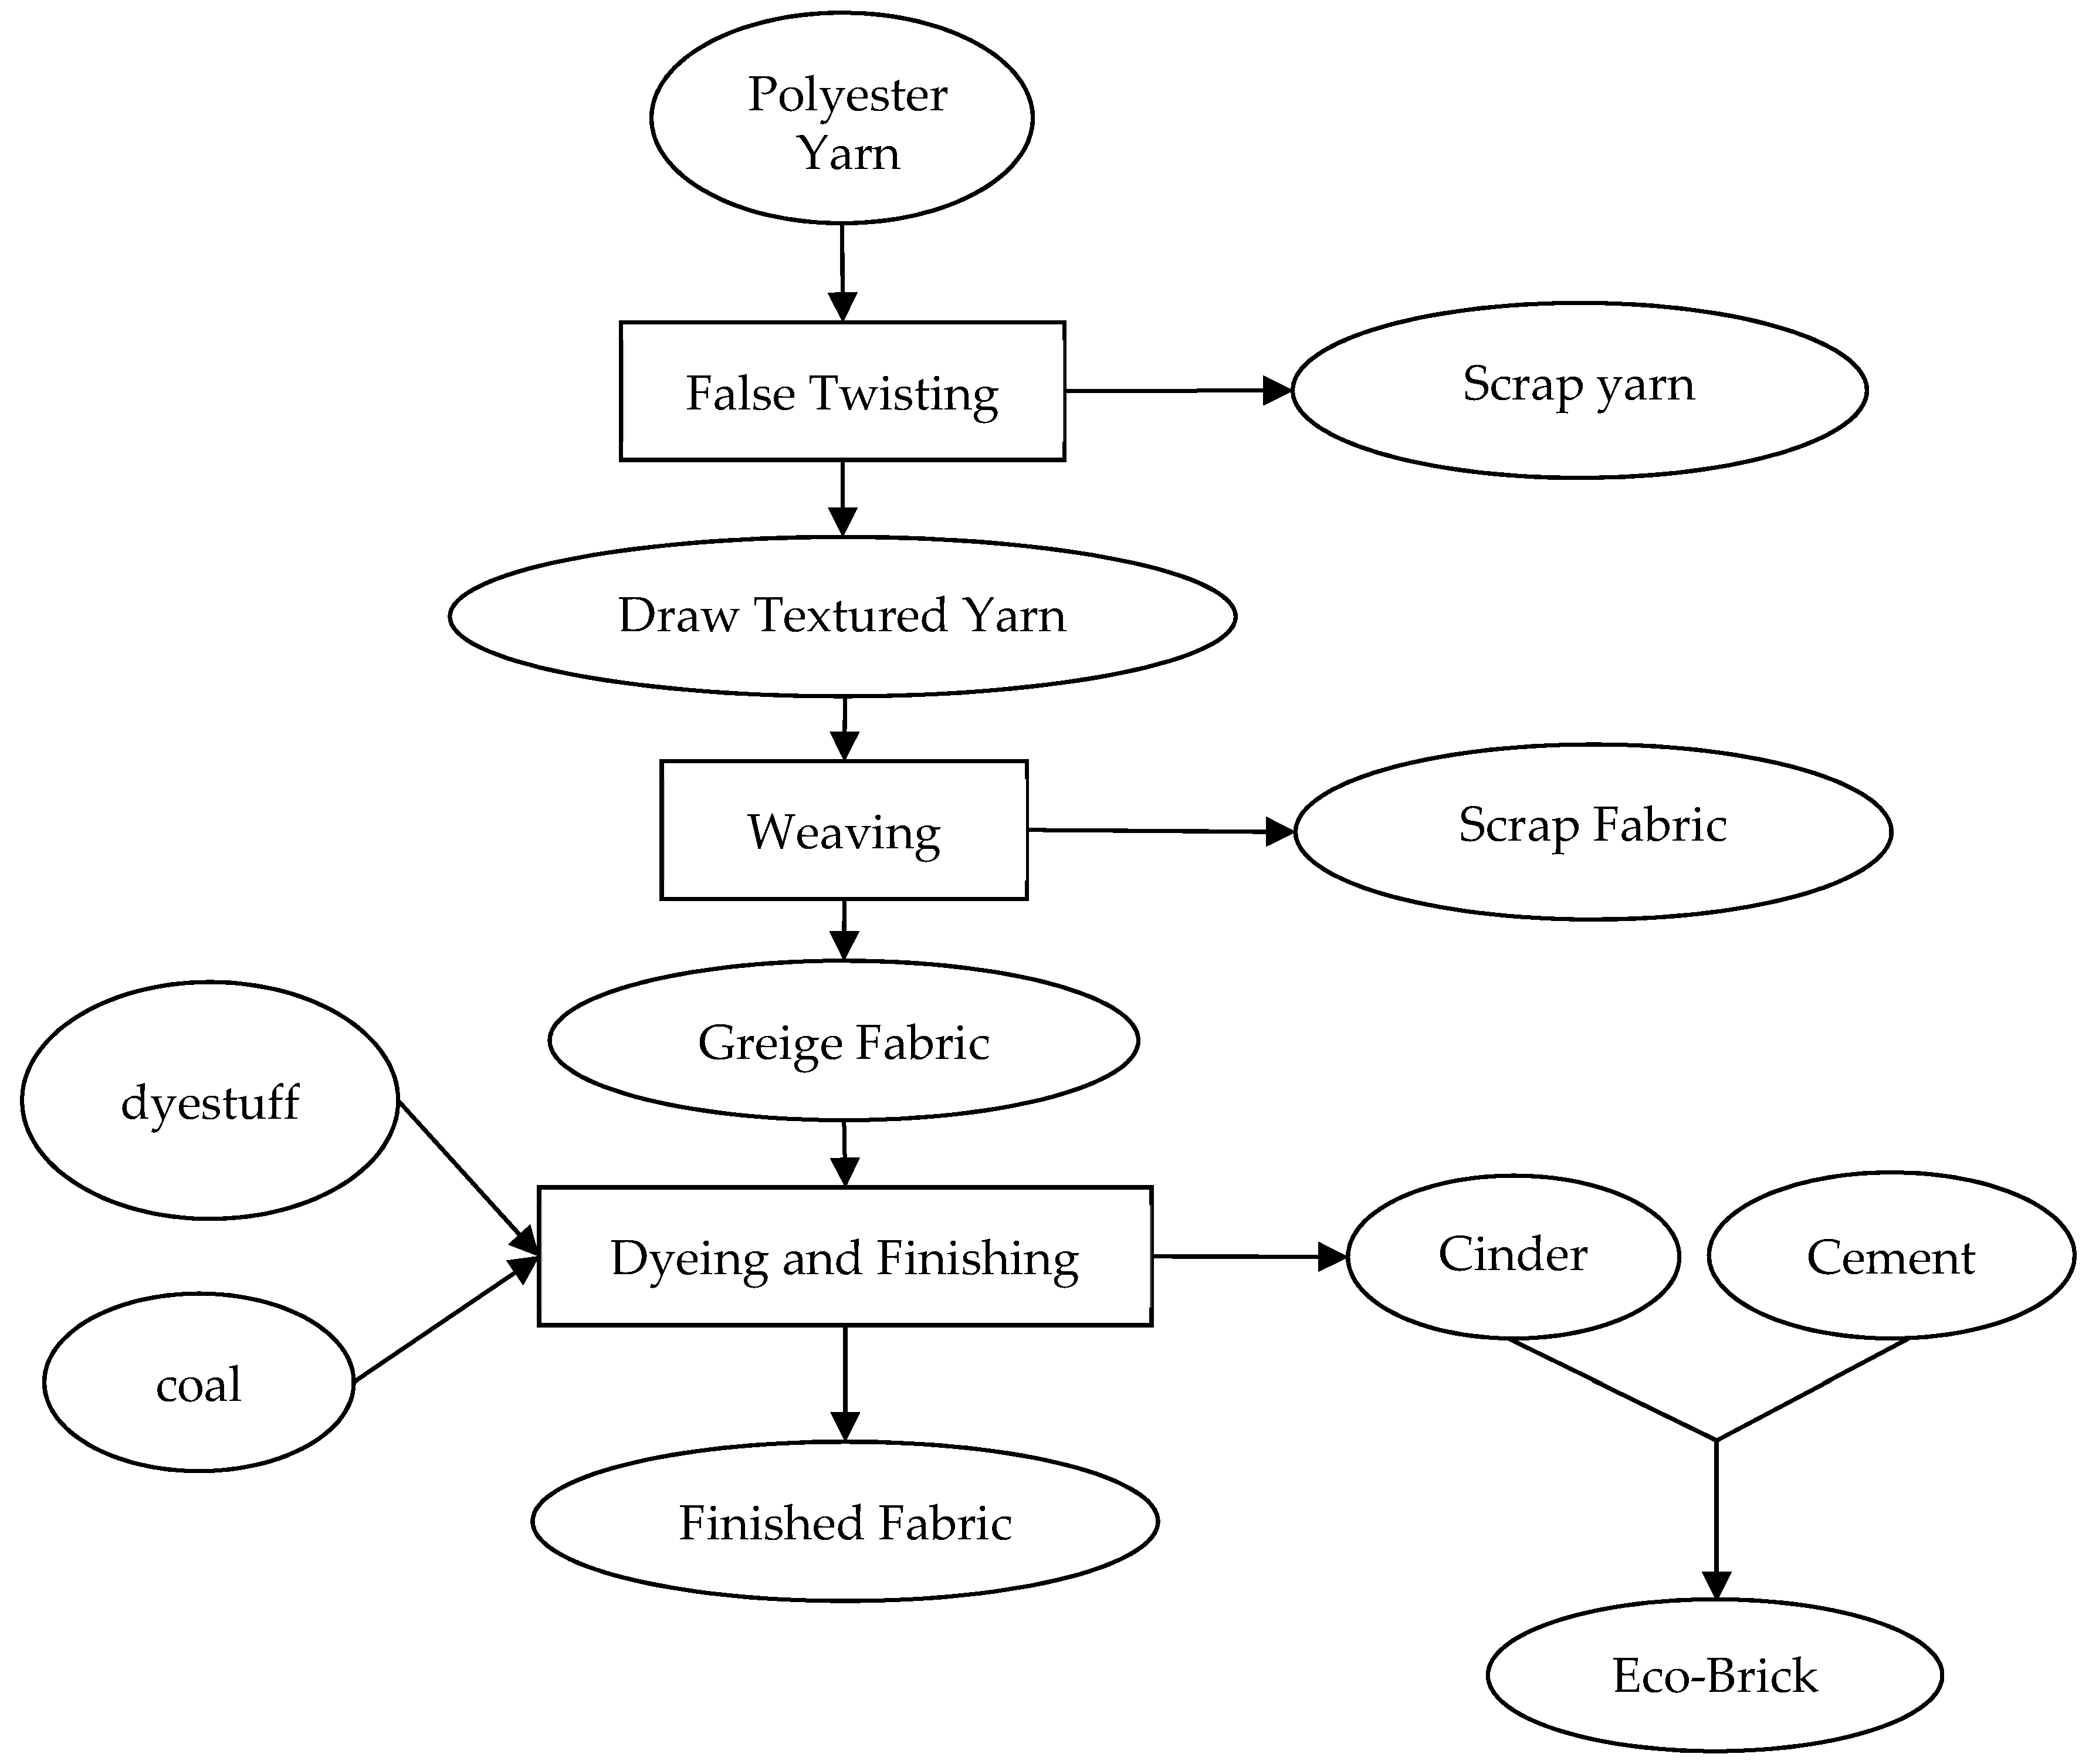
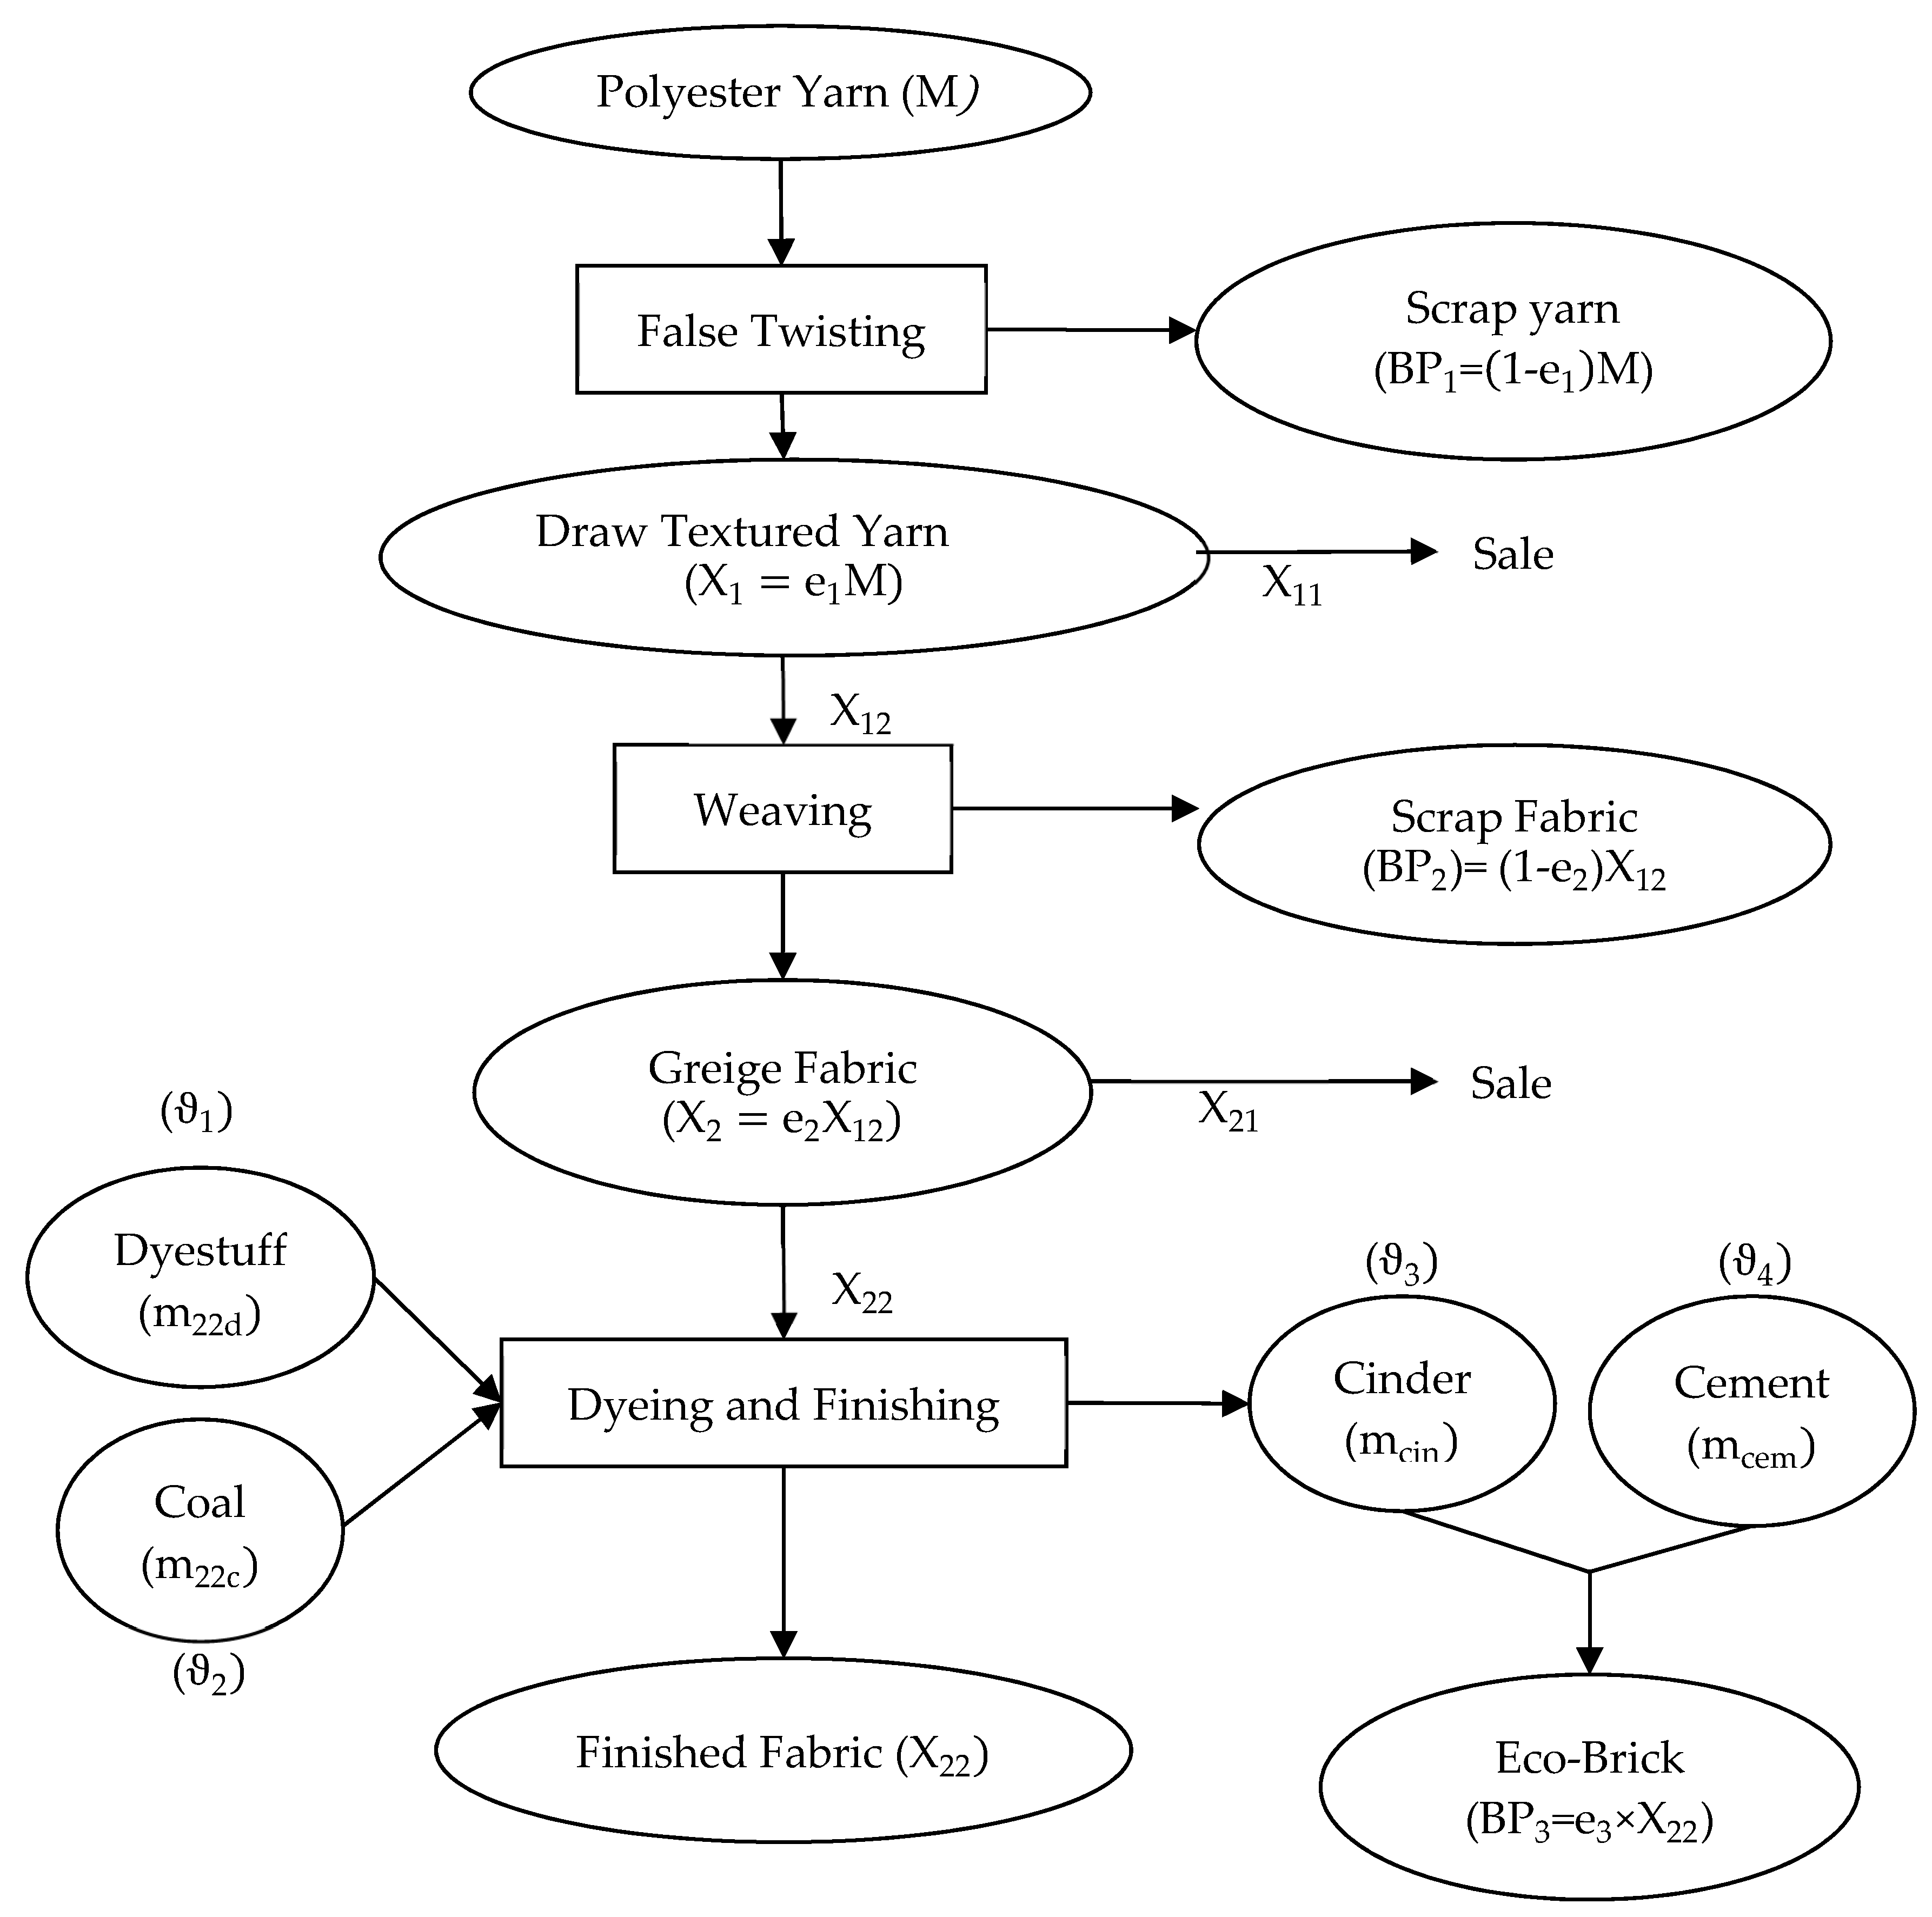
3.1. A Production Process for a Typical Textile Company

The traditional textile industry is a labor-intensive. Every process needs a lot of workers to complete the product [46,47]. The product is a result of yarn spinning, weaving, dyeing and finishing. There are three main processes involved in fabric production as shown in Figure 1. The first step is yarn production made from fibers by drawing and twisting bobbins together and then spinning it to turn in into yarn. The next step is the weaving. The weaving machine requires two sets of the yarn: warp and weft set, and the two sets of yarn are then joined together by weaving. The fabric made from the looms without any further processing is called greige fabric. Next, the fresh greige fabric is stained, but as it still contains impurities, it must be washed. The fabric is then dyed in a high temperature, high pressure dyeing machine. Finally, the fabric is given a special tactile impression and function, like smooth, suede, waterproof, wrinkle-free, non-felting, flame retardant, etc. Currently, as a result of the development of science and technology, enterprises can vertically integrate all aspects of the textile industry, so that the quantity and quality can be self-controlled.
In addition, dyeing machines require high heat, often produced by coal in the dyeing and finishing process, but burning coal is harmful to the environment, A plant will mix the waste cinder with cement to produce the light texture and good permeability of ecological bricks (eco-brick). The production of eco-bricks is not only beneficial to the environment, but also saves costs by avoiding the expenses incurred by shipping out the cinders

3.2. Assumptions

To develop vertical integration following the Industry 4.0 decision model and without loss of generality (WLOG), this paper discuss the classic textile production process in the following. One unit material processed in the process of twisting will produce e1 units of draw textured yarn and (1 − e1) units of scrap include false yarn. Drawn textured yarn can not only be sold, but may be further processed; scrap yarn will be sold at a lower price. After further processing by weaving, it will produce e2 units of greige fabric and (1 − e2) units of scrap fabric. Greige fabric can be sold or further processed. The final process is that of dyeing and finishing, and then the finished fabric is produced.
Except for assumptions of the production process, the green production of the Industry 4.0 decision model purposed has the following assumptions. First, the activities are categorized as unit-level and batch-level; resource drivers and activity drivers connect with ABC and Theory of Constraints (TOC) [23,24,25]. Second, the model does not involve capacity expansion and outsourcing of resources and materials, such as machine hours. Third, the labor working hours can be enhanced through overtime work with higher wage rates conforming to government regulations. Fourth, when the material quantity exceeds the threshold quantities, the purchaser obtains a piecewise price discount for all material resources. Fifth, the cost of CO2 emissions is dependent on emission quantities that are taxed at different rates as a piecewise variable cost. Sixth, water and heat resulting from energy recycling save costs. Seventh, fixed costs include machine costs, depreciation and other required production costs.

3.3. Objective Function

The objective function of the green production planning model under ABC and Industry 4.0 is as follows:
Maximize π = Total Revenue of main product + Revenue of by product − Total material cost − Total direct labor cost − Carbon tax − Energy recycling cost saving − Total other fixed cost
π = [ P 1 X 11 + P 2 X 21 + P 3 X 22 + β 1 ( 1 e 1 ) M + β 2 ( 1 e 2 ) X 12 + β 3 e 3 X 22 ] [ ( C 1 M + C 2 m 22 d ) + ( C 3 m 22 c + C 4 m 22 m ) ] [ L 0 + η 1 r ot ( Q 1 G 0 ) ] [ δ 1 r c 1 ( TC 1 GC 0 ) + δ 2 r c 2 ( TC 2 GC 0 ) ] + ( C 5 RE h + C 6 RE w ) F ,
where
P i The unit selling price of i product
X 11 The selling quantities of drawn textured yarn
X 12 The future processing quantities of drawn textured yarn
X 21 The selling quantities of greige fabric
X 22 The selling quantities of finished fabric
β i The unit selling price of i by-product
e 1 The input-output coefficient from POY to drawn textured yarn and scrap yarn
e 2 The input-output coefficient from textured yarn to greige fabric and scrap fabric
e 3 The input-output coefficient of Eco-Brick
C 1 , C 2 , C 3 , C 4 The unit material cost of M , m 22 d , m 22 c and m 22 m
C 5 , C 6 The unit recycle saving cost of heat and water
M The material quantities of POY
m 22 d The material quantities of dye
m 22 c The material quantities of cinder
m 22 m The material quantities of cement
L 0 The direct labor cost of available normal hours
η 0 , η 1 Special ordered sets of type 1 (SOS1) of 0/1 variables, where only one variable will be 1
r ot The wage rate of the total direct labor hours in overtime work situations
Q 1 The overtime working hours (extend working hours to 2 hours per worker)
G 0 The limit of the normal direct labor hour
δ 0 , δ 1 , δ 2 Special ordered sets of type 1 (SOS1) of 0/1 variables, where only one variable will be 1
r c 1 The carbon tax rate of available normal CO2 emission quantities
r c 2 The carbon tax rate that produces excessive CO2 emission quantities
TC 1 The total CO2 emission quantities in normal production
TC 2 The total CO2 emission quantities that produces excessive CO2 emission quantities
GC 0 No charge for CO2 emission quantities
RE h , RE w Green energy recycling saving quantities of heat and water
F Fixed cost

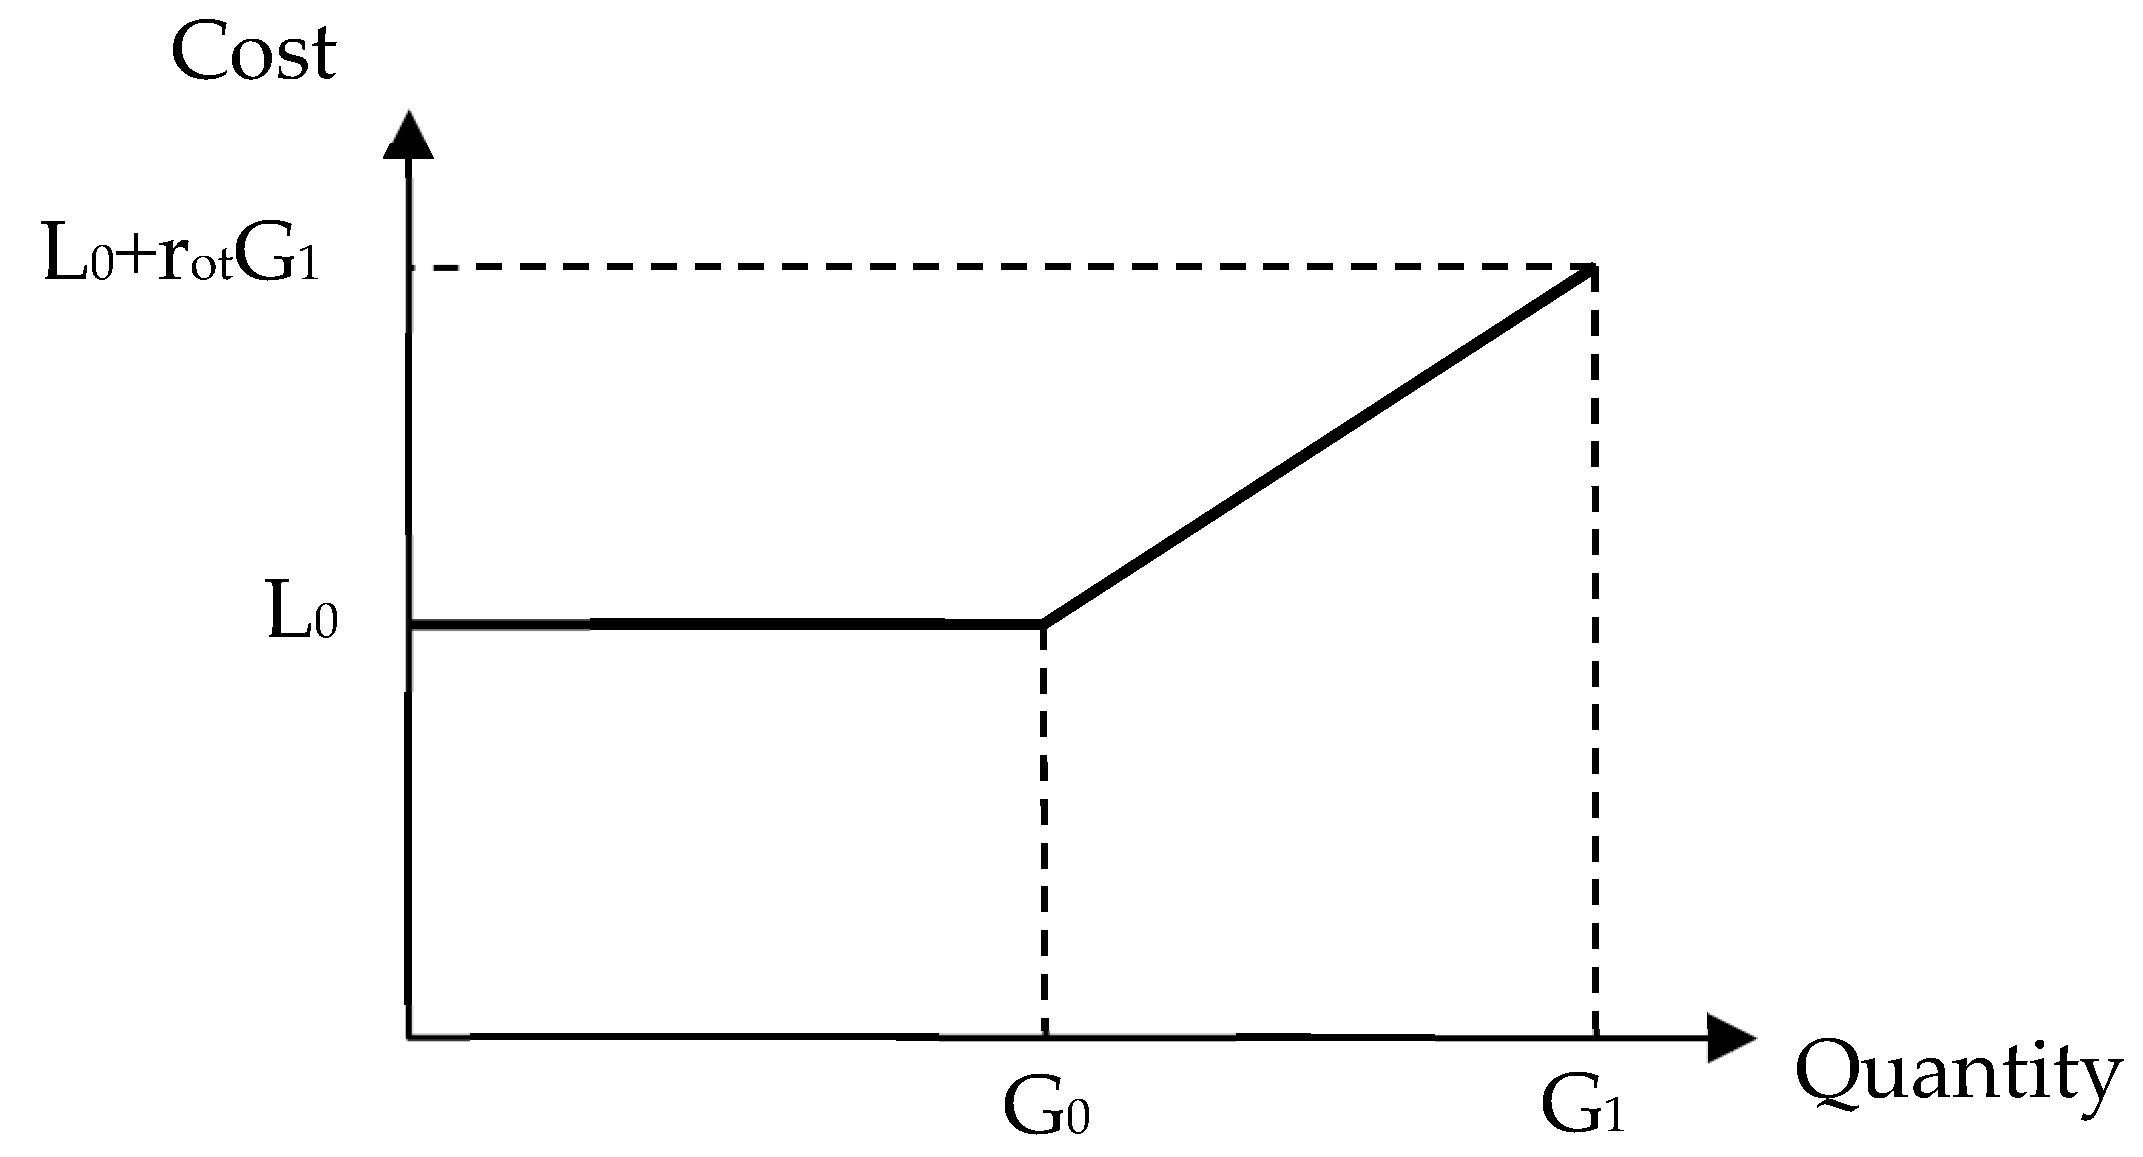
3.4. Unit-Level Direct Labor Cost Function

Assume that overtime work can expand the direct labor resources, and labor is used for handling the material and products. The total cost function of direct labor is the piecewise linear function, as shown in Figure 2. The available normal direct labor hours are G 0 and the direct labor hours can be expanded to G 1 with the total direct labor cost respectively being L 0 and L 0 + m 1 G 1 at G 0 and G 1 . As well as the handling and setup, direct labor is also needed to transfer the products to the next plant. The setup of direct labor hours incudes the time required to replace material or reset programs during each batch start in the dyeing process, like the setup of dyestuff. The total direct labor cost is L 0 + η 1 r ot ( Q 1 G 0 ) in Equation (1), and the associated constraints are shown in Equations (2)–(5):
l 1 M + l 2 X 12 + l 3 X 22 + μ 01 B 01 + μ 12 B 12 + μ 10 B 10 + μ 23 B 23 + μ 20 B 20 + μ 30 B 30 + ω   BS = Q 0 + Q 1
0 Q 0 η 0 G 0 ,
η 1 G 0 < Q 1 η 1 G 1 ,
η 0 + η 1 = 1 ,
where:
l 1 The direct labor hours required by M
l 2 The direct labor hours required by X 12
l 3 The direct labor hours required by X 22
μ s , e The direct labor hours of the handling of each batch-level activity from start to finish
B s , e The product of shipping from start to finish in terms of quantities needed at each batch-level
ω Each batch of direct labor hours of setup
BS The setup product in terms of quantities of each batch-level
Q 0 The total direct labor hours in the normal working hour
Q 1 The overtime working hours (extend working hours to 2 h per worker)
G0The limit of the normal direct labor hour
G1The limit of the overtime work direct labor hour
η 0 ,   η 1 Special ordered sets of type 1 (SOS1) of 0/1 variables.

3.5. Batch-Level Activity Cost Function for Material Handling and Setup Activities

Batch-level activity in the production includes material and products handling from the start to finish; when the goods are finished, they will be shipped back to the plant awaiting sale. The other activity is the material dyestuff setup:
M σ 01 B 01 ,
X 12 σ 12 B 12 ,
X 11 + ( 1 e 1 ) M σ 10 B 10 ,
X 22 σ 23 B 23 ,
X 21 + ( 1 e 2 ) X 12 σ 20 B 20 ,
X 22 + e 3 X 22 σ 30 B 30 ,
X 22 λ   BS ,
where
σ s , e The quantity of handling of each batch-level activity from start to finish
λ The quantity of setup of batch-level activity

3.6. Carbon Tax Function

Global warming is an important issue. Reducing the greenhouse effect is a primary concern, and one of the main factors affecting the greenhouse effect is that of carbon dioxide emissions [1,59,60,61]. The textile industry is the one of the major industries guilty of excessive CO2 emissions in global manufacturing, especially in the dyeing and finishing process [62,63,64]. Assume that CO2 emissions are taxed at different rates as a piecewise variable cost as shown in Figure 3. When CO2 emissions are well controlled according to particular criteria, there is free carbon tax in TC 0 . The standard of the CO2 emissions is TC 1 , and the tax will be higher than the standard when CO2 emissions exceed GC1 and become TC 2 . The total carbon tax cost is δ 1 r c 1 ( TC 1 GC 0 ) + δ 2 r c 2 ( TC 2 GC 0 ) as shown in Equation (1), and the associated constraints are Equations (13)–(17):
q c X 22 = TC 0 + TC 1 + TC 2 ,
0 TC 0 δ 0 GC 0 ,
δ 1 GC 0 < TC 1 δ 1 GC 1 ,
δ 2 GC 2 < TC 2 ,
δ 0 + δ 1 + δ 2 = 1 ,
where:
q c The total CO2 emission quantities in the dyeing and finishing process
TC 0 The total CO2 emission quantities where there is no charge in standard range
TC 1 The total CO2 emission quantities in normal production
TC 2 The total CO2 emission quantities that produces excessive CO2 emission quantities
GC 0 No charge for CO2 emission quantities
GC 1 Carbon tax cost of normal capacity
GC 2 Carbon tax cost for over emission capacity
δ 0 ,   δ 1 ,   δ 2 Special ordered sets of type 1 (SOS1). The summation of 0/1 variables is 1

3.7. Energy Recycling

The textile industry, during the dyeing and finishing processes, needs to generate a lot of heat. It generally uses heat from burning coal, steam boilers, and medium heat boilers and heating furnaces. The use of its high temperature and air heat transfer can enhance the combustion air temperature, and reduce the exhaust temperature to achieve waste heat recovery purposes [65,66]. However, the textile industry is also a heavy consumer of water [42]. It is therefore evident that water recycling and reuse is also an important wastewater treatment issue [67]. Heat and water are used mainly in the dyeing and finishing process [68]; thus, energy recycling of heat and water will vary with the production quantity of the finished fabric. The energy recycling cost saving for heat and water are C 5 RE h and C 6 RE w , respectively, in Equation (1), and the associated constraints are Equations (18) and (19):
RE h = ρ 1 × X 22
RE w = ρ 2 × X 22
where:
ρ 1 The relation coefficient between energy recycling of heat and X 22
ρ 2 The relation coefficient between energy recycling of water and X 22

3.8. Input-Output Relationship

The amount of material input and product output differs because the material suffers loss in the production process, such as in the weaving process. Fabric is made of yarn, and some scrap from the fabric articles will remain that is the input-output coefficient. X 12 is the quantity of yarn, e 2 X 12 is the quantity of fabric and ( 1 e 2 ) X 12 is the quantity of scrap fabric, as below:
X 1 e 1 M = 0 ,
X 1 = X 11 + X 12 ,
X 2 e 2 X 12 = 0 ,
X 2 = X 21 + X 22 ,
M = e 1 M + ( 1 e 1 ) M ,
X 12 = e 2 X 12 + ( 1 e 2 ) X 12 = 0 ,
BP 1 = ( 1 e 1 ) M ,
BP 2 = ( 1 e 2 ) X 12 ,
BP 3 = e 3 × X 22 ,
m 22 d = ϑ 1 × X 22 ,
m 22 c = ϑ 2 × X 22 ,
m cin = ϑ 3 × m 22 c ,
m cem = ϑ 4 × m cin ,
where
BP i The quantities of i byproduct
ϑ 1 The relation coefficient between m 22 d and X 22
ϑ 2 The relation coefficient between m 22 c and X 22
ϑ 3 The relation coefficient between m cin and X 22
ϑ 4 The relation coefficient between m cem and X 22
Textile manufacturing process with the symbols of quantity variables mentioned in Equations (20)–(32) is shown as Figure 4.

3.9. Other Sale and Production Constraints

There are three kinds of machines to generate products. A twisting machine is used to false twist the yarn, a loom is used to weave the fabric, and a dyeing and finishing machine is used to dye the fabric and give the fabric other special qualities. Those are limiting machines in so far as their efficiency is limited by the material, operator, and machine maintenance time [69]. Therefore, producing a product requires limited machine hours, including twisting machine hours ( h 1 ), weaving machine hours ( h 2 ) and dyeing and finishing machine hours ( h 22 ), as expressed in the following Equations (23)–(25):
Machine hour constraints:
h 1 M H 1 ,
h 2 X 12 H 2 ,
h 22 X 22 H 22 ,
where:
h 1 the resources of machine hours of false twisting
h 2 the resources of machine hours of weaving
h 22 the resources of machine hours of dyeing and finishing
H 1 The limited machine hours of false twisting
H 2 The limited machine hours of weaving
H 22 The limited machine hours of dyeing and finishing

4. Illustrative Case

4.1. Illustrative Data and Optimal Decision Analysis

The model assumes that the textile factory is a vertically integrated plant that uses one material to produce three different products, which are similar to the joint-product model. After the production of false twist yarns with a raw yarn, part of the drawn textured yarn is sold while the rest continues to be processed into greige fabric. Part of the embryo fabric is sold, the rest undergoes dyeing and finishing procedures, and finally a high price finished fabric is produced. The associated costs in this model include: (1) Unit-level activity: material costs and director labor cost, (2) Batch-level activity: material and product handling and setup of the dyeing process, (3) environment-level activity: carbon tax and energy recycling cost, (4) Fixed cost: To more effectively trace and identify cost in the production, our model considers related production costs which include depreciation, land, plant and equipment as fixed cost to accurately evaluate production. This model can also be used to help corporations find the optimal solution to effectively decrease production cost by means of an optimal product portfolio and resource allocation.
The production data for production planning model for the production process of Figure 1 are presented in Table 1 and Table 2. In this model, assume that there are three products and three by-products that can be sold: draw textured yarn ( X 11 ), greige fabric ( X 21 ), finished fabric ( X 22 ), scrap yarn ( β 1 ), scrap fabric ( β 2 ) and eco-brick ( β 3 ). The unit prices of products are 97,000, 135,000, 202,500, 570, 2100 and 2300 NTD, respectively, per ton. The main purpose of this model is to accurately estimate production to ascertain cost objectives and operation of production to help corporations control related costs and increase profit.

4.2. Optimal Solution Analysis

The green production planning model for the example data is shown in Table 3, which is a mixed integer programming (MIP) model, and the optimal solution is shown in Table 4, which is obtained by using Lingo 16.0.
In Table 4, the optimal solution in the model indicates the optimal product portfolio where the profit is 3,361,133,000 NTD from three products and three by-products. The total revenue is (4,371,466,156 NTD) which is comprised of three products: Draw Textured Yarn (1,327,368,370 NTD), Greige Fabric (69,285,713 NTD) and Finished Fabric (2,355,713,870 NTD). Product quantities are (13,684.21/ton, 714.29/ton, 24,285.71/ton) m 22 d (15,785.71), m 22 c (2428.57), and M (41,666.67). Besides, the by-product revenue of eco-brick is (3,833,334 NTD) ( β 3 e 3 X 22 ) and the energy recycling cost saving for heat and water is (1,384,286 NTD) ( C 5 RE h ) and (2,477,143 NTD) ( C 6 RE w ), respectively.
Three kinds of machine hours relate to false twisting (120,000), weaving (100,000), and dyeing and finishing (121,428.55). Carbon tax costs are (120,000,000 NTD), and CO2 emission quantities are (1200/ton). Therefore, the mathematical programming in this model combining ABC and TOC, as well as the constraint of carbon emissions, can reduce production costs and enhance profit through the efficient distribution of resources.

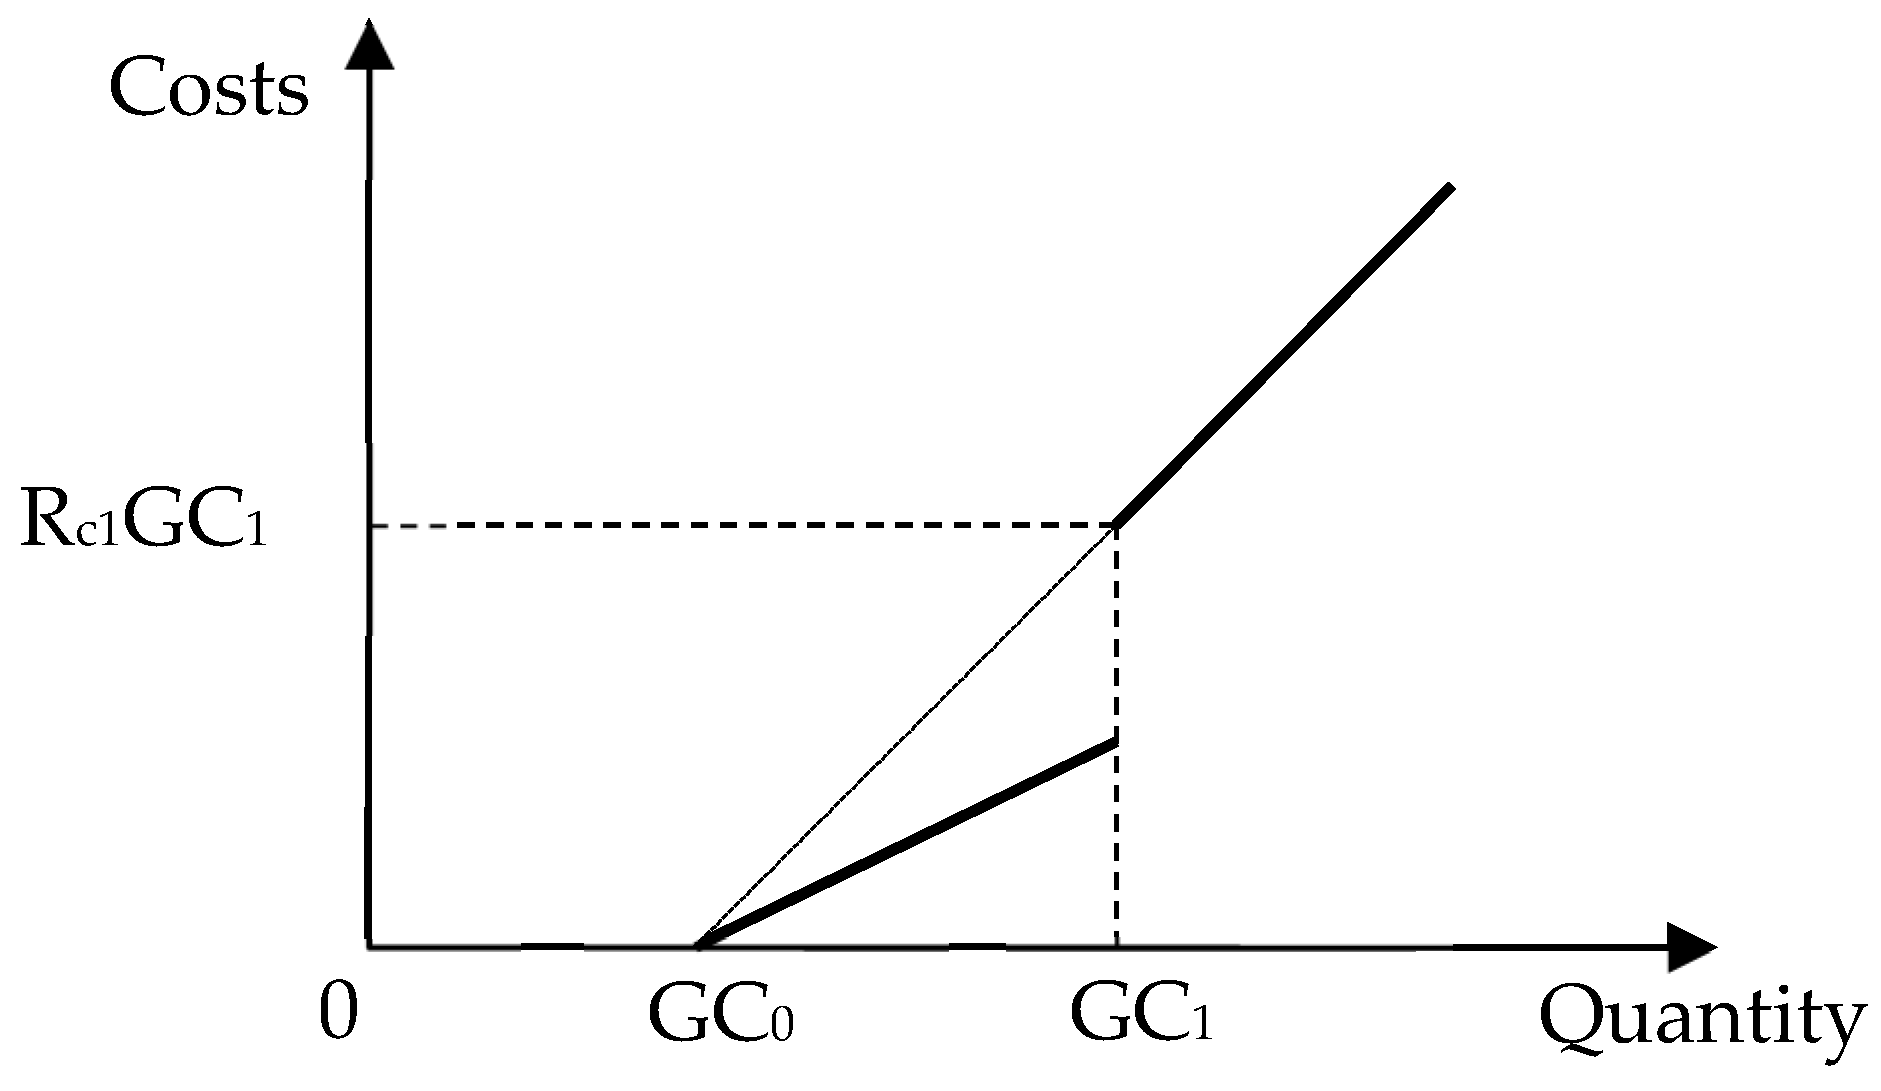
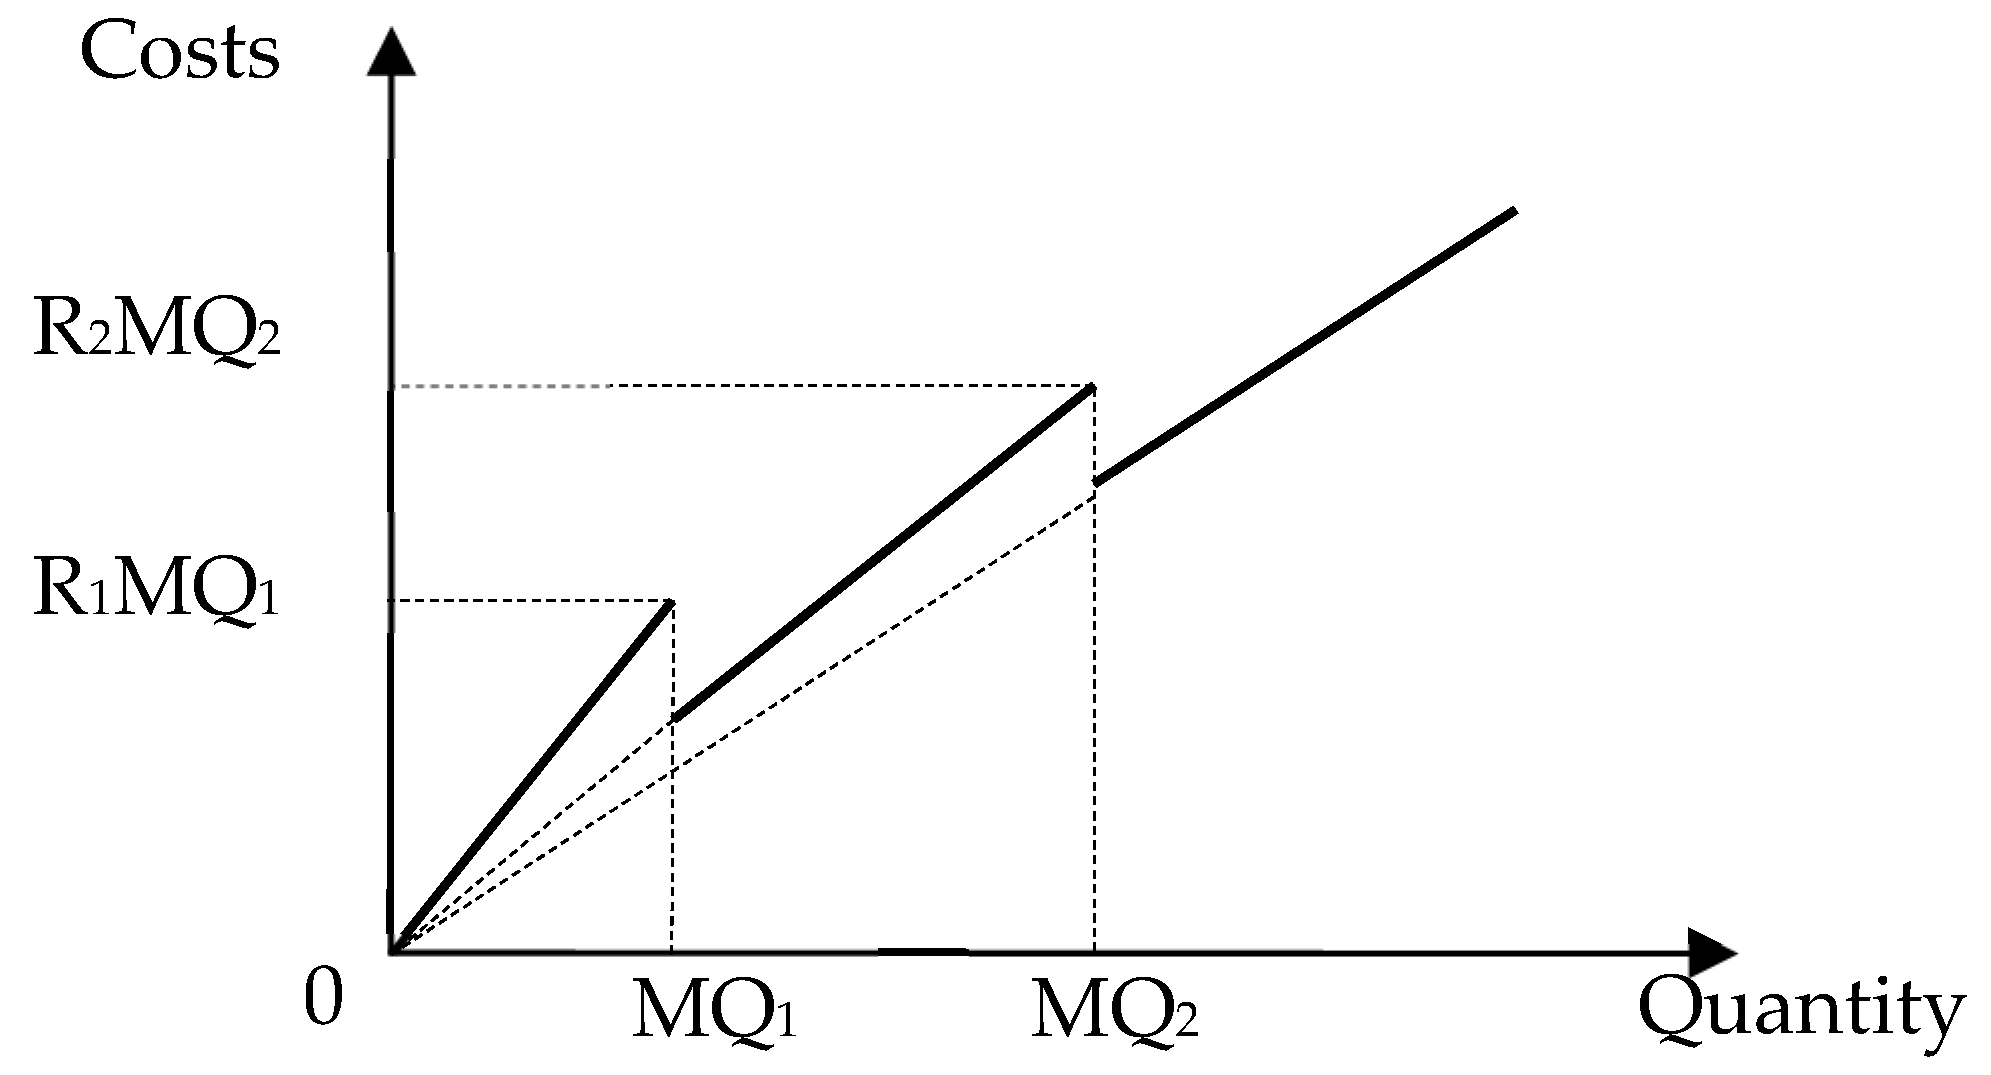
4.3. Sensitivity Analysis of the Quantity Discount of Direct Material

Considering the quantity discount of direct material, this paper divided the material purchase discount pricing into high, medium and low degree levels [70,71]. This study used three segments of piecewise linear function, as shown in Figure 5. In Equations (35)–(40), this paper replaces the former material cost ( C 1 M ) to become three segments of piecewise discount ( R 1 · MT 1 + R 2 · MT 2 + R 3 · MT 3 ) . For example, when the amount of material is more than MQ1, the material cost would become R1 and the total material cost would be (R2MT2).
Our corporation in this model obtains the highest discount pricing. It indicates that the material cost would be from R2 to R3; the quantities that a plant buys and the total cost of materials are shown as (MT3R3):
π = P 1 X 11 + P 2 X 21 + P 3 X 22 + β 1 ( 1 e 1 ) M + β 2 ( 1 e 2 ) X 12 + β 3 · e 3 X 22 [ ( R 1 · MT 1 + R 2 · MT 2 + R 3 · MT 3 ) + C 2 m 22 d + C 3 m 22 c + C 4 m 22 m ] [ L 0 + η 1 r ot ( Q 1 G 0 ) ] [ δ 1 r c 1 ( TC 1 GC 0 ) + δ 2 r c 2 ( TC 2 GC 0 ) ] + C 5 Re F ,
M = MT 1 + MT 2 + MT 3 ,
0 MT 1 φ 1 MQ 1 ,
φ 2 MQ 1 < MT 2 φ 2 MQ 2 ,
φ 3 MQ 2 < MT 3 ,
φ 1 + φ 2 + φ 3 = 1 ,
where:
MT 1 The original price of the amount of material
MT 2 The amount of material in the first gradation of the price discount
MT 3 The amount of material in the second gradation of the price discount
MQ 1 The original price of the maximum amount of material
MQ 2 The maximum amount of material in the first gradation of the price discount
φ 1 ,   φ 2 ,   φ 3 Special ordered sets of type 1 (SOS1). The summation of 0/1 variables is 1.
Moreover, this research proposes a sensitivity analysis to measure the cost of materials in the discount pricing function to increase our understanding of material price in terms of how they affect a company’s cost and revenue [72]. Sensitivity analysis in this model uses material discount cost and normal material cost to test three kinds of material cost. The interval of cost variation ratio (%) is 5%, from −20% to 20%. The results of the sensitivity analysis of the direct material discount are shown in Table 5.
This research adjusted material cost (M) in the sensitivity analysis to estimate the impact on normal material cost with and without discount pricing. The price is altered by 5% from (−20%–20%). If (M)’s cost is raised 5%, the profit will be from (3,361,133 NTD to 3,225,716 NTD), and if the cost that includes discount pricing is changed, that profit would decrease from (3,361,133 NTD) to (3,510,091 NTD). When the cost is decreased by 10%, the profit is (3,496,549 NTD) without discount pricing, and including the discount, it is (3,753,841 NTD).
Even if the change is from 0% to 20% the other products would not change and earnings would be (158,103,200 NTD). However, when price of X1 is decreased by 12% to (1251), the quantities of X22 would become zero; when X2 is raised to (75399) except for continuing decreased volume of X1 (99,902) but changed rate to −16%, it is not too different from the original price for the product mix. On the other hand, if a corporation needs to increase profit, it only needs to increase the price of X1 because the increased price would not reduce the quantities of products. However, when prices are down, this not only cuts down the quantities of all of products, but also reduces a firm’s profit.
Therefore, the changed cost of material in the textile industry would not result in a significant change to a corporation’s profit even if costs decrease by 20%; however, the profit only increased by $3,902,799. When the profit variation ratio (%) changed to 16.12%, this means that when the material cost changes, the corporation’s profit would not increase or decrease significantly; even when considering discount pricing, the result is the same as the normal material cost.

5. Manufacturing Execution System for Production Control under Industry 4.0 in the Textile Industry

In the past, traditional manufacturing produced few types and huge amounts of products, but the Internet has currently changed the situation. Enterprises need to achieve rapid, small quantity and customization production. If an enterprise continues to transport and cooperate production data still in accordance with manual adjustment, then it simply cannot adapt to the demands of the current market [58].
Under Industry 4.0, the Manufacturing Execution System (MES) provides an important bridge between Shop Floor Control System (SFCS) and Enterprise Resource Planning (ERP) [55,57,73]. Compared to the old-fashioned MES, it is not only just scheduling, managing materials and contorting products to increase product yield and quality, but MES can collect data for cloud application and use data to control production process. There is also a need to embrace Corporate Social Responsibility (CSR) to effectively control carbon emissions, room temperature and sewage concentration [74].

5.1. Status Monitoring and Predictive Maintenance

MES can monitor the status of a plant and use the collected data for useful information about status monitoring and predictive maintenance. For successful status monitoring, MES need to meet the following conditions: first, a factory must be digitized and synchronized with networks to respond to actual situation changes in real time [75]. Second, three levels of enterprise management, production management and production must be vertically integrated via automation. Machine and plant control systems (PCS) shift data to react quickly to automation, and vertical integration can ensure that the information to other levels is accurate in the correct real time [76,77]. Third, the ability to exchange consistent data with other applications in production management level is an important attribute of the MES system; this is called horizontal integration. Fourth, the existing MES data are evaluated synthetically by data mining, and identify the quality data and process parameters’ they are then adjusted according to a self-optimizing system [48,55]. Fifth, it identifies multiple correlation data, as well as combines the information from MES and plant data to provide meaningful intelligence. Finally, factory machines need preventive maintenance through the data collection and analyzing parameters, in addition to regular maintenance. It is prudent to be warned before a machine malfunctions, thus decreasing the occurrence of unforeseen downtimes [48,78].

5.2. Work-in-Process Tracking

In Industry 4.0, MES can effectively track WIP and reduce losses that WIP causes through the abovementioned features. Work in process tracking is a significant application that aims to control work order, batch and unit production [55,79,80]. Moreover, WIP tracking can efficiently support plants to reduce costly problems such as cancelled orders, assembly errors, line of products downtime, and product recalls. Thus, efficient WIP tracking can offer traceability in all activities, and can effectively increase manufacturing effectiveness. To enable corporations to collect critical data and accurately track progress, the fundamental in WIP tracking is to build on barcode labeling that can accurately identify each item, and to put in place scanning technologies that can scan items as they go through the manufacturing, assembling, maintenance or testing processes [81,82]. These technologies enable the collection of critical data and accurately track progress for full traceability. That is to say, a corporation can more timely track orders to produce related-products through WIP tracking. Moreover, it can reduce the overall cost of production by reducing aspects of inventory. Thus, by effectively controlling cost and reducing WIP, a company can achieve zero inventory that reduces inventory costs, increases turnover and enhances profit to achieve profit maximization [83,84,85].

5.3. Quality Control

Recently, mass production of customized products in the textile industry has become increasingly important, but pressure is put on quality by the delivery times demanded by customers. In order to control quality, a plant needs to automatically collect data and history information through sensors and IoT technology, and then analyze and optimize process parameters to adjust them with the actual situation, thereby controlling and improving product quality [86,87]. Therefore, the key to Industry 4.0 is real-time communication and machine to machine connection between all systems [88,89]. Machines and equipment exchange data by communicating with each other, and a “smart” plant can record, analyze and make adjustments on its own to enhance the manufacturing process. Due to the need to integrate complex information in real time, achieving stand-alone systems and transparency are the problems on the shop floor that human-machine interaction need to solve [3,38].

6. Discussion

Some issues related to the textile industry and the case company are discussed in this section.

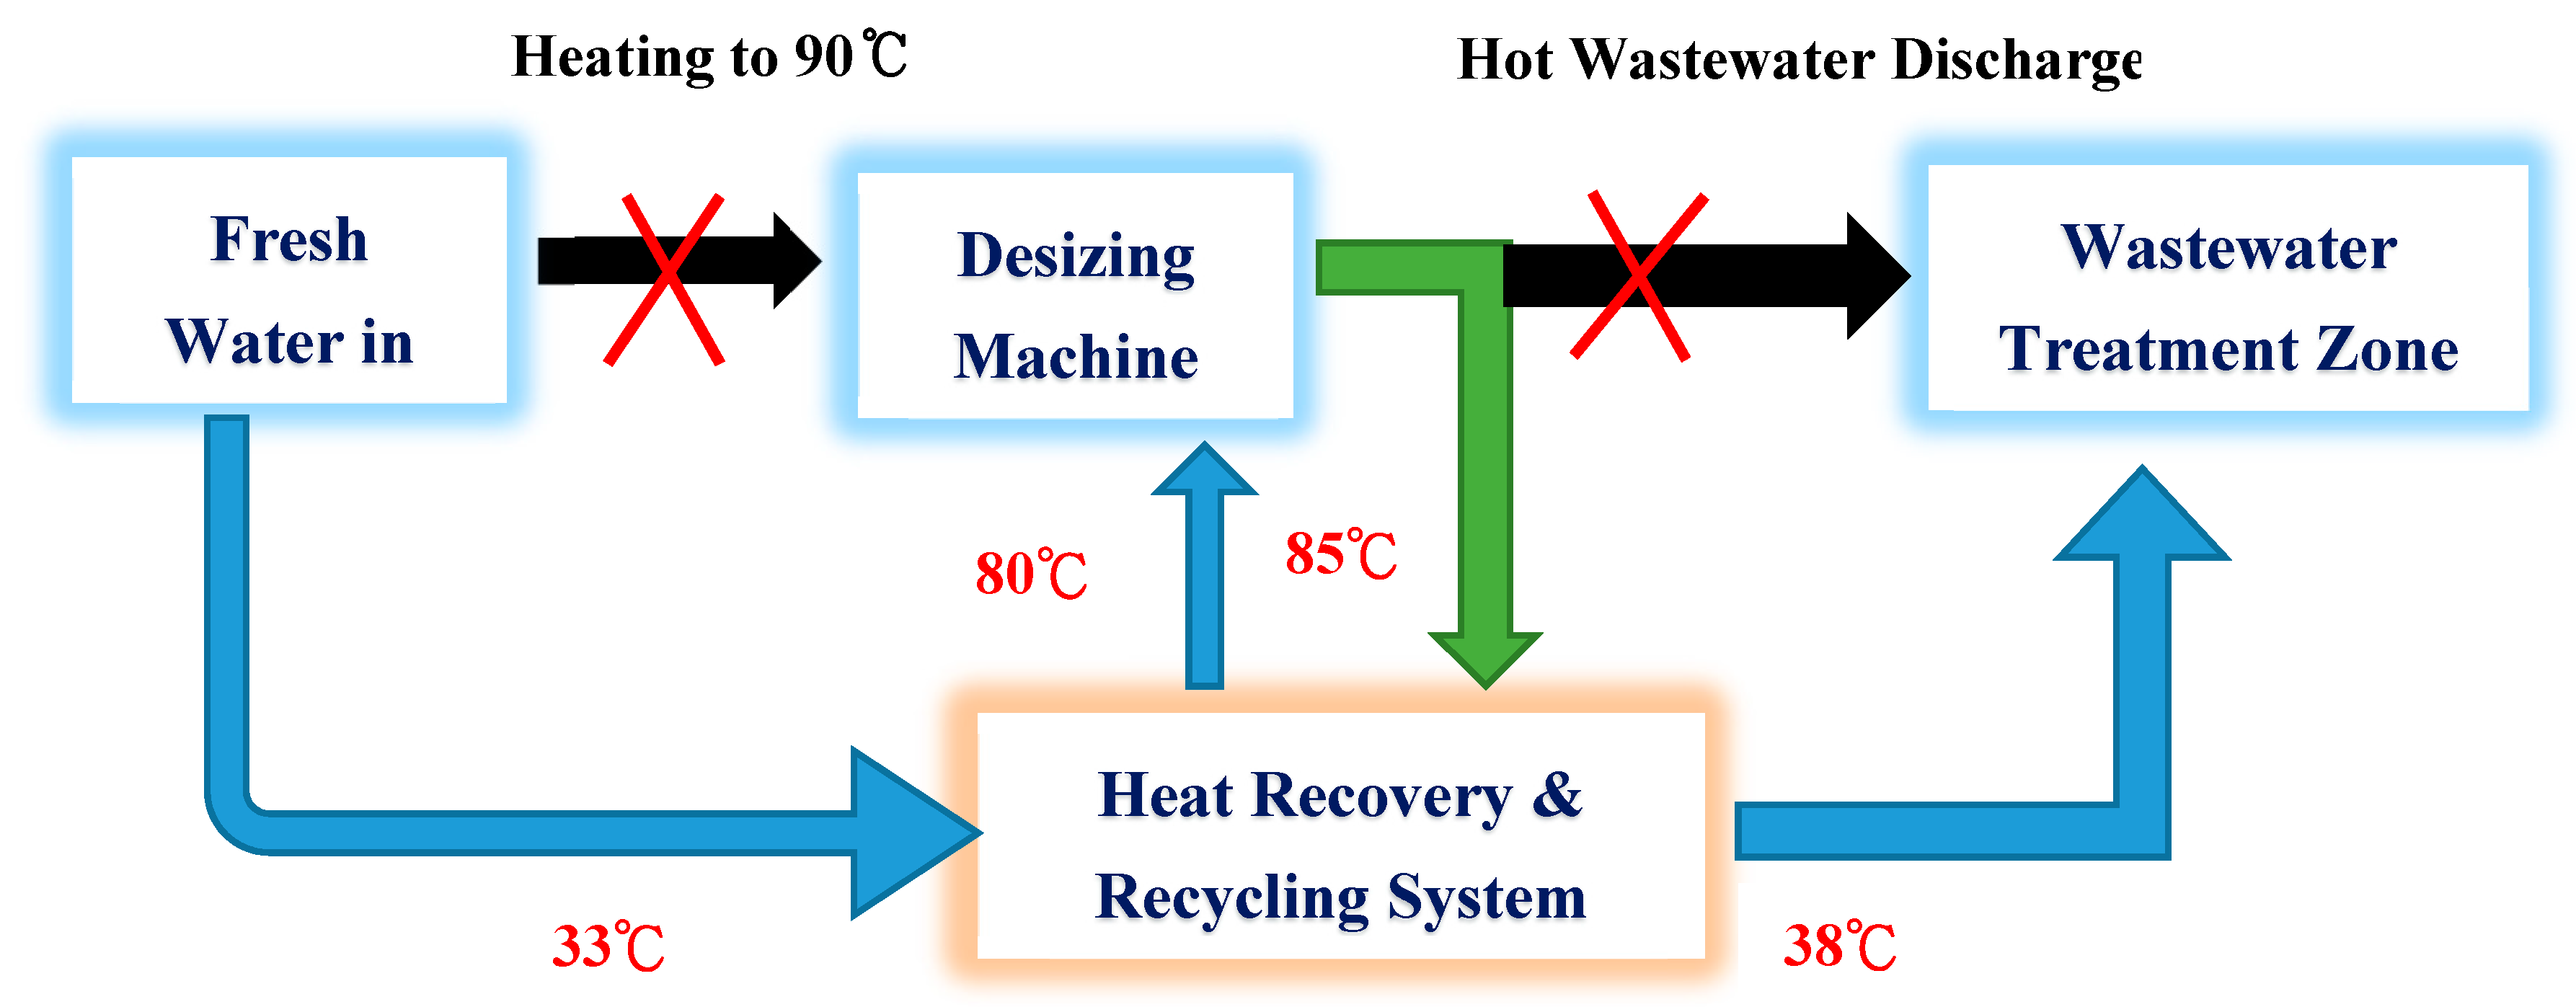
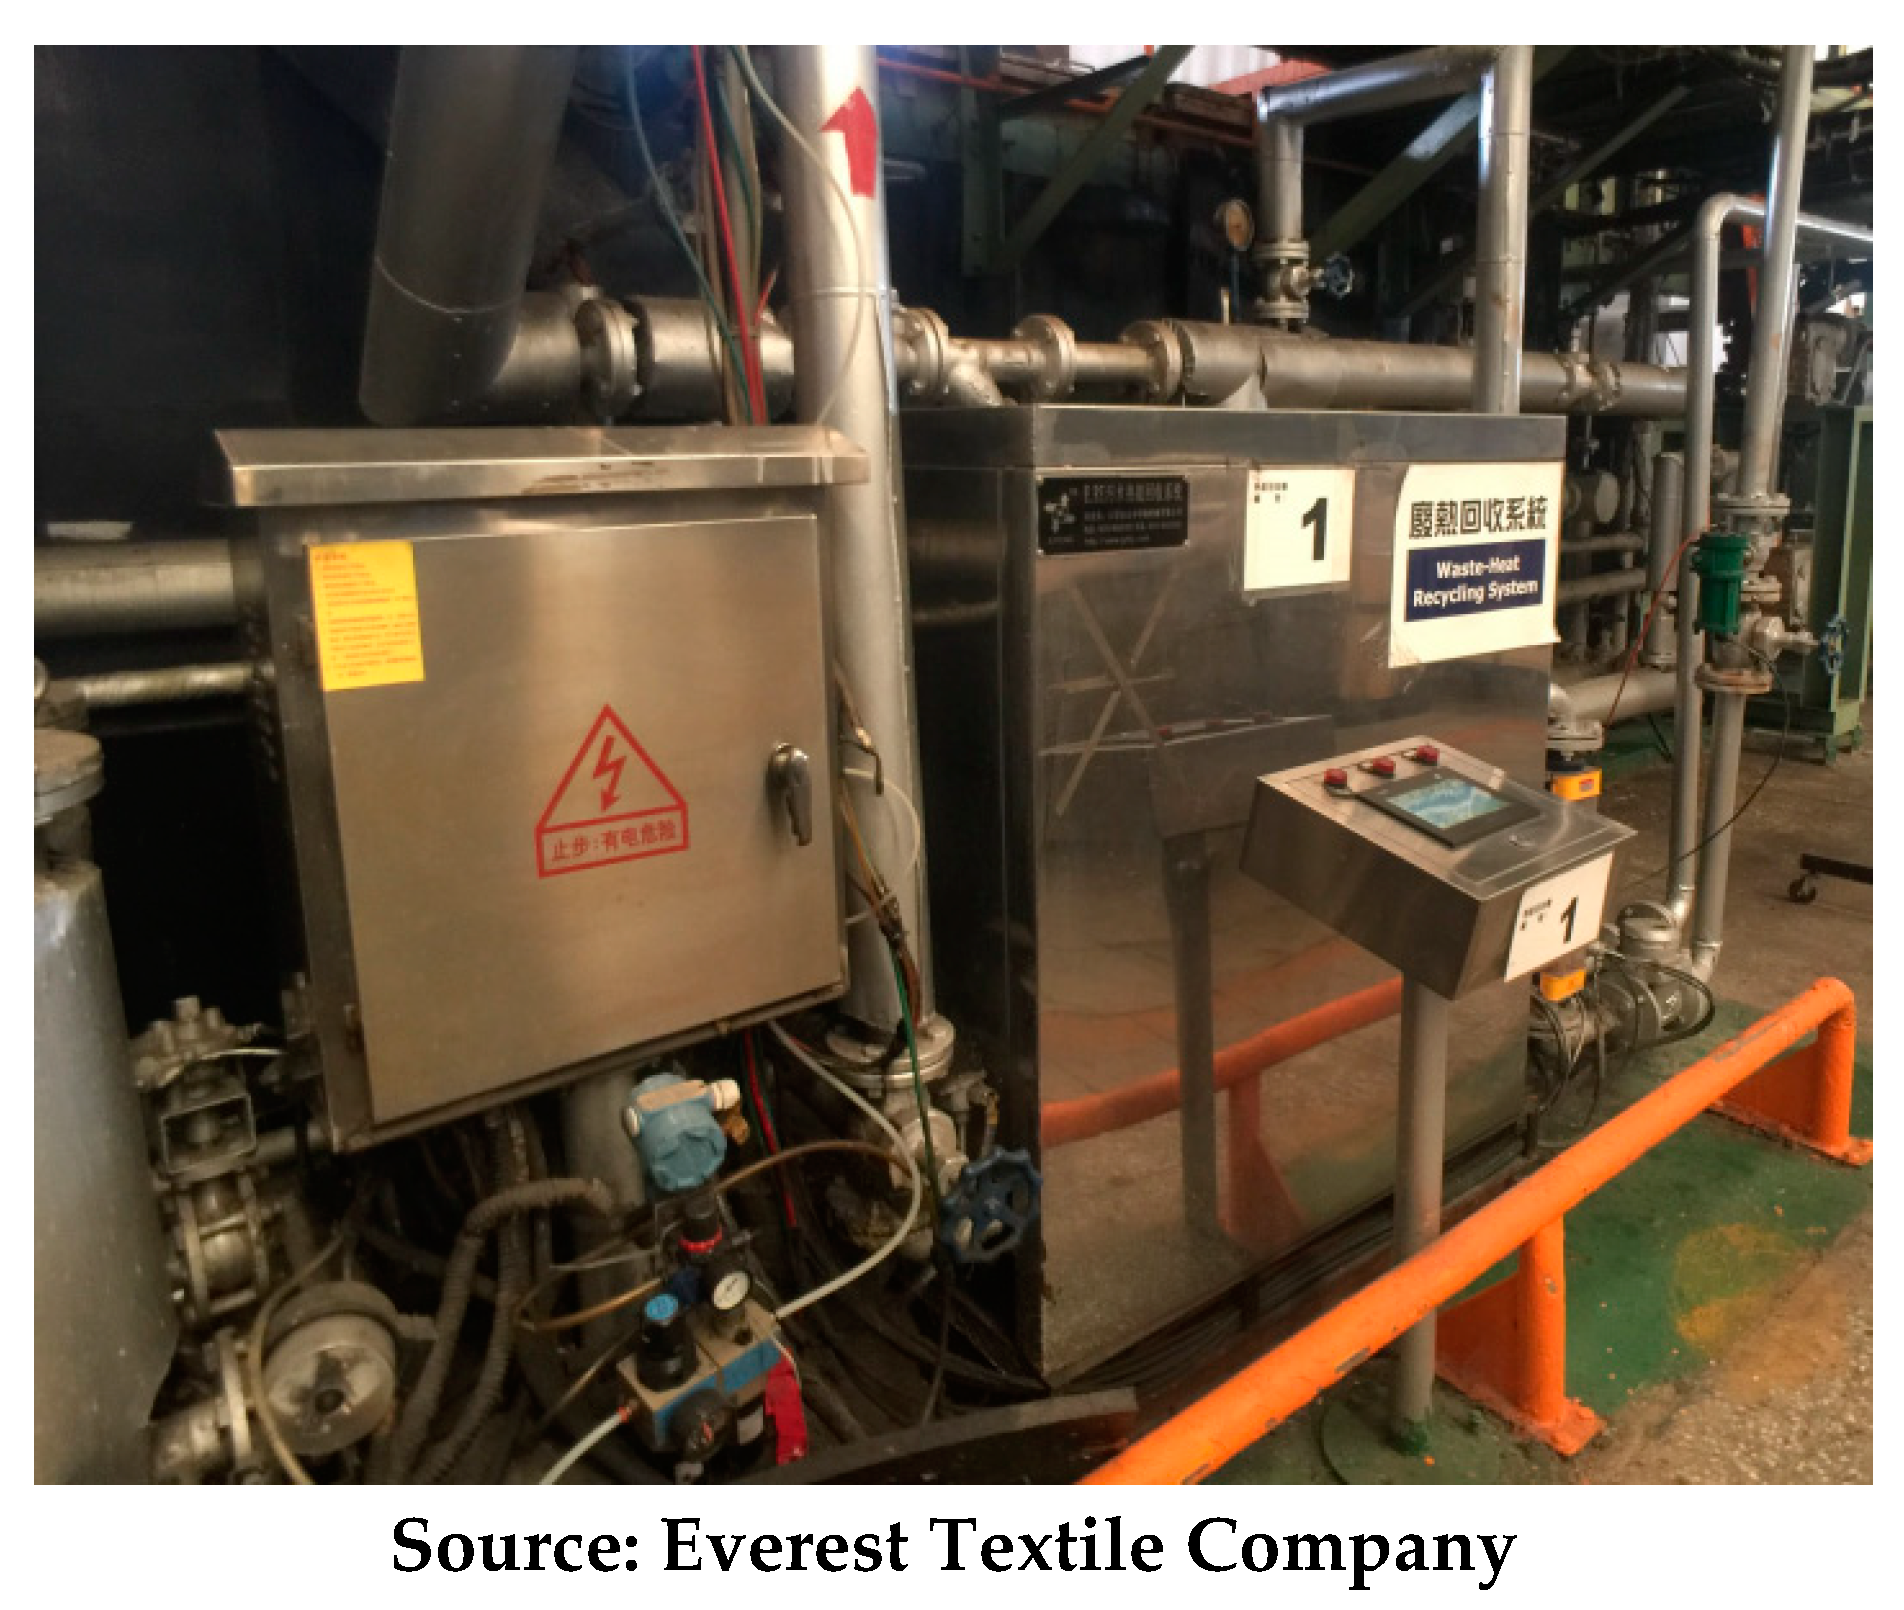
6.1. Energy Saving Method for the Case Company

Equations (18) and (19) are the equations for the energy recycling of heat and water in dyeing factory, respectively. Figure 6 is the heat recovery and recycling system used for the desizing activity in dyeing factory of the case factory. Desizing is the activity of removing the size material from the warp yarns after the textile fabric is woven.
Traditionally, the fresh water is heated to 90 °C and put into the desizing machine and the hot wastewater created from the desizing machine is discharged into the wastewater treatment zone. The case company designed a heat recovery and recycling system. The fresh water is only heated to 33 °C and put into the system. On the other hand, the 85 °C water created from the desizing machine is put into the system. These two sources of water are blended in the system. After the processing of the system, 85% of the water with 80 °C returns to the desizing machine and 15% of the wastewater flows into the wastewater treatment zone for further processing. This method will save the energy and water costs and the total cost saving amount is ( C 5 RE h + C 6 RE w ) in Equation (1). Figure 7 shows the waste-heat recycling system adopted in the case company.

6.2. From Waste Cinder to Eco-Brick

In addition to the recycling and reuse of wastewater and waste-heat, the case company also reuse the waste cinder produced from coal combustion in coal boiler. There are 10 tons of cinders generated from coal boiler. The cinders are non-toxic, harmless and suitable to be reused and processed into eco-bricks by using a special and precise high pressure forming process. The water permeable turf eco-bricks can be sold in the market or be used to replace the asphalt surface inside the factory as shown in Figure 8. The quantity of eco-bricks in the model is shown in Equation (28), i.e., BP 3 = e 3 × X 22 , and the revenue of the by-product eco-bricks is β 3 e 3 X 22 in Equation (1).

6.3. Labor Skills and Job Losses Due to the Introduction of Industry 4.0

Some researchers claim that there are four important kinds of skills required for Industry 4.0: (1) Knowledge about Information and Communication Technology such as robots, machine to machine communication, IT security, data protection, and so on; (2) Ability to work with data such as basic statistical knowledge, visual data output and analysis, and so on; (3) Technical know-how about new manufacturing processes and machine maintenance related maintenance related activities; and (4)Person skills such as adaptability and ability to change, working in team, social and communication skills, mindset change for lifelong learning, and so on [89,90].
After introducing Industry 4.0, companies need to face the challenges to find the labor with the skills mentioned above. Besides, the companies may also want to retrain their existing labor by up-skilling the workforce having the retaining jobs equipped with the new technologies or by re-skilling the workforce having the ceasing jobs to new jobs created by Industry 4.0. On the other hand, the employees need to change their mindset for continuously learning new technologies to transit to advanced manufacturing processes [89,91].
The Fourth Industrial Revolution is the annual meeting focus at the World Economic Forum (WEF) held in Davos, Swiss in January, 2016 [92]. The WEF reported that “It sees as many as 7.1 million jobs being lost, mostly in white-collar office and administrative roles, with the creation of 2.1 million new jobs in fields such as computer engineering and mathematics. It leads to a net loss of over 5 million jobs in 15 major developed and emerging economies” [92,93]. After introducing Industry 4.0, the manual labor was replaced by high-performance machines with Programmable logic controller or robotics with the accuracy of 99.9966% [94,95]. Only non-routine manual labor jobs are broadly unaffected [94].

7. Conclusions

This research combined Industry 4.0, Activity-Based Costing (ABC) and the Theory of Constraints (TOC) to achieve profit maximization, and proposes a green production planning model to deal with environmental issues [28,96,97,98,99]. The textile industry is one of the world’s major sources of industrial pollution; therefore, environmental issues are a major concern. This paper considered carbon emissions, energy recycle and waste reuse. It is found that an Industry 4.0 automated monitoring system will properly maintain and manage all production processes and immediately monitor and record all production process data. In the manufacturing process, it is necessary to effectively control carbon emissions. The carbon taxes must be considered to prompt enterprises to control carbon emissions, and there must be an exploration of the use of renewable energy. This paper also focuses on the recycling of water and heat energy. Energy can be recycled and reused after being processed, not only for a green energy effect, but also to save more costs due to energy saving. Finally, this paper also the reuse of waste cinder. Coal is burned and produces waste cinder in a coal boiler. Cinder is usually regarded as waste. Its transportation cost is very high and burying cinder is very polluting to the environment. Therefore, mixing cinder with cement to form the solid and highly breathable eco-bricks, is not only environmental protective, but can also avoid the high cost of shipping, and so add to green manufacturing.
This research used mathematical programming approach to formulate the decision model with ABC cost data and TOC constraints for the textile companies. This research also clarified the relation between mathematical programming models and Industry 4.0 techniques. Managers in the textile companies can applied this decision model to achieve the optimal product-mix under various constraints and to evaluate the effect on profit of carbon emissions, energy recycling, waste reuse, and material quantity discount.
For the future works, the green production planning model proposed in this paper can be extended to incorporate the cap-and-trade feature [100] the companies can buy carbon emission right if they use up the carbon emission quota, otherwise they also can sell the surplus carbon emission right in the market. Also, this model can be extended to consider different carbon tax cost functions and their effects on profit.

Acknowledgments

The author is extremely grateful to the energies journal editorial team and reviewers who provided valuable comments for improving the quality of this article. The author also would like to thank the Ministry of Science and Technology of Taiwan for financially supporting this research under Grant No. MOST106-2410-H-008-020-MY3.

Conflicts of Interest

The author declares no conflict of interest.

References

  1. Choudhury, A.R. Environmental impacts of the textile industry and its assessment through life cycle assessment. In Roadmap to Sustainable Textiles and Clothing; Springer: Berlin, Germany, 2014; pp. 1–39. [Google Scholar]
  2. Bullon, J.; González Arrieta, A.; Hernández Encinas, A.; Queiruga Dios, A. Manufacturing processes in the textile industry. Expert Systems for fabrics production. Adv. Distrib. Comput. Articial Intell. J. 2017, 6, 41–50. [Google Scholar]
  3. Brettel, M.; Friederichsen, N.; Keller, M.; Rosenberg, M. How virtualization, decentralization and network building change the manufacturing landscape: An industry 4.0 perspective. Int. J. Mech. Ind. Sci. Eng. 2014, 8, 37–44. [Google Scholar]
  4. Rüßmann, M.; Lorenz, M.; Gerbert, P.; Waldner, M.; Justus, J.; Engel, P.; Harnisch, M. Industry 4.0: The Future of Productivity and Growth in Manufacturing Industries; Boston Consulting Group: Boston, MA, USA, 2015. [Google Scholar]
  5. Lee, J.; Kao, H.-A.; Yang, S. Service innovation and smart analytics for industry 4.0 and big data environment. Procedia Cirp 2014, 16, 3–8. [Google Scholar] [CrossRef]
  6. Awad, M.I.; Hassan, N.M. Joint decisions of machining process parameters setting and lot-size determination with environmental and quality cost consideration. J. Manuf. Syst. 2018, 46, 79–92. [Google Scholar] [CrossRef]
  7. Rojko, A. Industry 4.0 Concept: Background and Overview. Int. J. Inf. Manag. 2017, 11, 77–90. [Google Scholar] [CrossRef]
  8. Park, S.; Huh, J.-H. Effect of Cooperation on Manufacturing IT Project Development and Test Bed for Successful Industry 4.0 Project: Safety Management for Security. Processes 2018, 6. [Google Scholar] [CrossRef]
  9. Küsters, D.; Praß, N.; Gloya, Y.-S. Textile up 4.0—Preparing Germany’s Textile Industry for the Digital Future. Procedia Manuf. 2017, 9, 214–221. [Google Scholar] [CrossRef]
  10. Chen, Z.; Xing, M. Upgrading of textile manufacturing based on Industry 4.0. In Proceedings of the 5th International Conference on Advanced Design and Manufacturing Engineering (ICADME 2015), Shenzhen, China, 19–20 September 2015; pp. 2143–2146. [Google Scholar]
  11. Dujin, A.; Blanchet, M.; Rinn, T.; Von Thaden, G.; De Thieullo, G. Industry 4.0—The New Industrial Revolution: How Europe Will Succeed; Roland Berger Strategy Consultants: Munich, Germany, 2014. [Google Scholar]
  12. Jerzembeck, J. Industry 4.0 Potential in Textile Production (Dyeing and Finishing). Melliand Int. 2016, 4, 220–222. [Google Scholar]
  13. RINA Consulting. Industry 4.0: The New Challenge for the ITALIAN TEXTILE MACHINERY INDUSTRY. Executive Summary, Italian Textile Machinery, 2017. Available online: http://www.acimit.it/DOC/Executive17-Ing.pdf (accessed on 20 July 2018).
  14. Lee, H.-G.; Huh, J.-H. A Cost-Effective Redundant Digital Excitation Control System and Test Bed Experiment for Safe Power Supply for Process Industry 4.0. Processes 2018, 6. [Google Scholar] [CrossRef]
  15. Huh, J.-H. Smart Grid Test Bed Using OPNET and Power Line Communication; IGI Global: Hershey, PA, USA, 2017. [Google Scholar]
  16. Kamal Abd Rahman, I.; Omar, N.; Zainal Abidin, Z. The applications of management accounting techniques in Malaysian companies: An industrial survey. J. Financ. Rep. Account. 2003, 1, 1–12. [Google Scholar] [CrossRef]
  17. Holmen, J.S. ABC vs. TOC: It’s a matter of time. Strat. Financ. 1995, 76, 37. [Google Scholar]
  18. Kee, R. Integrating activity-based costing with the theory of constraints to enhance production-related decision-making. Account. Horiz. 1995, 9, 48–61. [Google Scholar]
  19. Lockhart, J.; Taylor, A. Environmental considerations in product mix decisions using ABC and TOC: As environmental issues increasingly influence corporate performance, they need to be a standard part of management accounting systems. Manag. Account. Q. 2007, 9, 13. [Google Scholar]
  20. Turney, P.B.B. Common Cents: The ABC Performance Breakthrough—How to Succeed with Activity-Based Costing, Revised ed.; McGraw-Hill: New York, NY, USA, 2005. [Google Scholar]
  21. Luebbe, R.; Finch, B. Theory of constraints and linear programming: A comparison. Int. J. Prod. Res. 1992, 30, 1471–1478. [Google Scholar] [CrossRef]
  22. Plenert, G. Optimizing theory of constraints when multiple constrained resources exist. Eur. J. Oper. Res. 1993, 70, 126–133. [Google Scholar] [CrossRef]
  23. Tsai, W.-H.; Lin, T.-M. Nonlinear multiproduct CVP analysis with 0–1 mixed integer programming. Eng. Costs Prod. Econ. 1990, 20, 81–91. [Google Scholar] [CrossRef]
  24. Tsai, W.-H.; Lee, K.-C.; Liu, J.-Y.; Lin, H.-L.; Chou, Y.-W.; Lin, S.-J. A mixed activity-based costing decision model for green airline fleet planning under the constraints of the European Union Emissions Trading Scheme. Energy 2012, 39, 218–226. [Google Scholar] [CrossRef]
  25. Tsai, W.-H.; Lin, S.-J.; Liu, J.-Y.; Lin, W.-R.; Lee, K.-C. Incorporating life cycle assessments into building project decision-making: An energy consumption and CO2 emission perspective. Energy 2011, 36, 3022–3029. [Google Scholar] [CrossRef]
  26. Jaedicke, R.K. Improving breakeven analysis by linear programming techniques. NAA Bull. 1961, 5–12. [Google Scholar]
  27. Entezaminia, A.; Heydari, M.; Rahmani, D. A multi-objective model for multi-product multi-site aggregate production planning in a green supply chain: Considering collection and recycling centers. J. Manuf. Syst. 2016, 40, 63–75. [Google Scholar] [CrossRef]
  28. Tsai, W.-H.; Yang, C.-H.; Chang, J.-C.; Lee, H.-L. An activity-based costing decision model for life cycle assessment in green building projects. Eur. J. Oper. Res. 2014, 238, 607–619. [Google Scholar] [CrossRef]
  29. Williams, H.P. Model Building in Mathematical Programming; John Wiley & Sons: West Sussex, UK, 2013. [Google Scholar]
  30. Cohon, J.L. Multiobjective Programming and Planning; Dover Publications: Mineola, NY, USA, 2003. [Google Scholar]
  31. Hanasusanto, G.A.; Kuhn, D.; Wallace, S.W.; Zymler, S. Distributionally robust multi-item newsvendor problems with multimodal demand distributions. Math. Program. 2015, 152, 1–32. [Google Scholar] [CrossRef]
  32. Correa, J.; Marchetti-Spaccamela, A.; Matuschke, J.; Stougie, L.; Svensson, O.; Verdugo, V.; Verschae, J. Strong LP formulations for scheduling splittable jobs on unrelated machines. Math. Program. 2015, 154, 305–328. [Google Scholar] [CrossRef]
  33. Elamvazuthi, I.; Ganesan, T.; Vasant, P.; Webb, J.F. Application of a Fuzzy Programming Technique to Production Planning in the Textile Industry. Int. J. Comput. Sci. Inf. Secur. 2009, 6, 238–243. [Google Scholar]
  34. Teke, Ç.; Okutkan, C.; Erden, C. Determining the Production Amounts in Textile Industry with Fuzzy Linear Programming. Int. J. Eng. Technol. Res. 2017, 2, 1–6. [Google Scholar]
  35. Waidner, M.; Kasper, M. Security in industrie 4.0: Challenges and solutions for the fourth industrial revolution. In Proceedings of the 2016 Conference on Design, Automation & Test in Europe, Dresden, Germany, 14–18 March 2016; pp. 1303–1308. [Google Scholar]
  36. Schmidt, R.; Möhring, M.; Härting, R.-C.; Reichstein, C.; Neumaier, P.; Jozinović, P. Industry 4.0—Potentials for creating smart products: Empirical research results. In Proceedings of the International Conference on Business Information Systems, Poznań, Poland, 24–26 June 2015; Springer: Berlin, Germany, 2015; pp. 16–27. [Google Scholar]
  37. Wang, S.; Wan, J.; Zhang, D.; Li, D.; Zhang, C. Towards smart factory for industry 4.0: A self-organized multi-agent system with big data based feedback and coordination. Comput. Netw. 2016, 101, 158–168. [Google Scholar] [CrossRef]
  38. Lee, J.; Bagheri, B.; Kao, H.-A. A cyber-physical systems architecture for industry 4.0-based manufacturing systems. Manuf. Lett. 2015, 3, 18–23. [Google Scholar] [CrossRef]
  39. Kagermann, H. Change through digitization—Value creation in the age of Industry 4.0. In Management of Permanent Change; Springer: Berlin, Germany, 2015; pp. 23–45. [Google Scholar]
  40. Karre, H.; Hammer, M.; Kleindienst, M.; Ramsauer, C. Transition towards an Industry 4.0 State of the LeanLab at Graz University of Technology. Procedia Manuf. 2017, 9, 206–213. [Google Scholar] [CrossRef]
  41. Jazdi, N. Cyber physical systems in the context of Industry 4.0. In Proceedings of the 2014 IEEE International Conference on Automation, Quality and Testing, Robotics, Cluj-Napoca, Romania, 22–24 May 2014; pp. 1–4. [Google Scholar]
  42. Schoeberl, P.; Brik, M.; Braun, R.; Fuchs, W. Treatment and recycling of textile wastewater—Case study and development of a recycling concept. Desalination 2005, 171, 173–183. [Google Scholar] [CrossRef]
  43. Gorecky, D.; Schmitt, M.; Loskyll, M.; Zühlke, D. Human-Machine-Interaction in the industry 4.0 era. In Proceedings of the 2014 12th IEEE International Conference on Industrial Informatics (INDIN), Porto Alegre, Brazil, 27–30 July 2014; pp. 289–294. [Google Scholar]
  44. Lethbridge, T.C. What knowledge is important to a software professional? Computer 2000, 33, 44–50. [Google Scholar] [CrossRef]
  45. Valdeza, A.C.; Braunera, P.; Schaara, A.K.; Holzingerb, A.; Zieflea, M. Reducing complexity with simplicity-usability methods for industry 4.0. In Proceedings of the 19th Triennial Congress of the IEA, Melbourne, Australia, 9–14 August 2015; pp. 1–8. [Google Scholar]
  46. Lary, H.B. Trade in Labor-Intensive Manufactures. In Imports of Manufactures from Less Developed Countries; NBER: Cambridge, MA, USA, 1968; pp. 86–115. [Google Scholar]
  47. Leamer, E.E. Wage inequality from international competition and technological change: Theory and country experience. Am. Econ. Rev. 1996, 86, 309–314. [Google Scholar]
  48. Kletti, J. Manufacturing Execution System—MES; Springer: Berlin, Germany, 2007. [Google Scholar]
  49. Saenz de Ugarte, B.; Artiba, A.; Pellerin, R. Manufacturing execution system—A literature review. Prod. Plan. Control 2009, 20, 525–539. [Google Scholar] [CrossRef]
  50. Arik Ragowsky, T.M.S. Enterprise resource planning. J. Manag. Inf. Syst. 2002, 19, 11–15. [Google Scholar]
  51. Leon, A. Enterprise Resource Planning; McGraw-Hill Education: New York, NY, USA, 2008. [Google Scholar]
  52. Sumner, M. Enterprise Resource Planning; Pearson Education Inc.: New Jersey, NJ, USA, 2005. [Google Scholar]
  53. O’Leary, D.E. Enterprise Resource Planning Systems: Systems, Life Cycle, Electronic Commerce, and Risk; Cambridge University Press: Cambridge, UK, 2000. [Google Scholar]
  54. Umble, E.J.; Haft, R.R.; Umble, M.M. Enterprise resource planning: Implementation procedures and critical success factors. Eur. J. Oper. Res. 2003, 146, 241–257. [Google Scholar] [CrossRef]
  55. Lasi, H.; Fettke, P.; Kemper, H.-G.; Feld, T.; Hoffmann, M. Industry 4.0. Bus. Inf. Syst. Eng. 2014, 6, 239–242. [Google Scholar] [CrossRef]
  56. Choi, B.K.; Kim, B.H. MES (manufacturing execution system) architecture for FMS compatible to ERP (enterprise resource planning). Int. J. Comput. Integr. Manuf. 2002, 15, 274–284. [Google Scholar] [CrossRef]
  57. Liu, W.; Chua, T.J.; Larn, J.; Wang, F.-Y.; Yin, X. APS, ERP and MES systems integration for semiconductor backend assembly. In Proceedings of the 7th International Conference on Control, Automation, Robotics and Vision, Singapore, 2–5 December 2002; pp. 1403–1408. [Google Scholar]
  58. Saggiomo, M.; Wischnowski, M.; Winkel, B.; Nierhaus, M.; Gloy, Y.-S.; Gries, T. Industry 4.0 in the field of textile machinery-first steps of implementation. Melliand Int. 2015, 1, 49–50. [Google Scholar]
  59. Ramanathan, V.; Feng, Y. Air pollution, greenhouse gases and climate change: Global and regional perspectives. Atmos. Environ. 2009, 43, 37–50. [Google Scholar] [CrossRef]
  60. Dodman, D. Blaming cities for climate change? An analysis of urban greenhouse gas emissions inventories. Environ. Urban. 2009, 21, 185–201. [Google Scholar] [CrossRef] [Green Version]
  61. Keohane, N.O.; Olmstead, S.M. Introduction. In Markets and the Environment; Springer: Berlin, Germany, 2016; pp. 1–10. [Google Scholar]
  62. Davis, S.J.; Caldeira, K. Consumption-based accounting of CO2 emissions. Proc. Natl. Acad. Sci. USA 2010, 107, 5687–5692. [Google Scholar] [CrossRef] [PubMed]
  63. Guan, D.; Peters, G.P.; Weber, C.L.; Hubacek, K. Journey to world top emitter: An analysis of the driving forces of China’s recent CO2 emissions surge. Geophys. Res. Lett. 2009, 36, 1–5. [Google Scholar] [CrossRef]
  64. Steinberger, J.K.; Friot, D.; Jolliet, O.; Erkman, S. A spatially explicit life cycle inventory of the global textile chain. Int. J. Life Cycle Assess. 2009, 14, 443–455. [Google Scholar] [CrossRef]
  65. Elahee, K. Heat recovery in the textile dyeing and finishing industry: Lessons from developing economies. J. Energy S. Afr. 2010, 21, 9–15. [Google Scholar]
  66. Oǧulata, R.T. Utilization of waste-heat recovery in textile drying. Appl. Energy 2004, 79, 41–49. [Google Scholar] [CrossRef]
  67. Lopez, A.; Ricco, G.; Ciannarella, R.; Rozzi, A.; Di Pinto, A.; Passino, R. Textile wastewater reuse: Ozonation of membrane concentrated secondary effluent. Water Sci. Technol. 1999, 40, 99–105. [Google Scholar] [CrossRef]
  68. Chequer, F.M.D.; de Oliveira, G.A.R.; Ferraz, E.R.A.; Cardoso, J.C.; Zanoni, M.V.B.; de Oliveira, D.P. Textile dyes: Dyeing process and environmental impact. In Eco-Friendly Textile Dyeing and Finishing; InTech: London, UK, 2013. [Google Scholar]
  69. Li, K.; Zhang, X.; Leung, J.Y.-T.; Yang, S.-L. Parallel machine scheduling problems in green manufacturing industry. J. Manuf. Syst. 2016, 38, 98–106. [Google Scholar] [CrossRef]
  70. Monahan, J.P. A quantity discount pricing model to increase vendor profits. Manag. Sci. 1984, 30, 720–726. [Google Scholar] [CrossRef]
  71. Kee, R. The sufficiency of product and variable costs for production-related decisions when economies of scope are present. Int. J. Prod. Econ. 2008, 114, 682–696. [Google Scholar] [CrossRef]
  72. Sinha, A.; Rämö, J.; Malo, P.; Kallio, M.; Tahvonen, O. Optimal management of naturally regenerating uneven-aged forests. Eur. J. Oper. Res. 2017, 256, 886–900. [Google Scholar] [CrossRef] [Green Version]
  73. Koh, S.; Saad, S. A holistic approach to diagnose uncertainty in ERP-controlled manufacturing shop floor. Prod. Plan. Control. 2003, 14, 273–289. [Google Scholar] [CrossRef]
  74. Lin, G.Y.; Solberg, J.J. Integrated shop floor control using autonomous agents. IIE Trans. 1992, 24, 57–71. [Google Scholar] [CrossRef]
  75. Park, H.-S.; Tran, N.-H. An autonomous manufacturing system for adapting to disturbances. Int. J. Adv. Manuf. Technol. 2011, 56, 1159–1165. [Google Scholar] [CrossRef]
  76. Zhong, R.Y.; Dai, Q.; Qu, T.; Hu, G.; Huang, G.Q. RFID-Enabled real-time manufacturing execution system for mass-customization production. Robot. Comput. Integr. Manuf. 2013, 29, 283–292. [Google Scholar] [CrossRef]
  77. Hua, J.; Liang, T.; Lei, Z. Study and design real-time manufacturing execution system based on RFID. In Proceedings of the 2008 Second International Symposium on Intelligent Information Technology Application, Shanghai, China, 20–22 December 2008; pp. 591–594. [Google Scholar]
  78. Almada-Lobo, F. The Industry 4.0 revolution and the future of manufacturing execution systems (MES). J. Innov. Manag. 2016, 3, 16–21. [Google Scholar]
  79. Wang, W.Y.; Chan, H.K. Virtual organization for supply chain integration: Two cases in the textile and fashion retailing industry. Int. J. Prod. Econ. 2010, 127, 333–342. [Google Scholar] [CrossRef]
  80. Kuhn, W. Digital factory-simulation enhancing the product and production engineering process. In Proceedings of the 2006 Winter Simulation Conference, Monterey, CA, USA, 3–6 December 2006; pp. 1899–1906. [Google Scholar]
  81. Tajima, M. Strategic value of RFID in supply chain management. J. Purch. Supply Manag. 2007, 13, 261–273. [Google Scholar] [CrossRef]
  82. Spekman, R.E.; Kamauff, J.W., Jr.; Myhr, N. An empirical investigation into supply chain management: A perspective on partnerships. Supply Chain Manag. Int. J. 1998, 3, 53–67. [Google Scholar] [CrossRef]
  83. Johnson, H.T. Early cost accounting for internal management control: Lyman Mills in the 1850’s. Bus. Hist. Rev. 1972, 46, 466–474. [Google Scholar] [CrossRef]
  84. Abernathy, F.H.; Dunlop, J.T.; Hammond, J.H.; Weil, D. Globalization in the apparel and textile industries: What is new and what is not? In Locating Global Advantage: Industry Dynamics in the International Economy; Stanford University Press: Stanford, CA, USA, 2004. [Google Scholar]
  85. Lummus, R.R.; Vokurka, R.J.; Alber, K.L. Strategic supply chain planning. Prod. Invent. Manag. J. 1998, 39, 49–58. [Google Scholar]
  86. Montgomery, D.C. Introduction to Statistical Quality Control; John Wiley & Sons: Hoboken, NJ, USA, 2007. [Google Scholar]
  87. Stojanovic, R.; Mitropulos, P.; Koulamas, C.; Karayiannis, Y.; Koubias, S.; Papadopoulos, G. Real-Time vision-based system for textile fabric inspection. Real-Time Imaging 2001, 7, 507–518. [Google Scholar] [CrossRef]
  88. Esmaeilian, B.; Behdad, S.; Wang, B. The evolution and future of manufacturing: A review. J. Manuf. Syst. 2016, 39, 79–100. [Google Scholar] [CrossRef]
  89. Aulbur, W.; Arvind, C.J.; Bigghe, R. Whitepaper: Skill Development for Industry 4.0; BRICS Skill Development Group: Roland Berger, India, 2016. [Google Scholar]
  90. Gehrke, L.; Kühn, A.; Rule, D.; Moore, P.; Bellmann, C.; Siemes, S.; Dawood, D.; Singh, L.; Kulik, J.; Standle, M. Industry4.0: A Discussion of Qualifications and Skills in the Factory of the Future: A German and American Perspective; The Association of German Engineers (VDI): Düsseldorf, Germany; American Society of Mechanical Engineers (ASME): Washington, DC, USA, 2015. [Google Scholar]
  91. Hartmann, E.; Bovenschulte, M. Skills Needs Analysis for “Industry 4.0” Based on Roadmaps for Smart Systems. In SKOLKOVO Moscow School of Management & International Labour Organization: Using Technology Foresights for Identifying Future Skills Needs; Global Workshop Proceedings, Moscow; Institute for Innovation and Technology: Berlin, Germany, 2013; pp. 24–36. [Google Scholar]
  92. Lowman, S. WEF 2016: 4th Industrial Revolution. 5 mn Jobs, Women in the Firing Line. BIZNEWS. 18 January 2016. Available online: https://www.biznews.com/wef/davos-2016/2016/01/18/wef-2016-4th-industrial-revolution-5mn-jobs-women-in-the-firing-line/ (accessed on 20 July 2018).
  93. Team, M. Five Million Jobs by 2020: The Real Challenge of the Fourth Industrial Revolution. World Economic Forum, 18 January 2016. Available online: https://www.weforum.org/press/2016/01/five-million-jobs-by-2020-the-real-challenge-of-the-fourth-industrial-revolution/ (accessed on 20 July 2018).
  94. Flynn, J.; Dance, S.; Schaefer, D. Industry 4.0 and Its Potential Impact on Employment Demographics in the UK. In Advanced in Manufacturing Technology XXXI, Proceedings of the 15th International Conference on Manufacturing Research, incorporating the 32nd National Conference on Manufacturing Research, London, UK, 5–7 September 2017; Gao, J., El Souri, M., Keates, S., Eds.; IOS Press: Amsterdam, The Netherlands, 2017. [Google Scholar]
  95. Matovcikova, D. Industry 4.0 as the Culprit of Unemployment. In Proceedings of the 12th International Workshop on Knowledge Management, Trenčín, Slovakia, 12–13 October 2017. [Google Scholar]
  96. Tsai, W.-H.; Hung, S.-J. A fuzzy goal programming approach for green supply chain optimisation under activity-based costing and performance evaluation with a value-chain structure. Int. J. Prod. Res. 2009, 47, 4991–5017. [Google Scholar] [CrossRef]
  97. Tsai, W.-H.; Chen, H.-C.; Leu, J.-D.; Chang, Y.-C.; Lin, T.W. A product-mix decision model using green manufacturing technologies under activity-based costing. J. Clean. Prod. 2013, 57, 178–187. [Google Scholar] [CrossRef]
  98. Tsai, W.-H.; Hung, S.-J. Treatment and recycling system optimisation with activity-based costing in WEEE reverse logistics management: An environmental supply chain perspective. Int. J. Prod. Res. 2009, 47, 5391–5420. [Google Scholar] [CrossRef]
  99. Tsai, W.-H.; Chen, H.-C.; Liu, J.-Y.; Chen, S.-P.; Shen, Y.-S. Using activity-based costing to evaluate capital investments for green manufacturing systems. Int. J. Prod. Res. 2011, 49, 7275–7292. [Google Scholar] [CrossRef]
  100. Wang, S.; Wan, L.; Li, T.; Luo, B.; Wang, C. Exploring the effect of cap-and-trade mechanism on firm’s production planning and emission reduction strategy. J. Clean. Prod. 2018, 172, 591–601. [Google Scholar] [CrossRef]
Figure 1. The process of producing textiles.
Energies 11 02072 g001
Figure 2. Direct labor cost function.
Energies 11 02072 g002
Figure 3. Direct Carbon tax function.
Energies 11 02072 g003
Figure 4. Textile manufacturing process with the symbols of quantity variables.
Energies 11 02072 g004
Figure 5. Direct material cost function.
Energies 11 02072 g005
Figure 6. Heat recovery & recycling system in dyeing factory.
Energies 11 02072 g006
Figure 7. Waste-heat Recycling System.
Energies 11 02072 g007
Figure 8. Eco-brick made from waste cinder and used in the factory.
Energies 11 02072 g008
Table 1. Example data.
Activity Resources Process 1Process 2Process 3Capacity
Draw Textured YarnScrap yarnGreige FabricScrap FabricFinished FabricEco-Brick
Price of per selling unit $97,000$570$135,000$2,100$202,500$2,300
Production coefficient ei0.96 0.95 0.14
(1 − ei) 0.04 0.05
Direct material cost M, m 22 d $65,000 $7,000
m 22 c ,   m cem $1,800$1,500
Machine hours constraintActivity driver
Machine 1Machine hrs.hi3 120,000
Machine 2 4 100,000
Machine 3 5 130,000
li3 2 1
Direct Labor constraint Carbon tax constraint qc7
CostL0 = 47,840,000L1 = 101,660,000CostPC0 = 0PC1 = 170,000,000PC2 = 270,000,000
Labor hoursG0 = 368,000G1 = 598,000Emission QuantitiesGC0 = 50,000GC1 = 170,000GC2 = 180,000
Wage Ratewr0 = $130/hwr1 = 170/hTax RateTr0 = $0/tonTr1 = $1,000/tonTr2 = $1,500/ton
Table 2. Example data for batch-level activities.
Batch-Level Activity Starting Location (s)End Location (e)Draw Textured YarnGreige FabricFinished Fabric
Handlingσse, μse015, 2
121, 1
100.5, 1
23 1, 1
20 2, 1
23 3, 2
Set-upλ, ω 3, 2
Table 3. Green production planning model for the example data.
Max π = (97,000 × X 11 + 135,000 × X 21 + 202,500 × X 22 + 570 × 0.04 × M + 2100 × 0.05 × X 12 + 2300 × 0.14 × X 22 ) − (65,000 × M + 7000 × m 22 d + 1800 × m 22 c + 1500 × m cem ) − [47,840,000 + (170 × Q 1 − 62,560,000 × η 1 )] − (1000 × TC 1 − 50,000,000 × δ 1 + 1500 × TC 2 − 75,000,000 × δ 2 ) + (60 × RE h + 120 × RE w ) − 500,000
Subject to Input-Output Relationship:
X 1 − 0.96 × M = 0
X 1 = X 11 + X 12
X 2 − 0.95 × X 12 = 0
X 2 = X 21 + X 22
BP 1 = 0.04 × M
BP 2 = 0.05 × X 12
BP 3 = 0.14 × X 22
m 22 d = 0.65 × X 22
m 22 c = 0.1 × X 22
m cin = 0.2 × m 22 c
m cem = 6 × m cin
RE h = 0.95 × X 22
RE w = 0.85 × X 22
Subject to Direct Labor:
3 × X 1 + 2 × X 2 + 1 × X 22 + 2 × B 01 + 1 × B 12 + 1 × B 10 + 1 × B 23 + 1 × B 20 + 2 × B 30 + 2 × BS Q 0 Q 1 ≤ 0
Q 0 η 0 × 368,000
η 1 × 368,000 < Q 1
Q 1 η 1 × 598,000
η 0 + η 1 = 1
Subject to Machine Hour:
3 × X 1 − 120,000 ≤ 0
4 × X 2 − 100,000 ≤ 0
5 × X 22 − 130,000 ≤ 0
Subject to Batch-Level:
M ≤ 5 × B 01
X 12 ≤ 1 × B 12
X 11 + 0.04 × M ≤ 0.5 × B 10
X 22 ≤ 1 × B 23
X 21 + 0.05 × X 12 ≤ 2 × B 20
X 22 + 0.14 × X 22 ≤ 3 × B 30
X 22 ≤ 3 × BS
Subject to Carbon Tax Function:
7 × X 22 TC 0 + TC 1 + TC 2
TC 0 δ 0 × 50,000
50,000 × δ 1 < TC 1
TC 1 δ 1 × 170,000
δ 2 × 170,000 < TC 2
TC 2 δ 2 × 0.1E + 10
δ 0 + δ 1 + δ 2 = 1
Table 4. The optimal solution in mixed integer programming model (MIP).
π = 3,361,133,000 X 1 = 40,000 X 11 = 13,684.21 X 12 = 26,315.79
X 2 = 25,000 X 21 = 714.2857 X 22 = 24,285.71 BP 1 = 1666.667
BP 2 = 1315.789 BP 3 = 2695.714M = 41,666.67 m 22 d = 15,785.71
m 22 c = 2428.571 m cin = 485.7143 m cem = 2914.286 Q 0 = 0
Q 1 = 327,455.7 η 0 = 0.746149 η 1 = 0.9253851 TC 0 = 0
TC 1 = 170,000 TC 2 = 0 δ 0 = 0 δ 1 = 1
δ 2 = 0 RE h = 23,071.43 RE w = 20,642.86 B 01 = 8334
B 12 = 26,316 B 10 = 30,702 B 23 = 24,286 B 20 = 13,158
B 30 = 9229 BS = 8334
Table 5. Sensitivity analysis on the material cost.
Cost variation Ratio (%)NormalPrice Discount
Profit (Thousands)Profit Variation Ratio (%)Profit (Thousands)Profit Variation Ratio (%)
20%2,819,466−16.12%3,144,466−13.42%
15%2,954,883−12.09%3,266,341−10.07%
10%3,090,299−8.06%3,388,216−6.71%
5%3,225,716−4.03%3,510,091−3.36%
0%3,361,1330.00%3,631,9660.00%
−5%3,496,5494.03%3,753,8413.36%
−10%3,631,9668.06%3,875,7166.71%
−15%3,767,38312.09%3,997,59110.07%
−20%3,902,79916.12%4,119,46613.42%

