Productive Efficiency of Energy-Aware Data Centers


Abstract
1. Introduction
- Extensive empirical experimentation and analysis of various cloud-computing scenarios with a trustworthy and detailed simulation tool.
- Impact analysis in terms of the energy consumption and performance of several energy efficiency policies, which shut-down idle machines by means of data envelopment analysis.
- DEA-conducted analysis of the performance impact and energy consumption of a set of scheduling models for large-scale data-centers.
- Empirical determination and proposal of corrective actions to achieve optimal efficiency.
2. Data Envelopment Analysis Model
2.1. Natural Disposability
2.2. Managerial Disposability
3. Energy Policies for Data Centers at a Glance
- Never: prevents any shut-down process.
- Always: shuts down every server running in an idle state.
- Load: shuts down machines when data-center load pressure fails to reach a given threshold.
- Margin: assures that a determined number of machines are turned on and available before shutting down any machine.
- Random: shuts down machines randomly by means of a Bernoulli distribution with parameter .
- Exponential: shuts down machines when the probability of one incoming task negatively impacting on the data-center performance is lower than a given threshold. This probability is computed by means of the exponential distribution.
- Gamma: shuts down machines when the probability of incoming tasks oversubscribing to the available resources in a particular time period is lower than a given threshold; this probability is computed by means of the Gamma distribution.
4. Scheduling Models for Data Centers at a Glance
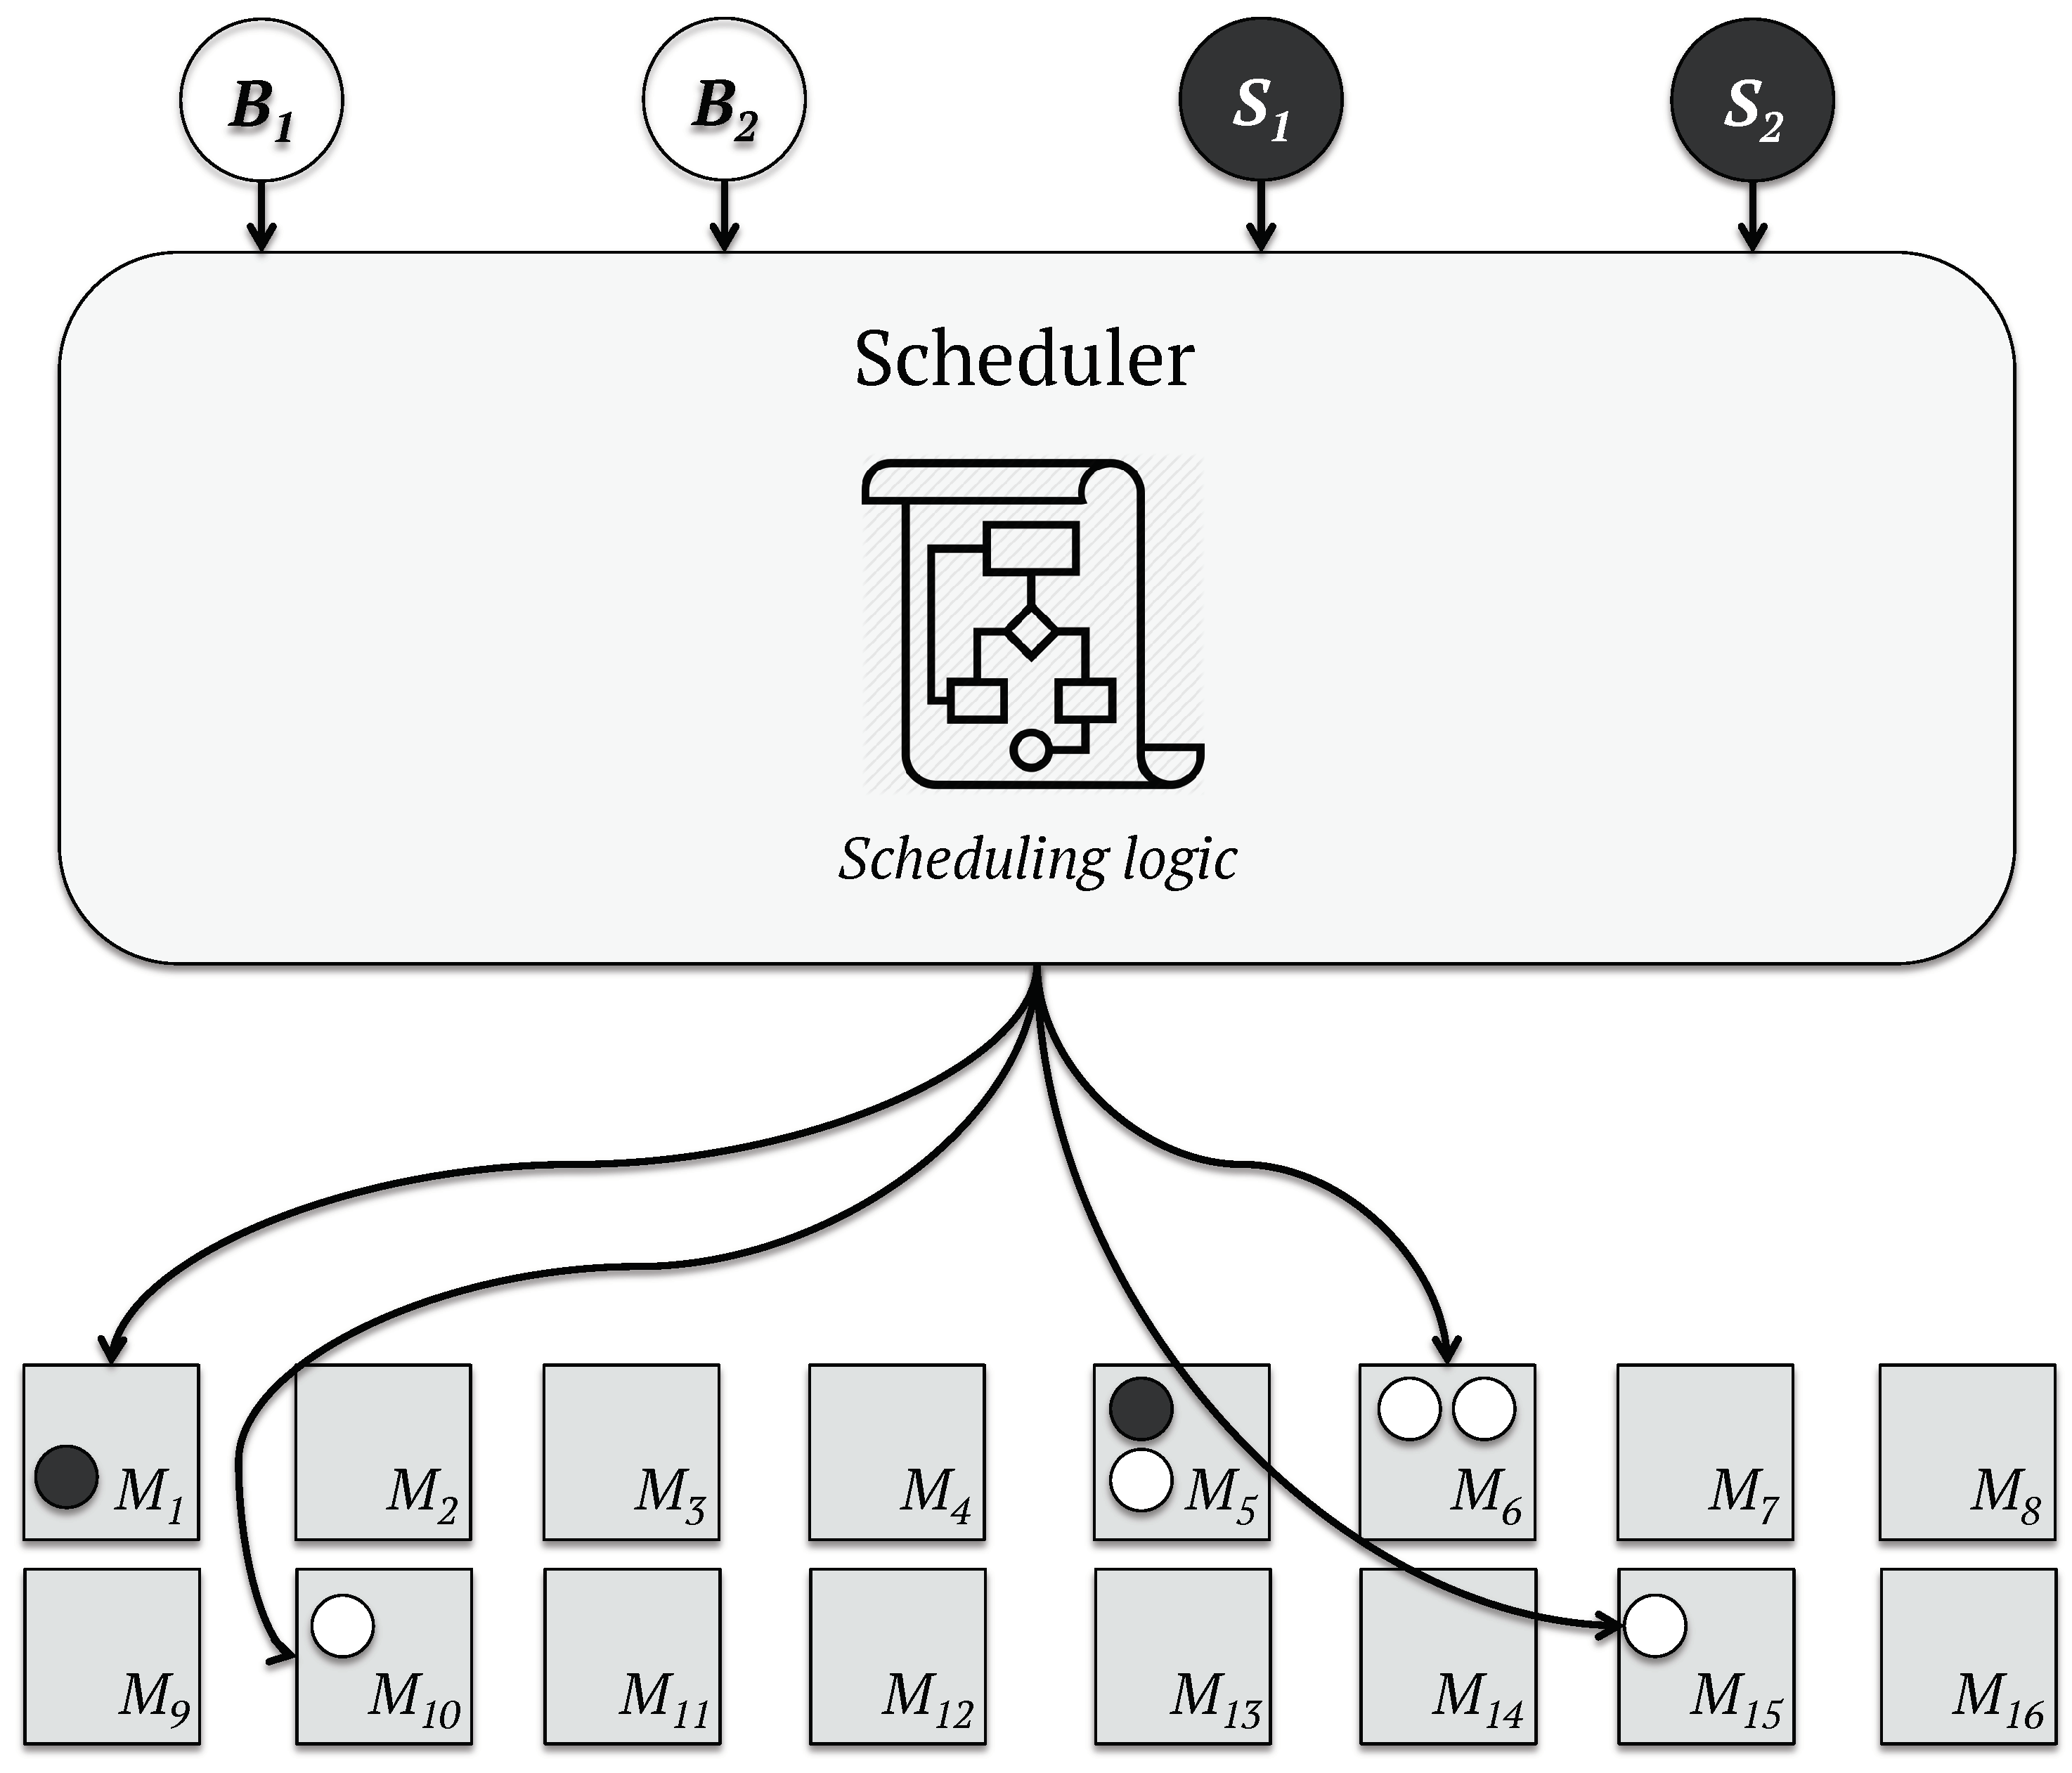
- Monolithic: A centralized and single scheduler is responsible for scheduling all tasks in the workload in this model [44]. This scheduling approach may be the perfect choice when real-time responses are not required [45,46], since the omniscient algorithm performs high-quality task assignations by considering all restrictions and features of the data-center [47,48,49,50] at the cost of longer latency [46]. The scheduling process of a monolithic scheduler, such as that given by Google Borg [51], is illustrated in Figure 1.
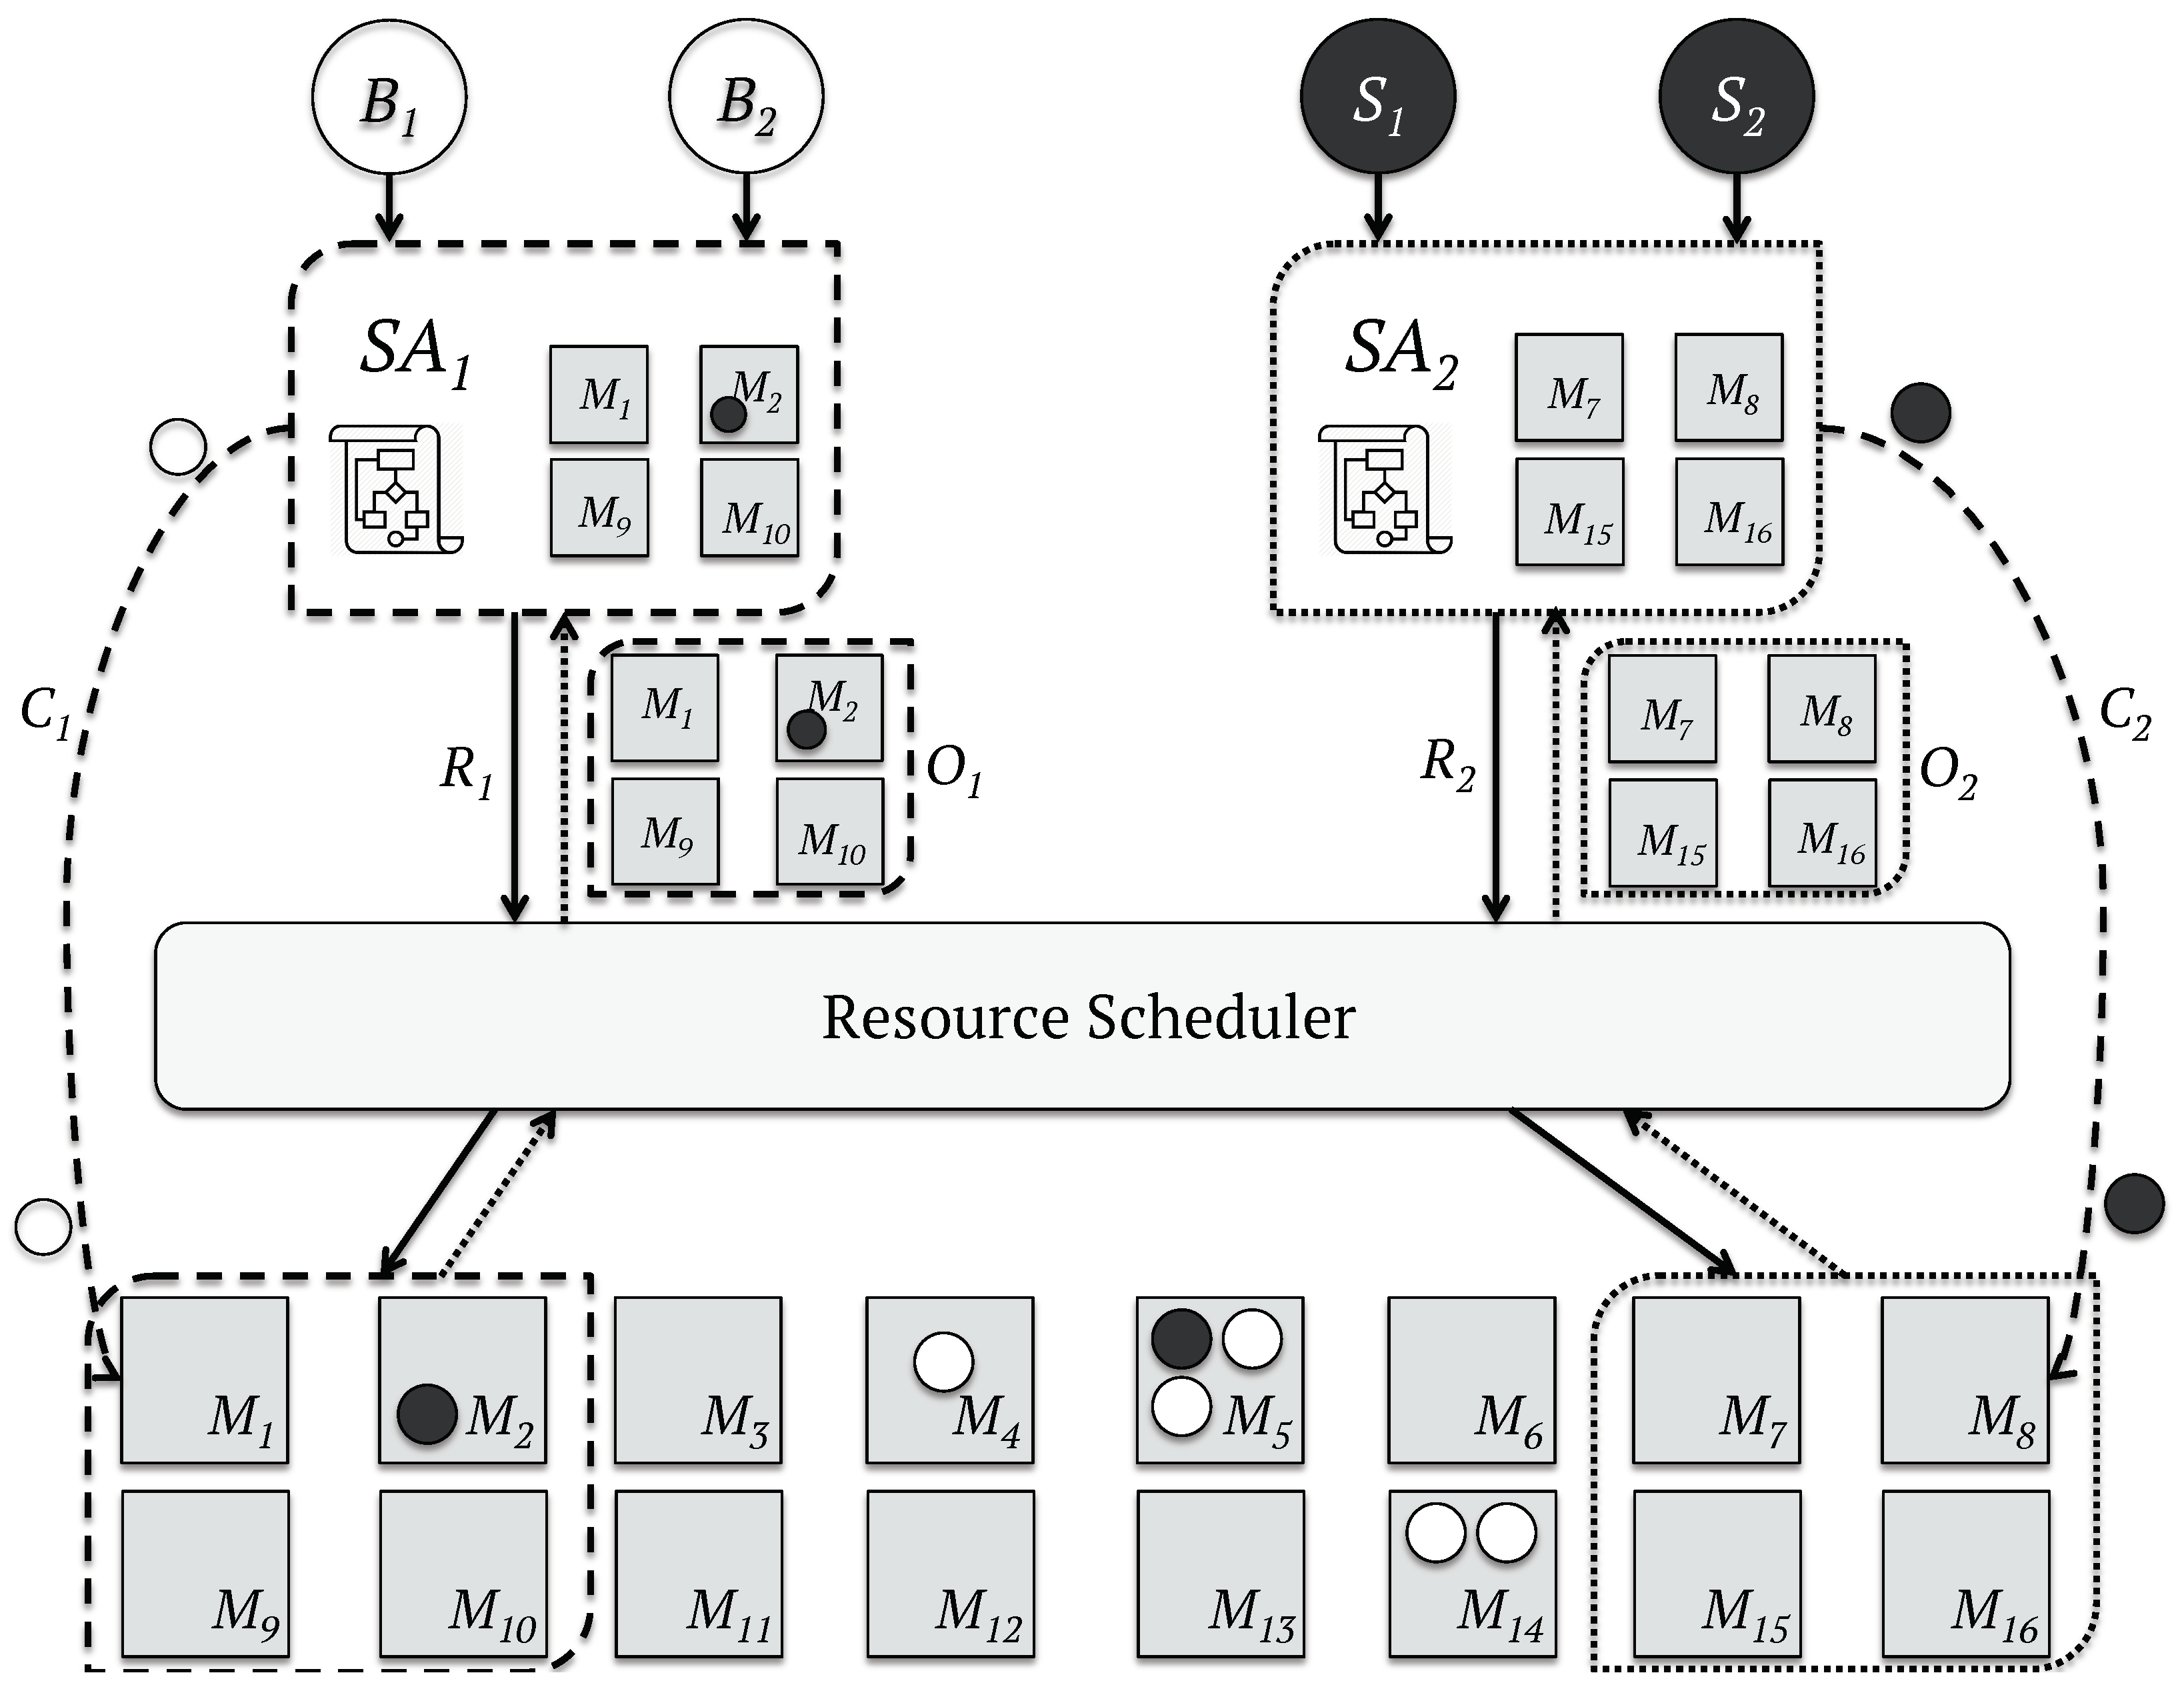
- Two-level: This model achieves a higher level of parallelism by splitting the resource allocation and the task placement: a central manager blocks the whole cluster every time a scheduler makes a decision to offer computing resources to schedulers; and a set of parallel application-level schedulers performs the scheduling logic against the resources offered. This strategy enables the development of sub-optimal scheduling logic for each application, since the state of the data-center is not shared with the central manager, nor with the application schedulers. The workflow of the Two-level schedulers [53,54] is represented in Figure 2.
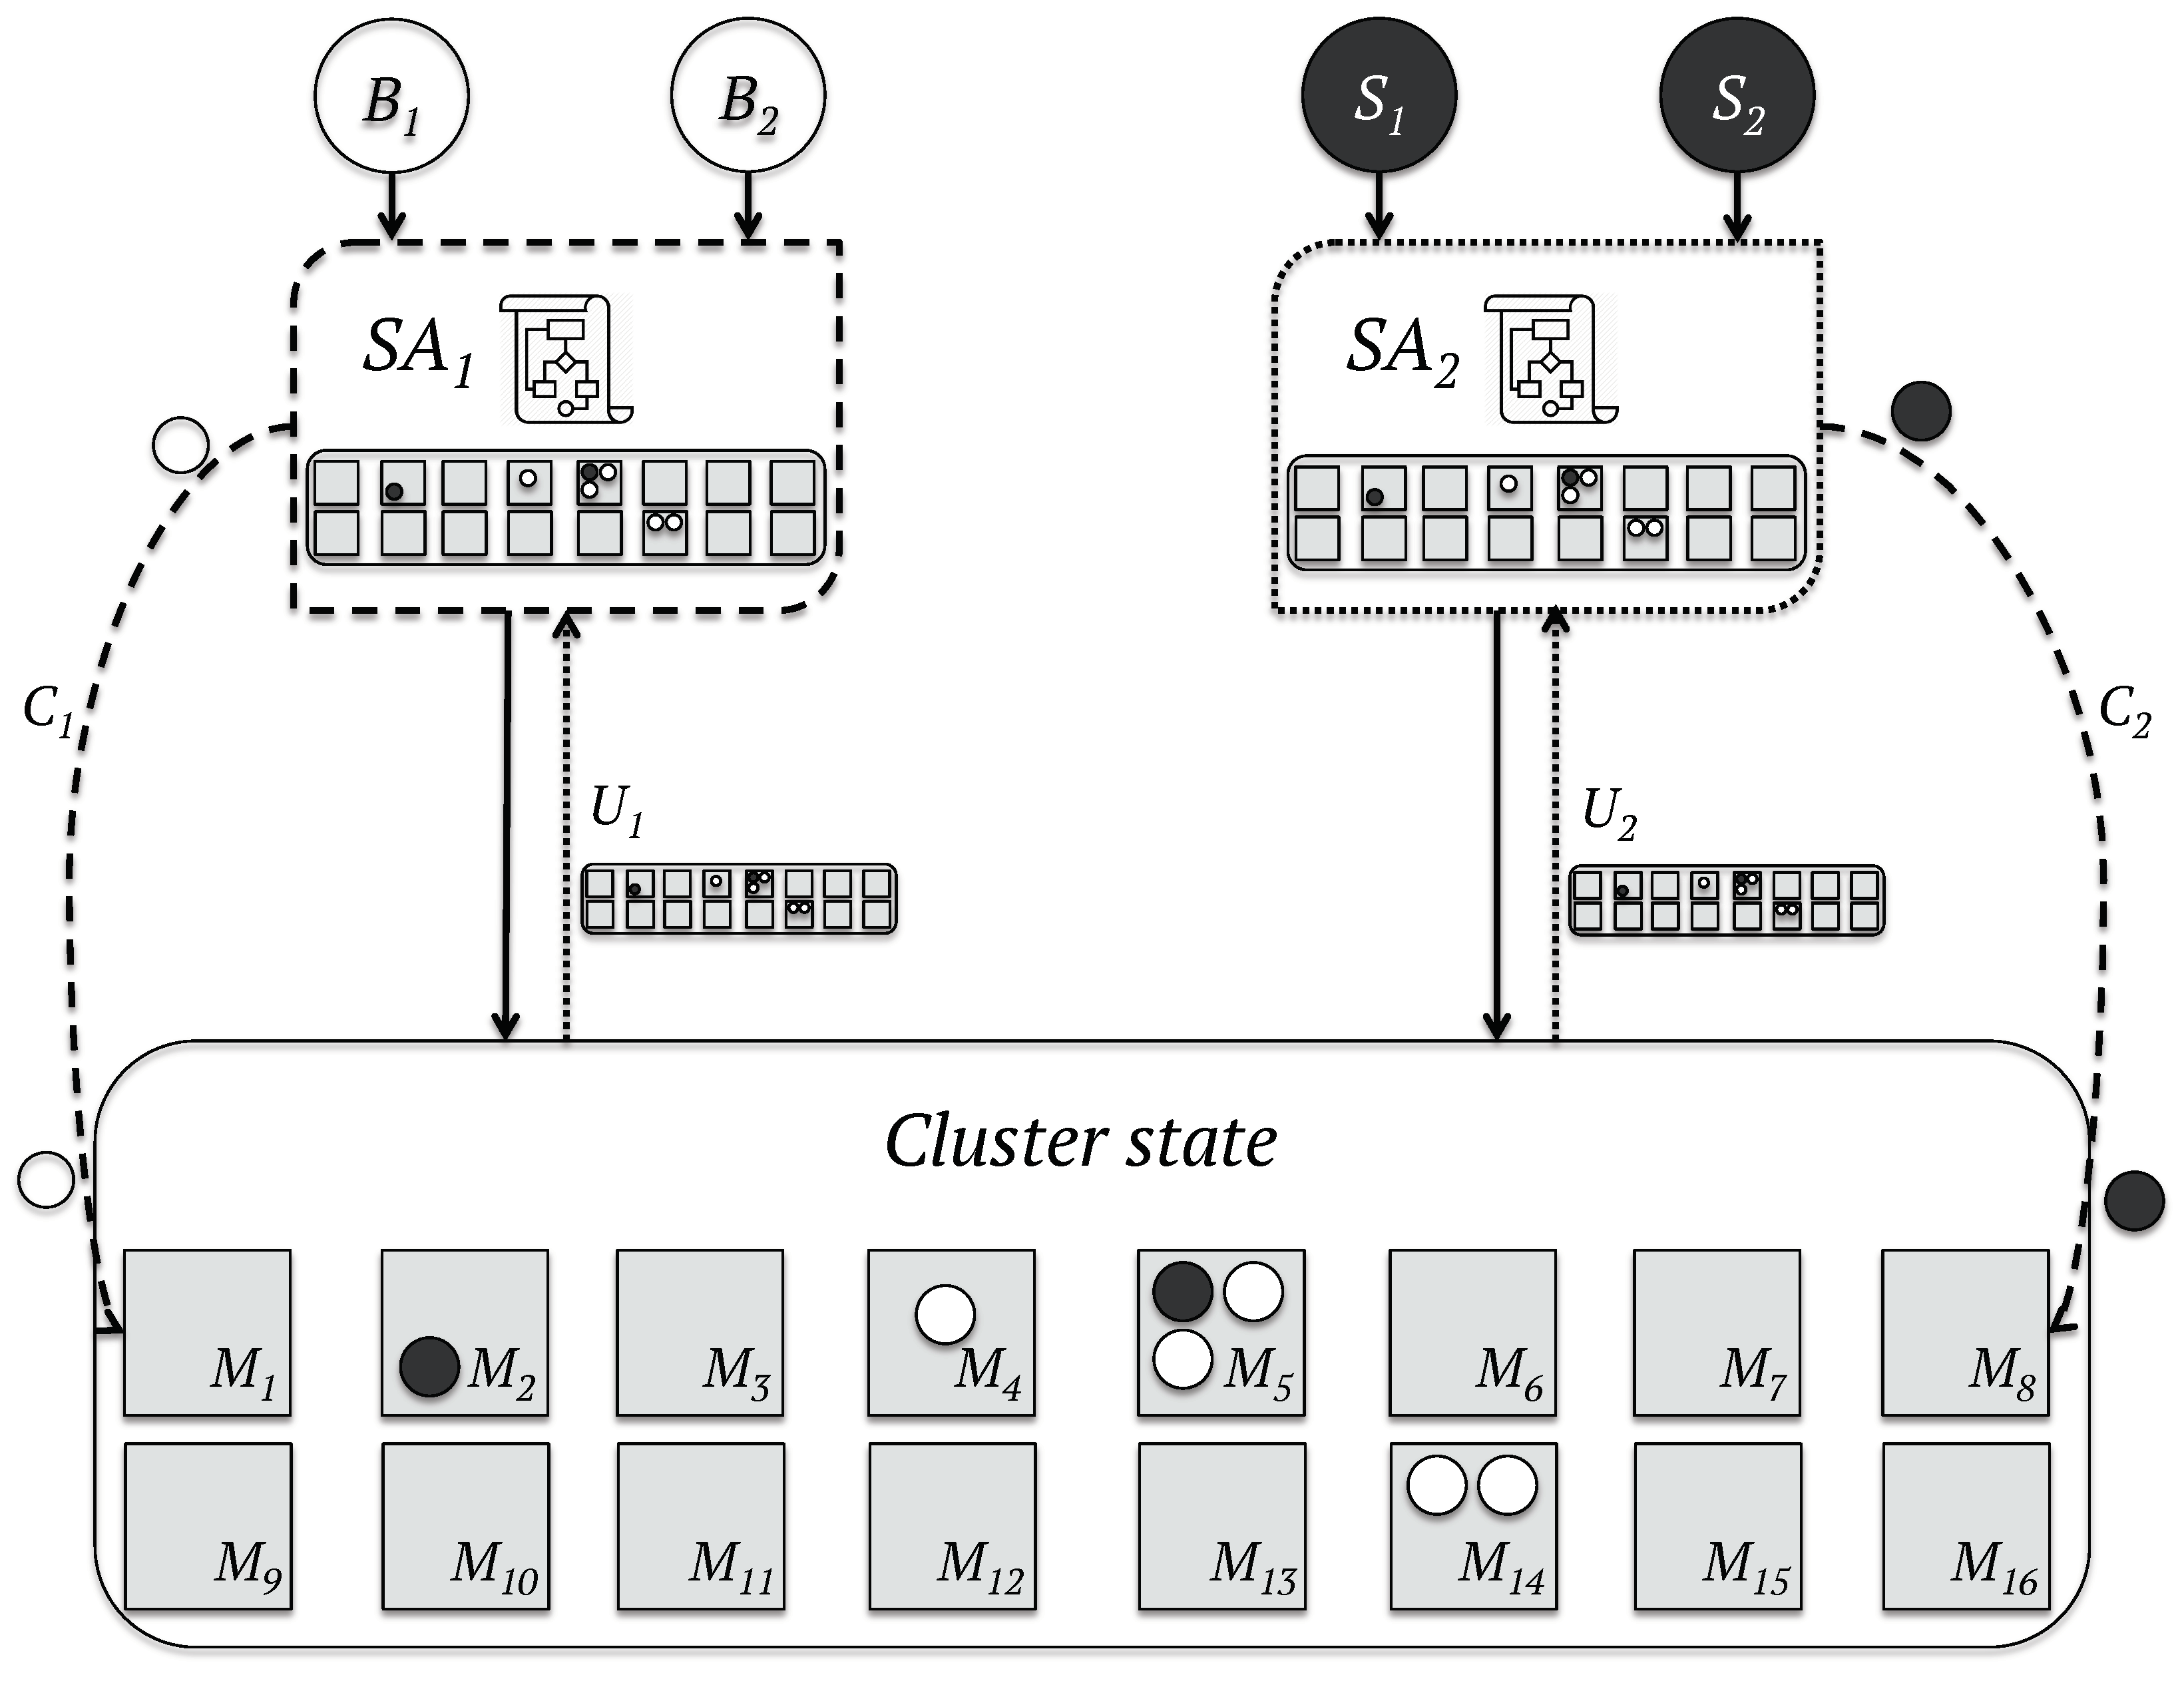
- Shared-state schedulers: On the other hand, in shared-state schedulers, such as Omega [55], the state of the data-center is available to all the schedulers. The central manager coordinates all the simultaneous parallel schedulers, which perform the scheduling logic against an out-of-date copy of the state of the data-center. The scheduling decisions are then committed to the central manager, which strives to apply these decisions. The utilization of stale views of the cluster by the schedulers can result in conflicts, since the chosen resources may not longer be available. In such a scenario, the local view of the state of the data-center stored in the scheduler is refreshed before the repetition of the scheduling process. The workflow of the shared-state scheduling model is represented in Figure 3.
5. Methodology
5.1. Simulation Tool
5.2. Environment and DMU Definition
- the low-utilization scenario, which represents highly over-provisioned infrastructures and achieves an average utilization of approximately 30%.
- the high-utilization scenario, which represents facilities of a more efficient nature that use approximately 65% of available resources on average.
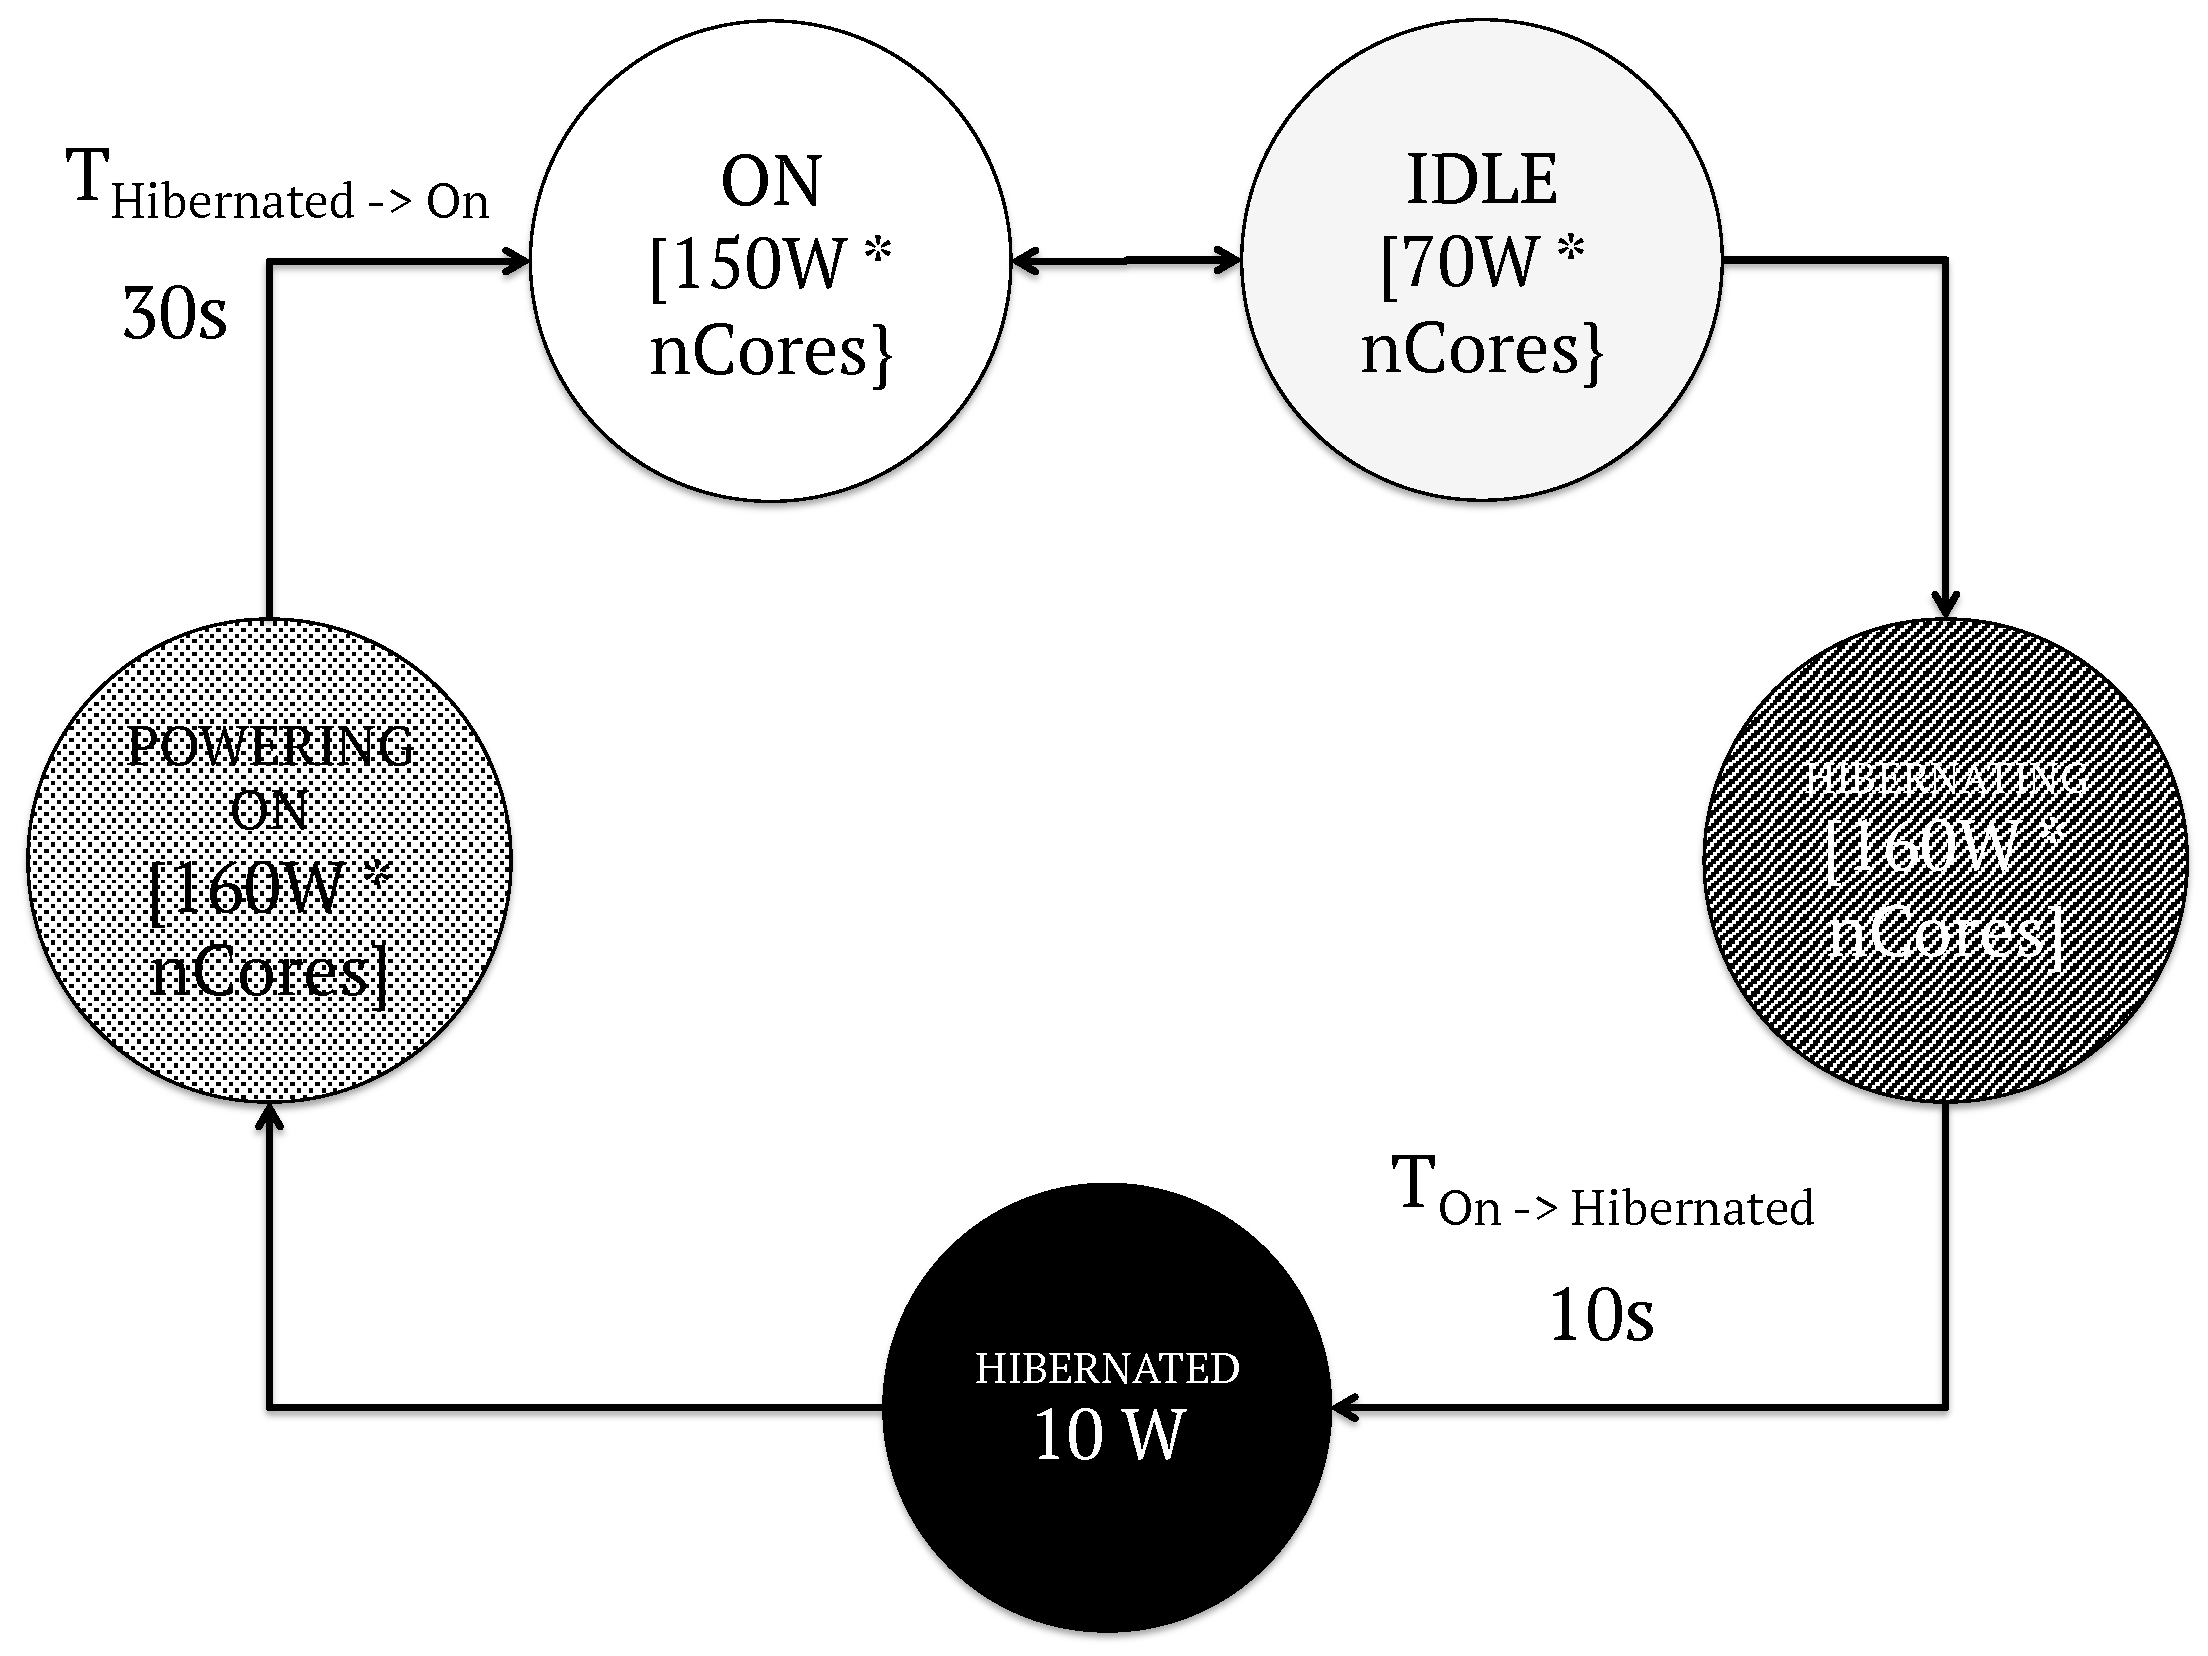
5.3. Energy Model
5.4. DEA Inputs and Outputs
- Inputs: Two inputs are considered in this work: (a) the number of machines in the data-center (D.C.), as shown in Section 5.2; and (b) the number of shut-down operations performed. These inputs may be reduced or kept equal.
- Outputs: One desirable output and two undesirable outputs are considered in this paper: (a) the time used to perform tasks’ operations. The longer the time, the less idle the data-center. This good input can be maximized or kept equal; (b) the energy consumption of the data-center. The lower the energy consumption, the more efficient the data-center. This bad input may be reduced or kept equal; and (c) the average time jobs spend in a queue until they are scheduled. The shorter the time, the more performant the system is. This bad input may be reduced or kept equal.
6. Natural CRS DEA Results
- The best efficiency levels are achieved for small data-centers. The data-center size input is predominant in this group of DMUs, since no major differences between energy policies, scheduling frameworks and workload scenarios are present ( = 0.01, = 0.99).
- Mid-size data-centers should use the margin energy policy and monolithic or Omega schedulers and should avoid all other energy policies and the Mesos scheduler. Moreover, high workload scenarios are also more efficient than low workload scenarios. In addition, the following DMUs achieve a good level of efficiency, but they do not belong to the efficiency frontier: (a) the DMU combining the Gamma energy policy and the monolithic or Omega schedulers; (b) the DMU combining the exponential energy policy and the Omega scheduler.
- No DMU is efficient in large-scale data-centers. However, the following DMUs present good levels of efficiency: (a) the DMUs combining the Gamma, exponential or margin energy policy with the high workload scenario and the monolithic scheduler; and (b) the DMUs combining the Gamma or margin energy policy with the high workload scenario and the Omega scheduler.
- In high-loaded scenarios, the monolithic scheduler presents the lowest deviation regardless of the data-center size ( = 0.32).
6.1. Proposed Corrections for a Sample DMU
- The time the data-center spends on task computation must be increased by 38.28 h (+83%).
- Energy consumption must be reduced by 193.88 MWh (−83%).
- The average time jobs wait in a queue must be reduced by 3.23 s (−83%).
- The number of servers must be reduced by 9190 (−92%).
- Shut-down operations must be reduced by 9680 (−24%).
7. Conclusions and Policy Implications
- The addition of different kind of workload patterns, as well as real workload traces.
- The analysis of other scheduling models, such as distributed and hybrid models.
- The development of a new-generation resource-managing system that could dynamically apply the optimal scheduling framework depending on the environment and workload.
- The analysis of simulation data with other DEA approaches, such as Bayesian and probabilistic models, which could minimize the impact of the noise in current DEA models.
Supplementary Materials
Author Contributions
Funding
Acknowledgments
Conflicts of Interest
References
- Koomey, J. Growth in Data Center Electricity Use 2005 to 2010; Analytical Press: Piedmont, CA, USA, 1 August 2011. [Google Scholar]
- Van Heddeghem, W.; Lambert, S.; Lannoo, B.; Colle, D.; Pickavet, M.; Demeester, P. Trends in worldwide ICT electricity consumption from 2007 to 2012. Comput. Commun. 2014, 50, 64–76. [Google Scholar] [CrossRef]
- Gómez-López, M.T.; Gasca, R.M.; Pérez-Álvarez, J.M. Decision-Making Support for the Correctness of Input Data at Runtime in Business Processes. Int. J. Cooper. Inf. Syst. 2014, 23. [Google Scholar] [CrossRef]
- Amirteimoori, A.; Emrouznejad, A. Optimal input/output reduction in production processes. Decis. Support Syst. 2012, 52, 742–747. [Google Scholar] [CrossRef]
- Chiang, K.; Hwang, S.N. Efficiency measurement for network systems IT impact on firm performance. Decis. Support Syst. 2010, 48, 437–446. [Google Scholar]
- Chang, Y.T.; Zhang, N.; Danao, D.; Zhang, N. Environmental efficiency analysis of transportation system in China: A non-radial DEA approach. Energy Policy 2013, 58, 277–283. [Google Scholar] [CrossRef]
- Arcos-Vargas, A.; Núñez-Hernández, F.; Villa-Caro, G. A DEA analysis of electricity distribution in Spain: An industrial policy recommendation. Energy Policy 2017, 102, 583–592. [Google Scholar] [CrossRef]
- Gonzalez-Rodriguez, M.; Velasco-Morente, F.; González-Abril, L. La eficiencia del sistema de protección social español en la reducción de la pobreza. Papeles de Población 2010, 16, 123–154. [Google Scholar]
- Afonso, A.; Schuknecht, L.; Tanzi, V. Public sector efficiency: Evidence for new EU member states and emerging markets. Appl. Econ. 2010, 42, 2147–2164. [Google Scholar] [CrossRef]
- Jakóbik, A.; Grzonka, D.; Kolodziej, J.; Chis, A.E.; González-Vélez, H. Energy Efficient Scheduling Methods for Computational Grids and Clouds. J. Telecommun. Inf. Technol. 2017, 1, 56–64. [Google Scholar]
- Sharma, R.K.; Bash, C.E.; Patel, C.D.; Friedrich, R.J.; Chase, J.S. Balance of power: Dynamic thermal management for internet data centers. IEEE Internet Comput. 2005, 9, 42–49. [Google Scholar] [CrossRef]
- El-Sayed, N.; Stefanovici, I.A.; Amvrosiadis, G.; Hwang, A.A.; Schroeder, B. Temperature management in data-centers: Why some (might) like it hot. In Proceedings of the 12th ACM SIGMETRICS/PERFORMANCE Joint International Conference on Measurement and Modeling of Computer Systems, London, UK, 11–15 June 2012; pp. 163–174. [Google Scholar]
- Miyoshi, A.; Lefurgy, C.; Van Hensbergen, E.; Rajamony, R.; Rajkumar, R. Critical power slope: Understanding the runtime effects of frequency scaling. In Proceedings of the 16th International Conference on Supercomputing, New York, NY, USA, 22–26 June 2016; pp. 35–44. [Google Scholar]
- Fan, X.; Weber, W.D.; Barroso, L.A. Power provisioning for a warehouse-sized computer. In Proceedings of the 34th Annual International Symposium on Computer Architecture, San Diego, CA, USA, 9–13 June 2007; pp. 13–23. [Google Scholar]
- Andersen, D.G.; Swanson, S. Rethinking flash in the data-center. IEEE Micro 2010, 30, 52–54. [Google Scholar] [CrossRef]
- Femal, M.E.; Freeh, V.W. Boosting data-center performance through non-uniform power allocation. In Proceedings of the Second International Conference on Autonomic Computing (ICAC’05), Seattle, WA, USA, 13–16 June 2005. [Google Scholar] [CrossRef]
- Jakóbik, A.; Grzonka, D.; Kołodziej, J. Security supportive energy aware scheduling and scaling for cloud environments. In Proceedings of the 31st European Conference on Modelling and Simulation (ECMS 2017), Budapest, Hungary, 23–26 May 2017; pp. 583–590. [Google Scholar]
- Juarez, F.; Ejarque, J.; Badia, R.M. Dynamic energy-aware scheduling for parallel task-based application in cloud computing. Future Gener. Comput. Syst. 2018, 78, 257–271. [Google Scholar] [CrossRef]
- Lee, Y.C.; Zomaya, A.Y. Energy efficient utilization of resources in cloud computing systems. J. Supercomput. 2012, 60, 268–280. [Google Scholar] [CrossRef]
- Sohrabi, S.; Tang, A.; Moser, I.; Aleti, A. Adaptive virtual machine migration mechanism for energy efficiency. In Proceedings of the 5th International Workshop on Green and Sustainable Software, Austin, TX, USA, 14–22 May 2016; pp. 8–14. [Google Scholar]
- Beloglazov, A.; Buyya, R. Optimal online deterministic algorithms and adaptive heuristics for energy and performance efficient dynamic consolidation of virtual machines in cloud data-centers. Concurr. Comp.-Pract. E 2012, 24, 1397–1420. [Google Scholar] [CrossRef]
- Kaushik, R.T.; Bhandarkar, M. Greenhdfs: Towards an energy-conserving, storage-efficient, hybrid hadoop compute cluster. In Proceedings of the 2010 International Conference on Power Aware Computing and Systems, Vancouver, BC, Canada, 3–6 October 2010; pp. 1–9. [Google Scholar]
- Luo, X.; Wang, Y.; Zhang, Z.; Wang, H. Superset: A non-uniform replica placement strategy towards high-performance and cost-effective distributed storage service. In Proceedings of the 2013 International Conference on Advanced Cloud and Big Data, Nanjing, China, 13–15 December 2013. [Google Scholar] [CrossRef]
- Fernández-Montes, A.; Gonzalez-Abril, L.; Ortega, J.A.; Lefèvre, L. Smart scheduling for saving energy in grid computing. Expert Syst. Appl. 2012, 39, 9443–9450. [Google Scholar] [CrossRef]
- Fernández-Montes, A.; Fernández-Cerero, D.; González-Abril, L.; Álvarez-García, J.A.; Ortega, J.A. Energy wasting at internet data-centers due to fear. Pattern Recogn. Lett. 2015, 67, 59–65. [Google Scholar] [CrossRef]
- Farrell, M.J. The measurement of productive efficiency. J. R. Stat. Soc. Ser. A (Gen.) 1957, 120, 253–290. [Google Scholar] [CrossRef]
- Charnes, A.; Cooper, W.W.; Rhodes, E. Measuring the efficiency of decision making units. Eur. J. Oper. Res. 1978, 2, 429–444. [Google Scholar] [CrossRef]
- Banker, R.D.; Charnes, A.; Cooper, W.W. Some Models for Estimating Technical and Scale Inefficiencies in Data Envelopment Analysis. Manag. Sci. 1984, 30, 1078–1092. [Google Scholar] [CrossRef]
- Fernández-Montes, A.; Velasco, F.; Ortega, J. Evaluating decision-making performance in a grid-computing environment using DEA. Expert Syst. Appl. 2012, 39, 12061–12070. [Google Scholar] [CrossRef]
- Campos, M.; Fernández-Montes, A.; Gavilan, J.; Velasco, F. Public resource usage in health systems: A data envelopment analysis of the efficiency of health systems of autonomous communities in Spain. Public Health 2016, 138, 33–40. [Google Scholar] [CrossRef] [PubMed]
- Fernández-Serrano, J.; Berbegal, V.; Velasco, F.; Expósito, A. Efficient entrepreneurial culture: A cross-country analysis of developed countries. Int. Entrep. Manag. J. 2017, 14, 105–127. [Google Scholar] [CrossRef]
- Exposito, A.; Velasco, F. Municipal solid-waste recycling market and the European 2020 Horizon Strategy: A regional efficiency analysis in Spain. J. Clean. Prod. 2018, 172, 938–948. [Google Scholar] [CrossRef]
- Scheel, H. Undesirable outputs in efficiency valuations. Eur. J Oper. Res. 2001, 132, 400–410. [Google Scholar] [CrossRef]
- Färe, R.; Grosskopf, S.; Hernandez-Sancho, F. Environmental performance: An index number approach. Resour. Energy Econ. 2004, 26, 343–352. [Google Scholar] [CrossRef]
- Zhou, P.; Ang, B.W.; Poh, K.L. Measuring environmental performance under different environmental DEA technologies. Energy Econ. 2008, 30, 1–14. [Google Scholar] [CrossRef]
- Sueyoshi, T.; Goto, M. Returns to scale and damages to scale on US fossil fuel power plants: Radial and non-radial approaches for DEA environmental assessment. Energy Econ. 2012, 34, 2240–2259. [Google Scholar] [CrossRef]
- Sueyoshi, T.; Goto, M. DEA radial measurement for environmental assessment: A comparative study between Japanese chemical and pharmaceutical firms. Appl. Energy 2014, 115, 502–513. [Google Scholar] [CrossRef]
- Halkos, G.E.; Tzeremes, N.G. Measuring the effect of Kyoto protocol agreement on countries’ environmental efficiency in CO2 emissions: An application of conditional full frontiers. J. Prod. Anal. 2014, 41, 367–382. [Google Scholar] [CrossRef]
- Sanz-Díaz, M.T.; Velasco-Morente, F.; Yñiguez, R.; Díaz-Calleja, E. An analysis of Spain’s global and environmental efficiency from a European Union perspective. Energy Policy 2017, 104, 183–193. [Google Scholar] [CrossRef]
- Vlontzos, G.; Pardalos, P. Assess and prognosticate green house gas emissions from agricultural production of EU countries, by implementing, DEA Window analysis and artificial neural networks. Renew. Sustain. Energy Rev. 2017, 76, 155–162. [Google Scholar] [CrossRef]
- Yu, S.H.; Gao, Y.; Shiue, Y.C. A Comprehensive Evaluation of Sustainable Development Ability and Pathway for Major Cities in China. Sustainability 2017, 9, 1483. [Google Scholar] [CrossRef]
- Dios-Palomares, R.; Alcaide, D.; Pérrez, J.D.; Bello, M.J.; Prieto, A.; Zúniga, C.A. The Environmental Efficiency using Data Envelopment Analysis: Empirical methods and evidences. In The stated of the Art for Bieconomic and Climate Change; Editorial Universitaria UNAN Leon, Ed.; Red de Bioeconomia y Cambio Climático: Cordoba, Spain, 2017; p. 48. [Google Scholar]
- Cooper, W.W.; Park, K.S.; Pastor, J.T. RAM: A range adjusted measure of inefficiency for use with additive models, and relations to other models and measures in DEA. J. Prod. Anal. 1999, 11, 5–42. [Google Scholar] [CrossRef]
- Delimitrou, C.; Kozyrakis, C. Paragon: QoS-aware scheduling for heterogeneous datacenters. In Proceedings of the Eighteenth International Conference on Architectural Support for Programming Languages and Operating Systems, Houston, TX, USA, 16–20 March 2013; pp. 77–88. [Google Scholar]
- Isard, M.; Prabhakaran, V.; Currey, J.; Wieder, U.; Talwar, K.; Goldberg, A. Quincy: Fair scheduling for distributed computing clusters. In Proceedings of the ACM SIGOPS 22nd Symposium on Operating Systems Principles, Big Sky, MT, USA, 11–14 October 2009; pp. 261–276. [Google Scholar]
- Delimitrou, C.; Sanchez, D.; Kozyrakis, C. Tarcil: Reconciling scheduling speed and quality in large shared clusters. In Proceedings of the Sixth ACM Symposium on Cloud Computing, Kohala Coast, HI, USA, 27–29 August 2015; pp. 97–110. [Google Scholar]
- Grandl, R.; Ananthanarayanan, G.; Kandula, S.; Rao, S.; Akella, A. Multi-resource packing for cluster schedulers. ACM SIGCOMM Comput. Commun. Rev. 2015, 44, 455–466. [Google Scholar] [CrossRef]
- Zaharia, M.; Borthakur, D.; Sen Sarma, J.; Elmeleegy, K.; Shenker, S.; Stoica, I. Delay scheduling: A simple technique for achieving locality and fairness in cluster scheduling. In Proceedings of the 5th European Conference on Computer systems, Paris, France, 13–16 April 2010; pp. 265–278. [Google Scholar]
- Delimitrou, C.; Kozyrakis, C. Quasar: Resource-efficient and QoS-aware cluster management. In Proceedings of the 19th International Conference on Architectural Support for Programming Languages and Operating Systems, Salt Lake City, UT, USA, 1–5 March 2014; pp. 127–144. [Google Scholar]
- Zhang, X.; Tune, E.; Hagmann, R.; Jnagal, R.; Gokhale, V.; Wilkes, J. CPI 2: CPU performance isolation for shared compute clusters. In Proceedings of the 8th ACM European Conference on Computer Systems, Prague, The Czech Republic, 15–17 April 2013; pp. 379–391. [Google Scholar]
- Verma, A.; Pedrosa, L.; Korupolu, M.; Oppenheimer, D.; Tune, E.; Wilkes, J. Large-scale cluster management at Google with Borg. In Proceedings of the Tenth European Conference on Computer Systems, Bordeaux, France, 21–24 April 2015; p. 18. [Google Scholar] [CrossRef]
- Fernández-Cerero, D.; Fernández-Montes, A.; Jakóbik, A.; Kołodziej, J.; Toro, M. SCORE: Simulator for cloud optimization of resources and energy consumption. Simul. Model. Pract. Th. 2018, 82, 160–173. [Google Scholar] [CrossRef]
- Hindman, B.; Konwinski, A.; Zaharia, M.; Ghodsi, A.; Joseph, A.D.; Katz, R.H.; Shenker, S.; Stoica, I. Mesos: A Platform for Fine-Grained Resource Sharing in the Data Center. In Proceedings of the 8th USENIX Conference on Networked Systems Design and Implementation, Boston, MA, USA, 30 March–1 April 2011; pp. 295–308. [Google Scholar]
- Vavilapalli, V.K.; Murthy, A.C.; Douglas, C.; Agarwal, S.; Konar, M.; Evans, R.; Graves, T.; Lowe, J.; Shah, H.; Seth, S.; et al. Apache hadoop yarn: Yet another resource negotiator. In Proceedings of the 4th Annual Symposium on Cloud Computing, Santa Clara, CA, USA, 1–3 October 2013; p. 5. [Google Scholar]
- Schwarzkopf, M.; Konwinski, A.; Abd-El-Malek, M.; Wilkes, J. Omega: Flexible, scalable schedulers for large compute clusters. In Proceedings of the 8th ACM European Conference on Computer Systems, Prague, The Czech Republic, 15–17 April 2013; pp. 351–364. [Google Scholar]
- Armbrust, M.; Fox, A.; Griffith, R.; Joseph, A.D.; Katz, R.; Konwinski, A.; Lee, G.; Patterson, D.; Rabkin, A.; Stoica, I.; et al. A view of cloud computing. Commun. ACM 2010, 53, 50–58. [Google Scholar] [CrossRef]
- Ruth, S. Reducing ICT-related carbon emissions: An exemplar for global energy policy? IETE Tech. Rev. 2011, 28, 207–211. [Google Scholar] [CrossRef]


| Parameter | Description | Action |
|---|---|---|
| Inputs | ||
| Data-center size | Number of machines in the data-center | ↓ ↔ |
| #shut-downs | Number of shut-down operations | ↓ ↔ |
| Outputs | ||
| Computation time | Total amount of useful task computation | ↑ ↔ |
| Energy consumption | Total data-center energy consumption | ↓ ↔ |
| Queue time | Average time until jobs are fully scheduled | ↓ ↔ |
| DMU | Inputs | Outputs | |||||
|---|---|---|---|---|---|---|---|
| Energy Policy | Scheduling Model | Work-Load | D.C. Size | #Shut-Downs | Computing Time (h) | MWh Consumed | Queue Time (ms) |
| Always | Monolithic | High | 1000 | 37,166 | 104.42 | 49.01 | 90.10 |
| Margin | Mesos | High | 1000 | 13,361 | 104.26 | 49.65 | 1093.00 |
| Gamma | Omega | High | 1000 | 14,252 | 104.17 | 49.60 | 0.10 |
| Always | Mono. | Low | 1000 | 36,404 | 49.25 | 23.92 | 78.30 |
| Exponential | Mesos | Low | 1000 | 19,671 | 49.63 | 24.65 | 1188.70 |
| Load | Omega | Low | 1000 | 32,407 | 49.34 | 24.19 | 1.10 |
| Margin | Mono. | High | 5000 | 6981 | 99.96 | 237.09 | 126.20 |
| Gamma | Mono. | High | 5000 | 9877 | 99.96 | 235.92 | 129.80 |
| Random | Mesos | High | 5000 | 33,589 | 100.03 | 234.90 | 1122.60 |
| Margin | Omega | High | 5000 | 8578 | 100.26 | 239.13 | 0.70 |
| Exponential | Omega | High | 5000 | 11,863 | 100.26 | 236.95 | 1.00 |
| Margin | Omega | Low | 5000 | 15,452 | 46.70 | 115.82 | 0.50 |
| Margin | Mono. | High | 10,000 | 9680 | 101.56 | 481.36 | 325.20 |
| Gamma | Mono. | High | 10,000 | 11,388 | 101.56 | 479.36 | 327.90 |
| Margin | Omega | High | 10,000 | 18,150 | 101.63 | 486.11 | 2.60 |
| Gamma | Omega | High | 10,000 | 18,409 | 101.63 | 484.69 | 2.50 |
| Gamma | Mesos | Low | 10,000 | 29,707 | 45.83 | 228.31 | 1107.60 |
| Random | Omega | Low | 10,000 | 40,772 | 46.09 | 233.50 | 3.80 |
| Scheduling | Workload | Data-Center Size | Efficiency | |||
|---|---|---|---|---|---|---|
| Model | Scenario | 1000 | 5000 | 10,000 | ||
| Monolithic | High | 1.00 | 0.60 | 0.37 | 0.32 | 0.66 |
| Monolithic | Low | 0.98 | 0.33 | 0.18 | 0.43 | 0.49 |
| Mesos | High | 1.00 | 0.47 | 0.18 | 0.41 | 0.55 |
| Mesos | Low | 0.97 | 0.32 | 0.17 | 0.43 | 0.49 |
| Omega | High | 1.00 | 0.62 | 0.27 | 0.36 | 0.63 |
| Omega | Low | 0.97 | 0.32 | 0.17 | 0.43 | 0.49 |
| 0.01 | 0.14 | 0.08 | ||||
| 0.99 | 0.44 | 0.23 | ||||
| 0.40 | 0.55 | |||||
| Scheduling Model | |||||||||||
|---|---|---|---|---|---|---|---|---|---|---|---|
| Energy | Monolithic | Mesos | Omega | Efficiency | |||||||
| Policy | 1000 | 5000 | 10,000 | 1000 | 5000 | 10,000 | 1000 | 5000 | 10,000 | ||
| Always | 0.99 | 0.33 | 0.18 | 0.99 | 0.33 | 0.18 | 0.99 | 0.33 | 0.18 | 0.37 | 0.50 |
| Random | 0.99 | 0.33 | 0.18 | 0.98 | 0.32 | 0.18 | 0.98 | 0.33 | 0.18 | 0.37 | 0.50 |
| Load | 0.99 | 0.33 | 0.18 | 0.99 | 0.33 | 0.18 | 0.99 | 0.33 | 0.18 | 0.37 | 0.50 |
| Margin | 0.99 | 0.66 | 0.42 | 0.99 | 0.53 | 0.18 | 0.99 | 0.66 | 0.30 | 0.31 | 0.63 |
| Exp. | 0.99 | 0.54 | 0.31 | 0.99 | 0.40 | 0.18 | 0.99 | 0.58 | 0.22 | 0.33 | 0.58 |
| Gamma | 0.99 | 0.58 | 0.38 | 0.98 | 0.47 | 0.18 | 0.99 | 0.61 | 0.29 | 0.31 | 0.61 |
| DMU | Peer | Corrections | |||||||
|---|---|---|---|---|---|---|---|---|---|
| Energy | Sched. | Work- | Projec- | D.C. | #Shut- | Comp. | Energy | Queue | |
| # | Policy | Model | load | tions | Size | downs | Time | Cons. | Time |
| 1 | Always | Mono. | High | ↔ | ↔ | ↔ | ↔ | ↔ | ↔ |
| 10 | Margin | Mesos | High | 4 (88%) | ↓ | ↔ | ↑ | ↓ | ↓ |
| 18 | Gamma | Omega | High | ↔ | ↔ | ↔ | ↔ | ↔ | ↔ |
| 19 | Always | Mono. | Low | ↔ | ↓ | ↓ | ↑ | ↓ | ↓ |
| 29 | Exp. | Mesos | Low | 23 (56%) | ↓ | ↓ | ↑ | ↓ | ↓ |
| 22 (48%) | |||||||||
| 33 | Load | Omega | Low | 31 (100%) | ↓ | ↓ | ↑ | ↓ | ↔ |
| 40 | Margin | Mono. | High | ↔ | ↔ | ↔ | ↔ | ↔ | ↔ |
| 42 | Gamma | Mono. | High | 6 (59%) | ↓ | ↔ | ↑ | ↓ | ↓ |
| 41 (41%) | |||||||||
| 44 | Random | Mesos | High | 7 (100%) | ↓ | ↔ | ↑ | ↓ | ↓ |
| 52 | Margin | Omega | High | ↔ | ↔ | ↔ | ↔ | ↔ | ↔ |
| 53 | Exp. | Omega | High | 16 (63%) | ↓ | ↔ | ↑ | ↓ | ↓ |
| 52 (36%) | |||||||||
| 70 | Margin | Omega | Low | 18 (72%) | ↓ | ↓ | ↑ | ↓ | ↓ |
| 76 | Margin | Mono. | High | 6 (55%) | ↓ | ↔ | ↑ | ↓ | ↓ |
| 40 (45%) | |||||||||
| 78 | Gamma | Mono. | High | 6 (90%) | ↓ | ↔ | ↑ | ↓ | ↓ |
| 88 | Margin | Omega | High | 18 (95%) | ↓ | ↔ | ↑ | ↓ | ↓ |
| 90 | Gamma | Omega | High | 18 (96%) | ↓ | ↔ | ↑ | ↓ | ↓ |
| 102 | Gamma | Mesos | Low | 1 (49%) | ↓ | ↔ | ↑ | ↓ | ↓ |
| 22 (38%) | |||||||||
| 104 | Random | Omega | Low | 13 (53%) | ↓ | ↓ | ↑ | ↓ | ↓ |
| 34 (36%) | |||||||||
| Results for DMU #104 | |||||
|---|---|---|---|---|---|
| Natural Efficiency = 0.1697 | |||||
| Projection Summary: | |||||
| Variable | Original | Radial | Slack | Projected | |
| Value | Movement | Movement | Value | ||
| Output | Computation (h) | 46.09 | +83% | 0 | 84.37 |
| Output | MWh consumed | 233.50 | −83% | 0 | 39.62 |
| Output | Queue time (ms) | 3.80 | −83% | 0 | 0.6 |
| Input | #Servers | 10,000 | 0 | −9190 | 810 |
| Input | #Shut-downs | 40,772 | 0 | −9680 | 31,092 |
| Listing of Peers: | |||||
| Peer | Lambda Weight | ||||
| #13 | 53% | ||||
| #34 | 36% | ||||
| #18 | 11% | ||||
© 2018 by the authors. Licensee MDPI, Basel, Switzerland. This article is an open access article distributed under the terms and conditions of the Creative Commons Attribution (CC BY) license (http://creativecommons.org/licenses/by/4.0/).
Share and Cite
Fernández-Cerero, D.; Fernández-Montes, A.; Velasco, F. Productive Efficiency of Energy-Aware Data Centers. Energies 2018, 11, 2053. https://doi.org/10.3390/en11082053
Fernández-Cerero D, Fernández-Montes A, Velasco F. Productive Efficiency of Energy-Aware Data Centers. Energies. 2018; 11(8):2053. https://doi.org/10.3390/en11082053
Chicago/Turabian StyleFernández-Cerero, Damián, Alejandro Fernández-Montes, and Francisco Velasco. 2018. "Productive Efficiency of Energy-Aware Data Centers" Energies 11, no. 8: 2053. https://doi.org/10.3390/en11082053
APA StyleFernández-Cerero, D., Fernández-Montes, A., & Velasco, F. (2018). Productive Efficiency of Energy-Aware Data Centers. Energies, 11(8), 2053. https://doi.org/10.3390/en11082053