Article

Prediction Error Analysis of Finite-Control-Set Model Predictive Current Control for IPMSMs

1
College of Electrical Engineering, Zhejiang University, Hangzhou 310027, China
2
State Key Laboratory of Reliability and Intelligence of Electrical Equipment, Hebei University of Technology, Tianjin 300130, China
*
Author to whom correspondence should be addressed.
Energies 2018, 11(8), 2051; https://doi.org/10.3390/en11082051
Submission received: 12 May 2018 / Revised: 24 July 2018 / Accepted: 3 August 2018 / Published: 7 August 2018
(This article belongs to the Section F: Electrical Engineering)

Abstract

:
Finite-control-set model predictive current control (FCS-MPCC) has been widely investigated in the field of motor control. When the discrete motor prediction model is not obtained accurately, prediction error often occurs, which can result in improper determinations of optimal voltage vectors and can further affect the control performance of motor systems. However, papers evaluating the motor control performance employing FCS-MPCC rarely consider prediction error and its utilization to weaken the influence of inaccurate prediction model. This paper investigates in depth the prediction error caused by three influencing factors from the perspective of model accuracy—discretization method, prediction stepsize, and parameter mismatch. Firstly, the evaluation index, prediction error, is defined and its formulas considering the above three factors are derived based on interior permanent magnet synchronous motor (IPMSM). Then, the theoretical analysis of prediction error is provided. Finally, experimental results of an IPMSM drive system are presented to verify and complement the theoretical analysis. Both the theoretical analysis and experimental results fully elaborate the prediction error, which can offer practical guidelines for the evaluation and improvement of motor control performance, especially for FCS-MPCC in IPMSM applications.

1. Introduction

The interior permanent magnet synchronous motor (IPMSM) is widely applied in many industry applications due to its high power intensity, high efficiency, high toque density, and wide speed range [1]. As an important control objective, the current of IPMSM is usually adjusted by utilizing vector control (VC) schemes based on proportional-integral (PI) controllers and pulse-width-modulation (PWM) strategies [2]. It shows good control performance but suffers from the problems of PI-parameters tuning and constraints handling. With the improvement of digital microprocessors, model predictive control (MPC), which has been successfully applied in process industry control, is becoming a potential alternative due to its obvious advantages, such as intuitive control process, fast dynamic responses, and easy inclusion of multiple control objectives and nonlinear constraints [3].
MPC is usually divided into continuous-control-set MPC (CCS-MPC) and finite-control-set MPC (FCS-MPC). In CCS-MPC, an optimization problem is solved online to get the desired voltage vector, which is then synthesized through a modulator [4]. FCS-MPC can take advantage of the discrete nature of power converters without any modulator [5]. Available voltage vectors that represent all switching states are enumerated to complete the prediction process, and the optimal one is finally selected for the next control period based on a designed cost function. Therefore, FCS-MPC is quite simple and intuitive compared with CCS-MPC.
For MPC strategies in the field of motor control, the prediction process mainly utilizes discrete motor prediction model to calculate the future states of motor systems and to select one optimal voltage vector according to the prediction results. Therefore, the control performance of motor systems is significantly affected by the prediction accuracy of motor prediction model. Generally speaking, there are three main factors that can influence the model prediction accuracy.
The first factor is the discretization method to obtain motor prediction model from motor continuous equations. It is well known that there are several approximation methods for differential equations [6]. In the field of motor control, forward Euler approximation method is widely used to obtain the discrete motor prediction model due to its simplicity and low computational burden for single-step prediction applications [7,8,9]. In Reference [10], a modified Euler integration method was adopted to achieve higher model accuracy, which actually transformed the implicit Tustin approximation to an explicit one by combining with forward Euler approximation. In Reference [11], two-order Taylor series expansion was utilized to achieve faster signal propagation from input changes to all controlled states, especially the mechanical speed, and relative degree one could be obtained [12]. In References [13,14], a discretization method was proposed considering the PWM pulse patterns within each sampling period for deadbeat predictive control to obtain an accurate discrete model.
The second factor is the prediction stepsize, which is usually equal to the control interval and sampling time for single-step MPC. It is well known that the prediction stepsize is closely related to the final control performance. In general, the shorter the prediction stepsize, the better is the steady-state performance; this has been empirically shown by experimental results in literature [15,16]. In particular, when system variables and inputs change rapidly, a long prediction stepsize cannot respond immediately and may yield large tracking errors [11]. However, the prediction stepsize cannot be reduced indefinitely due to the hardware limitations and the power level of applications [17].
The third factor is the parameter mismatch between prediction model and actual motor. Due to the inaccuracy of measurements or settings, the parameters in prediction model may not be the same as the actual values. Besides, the motor parameters also change according to the magnetic saturation and temperature [18]. Such parameter mismatches can bring different degrees of prediction error, which may further lead to wrong selection of optimal voltage vector and deteriorate system control performance. Many published papers have proposed methods to solve this problem, including designing model-free prediction algorithm [19,20], identifying parameters online [9,21,22], and constructing observers to estimate the influence of parameter deviations [23,24,25]. However, the model-free predictive control poses relatively high requirements for hardware implementation of the drive system, while the latter two categories are prone to making control algorithms complex, which may be not suitable for the real-time implementation and may even result in instability of the system.
Although there are above-state-of-the-art published works about MPC methods in terms of discretization method, prediction stepsize, and model parameter mismatch, little direct attention has been given to the prediction error and its relationship with the three influencing factors mentioned above. However, for MPC strategies including FCS-MPC, the prediction error is an inherent and essential feature, which should be considered to evaluate control performance. In Reference [26], the prediction error between the models with accurate parameters and with parametric mismatches was studied by simulation based on a generalized voltage-source converter. In Reference [27], the weighted prediction errors between predicted and measured current values in previous control interval were utilized to compensate for the prediction error in present prediction process; this can improve the robustness of the surface permanent magnet synchronous motor (SPMSM) system and has quite a simple structure. The study showed the feasibility and potentiality of utilizing prediction error to improve the control performance when employing finite-control-set model predictive current control (FCS-MPCC) algorithm. However, the analysis of prediction error is still limited in both References [26,27], especially in terms of IPMSM, which is not good for further utilization of prediction error.
Due to the above reasons, this paper aims to fill the gap of prediction error analysis based on the framework of FCS-MPCC strategy and IPMSM. Firstly, the prediction error is defined as the difference between prediction value and actual value from the perspective of practical implementation. Then, it takes IPMSM as control object and utilizes FCS-MPCC as control strategy to derive formulas of prediction error considering different discretization orders, prediction stepsizes, and parameter mismatch degrees. Finally, comprehensive theoretical and experimental analyses of prediction error and its variation trends are conducted. The investigations can offer a new perspective to evaluate motor control performance when employing FCS-MPCC strategy in IPMSM applications. Besides, it can also lay the foundation for new methods to compensate for prediction error and improve motor control performance.
The rest of the paper is organized as follows: Section 2 introduces the basic FCS-MPCC algorithm. In Section 3, the prediction error is clearly defined and its detailed analytical studies for three influencing factors are presented separately. Experimental results are presented to verify the theoretical analysis in Section 4. Finally, the paper is concluded in Section 5.

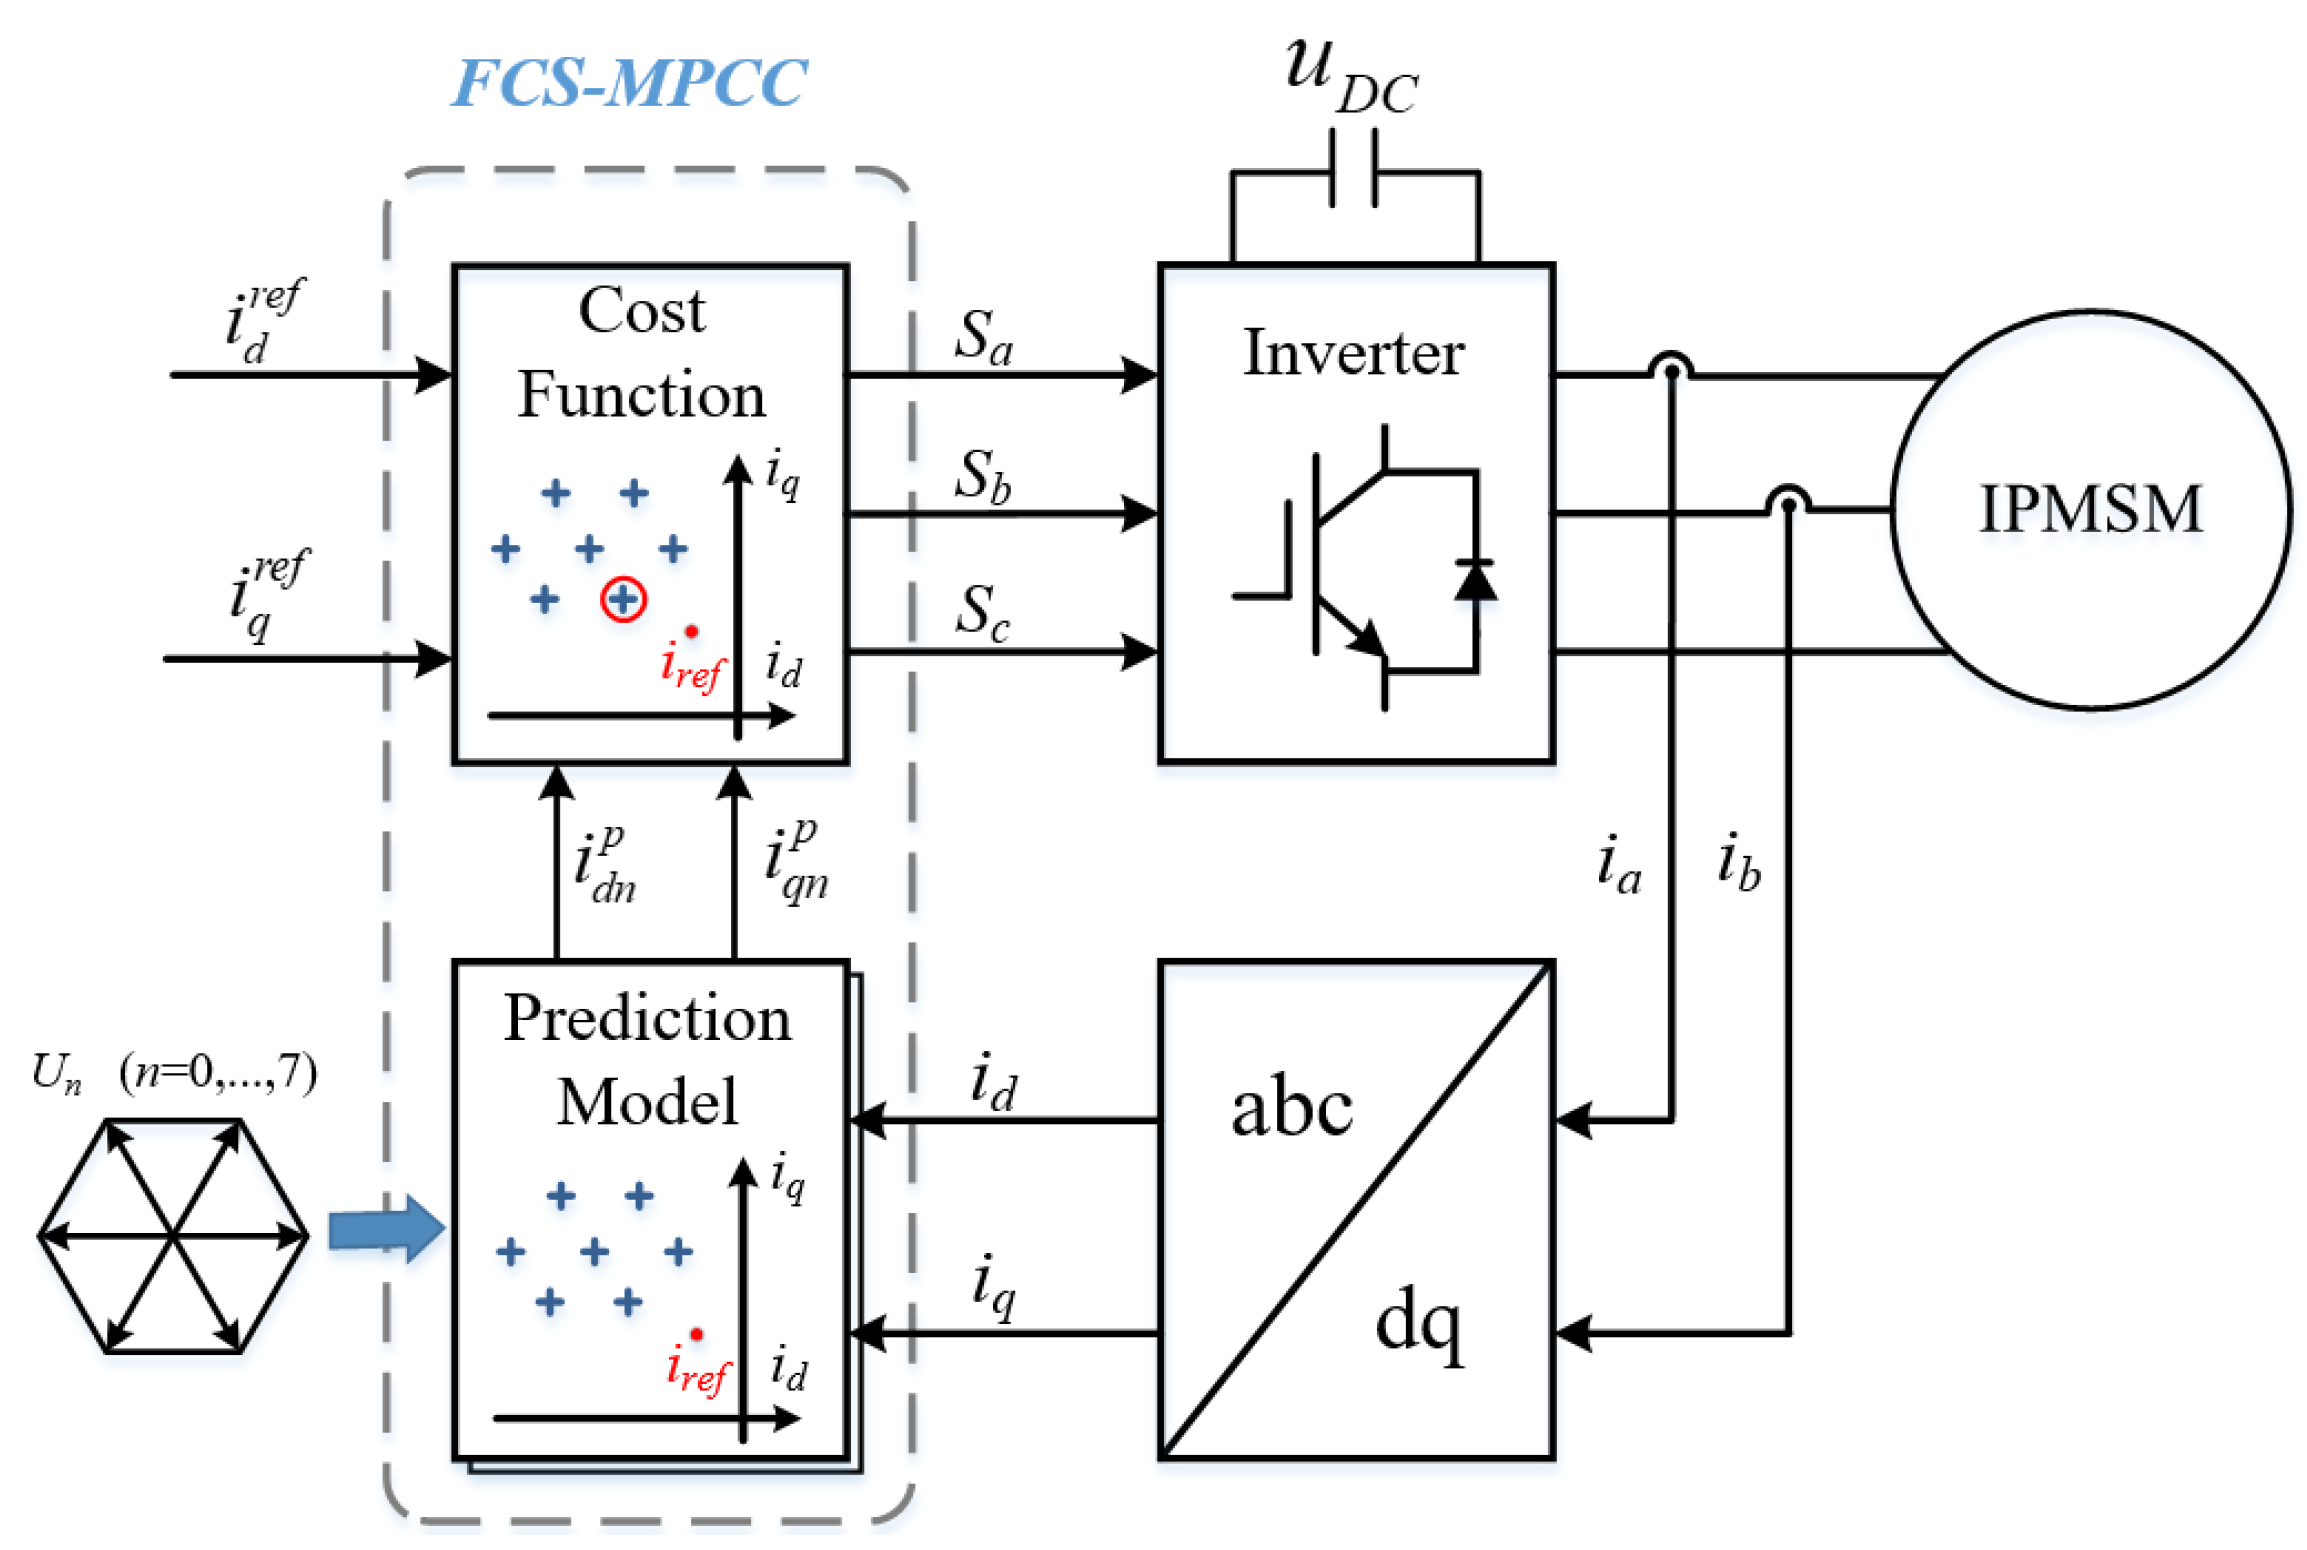
2. Basic FCS-MPCC Algorithm

2.1. IPMSM Model

The continuous state equation of an IPMSM in d-q reference frame is expressed as [9]:
[ p i d p i q ] = [ R s L d ω e L q L d ω e L d L q R s L q ] [ i d i q ] + [ 1 L d 0 0 1 L q ] [ u d u q ] + [ 0 ω e ψ f L q ]
where
ud, uqd- and q-axis voltage components
id, iqd- and q-axis current components
Rsstator resistance
Ld, Lqd- and q-axis inductance components
ψfflux linkage of permanent magnet
ωeelectrical angular speed
pdifferential operator
Due to its implementation in microprocessors, such as digital signal processor (DSP), the continuous state Equation (1) has to be discretized for FCS-MPCC algorithm. The forward Euler approximation method is commonly utilized to obtain the discrete motor prediction model as [9]:
[ i d P ( k + 1 ) i q P ( k + 1 ) ] = [ 1 T s R s L d T s ω e L q L d T s ω e L d L q 1 T s R s L q ] [ i d ( k ) i q ( k ) ] + [ T s L d 0 0 T s L q ] [ u d ( k ) u q ( k ) ] + [ 0 T s ω e ψ f L q ]
where the superscript P represents the prediction quantity, Ts is the control period, and X(k) (k = 1, 2, 3, …) is the value of X in kth control period kTs.

2.2. Control Delay Compensation

When the FCS-MPCC algorithm is executed on DSP, there is a control delay caused by computational burden, which can deteriorate the control performance. In Reference [28], the control delay is explained clearly, and a two-step prediction method, shown in Equation (3), is proposed to realize control delay compensation.
[ i d p ( k + 2 ) i q p ( k + 2 ) ] = [ 1 T s R s L d T s ω e L q L d T s ω e L d L q 1 T s R s L q ] [ i d p ( k + 1 ) i q p ( k + 1 ) ] + [ T s L d 0 0 T s L q ] [ u d ( k + 1 ) u q ( k + 1 ) ] + [ 0 T s ω e ψ f L q ]

2.3. Cost Function

The cost function is designed to evaluate the prediction results and select the optimal voltage vector. It is generally expressed by including the errors between prediction values of controlled variables and their reference values. There are several ways to calculate the errors, such as the absolute error, square of error, or integration of error [29]. Taking into account the tradeoff between simplicity and evaluation performance, the squared form is often utilized for FCS-MPCC, which is written as follow:
g = | i d r e f ( k + 2 ) i d p ( k + 2 ) | 2 + | i q r e f ( k + 2 ) i q p ( k + 2 ) | 2
where the superscript ref represents the reference quantity. It should be noted that the controlled variables are d- and q-axis currents, which have the same unit, magnitude order, and significance. Therefore, there is no need to add weighting factors in the cost function.
For a two-level, three-phase voltage-source inverter (VSI) driven motor system, there are eight possible switching states, which can produce eight voltage vectors—six active voltage vectors and two null voltage vectors. The future states of motor systems under these eight voltage vectors are predicted according to Equations (2) and (3), and the prediction results are then evaluated using the cost function given in Equation (4). The one that can minimize g is chosen as the optimal voltage vector, and the corresponding switching signals will drive the inverter in the next control interval. The basic FCS-MPCC control scheme for IPMSM is shown in Figure 1.

3. Prediction Error Analysis

The prediction error (PE) is an important index to be considered in MPC algorithms. It can reflect the accuracy of prediction model and further influence the control performance of motor systems. For FCS-MPCC, the prediction error can be defined as the difference between prediction values of d- and q-axis currents and their corresponding actual values, which is expressed as:
PE = i d q p ( k + 1 ) i d q ( k + 1 )
As mentioned in the Introduction, there are three main factors which influence the prediction error—discretization method, prediction stepsize, and parameter mismatch. In the following parts, these factors are separately analyzed for single-step prediction applications.

3.1. Discretization Method

There are various discretization methods to approximate the motor. In essence, the objective of these discretization methods is the same—to obtain higher similarity to the actual motor as well as to consider the implementation in practical applications. Among these methods, the Taylor series expansion can be regarded as a representative discretization method due to its flexible expansion orders. There can be a wide window for the observation of relationship between prediction error and discretization methods, varying from the simplest discretization to accurate discretization just by adjusting the discretization order.
The continuous state space equation in Equation (1) can be rewritten as:
p x ( t ) = A x ( t ) + B u ( t ) + D
where x = [id   iq]T, u = [ud   uq]T and the coefficient matrices are:
A = [ R s L d ω e L q L d ω e L d L q R s L q ]
B = [ 1 L d 0 0 1 L q ]
D = [ 0 ω e ψ f L q ] T
Then, the Taylor series expansion is applied to the differential terms of variables id and iq:
i d q ( k + 1 ) = i d q ( k ) + T s d i d q d t | t = k + T s 2 2 ! d 2 i d q d t 2 | t = k + = i d q ( k ) + i = 1 T s i i ! d i i d q d t i | t = k
and zero-order-hold inputs are considered during the control interval Ts, so the discrete model of Equation (6) can be obtained as:
x ( k + 1 ) = A D x ( k ) + ( A D I ) A 1 [ B u ( k ) + D ]
where the state transition matrix AD is given as:
A D = I + T s A + + T s N A N N ! + = i = 0 T s i A i i !
and the input matrix is (ADI)A−1B. Equation (11) can be regarded as the actual motor as well as an ideal prediction model. Taking account of implementation requirements, it can be simplified by truncating Taylor series expansion by N shown as:
x P ( k + 1 ) = A D _ N x ( k ) + ( A D _ N I ) A 1 [ B u ( k ) + D ]
where
A D _ N = I + T s A + + T s N A N N ! = i = 0 N T s i A i i !
It should be noted that Equation (13) becomes Equation (2) when N = 1, which means that the forward Euler approximation is a specific case of Taylor series expansion approximation. Assuming that there are no deviations of motor parameters, the prediction error can be derived from Equations (11) and (13) as:
PE = x P ( k + 1 ) x ( k + 1 ) T s N + 1 A N + 1 ( N + 1 ) ! x ( k ) T s N + 1 A N B ( N + 1 ) ! u ( k ) T s N + 1 A N D ( N + 1 ) !
It can be found from Equation (15) that the prediction errors of stator currents are related to ωe(k), ud(k), uq(k), id(k), and iq(k), which may vary in different control periods. However, for every specific control period when these variables are determined, it can be clearly seen that the three terms in Equation (15) are proportional to N + 1 power of control interval Ts, which is much less than 1. Therefore, the prediction error will decrease when the Taylor series expansion is truncated by high orders. However, it is noticeable that the complexity of prediction model in Equation (13) will increase with an increase in N. Therefore, it is necessary to select a proper discretization order to balance the prediction error and calculation burden for specific applications.

3.2. Prediction Stepsize

In general, the prediction stepsize of most single-step MPC methods is fixed as the control period and sampling time Ts. It can be seen from Equation (15) that the prediction error is closely related to Ts. If the prediction stepsize is short enough, the prediction error can be reduced to a very small value, and the increased prediction error caused by low discretization order can even be compensated. Therefore, the actual motor can be simulated using a model obtained by forward Euler approximation with infinitely small stepsize.
From the perspective of MPC algorithm, one remarkable feature, as well as an advantage, is its receding horizon optimization. Specifically, FCS-MPCC determines the optimal voltage vector based on the current values at present sampling instant, and the objective of this optimal voltage vector is aimed at finally eliminating the tracking error in the same control period. Therefore, the MPC algorithm seeks an optimal solution in single-step horizon or a multi-step prediction horizon. If the prediction stepsize is too large, the prediction error will increase, and the optimization for multi-step prediction horizon may be hard to guarantee.
However, considering practical applications, the length of prediction stepsize is limited by several factors, such as the power level of applications, hardware limitations, switching frequency, control performance requirements, stability boundary, execution time of MPC algorithm, and so on. Therefore, the prediction stepsize—control period and sampling time—cannot be too long or too short, which is a critical factor to choose properly.

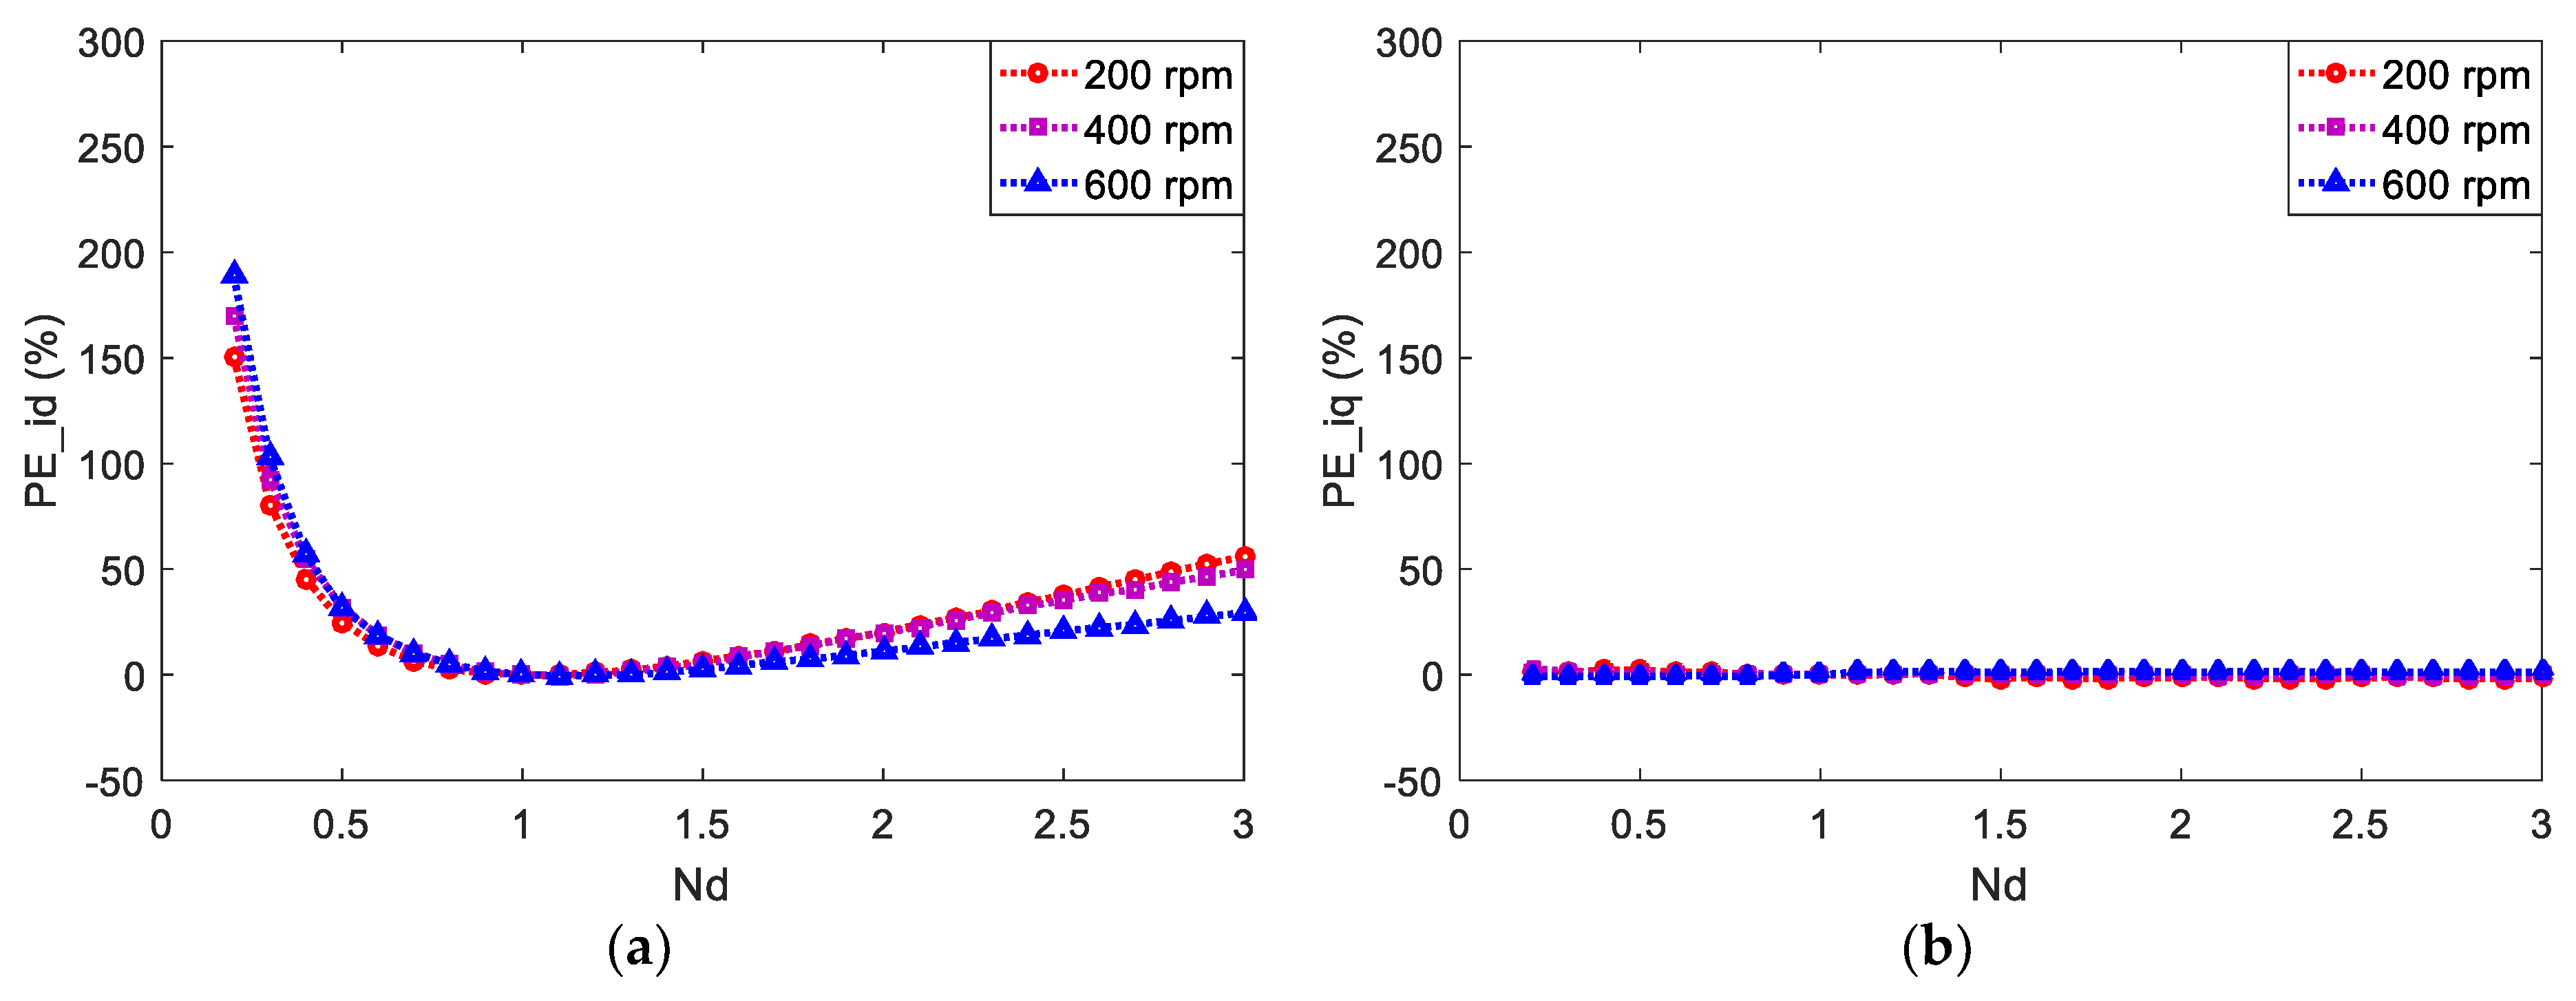
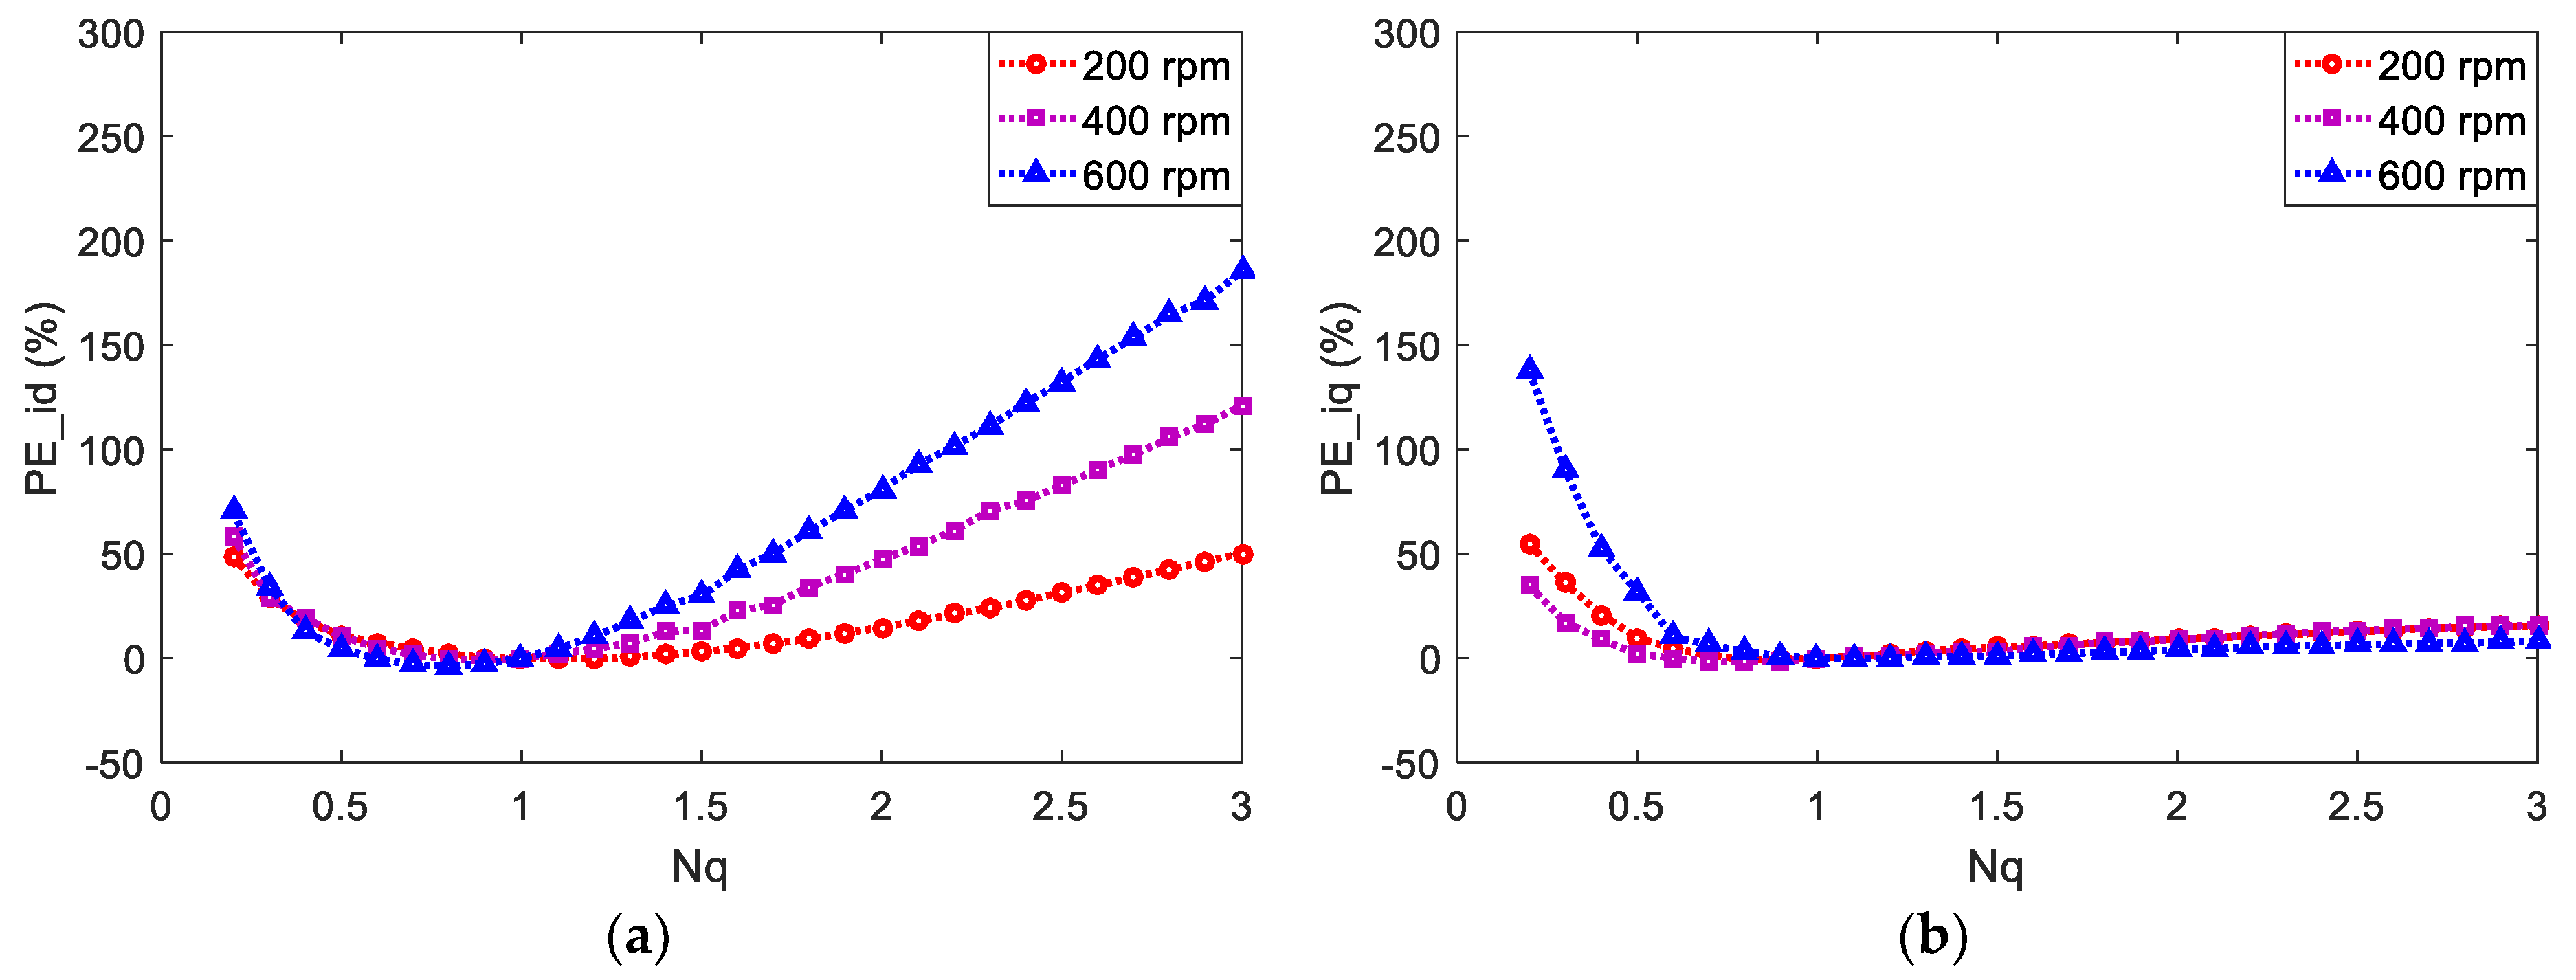
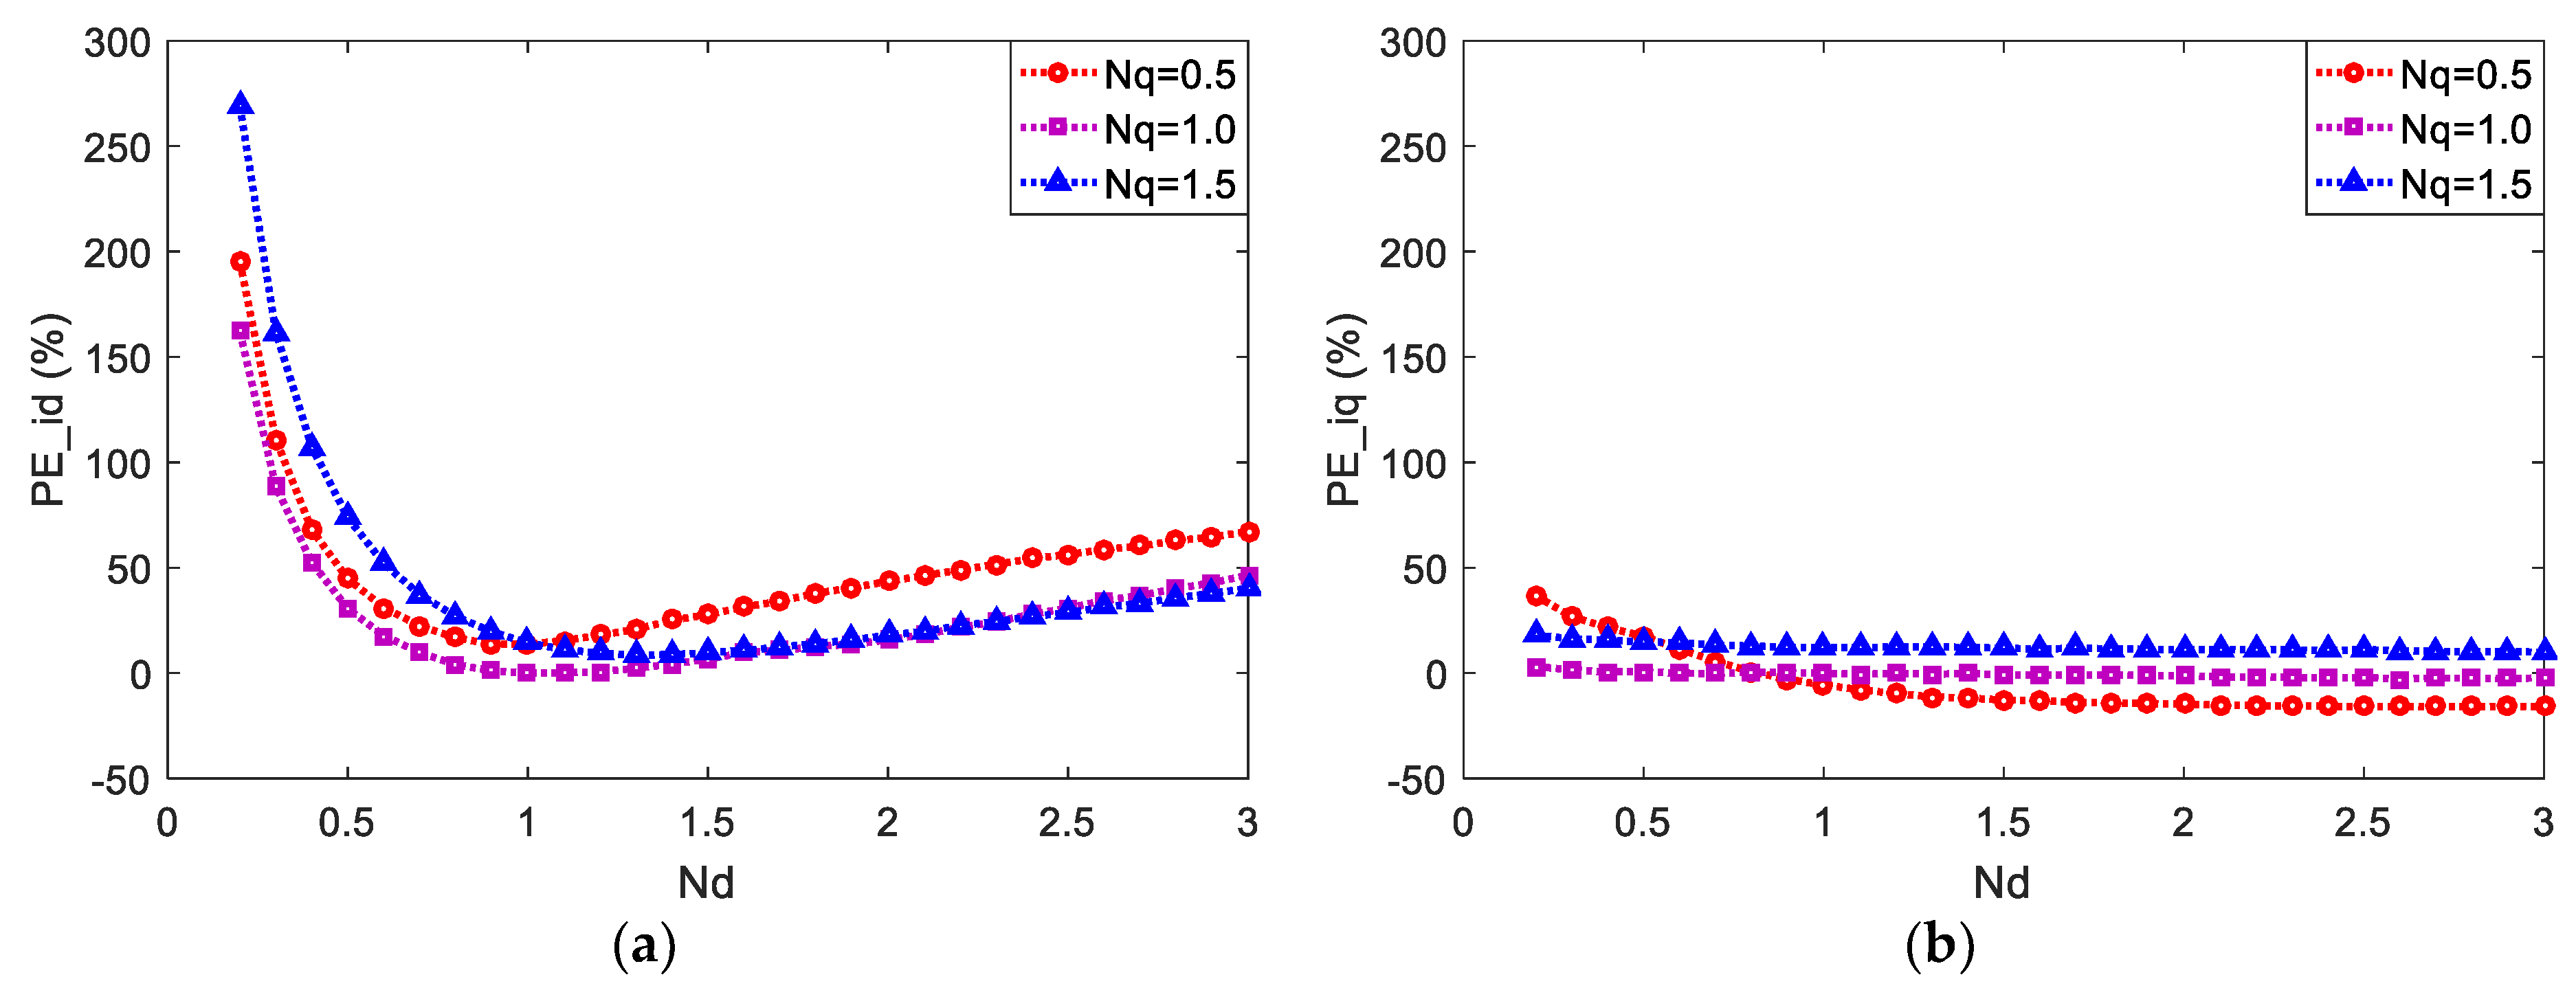
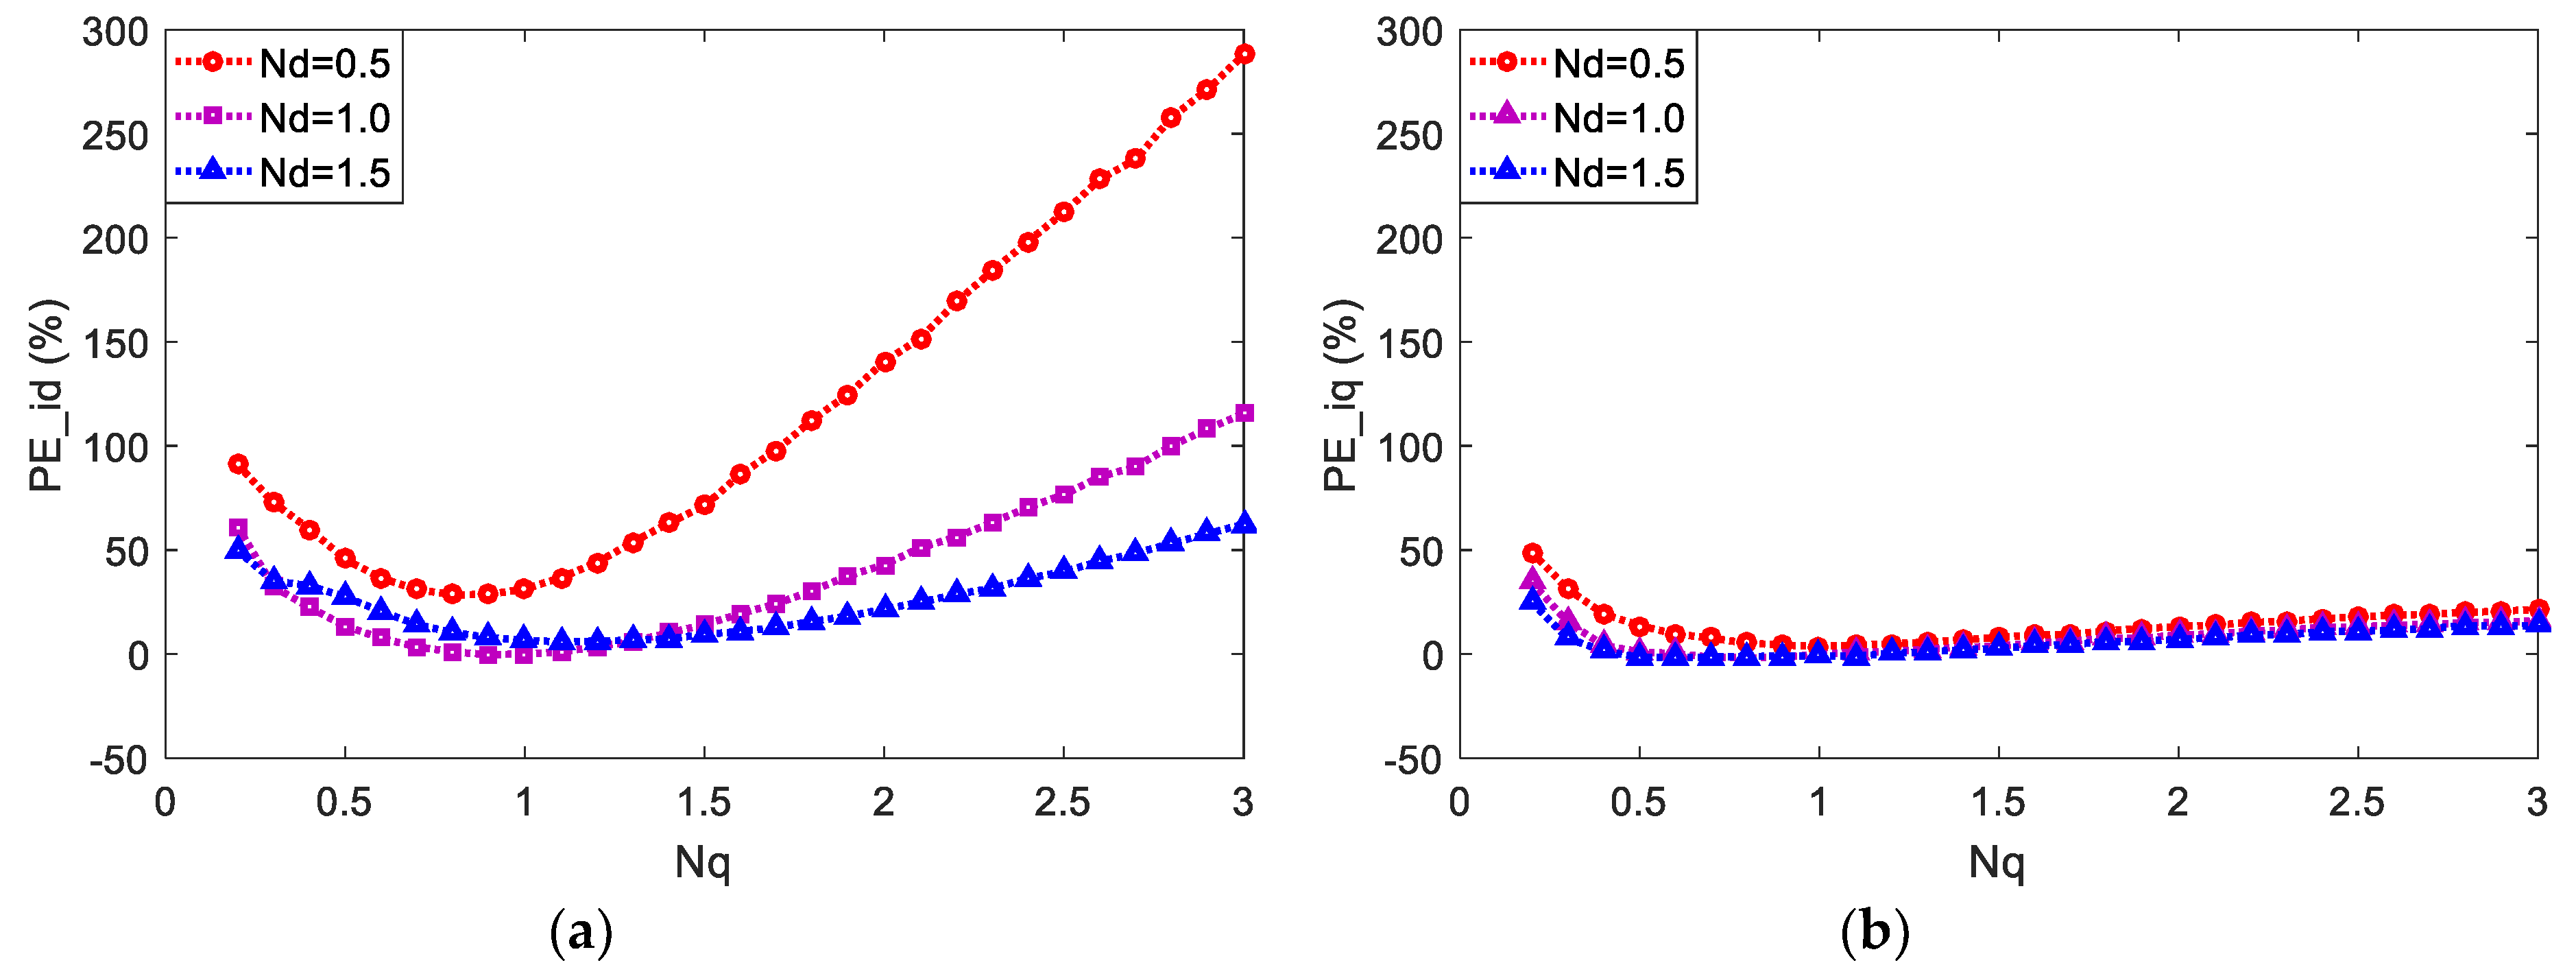
3.3. Parameter Mismatch

It can be seen from Equation (13) that the motor prediction model involves several parameters including Rs, ψf, Ld, and Lq. However, the parameters in the prediction model may not be the same as the practical motor parameters because they may not be measured accurately and the practical parameters also change during the operation. Such parameter mismatch can lead to prediction errors and further bring torque ripples and even instability for the motor system.
Among the parameters in prediction model, Ld and Lq are the two most commonly considered parameters that affect the model accuracy. There are two reasons for the above result. Firstly, the stator resistance and permanent magnet flux linkage are mainly influenced by the temperature within motor, while d- and q-axis inductances change due to magnetic saturation that is related to d- and q-axis currents. The temperature within motor changes much slower than the stator current, so the stator inductances are easier to change and their changing periods are shorter than that of stator resistance and permanent magnet flux linkage. Secondly, the mismatch of stator inductances can yield greater influence on prediction accuracy and motor control performance compared with other parameters, which has been presented in several works [27,30,31]. Therefore, this paper mainly focuses on the prediction error analysis caused by stator inductances mismatch.
In order to facilitate the theoretical analysis of prediction error caused by parametric mismatch, the prediction model obtained through forward Euler approximation shown in Equation (2) is employed, and the practical motor is also simplified as Equation (2) to conduct the following mathematical analysis. The stator inductances in prediction model are defined as Ldp and Lqp, while the stator inductances of practical motor are defined as Ldn and Lqn. The relationship between the above two sets of stator inductances can be expressed as Ldp = Nd·Ldn, Lqp = Nq·Lqn, where Nd and Nq are coefficients. The prediction values and actual values of stator currents can then be expressed as:
i d P ( k + 1 ) = i d ( k ) T s R s L d p i d ( k ) + T s ω e L q p L d p i q ( k ) + T s L d p u d ( k )
i q P ( k + 1 ) = i q ( k ) T s R s L q p i q ( k ) T s ω e L d p L q p i d ( k ) + T s L q p u q ( k ) T s ω e ψ f L q p
and
i d ( k + 1 ) = i d ( k ) T s R s L d n i d ( k ) + T s ω e L q n L d n i q ( k ) + T s L d n u d ( k )
i q ( k + 1 ) = i q ( k ) T s R s L q n i q ( k ) T s ω e L d n L q n i d ( k ) + T s L q n u q ( k )   T s ω e ψ f L q n
From Equations (16)–(19), the prediction errors of d- and q-axis currents, namely PE_id and PE_iq, can be calculated as:
PE _ i d = i d P ( k + 1 ) i d ( k + 1 ) = T s L d n ( 1 1 N d ) [ ( R s i d ( k ) ω e L q n i q ( k ) ) u d ( k ) ] + T s L d n N q 1 N d ω e L q n i q ( k )
PE _ i q = i q P ( k + 1 ) i q ( k + 1 ) = T s L q n ( 1 1 N q ) [ ( R s i q ( k ) + ω e L d n i d ( k ) + ω e ψ f ) u q ( k ) ] + T s L q n 1 N d N q ω e L d n i d ( k )
The analysis of ωe, ud(k), uq(k), id(k), and iq(k) in Equations (20) and (21) is the same as that in Section 3.1. The prediction errors are affected only by stator inductance mismatches. Based on Equations (20) and (21), the prediction error caused by the inaccuracy of d- and q-axis stator inductances can be further investigated separately. Assuming that the parameter deviation only exists on Ld, i.e., Ldp = Nd·Ldn and Lqp = Lqn, Equations (20) and (21) can be rewritten as:
PE _ i d = T s L d n ( 1 1 N d ) [ ( R s i d ( k ) ω e L q n i q ( k ) ) u d ( k ) ]
PE _ i q = ( 1 N d ) T s ω e L d n L q n i d ( k )
As mentioned before, the speed, current, and voltage components may vary during operation, so the signs of related terms in Equations (22) and (23) are hard to be determined. Therefore, the absolute value of prediction error is evaluated instead. It can be seen from Equation (22) that if there is no mismatch of Ld, the prediction error of id is zero. If Nd changes from 1 to a greater or smaller value, the absolute value of PE_id will increase from 0. It is worth noting that the same variation of Ld for both directions can lead to a different influence on PE_id. Ignoring the stability issue, if N d + , 1 - 1 / N d 1 ; if N d 0 , 1 - 1 / N d , which means that negative deviation of Ld leads to greater prediction error of id than the positive deviation. As for the prediction error of iq in Equation (23), it is proportional to the parameter deviation of Ld.
Considering the mismatch of Lq, i.e., Lqp = Nq·Lqn and Ldp = Ldn, the prediction errors can be obtained from Equations (20) and (21) as:
PE _ i d = ( N q 1 ) T s ω e L q n L d n i q ( k )
PE _ i q = T s L q n ( 1 1 N q ) [ ( R s i q ( k ) + ω e L d n i d ( k ) + ω e ψ f ) u q ( k ) ]
It can be found that similar conclusions can be obtained from Equations (24) and (25) due to their similar formulas to Equations (22) and (23).
When both mismatches of Ld and Lq are taken into account, the variation of prediction error becomes more complicated. However, considering the dominant role of d- and q-axis voltage values for prediction error Equations (20) and (21), it can still be seen that the prediction error of id tends to be affected by the mismatch of Ld, especially by negative deviations, and the same relationship also applies to the prediction error of iq and mismatch of Lq.

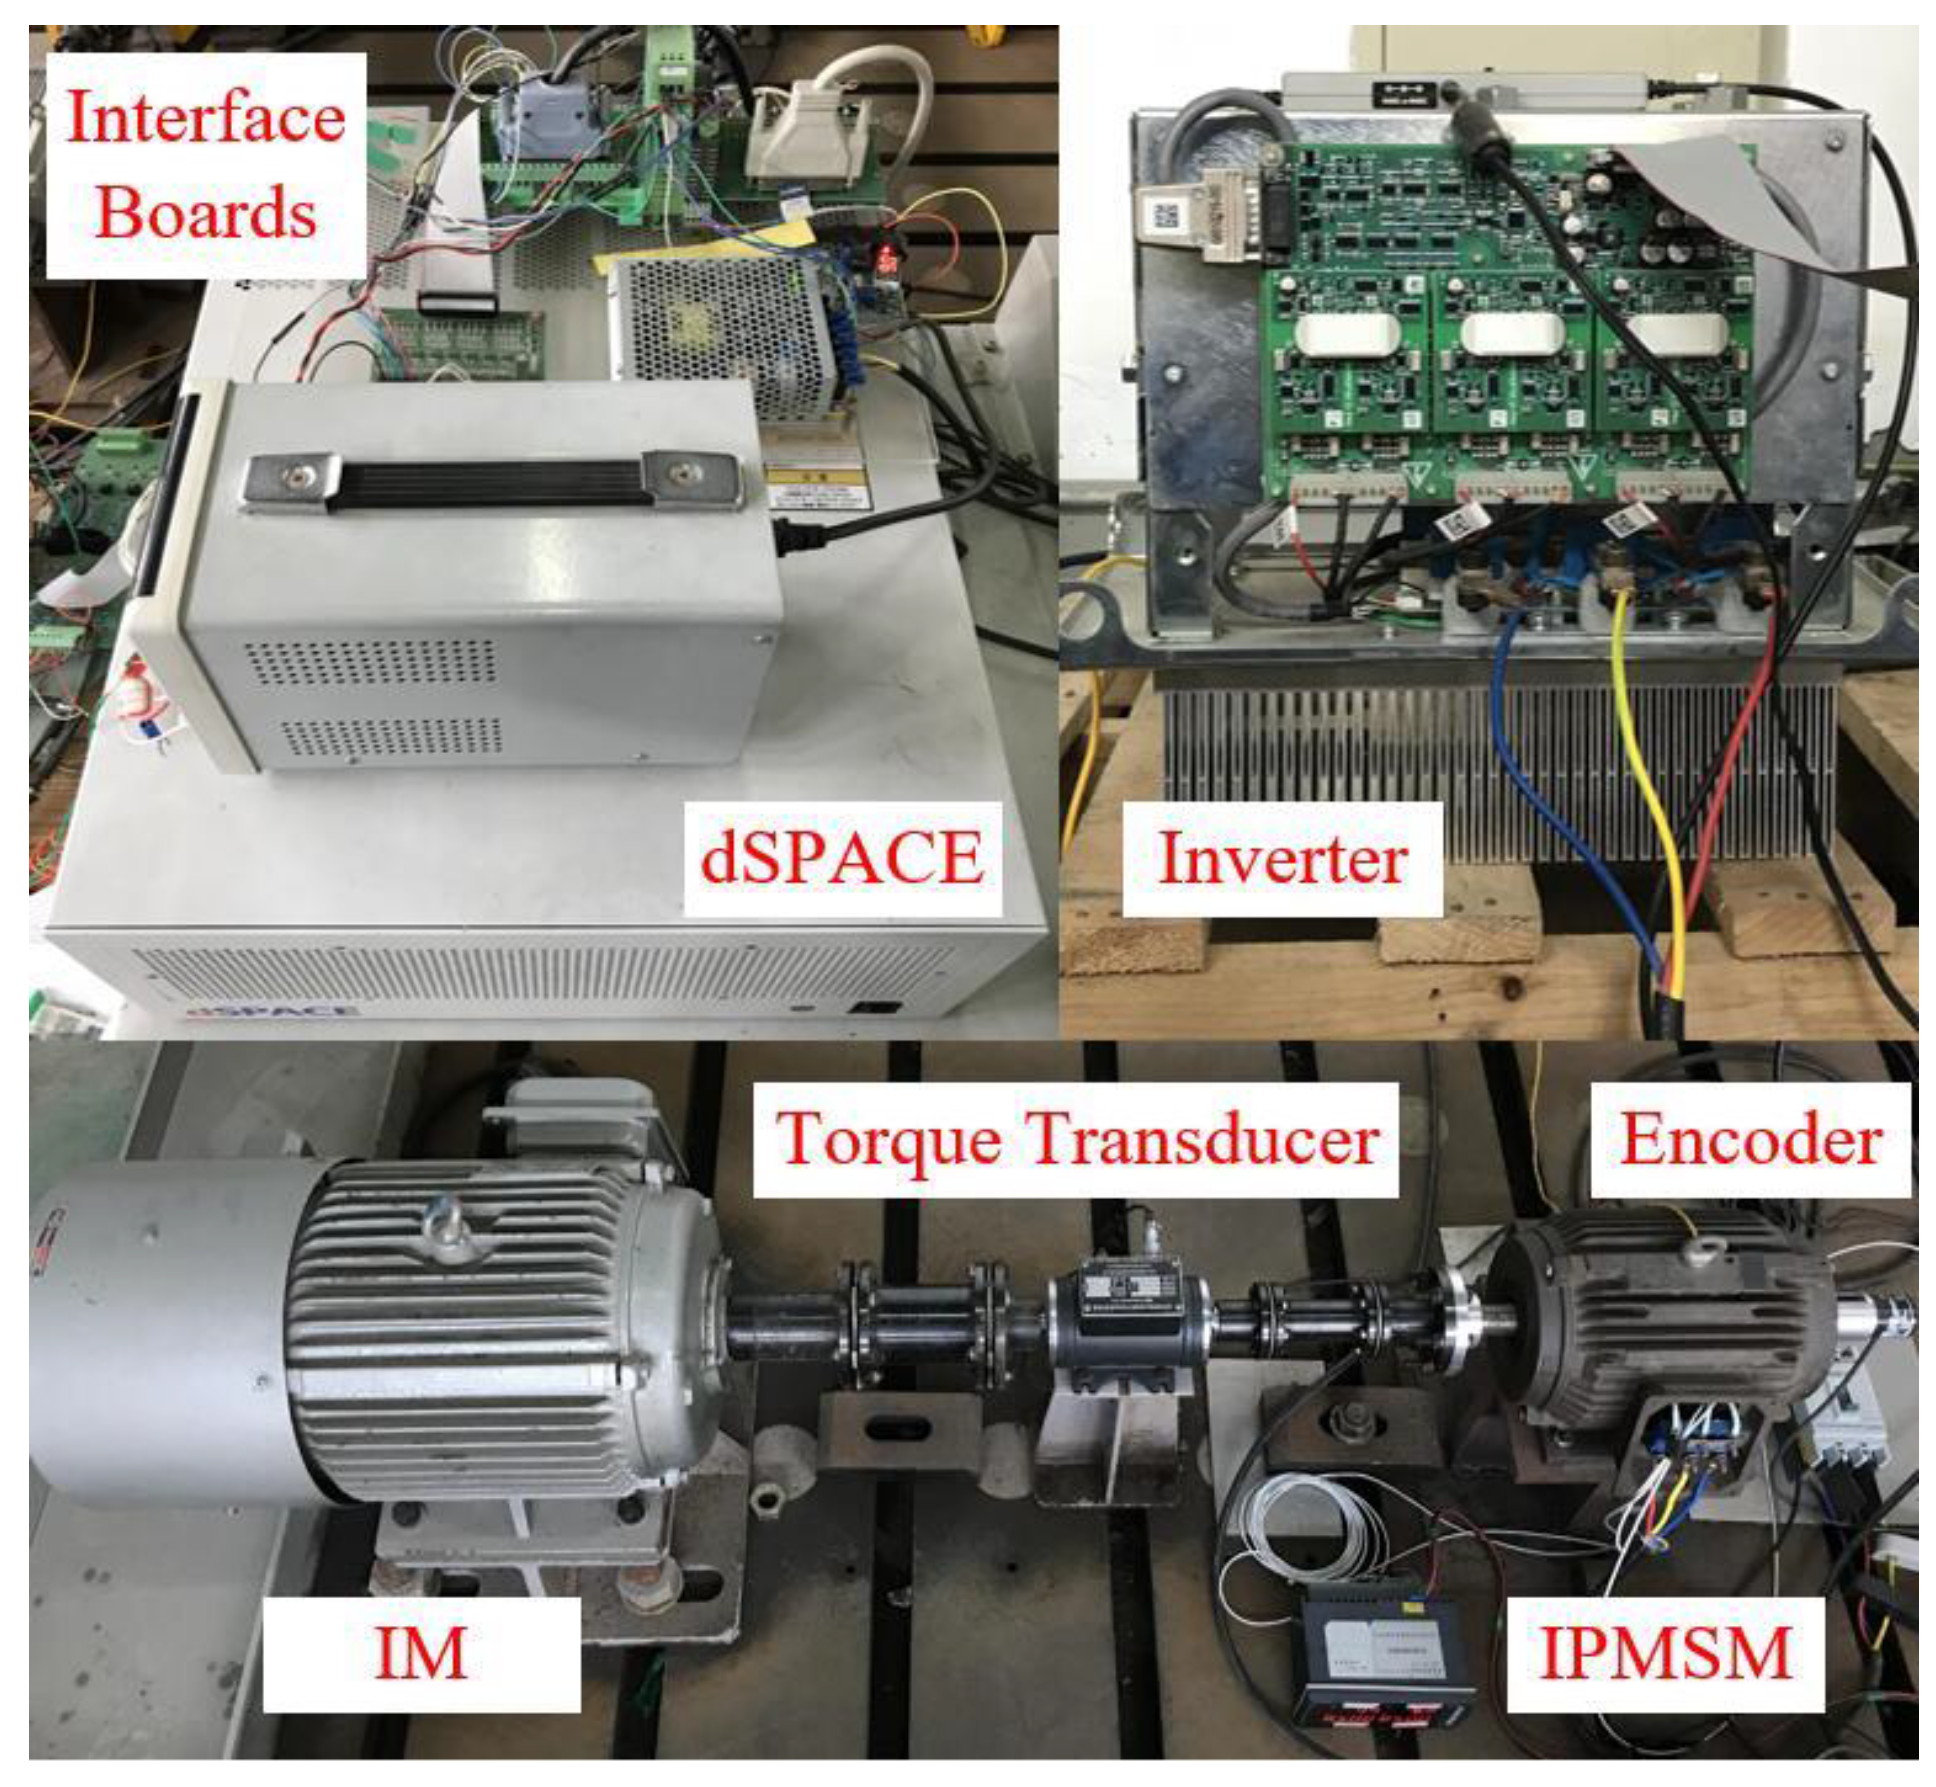
4. Experimental Results

In this section, experimental results are presented to verify the theoretical analysis about the three influencing factors to prediction error of FCS-MPCC algorithm. Figure 2 shows the experimental setup utilized in this work. The plant is a 2-kW IPMSM system (Weiheng Technology, Hangzhou, China) whose key parameters are listed in Table 1. The load is an induction motor (IM), which can be controlled in both speed mode and torque mode. The power circuit includes a two-level, three-phase VSI with a DC-link voltage of 300 V. A dSPACE1005 platform (dSPACE GmbH, Paderborn, Germany) is employed for the execution of FCS-MPCC algorithm.
In experiments, it is not practical to evaluate the prediction error in only one or several control periods. In order to quantitatively examine the prediction error under different steady-state operating conditions, the root mean square (RMS) value of prediction error is calculated as [32]:
PE RMS = 1 N k = 1 N ( i x P ( k ) i x ( k ) ) 2 ,   x { d ,   q }
where N is the number of control periods during 30 s. Based on this, the relative prediction error ΔPE is further defined as follows to facilitate the quantitative analysis and comparison:
Δ PE = ( PE RMS PE base ) / PE base
where PEbase is the RMS prediction error under basic reference setting of three influencing factors—prediction model obtained by one-order Taylor series expansion, prediction stepsize of 100 μs, and actual values of Ld and Lq shown in Table 1. All experiments conducted in the following three sections are based on the control scheme shown in Figure 1, and the reference values of id and iq are 0 A and 4 A, respectively. It should be noted that the values of d- and q-axis inductances in Table 1 are measured for the operating condition with id = 0 A and iq = 4 A [33], which can be regarded as actual inductance values, i.e., Ldn and Lqn.

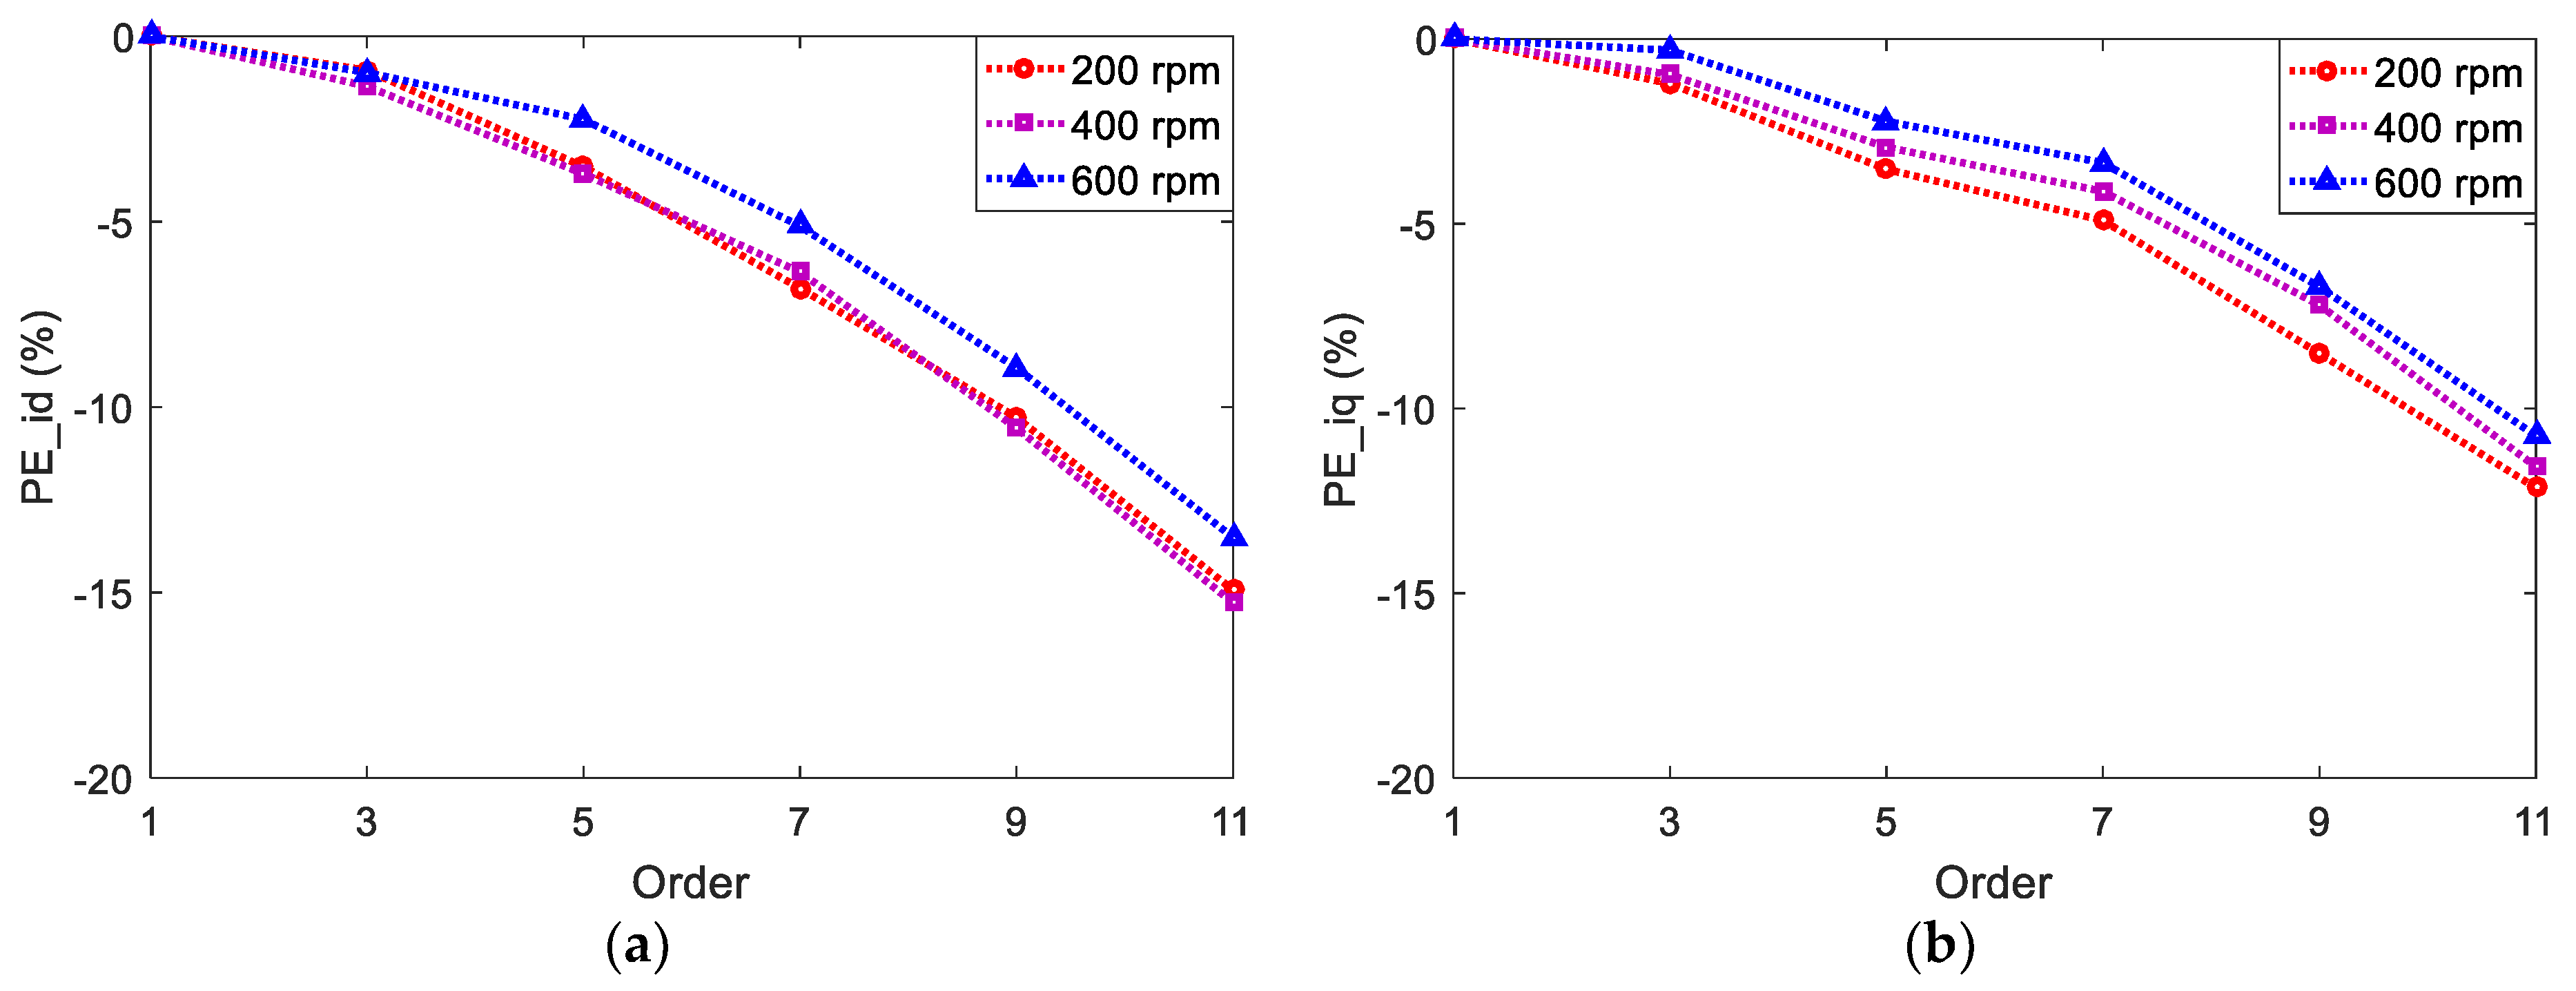
4.1. Discretization Order

According to Equations (13) and (14), the Taylor series expansion is truncated by different discretization orders to obtain prediction models, i.e., N = 1, 3, 5, 7, 9, 11. The sampling time is 100 μs and the inductance values in prediction model are the same as that in Table 1. Different speed conditions—200, 400, and 600 rpm—are tested. As defined above, the corresponding RMS prediction errors under one-order discretization are chosen as PEbase, which are listed in Table 2 and are also the same as the ones in Section 4.2 and Section 4.3. The relative prediction errors of id and iq for different prediction models are shown in Figure 3. It is noticeable that both prediction errors of id and iq decrease with an increase in discretization orders, which holds true for different speeds. The results follow the theoretical analysis in Section 3.1. Under different speeds, the differences between RMS prediction errors of id or iq under one-order case and eleven-order case are less than 0.02 A, and the corresponding differences of relative prediction errors are less than 15%, which reveals the weak influence of discretization order on current prediction errors for this low-power setup. However, an increase in discretization order will make the algorithm more complex and lead to higher computation burden.

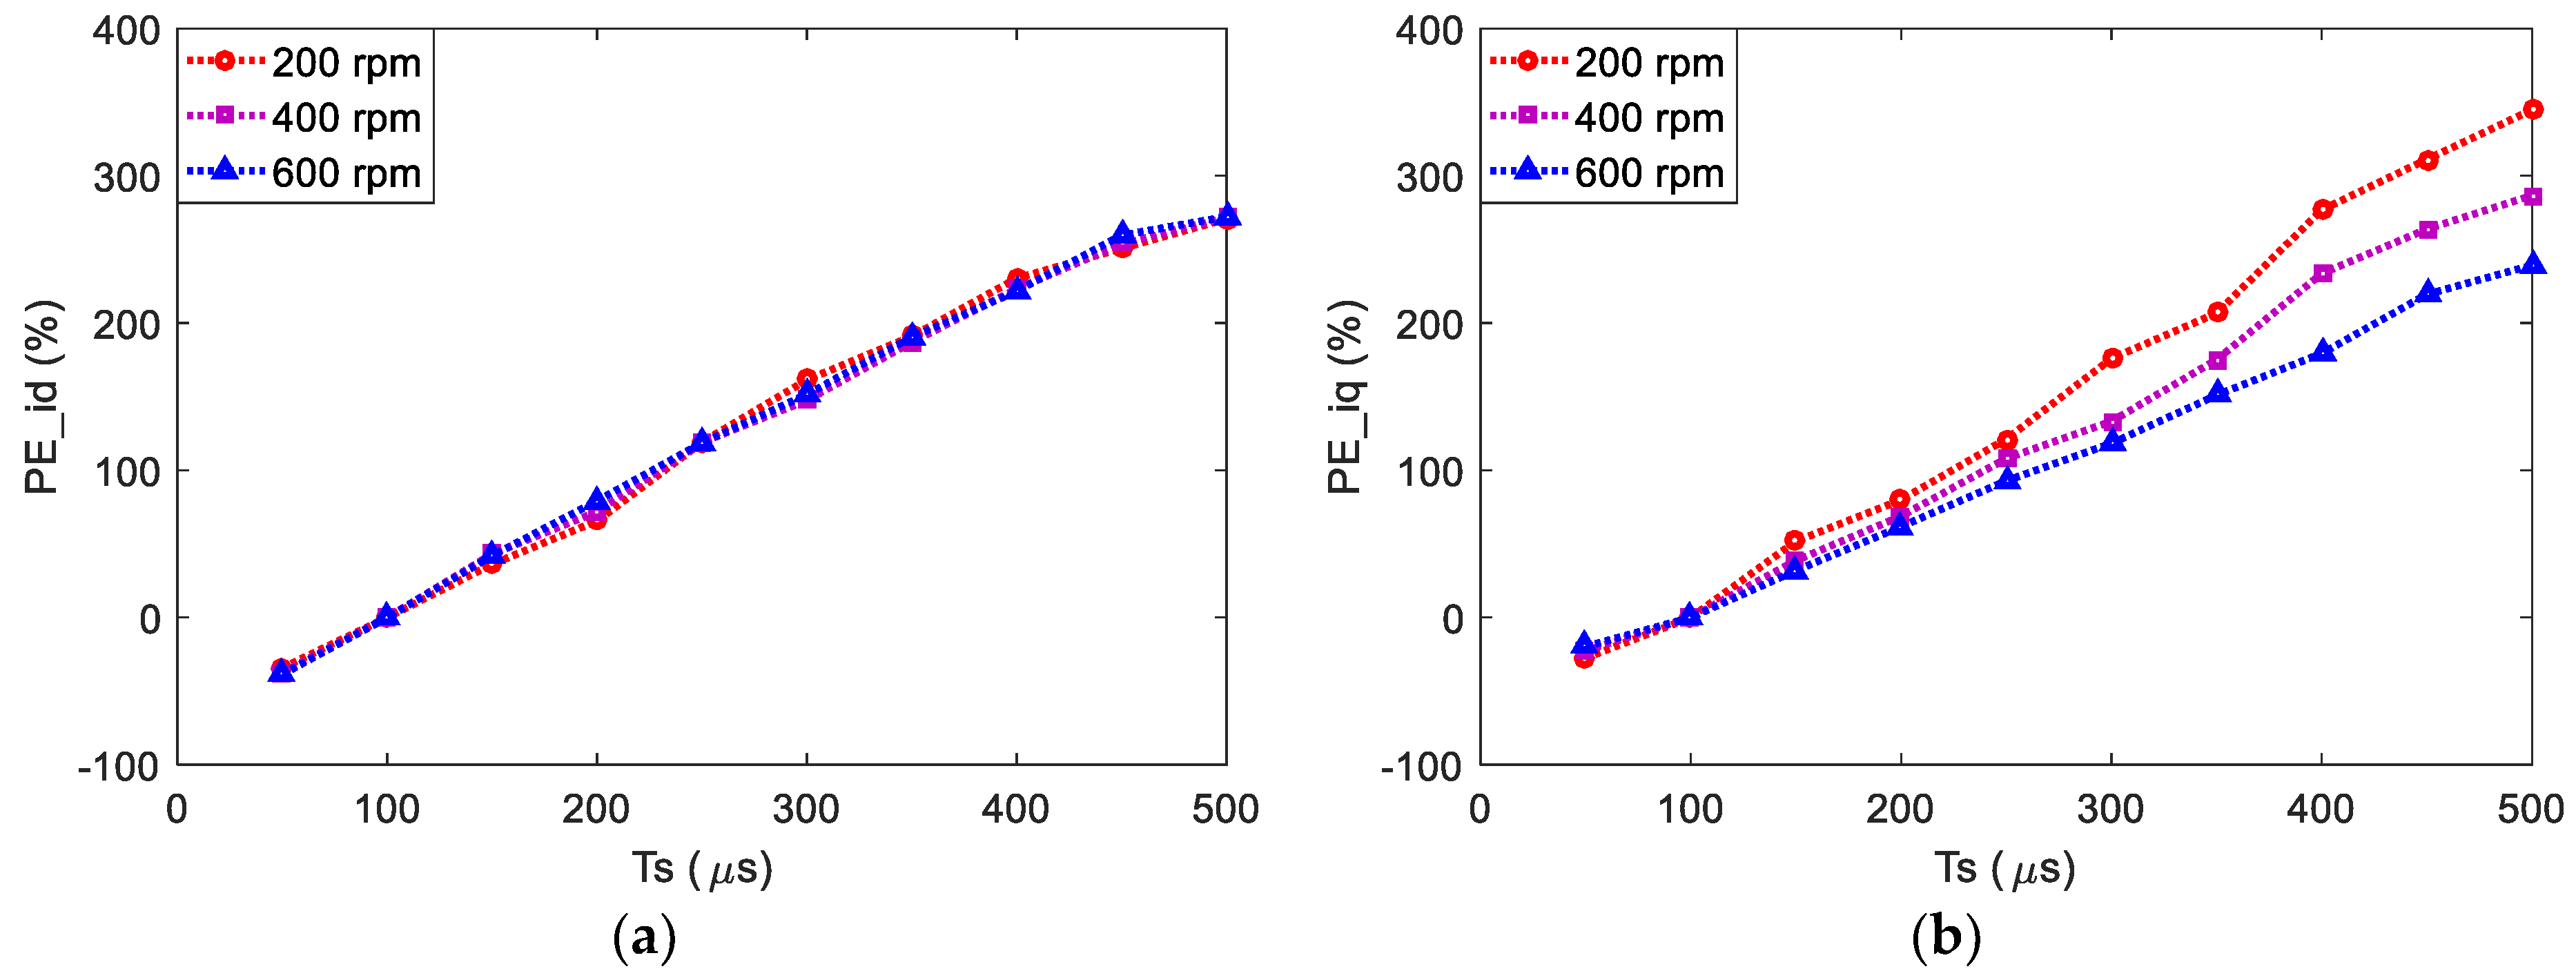
4.2. Prediction Stepsize

In this section, the prediction model is obtained by one-order Taylor series expansion, and the inductance values in prediction model are the same as that in Table 1. Different speed conditions—200, 400, and 600 rpm—are tested. Figure 4 shows the relative prediction errors of id and iq when different prediction stepsizes—control periods and sampling time—are adopted in FCS-MPCC algorithm, i.e., from 50 μs to 500 μs by the step of 50 μs. The RMS prediction errors under prediction stepsize of 100 μs are chosen as PEbase for different speeds, as shown in Table 2. As expected, longer prediction stepsize yields greater prediction errors for both id and iq. A quite large prediction stepsize can seriously deteriorate the control performance of motor system and even lead to instability, which has also been tested in experiments. By comparing the prediction errors in Figure 3 and Figure 4, it can be seen that the variation of prediction stepsize has a more obvious effect on the prediction error compared with that caused by varying discretization order; therefore, it is necessary to choose a suitable prediction stepsize.

4.3. Stator Inductances Mismatch

In this section, the prediction model is obtained by one-order Taylor series expansion, and the prediction stepsize is 100 μs. Neglecting the influence of stator resistance and permanent magnet flux linkage, the influences of d- and q-axis inductances mismatches on prediction error are investigated separately. Firstly, the influence of d-axis inductance mismatches on prediction error is studied. The coefficient Nd defined in Section 3.3 is changed from 0.2 to 3 by the step of 0.1, and the q-axis inductance Lqp in prediction model is kept as the nominal value Lqn. It should be noted that the variation range of Ld is determined by just considering the practical stable operation according to experimental results.
The relative prediction errors for Ld mismatch under different speeds—200, 400, and 600 rpm—are shown in Figure 5. The RMS prediction errors at Nd = 1 and Nd = 1 for different speeds are chosen as PEbase, which are shown in Table 2. For the prediction error of id in Figure 5a, it can be seen that the curves are concave and asymmetric for different speeds, and the minimum error values are obtained when Nd is about 1. When Nd is smaller than 1, the effect on prediction error is greater than that when Nd is greater than 1, referring to the same variation of Nd. These experimental variation trends are consistent with the theoretical analysis. For the q-axis current, the prediction error varies in a quite narrow range. The differences between maximum and minimum RMS prediction errors are 0.01, 0.008, and 0.007 A for 200, 400, and 600 rpm, respectively. This result can be explained by Equation (23) due to the fact that id is close to zero.
Similar experiments for the case of Lq mismatch are also conducted, and the relative prediction errors are presented in Figure 6. The same PEbase values as those in Figure 5 are chosen. The curves are all concave but the locations of minimum prediction errors of id and iq are different. For id, the minimum prediction errors are obtained when Nq is 1.1, 0.9, and 0.8 for 200, 400, and 600 rpm, respectively, and the corresponding values are −0.4%, −1%, and −2.4%. The minimum prediction errors of iq are obtained when Nq is 0.8, 0.8, and 1.1 for 200, 400, and 600 rpm, respectively, and the corresponding values are −0.8%, −1.8%, and −0.3%. From the perspective of minimum prediction error points, the prediction error curves of id are roughly symmetric, while those of iq are obviously asymmetric, which essentially follows the theoretical analysis and shows the stronger influence of negative deviation of Lq on prediction error of iq. From Figure 5 and Figure 6, the separate deviations of Ld and Lq can yield different effects on the prediction errors of id and iq with respect to the magnitude and its change rate.
It should be noted that for the analysis of Equations (20)–(25), if there are no mismatches of Ld and Lq, i.e., Nd = 1 and Nq = 1, the prediction errors of id and iq are the minimum ones, which is actually an ideal condition. The prediction errors under this condition may not be the minimum ones in practical experiments, mainly due to two aspects. Firstly, for specific operating condition, it is challenging to obtain the accurate stator inductances necessarily set in prediction model due to several factors, such as nonlinearity of inverter and measurement errors of practical currents, speed, and DC voltage. Besides, even if the stator inductances are accurately measured, prediction errors still exist due to the influence of discretization order and prediction stepsize, and they may be compensated by the ones resulting from inductance mismatches. Although the minimum prediction errors may not be obtained at Nd = 1 and Nq = 1, they are located near this point as mentioned above. At the same time, although corresponding relative prediction errors are negative, they are very close to zero, which shows that the compensation effect is not obvious. From the whole range of inductance variation, the experimental results shown in figures essentially follow the theoretical analysis results. Therefore, the influence of above aspects can be regarded in an acceptable degree.
Additionally, the cases in which both Nd and Nq change are further tested under the speed of 400 rpm, and the corresponding PEbase values can be seen in Table 2. The relative prediction errors of id and iq are exhibited in Figure 7 and Figure 8. The variation trends of PE_id and PE_iq are similar to that shown in Figure 5 and Figure 6. It can be seen that the deviations of Ld, especially negative ones, can influence the prediction error of id more obviously and that such relationship also exists between the deviation of Lq and the prediction error of iq, which also follows the theoretical analysis.
According to the above experimental results and the theoretical analysis in Section 3, two points need further explanation. Firstly, it should be noted that when the prediction stepsize utilized in experiments is smaller than 100 μs, such as 50 μs, the variation trends of prediction error are essentially the same as the above experimental results, except that the magnitudes are smaller. Considering that this paper mainly focuses on the prediction error observation instead of control performance improvement, the prediction stepsize is selected as 100 μs to show the prediction error variations. Besides, it also considers the computation burden when the conditions utilizing high discretization orders are tested.
Secondly, although the theoretical analysis of prediction error in Section 3 is conducted with respect to each control interval, while the experimental results of prediction error are obtained for a relatively long interval; in fact, the prediction errors can appear roughly in a periodical manner under steady-state operation. Therefore, an observation of a long steady-state operating interval is reasonable in experiments and the results are essentially consistent with the theoretical analysis.

5. Conclusions

In this paper, the prediction error of FCS-MPCC algorithm in IPMSM system is defined and then analytically investigated by separately considering three influencing factors—discretization method, prediction stepsize, and parameter mismatch. Specifically, the investigation of the first factor is focused on the discretization order of Taylor series expansion, and the investigation of the third factor mainly considers the direct and quadrature axis inductances mismatches. Experimental results of an IPMSM drive system have verified and complemented the theoretical analysis. The main conclusions are summarized below.
When the Taylor series expansion approximation method is utilized to obtain the discrete motor prediction model, higher discretization order can reduce the prediction errors of id and iq. However, referring to the discretization order in a limited range, the effect of reduction is a little slight, though higher discretization order can yield much more computation burden. Then, the prediction error is seriously influenced by the prediction stepsize, which is also equal to the control period and sampling time. Shorter prediction stepsize can obviously reduce prediction errors, but it poses high requirements for hardware performance at the same time because the control scheme has to be finished in a shorter period. The influence of stator inductance mismatch on the prediction errors of id and iq is relatively more complex. When there is only Ld mismatch in the prediction model, the influence on the prediction error of id is asymmetric, which means that a decrease in Ld in the prediction model can affect the prediction error of id more seriously. Such asymmetric influence also exists in the prediction error of iq when just considering Lq mismatch. The above conclusions for cases with only Ld or Lq mismatch also hold true for more general cases with both mismatches. Specifically, the prediction errors of id and iq tend to be affected by the deviations of Ld and Lq employed in prediction model, respectively, especially with smaller inductance values.
The derived prediction error formulas, theoretical analysis, and experimental results in this paper can be directly utilized for the evaluation and correction of prediction error for MPC strategies used in motor drive applications. Basically, the elimination of prediction error can be simply achieved by adding prediction error in the previous control period to the present period as shown in Reference [27]. The improvement of control performance can be seen but is still limited due to the fixed weighting coefficient [27]. The weighting coefficient should be automatically adjusted according to the operating conditions, adopted discretization method and prediction stepsize, and degree of parametric mismatch. In other words, the relationship between prediction error and influencing factors should be applied in some form for the future improvement of motor control performance.

Author Contributions

J.L. proposed the framework and conducted the mathematical analysis and experiments. X.H. and F.N. provided important comments and advice for the framework. C.Y. helped with the building of the setup and experiment implementation. The writing of this manuscript was mainly done by J.L., X.H., F.N., L.W., and Y.F. reviewed and polished the manuscript. All authors discussed the final manuscript and approved the submission.

Funding

This work is supported by the National Natural Science Foundation of China (51637009, U1434202 and 51707174), National Postdoctoral Program for Innovative Talents (BX201600132), China Postdoctoral Science Foundation (2018M632461), Natural Science Foundation of Tianjin (16JCQNJC04200), and Research Project of Science and Technology of Hebei Province (QN2016193).

Conflicts of Interest

The authors declare no conflict of interest.

Nomenclature

Abbreviations
CCS-MPCContinuous-control-set model predictive control
FCS-MPCFinite-control-set model predictive control
FCS-MPCCFinite-control-set model predictive current control
MPCModel predictive control
IMInduction motor
IPMSMInterior permanent magnet synchronous motor
PEPrediction error
PIProportional integral
PWMPulse width modulation
RMSRoot mean square
SPMSMSurface permanent magnet synchronous motor
VCVector control
VSIVoltage-source inverter
Variables and parameters
ud, uqd- and q-axis voltage components
id, iqd- and q-axis current components
RsStator resistance
Ld, Lqd- and q-axis inductance components
ψfFlux linkage of permanent magnet
ωeElectrical angular speed
pDifferential operator
TsPrediction stepsize/control period/sampling time
NDiscretization order
Ldn, LqnStator inductances of practical motor
Ldp, LqpStator inductances in prediction model
Nd, NqCoefficients between stator inductances in prediction model and of practical motor
PE_id, PE_iqPrediction errors of d- and q-axis currents
PERMSRMS value of prediction error
PEbaseRMS prediction error under basic reference setting of three influencing factors
ΔPERelative prediction error
Superscripts
PPrediction quantity
refReference quantity

References

  1. Li, H.; Gao, J.; Huang, S.; Fan, P. A Novel Optimal Current Trajectory Control Strategy of IPMSM Considering the Cross Saturation Effects. Energies 2017, 10, 1460. [Google Scholar] [CrossRef]
  2. Sul, S.K. Control of Electric Machine Drive Systems; Wiley: New York, NY, USA, 2011. [Google Scholar]
  3. Vazquez, S.; Rodríguez, J.; Rivera, M.; Franquelo, L.G.; Norambuena, M. Model Predictive Control for Power Converters and Drives: Advances and Trends. IEEE Trans. Ind. Electron. 2017, 64, 935–947. [Google Scholar] [CrossRef]
  4. Preindl, M.; Bolognani, S. Comparison of Direct and PWM Model Predictive Control for Power Electronic and Drive Systems. In Proceedings of the 2013 Twenty-Eighth Annual IEEE Applied Power Electronics Conference and Exposition, Long Beach, CA, USA, 17–21 March 2013. [Google Scholar]
  5. Singh, V.K.; Tripathi, R.N.; Hanamoto, T. HIL Co-Simulation of Finite Set-Model Predictive Control Using FPGA for a Three-Phase VSI System. Energies 2018, 11, 909. [Google Scholar] [CrossRef]
  6. Chapra, S.C.; Canale, R.P. Numerical Methods for Engineers, 6th ed.; McGraw-Hill: New York, NY, USA, 2010. [Google Scholar]
  7. Niu, F.; Wang, B.; Babel, A.S.; Li, K.; Strangas, E.G. Comparative Evaluation of Direct Torque Control Strategies for Permanent Magnet Synchronous Machines. IEEE Trans. Power. Electron. 2016, 31, 1408–1424. [Google Scholar] [CrossRef]
  8. Preindl, M.; Bolognani, S. Model Predictive Direct Torque Control with Finite Control Set for PMSM Drive Systems, Part 1: Maximum Torque Per Ampere Operation. IEEE Trans. Ind. Informat. 2013, 9, 1912–1921. [Google Scholar] [CrossRef]
  9. Chen, Z.; Qiu, J.; Jin, M. Adaptive finite-control-set model predictive current control for IPMSM drives with inductance variation. IET Electr. Power Appl. 2017, 11, 874–884. [Google Scholar] [CrossRef]
  10. Zhang, Y.; Xu, D.; Liu, J.; Gao, S.; Xu, W. Performance Improvement of Model-Predictive Current Control of Permanent Magnet Synchronous Motor Drives. IEEE Trans. Ind. Appl. 2017, 53, 3683–3695. [Google Scholar] [CrossRef]
  11. Vaclavek, P.; Blaha, P. PMSM Model Discretization for Model Predictive Control Algorithms. In Proceedings of the 2013 IEEE/SICE International Symposium on System Integration, Kobe, Japan, 15–17 December 2013. [Google Scholar]
  12. Silva, C.A.; Yuz, J.I. On Sampled-data Models for Model Predictive Control. In Proceedings of the 36th Annual Conference on IEEE Industrial Electronics Society, Glendale, AZ, USA, 7–10 November 2010. [Google Scholar]
  13. Kawamura, A.; Chuarayapratip, R.; Haneyoshi, T. Deadbeat Control of PWM Inverter with Modified Pulse Patterns for Uninterruptible Power Supply. IEEE Trans. Ind. Electron. 1988, 35, 295–300. [Google Scholar] [CrossRef]
  14. Damiano, A.; Gatto, G.; Marongiu, I.; Perfetto, A.; Serpi, A. Operating Constraints Management of a Surface-Mounted PM Synchronous Machine by Means of an FPGA-Based Model Predictive Control Algorithm. IEEE Trans. Ind. Informat. 2014, 10, 243–255. [Google Scholar] [CrossRef]
  15. Rodríguez, J.; Pontt, J.; Silva, C.A.; Correa, P.; Lezana, P.; Cortés, P.; Ammann, U. Predictive Current Control of a Voltage Source Inverter. IEEE Trans. Ind. Electron. 2007, 54, 495–503. [Google Scholar] [CrossRef]
  16. Joshi, B.M.; Chandorkar, M.C. Time Discretization Issues in Induction Machine Model Solving for Real-time Applications. In Proceedings of the 2011 IEEE International Electric Machines & Drives Conference, Niagara Falls, ON, Canada, 15–18 May 2011. [Google Scholar]
  17. Diao, L.; Sun, D.; Dong, K.; Zhao, L.; Liu, Z. Optimized Design of Discrete Traction Induction Motor Model at Low-Switching Frequency. IEEE Trans. Power Electron. 2013, 28, 4803–4810. [Google Scholar] [CrossRef]
  18. Nalakath, S.; Preindl, M.; Emadi, A. Online Multi-parameter Estimation of Interior Permanent Magnet Motor Drives with Finite Control Set Model Predictive Control. IET Electr. Power Appl. 2017, 11, 944–951. [Google Scholar] [CrossRef]
  19. Lin, C.; Liu, T.; Yu, J.; Fu, L.; Hsiao, C. Model-Free Predictive Current Control for Interior Permanent-Magnet Synchronous Motor Drives Based on Current Difference Detection Technique. IEEE Trans. Ind. Electron. 2014, 61, 667–681. [Google Scholar] [CrossRef]
  20. Lin, C.; Yu, J.; Lai, Y.; Yu, H. Improved Model-Free Predictive Current Control for Synchronous Reluctance Motor Drives. IEEE Trans. Ind. Electron. 2016, 63, 3942–3953. [Google Scholar] [CrossRef]
  21. Sawma, J.; Khatounian, F.; Monmasson, E.; Idkhajine, L.; Ghosn, R. Analysis of the Impact of Online Identification on Model Predictive Current Control Applied to Permanent Magnet Synchronous Motors. IET Electr. Power Appl. 2017, 11, 864–873. [Google Scholar] [CrossRef]
  22. Wang, W.; Xiao, X. Research on Predictive Control for PMSM Based on Online Parameter Identification. In Proceedings of the 38th Annual Conference on IEEE Industrial Electronics Society, Montreal, QC, Canada 25–28 October 2012. [Google Scholar]
  23. Xia, C.; Wang, M.; Song, Z.; Liu, T. Robust Model Predictive Current Control of Three-Phase Voltage Source PWM Rectifier with Online Disturbance Observation. IEEE Trans. Ind. Informat. 2012, 8, 459–471. [Google Scholar] [CrossRef]
  24. Preindl, M.; Bolognani, S. Model Predictive Direct Speed Control with Finite Control Set of PMSM Drive Systems. IEEE Trans. Power Electron. 2013, 28, 1007–1015. [Google Scholar] [CrossRef]
  25. Yang, M.; Lang, X.; Long, J.; Xu, D. Flux Immunity Robust Predictive Current Control with Incremental Model and Extended State Observer for PMSM Drive. IEEE Trans. Power Electron. 2017, 32, 9267–9279. [Google Scholar] [CrossRef]
  26. Young, H.A.; Perez, M.A.; Rodríguez, J. Analysis of Finite-Control-Set Model Predictive Current Control with Model Parameter Mismatch in a Three-Phase Inverter. IEEE Trans. Ind. Electron. 2016, 63, 3100–3107. [Google Scholar] [CrossRef]
  27. Siami, M.D.; Khaburi, A.; Abbaszadeh, A.; Rodríguez, J. Robustness Improvement of Predictive Current Control Using Prediction Error Correction for Permanent-Magnet Synchronous Machines. IEEE Trans. Ind. Electron. 2016, 63, 3458–3466. [Google Scholar] [CrossRef]
  28. Cortés, P.; Rodríguez, J.; Silva, C.; Flores, A. Delay Compensation in Model Predictive Current Control of a Three-Phase Inverter. IEEE Trans. Ind. Electron. 2012, 59, 1323–1325. [Google Scholar] [CrossRef]
  29. Zhang, Y.; Xie, W. Low Complexity Model Predictive Control—Single Vector-Based Approach. IEEE Trans. Power Electron. 2014, 29, 5532–5541. [Google Scholar] [CrossRef]
  30. Rodríguez, J.; Cortés, P. Predictive Control of Power Converters and Electrical Drives, 1st ed.; Wiley: New York, NY, USA, 2012. [Google Scholar]
  31. Bogado, B.; Barrero, F.; Arahal, M.R.; Toral, S.; Levi, E. Sensitivity to Electrical Parameter Variations of Predictive Current Control in Multiphase Drives. In Proceedings of the 39th Annual Conference on IEEE Industrial Electronics Society, Vienna, Austria, 10–13 November 2013. [Google Scholar]
  32. Niu, F.; Li, K.; Wang, Y. Direct Torque Control for Permanent-Magnet Synchronous Machines Based on Duty Ratio Modulation. IEEE Trans. Ind. Electron. 2015, 62, 6160–6170. [Google Scholar] [CrossRef]
  33. Hu, D.; Alsmadi, Y.M.; Xu, L. High-fidelity Nonlinear IPM Modeling Based on Measured Stator Winding Flux Linkage. IEEE Trans. Ind. Appl. 2015, 51, 3012–3019. [Google Scholar] [CrossRef]
Figure 1. Block diagram of finite-control-set model predictive current control (FCS-MPCC) scheme.
Energies 11 02051 g001
Figure 2. Experimental setup.
Energies 11 02051 g002
Figure 3. Relative prediction error under different discretization orders. (a) Relative prediction error of id; (b) Relative prediction error of iq.
Energies 11 02051 g003
Figure 4. Relative prediction error under different prediction stepsizes. (a) Relative prediction error of id; (b) Relative prediction error of iq.
Energies 11 02051 g004
Figure 5. Relative prediction error under Ld mismatch. (a) Relative prediction error of id; (b) Relative prediction error of iq.
Energies 11 02051 g005
Figure 6. Relative prediction error under Lq mismatch. (a) Relative prediction error of id; (b) Relative prediction error of iq.
Energies 11 02051 g006
Figure 7. Relative prediction error under Nd step changes for three Nq settings. (a) Relative prediction error of id; (b) Relative prediction error of iq.
Energies 11 02051 g007
Figure 8. Relative prediction error under Nq step changes for three Nd settings. (a) Relative prediction error of id; (b) Relative prediction error of iq.
Energies 11 02051 g008
Table 1. Parameters of the interior permanent magnet synchronous motor (IPMSM).
ParametersValue
Rated power2 kW
Rated phase voltage (peak)170 V
Rated phase current (peak)10 A
Rated speed800 rpm
Stator resistance4.1 Ω
d-axis inductance0.056 H
q-axis inductance0.119 H
Permanent magnet flux linkage0.936 Wb
Pole pairs2
Table 2. PEbase under different speeds.
Speed (rpm)PEbase of id (A)PEbase of iq (A)
2000.1360.139
4000.1490.127
6000.1610.119

