Article

Pilot Protection Based on Amplitude of Directional Travelling Wave for Voltage Source Converter-High Voltage Direct Current (VSC-HVDC) Transmission Lines

1
Key Laboratory of Power System Intelligent Dispatch and Control of Ministry of Education, Shandong University, Jinan 250061, Shandong, China
2
Weifang Electric Power Company, Weifang 261000, Shandong, China
3
Jinan Electric Power Company, Jinan 250061, Shandong, China
*
Author to whom correspondence should be addressed.
Energies 2018, 11(8), 2021; https://doi.org/10.3390/en11082021
Submission received: 9 July 2018 / Revised: 31 July 2018 / Accepted: 1 August 2018 / Published: 3 August 2018

Abstract

:
This paper presents a novel pilot protection scheme of DC cable line in voltage-source-converter (VSC) based multi-terminal DC (MTDC) grids, which utilizes a novel phase-mode transformation to decouple the bipolar DC cable current into six mode and it uses the stationary wavelet transform to extract the modulus maxima of fault initial traveling waves current (FITWC). With accurate amplitude and polarities of the FITWC being collected from the fault-detection devices located at each terminal, the proposed scheme can correctly determine the faulty segment and the faulty pole. In this paper, the ratio of amplitudes between sixth mode forward and backward travelling wave currents is used to judge the faulty segment and the polarity of fifth mode forward travelling wave current is used to identify the faulty pole. A four-terminal VSC-based MTDC grid was built in PSCAD/EMTDC to evaluate the performance of the fault-protection scheme. Simulation results for different cases demonstrate that the proposed protection scheme is robust against noise, and has been tested successfully for fault resistance of up to 400 Ω. Since the scheme merely needs the characteristics of FITWCs, the practical difficulties of detecting subsequent travelling waves are avoided. Moreover, only the state signal is needed to send to the other side in proposed scheme, so low communication speed can satisfy the requirement of relay protection and it does not need the data synchronization seriously.

1. Introduction

The development of power-electronic and controllable devices in power systems is rapidly expanding the field of applications for voltage source converter (VSC) based high voltage direct current (HVDC) technologies, due to its recognized advantages in comparison with traditional line commutated converter (LCC) based HVDC transmission [1,2]. Conventional two- and three-level VSC-HVDC systems present a faster dynamic response thanks to the pulse-width-modulation (PWM) technology when compared with the fundamental switching frequency operation of traditional HVDC systems [3]. These distinguishing features make VSC-HVDC been accepted as a feasible solution to implement efficient grid integration and power transmission for renewable energy over long distances [4].
Multi-terminal VSC-HVDC (VSC-MTDC) transmission system is expected to play a crucial role in future power systems. In VSC-MTDC systems, the unavoidable nonpermanent DC faults on any transmission line can severely undermine the reliability and availability of the transmission system, which will cause the entire grid breakdown [5]. Therefore, it is vital to design a protection scheme for transmission lines to achieve fast fault clearance, as well as automatic and quick recovery.
Various methods have been proposed for fault protection; overcurrent, derivative, and wavelet protection have all received attention [6,7,8]. Reference [9] proposed a current differential protection principle that was implemented by calculating the current at midpoint of cable lines. The proposed protection method can reduce the effect of the distributed capacitance and improve the sensitivity of differential protection, but it needs a large amount of calculation and a long time delay.
The travelling wave (TW) based protection method is an ideal main protection scheme for VSC-HVDC transmission line that satisfies high-speed requirement by detecting and locating the faults close to the speed of light on both AC and HVDC transmission lines. References [10,11] use the transient characteristic of TW at the two terminals to construct the differential protection scheme, but the seriously synchronous current data of both stations, high sampling rate, and communication speed are required. Reference [12] utilized S-transform to extract the high frequency components and then used the sudden change value of fault current components to recognize the internal fault. Since a data window of 200 sampling points is needed in S-transform, a high sampling frequency must be required in the proposed method in order to satisfy the quickness. Moreover, the protection scheme that is proposed in reference [12] did not give a matched faulty pole selection.
In two-level converter based VSC-HVDC system, there are large shunt capacitors in parallel at both terminals of the DC transmission lines. According to this characteristic, [13,14,15] have proposed some DC transmission line protection methods. However, the proposed protection method only aims at two-terminal DC transmission system, their application in MTDC grid needs to be further analyzed. Polarity comparison based protection scheme is proposed in reference [16]. In two-terminal VSC-HVDC system, the polarities of initial TW current on both terminals are the same in the faulty line while being opposite in the healthy line. However, in four-terminal MTDC system, the polarities on the healthy line which is opposite to the faulty line may also be the same. Thus, the method by comparing the polarity of TW in MTDC grid needs additional criteria to ensure reliance. Based on the scheme in [16], reference [17] improved the scheme by carrying out the faulty pole identification before the faulty segment selection to make up the aforementioned shortcoming in MTDC grid, which increased the amount of calculation in faulty pole identification.
In this paper, a precise fault protection scheme utilizes the characteristics of the fault initial traveling wave current (FITWC) is introduced. The remainder of paper is arranged, as follows. Section 2 introduces the theory of two necessary tools: the stationary wavelet transform, given in Section 2.1, is used to extract the modulus maxima of FITWC and the novel phase-mode transformation, introduced in Section 2.2, is used to decouple the bipolar DC cable. In Section 3, the reflection characteristics of forward and backward TW at both sides in two-terminal and four-terminal VSC-HVDC grid are analyzed. According to the characteristic above, a novel pilot protection principle for VSC-MTDC cable lines is proposed in Section 4, in which the amplitude difference between the six-mode initial forward and backward FITWC is utilized to judge the faulty segment and the polarity of fifth mode forward TW current is used to identify the faulty pole. With a four-terminal VSC-MTDC model built in PSCAD/EMTDC, numerous faults are simulated to test the proposed protection method in Section 5.

2. Protection Prepare

2.1. Wavelet Analysis Theory

The wavelet transform methods have been found to be promising and capable of presenting abrupt local changes in transient signals, for example, TW signals that were generated by a fault, for its splendid ability to extract their features in both time domain and frequency domain simultaneously [18]. In stationary wavelet transform (SWT), unlike the standard discrete wavelet transform (DWT), the length of wavelet at each scale is equal to that of the original signal, which get around frequency-mixing when signal reconstitution. Due to the time invariant characteristics of SWT, it has been diffusely used in de-noising study, singularity detection, sharp transient detection, as well as HVDC line protection [19].
The SWT of a signal x[n] is calculated, according to Figure 1:
Where bj and aj, j = 1, 2, …, J, are the detail and approximation coefficients in SWT of the signal x[n] at scale j, respectively. The filters Gj[n] and Hj[n] are obtained by up-sampling the filters that are used for the previous step (i.e., Gj-1[n] and Hj-1[n]) at 2-scale respectively, and G1[n] and H1[n] for the first step are equal to the standard decomposition high-pass and low-pass wavelet filters used in Mallat algorithm, respectively.
Supposing Wkf(x) is the SWT of signal x[n] in the scale k, for all value x in the neighborhood of x0, if Wkf(x) meets the following criterion:
| W k f ( x ) | < | W k f ( x 0 ) |  
then x0 and Wkf(x0) are called as modulus maximum point and modulus maximum value of the SWT, respectively.
The translation invariance of SWT and singularity detection theory shows that the modulus maximum point is one-to-one corresponding to the abrupt local point of signal. Thus, the SWT can be applied to detect the arrival time and absolute value of fault initial current travelling wave signal in the proposed protection scheme.

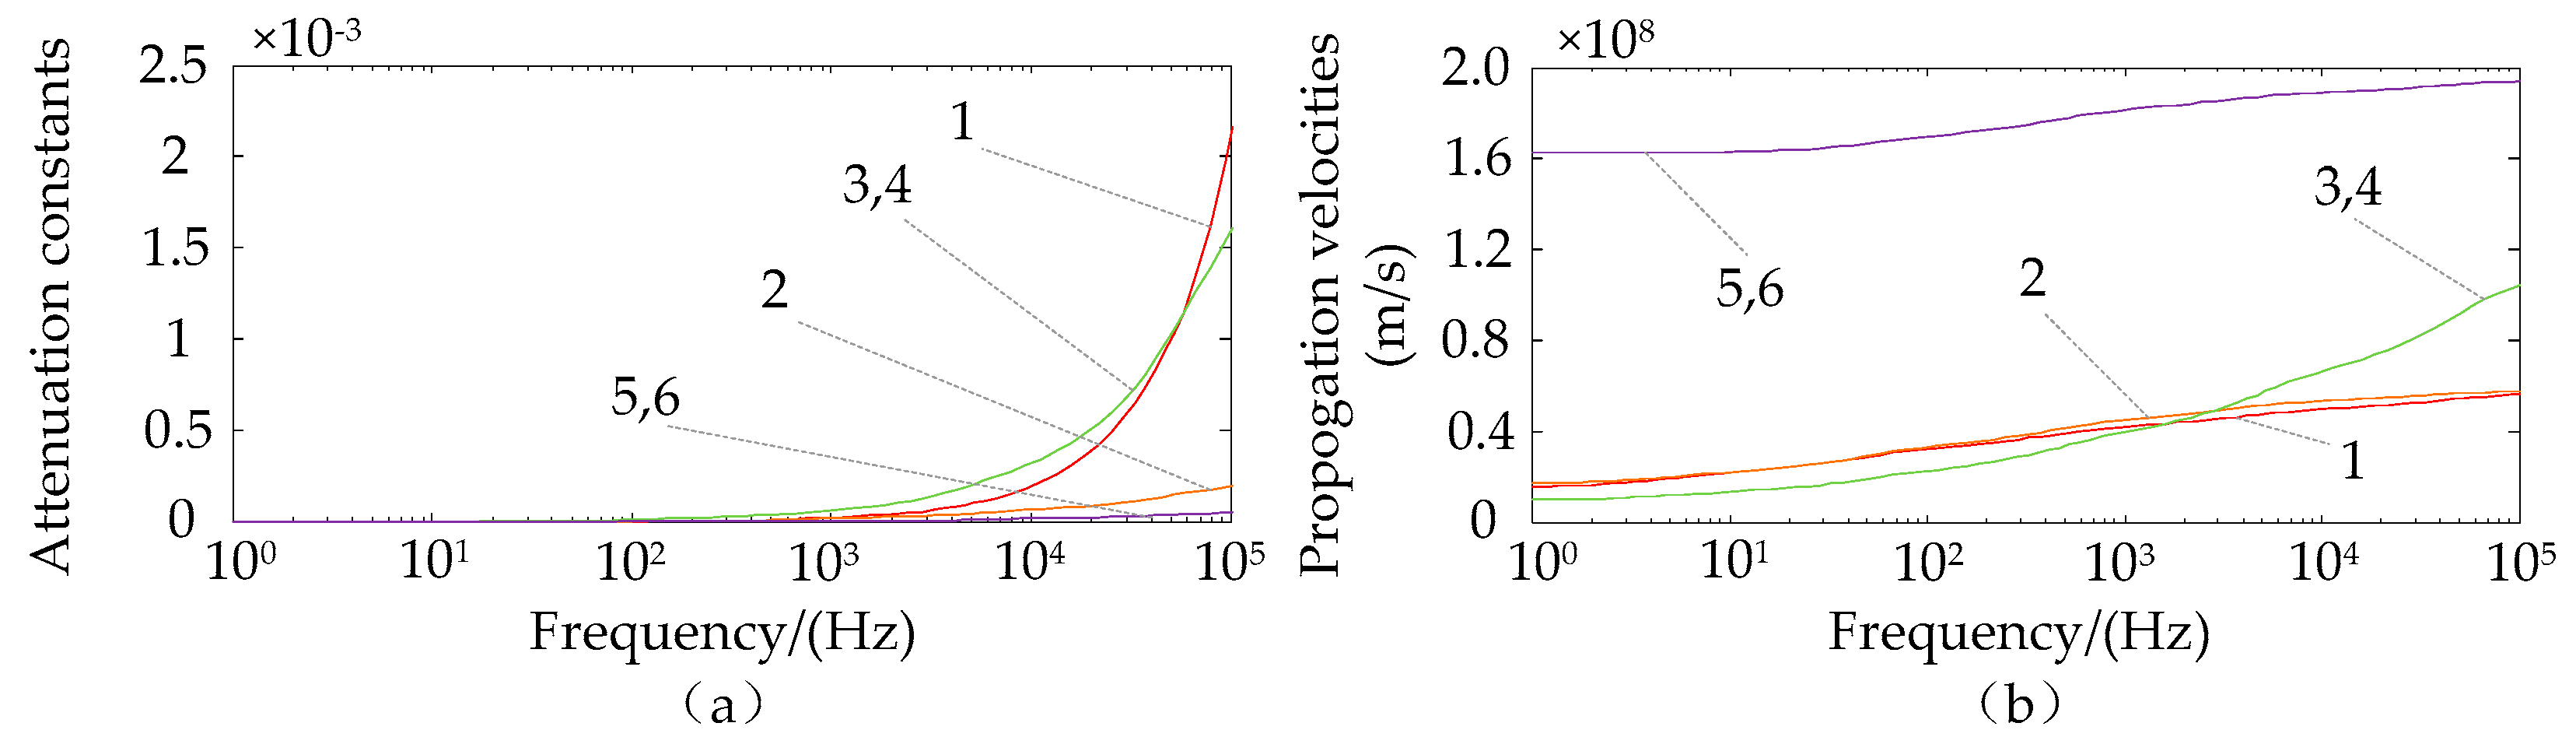
2.2. Phase-Mode Transform Method for Bipolar Cable

Accurate impedance and admittance parameters of power cable are required for relay protection setting and fault current calculation of power system with power cable [20]. At present, crosslinked polyethylene is widely used in VSC-HVDC transmission line. Figure 2 shows the cross section of a single DC cable. Its structure is composed by three layers, namely, conductor layer, sheath layer, and armour layer. Thus, there are six sets of voltages and currents for a bipolar cable, which are coupled with each other. Decoupling the parameters of the cable in an effective way is of great significance.
Reference [21] represents the calculation methods of equivalent impedance and admittance parameters when considering the coupling between the multiple conductors’ layers of the cable. Nevertheless, the proposed method is not suitable for DC cable lines. Reference [22] proposed a phase-mode transform method for the bipolar DC cable. The voltage and the current decoupling matrix S and Q can be derived, as follows:
S = [ 1 1 1 1 1 1 1 1 1 1 1 1 1 1 1 1 1 1 1 1 0 0 0 0 1 1 1 1 0 0 0 0 0 0 0 0 ]  
Q = S - T = 1 2 [ 0 0 0 0 0 0 0 0 1 1 1 1 0 0 0 0 1 1 1 1 1 1 1 1 1 1 1 1 1 1 1 1 0 0 0 0 ]  
Thus, IM is derived into six mode as follow, where IM = [Impc, Imnc, Imps, Imns, Impa, Imna].
I k = Q 1 I M = [ i m p c + i m n c + i m p s + i m n s + i m p a + i m n a i m p c i m n c + i m p s i m n s + i m p a i m n a i m p c + i m n c + i m p s + i m n s i m p c i m n c + i m p s i m n s i m p c + i m n c i m p c i m n c ]
Reference [22] gives the attenuation constants and propagation velocities of each mode currents varying with frequency as Figure 3 shows. Thus, the following conclusions can be made:
The attenuation constants of the fifth and sixth mode currents keep low as the frequency increased, while the attenuation constants of other mode currents increased obviously.
The velocities of the fifth and the sixth mode currents are close to the ideal velocity when the frequency is higher than 5 kHz, while the velocities of the other mode currents are significantly low.
As a result, the fifth mode and sixth mode currents are more suitable for fault protection and detection.

3. TW Characteristic Analysis

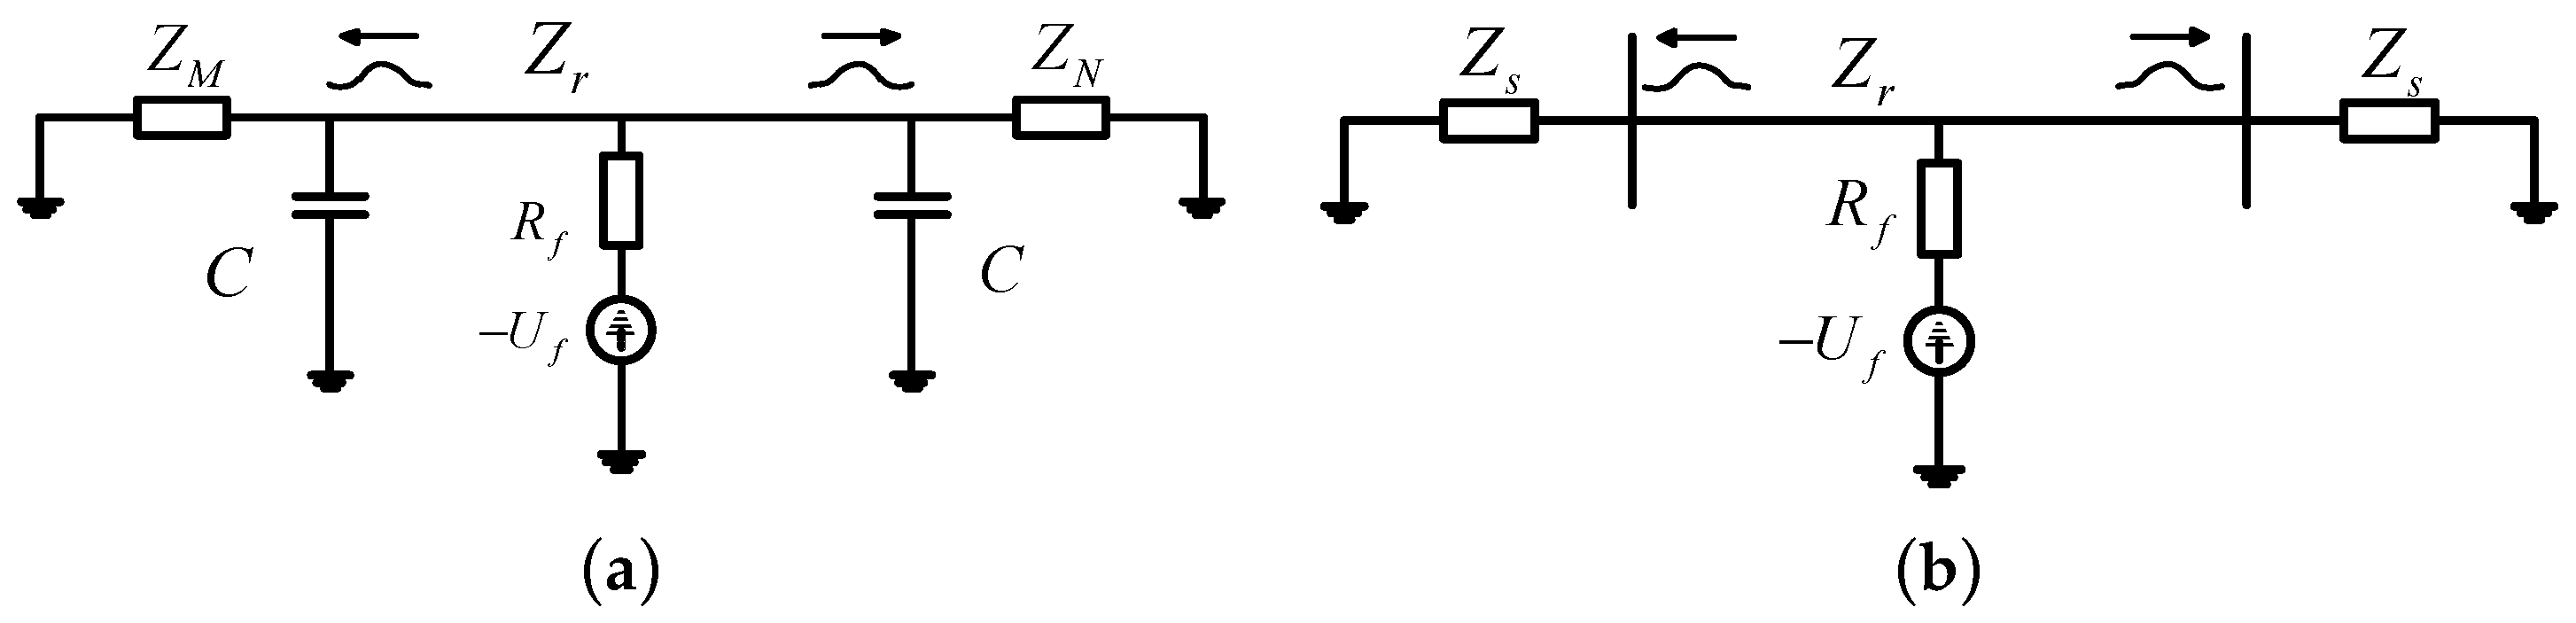
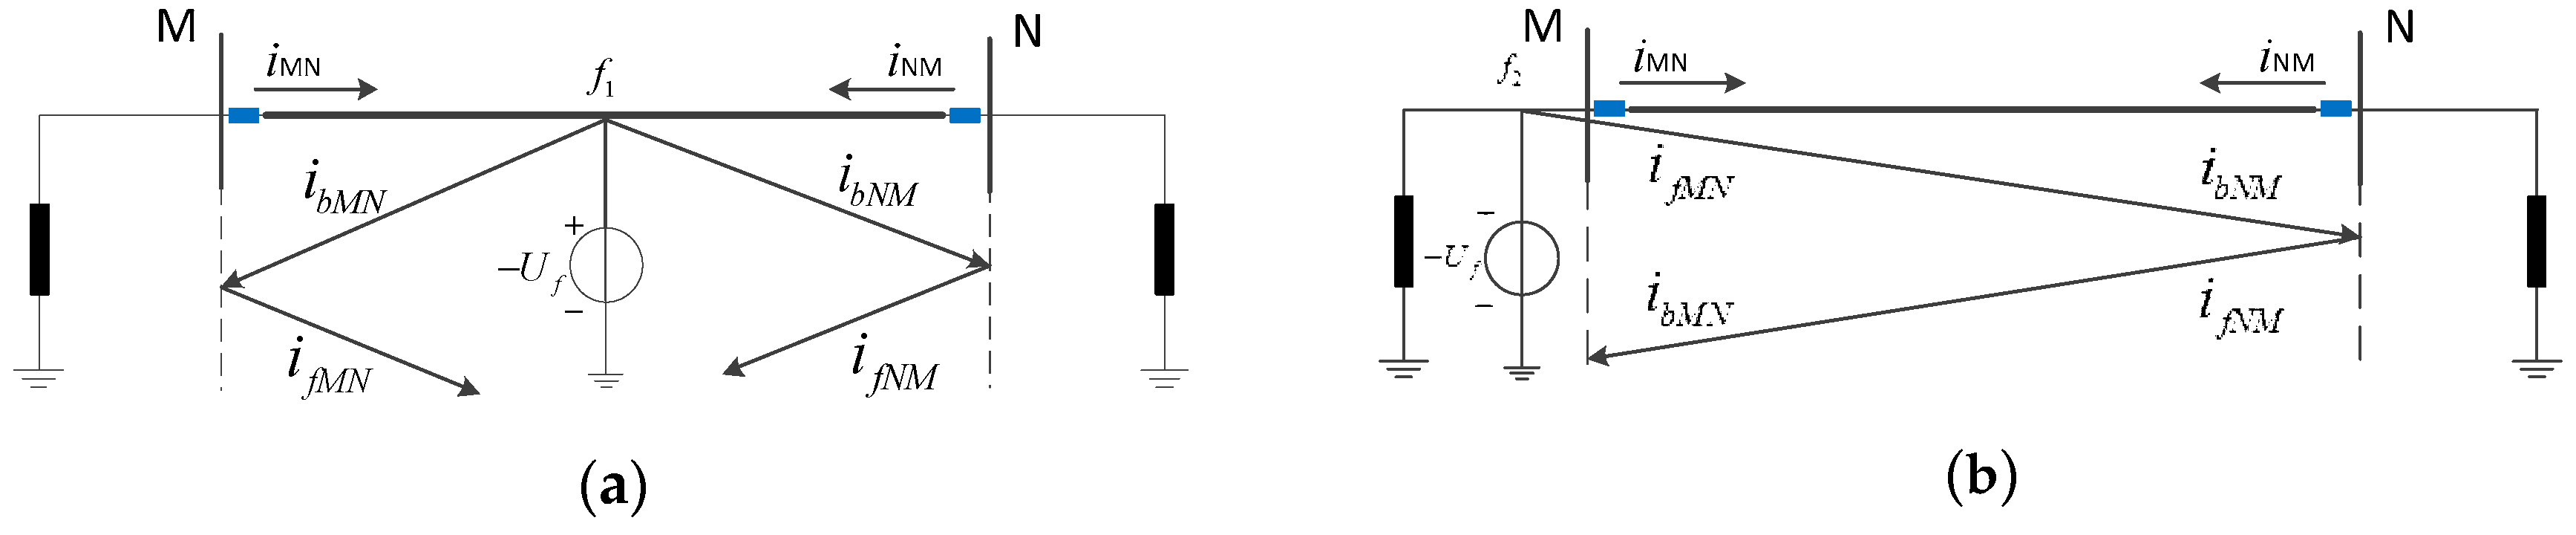
3.1. Basic Theory Analysis for Two-Terminal DC Grid

In two-terminal VSC-HVDC transmission system, there are shunt capacitors in parallel at both terminals of DC cable. When a fault occurs, an additional voltage source add to the fault point and the forward and backward travelling wave generated by the additional source propagation along the cable line from the fault point to both ends. In the fault component network, the system side is equivalent to the large shunt capacitor for the high-frequency component [23]. Taking the positive pole to ground (PG) fault, for example, the propagation and reflection of the travelling waves are analyzed in this subsection.
The fault component additional network for the PG fault is shown in Figure 4a. Uf is the additional DC voltage source at the fault point. C is the real capacitor on the each terminal. Rf is the fault resistance and Zr is the impedance of DC cable. ZM and ZN represent the equivalent impedance of the rectifier and inverter station of VSC-HVDC system, respectively. For convenience of analysis, we let ZM equal to ZN, and introduce Zs as
Z s = Z M / / ( 1 2 π f C )  
Then, get the simplified fault component network as Figure 4b.
According to the Peterson principle, the propagation coefficient α and the reflection coefficient β of the travelling wave is defined, as follows
{ α = 2 Z r Z r + Z s β = Z r Z s Z r + Z s  
Since the capacitive reactance of the shunt capacitor C vary with frequency. When the frequency of fault travelling wave ranges from 10 to 100 kHz, the capacitive reactance 1/(2πfC) of a 1000 μF capacitor ranges from 1.59 × 10⁻³ Ω to 1.59 × 10⁻² Ω. However, the resistance of cable line ranges from 10 Ω to 100 Ω in general. So, Zr >> 1/2πfC. Thus
Z r > > Z s  
Introduce (7) to (6), we can get the approximate value of coefficient α and β
α 2 ,   β 1
Therefore, when the fault initial travelling wave current (FITWC) arrives at the shunt capacitor, we can believe there take place a total reflection. So, the wave head of fault initial forward travelling wave current (FTWC) and the fault initial backward travelling wave current (BTWC) contain good information in theory.
The positive direction of FTWC is specified as from the bus to the cable line, consequently, the positive direction of BTWC is specified as from cable line to bus. When an internal fault occurs at f1 for the line MN, the propagation and reflection of the fault initial FTWC and BTWC is shown in Figure 5a. As illustrated in the figure, when an internal fault occurs, the amplitude of the fault initial BTWC is very close to FTWC for both terminals due to the reflection coefficient β ≈ 1.
When an external fault occurs at f2 for the line MN, the propagation and reflection of the fault initial FTWC and BTWC is shown in Figure 5b. As illustrated in the figure, the initial FTWC arrives at terminal M firstly, and then propagates along the cable line to terminal N. Therewith, the initial BTWC for terminal M, which is the reflection of the initial FTWC at terminal N, is detected. When considering the attenuation of TW on the cable line, the amplitude of initial FTWC is much larger than BTWC for terminal M. On the contrary, the amplitude of FTWC is very close to BTWC for terminal N due to the reflection coefficient β ≈ 1.
On the basis of the above analysis, the following conclusions can be drawn: when an internal fault occurs in the two-terminal VSC-HVDC line, the amplitudes of FTWC and BTWC at both terminals are approximate to each other; while, when an external fault occurs, the amplitude of FTWC is much larger than BTWC at least for one terminal. Therefore, the amplitude difference of the FTWC and BTWC can be used to distinguish the internal fault from the external fault.

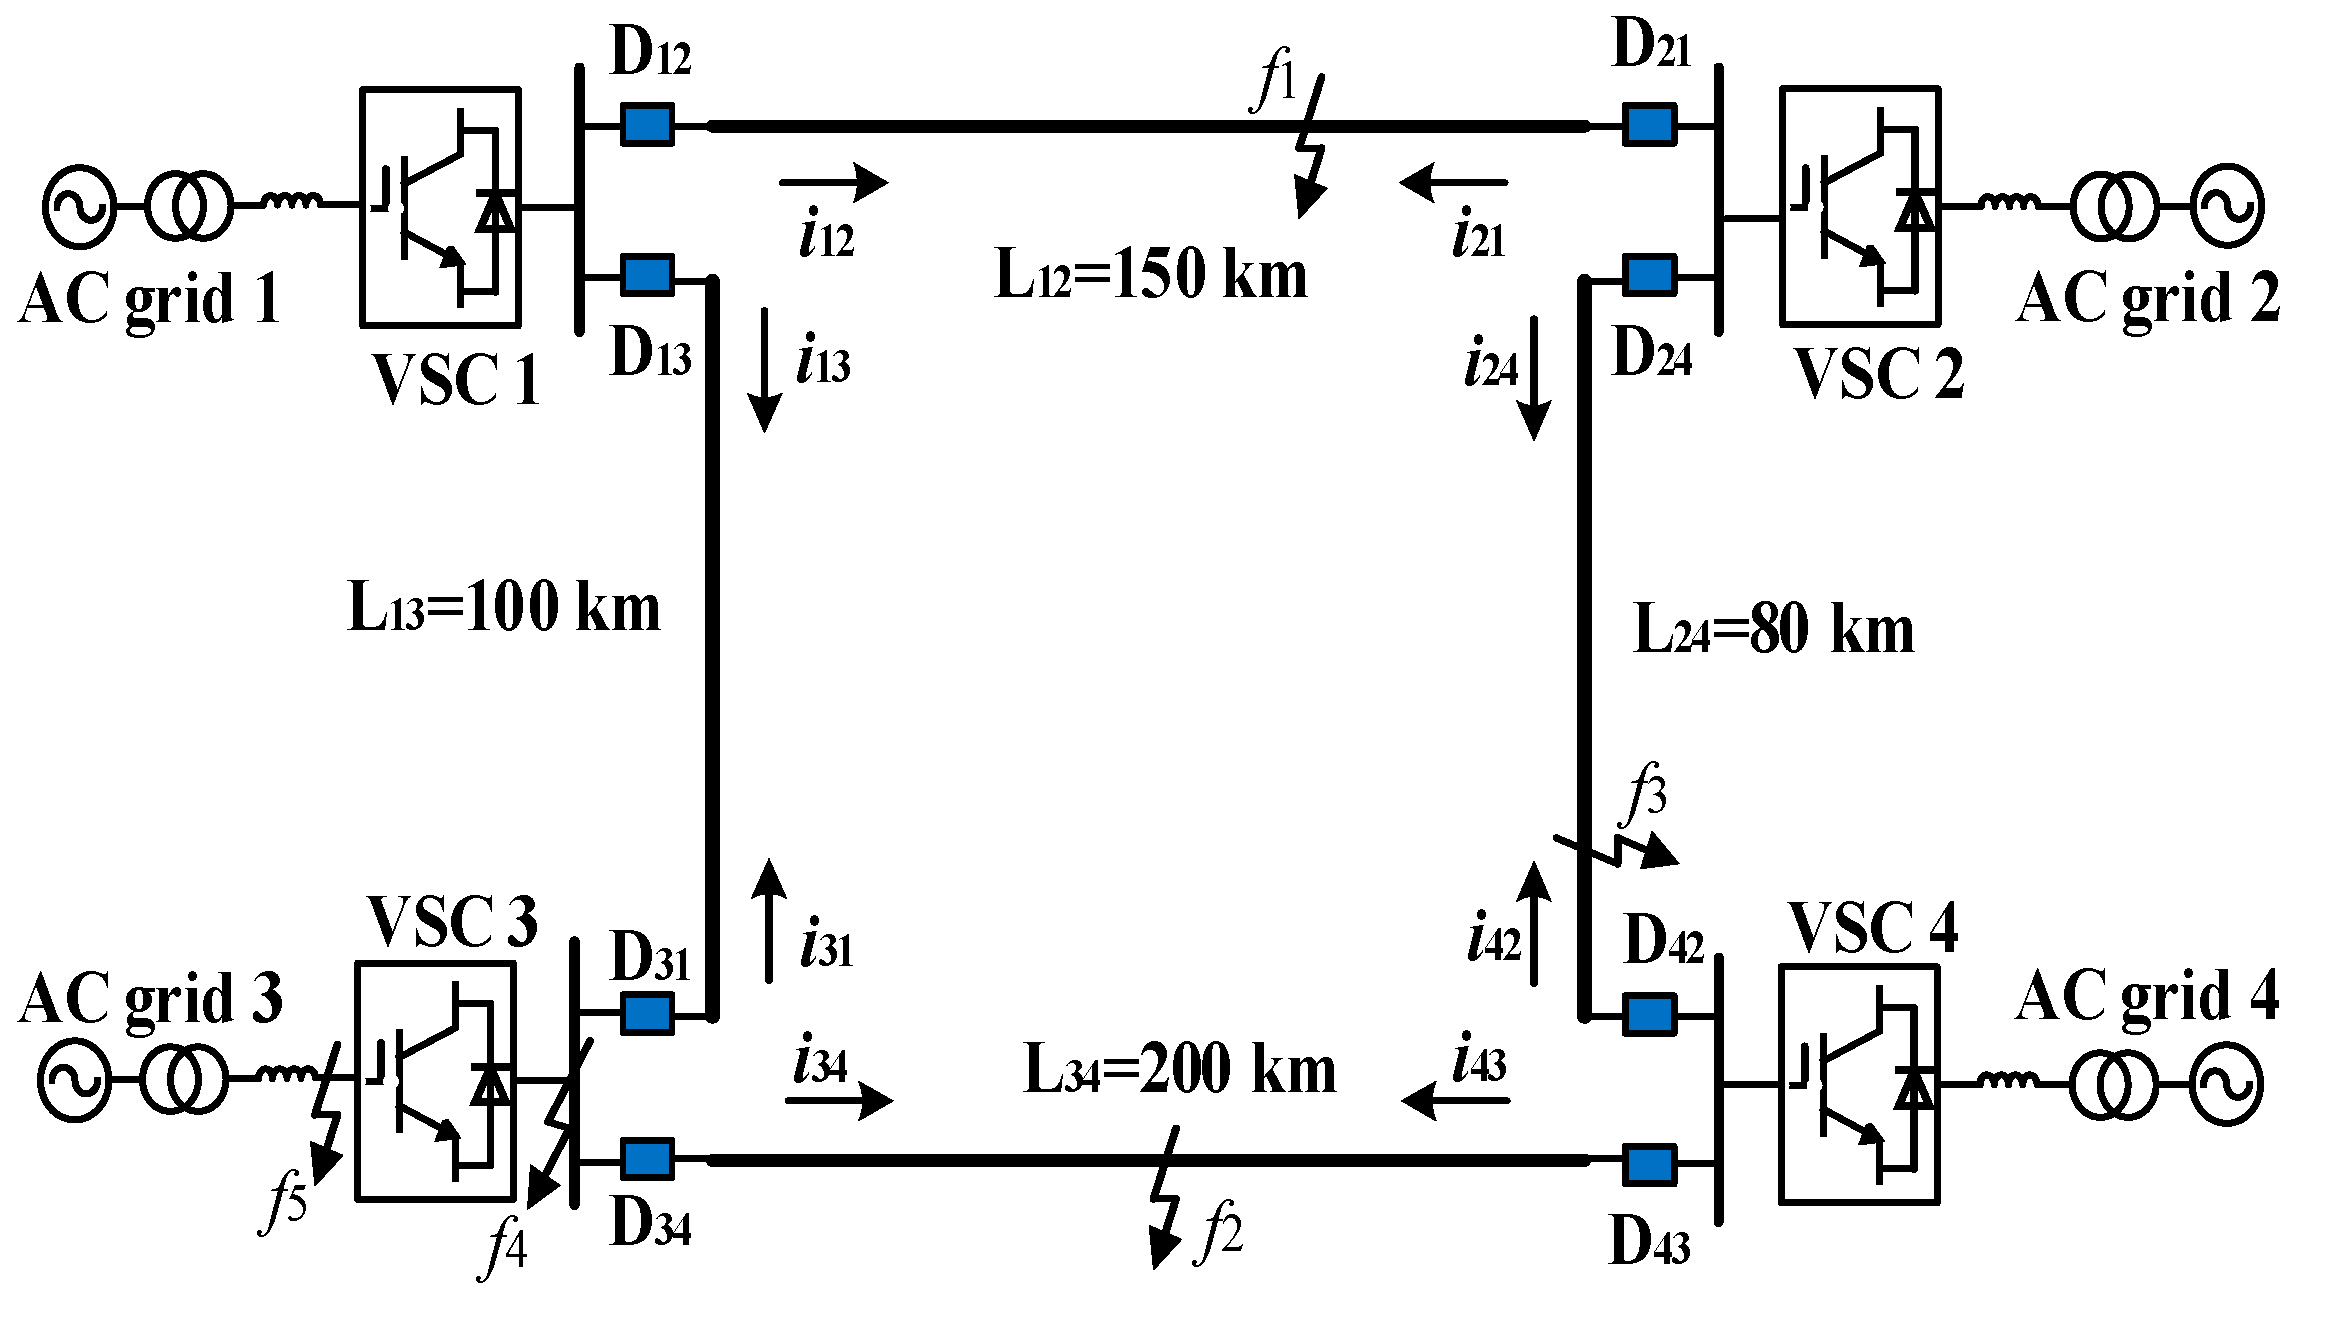
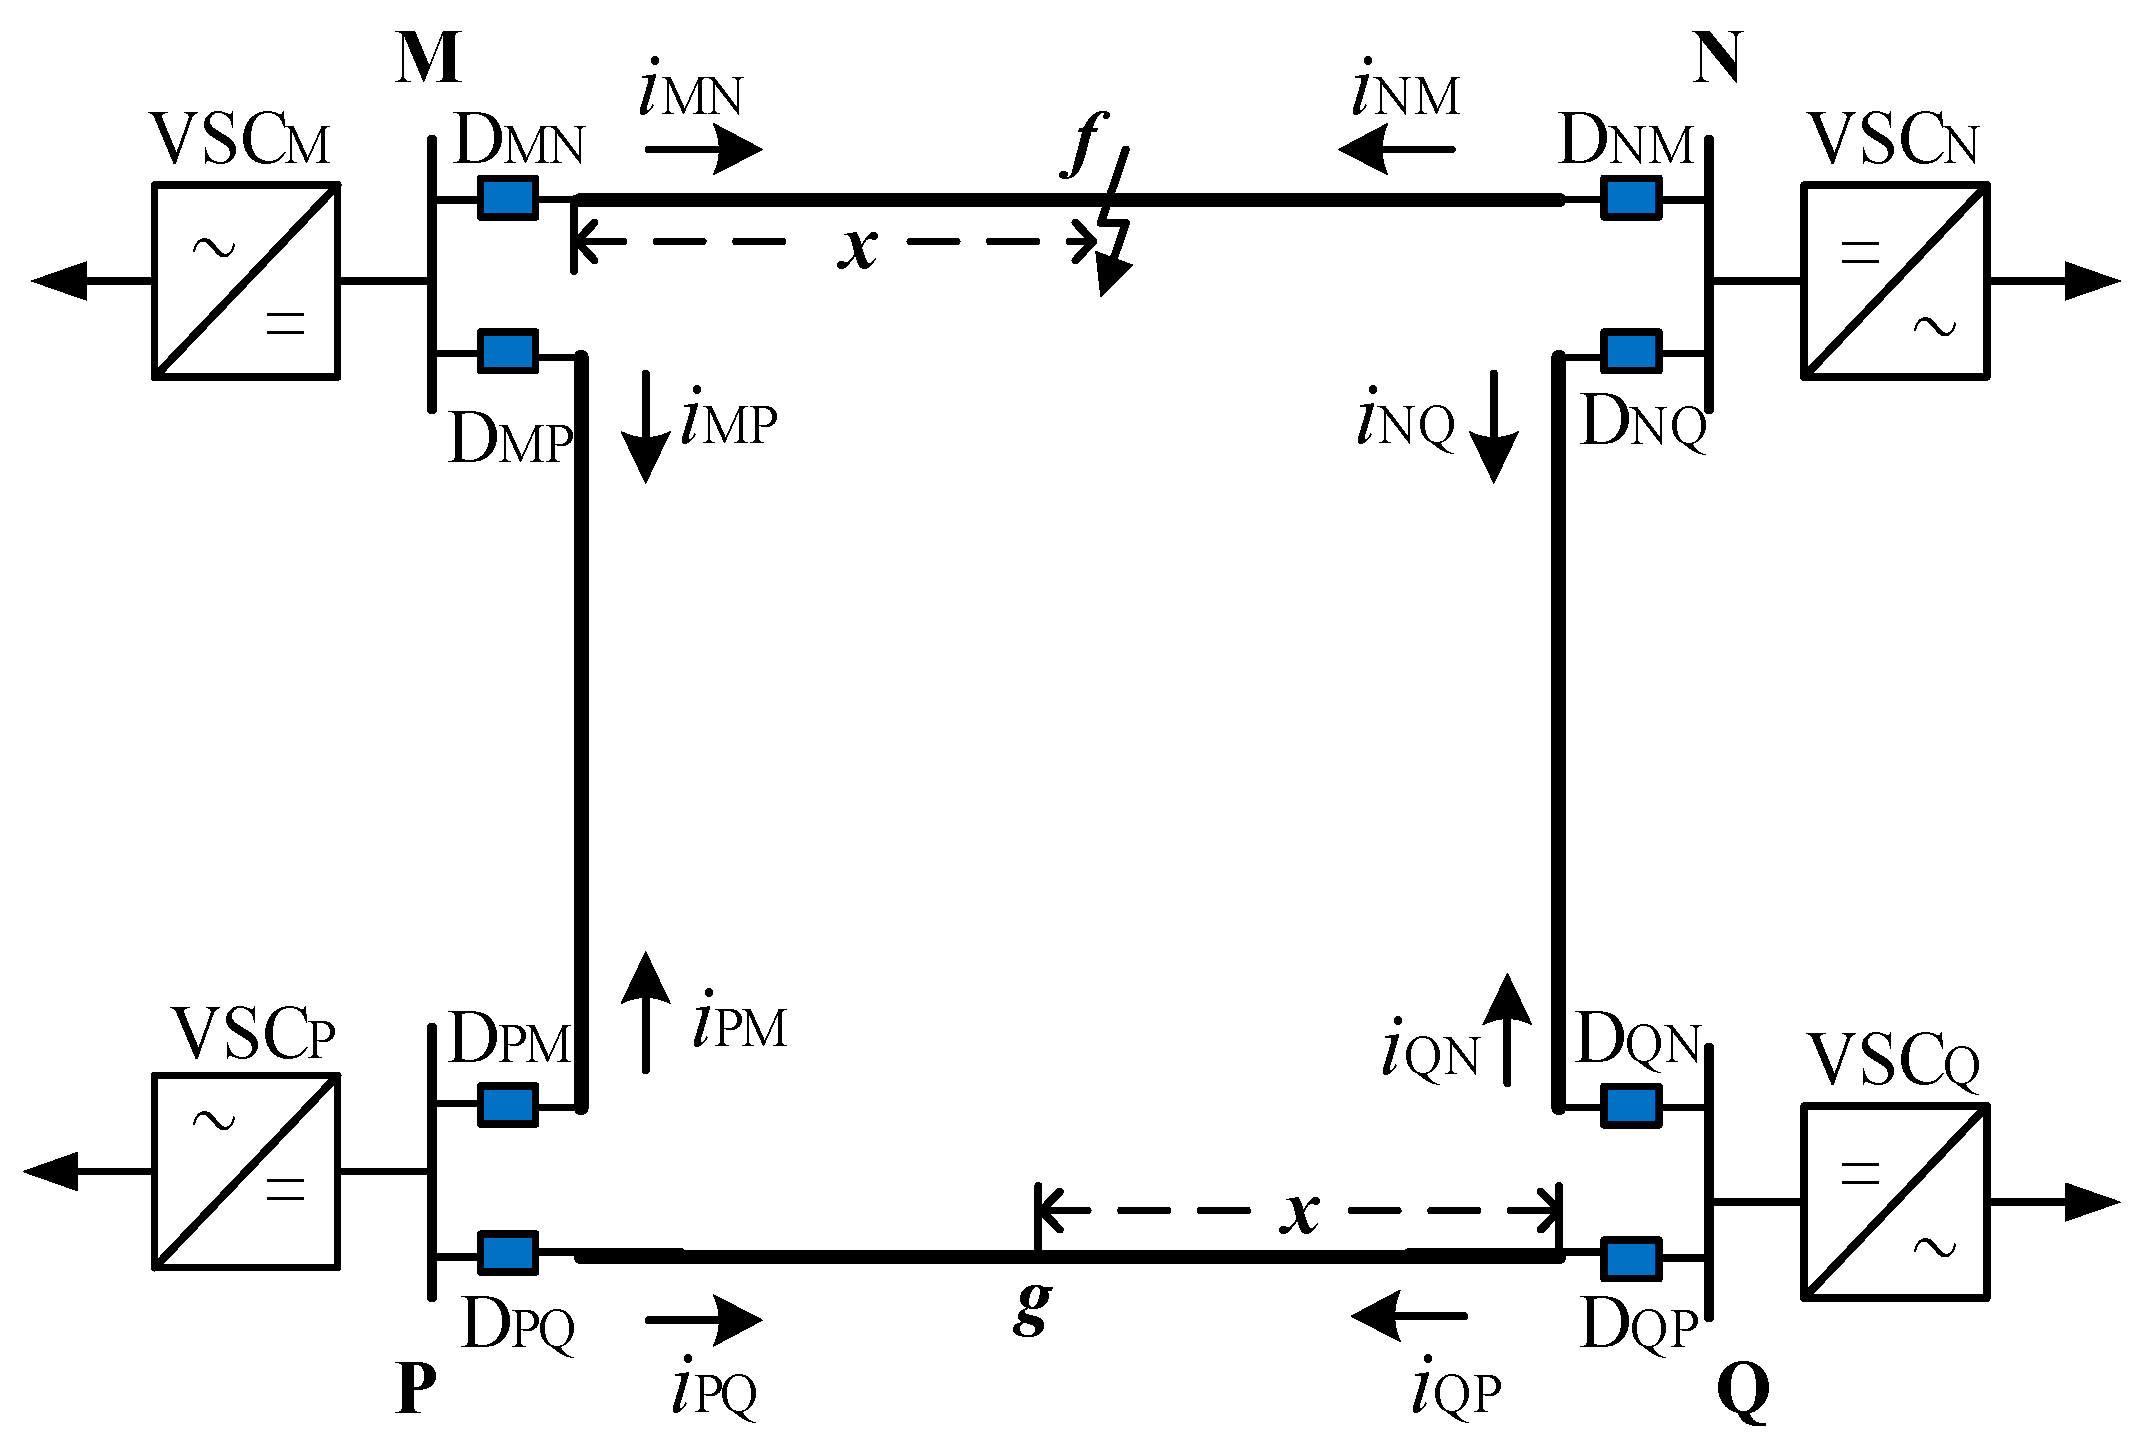
3.2. Basic Theory Analysis for Four-Terminal DC Grid

Without loss of generality, a four-terminal VSC-MTDC grid in Figure 6 is taken as an example. Assuming that the length and parameters of the cable lines are all the same and the blue blocks Dij (i, j = M, N, P, Q) located at both terminals of each line is the fault-detection devices. The following analysis is based on the single pole system for convenience.
As shown in Figure 6, when the fault occurs at an arbitrary position in cable line MN, where is x km from the bus M, the FITWC propagate from the fault point f to both terminals and then propagate into other lines by the shortest path between the fault point and the fault-detection devices Dij. When considering the same travelling wave propagation velocities of each line, the FTWC set out from the fault point f in different directions confront each other at the point g where is x km from the bus Q. Before encountering, the amplitudes of FTWC and BTWC detected by DMN and DNM are approximate to each other so the internal fault for line MN can be judged. While for the DMP and DNQ, the FTWC propagate along the cable line MP and NQ, and are reflected back before the BTWC been detected. Since the amplitude of FTWC is much larger than BTWC, the external fault for line MP and NQ can be distinguished. As to the line PQ, the FTWC from both sides arrive at point g for the first time and then travel forward continuously before been viewed as the BTWC by DPQ and DQP. As a result, the amplitude of FTWC is much larger than BTWC.
In extreme circumstances, for example x = 0, the aforementioned analysis for line MN, MP, NQ is still valid. However, with regard to line PQ, the FTWC from both sides arrive at the bus Q, which means that the amplitudes of FTWC and BTWC detected by DQP are close to each other, however the amplitude of FTWC is much larger than BTWC for DPQ.
In MTDC grid, the equivalent impedance Zsi of bus i (i = M, N, P, Q) is defined as
Z s i = Z i / / ( 1 2 π f C ) / / Z r  
where Zr is the impedance of DC cable and Zi represent the equivalent impedance of system i.
As a result, the propagation coefficient αi and the reflection coefficient βi at bus i are defined as
{ α i = 2 Z r Z r + Z s i β i = Z r Z s i Z r + Z s i  
According to the aforementioned analysis in Section 3.1, we can know that Zr >> 1/2πfC, so
Z r > > Z s i  
We can get the approximate value of coefficient αi and βi
α i 2 ,   β i 1
Therefore, a total reflection at bus i is still valid. The amplitude difference of the FTWC and BTWC can still be used to identify the internal fault from the external fault in VSC-MTDC grid. Based on the amplitudes difference of FTWC and BTWC for each fault-detection device analyzed above, the internal fault can be distinguished in VSC-MTDC grid by the following conclusion:
(a)
If the amplitudes of FTWC and BTWC detected by Dij and Dji, respectively, are both approximate to each other, an internal fault in line i, j can be distinguished;
(b)
If the amplitude of FTWC is much larger than BTWC for Dij or Dji, an external fault in line i, j can be judged.

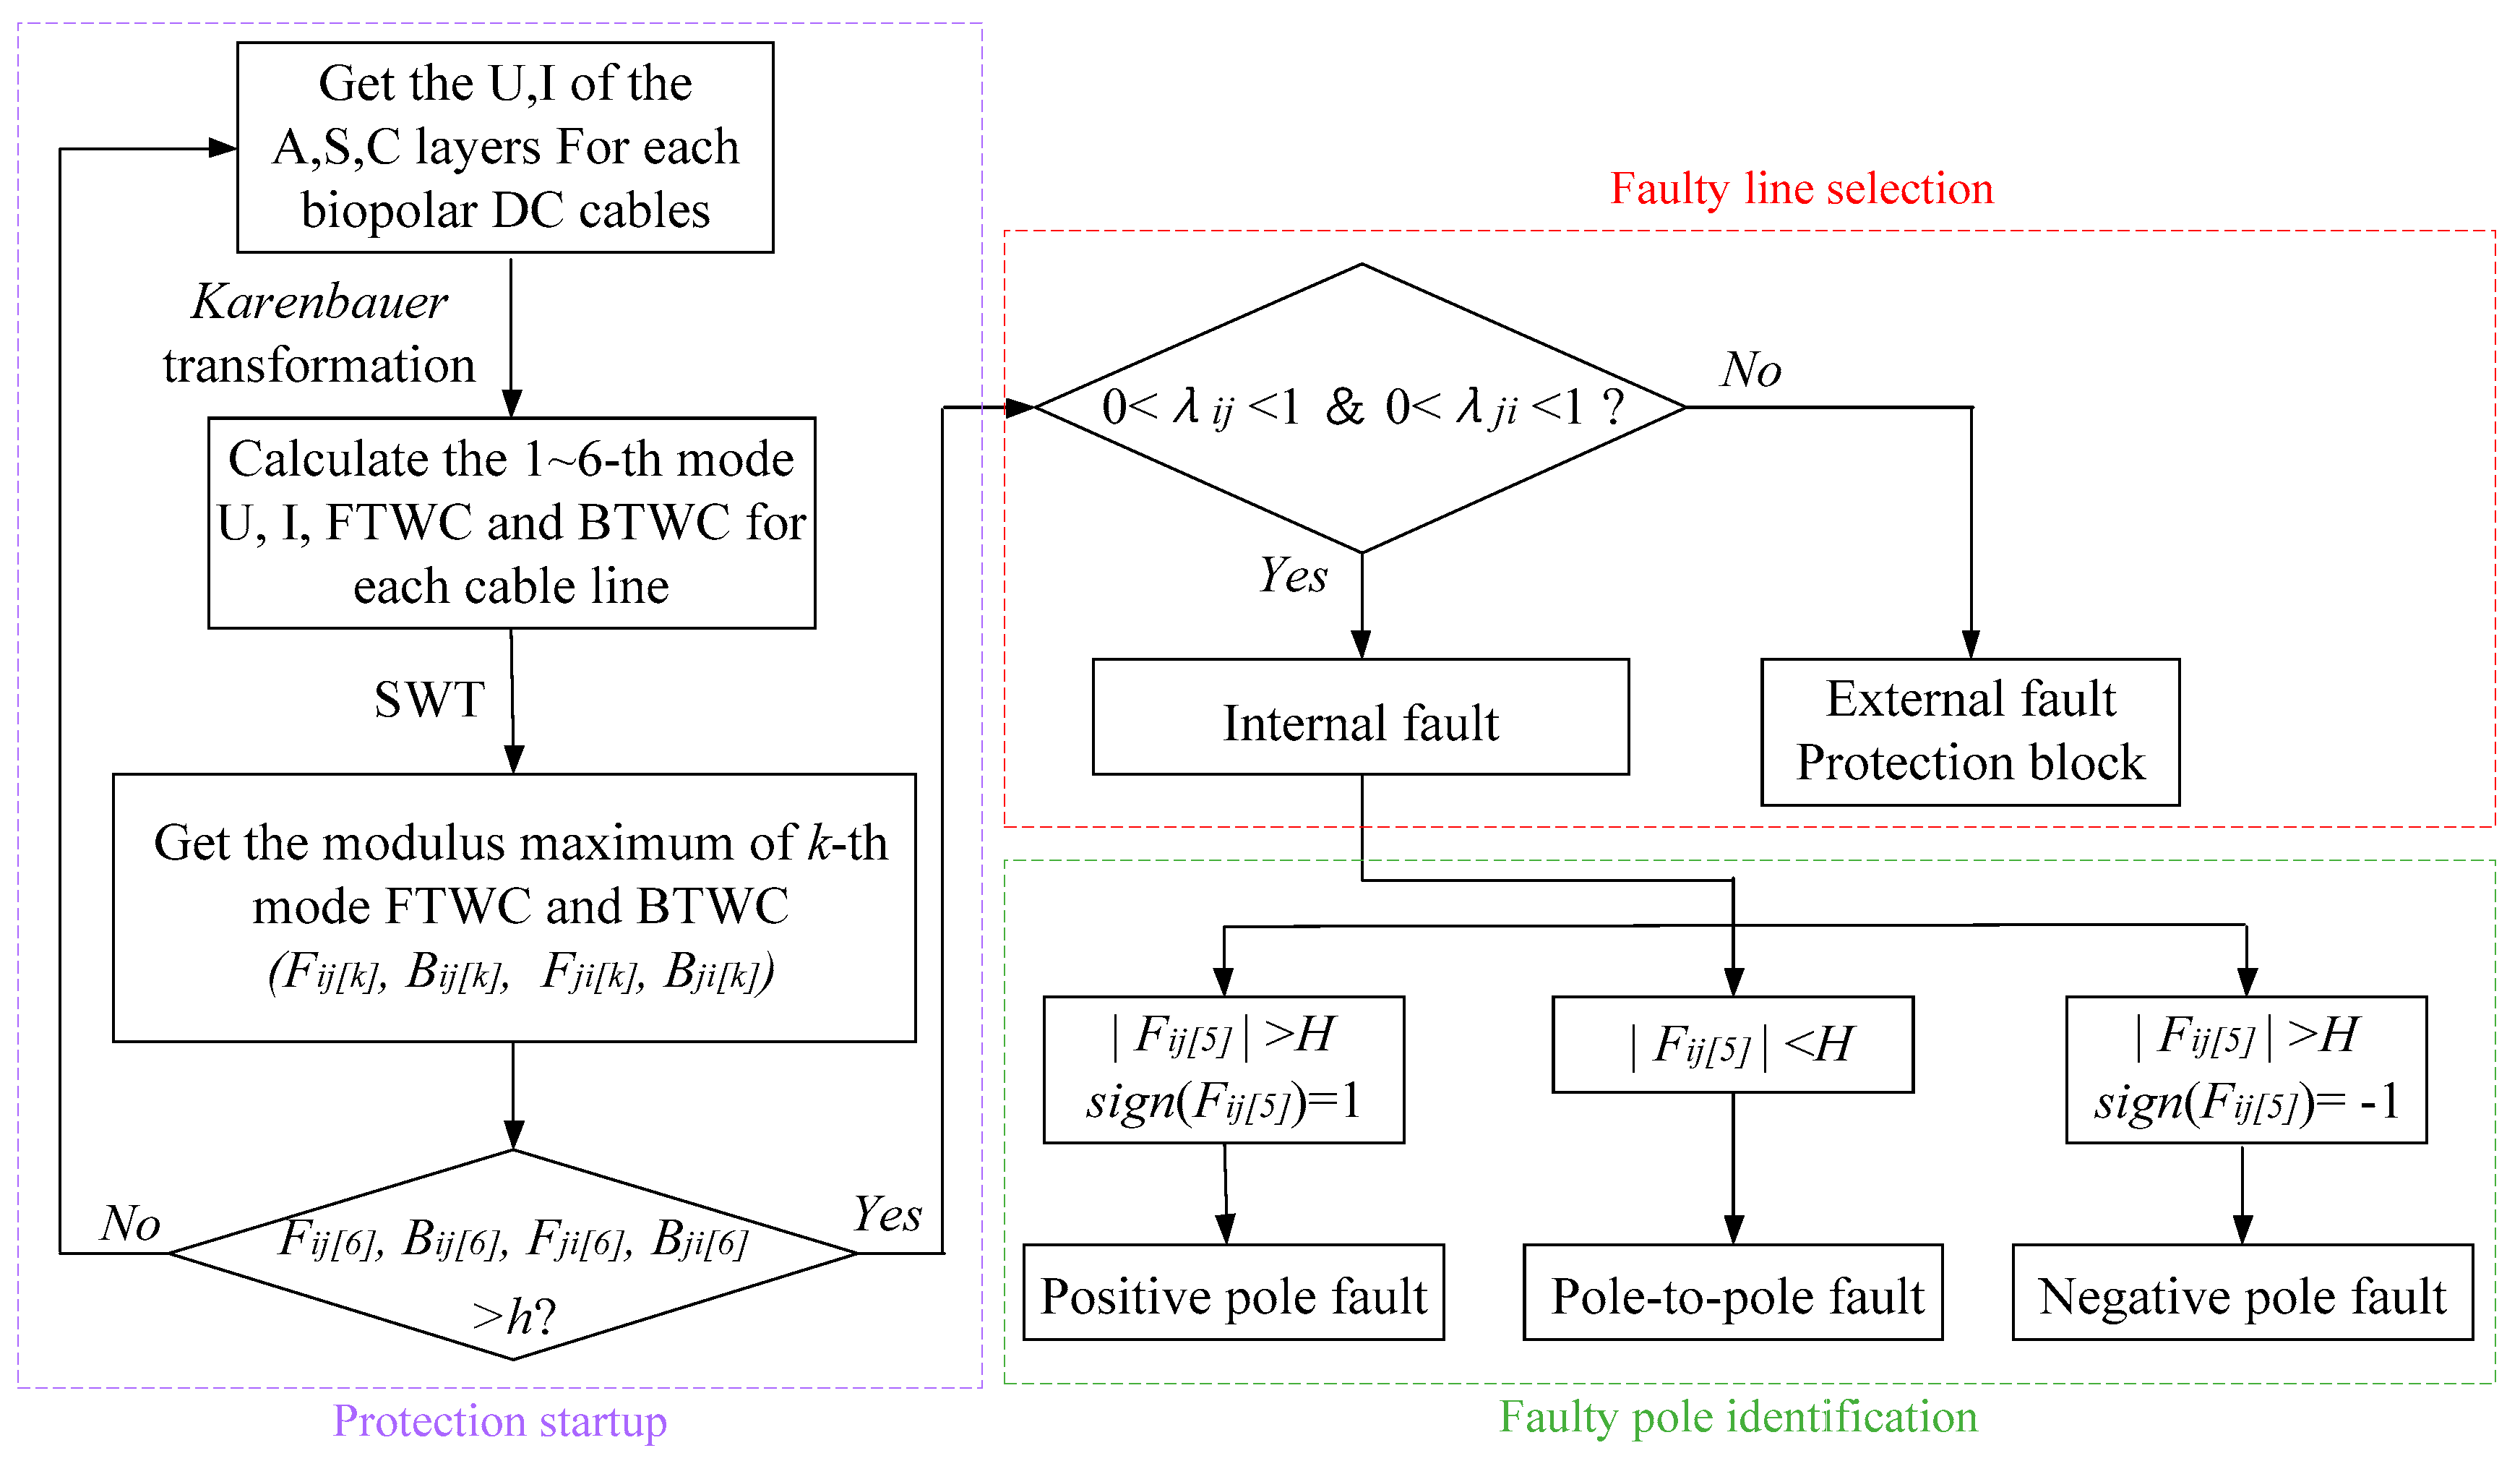
4 Protection Criterion

4.1. Fault-Line Determination Criterion

According to the fault travelling wave characteristic analysis and the SWT principle above, a four-terminal VSC-MTDC protection method is proposed in this section.
First, we can obtain the k-th mode FTWC ifij[k], ifji[k] and k-th mode BTWC ibij[k], ibji[k] of both terminals on line ij by Equations (13) and (14), in which the uij[k] and iij[k] represent for the k-th mode TW voltage and k-th mode TW current in line ij transformed by the proposed phase-mode transformation in Section 2.2.
{ i f i j [ k ] = u i j [ k ] / Z r [ k ] + i i j [ k ] i b i j [ k ] = u i j [ k ] / Z r [ k ] i i j [ k ]  
{ i f j i [ k ] = u j i [ k ] / Z r [ k ] + i j i [ k ] i b j i [ k ] = u j i [ k ] / Z r [ k ] i j i [ k ]  
Supposing Fij[k] and Fji[k] are the modulus maximum of k-th mode FTWC ifij[k] and ifji[k] on the terminal i and j, respectively. Similarly, Bij[k] and Bji[k] are the modulus maximum of k-th mode BTWC ibij[k] and ibji[k] on the terminal i and j, respectively.
Next, the following ratio is defined for convenience:
λ i j = ( F i j [ 6 ] B i j [ 6 ] ) 2  
Then, the fault-line selection criterion can be formed, as follows:
0 < λ i j < 1  and  0 < λ j i < 1
λ i j > 1  or  λ ji > 1
If Equation (16) is satisfied, then it indicates the occurrence of an internal fault in line ij. While if Equation (17) is satisfied, it indicates the occurrence of an external fault in line ij.
In order to ensure the reliability of the criterion and to overcome system disturbance and noise interference, threshold H is introduced to verification criterion
{ | F i j [ 6 ] | > H , | F j i [ 6 ] | > H | B i j [ 6 ] | > H , | B j i [ 6 ] | > H  

4.2. Fault-Pole Selection Criterion

In a bipolar MTDC grid, when a monopolar fault occurs on the DC line, the fault TW signal on the faulty pole line can be coupled to the healthy pole line due to the electromagnetic coupling. In order to isolate the faulty section of the grid, a faulty pole selective criterion is necessary. The result of the sign function 1 represents a positive polarity of fifth mode FTWC and −1 denotes a negative polarity. The faulty pole can be identified as the following criteria:
| F i j [ 5 ] | < H  
{ | F i j [ 5 ] | > H s i g n ( F i j [ 5 ] ) = 1  
If (19) is met, a pole-to-pole fault can be identified; if (20) is met, the positive pole is the faulty pole; or else, if (21) is met, the faulty pole is negative pole.
Based on the protection criterion above, a novel directional pilot protection utilizing the amplitude difference of fault initial FTWC and BTWC for VSC-MTDC cable line is formed. The flow chart of the method is shown in Figure 7.

5. Simulation and Analysis

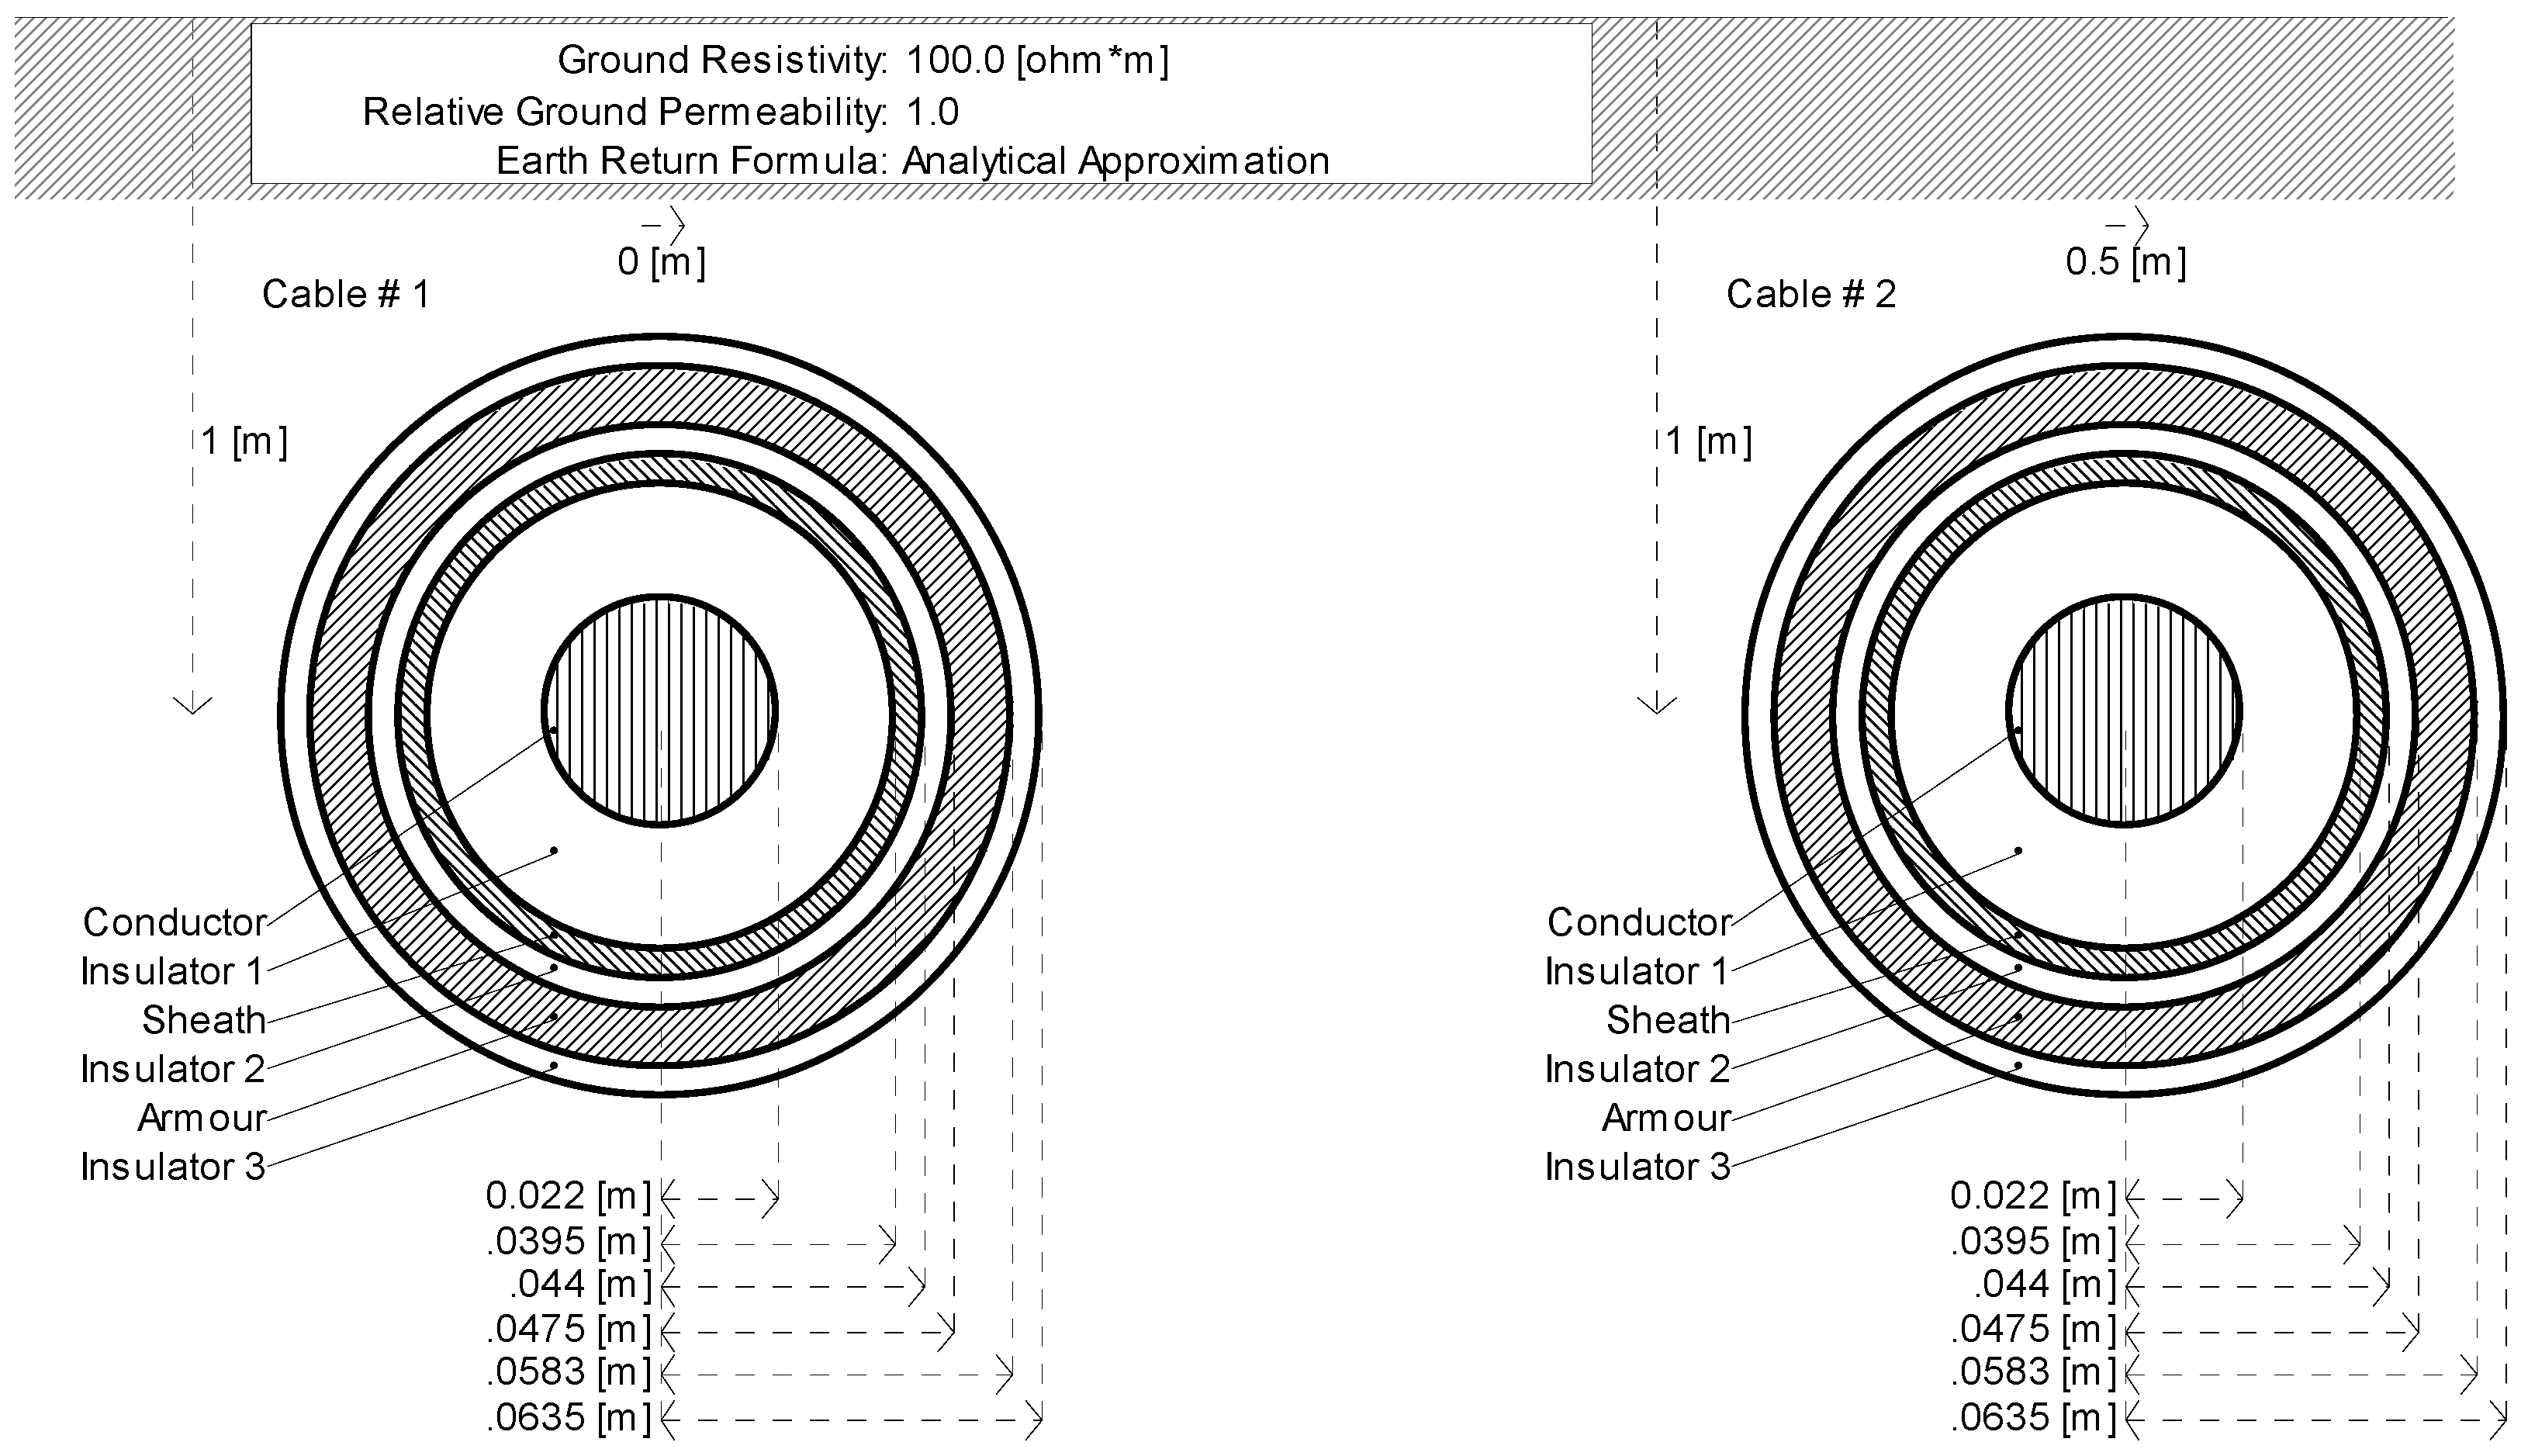
5.1. Simulation Model

In order to verify the validity of the proposed protection scheme, a four-terminal bipolar HVDC system that is based on two-level VSC is modeled in PSCAD, as shown in Figure 8. The rated voltages are ±200 kV and system capacity is 400 MW. The shunt capacitances of the positive and negative poles that are located at each line are 1000 μF and the sampling frequency is 100 kHz.
In Figure 8, the DC grid voltage of the VSC 2 and the active power of other converters are the reference values for corresponding control objects, the reactive power of each converters is controlled independently in this model. The bipolar DC cable lines are simulated based on the frequency-dependent model, their lengths are labeled in Figure 8, and its structure is shown in Figure 9. The time when the faults occur is set to 1.0 s and its duration time is set to 0.4 s. The db3 wavelet is adopted to the SWT. Taking the sensitivity and reliability of the protection criteria into consideration, the threshold H is set as 0.1 p.u.

5.2. Typical Fault Simulation

5.2.1. Positive Pole to Ground (PG) Fault

Without loss of generality, When a PG fault occurs at f1, 100 km away from D12, with a fault resistance of 0.01 Ω, the SWT modulus maxima of FTWC and BTWC for each terminal and the values of λij are shown in Table 1 and the waveforms of fifth mode FTWC in faulty line 12 detected by the fault-detection devices and their modulus maxima are shown in Figure 10.
As shown in Table 1, the ratio of sixth mode FTWC and BTWC at both terminals in segment L12 are both satisfy Equation (16). But for the cases of segments L13 and L24, those detected by D13 and D24 are both satisfy Equation (17), and so are D34 and D43. Thus, the segment L12 is judged as the faulted segment and the segments L13, L24, and L34 are determined as the non-fault segments in light of the fault-segment identification criterion.
As shown in Figure 10, the first modulus maxima of if12[5] and if21[5] marked by the black blocks represent for the appearance of FTWC head. Since the absolute values of the modulus maxima are all much larger than the threshold 0.1 and the polarities of F12[5] and F21[5] for both terminals are both positive, the positive pole is identified as the faulty pole.

5.2.2. Negative Pole to Ground (NG) Fault

When a NG fault occurs at f2, the middle of line 34, with a fault resistance of 0.01 Ω, the SWT modulus maxima of FTWC and BTWC for each terminal are shown in Table 2. The waveforms of fifth mode FTWC in faulty L34 and their modulus maxima are shown in Figure 11.
As displayed in Table 2, with Equation (16) satisfied, an internal fault in L34 can be judged primarily. In the same way, the analysis for other healthy lines is similar to Section 5.2.1. Therefore, the segment L34 is judged as the faulty line and the segments L12, L13 and L14 are determined as the healthy line.
As we can see from Figure 11, the first modulus maxima F34[5] and F43[5] marked by the black blocks represent for the appearance of FTWC head. The absolute values of modulus maxima F34[5] and F43[5] are obviously larger than the threshold 0.1 and the polarities of initial fifth mode FTWC are both negative. What needs to be clarified is that the fault point is at the middle of L34, so the waveform of i34 and i43 coincide in Figure 11. Therefore, no matter the fifth FTWC of i34 or i43 is used to identify the faulty pole, an internal NG fault in L34 can be distinguished reliably.

5.2.3. Bipolar Short-Circuit Fault

A bipolar short-circuit fault is set at f3, 60 km away from D24, with fault resistance of 0.01 Ω. The SWT modulus maxima of FTWC and BTWC for each terminal are shown in Table 3. The waveforms of fifth mode current TW in faulty line L24 and their modulus maxima are shown in Figure 12.
Seen from Table 3, the ratios of sixth mode FTWC and BTWC at both terminals in segment L24 are both satisfy Equation (16), and those for segment L12, L13, and L34 are both satisfy Equation (17), the segment L24 is determined as the faulted segment. As displayed in Figure 13, although there are slight fluctuations when fault occurs, the waveforms level off quickly and their corresponding modulus maxima F24[5] and F42[5] are both satisfy Equation (20), the fault type is identified as the bipolar short-circuit fault.

5.2.4. External Fault

When the external PN fault occurs at f4 on bus 3, with fault resistance of 1 Ω, the FITWC can be detected by all of the protection-detection device and the modulus maxima of FTWC and BTWC for each terminal are shown in Table 4. Obviously, the ratio of FTWC and BTWC for L12, L13, L24, and L34 are both satisfy Equation (17). Consequently, an external fault for four cable lines can be distinguished reliably.

5.3. Simulation for Influencing Factors

Numerous simulations were performed as follows to investigate the reliance of proposed protection scheme in this part.

5.3.1. Different Fault Resistances

Several NG faults with different fault resistances are set at f2. Table 5 shows that the absolute value of modulus maximum gradually decreases with the increase of fault resistance. When the fault resistance up to 400 Ω, the modulus maximum for L12, L13, and L24 are too small to be detected. Even so, different fault resistances cannot affect the fault-line selection and the fault-pole identification, indicating that the proposed protection scheme has strong tolerance of fault resistance.

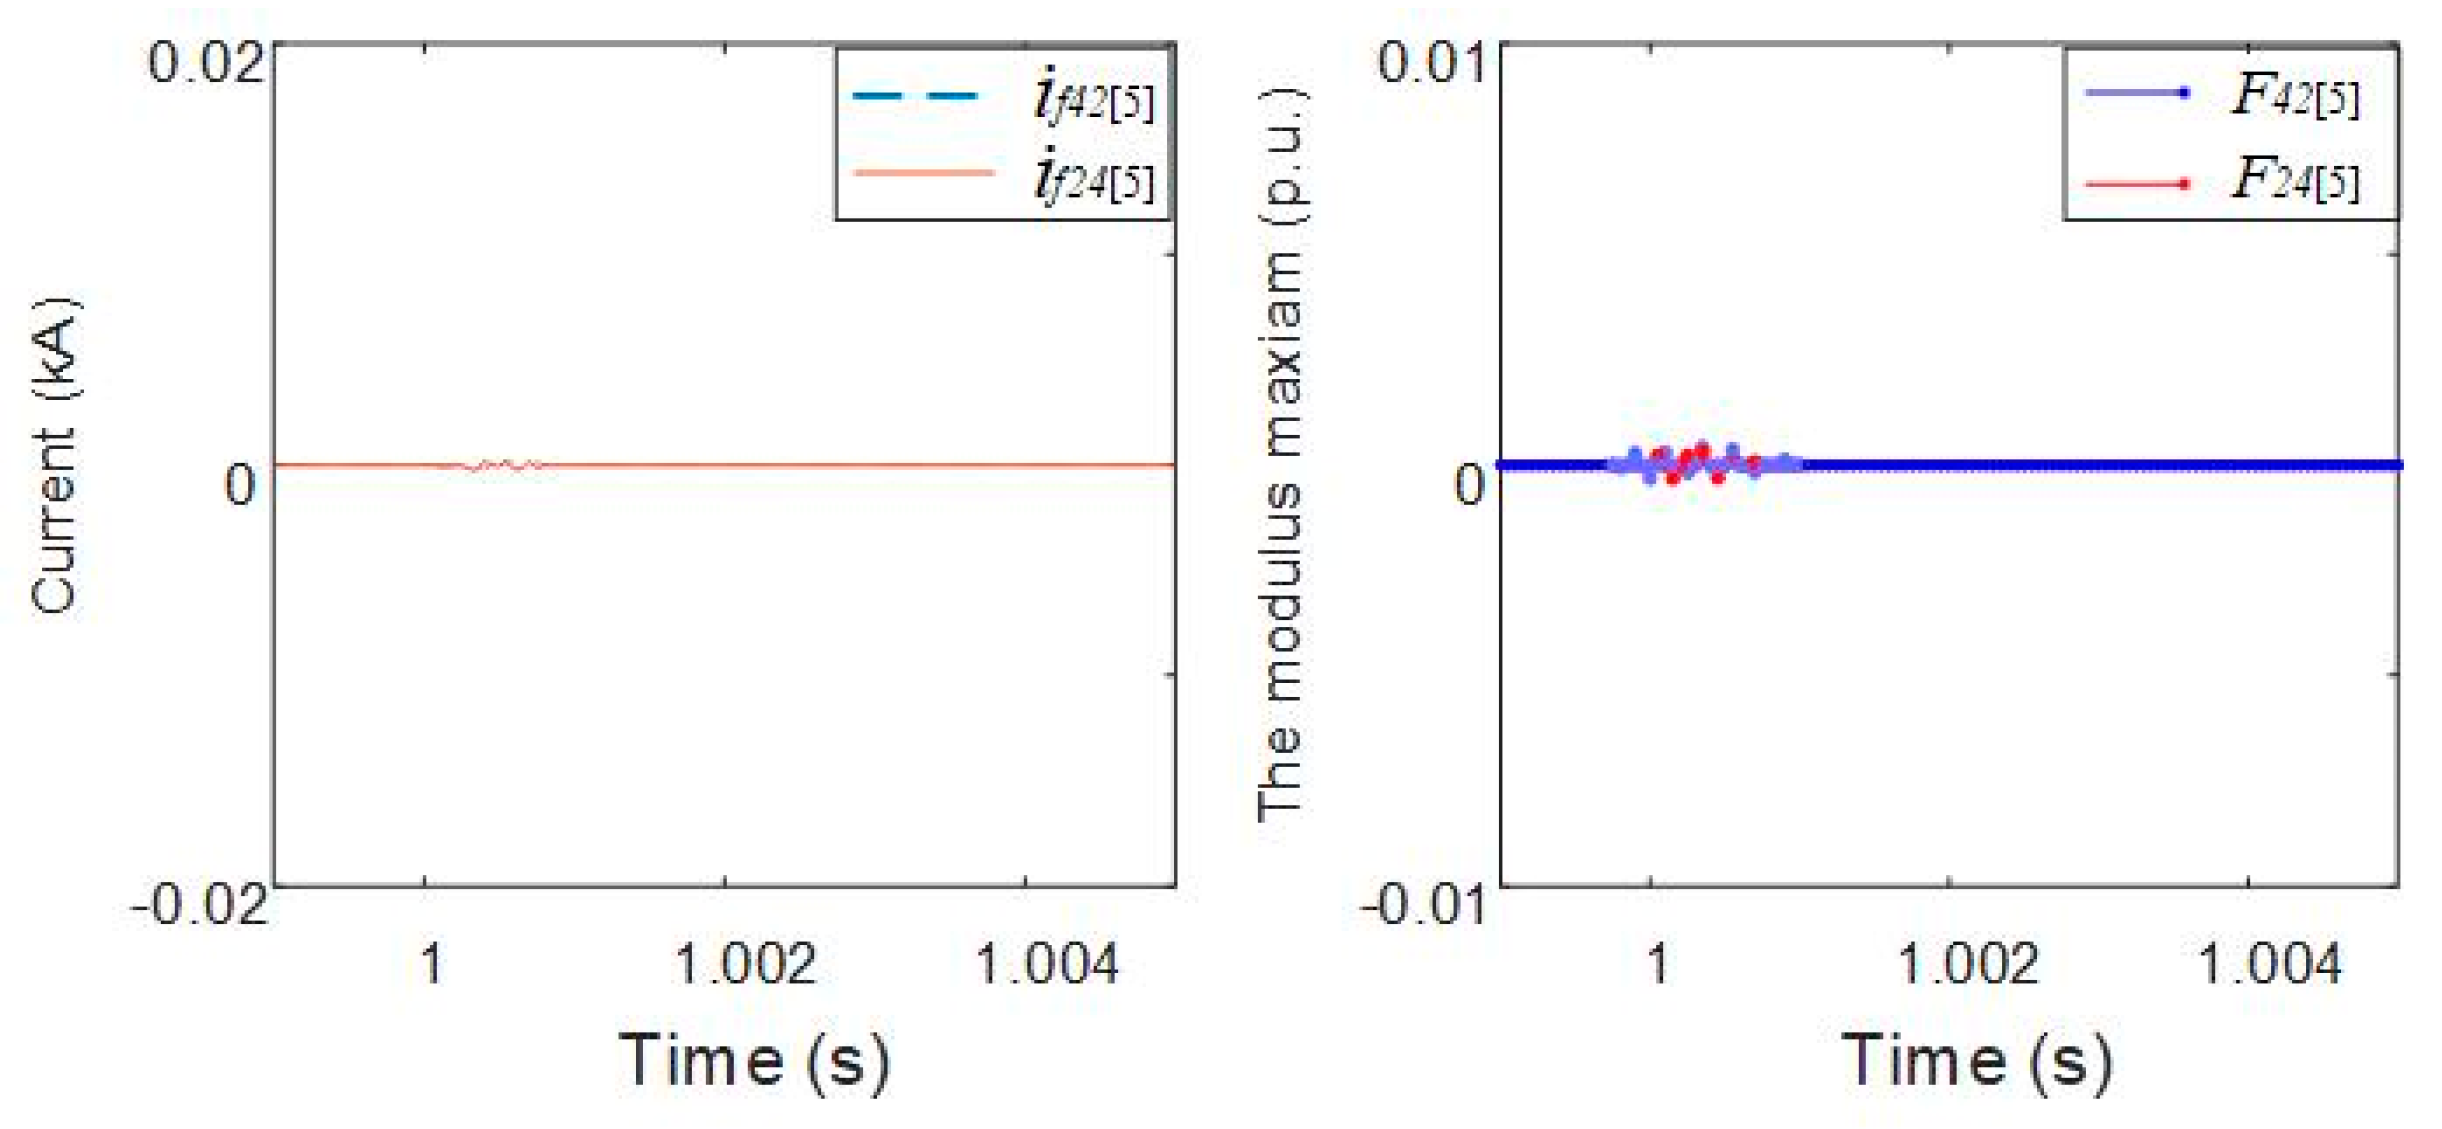
5.3.2. Influence of Noise Disturbance

Take D12, for example, to evaluate the security of the proposed protection, the simulation results for f1 fault with 40 dB Gaussian noises added are shown in Figure 13. The magnified view of the local details indicated by the arrow, which has an equal data window to the gray dotted frame, is a normal condition with 40 dB Gaussian noises added. According to the simulation results, though the noise disturbance influenced the current waveforms and the amplitude of modulus maxima, but F12[6] and B12[6] are both smaller than the threshold 0.1 when in normal operation and larger than 0.1 when the FCTW and BCTW is detected. As a result, the threshold H can ignore the noise disturbance reliably.

6. Conclusions

This paper proposes a novel directional pilot protection for VSC-MTDC frequency-varying cable lines, which utilizes the amplitude difference between sixth mode FTWC and BTWC to judge the faulty line and the polarity of fifth mode FTWC to identify the faulty pole. With a four-terminal VSC-MTDC system established in PSCAD/EMTDC, various faults while considering different fault conditions are simulated to verify the proposed protection method. The theoretical analysis and simulation results show that the protection method can distinguish the internal fault effectively, while the external fault and the disturbance can be ignored reliably. In addition, the algorithm is robust against noise, and it has been tested successfully for fault resistance of up to 400 Ω, which has important theoretical significance and engineering application value. Only state signal is sent to the other side, so low communication speed can meet the requirement of relay protection and it does not need the data synchronization seriously.

Author Contributions

This paper was a collaborative effort between the authors. All authors read and approved the final manuscript. The individual contributions can be stated as follows. Data curation, Q.C; Formal analysis, W.H.; Methodology, L.J.; Resources, P.Z.; Software, Y.Z.; Supervision, L.W.

Acknowledgments

There is no source of support for our research work.

Conflicts of Interest

The authors declare no conflict of interest.

References

  1. Flourentzou, N.; Agelidis, V.G.; Demetriades, G.D. VSC-Based HVDC power transmission systems: An overview. IEEE Trans. Power Electron. 2009, 24, 592–602. [Google Scholar] [CrossRef]
  2. Peralta, J.; Saad, H.; Dennetiere, S.; Mahseredjian, J.; Nguefeu, S. Detailed and averaged models for a 401-level MMC–HVDC system. IEEE Trans. Power Deliv. 2012, 27, 1501–1508. [Google Scholar] [CrossRef]
  3. Yang, Y.; Mao, C.; Wang, D.; Tian, J.; Yang, M. Modeling and analysis of the common mode voltage in a Cascaded H-Bridge Electronic Power Transformer. Energies 2017, 10, 1357. [Google Scholar] [CrossRef]
  4. Li, X.; Song, Q.; Liu, W.; Rao, H.; Xu, S.; Li, L. Protection of nonpermanent faults on DC overhead lines in MMC-Based HVDC systems. IEEE Trans. Power Deliv. 2012, 28, 483–490. [Google Scholar] [CrossRef]
  5. Tang, L.X.; Ooi, B.T. Locating and iolating DC faults in multi-terminal DC systems. IEEE Trans. Power Deliv. 2007, 22, 1877–1884. [Google Scholar] [CrossRef]
  6. De Kerf, K.; Srivastava, K.; Reza, M.; Bekaert, D.; Cole, S.; Van Hertem, D.; Belmans, R. Wavelet-based protection strategy for DC faults in multi-terminal VSC HVDC systems. IET Gener. Transm. Distrib. 2011, 5, 496–503. [Google Scholar] [CrossRef]
  7. Naidoo, D.; Ijumba, N.M. HVDC line protection for the proposed future HVDC systems. In Proceedings of the International Conference on Power System Technology, Singapore, 21–24 November 2004; Volume 2, pp. 1327–1332. [Google Scholar]
  8. Liu, X.; Osman, A.H.; Malik, O.P. Hybrid traveling wave/boundary protection for monopolar HVDC line. IEEE Trans. Power Deliv. 2009, 24, 569–578. [Google Scholar] [CrossRef]
  9. Song, G.; Cai, X.; Gao, S.; Suonan, J.; Li, G. Novel current differential protection principle of VSC-HVDC considering frequency-dependent characteristic of cable line. Proc. CSEE 2011, 31, 105–111. (In Chinese) [Google Scholar]
  10. Ha, H.X.; Yu, Y.; Yi, R.P.; Bo, Z.Q.; Chen, B. Novel scheme of travelling wave based differential protection for bipolar HVDC transmission lines. In Proceedings of the 2010 International Conference on Power System Technology, Hangzhou, China, 24–28 October 2010. [Google Scholar]
  11. Wang, L.; Chen, Q.; Xi, C. Study on the travelling wave differential protection and the improvement scheme for VSC-HVDC transmission lines. In Proceedings of the 2016 IEEE PES Asia-Pacific Power and Energy Engineering Conference (APPEEC), Xi’an, China, 25–28 October 2016. [Google Scholar]
  12. Zhao, P.; Chen, Q.; Sun, K. A novel protection method for VSC-MTDC cable based on the transient DC current using the S transform. Int. J. Electr. Power Energy Syst. 2018, 97, 299–308. [Google Scholar] [CrossRef]
  13. Jin, X.; Song, G.; Ma, Z. A novel pilot protection for VSC-HVDC transmission lines based on parameter identification. In Proceedings of the 12th IET International Conference on Developments in Power System Protection (DPSP 2014), Copenhagen, Denmark, 31 March–3 April 2014. [Google Scholar]
  14. Zheng, X.; Tai, N.; Wu, Z.; Thorp, J. Harmonic current protection scheme for voltage source converter-based high-voltage direct current transmission system. IET Gener. Transm. Distrib. 2014, 8, 1509–1515. [Google Scholar] [CrossRef]
  15. Song, G.; Cai, X.; Gao, S.; Suonan, J.; Li, G. Natural frequency based protection and fault location for VSC-HVDC transmission lines. In Proceedings of the 2011 International Conference on Advanced Power System Automation and Protection, Beijing, China, 16–20 October 2011. [Google Scholar]
  16. Zou, G.; Feng, Q.; Huang, Q.; Sun, C.; Gao, H. A fast protection scheme for VSC based multi-terminal DC grid. Electr. Power Energy Syst. 2018, 98, 307–314. [Google Scholar] [CrossRef]
  17. Zhang, S.; Zou, G.; Huang, Q.; Gao, H. A Traveling-Wave-Based Fault Location Scheme for MMC-Based Multi-Terminal DC Grids. Energies 2018, 11, 401. [Google Scholar] [CrossRef]
  18. Chang, B.; Cwikowski, O.; Barnes, M.; Shuttleworth, R.; Beddard, A.; Coventry, P. Review of different fault detection methods and their impact on pre-emptive VSC-HVDC dc protection performance. High Volt. 2018, 2, 211–219. [Google Scholar] [CrossRef]
  19. Xing, L.H.; Chen, Q.; Xue, B.L. A Fault Location Method for HVDC Transmission Lines. Appl. Mech. Mater. 2014, 556–562, 2723–2727. [Google Scholar] [CrossRef]
  20. Habib, S.; Kordi, B. Calculation of Multiconductor Underground Cables High-Frequency Per-Unit-Length Parameters Using Electromagnetic Modal Analysis. IEEE Trans. Power Deliv. 2013, 28, 276–284. [Google Scholar] [CrossRef]
  21. Li, B.; Zhang, Y. Calculation Method of Equivalent Core Impedance and Admittance Parameters of 3-Phase Single-Core Power Cable. J. Tianjin Univ. Sci. Technol. 2016, 49, 1144–1150. [Google Scholar]
  22. Zhao, P.; Chen, Q.; Sun, K.; Xu, C. A Current Frequency Component-Based Fault-Location Method for Voltage-Source Converter-Based High-Voltage Direct Current (VSC-HVDC) Cables Using the S Transform. Energies 2017, 10, 1115. [Google Scholar] [CrossRef]
  23. Song, G.; Cai, X.; Gao, S. Directional element for VSCHVDC transmission lines based on model identification. Power Syst. Prot. Control 2012, 40, 78–83. [Google Scholar]
Figure 1. (a) Stationary Wavelet Transform (SWT) decomposition tree. (b) SWT filters.
Energies 11 02021 g001
Figure 2. The cross section of positive cable terminal.
Energies 11 02021 g002
Figure 3. Attenuation constants and propagation velocities of each mode currents. (a) Attenuation constants. (b) Propagation velocities.
Energies 11 02021 g003
Figure 4. (a) Fault component additional network of Voltage Source Converter-High Voltage Direct Current (VSC-HVDC). (b) Simplified fault component additional network.
Energies 11 02021 g004
Figure 5. Propagation and reflection of fault initial traveling wave current (FITWC). (a) An internal fault occurs. (b) An external fault occurs.
Energies 11 02021 g005
Figure 6. Schematic diagram of VSC based four-terminal DC grid.
Energies 11 02021 g006
Figure 7. Flow chart of the proposed fault location scheme.
Energies 11 02021 g007
Figure 8. Fault simulation model.
Energies 11 02021 g008
Figure 9. The structure of bipolar DC cable lines.
Energies 11 02021 g009
Figure 10. Simulation results of fifth mode FTWC.
Energies 11 02021 g010
Figure 11. Simulation results of fifth mode FTWC when a pole to ground (PG) fault at L34.
Energies 11 02021 g011
Figure 12. Simulation results of fifth mode FTWC for f3 fault.
Energies 11 02021 g012
Figure 13. Simulation results of for f1 fault with 40 dB Gaussian noises added.
Energies 11 02021 g013
Table 1. Identification results of faulted segment for f1 fault.
Line ijFij[6]Bij[6]Fji[6]Bji[6]λijλjiIdentification Result
L123.831 −3.858 4.890 −4.928 0.986 0.985 Fault segment
L13−0.868 0.304 0.538 −0.544 8.153 0.978 Normal
L24−1.100 0.431 0.831 −0.855 6.514 0.945 Normal
L34−0.498 −0.308 −0.697 −0.178 2.614 15.333 Normal
Table 2. Identification results of faulted segment for f2 fault.
Line ijFij[6]Bij[6]Fji[6]Bji[6]λijλjiIdentification Result
L12−0.317 −0.212 −0.496 −0.196 2.236 6.404 Normal
L130.433 −0.449 −0.799 0.173 0.930 21.331 Normal
L240.642 −0.655 −0.807 0.375 0.961 4.631 Normal
L343.851 −3.862 3.849 −3.855 0.994 0.997 Fault segment
Table 3. Identification results of faulted segment for f3 fault.
Line ijFij[6]Bij[6]Fji[6]Bji[6]λijλjiIdentification Result
L120.422 −0.438 −0.943 0.188 0.928 25.160 Normal
L13−0.387 −0.341 −0.688 −0.167 1.288 16.972 Normal
L245.541 −5.583 6.722 −6.794 0.985 0.979 Fault segment
L340.814 −0.839 −1.197 0.332 0.941 12.999 Normal
Table 4. Identification results of faulted segment for f4 fault.
Line ijFij[6]Bij[6]Fji[6]Bji[6]λijλjiIdentification Result
L12−0.7880.2130.482−0.49713.6870.941Normal
L133.108−3.141−4.9152.1760.9795.102Normal
L24−0.179−0.227−0.599−0.1060.62231.933Normal
L34−4.9031.3362.436−2.49713.4680.952Normal
Table 5. Simulation results of modulus maxima with different fault resistances at f2 fault.
Fault ResistanceLine ijFij[6]Bij[6]Fji[6]Bji[6]λijλjiFij[5]Identification Result
10 ΩL12−0.259 −0.174 −0.445 −0.143 2.216 9.684 Normal
L130.390 −0.402 −0.753 0.128 0.941 34.607 Normal
L240.599 −0.607 −0.747 0.322 0.974 5.382 Normal
L343.806 −3.813 3.804 −3.811 0.996 0.996 4.788 Internal NG fault
200 ΩL12 −0.142 Normal
L130.125 −0.129 −0.241 0.941 Normal
L240.192 −0.194 −0.239 0.103 0.974 5.382 Normal
L341.522 −1.525 1.522 −1.524 0.996 0.996 1.924Internal NG fault
400 ΩL12 Normal
L13 Normal
L24 Normal
L340.251 −0.252 0.251 −0.252 0.996 0.996 0.282Internal NG fault

