Article

Artificial Neural Network-Based Decision Support System for Development of an Energy-Efficient Built Environment

1
Department of Construction Management and Real Estate, Faculty of Civil Engineering, Vilnius Gediminas Technical University, Saulėtekio al. 11, LT-10223 Vilnius, Lithuania
2
Institute of Mathematics and Informatics, Vilnius University, Akademijos str. 4, LT-08663 Vilnius, Lithuania
3
Belarusian State Technological University, Sverdlova str. 13a, 220006 Minsk, Belarus
*
Author to whom correspondence should be addressed.
Energies 2018, 11(8), 1994; https://doi.org/10.3390/en11081994
Submission received: 3 July 2018 / Revised: 25 July 2018 / Accepted: 26 July 2018 / Published: 1 August 2018

Abstract

:
Implementing energy-efficient solutions in a built environment is important for reaching international energy reduction targets. For advanced energy efficiency-related solutions, computer-based decision support systems are proposed and rapidly used in a variety of spheres relevant to a built environment. Present research proposes a novel artificial neural network-based decision support system for development of an energy-efficient built environment. The system was developed by integrating methods of the multiple criteria evaluation and multivariant design, determination of project utility and market value, and visual data mining by artificial neural networks. It enables a user to compose up to 100,000,000 combinations of the energy-efficient solutions, analyze strengths and weaknesses of a built environment projects, provide advice for stakeholders, and calculate market value and utility degree of the projects. For visual data mining, self-organizing maps (type neural networks) are used, which may influence the choosing of the final set of alternatives and criteria in the decision-making problem, taking into account the discovered similarities of alternatives or criteria. A system was validated by the real case study on the design of an energy-efficient individual house.

1. Introduction

At the global level, buildings and the construction industry together consume about 36% of energy and generate 39% of related carbon dioxide (CO2) emissions (taking into account electricity production) [1]. The European Union (EU) aims to achieve 20% energy savings by 2020 (compared with the projected energy use in 2020). Its target is to reduce primary energy consumption at least to 1483 million tons of an oil equivalent (Mtoe) and a final energy consumption at least to 1086 Mtoe in 2020. In 2016, primary energy consumption in the EU was 4% off the efficiency target [2].
To reduce final energy consumption and to achieve the intended targets, stakeholders (governmental institutions, construction and real estate business enterprises, households, individuals) have to modify a built environment by substantial means and search for new energy-efficiency improvement solutions.
Implementing the energy-efficient solutions in a built environment is important for reaching energy reduction targets. Therefore, the European Commission has introduced the Energy Performance of Buildings Directive (EPBD). The EPBD aims to significantly increase investments in energy-efficiency measures within building sector [3]. Besides, local governments worldwide already apply various measures to encourage energy-efficiency oriented behavior: obligations, grants, pricing/taxation, infrastructure/facilities (e.g., provision of recycling facilities), incentives and penalties, provision of information/education, community involvement, personal involvement, recognition, social pressure, and media/marketing.
Energy is important in each individual’s everyday life, which in turn has an impact on the achievement of the energy policy objectives at national and international levels. Habitants are among the largest energy consumers in most countries. Therefore, households are encouraged to use resources reasonably and to reduce final energy consumption in order to achieve multifold benefits, that is, to diminish energy costs and emissions and to stimulate markets to provide new and improved solutions [4].
Recently, the growing interest in an energy-efficient built environment has led to an increase of related research. Many studies include an economic assessment of energy-related measures and their optimizations [5,6,7,8,9,10], including cost-benefit analysis techniques [11]. For advanced energy efficiency-related solutions, computer-based decision support systems are proposed and rapidly used in a variety of spheres relevant to a built environment [12]. Labonnote et al. [13] emphasize the importance of decision support systems in achieving more sustainable and more intelligent constructions as they “integrate a selection of processes, constraints, time span, and performance criteria that are relevant to all involved stakeholders”. Authors [13] classify emerging decision support frameworks into four categories, namely, multi-process simulation tools, sensitivity analyses, multi-criteria optimization systems, and design space exploration methods. However, recent developments in technology allow integration of different approaches for the development of “more intelligent” decision support systems. Examples include an integrated use of multiple criteria optimization methods, geographic information systems (GIS), artificial neural networks (ANNs), data mining techniques, biometrics, intelligent agents, and sensors (refer to the literature [14] for detail review).
Present research focuses on the integration of methods of the multiple criteria evaluation and multivariant design [15], project utility and investment value assessment [16], and visual data mining by ANNs [17]. The aim is to develop a novel decision support system for selection of the energy-efficient built environment solutions.
There are many valuable studies in scientific literature related to the subject of research. A summary of the state-of-the-art proposed decision support systems is presented in Table 1.
It is observed that decision support systems perform many energy-related functions; namely, selection of scenarios for buildings‘ retrofit in terms of energy savings and carbon emissions [18,19,21,23,24,25,27,28,42], energy efficiency optimization of street lighting [20], assessment of energy performance of buildings [22,31], selection of energy management actions [29] and low-cost green building materials and components [30], spatial environmental assessment [32,33], energy demand prediction and optimization [34,35,36,37], assessment of energy generation technologies [38] and construction projects [40], designing of the most efficient versions of a passive house [39] and intelligent built environment [41].
Various methods are applied to implement the functions mentioned above: multiple criteria evaluation [20,22,23,26,27,28,30,31,32,33,38,39,40,41,42], GIS-based modelling [18,27,32,33], multivariant design or development of scenarios [18,19,28,39,41,42], and cost optimization [21,23,24,28,29,30,31,36,37,38,39,40,41,42]. However, these methods are rarely used in an integrated manner. Some of the decision support systems that had been previously developed by Kaklauskas and co-authors [38,39,40,41,42] integrate methods of multiple criteria evaluation, multivariant design, determination of project utility, and market value; however, to the best knowledge of authors, ANNs have never been integrated with these methods.
Some authors [24,25,34,35,36,37] propose artificial neural networks (ANNs) for energy demand prediction and optimization. For instance, Beccali et al. [24] applied ANNs for energy and economic evaluation of the best refurbishment actions. Muralitharan et al. [19] have developed a novel approach based on neural network optimization to predict energy demand in smart grid [34]. Deb et al. [35] employed ANNs to assess possible heating, ventilation, and air conditioning energy savings in cases of 56 retrofitted office buildings. Teich et al. [36] proposed a neural network based subsystem that provides personalized services for smart homes. Studies proved accuracy of ANN-based prediction compared with multiple linear regression [35] and stability of neural network-based solutions [36]. However, it is observed that in these studies, ANNs are not integrated with the multiple criteria evaluation and multivariant design methods.
In summary, an analysis of the available decision-support systems and approaches reveals that the researchers from different countries investigate energy-efficient solutions for the development of built environment; however, studies rarely analyze a life cycle, alternative energy-efficiency improvement solutions, requirements of stakeholders, and external and internal influencing environmental factors in an integrated manner. Moreover, artificial neural networks are seldom incorporated into multiple criteria-based decision-support tools. To fill this gap, authors propose an original artificial neural network-based decision support system for development of an energy-efficient built environment (NANSEN). This system was developed during the implementation of the Intelligent Energy Europe project “Master and Post Graduate education and training in multidisciplinary teams implementing EPBD and beyond” (IDES-EDU) [43] and currently is used for educational purposes [44,45].
The structure of present publication is as follows. Section 2 describes a methodology, proposes a model for selection of the energy-efficiency improvement solutions and introduces a NANSEN system. A case study and simulation results are presented in Section 3. Discussion, including limitations and insights for the future research, is provided in Section 4. General conclusions are presented in Section 5.

2. Materials and Methods

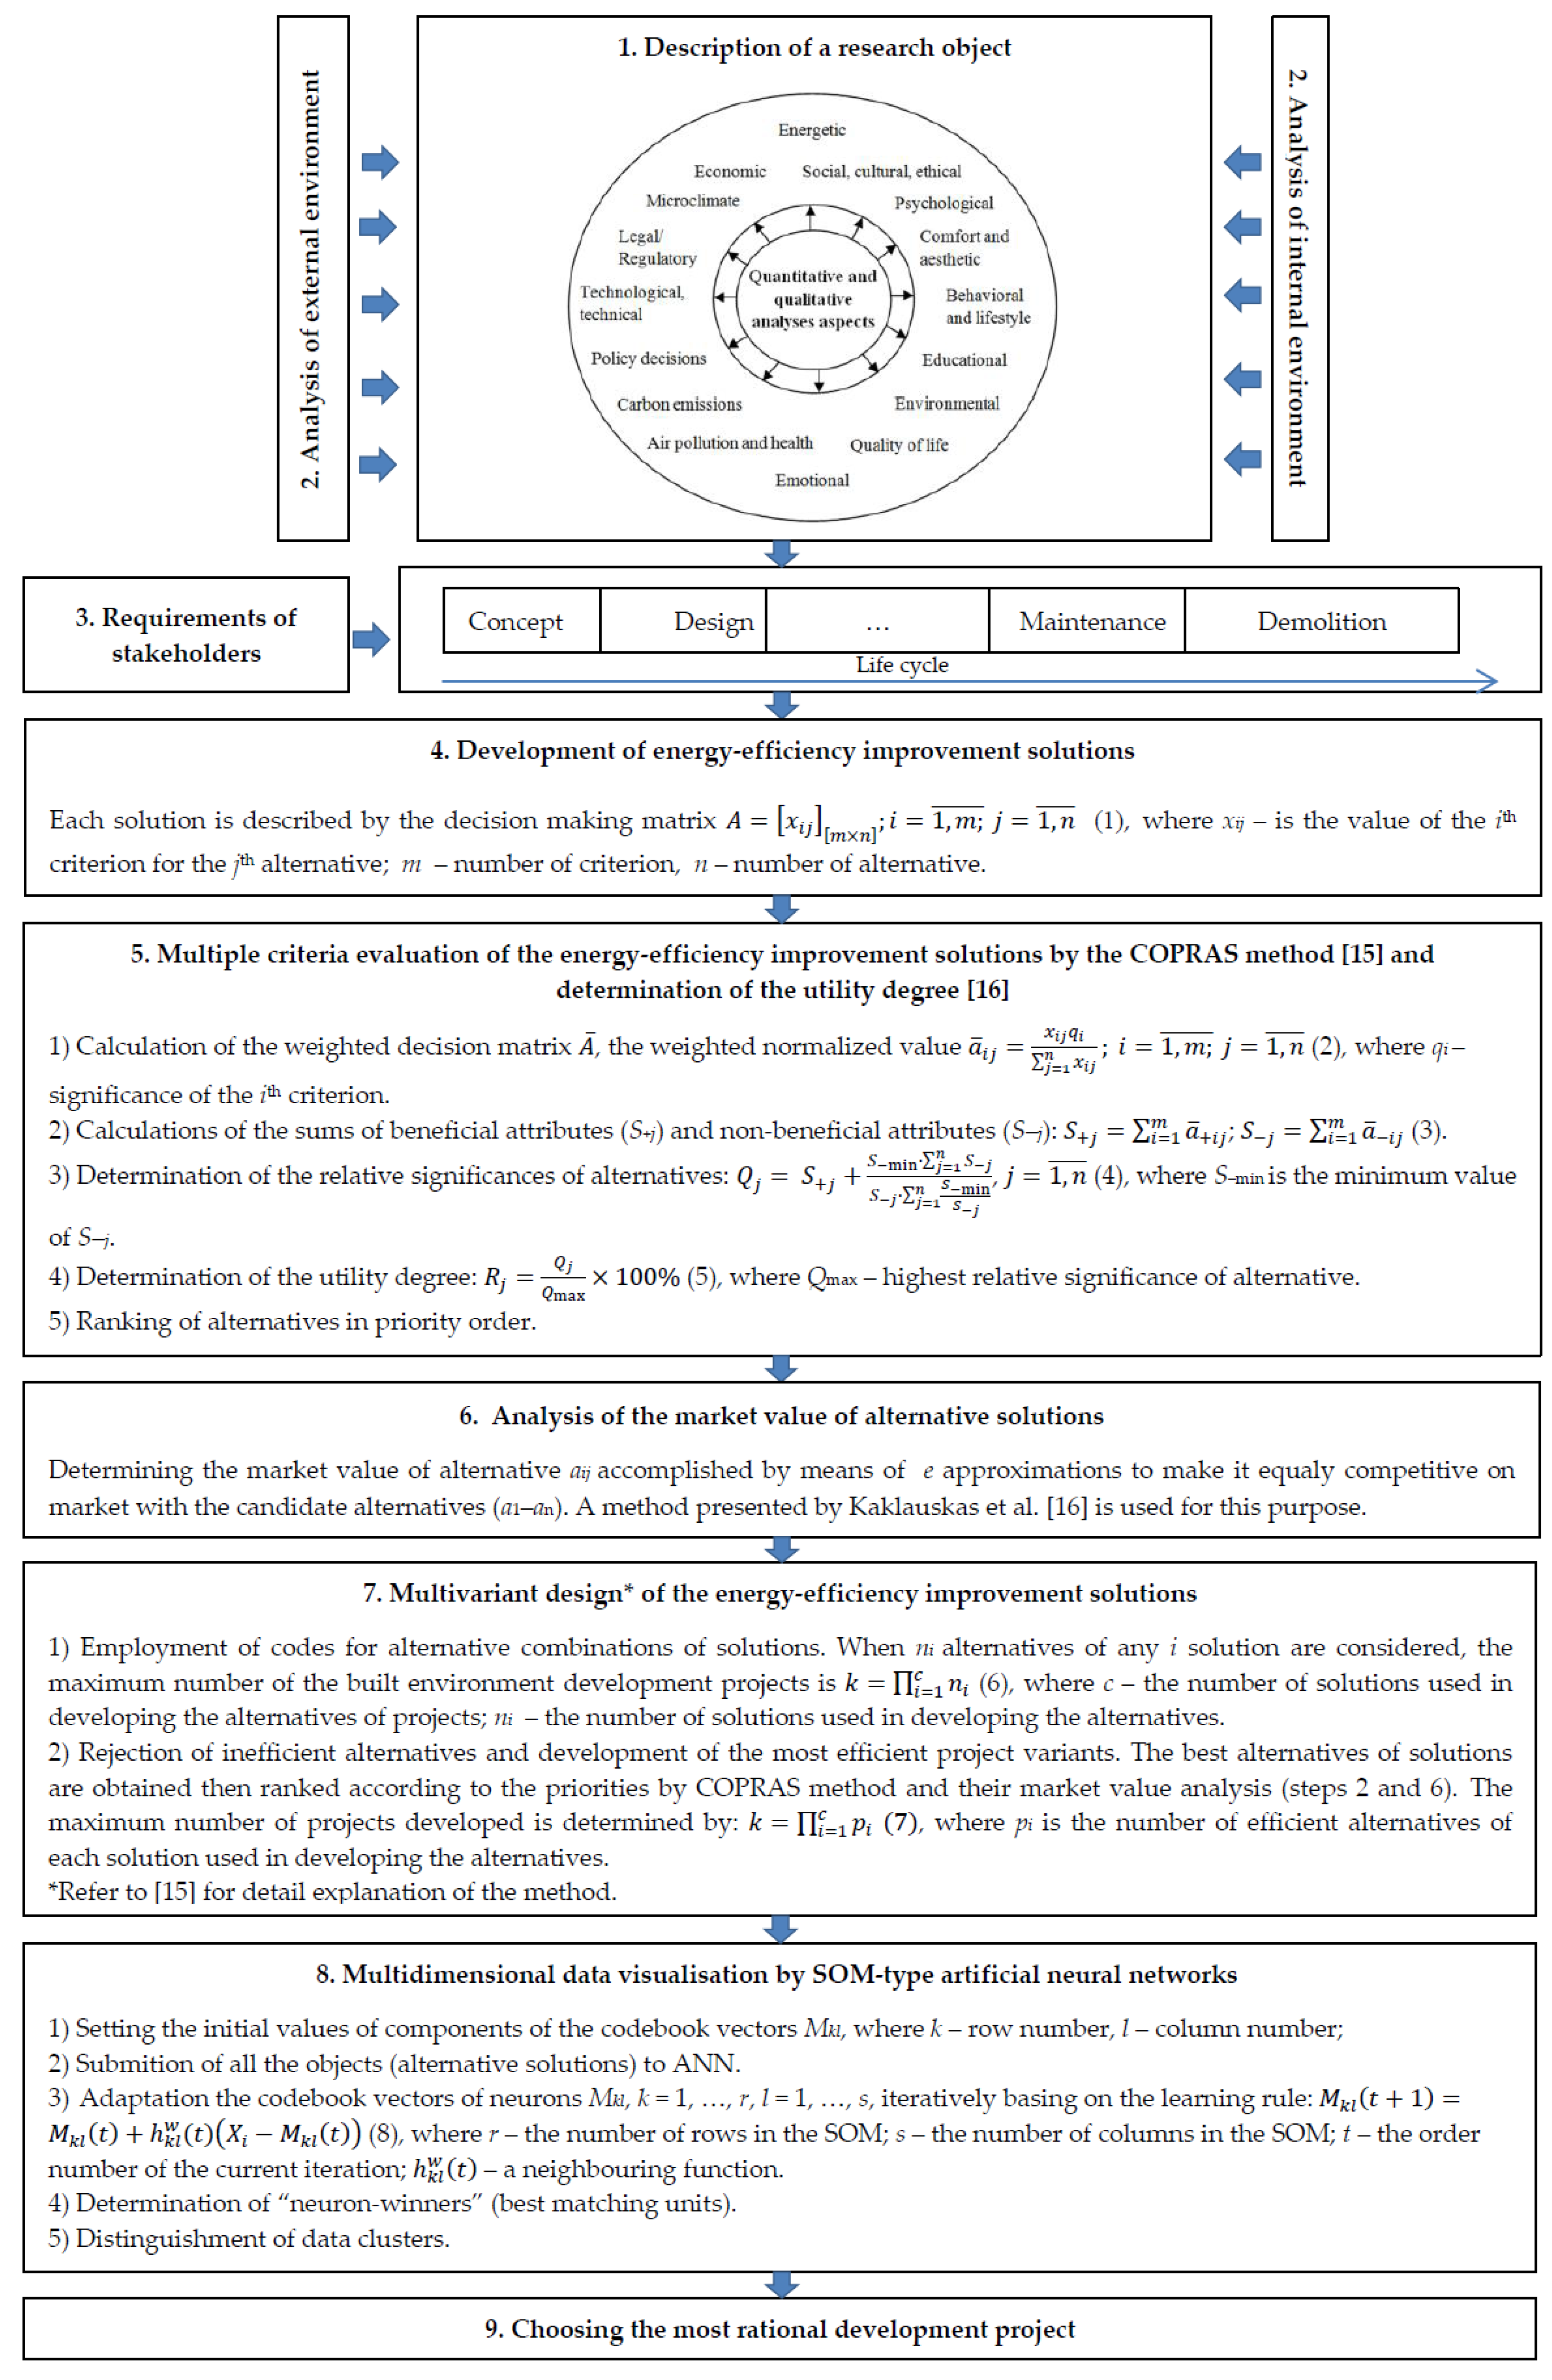
2.1. A Model for Selection of the Energy-Efficiency Improvement Solutions

The effectiveness of energy-efficient built environment development solutions shall be considered throughout the entire life cycle, from the conceptual and design stages to construction, operation, maintenance, demolition, and utilization. The entire built environment development process shall be planned and implemented in line with stakeholder aims; moreover, factors influencing the external and internal environments (micro, meso, and macro levels) must be estimated. Therefore, selection of the most rational energy-efficiency improvement solutions is considered as a multidimensional problem. To solve this problem, an original model for selection of energy-efficiency improvement solutions (hereafter, A Model) was developed by the authors of this present publication (see Figure 1). A Model involves the following steps:
  • Comprehensive description of a research object in quantitative and conceptual manners.
  • Study of the influencing environmental factors by PEST (analysis of political, economic, social, and technological factors), SWOT (analysis of strengths, weaknesses, opportunities, and threats) or other similar approaches.
  • Determination of requirements of stakeholders by means of surveys.
  • Development of energy-efficiency improvement solutions and description of alternatives by valuation criteria, their significances, and values.
  • Multiple criteria evaluation of the energy-efficiency improvement solutions by the COPRAS (complex pro-portional assessment) method (refer to the literature [15] for detail description).
  • Analysis of the market value of alternative solutions using the method proposed by Kaklauskas et al. [16].
  • Multivariant design of energy-efficiency improvement solutions by the method presented in the literature [15]—development of combinations of individual solutions into the projects and their evaluation by the COPRAS method.
  • Multidimensional data visualization by artificial neural networks (ANNs) (see Section 2.2.3 for more detail explanation).
  • Choice of the most rational development project.
A Model is dedicated to stakeholders who are involved in the design and development processes of an energy-efficient built environment. Based on this model, stakeholders can develop many alternative versions of the projects, assess them, and make a final choice of the most rational one.
Indeed, practical implementation of A Model may be complicated because of an extensive amount of data that needs to be analyzed, as well as difficult calculation procedures. For these purposes, authors propose an IT-based tool, the NANSEN system, which is further described in Section 2.2.

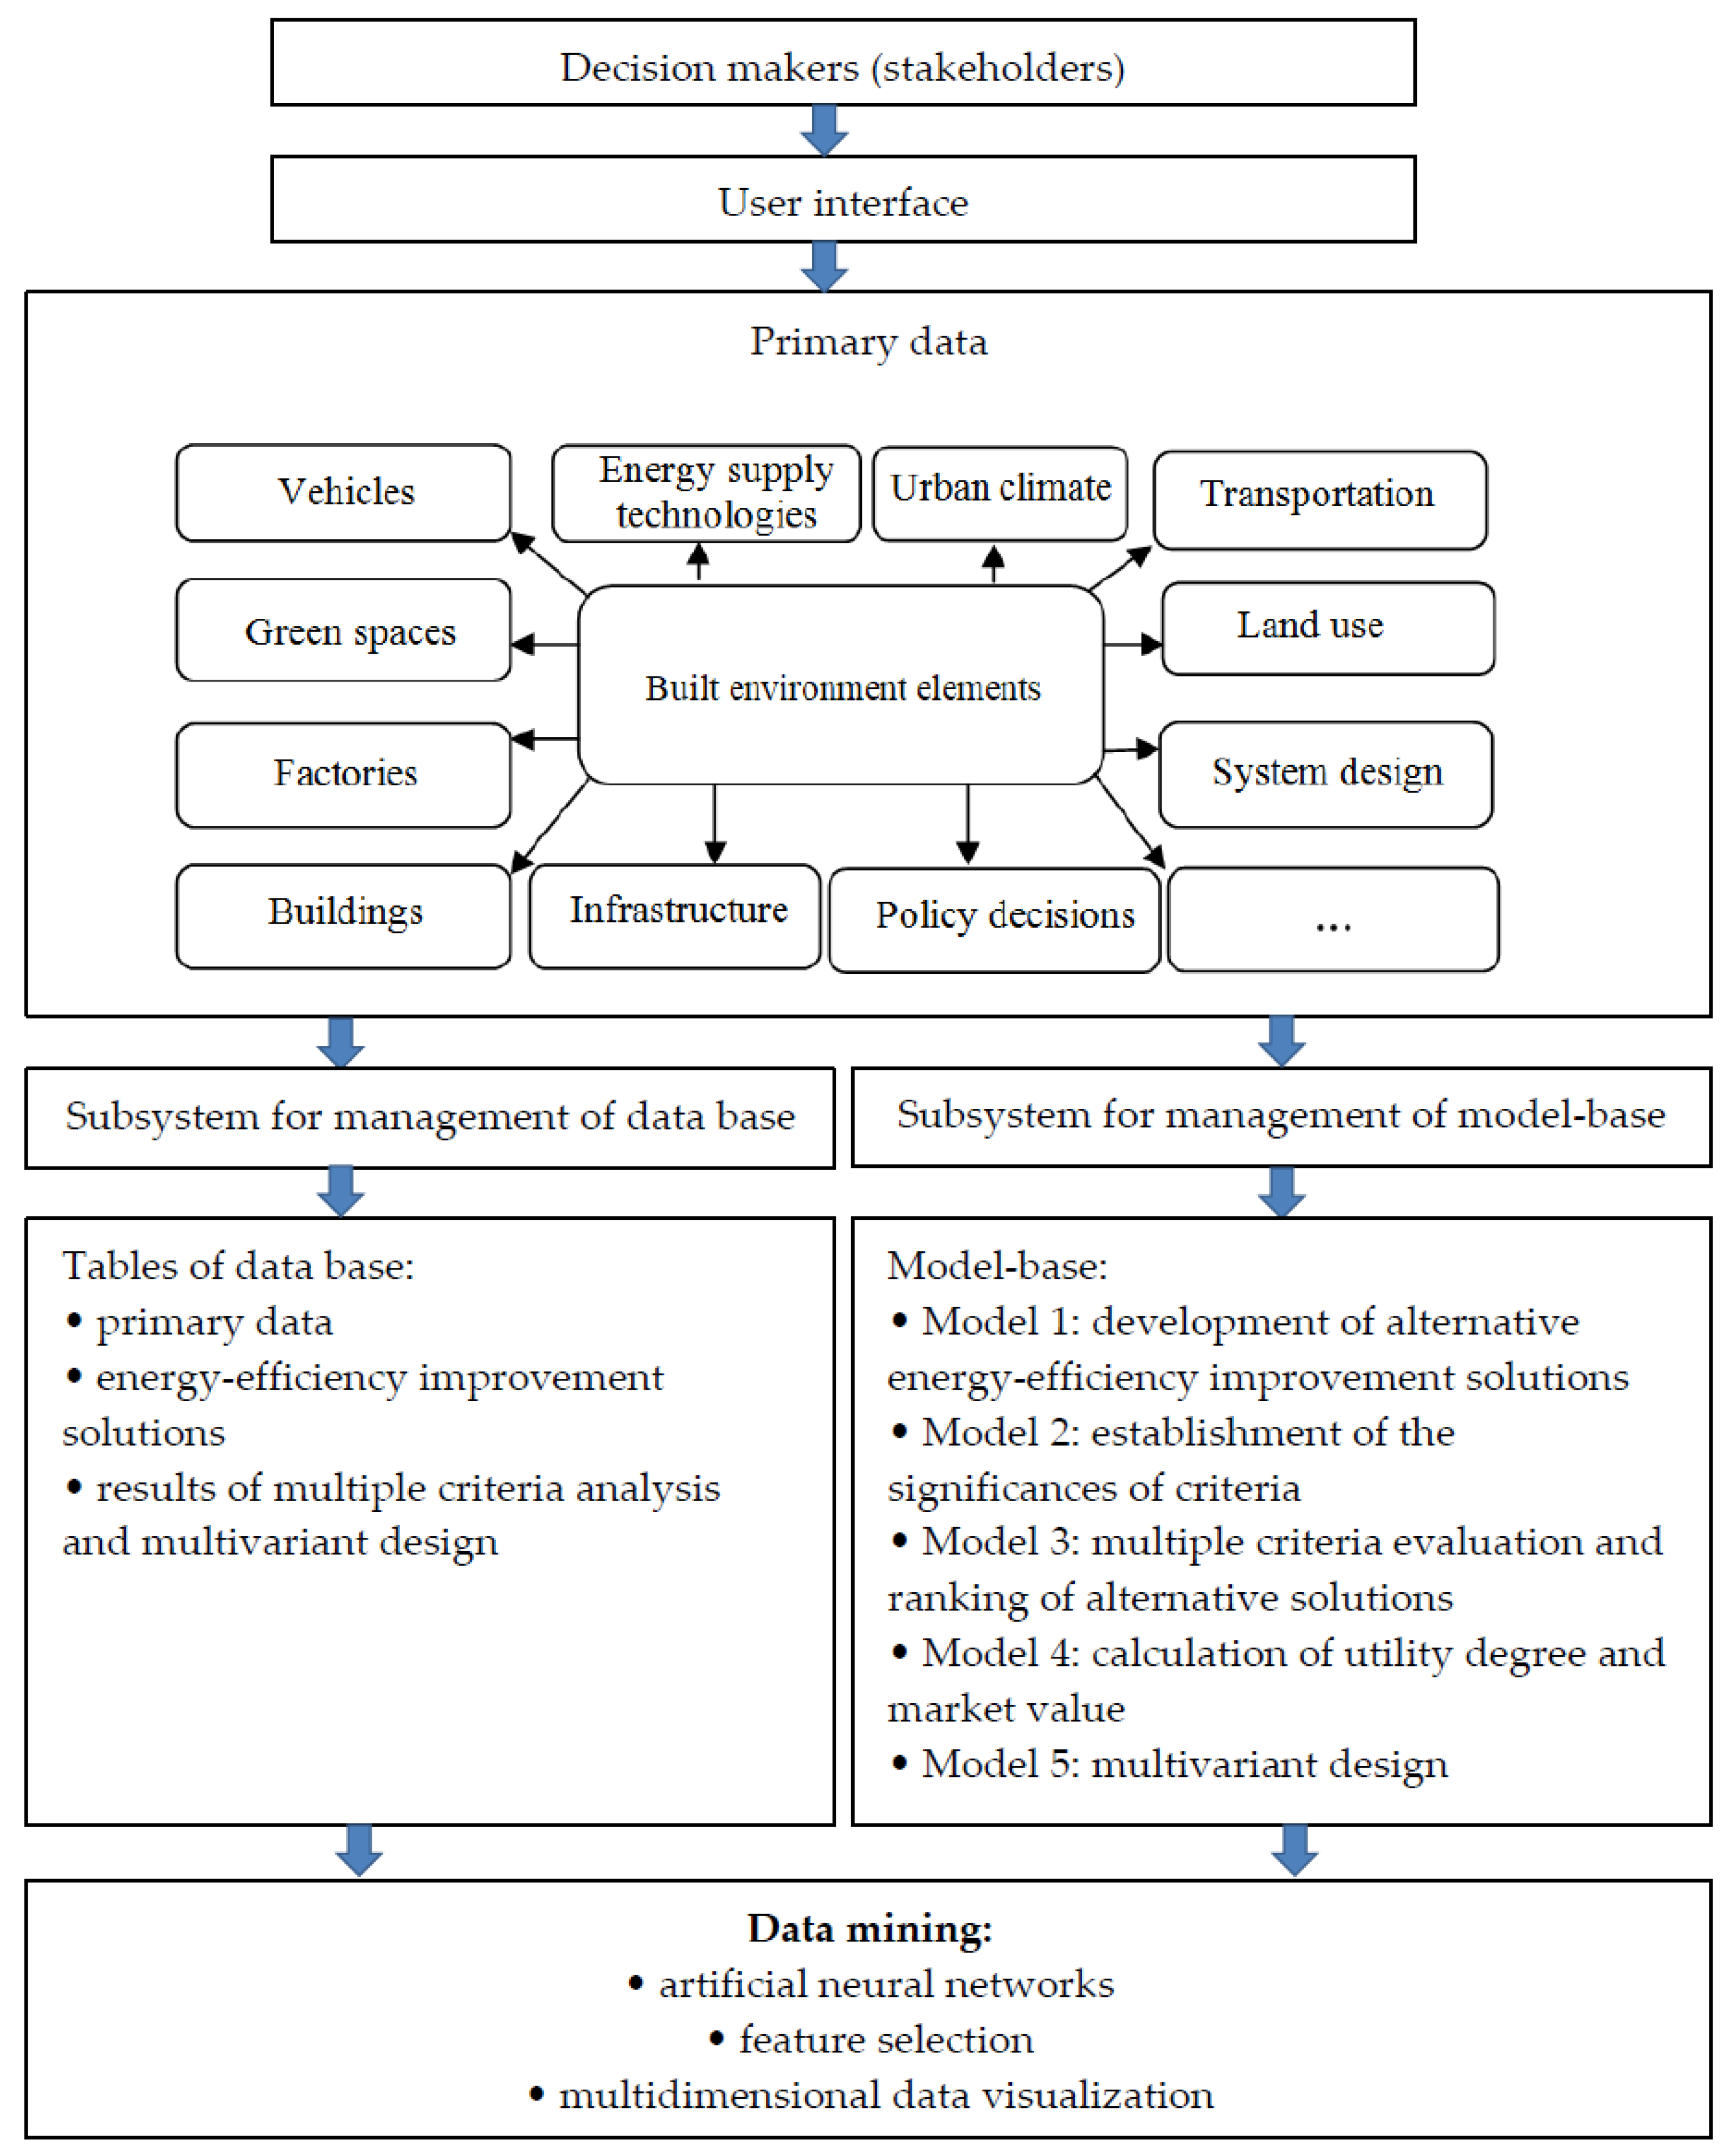
2.2. Description of NANSEN

To select the most rational alternatives for development of an energy-efficient built environment, the NANSEN system was proposed. Its structure is presented in Figure 2. The main elements of the system are described as follows.

2.2.1. Database and Its Management Subsystem

Built environment development projects involve different stakeholder groups, including customers, inhabitants, architects, contractors, suppliers, facility management organizations, municipalities, and governmental and non-governmental institutions. These groups may have different aims, educational levels, and expertise at a large scale, influencing the decision-making process. To analyze the available alternatives of energy-efficiency improvement solutions properly and to select the most rational one, it is important to describe alternatives by economic, socio-cultural, political, legal, technological, environmental, and other types of quantitative and qualitative data (see Figure 1). These data shall be provided in a user-friendly manner.
Necessary information about energy-efficiency improvement solutions for decision-making in NANSEN can be expressed in a conceptual form (i.e., text, figures, photographs, sounds, video) as well as quantitative and augmented reality forms. Quantitatively expressed information includes systems and sub-systems of evaluation criteria; their significances, measurement units, and estimated values. Conceptual information helps to describe alternative energy-efficiency improvement solutions properly. Thus, a decision-maker gets substantial information from NANSEN for making an integrated analysis of alternatives and choosing the most rational one.
The structure of the NANSEN database is relational—all the necessary data is collected in the form of tables. As mentioned above, these tables include exhaustive information (quantitative and conceptual) about the alternative energy-efficiency improvement solutions. Parts of these tables are logically connected. A developed database management subsystem allows compiling, storing, editing, navigating, and browsing large amounts of obtained data.
The NANSEN database encompasses the following tables:
1. Primary data tables. Tables provide general information about the elements of the concerned built environment (i.e., land, buildings, and their surroundings and infrastructure), their depreciation level (physical, economic, functional), and the amount of financial resources intended for improvements.
2. Tables assessing energy-efficiency improvement solutions include information about the proposed alternative energy-efficiency improvement measures (alternatives). The tables are filled as follows:
  • gathering and presenting basic information about energy-efficiency improvement solutions (i.e., insulation, windows, doors, and other elements);
  • developing and defining systems and sub-systems of evaluation criteria and their measurement units;
  • estimating and presenting the values of the criteria, including calculations;
  • assessing the significances of criteria.
Basic information to fill the tables is obtained from available resources, that is, projects, technical specifications, regulations, standards, catalogues, consultations with experts, case studies, best practices, and analogues from similar projects.
With general data on alternative energy-efficiency improvement solutions, the next step is to develop systems and sub-systems of criteria for their assessment. The selection of criteria depends on estimation purposes; they can be determined by customers; inhabitants; experts; or other stakeholders, such as municipalities. The values of the criteria to describe the alternative energy-efficiency improvement solutions are obtained by analyzing their specifications and documents and best practices, as well as by using the statistical, expert, and other available methods. Here, the precision of information is vitally important as the selection of the most rational solution depends on it. It is noteworthy to mention that quantitative information, that is, costs and dimensions, is usually objective. On the other hand, the values of the qualitative criteria are usually subjective; therefore, use of the expert methods that contribute to objectivity for their assessment is recommended.
The users of NANSEN may change the criteria and their significances according to specific needs and financing opportunities. For instance, one customer considers the thickness of a thermal insulation for a building envelope to be more important than an aesthetic look, while some other customer has an opposite opinion. The customer who aims to express his/her opinion may evaluate significances of criteria in numeric values, which will indeed affect general estimation of the energy-efficiency improvement solutions.
3. Tables of multiple criteria analysis and multivariant design results. These contain information on the evaluation results of individual energy-efficiency improvement solutions (elements), interconnection of these elements, their multivariant design results, and the most rational project alternative.
The multivariant design method [15] permits development of up to 100,000,000 alternative combinations of energy-efficiency improvement solutions. Verification of such solutions is in accordance with the requirements of stakeholders. Solutions that do not match certain requirements are excluded from further analysis.

2.2.2. Model-Base and Its Management Subsystem

Beneficence of built environment energy-efficiency improvement solutions is often determined by considering many factors of the external and internal environment (see Figure 1). Therefore, NANSEN has to incorporate models for a detailed examination of the concerned energy-efficiency improvement solutions and rational selection of alternatives. For these purposes, function-related models are proposed:
  • Model 1: development of energy-efficiency improvement solutions (alternatives), that is, insulation of walls, roof, selection of doors, windows, solar panels, and other elements under user’s request;
  • Model 2: establishment of the significances of criteria (by expert or other approaches);
  • Model 3: multiple criteria evaluation and ranking of alternatives;
  • Model 4: calculation of utility degrees and market values;
  • Model 5: multivariant design of improvements and composition of the most efficient combinations.
The aforementioned models enable NANSEN to analyze various energy-efficiency improvement solutions (i.e., insulation of walls, roof, selection of doors, windows, solar panels, and other elements) and to select the most rational ones by means of calculating the utility degree and market value. By next step, the obtained rational energy-efficiency improvement solutions are joined into projects by means of a multivariant design. Afterwards, a multiple criteria evaluation is performed, utility degrees calculated, and projects under consideration ranked in priority order for enabling a user to choose the most rational ones. This way, NANSEN develops up to 100,000,000 built environment improvement solutions.
A model-base management subsystem of NANSEN allows a user to adapt the models to his/her needs, eliminate those that are not necessary, and add new models.

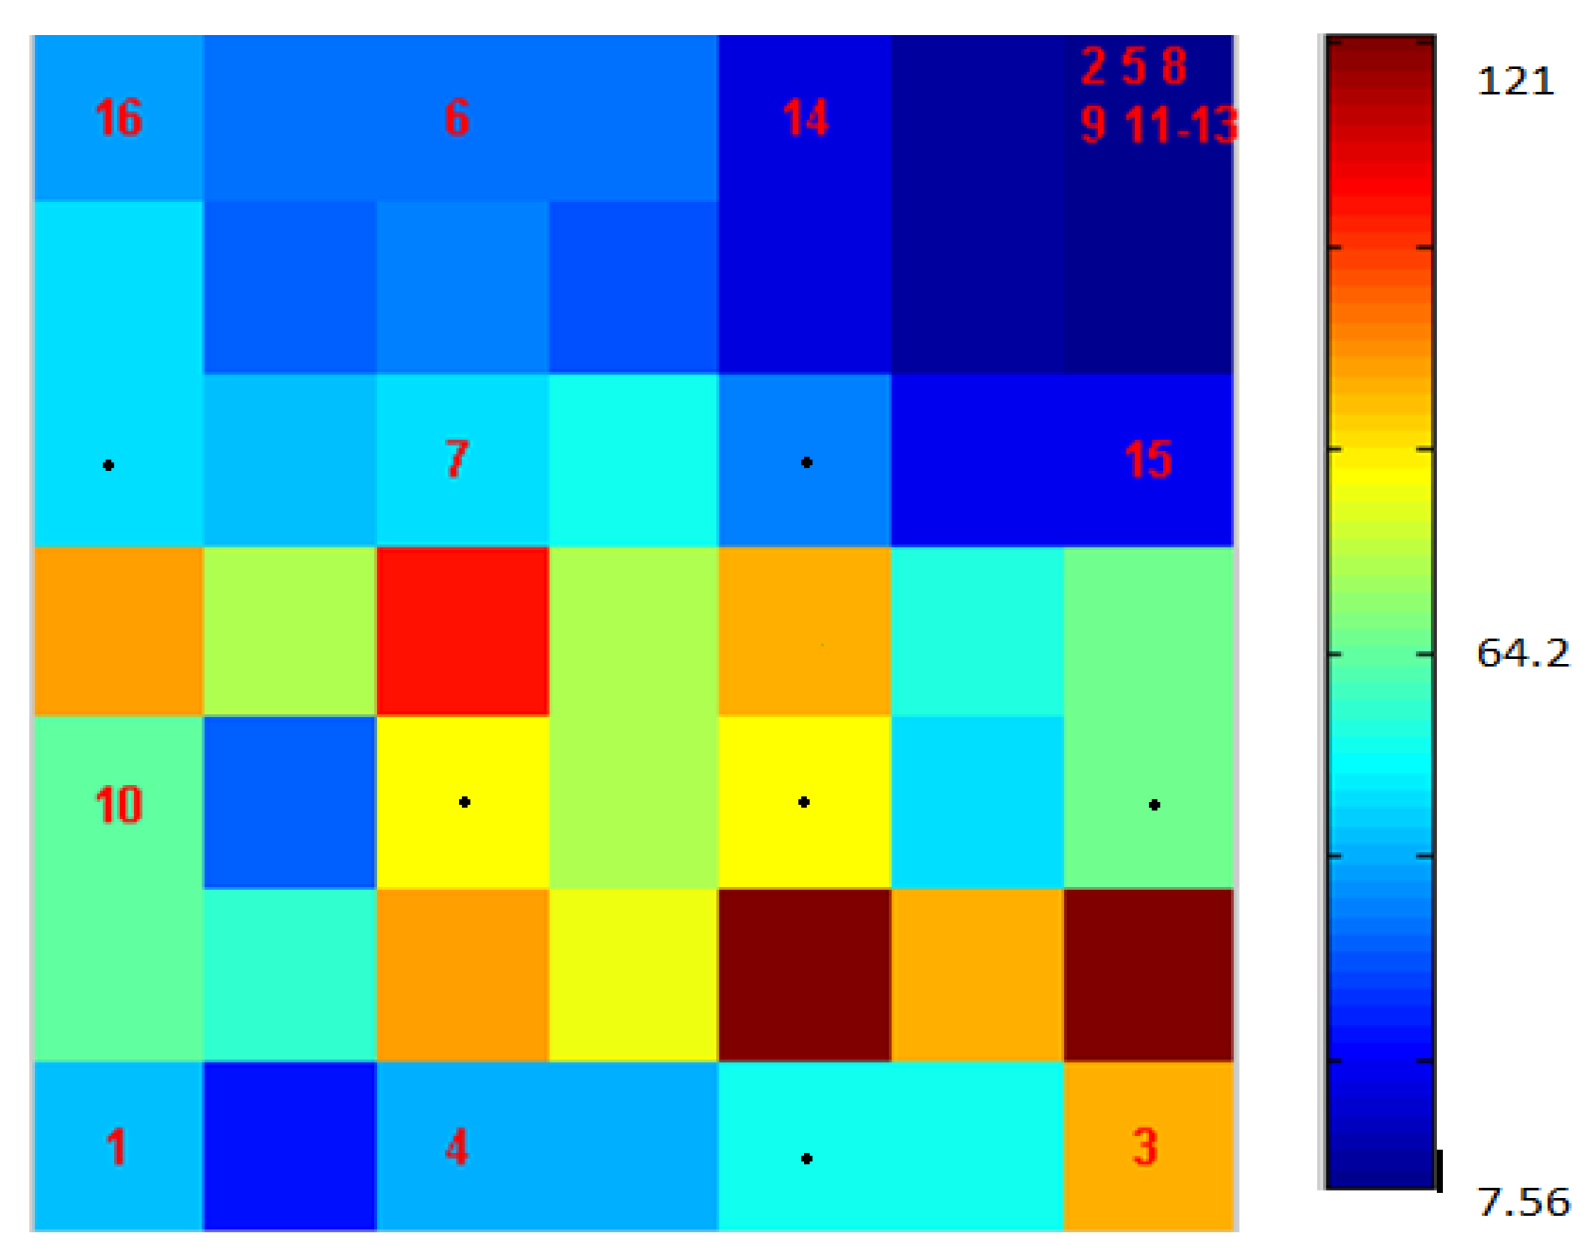
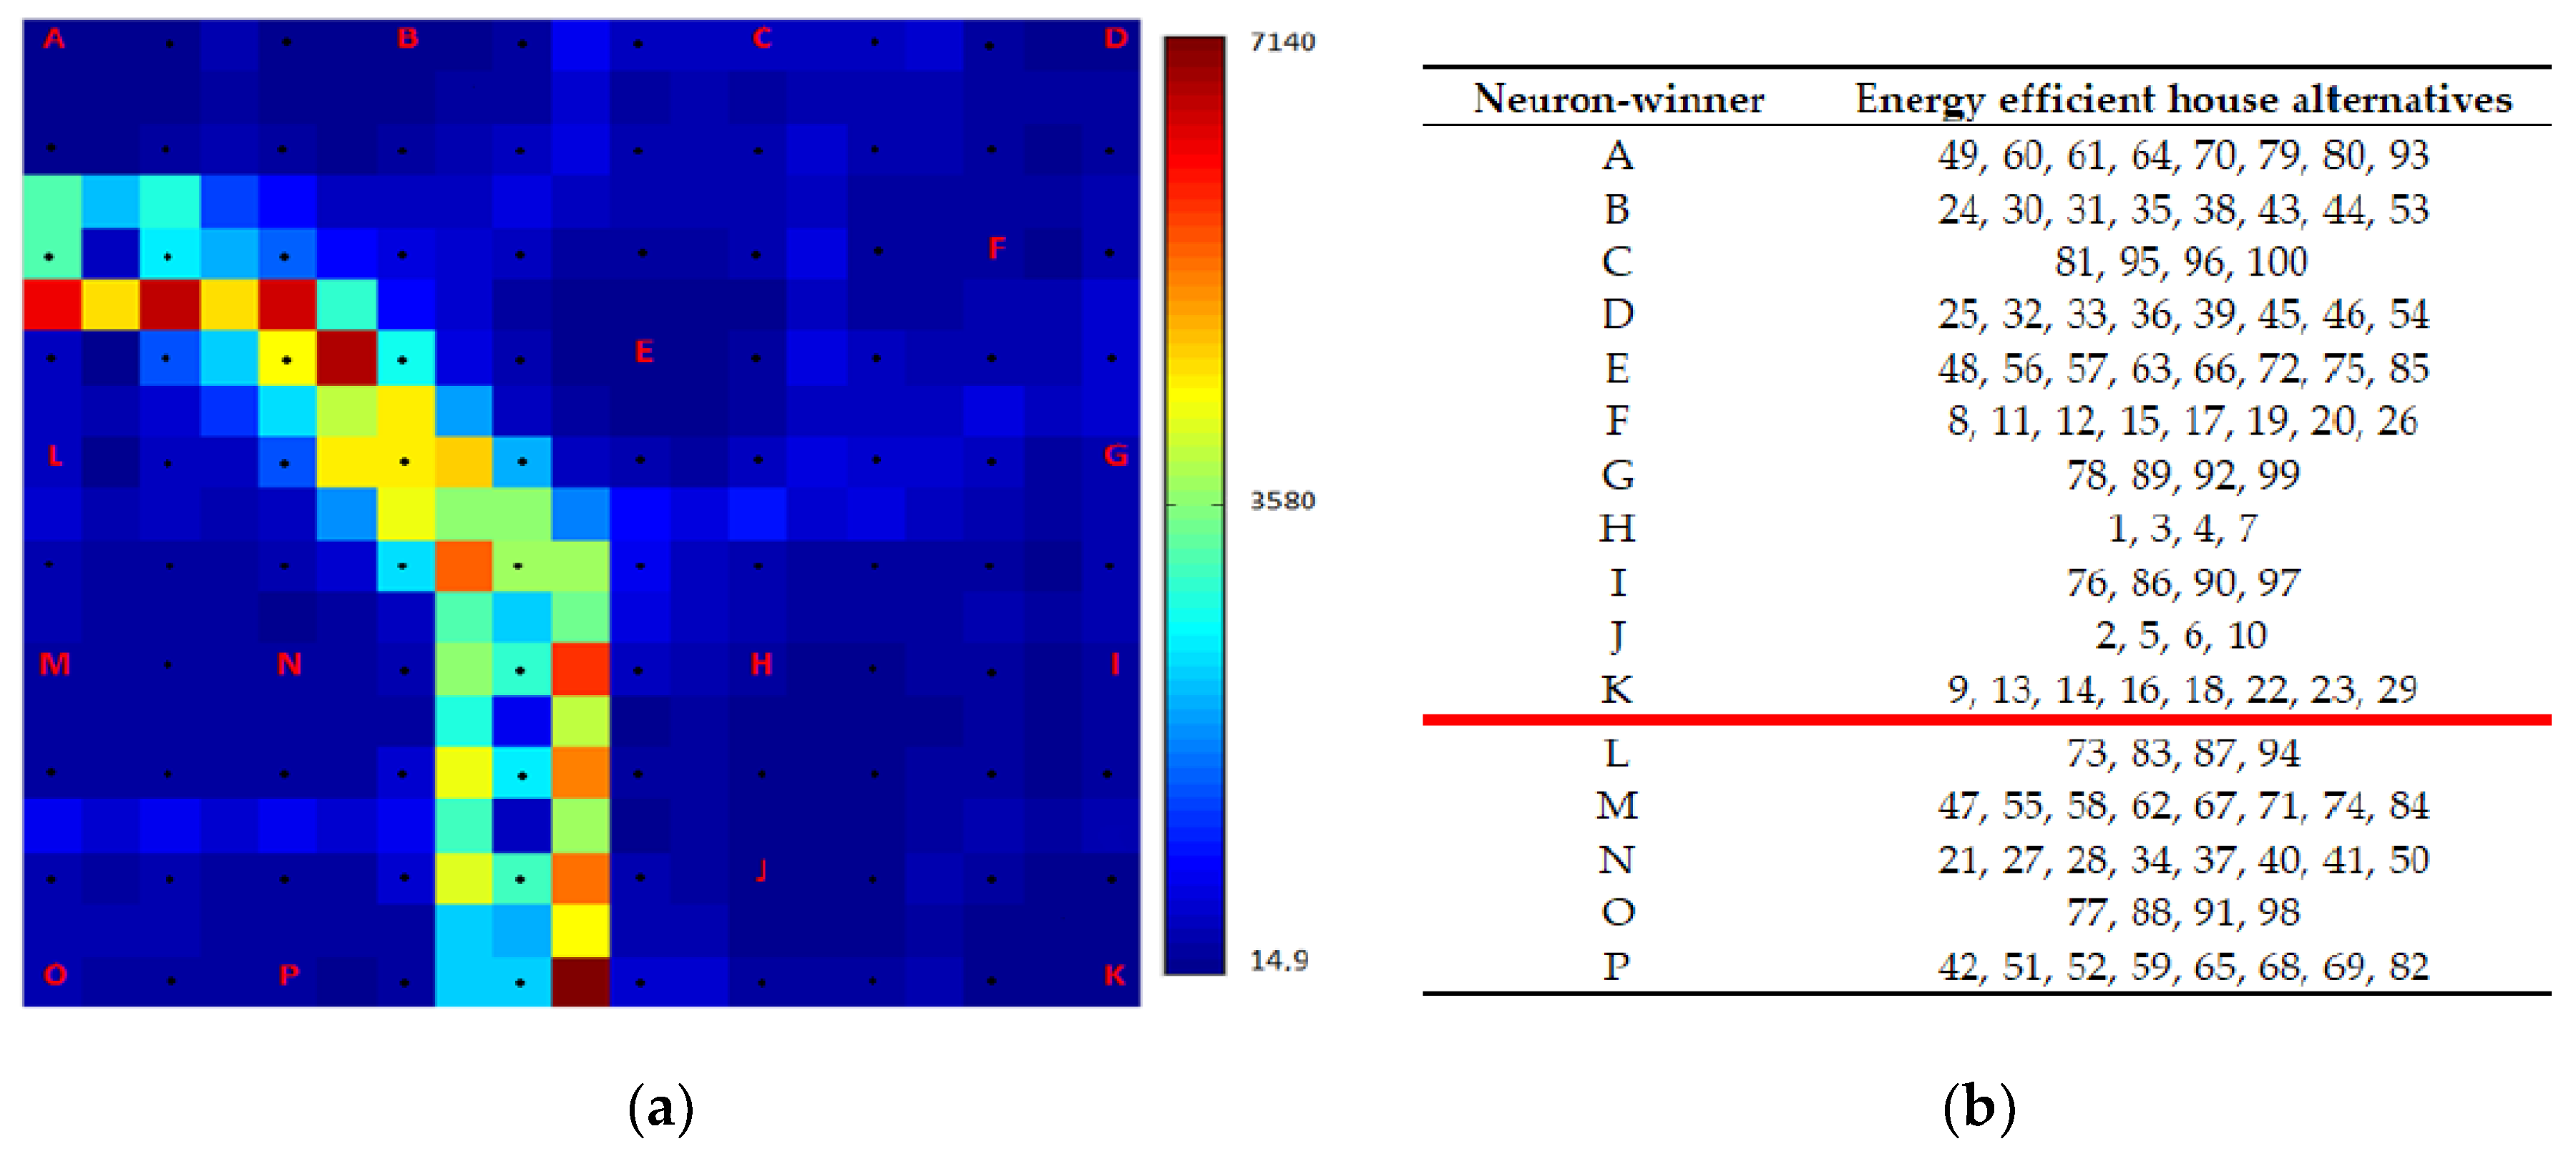
2.2.3. Visual Data Mining by Artificial Neural Networks

Human participation is essential in data analysis as well as in decision-making. Computers are still not able to replace human knowledge, skills, and capacities. Visual data mining helps a person analyze data by visualizing and presenting it in a graphical form. Visualization of data enables a person to understand and analyze it, draw conclusions, and make a decision [17].
Artificial neural networks (ANNs) can perform classification, clustering, function approximation, prediction, optimization, and many other functions. For topographic mapping, a class of neural networks, called self-organizing maps (SOMs), can be used [46]. SOMs are trained by using competitive learning. SOMs can be applied for clustering, reduction of the dimensionality of the data, and its visualization. Although there have been many modifications of SOMs [47,48], the general Kohonen algorithm [43] realized in the SOM toolbox [46] was used here for the NANSEN decision-support system.
Assume that we have some alternatives and the features (attributes) describing them and taking numerical values. If several features describe the alternatives, the data is called multidimensional data. To visualize such data, different methods can be used [16,46,48]. What distinguishes SOMs from others is that they are able both to visualize and to cluster multidimensional data. The neurons of the map can be arranged in a rectangular or a hexagonal grid. This research applied the rectangular topology of SOM.
All neurons in this grid are specified by the n-dimensional codebook vector Mkl, where k designates a row and l designates a column. To start training, it is necessary to set the initial values of Mkl components, which are generally random numbers within the interval (0,1). During the training, all the objects are submitted to the ANN many times and the codebook vectors are computed by iteration. The codebook vectors of neurons are adapted iteratively based on the learning rule, provided in Figure 1 (step 8).
The training of SOM continues until the maximum number of iterations is obtained. After the training, the data is presented to SOM and “neurons-winners” for each object (in this case, energy-efficiency improvement solution) are established and data clusters distinguished. The advantages of the SOMs for development of energy-efficient solutions are further illustrated in Section 3.

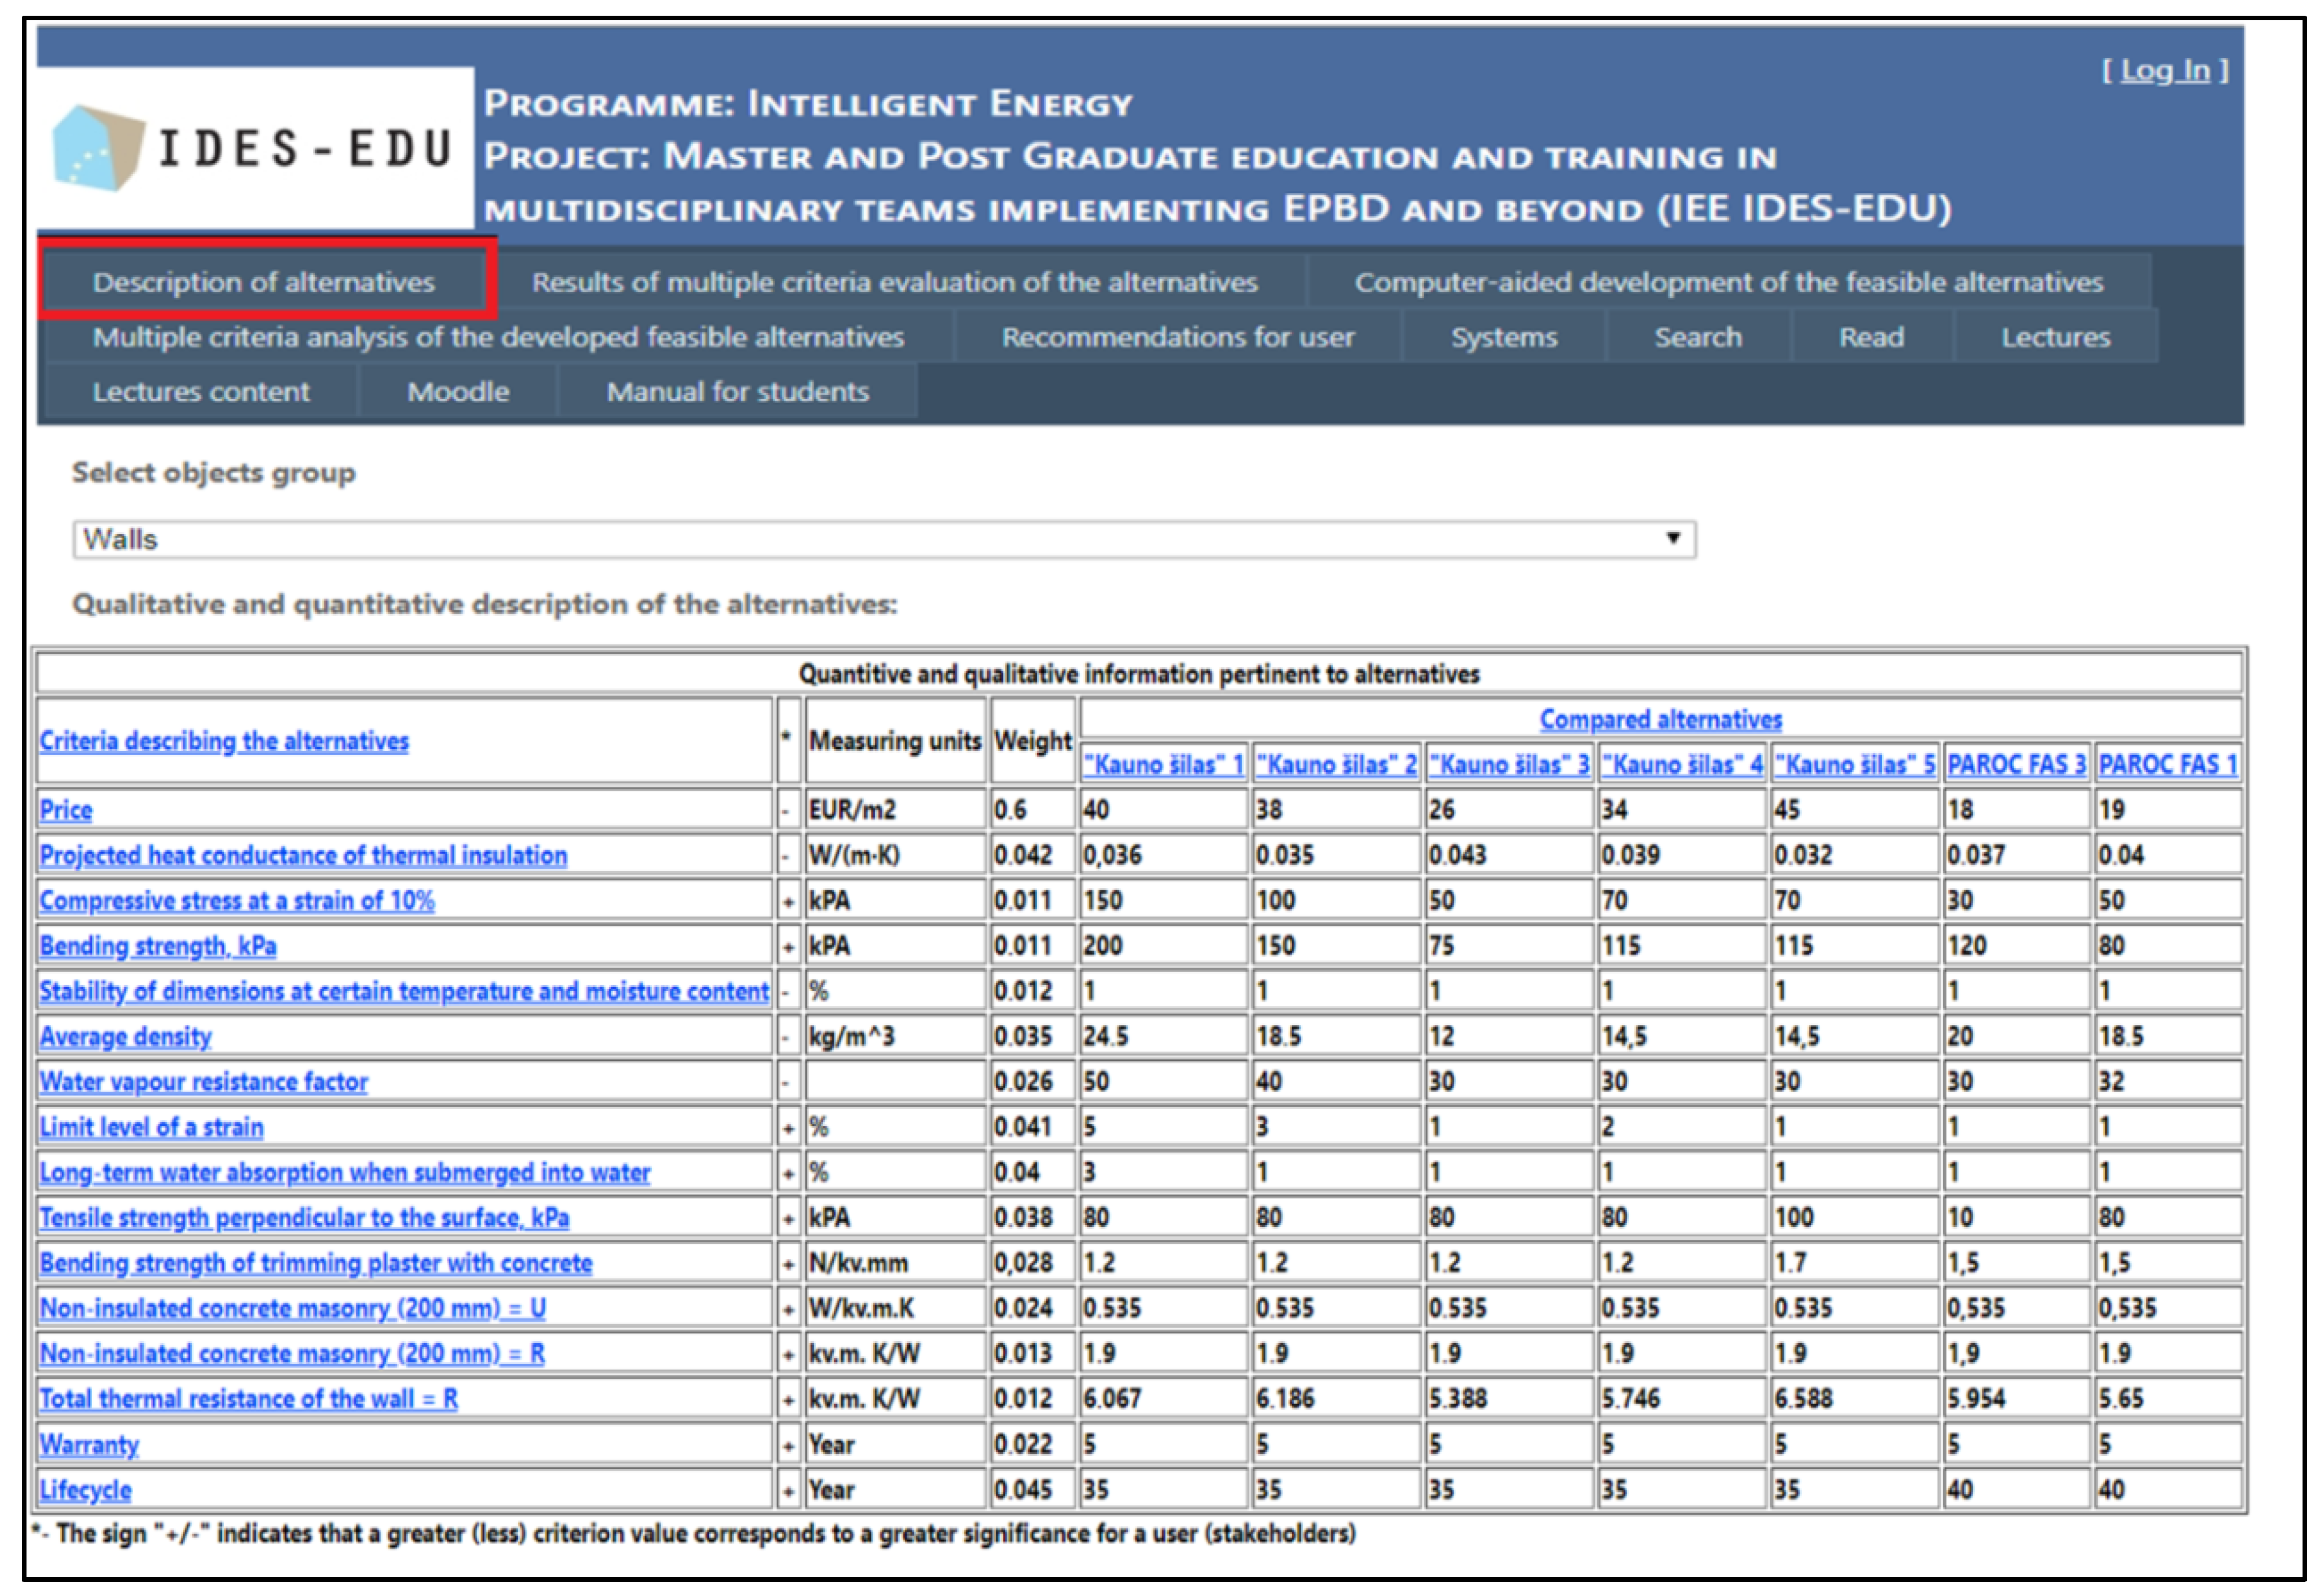
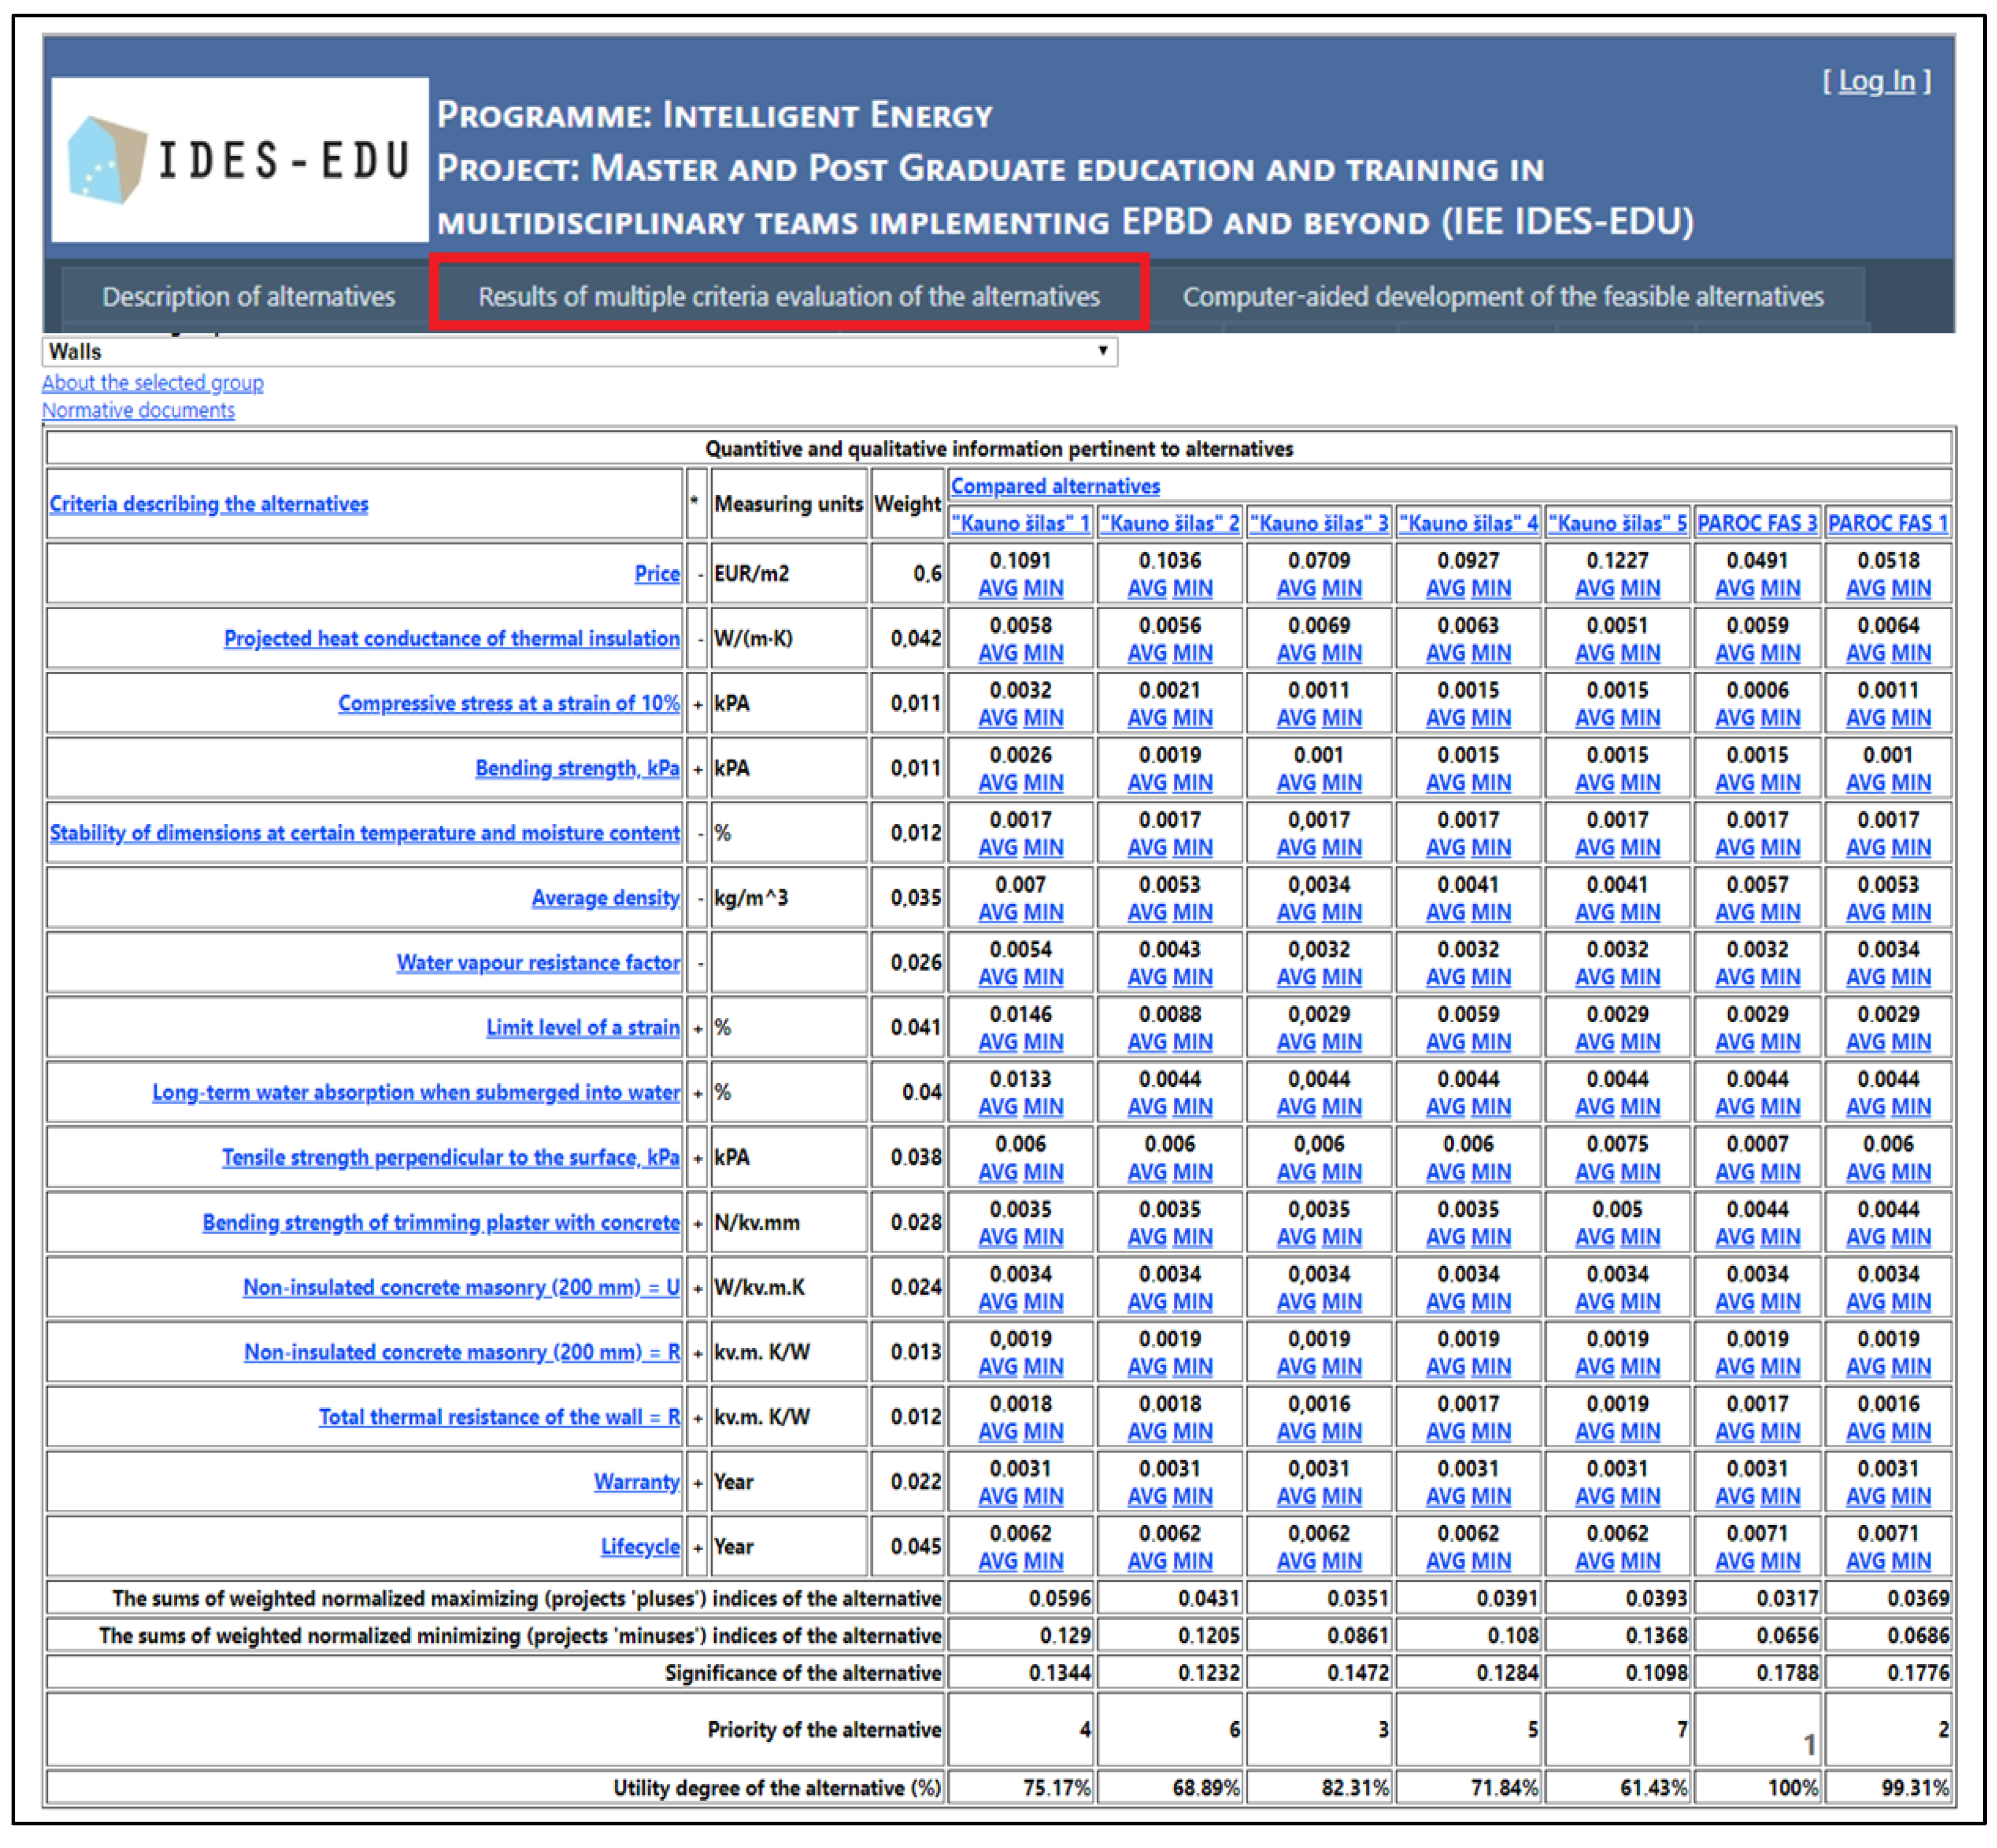
3. Case Study: Experimental Results

To demonstrate the performance of NANSEN, an experiment on a real case of an energy-efficient individual house design was performed. This house will be located in Vilnius, Lithuania. A customer is willing to construct a passive house, and therefore aims to select the most suitable alternatives of insulation for walls and roof, nano-structured grout, windows, doors, heat recovery units, and renewable energy devices (solar collectors, windmills, geothermal boilers).
The selection of the insulation material for walls will be explained in more detail for this present publication. The system of criteria, their measuring units, significances, and values describing the selected alternatives of walls are provided in Figure 3. Alternatives of the insulation are estimated according to sixteen criteria, namely price (EUR/m2), projected heat conductance of thermal insulation (W/(m·K)), compressive stress at a strain of 10% (kPa), bending strength (kPa), stability of dimensions at certain temperature and moisture content (%), average density (kg/m3), water vapor resistance factor, limit level of a strain (%), long-term water absorption when submerged into water (%), tensile strength perpendicular to the surface (kPa), bending strength of trimming plaster with concrete (N/kv·mm), heat transfer coefficient for non-insulated concrete masonry (200 mm) (W/kv·m·K), thermal resistance for non-insulated concrete masonry (200 mm) (kv·m·K/W), total thermal resistance of the wall (kv·m·K/W), warranty (years), and a lifecycle (years). The system of criteria was developed by the authors of this publication consulting with a customer and considering his needs. Significances of criteria were established by the customer as in this case, he is a main beneficiary. It can be observed that the most important criteria in selection of the walls for him are price, durability, and projected heat conductance of thermal insulation. Hereby, these criteria will have the highest impact on multicriteria evaluation results. Values of criteria were estimated by the authors of the present publication by consulting with suppliers and analyzing the specifications.
It should be noted that same procedures were applied to all of the elements (nano-structured grout, windows, doors, roof insulation, heat recovery units, and renewable energy devices).
As all the necessary initial information was obtained, the NANSEN performs a multiple criteria analysis and ranking of available alternatives (see Figure 4). It can be observed that insulation Alternative 6 “PAROC FAS 3” was ranked the best.
Figure 5 shows how the value of insulation is quantitatively affected by values and significances of criteria. NANSEN informs how to increase the attractiveness of the wall alternatives for a customer. As an example, Alternative 1 “Kauno šilas 1” can be analyzed. The greatest influence in an assessment of insulation materials is the criterion “price” (q1 = 0.6). A lower price makes an alternative more attractive to a customer.
The system recommends the following (see Figure 5):
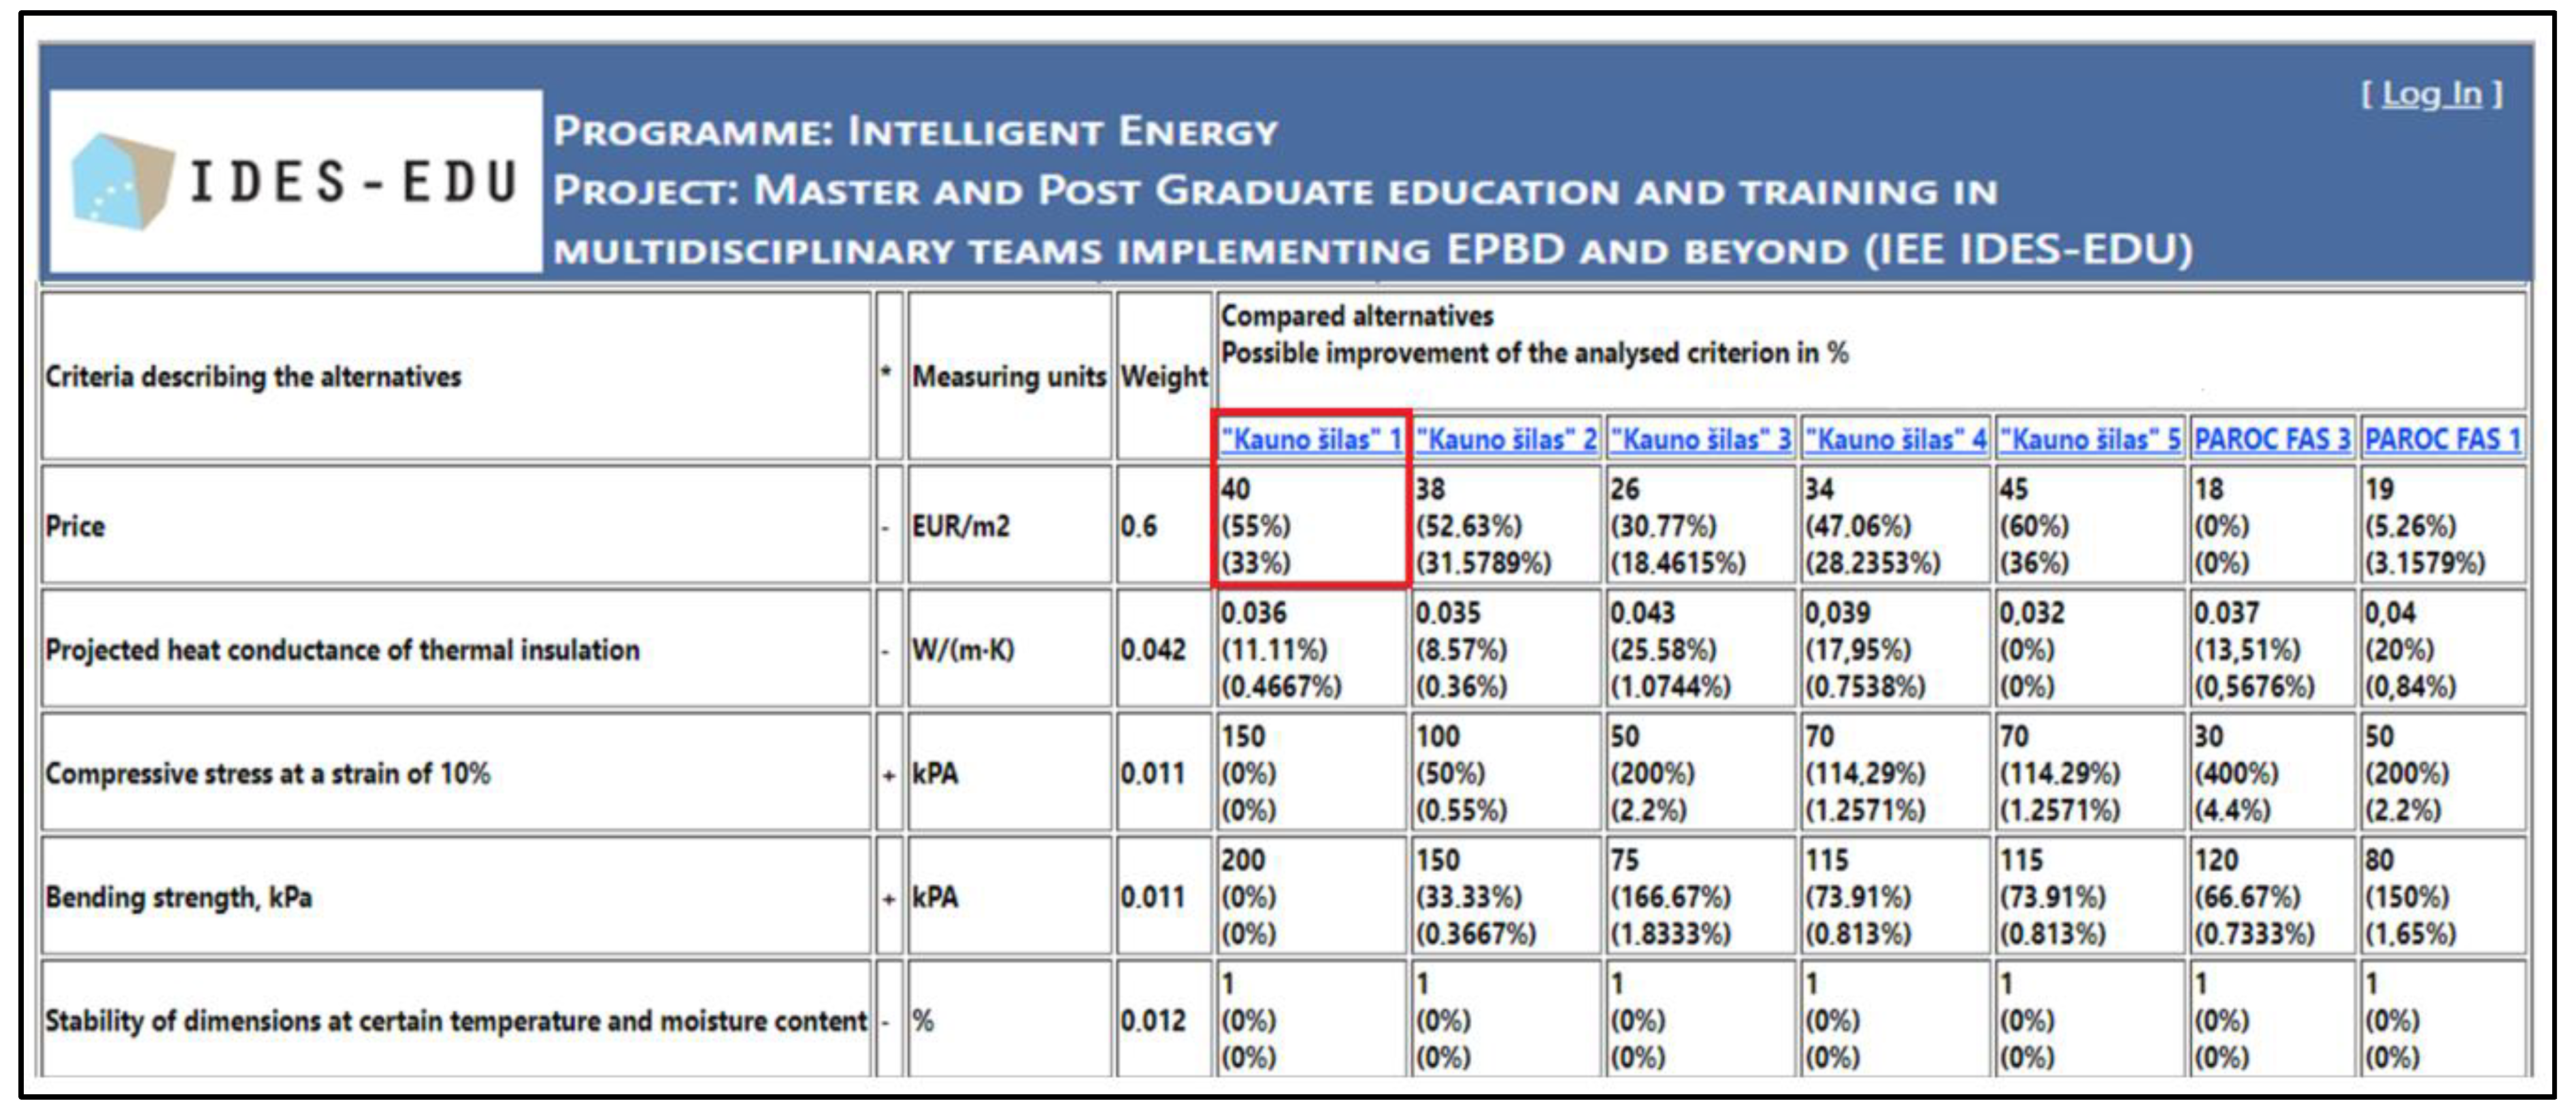
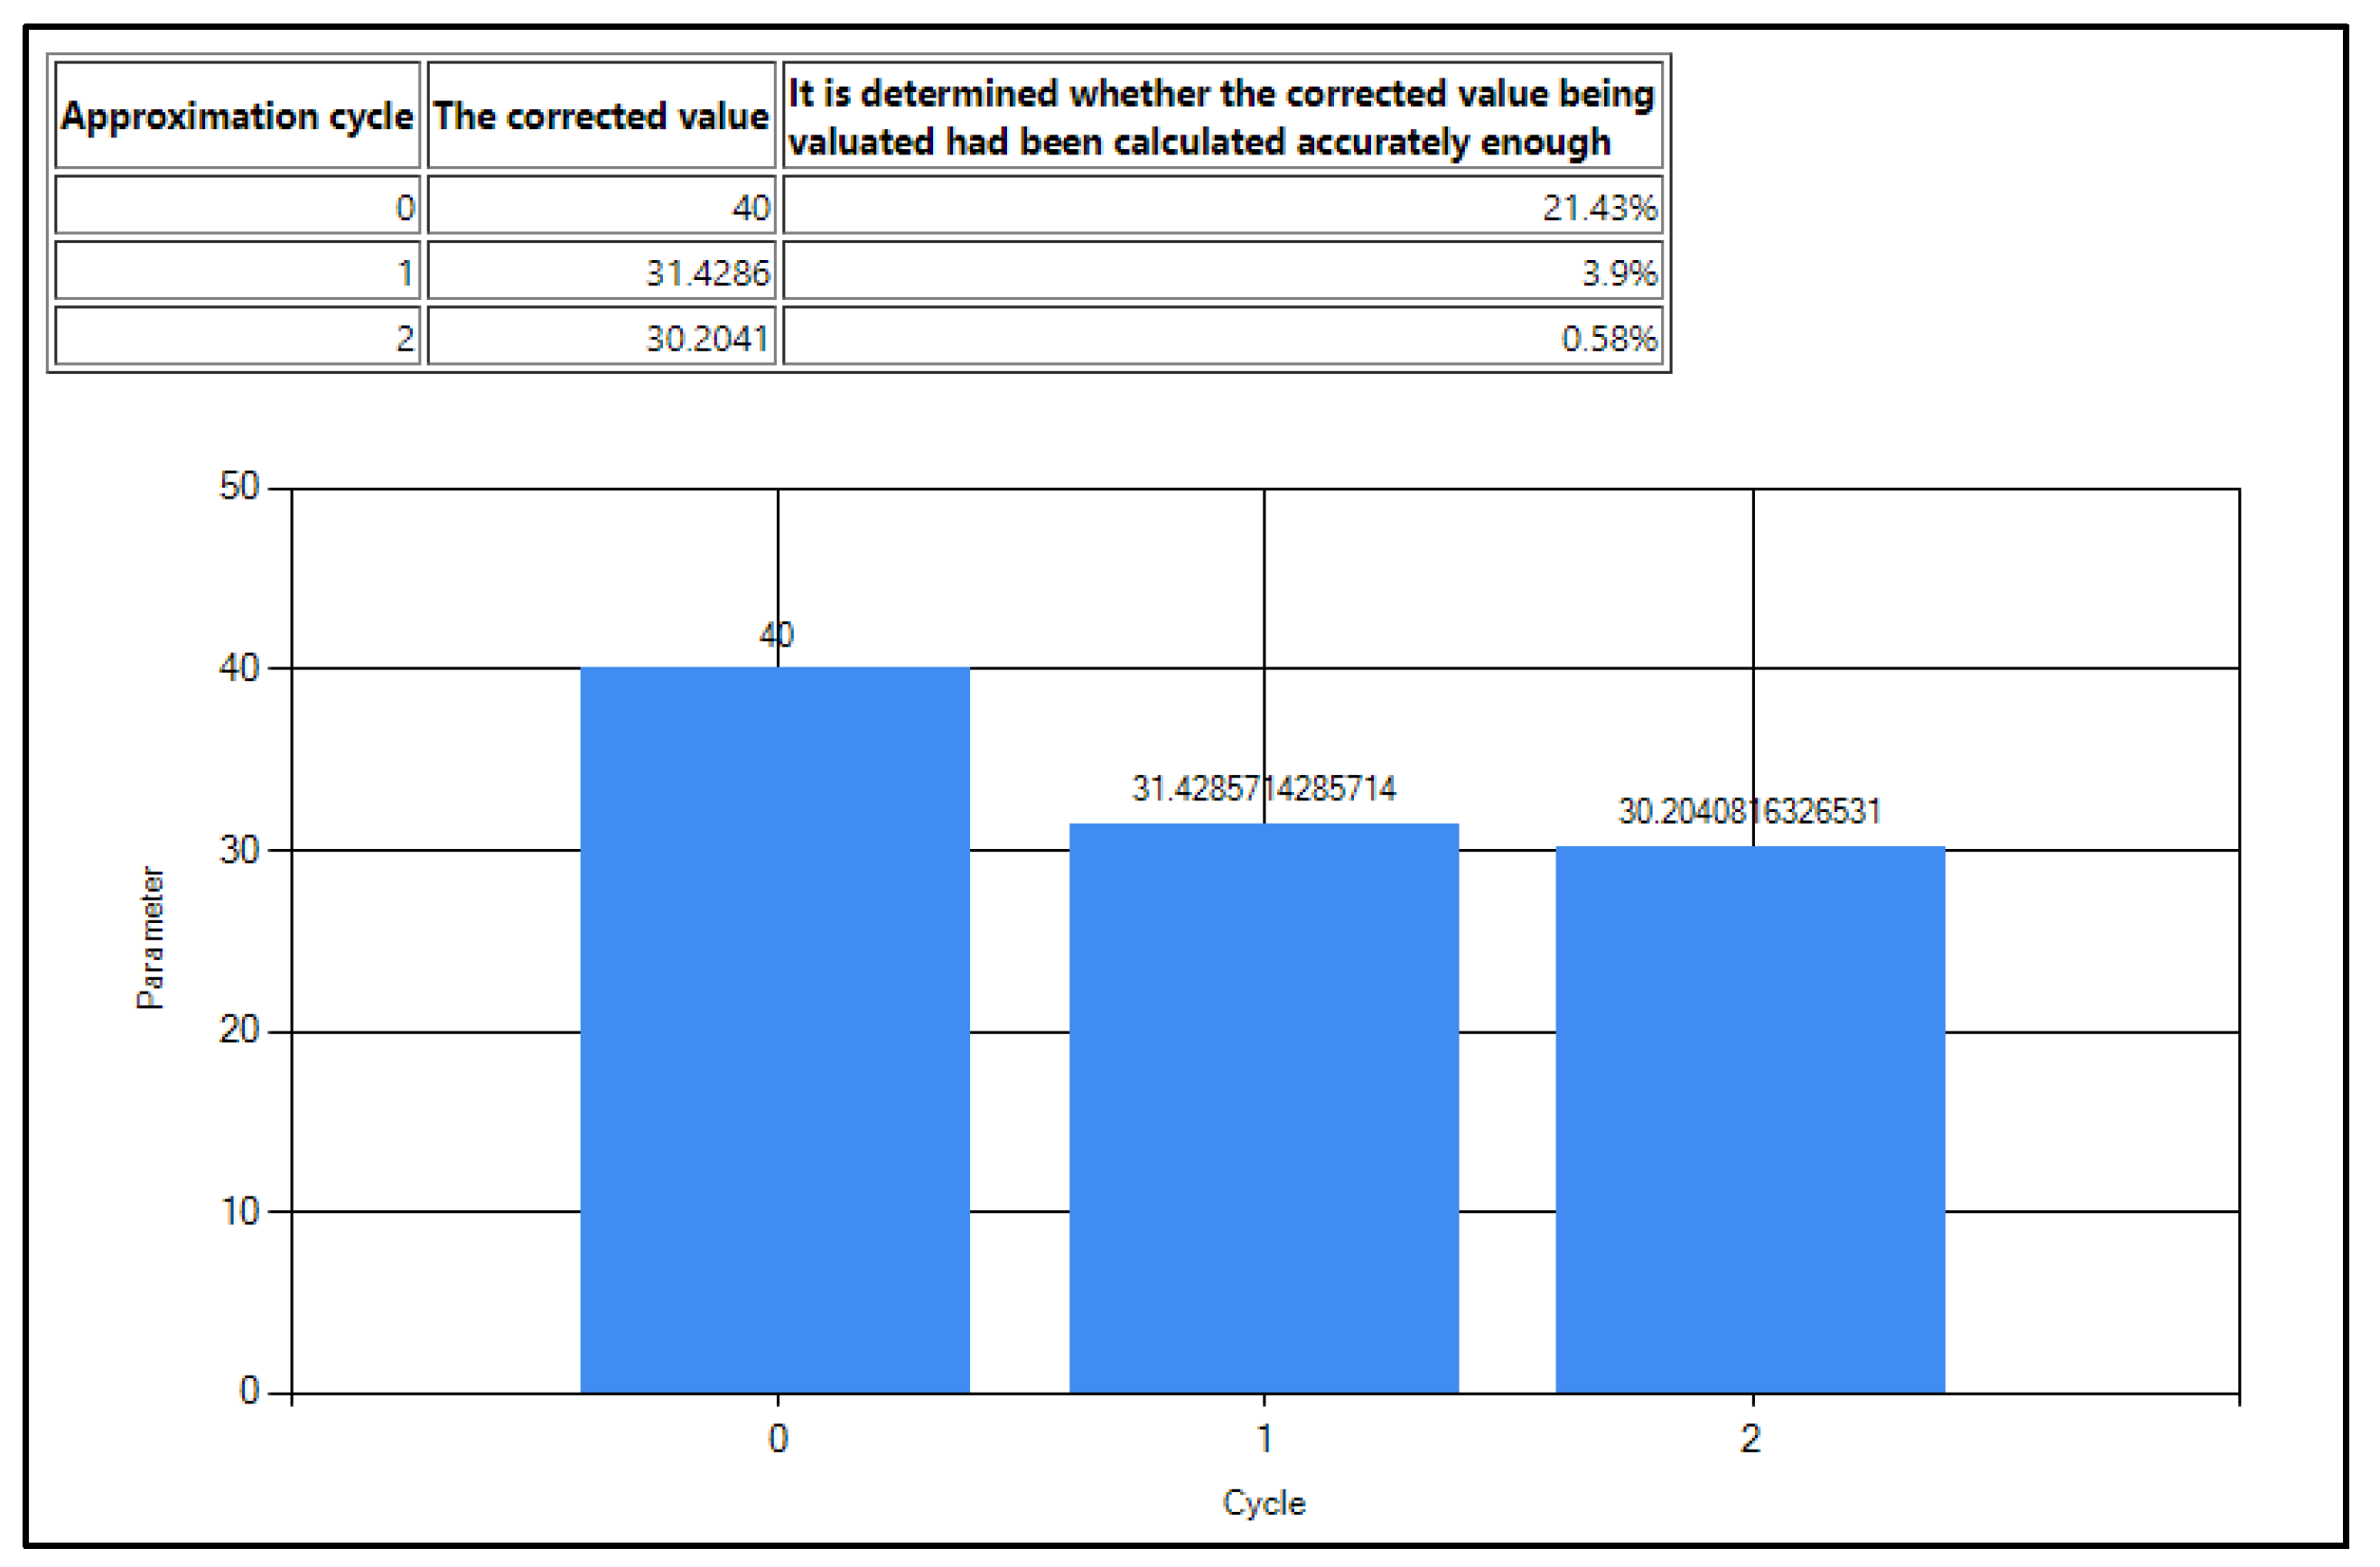
  • The price of alternative “Kauno šilas 1” is 40 EUR/m2. The price of the cheapest alternative “PAROC FAS 3” is 18 EUR/m2. Calculations show that the price of the alternative “Kauno šilas 1” can be decreased by 55% (to reach the least expensive alternative).
  • Calculations show that a decrease of 55% in price would make the insulation material alternative more attractive to a customer by 33%.
A method for determining the utility degree and market value of alternatives [15] can be used for a more accurate analysis. For example, the market value analysis was performed for the Alternative “Kauno šilas 1” (see Figure 6).
The top of the table shows the iterations that have been made for calculating the market value. Graphical visualization is also available. To calculate a market value, two iterations were performed from an initial 40 EUR/m2 until the figure reached 30 EUR/m2, meaning that real market value of the wall alternative shall be lower by 10 EUR/m2.
As an analysis is completed for all the elements (insulation of walls and roof, nano-structured grout, windows, doors, heat recovery units, and renewable energy devices (solar collectors, windmills, geothermal boilers)), the alternative combinations of energy-efficient solutions are automatically developed and ranked, and the best alternative combinations are presented (see Figure 7). In this case, the NANSEN has developed 16,329,600 alternative combinations. Figure 7 illustrates final calculation results; the best combination is highlighted in red. NANSEN recommends the user to manufacture windows at the company “Baltijos langai”, incorporate “TGE-Electrochrome” smart glasses, to select doors from “Fortas”, to use “PAROC FAS 1” wall insulation and “EUROMAC2 MTP2-46” roof insulation, to install “LGH-50RX5” energy recovery system, “WATT 3000 S” solar panels, “GMSW 10 plius” geothermal boiler, to choose walls with smart elements and to use “FUGA NANOTHECH 730” nano-structured grout.
Furthermore, it is possible to perform visual data mining. The advantages of the self-organizing maps for decision-making on energy-efficiency improvement solutions are illustrated on the data on walls (Figure 3), as well as combinations of energy-efficient solutions (Figure 7). The results are presented in Figure 8, Figure 9 and Figure 10. The SOM toolbox [49] is used in an experimental investigation. To compare the alternatives, the necessary data for the SOM toolbox is a matrix, in which the rows correspond to alternatives and the columns correspond to criteria; that is, if the notation in Section 2.2.3 is followed, the alternatives are objects and the criteria are features.
Figure 8 illustrates dependencies and similarities of alternatives of the walls (in this case, n = 16, m = 7). As a result of a small number of alternatives of the walls, the selection was a SOM with nine neurons, r = 3 and s = 3. Figure 9 illustrates dependencies and similarities of criteria describing the walls (in this case, n = 7 and m = 16). Here, SOM contains 16 neurons, r = 4 and s = 4. Figure 10 illustrates dependences and similarities of combinations of energy-efficient solutions (in this case, n = 141 and m = 100). Here, SOM contains 100 neurons, r = 10 and s = 10.
In Figure 8, Figure 9 and Figure 10, the cells filled with the numbers and dots refer to SOM neurons, and empty cells mark the borders between SOM cells. The cells filled with the numbers correspond to the “neurons-winners”. The SOM is presented in a u-matrix form [46]. Here, the SOM cells are in different colors depending on distances between the codebook vectors. The color of the border cells depends on the distance between neighboring neurons. The color of the cells corresponding to the neurons depends on the color of neighboring border cells.
In Figure 8, the numbers correspond to the alternatives of the walls. It can be observed that Alternatives 3 and 7 are very similar, because they have the same “neuron-winner”. Some similarities of Alternatives 2, 5, and 4 can be witnessed with Alternatives 3 and 7. Alternative 1 and Alternative 6 are different among themselves and among all remaining alternatives. More, but not such essential, findings of alternative similarities can be derived from the u-matrix shown in Figure 8.
In Figure 9, the numbers correspond to the criteria describing the walls. Obviously, Criteria 2, 5, 8, 9, 11, 12, and 13 are very similar, because they have the same “neuron-winner”. Some similarities of Criteria 14 and 15 with Criteria 2, 5, 8, 9, 11, 12, and 13 are noticeable. Moreover, Criteria 6, 7, and 16 have more similarities to Criteria 2, 5, 8, 9, 11, 12, 13, 14, and 15 as compared with the remaining criteria. Criteria 1 and 4 are similar too. These constitute a separate cluster of criteria. Criteria 3 and 10 are different among themselves and among all remaining criteria. Therefore, four clusters of criteria may be highlighted in this experiment: {1, 4}, {3}, {10}, and {2, 5, 6, 7, 8, 9, 11, 12, 13, 14, 15, 16}.
In Figure 10, the letters correspond to the different groups of combinations of energy-efficient solutions. Letters are used because the number of the alternatives is high and many alternatives correspond to the same “neuron-winner”. Alternatives corresponding to letters are presented on the right. Although the number of “neurons-winners” is 16, the alternatives form two large clusters: {A–K} and {L–P}. This is clearly seen in Figure 10, because some light zones separate the picture into two parts that are in blue. Blue color indicates small distances among neurons.
Concluding the results of the experiments, new way was discovered to apply the SOM-type neural networks in the initial analysis of multiple criteria decision problems. The results of the analysis may influence the selection of the final set of alternatives and criteria in the decision making problem by taking into account the discovered similarities of alternatives or criteria.

4. Discussion

Simulation results, presented in Section 3, revealed that the methods of multiple criteria evaluation, multivariant design, and multidimensional data visualization by using ANNs could be successfully integrated for development of the decision support systems aimed at improvement of the energy efficiency in a built environment.
The main innovation of the developed NANSEN system, compared with the systems discussed in Section 1, consists of the integration of different methods into a single, computer-based decision making tool. Integration of the methods of multiple criteria evaluation, market value estimation, multivariant design, and visual data mining allow performing extensive analysis of available energy efficiency improvement solutions, considering the quantitative and qualitative external and internal factors, as well as diminishing the price of a project and, therefore, better satisfying the requirements of participating stakeholders. To the best knowledge of authors, none of the systems available in the scientific literature are based on a combination of such methods as presented in Figure 1, nor does it holistically perform functions such as the ones performed by NANSEN.
It is noteworthy to mention that the present case demonstrated an application of the NANSEN system in the design of a new, energy-efficient individual building. Indeed, the presented methodology and the system can be applied for various energy-related issues in different stages of the life cycle of a built environment, that is, for selection of land parcels, construction technologies and approaches, energy-efficient refurbishment measures, and demolition and utilization options. To adapt a NANSEN for other tasks, a user has to describe alternative solutions by means of criteria along with their values and significances. Then, the NANSEN will automatically perform a multiple criteria evaluation of available solutions, calculate their utility degrees and adjust market values, join combinations of solutions into the most efficient projects, visualize the results, and enable a user to select the most rational project alternative. Most of the systems available in scientific literature are dedicated to solving individual problems in single stages of respective life-cycle (i.e., design, construction, refurbishment) or are used for particular types of buildings (i.e., public, office, cultural heritage). Indeed, authors agree that development of new decision support systems has a huge positive impact on the energy efficiency improvement of a built environment as a whole, and believe that the presented NANSEN system will contribute to better-informed, less time-consuming decisions.
A system is dedicated to stakeholders who are involved in the design and development processes of energy-efficient built environment. Based on this model, stakeholders can develop many alternative versions of the projects, in order to assess them and to make the final choice of the most rational one. Currently, it is used for educational purposes.
The proposed NANSEN is easy to use in real world applications. An initial multiple criteria evaluation and a multivariant design of alternatives can be performed using open source software created in framework of the IDES-EDU project. It is available at http://iti.vgtu.lt/ieeppt/vartotojosistemos.aspx with the system administrator’s permission. Within the IDES-EDU platform, a user is able to create initial data tables of the objects and their criteria, and the calculations are performed in an automated manner. A user manual is also available [50]. To perform visual data mining, the SOM toolbox, as a package for MATLAB, is necessary. Thus, a MATLAB license must be obtained. However, the method can be implemented using open-source environments, for example, R, which is a free software environment for statistical computing and graphics, and which compiles and runs on a wide variety of UNIX platforms, Windows, and MacOS.
The SOM Toolbox 2.0 [49] was used for present simulation. However, hardware configuration does not affect the experimental results from the side of the SOM-type neural network. The authors used a rather small configuration of the SOM for the experiments. The maximal number of neurons does not exceed 100. Therefore, there are no special requirements for the software and hardware.
Some limitations need discussion. Present publication focuses on the methodology of research; in the future publications, authors will provide more detailed explanations on different building elements and their evaluation. The presented simulation results are pertinent to the case of the energy-efficient house design. The customer who aims to build this house determined the energy-related solutions, along with their evaluation criteria and significances. If other stakeholders evaluate the solutions, different results can be obtained. For increased objectivity, the intention of these authors in their future research is to apply expert methods for developing energy-efficiency improvement solutions, their evaluation criteria, and the determination of criteria values and significances in the future publications. Moreover, the authors aim to perform simulations for other types of buildings, that is, public and office buildings. Furthermore, they intend to integrate the NANSEN with the biometric stress management system [51], which will enable a more accurate analysis of customer requirements. Finally, a cost–benefit analysis regarding the implementation of the proposed solutions will be considered in the future research.

5. Conclusions

Selection of the most rational energy-efficiency measures in a built environment is a multidimensional problem whose solution requires consideration of stakeholders’ needs as well as external and internal environmental factors.
The experimental results revealed that the methods of multiple criteria evaluation, multivariant design, and multidimensional data visualization using ANNs can be successfully integrated for development of the decision support systems aimed at improvement of the energy efficiency in a built environment. Using integrated methods, the presented NANSEN system enables a user to develop up to 100,000,000 combinations of alternative energy-efficiency improvement solutions. Moreover, the system allows determining the strengths and weaknesses of each energy-efficient built environment project and its components, provides recommendations, and calculates utility degrees along with multidimensional data visualization by SOM-type neural networks.
In the experimental case, the NANSEN has developed 16,329,600 alternative combinations of energy-efficient individual house elements and recommended that a user manufacture windows at the company “Baltijos langai”, incorporate “TGE-Electrochrome” smart glasses, select doors from “Fortas”, use “PAROC FAS 1” wall insulation and “EUROMAC2 MTP2-46” roof insulation, to install “LGH-50RX5” energy recovery system, “WATT 3000 S” solar panels, “GMSW 10 plius” geothermal boiler, to choose walls with smart elements, and to use “FUGA NANOTHECH 730” nano-structured grout. Visual data mining results can be used for selecting the final set of alternatives and criteria in the decision-making problem, taking into account the discovered similarities of alternatives or criteria.

Author Contributions

Conceptualization, A.K.; Methodology, A.K. and G.D.; Data Curation, O.K., L.K. and J.N.; Validation, L.T., O.K., I.V. and Y.R.; Investigation, A.K., L.T., O.K., J.N., L.K., I.V. and Y.R.; Writing-Original Draft Preparation, A.K., G.D., I.V. and L.T.

Funding

This research was partly funded by the IEE project “Master and Post Graduate education and training in multidisciplinary teams implementing EPBD and beyond” (IDES-EDU), no. IEE/09/631/SI2.558225.

Conflicts of Interest

The authors declare no conflict of interest.

References

  1. Dean, B.; Dulac, J.; Petrichenko, K.; Graham, P. Towards a Zero-Emission, Efficient, and Resilient Buildings and Construction Sector. Global Status Report. 2017. Available online: http://www.worldgbc.org/sites/default/files/UNEP%20188_GABC_en%20%28web%29.pdf (accessed on 20 June 2018).
  2. Energy Consumption in 2016 Consumption in the EU above the Energy Efficiency Target 4% Gap for Primary Energy Consumption and 2% Gap for Final Energy Consumption Targets. Available online: http://ec.europa.eu/eurostat/documents/2995521/8643581/8-05022018-BP-EN.pdf/1338cf55-5c91-4179-a6ca-808675e40bbd (accessed on 15 June 2018).
  3. Van Dijk, D.; Wouters, P.; Hogeling, J. The European Directive on Energy Performance of Buildings (EPBD): The EPBD buildings platform. ASHRAE Trans. 2008, 114, 338–341. [Google Scholar]
  4. Rogerson, R.; Bellingham, R.; Shevtsova, Y. Changing Behaviour and Attitudes to Sustainability: A Report for the Department of Enterprise, Trade and Investment; University of Strathclyde: Glasgow, UK, 2009. [Google Scholar]
  5. Coppielo, S. Achieving affordable housing through energy efficiency strategy. Energy Policy 2015, 85, 288–298. [Google Scholar] [CrossRef]
  6. Nikolaidis, Y.; Pilavachi, P.A.; Chletsis, A. Economic evaluation of energy saving measures in a common type of Greek building. Appl. Energy 2009, 86, 2550–2559. [Google Scholar] [CrossRef] [Green Version]
  7. Verbeeck, G.; Hens, H. Energy savings in retrofitted dwellings: Economically viable? Energy Build. 2005, 37, 747–754. [Google Scholar] [CrossRef]
  8. Zalejska-Jonsson, A.; Lind, H.; Hintze, S. Low-energy versus conventional residential buildings: Cost and profit. J. Eur. Real Estate Res. 2012, 5, 211–228. [Google Scholar] [CrossRef]
  9. Eshraghi, J.; Narjabadifam, N.; Mirkhani, N.; Khosroshahi, S.S.; Ashjaee, M. A comprehensive feasibility study of applying solar energy to design a zero energy building for a typical home in Tehran. Energy Build. 2014, 72, 329–339. [Google Scholar] [CrossRef]
  10. Kumbaroğlu, G.; Madlener, R. Evaluation of economically optimal retrofit investment options for energy savings in buildings. Energy Build. 2012, 49, 327–334. [Google Scholar] [CrossRef]
  11. Psomopoulos, C.S.; Ioannidis, G.C.; Kaminaris, S.D. Electricity production from small-scale photovoltaics in urban areas. In Promoting Sustainable Practices through Energy Engineering and ASSET Management; González-Prida, V., Raman, A., Eds.; IGI Global: Hershey, PA, USA, 2015. [Google Scholar]
  12. Kaklauskas, A. Analysis of the Life Cycle of a Built Environment; Nova Science Publishers: New York, NY, USA, 2016; p. 222. [Google Scholar]
  13. Labonnote, N.; Skaar, C.; Rüther, P. The potential of decision support systems for more sustainable and intelligent constructions: A short overview. Procedia Manuf. 2017, 12, 33–41. [Google Scholar] [CrossRef]
  14. Kaklauskas, A. Intelligent decision support systems. In Biometric and Intelligent Decision Making Support; Springer International Publishing: Basel, Switzerland, 2015; pp. 31–85. [Google Scholar]
  15. Banaitiene, N.; Banaitis, A.; Kaklauskas, A.; Zavadskas, E.K. Evaluating the life cycle of a building: A multivariant and multiple criteria approach. Omega 2008, 36, 429–441. [Google Scholar] [CrossRef]
  16. Kaklauskas, A. Degree of project utility and investment value assessments. Int. J. Comput. Commun. Control 2016, 11, 666–683. [Google Scholar] [CrossRef]
  17. Dzemyda, G.; Kurasova, O.; Žilinskas, J. Multidimensional Data Visualization: Methods and Applications; Springer: Berlin, Germany, 2013. [Google Scholar]
  18. Buffat, R.; Schmid, L.; Heeren, N.; Froemelt, A.; Raubal, M.; Hellweg, S. GIS-based decision support system for building retrofit. Energy Procedia 2017, 122, 403–408. [Google Scholar] [CrossRef]
  19. Thomas, A.; Menassa, C.C.; Kamat, V.R. A systems simulation framework to realize net-zero building energy retrofits. Sustain. Cities Soc. 2018, 41, 405–420. [Google Scholar] [CrossRef]
  20. Carli, R.; Dotoli, M.; Pellegrino, R. A decision-making tool for energy efficiency optimization of street lighting. Comput. Oper. Res. 2018, 96, 223–235. [Google Scholar] [CrossRef]
  21. Mora, T.D.; Peron, F.; Romagnoni, P.; Almeida, M.; Ferreira, M. Tools and procedures to support decision making for cost-effective energy and carbon emissions optimization in building renovation. Energy Build. 2018, 167, 200–215. [Google Scholar] [CrossRef]
  22. Bernardo, H.; Gaspar, A.; Antunes, C.H. An application of a multi-criteria decision support system to assess energy performance of school buildings. Energy Procedia 2017, 122, 667–672. [Google Scholar] [CrossRef]
  23. Gigliarelli, E.; Calcerano, F.; Cessari, L. Heritage Bim, numerical simulation and decision support systems: An integrated approach for historical buildings retrofit. Energy Procedia 2017, 133, 135–144. [Google Scholar] [CrossRef]
  24. Beccali, M.; Ciulla, G.; Lo Brano, V.; Galatioto, A.; Bonomolo, M. Artificial neural network decision support tool for assessment of the energy performance and the refurbishment actions for the non-residential building stock in Southern Italy. Energy 2017, 137, 1201–1218. [Google Scholar] [CrossRef]
  25. Khayatian, F.; Sarto, L.; Dall’O’, G. Building energy retrofit index for policy making and decision support at regional and national scales. Appl. Energy 2017, 206, 1062–1075. [Google Scholar] [CrossRef]
  26. Corneli, A.; Meschini, S.; Villa, V.; Di Giuda, G.M.; Carbonari, A. A decision support system for the multicriteria analysis of existing stock. Procedia Eng. 2017, 196, 682–689. [Google Scholar] [CrossRef]
  27. Lombardi, P.; Abastante, F.; Torabi Moghadam, S.; Toniolo, J. Multicriteria spatial decision support systems for future urban energy retrofitting scenarios. Sustainability 2017, 9, 1252. [Google Scholar] [CrossRef]
  28. Kamari, A.; Jensen, S.; Christensen, M.L.; Petersen, S.; Kirkegaard, P.H. A hybrid decision support system for generation of holistic renovation scenarios—Cases of energy consumption, investment cost, and thermal indoor comfort. Sustainability 2018, 10, 1255. [Google Scholar] [CrossRef]
  29. Capozzoli, A.; Corno, F.; Corrado, V.; Gorrino, A. The overall architecture of a decision support system for public buildings. Energy Procedia 2015, 78, 2196–2201. [Google Scholar] [CrossRef]
  30. Yang, J.; Ogunkah, I. A multi-criteria decision support system for the selection of low-cost green building materials and components. J. Build. Constr. Plan. Res. 2013, 1, 89–130. [Google Scholar] [CrossRef]
  31. Kabak, M.; Köse, E.; Kırılmaz, O.; Burmaoğlu, S. A fuzzy multi-criteria decision-making approach to assess building energy performance. Energy Build. 2014, 72, 382–389. [Google Scholar] [CrossRef]
  32. Torrieri, F.; Batà, A. Spatial multi-criteria decision support system and strategic environmental assessment: A case study. Buildings 2017, 7, 96. [Google Scholar] [CrossRef]
  33. Ruiz, M.C.; Fernández, I. Environmental assessment in construction using a spatial decision support system. Automat. Constr. 2009, 18, 1135–1143. [Google Scholar] [CrossRef]
  34. Muralitharan, K.; Sakthivel, R.; Vishnuvarthanc, R. Neural network based optimization approach for energy demand prediction in smart grid. Neurocomputing 2018, 273, 199–208. [Google Scholar] [CrossRef]
  35. Deb, C.; Lee, S.E.; Santamouris, M. Using artificial neural networks to assess HVAC related energy saving in retrofitted office buildings. Sol. Energy 2018, 163, 32–44. [Google Scholar] [CrossRef]
  36. Teich, T.; Roessler, F.; Kretz, D.; Franke, S. Design of a prototype neural network for smart homes and energy efficiency. Procedia Eng. 2014, 69, 603–608. [Google Scholar] [CrossRef]
  37. Dong, Q.; Xing, K.; Zhang, H. Artificial neural network for assessment of energy consumption and cost for cross laminated timber office building in severe cold regions. Sustainability 2018, 10, 84. [Google Scholar] [CrossRef]
  38. Šliogerienė, J.; Kaklauskas, A.; Štreimikienė, D.; Bianchi, M. Multiple criteria decision support system for the assessment of energy generation technologies considering the dimension of values. Int. J. Strateg. Prop. Manag. 2012, 16, 370–391. [Google Scholar] [CrossRef]
  39. Kaklauskas, A.; Rutė, J.; Zavadskas, E.K.; Daniūnas, A.; Pruskus, V.; Bivainis, J.; Gudauskas, R.; Plakys, V. Passive house model for quantitative and qualitative analyses and its intelligent system. Energy Build. 2012, 50, 7–18. [Google Scholar] [CrossRef]
  40. Kanapeckienė, L.; Kaklauskas, A.; Zavadskas, E.K.; Raslanas, S. Method and system for multi-attribute market value assessment in analysis of construction and retrofit projects. Expert Syst. Appl. 2011, 38, 14196–14207. [Google Scholar] [CrossRef]
  41. Kaklauskas, A.; Zavadskas, E.K.; Naimavičienė, J.; Krutinis, M.; Plakys, V.; Venskus, D. Model for a complex analysis of intelligent built environment. Autom. Constr. 2010, 19, 326–340. [Google Scholar] [CrossRef]
  42. Kaklauskas, A.; Kliukas, R.; Komka, A.; Šliogerienė, J. Decision support system of built environment for climate change mitigation. Adv. Intell. Syst. Res. 2013, 33, 727–730. [Google Scholar]
  43. Cauberg-Huygen Consulting Engineers; Op’t Veld, P. Master and Post Graduate Education and Training in Multidisciplinary Teams Implementing EPBD and Beyond. Final Publishable Report. 2013. Available online: http://proftrac.eu/fileadmin/user_upload/IDES-EDU_Final_Report.pdf (accessed on 15 June 2018).
  44. Brunsgaard, C.; Dvořáková, P.; Wyckmans, A.; Stutterecker, W.; Laskari, M.; Almeida, M.; Kabele, K.; Magyar, Z.; Bartkiewicz, P.; Op’t Veld, P. Integrated energy design–Education and training in cross-disciplinary teams implementing energy performance of buildings directive (EPBD). Build. Environ. 2014, 72, 1–14. [Google Scholar] [CrossRef]
  45. Wyckmans, A.; Skeie, K.; Jurosevic, S.; Pachecho, F.; Haase, M.; Dubois, M.-C.; Op’t Veld, P.; Brunsgaard, C. Report on Internal and External Monitoring of Results (D6.1). Project “Master and Post Graduate Education and Training in Multidisciplinary Teams Implementing EPBD and Beyond”. 2013. Available online: https://ec.europa.eu/energy/intelligent/projects/en/projects/ides-edu (accessed on 29 July 2018).
  46. Kohonen, T. Self-Organizing Maps, 3rd ed.; Springer Series in Information Sciences; Springer: Berlin, Germany, 2001. [Google Scholar]
  47. Bernatavičienė, J.; Dzemyda, G.; Kurasova, O.; Marcinkevičius, V. Optimal decisions in combining the SOM with nonlinear projection methods. Eur. J. Oper. Res. 2006, 173, 729–745. [Google Scholar] [CrossRef]
  48. Dzemyda, G.; Kurasova, O. Heuristic approach for minimizing the projection error in the integrated mapping. Eur. J. Oper. Res. 2006, 171, 859–878. [Google Scholar] [CrossRef]
  49. Alhoniemi, E.; Himberg, J.; Parhankangas, J.; Vesanto, J. SOM Toolbox for Matlab 5; Helsinky University of Technology, Report A57; Libella Oy: Espoo, Finland, 2000; Available online: http://www.cis.hut.fi/projects/somtoolbox/ (accessed on 15 June 2018).
  50. Kaklauskas, A. An Intelligent Dynamical and Adaptive Multimedia Teaching Portal. User Manual; Vilnius University Press: Vilnius, Lithuania, 2013. [Google Scholar]
  51. Kaklauskas, A.; Zavadskas, E.K.; Pruskus, V.; Vlasenko, A.; Bartkiene, L.; Paliskiene, R.; Zemeckyte, L.; Gerstein, V.; Dzemyda, G.; Tamulevicius, G. Recommended biometric stress management system. Expert Syst. Appl. 2011, 38, 14011–14025. [Google Scholar] [CrossRef]
Figure 1. A model for selection of energy-efficiency improvement solutions. SOM—self-organizing map.
Energies 11 01994 g001
Figure 2. Structure of the NANSEN.
Energies 11 01994 g002
Figure 3. Initial data for analysis of the insulation of walls.
Energies 11 01994 g003
Figure 4. Multiple criteria evaluation of the insulation for walls.
Energies 11 01994 g004
Figure 5. Fragment of advice for users.
Energies 11 01994 g005
Figure 6. The “Kauno šilas 1” insulation market value analysis.
Energies 11 01994 g006
Figure 7. Development of the combinations of energy-efficient alternatives and their multiple criteria analysis (fragment).
Energies 11 01994 g007
Figure 8. Alternatives for insulation of walls on the self-organizing map (SOM).
Energies 11 01994 g008
Figure 9. Criteria describing the insulation of walls on the SOM.
Energies 11 01994 g009
Figure 10. Visualization of combinations: (a) Combinations of alternative energy-efficient solutions on the SOM; (b) Neurons-winners for alternative combinations.
Energies 11 01994 g010
Table 1. Review of the energy-related decision support systems in the area of built environment. GIS—geographic information systems; ANN—artificial neural networks.
ReferenceTitleApplication Area/FunctionsMethods
Multiple criteria EvaluationMultivariant Design/ScenariosMarket Value/Cost OptimizationANNs
[18]GIS-based decision support system for building retrofitGIS-based selection and comparison of retrofit scenarios in terms of energy savings and carbon emissions.NoYesNoNo
[19]Systems simulation framework to realize net-zero building energy retrofitsAssessment of energy needs during a lifecycle, determination the best strategies to retrofit a building stock. Used for retrofit of public buildings.NoYesNoNo
[20]Decision-making tool for energy efficiency optimization of street lightingOptimization of interventions on energy retrofits of public street lighting systems.YesNoNoNo
[21]The A56opt-toolDecision support for cost-effective energy and carbon emissions optimization in building renovation; estimation of renovation packages.NoNoYesNo
[22]Multi criteria decision support system to assess energy performance of school buildingsAssessment of energy performance of school buildings based on ELECTRE TRI method.YesNoNoNo
[23]Integrated heritage building information modelling (BIM), numerical simulation, and decision support systemsSelection of the best retrofit solution for a pilot historical building.YesNoYesNo
[24]Artificial neural network decision support tool for assessment of the energy performance and the refurbishment actionsEnergy and economic evaluation of the best refurbishment actions. Used for the non-residential building stock in southern Italy.NoNoYesYes
[25]Framework to support decisions for building energy retrofit Development of indicator to support policies of building energy retrofit by machine learning procedures.NoNoNoYes
[26]Decision support system for the multicriteria analysis of existing stockAssessment of the quality of large building stock by Bayesian Networks to prioritize refurbishment actionsYesNoNoNo
[27]Multicriteria spatial decision support systems for future urban energy retrofitting scenariosIntegration of two instruments (GIS and multiple criteria decision support) to identify and evaluate alternative energy urban scenarios in a long-term period perspective.YesNoNoNo
[28]Hybrid decision support system for generation of holistic renovation scenariosGeneration of renovation scenarios by using genetic algorithm, simulation of scenarios in terms of energy consumption, investment cost and thermal indoor comfort, and determination of optimal scenarios by multiple criteria-based methods. YesYesYesNo
[29]OPTIMUS decision support systemReduction of energy use and CO2 emissions in public buildings through a set of suggested energy management actions.NoNoYesNo
[30]Multi-criteria decision support system for the selection of low-cost green building materials and componentsDecision aid for designers in their choice of materials for low-cost green residential housing projects.YesNoYesNo
[31]Fuzzy multi-criteria decision making approach to assess building energy performanceAssessment of building energy performance, improvement the effectiveness and efficiency of construction based on multiple criteria evaluation.YesNoYesNo
[32]Spatial multi-criteria decision support systemGIS-based preparation of environmental assessment reports and the construction of scenarios for the adoption of urban plans, their multiple criteria evaluation.YesNoNoNo
[33]Spatial decision support systemGIS-based inspection and environmental management of buildings based on multi-criteria evaluation.YesNoNoNo
[34]Neural network based optimization approach for energy demand prediction in smart gridForecasting of energy demand.NoNoNoYes
[35]Artificial neural networks to assess heating, ventilation, and air conditioning HVAC related energy saving HVAC-related energy saving in retrofitted office buildings by ANN-based analysis of pre- and post-retrofit energy consumption data.NoNoNoYes
[36]Prototype neural network for smart homes and energy efficiencyUse of ANNs as a part of smart home systems to design of highly personalized energy-related services. NoNoYesYes
[37]Artificial neural network for assessment of energy consumption and cost for cross laminated timberForecasting of the energy consumption and cost of cross laminated timber office buildings. Used in the early stage of architectural design.NoNoYesYes
[38]Expert decision support system EGTAV-SPSAssessment of energy generation technologies. YesNoYesNo
[39]Intelligent passive house design systemDesign the most efficient alternatives of a passive house by means of multiple criteria analysis, multivariant design, and market value adjustment.YesYesYesNo
[40]Decision support system for construction and retrofit projects (DSS-CRP)Assessment of construction projects in conceptual and qualitative forms, estimation of their market values.YesNoYesNo
[41]Multiple criteria decision support system of intelligent built environment (MDSS-IBE)Design of the intelligent built environment by integration of multiple criteria evaluation, multivariant design, and market value estimation methods.YesYesYesNo
[42]Decision support system of built environment for climate change mitigationAssessment of renovation measures in terms of climate change mitigationYesYesYesNo

