Article

Operation and Economic Assessment of Hybrid Refueling Station Considering Traffic Flow Information

School of Electrical Engineering, Southeast University, Nanjing 210000, China
*
Author to whom correspondence should be addressed.
Energies 2018, 11(8), 1991; https://doi.org/10.3390/en11081991
Submission received: 27 June 2018 / Revised: 24 July 2018 / Accepted: 25 July 2018 / Published: 31 July 2018
(This article belongs to the Section F: Electrical Engineering)

Abstract

:
It is anticipated that the penetration of “Green-Energy” vehicles, including Electric Vehicle (EV), Fuel Cell Vehicle (FCV), and Natural Gas Vehicle (NGV) will keep increasing in next decades. The demand of refueling stations will correspondingly increase for refueling these “Green-Energy” vehicles. While such kinds of “Green-Energy” vehicles can provide both social and economic benefits, effective management of refueling various kinds of these vehicles is necessary to maintain vehicle users’ comfortabilities and refueling station’s return on investment. To tackle these problems, this paper proposes a novel energy management approach for hybrid refueling stations with EV chargers, Hydrogen pumps and gas pumps. Firstly, the detailed models of EV chargers, Hydrogen pumps with electrolyte and hydrogen tank, the gas pumps with gas tank, renewable resources, and battery energy storage systems are established. The forecasting methodologies for renewable energy, electricity price and the traffic flow are also presented to support the hybrid refueling station modeling and operation. Then, a management approach is adopted to manage the refueling various kinds of vehicles with considerations of the refueling station profitability. Finally, the proposed management approach is verified under four different kinds of tariffs- Economy-7, Economy-10, Flat-rate, and Real-Time Pricing (RTP), finding that the proposed management approach has the best performance under RTP tariff. The economic assessment of the Energy Storage System (ESS) is also performed. It is found that the ESS can make the saving up to $127 per day. Different sizes of gas storage tank are compared in the final section as well. The result shows that increasing the size of the tank does not bring attractive extra benefits with the consideration of the investment on enlarging the tank size.

1. Introduction

The “Green-Energy” vehicle has attracted great interests in recent years. When compared to conventional fossil-fuel power vehicles, ”Green-Energy” vehicles offer both social and economic benefits, including high energy efficiency, low greenhouse gas emissions, and low fueling cost [1,2]. A number of countries and areas have already announced the plans of phasing out petrol and diesel cars, such as Scotland and France. This means the petrol and diesel vehicles will be gradually replaced by Electric Vehicles (EVs), Fuel Cell Vehicle (FCV), and Natural Gas Vehicle (NGV) in these countries in the near future. However, due to the natural characteristics of “Green-Energy” vehicles, the energy destiny of battery, natural gas, or hydrogen fuel cell is lower than petrol and diesel, and the refueling frequency of EVs, NGVs, and FCVs is correspondingly higher than the petrol and diesel cars. At the current stage, the number of “Green-Energy” refueling stations are falling behind the increasing of “Green-Energy” vehicles on the road, for example, only 39 hydrogen refueling stations are operating in the whole United States (U.S.) by 2018 [3]. Drivers will be reluctant to purchase green energy vehicles unless the hybrid refueling stations become adequately reliable and available. Thus, to satisfy the refueling demands of “Green-Energy” vehicles, large number of hybrid refueling stations for “Green-Energy” vehicles are expected to be constructed. Since the investment on the hybrid refueling station construction and operation is purely investment behavior, considerable return on the investment is one of the most important motivations for the investors. In order to facilitate the promotion of hybrid refueling stations, the effective management and operation of hybrid refueling station is in necessary. The optimal hybrid refueling station energy management system can schedule the operation of refueling devices and the Distributed Energy Resources (DERs) within the station to satisfy the refueling demands for EVs, NGVs, and FCVs and gain reasonable economic benefits for station operators and investors, and thereby promote the development of green energy vehicle industry.
Previous studies carried out on the management on “New Energy” vehicles refueling stations have confirmed the active impact on economical operation and network reinforcement deferral [4,5]. In order to reduce the operational cost of the integrated smart EV’s charging station with battery energy storage, Yan et al. [6] proposed a four-stage optimization and control algorithm. Other authors [7] introduced an online distributed model predictive control (MPC)-based optimal scheduling algorithm for EV charging stations when considering the network constraints and EV uncertainties. In [8], a business model of ultra-fast charging stations with energy storage system is proposed, it is found that the profitability of charging station can be enhanced with Energy Storage System (ESS) and appropriate management approach. Most of the research performed on the “Green-Energy” vehicles scheduling and management mainly focused on EV charging station under electricity market environment. There are few research performed on the scheduling of refueling station for NGV and FCVs with considerations of different tariffs. However, when compared to EVs, the recharging range and recharging speed of NGV and FCV is attractive. A number of governments, enterprises, and researchers believed that the FCV and NGV would occupy a reasonable market share in automotive market in the future, especially in the developing countries or gas-rich countries [9].
NGVs can usually be refueled in five minutes at most fast-fill compressed natural gas (CNG) refueling stations, which means that the refueling time period of NGVs is comparable to the refueling time period of petrol or diesel cars [10]. Gas compression is the core working process of fast-fill fueling station. It contributes more than 80% electricity consumption of the whole CNG refueling stations [11]. The effectiveness of scheduling the gas compressors will influence the operational cost and working efficiency of CNG refueling station significantly [12]. Plenty of research has been performed on the optimization of CNG refueling station operation, such as [13,14].
FCV is considered as one of the potential replacement for traditional petrol/diesel vehicles [15]. A number of advantages of FCVs, such as long mileage, fast refueling period, and low carbon emission have been defined by governments and researchers. However, there are still critical barriers preventing the wide usage of FCVs, and one of the most critical barriers is the lack of hydrogen infrastructure. Researchers have been working on the improvement of the working efficiency and reduction of the operation costs of hydrogen refueling infrastructures. The literature [16] proposed an Mixed Integer Linear Programming (MILP) model for the optimal design and operation of integrated wind-hydrogen-electricity networks in the United Kingdome (UK). A study [17] presented a framework of planning hydrogen refueling stations on highway considering refueling station within considerations of time-of-use (TOU) electricity rates, and hydrogen refueling station service ability.
For the research on the hybrid refueling stations (or named as “Multi-Service Station”), some studies have been carried out that focusing on the planning and location issues of refueling stations [18,19,20,21]. To the best knowledge of authors, there are little research has been adopted on the operation and economic assessment of refueling stations containing different kinds of charging facilities for EV, FCV, and NGV. Nonetheless, the “new energy” vehicles on the road would be a mixture of EV, FCV, and NGVs in the foreseeable future. There are clear demands of hybrid refueling stations that is able to provide multiple refueling services for the “Green-Energy” vehicles on the road.
In this paper, aiming to facilitate the promotion of the “new energy” vehicles, we introduce the detailed model of refueling station, which is able to accommodate various kinds of “new energy” vehicles. Our model takes multiple uncertainties, including the charging demand vitality, generations of renewable energy, and the electricity price fluctuation into account. Aiming to mitigate the influence of such uncertainties, several forecasting technologies are trialed in the paper to give better inputs to the optimization problem. In addition, various DER technologies are also considered in the refueling station, including solar photovoltaic (PV), wind turbine, and energy storage system. After then, an energy management approach is proposed to solve the mixed integer linear programing problem. Finally, to verify the performance of the proposed model and algorithm, four typical electricity tariffs are utilized in the numerical analysis, and the pay-back period of battery energy storage system is also presented.
The main contributions of this paper can be concluded, as below:
(1)
Detailed models for the hybrid refueling station including CNG refueling facilities, Hydrogen refueling facilities, EV charging facilities, and energy storage systems are presented in this paper. Operational constraints of these facilities are also included, and the EV charging demands are also considered.
(2)
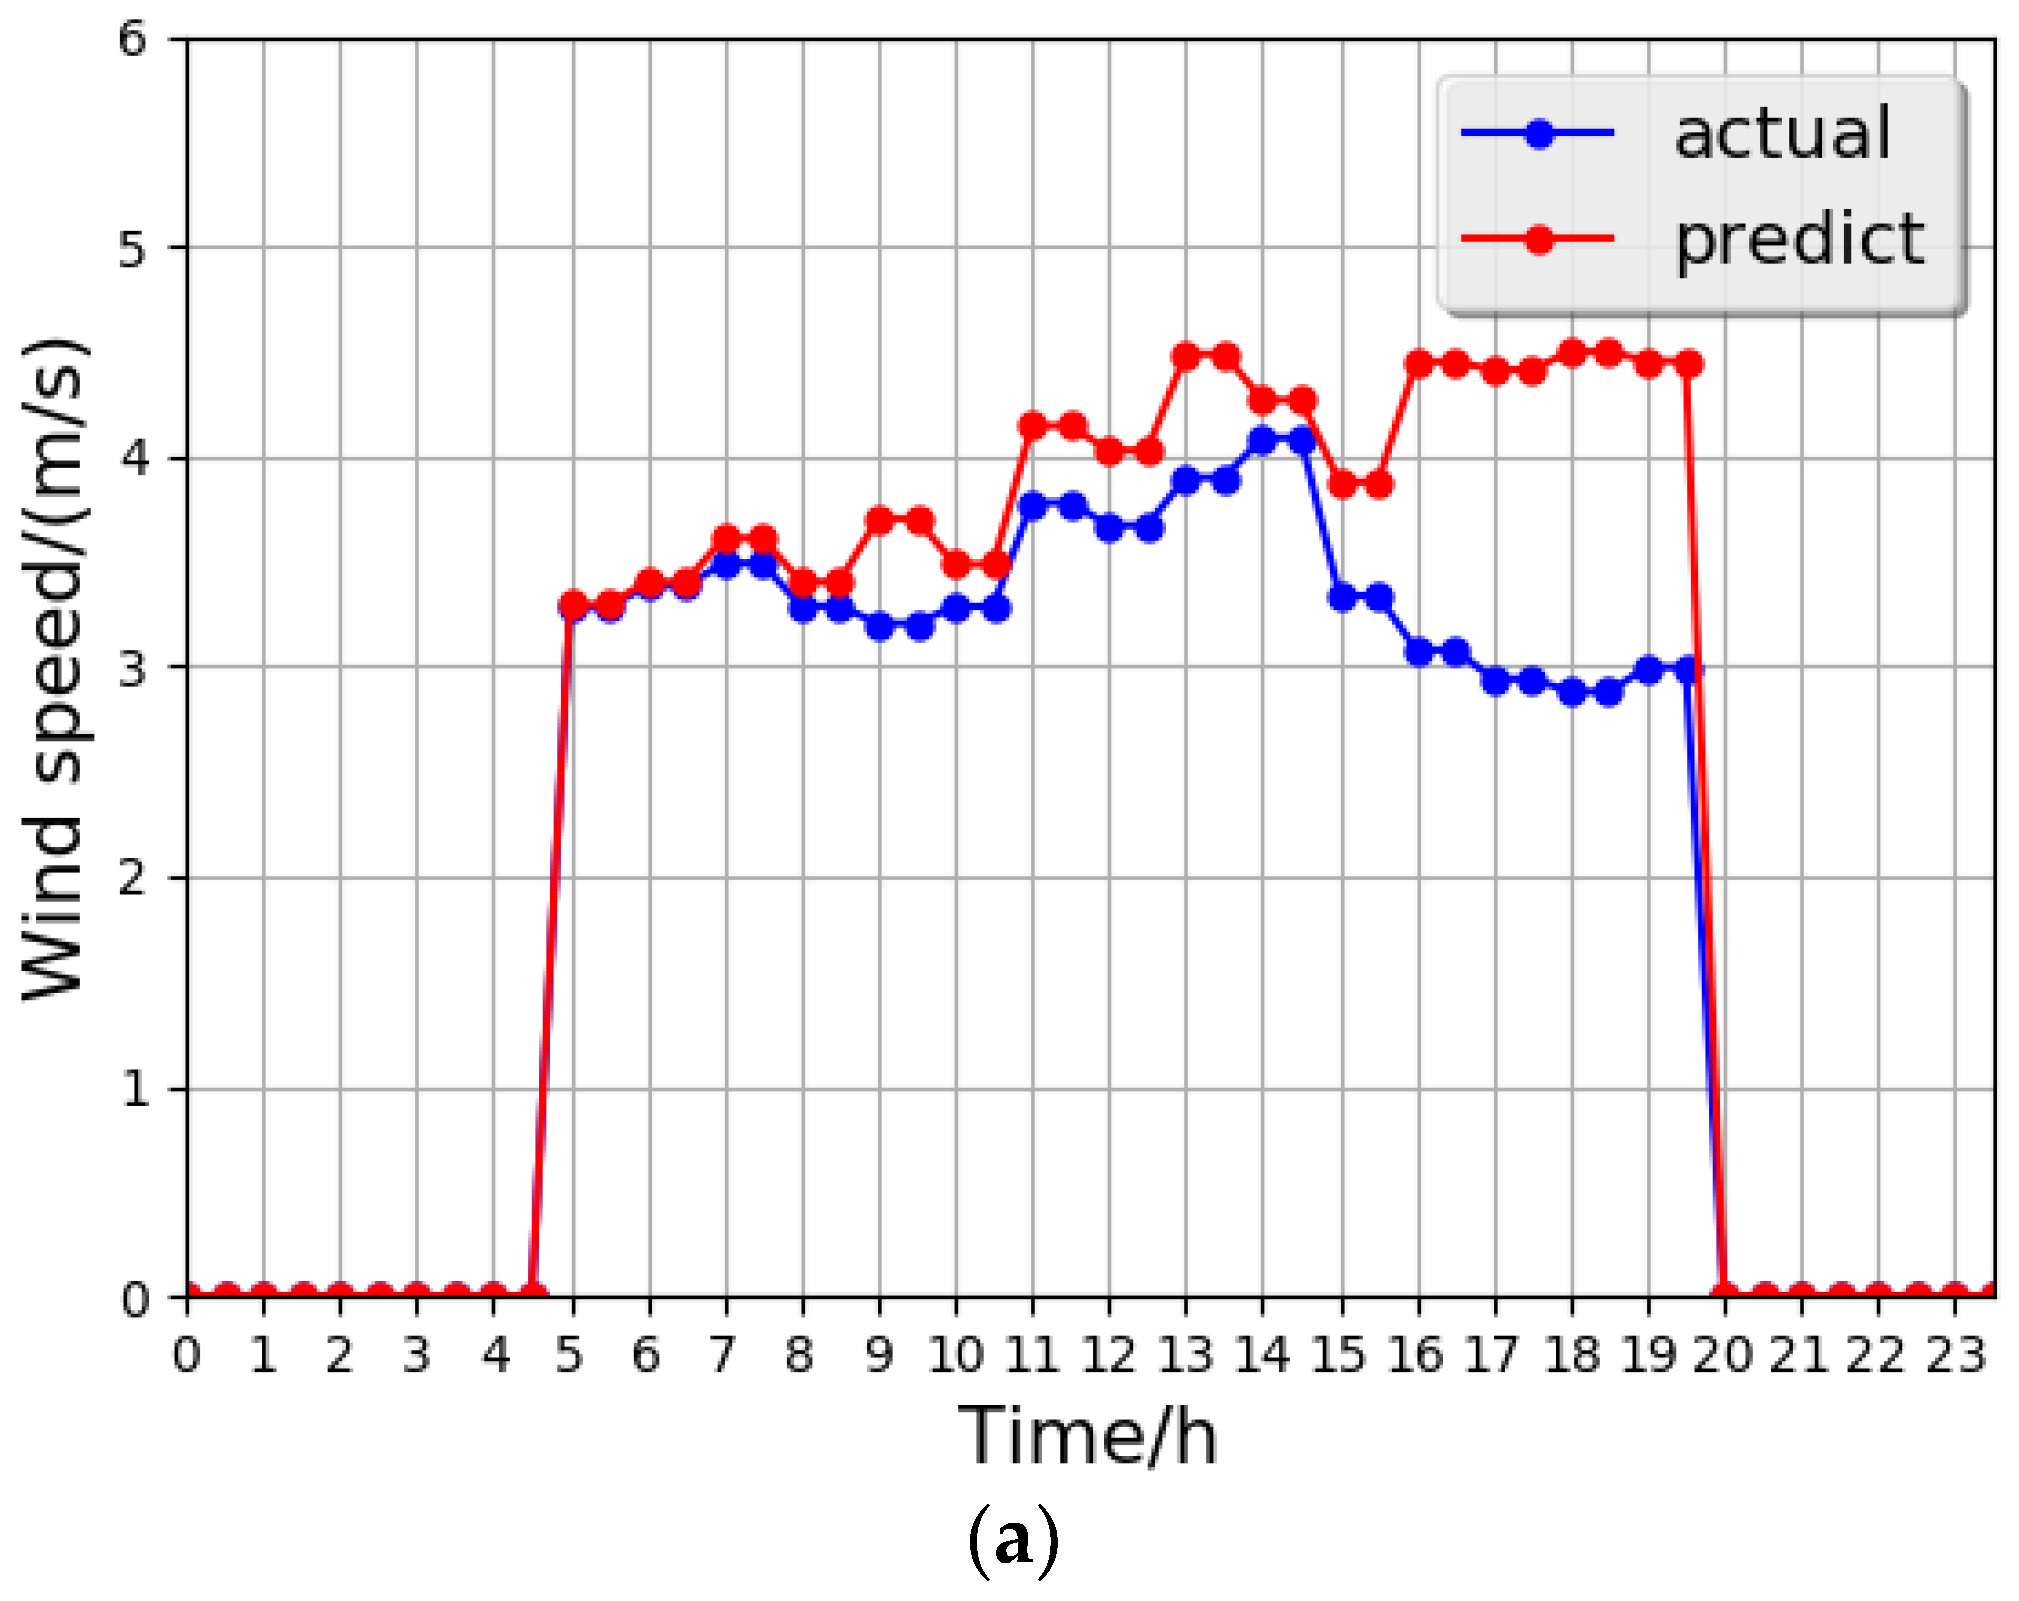
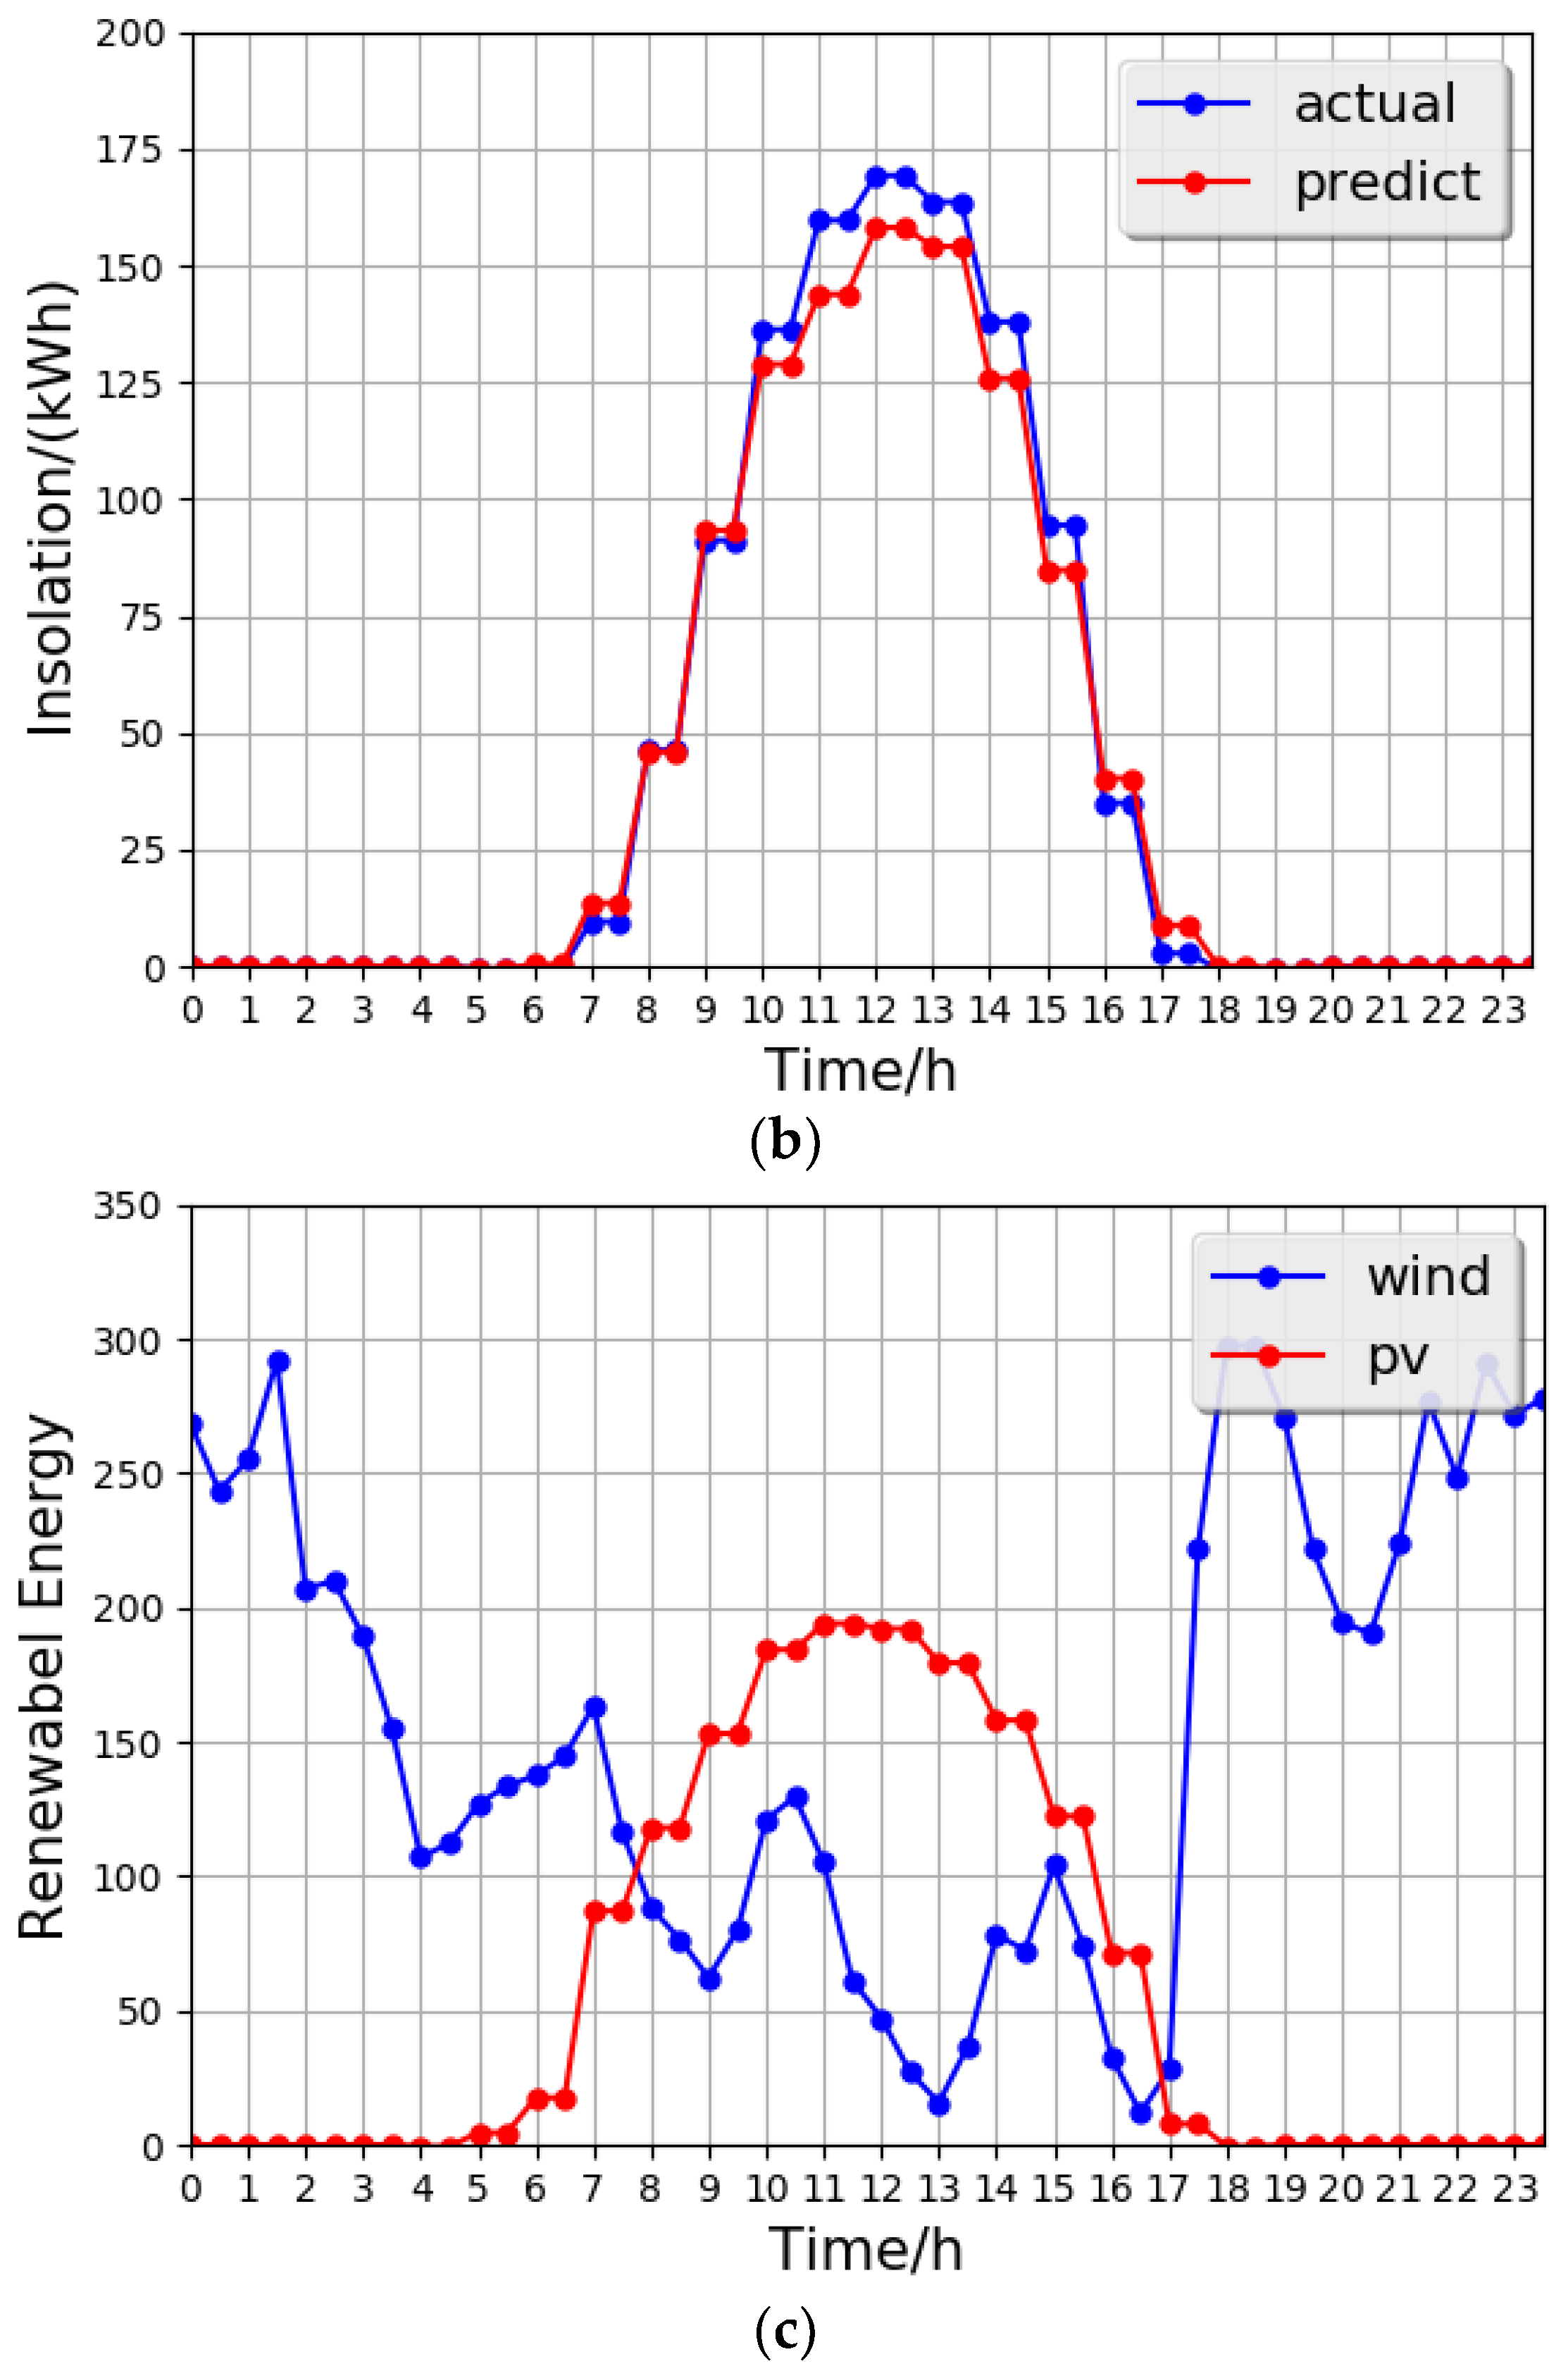
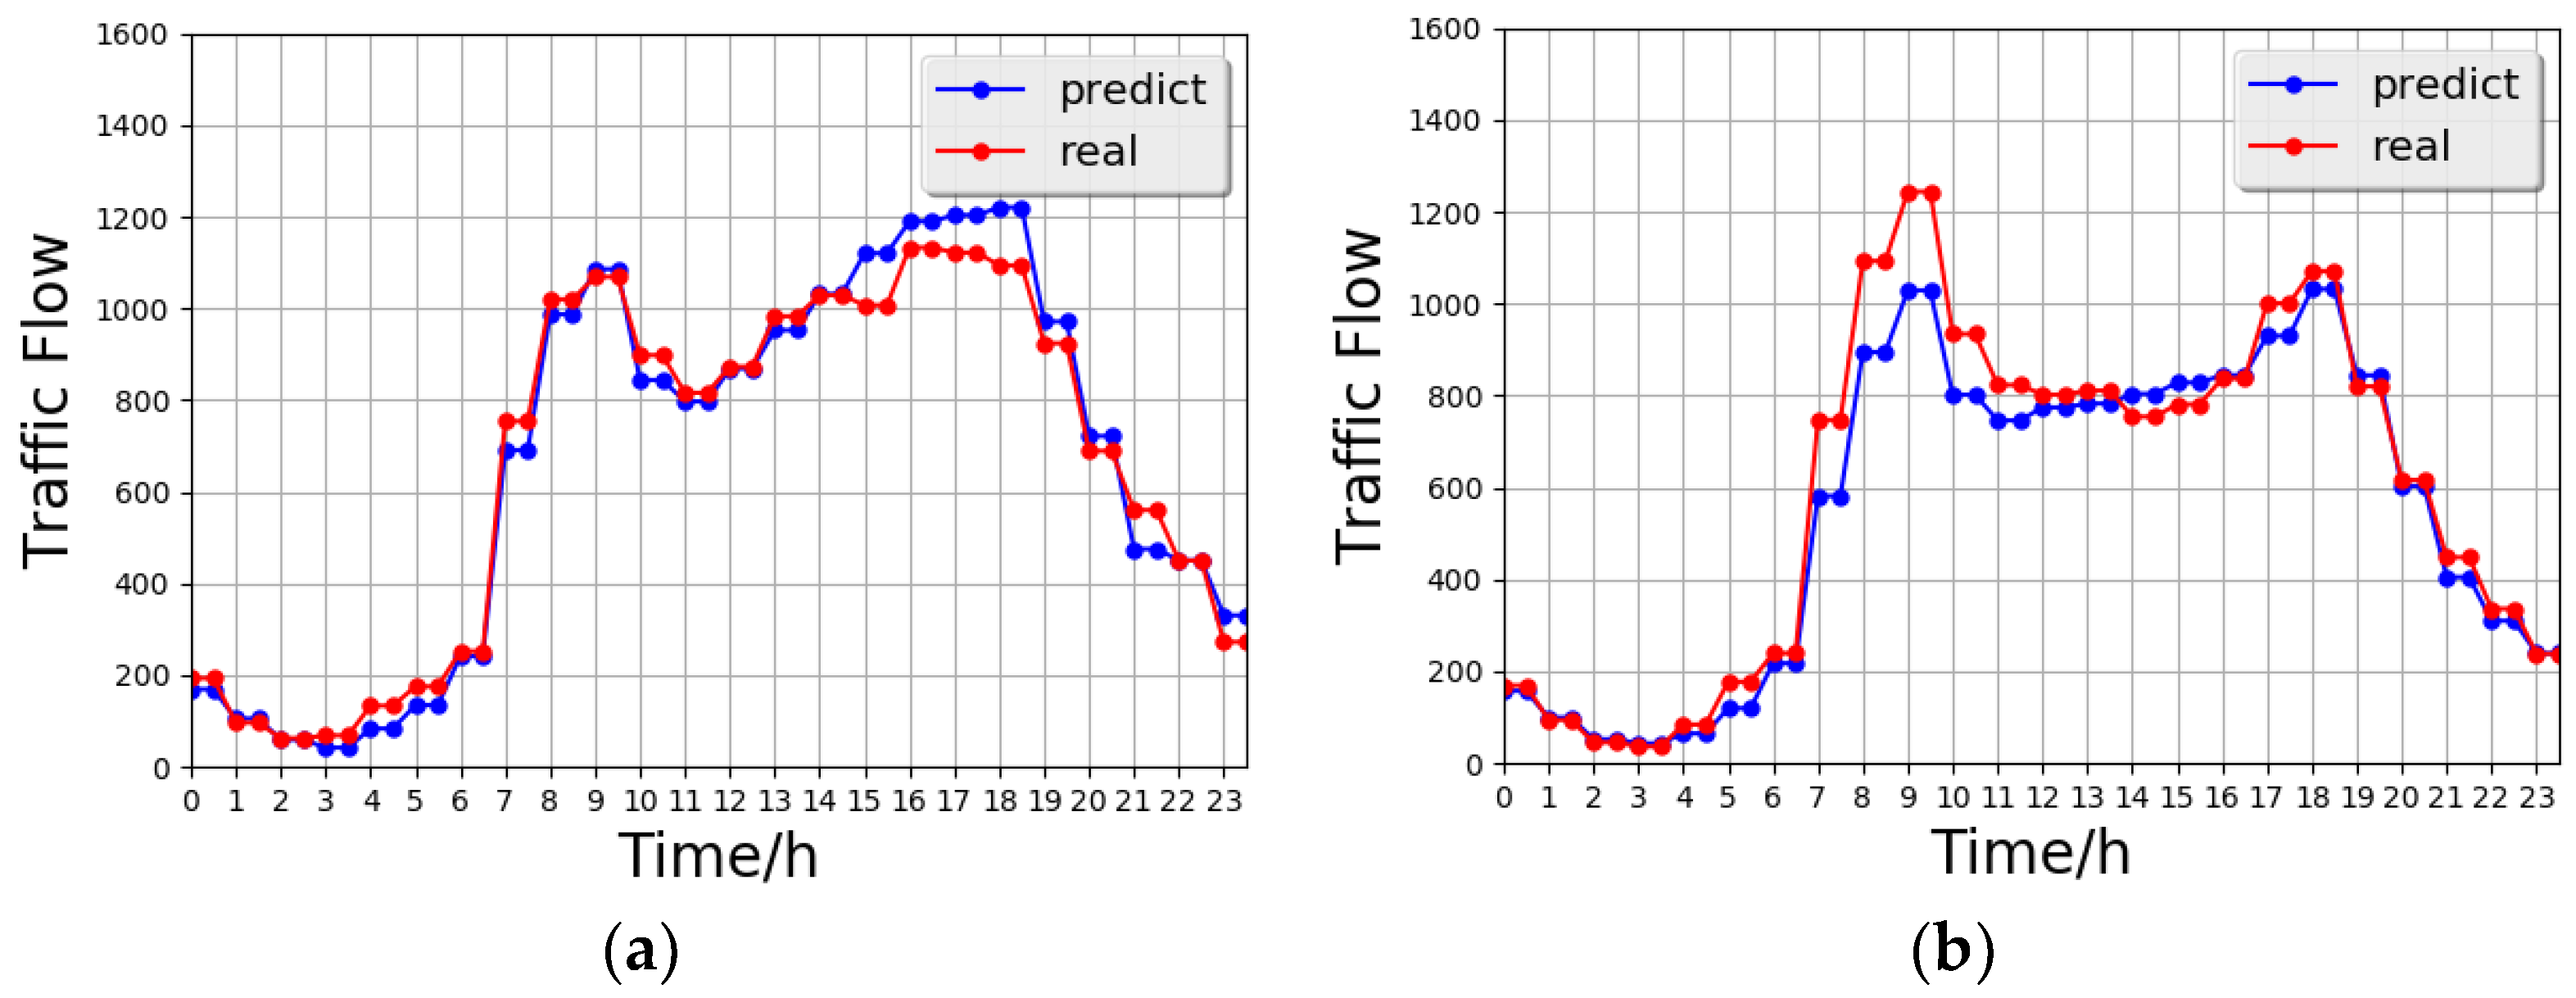
The approach of forecasting the EV charging demand by using historical traffic flow data is investigated. When considering the significant difference of traffic flow in weekday and weekend, the EV charging demands are forecasted based on weekday and weekend data, respectively. Other data applied in the energy management system, such as solar generation, wind generation, and electricity price are forecasted after careful comparison of the forecasting performance among different forecasting methodologies.
(3)
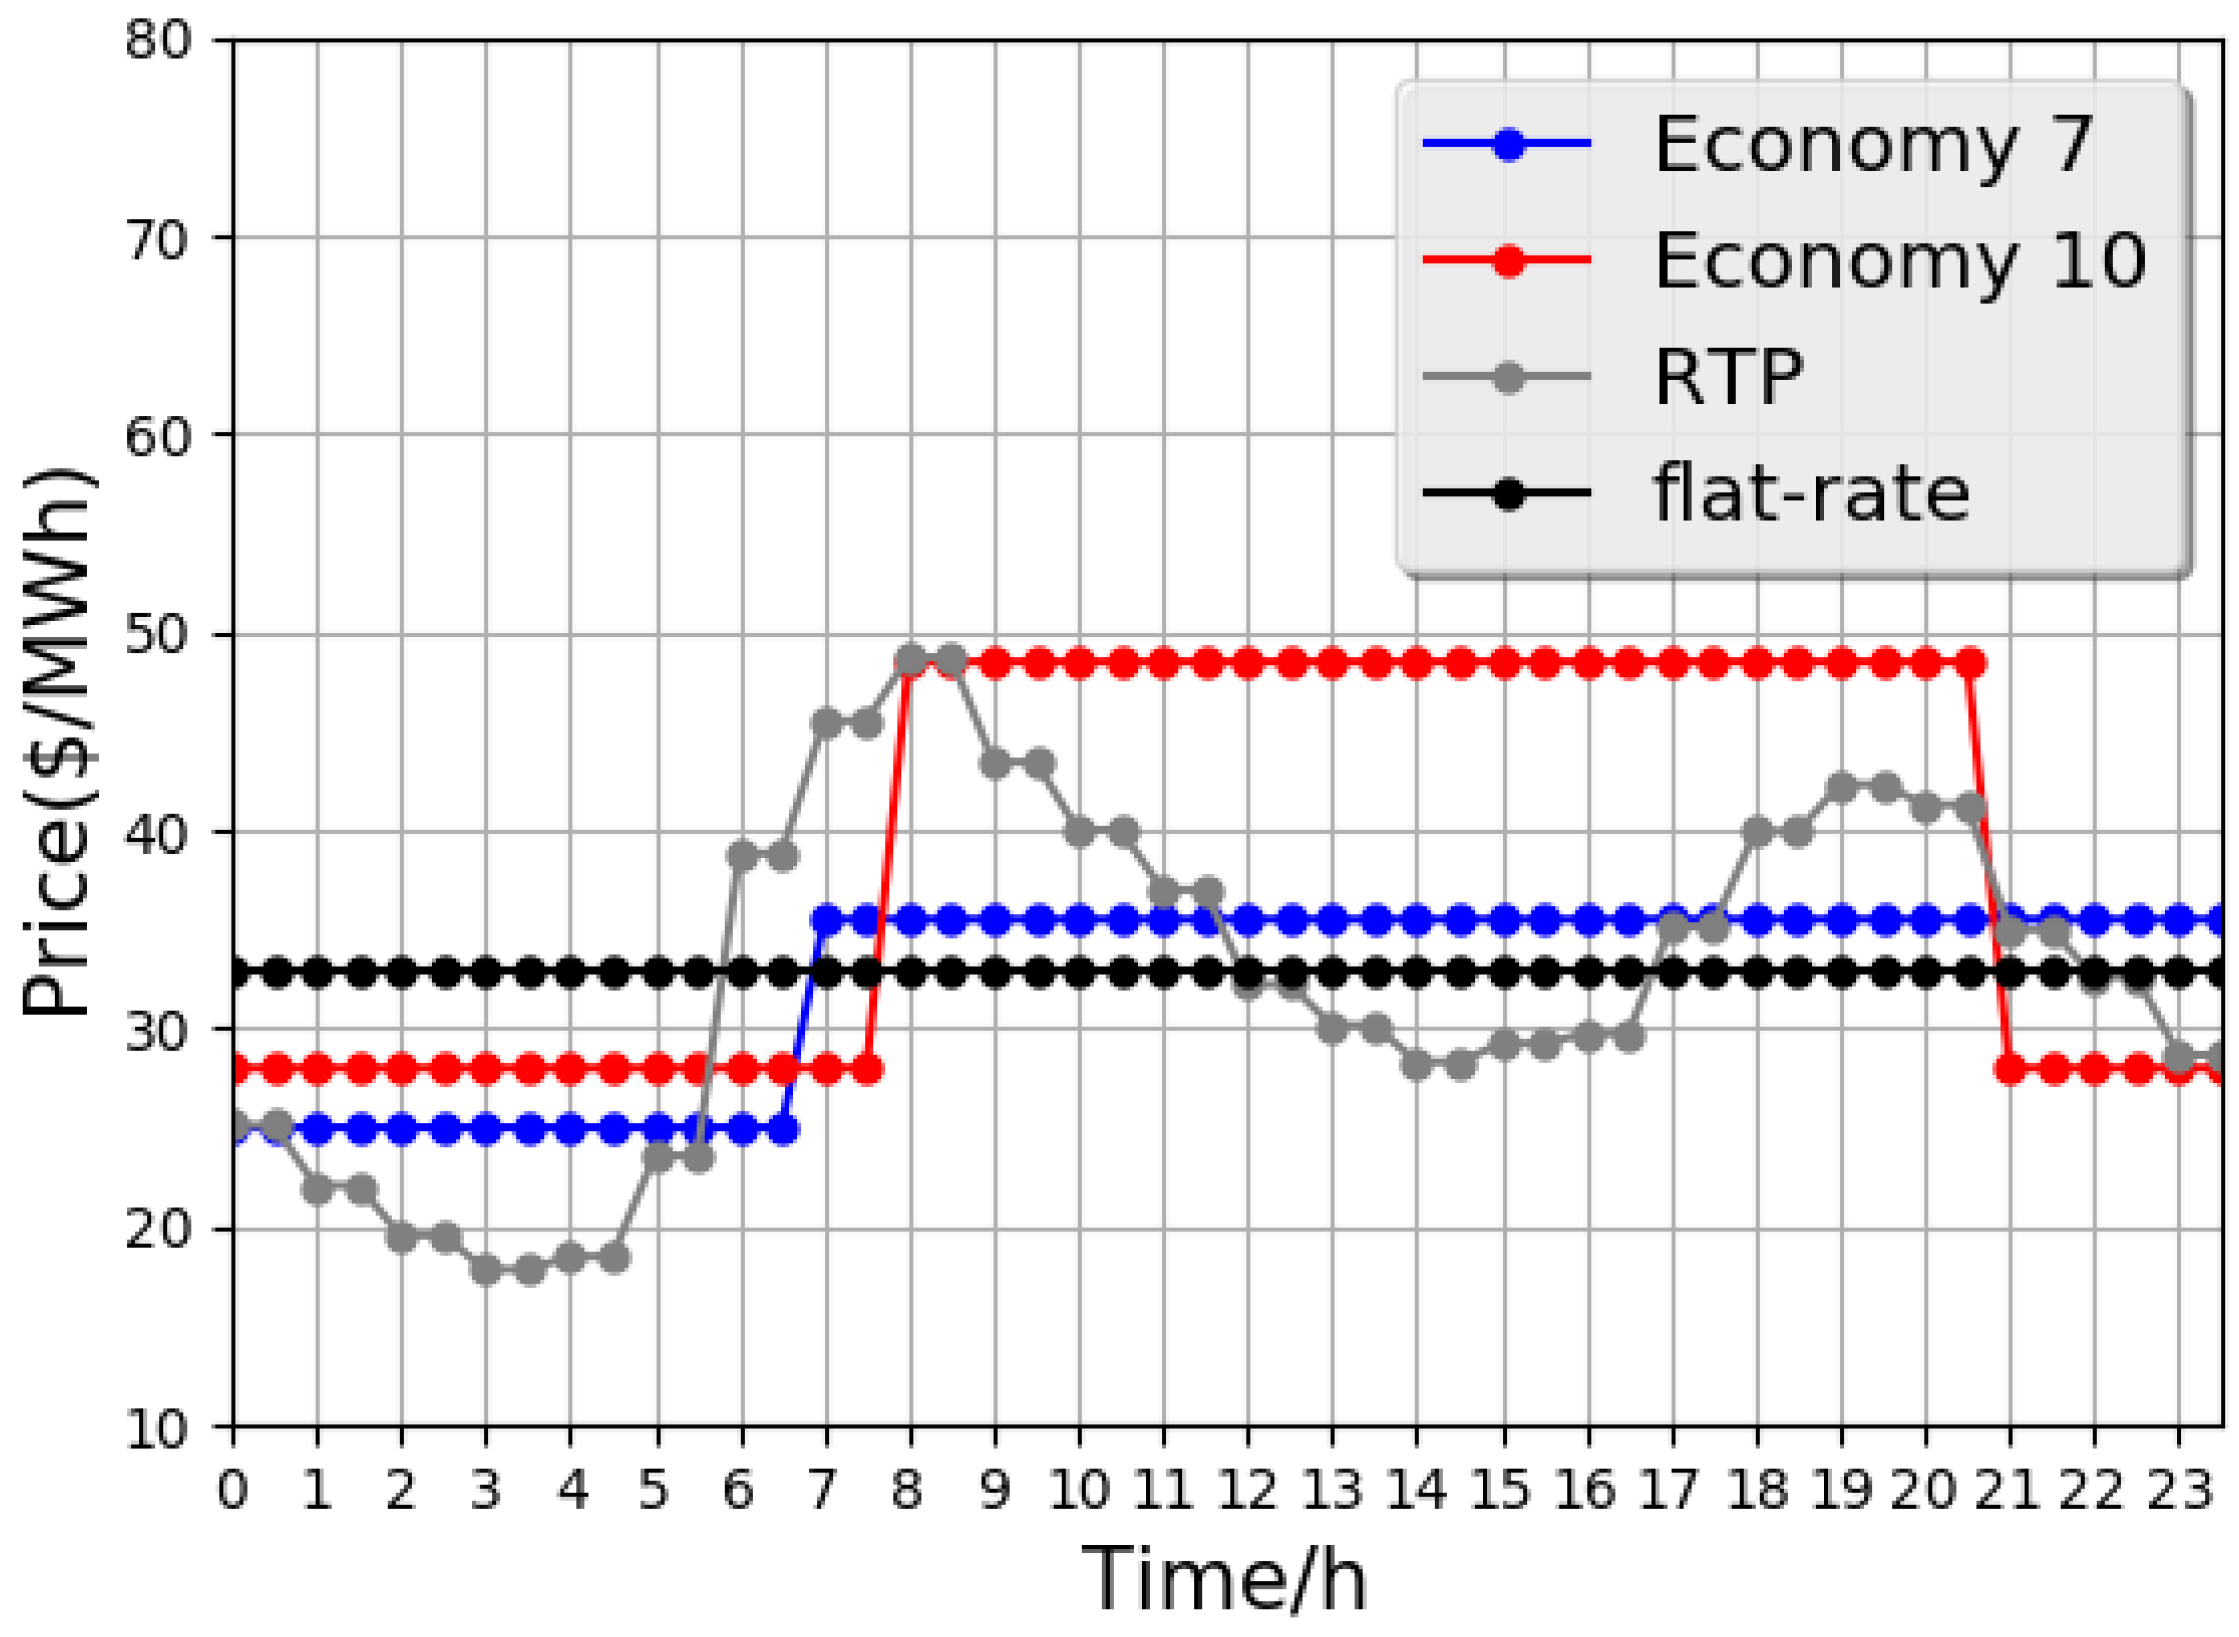
A comprehensive analysis for the performance of proposed energy management approach under various electricity tariffs (Economy 7, Economy 10, Real-Time Pricing, and flat rate tariffs) is presented in this paper. The economic assessment of ESS and the gas tank for the hybrid refueling station is analyzed separately.
The remainder of this paper is organized, as follows: Section 2 presents the general problem formulation. Section 3 introduces the forecasting methodologies for EV charging demands, renewable generations, and electricity price. Section 4 discusses the performance of the proposed energy management approach for the hybrid refueling station under four different electricity tariffs.

2. System Design and Optimization Model

This section firstly presents the system overview of a hybrid refueling station. Then, the detailed models of the key devices of hybrid refueling station, including hydrogen refueling system, gas refueling system, EV charging system, and energy storage system are presented, respectively. Finally, the objective function is proposed and the optimization approach is introduced.

2.1. Hybrid Refueling Station Overview

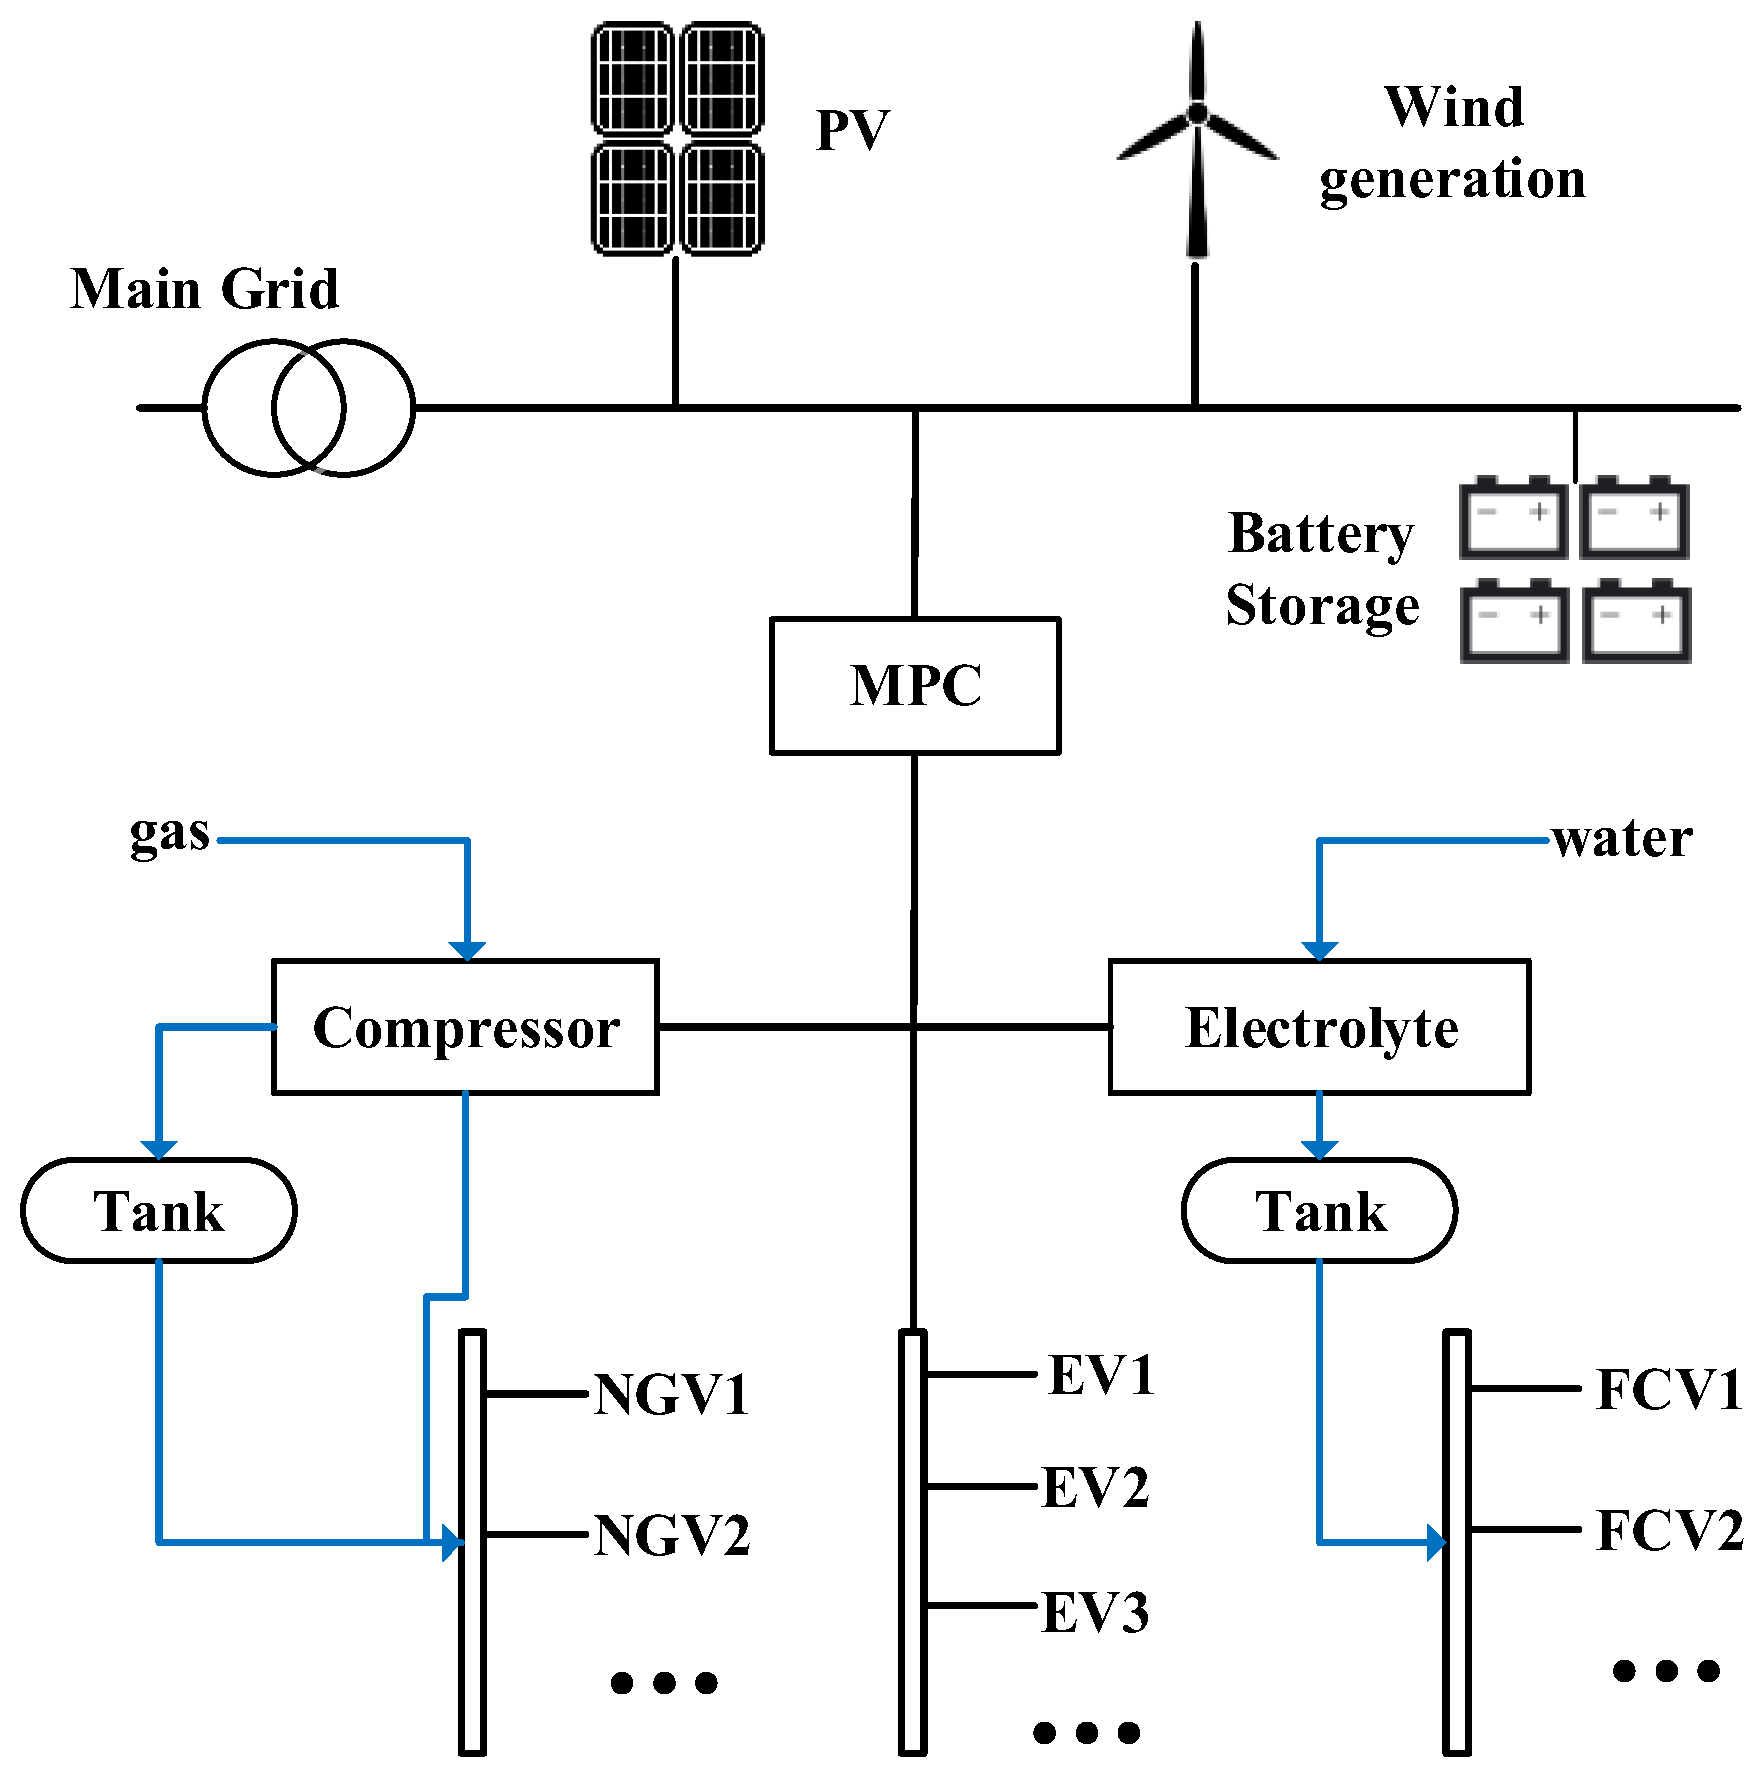
In this paper, it is assumed that a future refueling station would consist of various kinds of “Green-Energy” vehicles’ refueling facilities and distributed energy resources (DERs) as shown in Figure 1, Such refueling station contains EV charging systems, hydrogen generation and refilling system, gas compression and refilling system that can satisfy various refueling demands of BEVs, FCVs and NGVs. We assume that this kind of refueling station will be usually located beside motorways and has reasonable large land space. Thus, wind turbine, solar PV, and ESS are also included in the refueling station that can help with the refueling station operation. The proposed hybrid refueling station operates as a micro-grid, so that it can buy/sell electricity from/to the main grid, and has the freedom to choose different electricity tariffs.

2.2. Battery Energy Storage System

Battery energy storage system (BESS) is considered as one of the most important flexible resources for electricity network [22]. It can provide different kinds of service, such as peak-reduction, frequency response, energy storage, and electricity arbitrage. In this paper, the BESS is used as a flexible energy resource to help refueling station operator reduce the station operational cost by mitigating the exportation of the redundant renewable generation to external grid and compensate the energy usage of refueling station during peak time. The model of BESS is described, as below [23].
S O C t = S O C t 1 + P t c h a · η c h a P t d i s c h a · η d i s c h a
0 S O C _ S O C t S O C ¯ 1
Equation (1) illustrates the state change of battery SOC during operation, where S O C t   represents the battery SOC at time t, P t c h a represents the charging power of battery,   η c h a represents the charging efficiency of BESS, P t d i s c h a represents the discharging power to the grid and system from battery. Equation (2) ensures that SOC does not violate its limits, where S O C _ and S O C ¯ represent the minimum and maximum limits for S O C t , respectively.
S O C t = N = S O C i n i t
0 P t G 2 B E P m a x
0 P t B 2 G + P t B T S E P m a x
0 P t B 2 G , P t B 2 S E P m a x
{ P t c h a · P t d i s c h a = 0 P t c h a + P t d i s c h a 0
One day (24 h) is regarded as a whole simulation cycle in this paper; constraint (3) ensures that the energy within battery at the beginning of the simulation horizon is replenished by the end. S O C t = N is the value of SOC by the end of the simulation cycle.
Constrains (4)–(6) ensure that energy transmission in battery is within its minimum and maximum power limits E P m a x . Constrains (7) is setting the principle that charging behavior and discharging behavior are not allowed to occur at the same time.

2.3. On-Site Hydrogen Production System

Hydrogen can be produced by Electrolysis, steam reforming, partial oxidation, and coal gasification [24]. When compared to other production technologies, electrolysis (using electricity to split water to hydrogen and oxygen) is the most straightforward way to produce hydrogen and it does not require large land space. Most of the hydrogen refueling stations in the world use electrolysis technology for hydrogen production. Figure 2 illustrates one typical hydrogen refueling station with electrolytes, compressor, storage, and dispenser. In the production stage, electricity from the distribution grid powers the water electrolytes to separate water molecules into hydrogen on the cathode and oxygen on the anode. The compressor pressurizes the hydrogen to the high pressure buffer storage tank [25]. In the dispensing stage, the storage tank releases hydrogen on demand. The hydrogen is firstly cooled into the liquid state and then pumped out of a hose and fueled into an FCV.
The cooling and refueling processes consume an insignificant amount of energy and time [26]. Except for water, electricity is needed during this progress, which is controllable.
Hydrogen production and refueling system model are described, as below:
H S C t =   H S C t 1 + H P t ζ H · C a r t H η H E
0 H S C t H S C t ¯
0 H P t H P t ¯
H S C t = N = H S C i n i t
H 2 O t = γ H 2 O · H P t
cost H 2 O = t ϵ θ γ H 2 O · H P t · λ t H 2 O
Elect t H 2 O = γ H 2 E · H P t
Equation (8) illustrates the state change of hydrogen storage tank during operation. H S C t represents the hydrogen capacity that is stored at time t, H P t represents the power of hydrogen compressor at time t, ζ H represents the hydrogen demand for each FCV, C a r t H represents the number of FCVs arrived refueling station at time t, and η H E represents transferring efficiency during the progress from gas storage tank to the gas filling station. Equations (9) and (10) represents the constraints of hydrogen storage tank and hydrogen compressor. Equation (11) ensures that the initial and the final storage states are equal, where H S C t = N represents the value for hydrogen capacity thatis stored by the end of simulation cycle. Equation (12) impose the water demand H 2 O t of hydrogen system at time t. γ H 2 O represents the exchange rate of water for hydrogen production. Hydrogen production is the only part of consuming water in refueling system, thus water fee is described as Equation (13), where γ H 2 O represents the electrolysis efficiency, λ t H 2 O represent water price. Equation (14) depicts the electricity consumption of hydrogen compression system. γ H 2 E represents the compression efficiency.
It should be noted that the temporal coupling of hydrogen production rates is not taken into account in this paper. This is because the ramping-up and ramping-down of water electrolytes are typically in a time scale that is much smaller than one hour [27].

2.4. CNG Refueling System

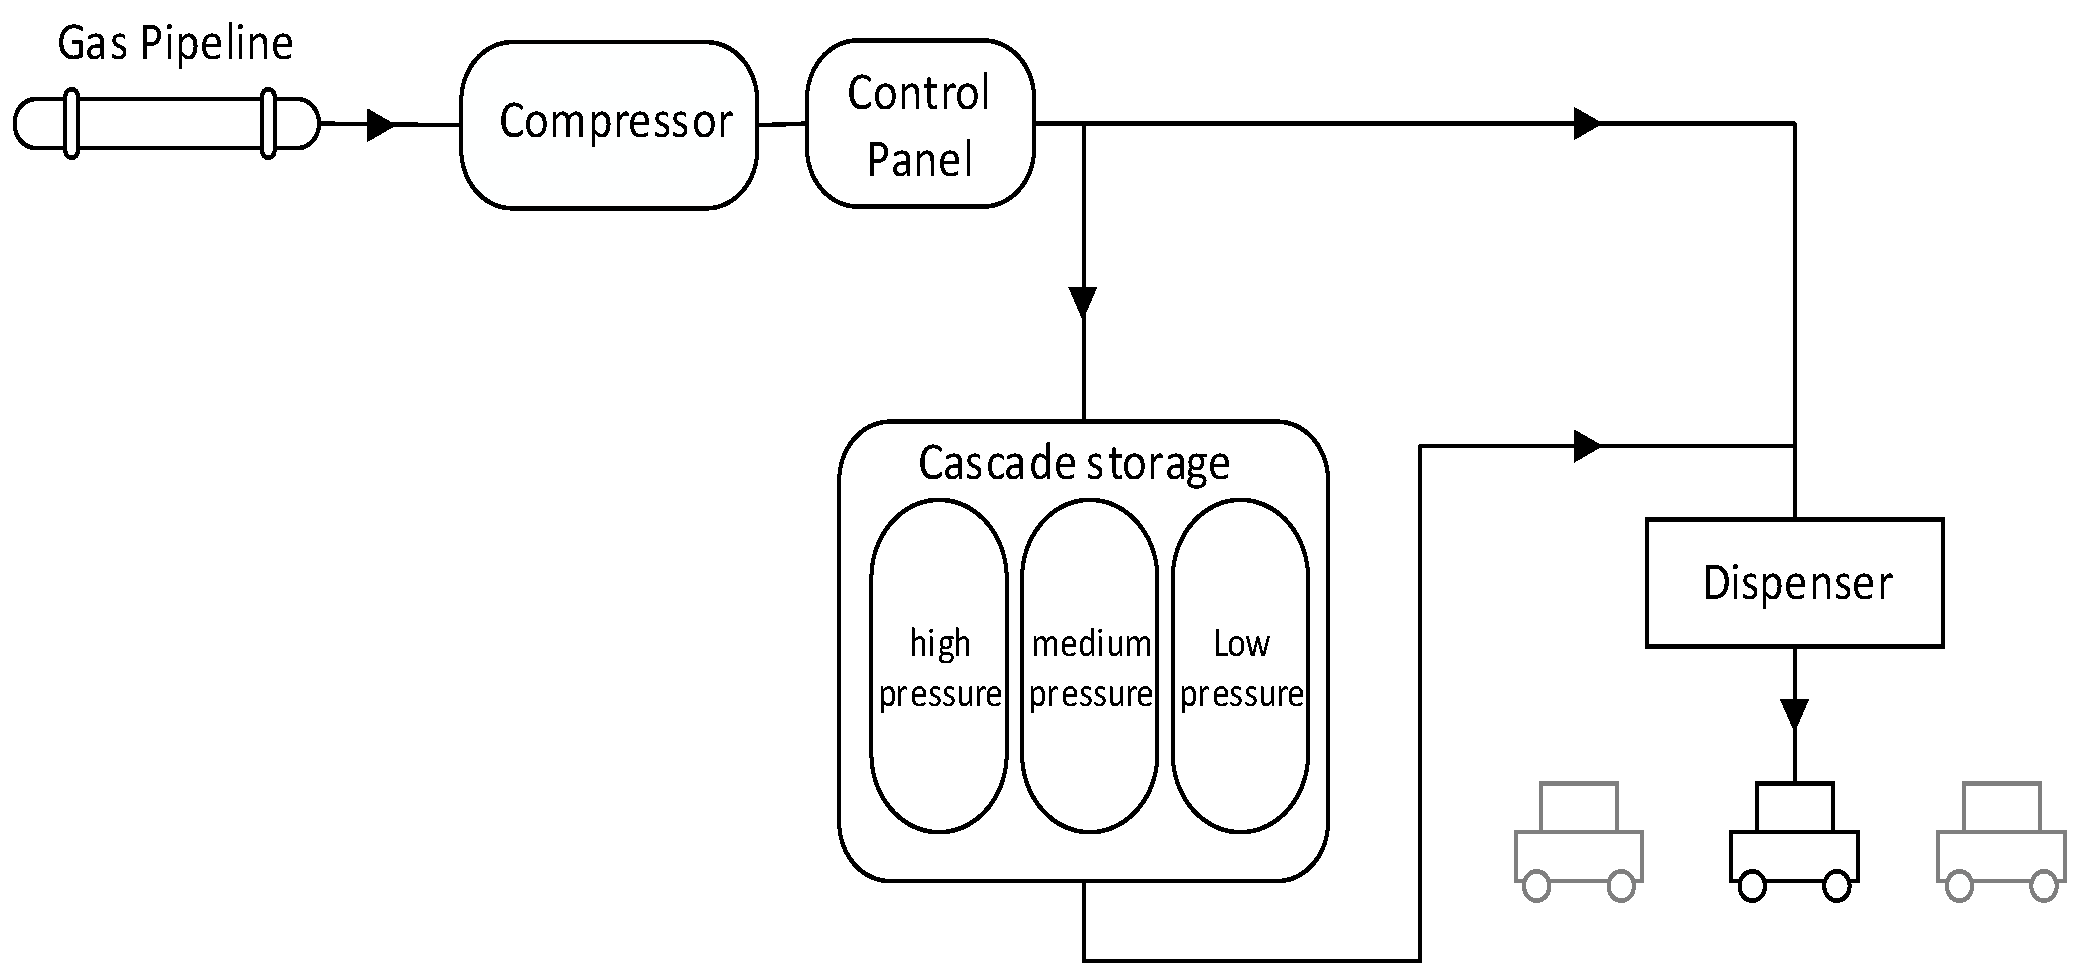
Figure 3 presents a schematic diagram of CNG fast-fill station with CNG compressor, storage tanks, and dispenser. The nature gas is usually transmitted by gas pipelines, then all of the gas would be compressed to certain pressure within the CNG station. One part of the compressed gas will be directly conveyed to dispensers to refuel the NGVs. The other part of the compressed gas will be stored in cascade storage tanks, and stored gas will be transferred to dispensers to refuel the NGVs on demand. Investigation on the CNG refueling station has shown that more than 80% of electricity usage in a CNG station is consumed by the gas compressor and dispenser [11]. Thus, it has great potential to save the energy cost by managing the CNG system operation within the refueling station. The detailed models of CNG refueling system are given, as below. Equations (15)–(17), (22), and (23) illustrates the CNG refueling model and Equations (18)–(21) presents the operational constraints of the CNG refueling system.
G S C t = G S C t 1 + G S C t i n G S C t s , o u t
G C t = G S C t i n + G S C t c , o u t η C E
g a s t d e m a n d = ζ G · C a r t G = G S C t s , o u t + G S C t c , o u t η G L
0 G S C t G S C t ¯
0 G S C t i n G S C t i n ¯
0 G S C t s , o u t + G S C t c , o u t G S C t o u t ¯
0 G C t G C t ¯
G S C t = N = G S C i n i t
Elect t G A S = γ H 2 G · G C t
Equation (15) defines the gas amount within the storage tank. G S C t represents the gas stored in the tank at time t. G S C t i n represents the gas being transmitted into the gas tank at time t. G S C t s , o u t represents the gas that is delivered to the dispenser from storage tank at time t. Equation (16) imposes that the gas coming through compressor ( G C t ) is split into two group ( G S C t i n and G S C t s , o u t ), and η C E represents the compressor efficiency of gas. Equation (17) illustrates that gas demand is decided by NGVs ( C a r t G ) and it should be satisfied by compressor and storage tank, ζ G represents refueling demand for each NGV, η G L represents transferring efficiency during the way from both storage tank and compressor to dispenser. Constraints (18)–(21) ensure G S C t , G S C t i n , G S C t s , o u t , and G C t are bounded from below by zero and from above by their capacities, respectively. Constraint (22) ensures that the initial and the final storage states are equal, where G S C t = N . represents the gas stored in the tank by the end of the simulation cycle. Equation (23) depicts the gas consumption of CNG refueling system, where γH2G represents the electricity loss when compressor is working.

2.5. EVs Charging System

In this paper, the operation of EV charging facilities are modeled based on the method that is introduced in [28]. When an EV arrives at the charging station, the EV will be charged immediately if there are charging equipment available there. Once EV is fully charged, the EV will dispatch without any further stay. If all of the charging facilities are occupied, the EV will queue at EV charging station, which means that the charging demand at time t will be partly transferred to time t + 1. Every EV is assumed to have the same value of charging demand and the same dwell time.
According to the operation model, the simplified mathematical model for EV charging demand is given, as below:
Conventional parking: If
car t E · Δ t ϖ ,   Elect t E = ζ E · car t E η E E
Valet parking: Esle
car t E · Δ t > ϖ ,   Elect t E = ζ E · ϖ η E E · Δ t   while   car t + 1 E + = car t E ϖ Δ t
Equations (24) and (25) determine the usage of electricity at time t ( Elect t E ) by the comparison of charging demand and the amount of vacant equipment at the current moment. Δ t represents the dwell time or charging time. ϖ indicates the capability of EVES, and ϖ Δ t is the maximum amount of vacant EV charging equipment. ζ E imposes how many electricity an EV need. η E E is the charging efficiency. If the charging demand can no be satisfied at time t, then the used electricity volume is determined by the capacity of EVSE, and the remain cars are going to be charged at next interval t + 1. Notice that ϖ Δ t maybe not an integer, but when the number of charging devices is very large, this error can be omitted.

2.6. Problem Formulation

Owners or operators of hybrid refueling station always seek to maximize their profits by reducing the operational cost and making the maximum usage of refueling facilities. The operation cost of the hybrid refueling station relates to the energy price and energy consumption of hybrid refueling station. Since there are plenty DERs, including solar PV, wind turbines, and ESS in the proposed hybrid station. The hybrid station is not a pure consumer, but a prosumer that is able to sell electricity back to grid when spare energy is generated by DERs. Thus, the objective function can be formulated, as below.
min   { t θ [ λ t p ( P t b u y P t s e l l ) + cost H 2 O + cost G A S ] }
Equation (26) illustrates that the object function is to acquire the minimum operation cost, the operation consisted by electricity fee (positive if buying, negative if selling), water fee, and gas fee, where λ t p represents the buying and selling of energy price at time t, P decides what type of tariff it is. In addition, buying and selling behavior are not allowed to appear at the same time t, which means that λ t p has only one certain value when p and t are fixed. This constrain can be described, as follows:
{ P t b u y · P t s e l l = 0 P t b u y + P t s e l l 0
Take the models of EV charging system, hydrogen system, and CNG system into objective function (26), we can get the following objective function: min
t θ { t ϵ θ ( P t G 2 B + γ H 2 E · H P t + γ H 2 G · G C t + Elect t E ) · λ t b u y ( wind t + P V t + P t B 2 G + P t B 2 S ) · λ t s e l l c o s t   o f   e l e c t r i c i t y + t ϵ θ ( γ H 2 E · H P t · λ t H 2 O ) c o s t   o f   w a t e r   + t θ ( G C t · λ t G A S ) c o s t   o f   g a s   }
where wind t and P V t represent electricity generated by wind and PV. Definitions of other variables can be found in previous models.
According to the objective function and the constraints that are indicated in Equations (1)–(25) the working state of ESS are integer values, and the rest are continuous variables. Thus, this model is a mixed-integer linear programming (MILP) problem, which can be solved by commercial solvers, such as GUROBI and CPLEX. In this paper, the model is coded with python and solved by GUROBI with its python interface.

3. Forecasting Methodologies for Hybrid Refueling Station

Efficient management of hybrid refueling station operation requires the accurate forecasting for EV charging demand, renewable energy, and the energy price. Forecasting of EV charging demand, renewable energy, and energy price have been studied in the past decade [29,30,31,32]. In this section, a comparison of different forecasting methodologies based on Support Vector Machine (SVM), K-Nearest Neighbors (KNN), and Artificial Neural Network (ANN) have been investigated, and the most suitable approach for forecasting the EV demand, energy price, and renewable energy is chosen regarding to the performance of three forecasting methodologies.

3.1. Renewable Energy Forecasting

In the proposed hybrid refueling station, both wind and solar PV are included. The mainstream forecasting methodologies of renewable energy, SVM, KNN, and ANN, are evaluated in this section. The data of wind and solar PV are collected from Newquay Harbor weather station [33].
Root Mean Square Error (RMSE) and error rate are adopted to evaluate the forecasting precision. Error rate ω represents the percentage of inaccurate points, this method uses Mean Absolute Percentage Error (MAPE) as a way to determine whether the predicted value is accurate, for every single points, if MAPE is greater than 0.3, then the prediction of this point is considered as an inaccurate result. The definition of RMSE, MAPE, and   ω are given below.
RMSE = 1 N i = 1 N ( p r e d i c t i r e a l i ) 2
MAPE = | ( p r e d i c t i r e a l i | r e a l i
ω = E r r _ N u m N
where p r e d i c t i represent predictive value, r e a l i represents real value, E r r _ N u m represents the total number of errors, and N represents the total number of predictive points.
The performance of three forecasting methodologies for wind speed and solar insolation forecasting are presented in Table 1.
In term of wind speed, the error rate and the RMSE of KNN is both the least among three methods, and thereby the accuracy of the prediction results of wind speed based on KNN is the highest. KNN is used for predicting the wind speed in this paper (comparison between the predicted data and real data of wind speed is given in Figure 4a. The three methods perform similarly for predicting the solar insolation, the error rate and RMSE of SVM is the smallest when compared with the other two methods, and thereby the SVM is selected to predict solar insolation in this paper (comparison between predicted data and real data is given in Figure 4b. The predicted wind speed and insolation are then converted into wind turbine power and PV output power using following equations:
P t w i n d = 1 2 ρ A ν ( t ) 3 C p E f f a d
where ρ is the air density(kg/ m 3 ), A is the swept area of the rotor ( m 2 ), v is the wind speed (m/s), Cp is the efficiency of the wind turbine, and E f f a d is the efficiency of the AC/DC converter (assumed to be 95% in this study).
P t P V = I n s ( t ) AE f f p v
where I n s ( t ) is the insolation data at time t ( kW / m 2 ), A is the area of a single PV panel ( m 2 ), and Effpv is the overall efficiency of the PV panels and the DC/DC converter. Equation (30) assumes that the PV array has a tracking system and a maximum power point tracker. It also assumes that the temperature effects (on PV cells) are ignored.
The power output from the wind turbine and a single PV panel are shown in Figure 4c.

3.2. Traffic Flow Forecasting

The vehicle refueling demand is related to the traffic flow through the hybrid refueling station [29]. With traffic flow data and expected vehicle refueling probability, the station refueling demand can be obtained. The traffic flow data used in this paper is obtained from Ireland National Road Authority. The data includes the traffic flow data of M1 between Castleblaney Road Southern Link interchanges in Ireland over a period of five months [34]. When considering the significant difference of traffic flow during weekday and weekend, the traffic flow is forecasted by SVN, ANN, and KNN with weekday and weekend data, respectively, the evaluation of the three forecasting methods is presented in Table 2.
Table 2 illustrates that KNN has the best performance for predicting weekday traffic data, while SVM has small error rate and RMSE when predicting weekend traffic data, therefore, KNN and SVM are selected as forecasting methods for traffic flow during weekday and weekend, respectively. The predicted traffic flow data is presented in Figure 5.
To simplify the refueling demand model, we use different probability factors to calculate the refueling demand for the “Green-Energy” vehicles passing by the refueling station for different types of vehicles. To simplified the calculation, we assume that the each vehicle with same “Green-Energy” technology have the same refueling demand.

3.3. Electricity Price Forecasting

Optimal operation strategy for refueling station is highly related to electricity tariffs, aiming to reduce the overall cost, accurate prediction of electricity price is necessary. Four types of tariffs are investigated in this paper, which are Real-Time Pricing (RTP), Economy 7, Economy 10, and flat-rate. Economy 7 tariff offers a seven-hour (assumed to be 0:00–7:00) off-peak electricity price while Economy 10 tariff offers ten hours (assumed to be 20:00–8:00) of off-peak electricity over 24 h period. The flat-rate tariff means the electricity price is constant. The RTP pricing mechanism is the only tariff that needs to be forecasted. The data that is used for forecasting RTP price is obtained from European Electricity Index over a period of one month [35]. Performance of three forecasting methods is given in Table 3.
The results indicates that KNN has best performance for forecasting RTP tariff with least error rate and RMSE, the predicted RTP, and economy 7 economy 10 tariffs are given in Figure 6.

4. Numerical Analysis

4.1. Parameters Setting

The proposed energy management approach has been evaluated for a hybrid refueling station comprising wind turbines with installed capacity equal to 500 kwh, solar PV with installed capacity equal to 500 kwh, and ESS with installed capacity equal to 500 kwh and maximum charging/discharging power equal to 50 kw. Parameters of hydrogen refueling system, CNG refueling system, and EV charging system are presented in Table 4. The pricing information of economy 7 tariff, economy 10 tariff, RTP tariff, and constant tariffs is given in Figure 6.
In the numerical analysis section, we allow for the refueling station sell electricity back to grid when there is spare energy generated by renewable resources. The feed-in tariff follows the current tariff in UK [36]. The electricity feed-in price is 24 $/MWh (using the average value of tariffs for wind and PV).

4.2. Hybrid Refueling Station Benchmark Operation Approach

A benchmark energy management approach for hybrid refueling station is established for comparison purpose with the proposed energy management approach. For the benchmark approach, two time periods, the valley period ( T 1 ) and peak period ( T 2 ), are defined, respectively. The key components within the hybrid refueling station will operate with regarding to the two time periods. For ESS, battery will be charged at even power during T 1 and discharged with even power during T 2 , after one simulation cycle is finished, the total charging amount and discharging amount are both S O C ¯ · 500 (the battery capacity is assumed to be 500 kwh). Charging power and discharging power for every time t are assumed to be less than maximum power limits E P m a x . For the hydrogen system, hydrogen is produced during T 1 and the electrolytes will normally at out of work state during T 2 . A threshold is defined to ensure the service quality during the peak period, if the storage in tank less than the proposed threshold, electrolytes will automatically produce h 2 until the h 2 storage volume is equal to the threshold. In real-world environment, most of conventional CNG refueling systems have no connection between compressor and dispensers, which means that the gas cannot be conveyed to dispensers from compressor directly. Thus, the operation of CNG refueling system is similar to hydrogen system. Detailed operation approach for each part is described in Table 5 ( β H and β G are assumed to be 50% in this paper).
The operational cost of proposed benchmark scenario relates to the electricity price in different time periods and the energy consumption of the refueling facilities within the hybrid refueling station. The total cost of benchmark scenario is given, as below.
cost B M = t θ ( ( O P t b a t t e r y η c h a   o r   η d i s c h a + O P t H 2 · γ H 2 E η H E + O P t g a s · γ H 2 G η G E P t P V P t w i n d ) · λ t p + O P t g a s · λ t G A S + O P t H 2 · γ H 2 O · λ t H 2 O )
where O P t b a t t e r y ,   O P t H 2 , and O P t g a s are a one-dimensional array that contains the operation strategy for battery, hydrogen, and gas, respectively.
It should be noted that Equation (34) can also be used to calculate the operating costs under different tariffs.

4.3. Performance Evaluation for the System under Different Tariffs

The operation performance of HRS under different tariffs based on weekday traffic data are investigated in this section. The four tariffs are Economy 7, Economy 10, RTP, and flat-rate tariff, respectively. The pricing information of the four tariffs are presented in Figure 6.
Table 6 illustrates operation costs before and after optimization. By horizontal comparison, it is found that no matter which kind of tariffs, the saving percentage all between 10% and 20%. By longitudinal comparison, it is found that the proposed management approach has the best performance under RTP tariff, with saving percentage of around 18% of the original cost. The proposed management approach under flat-rating pricing mechanism has the lowest saving percentage because the BESS cannot make any profits on electricity arbitrage trading.
Figure 7 illustrates the operation of ESS, hydrogen refueling system, and gas refueling system under four different tariffs. For ESS, it can be found that the charging behavior is concentrated in the valley period for all tariffs. There are two distinct peaks in SOC in the conditions using RTP and flat-rate, which are caused by different reasons. In RTP, the second SOC peak is caused by the second RTP valley period, the trend of SOC is basically opposite to that of predicted RTP data. In flat-rate, the second SOC peak is related to both refueling demand and renewable energy. The figures show that ESS tend to charge/discharge with a certain value stayed for a certain period in RTP. For the gas refueling system, the electrolytes tend to produce hydrogen during the 0:00–5:00 a.m., which is the valley period in four tariffs. The electrolytes together with storage tank act similar to the operation of ESS in RTP, which can be directly observed from Figure 6. For the hydrogen system, the electrolytes tend to produce hydrogen with maximum production capability during the 0:00–8:00 a.m. The hydrogen production system tend to produce hydrogen with relatively small production amount during the second electricity valley period no matter in what tariffs. This phenomenon is caused by the high hydrogen storage capability and low refueling demand for FCVs. Overall, working condition of battery, compressors, and electrolytes are more continuous in RTP than in other tariff, which means less number of start and stop activities are performed by the devices, and correspondingly increase the equipment life-time and reduce the loss of gas and hydrogen.

4.4. Hybrid Refueling Station with/without ESS

Along with the increasing attention on the energy storage system (ESS), it is valuable to explore whether the ESS will assist the operation of hybrid refueling station, and if so, how much savings will be achieved by the ESS and how long the investment of ESS will be recovered.
In this section, the operation performance of HRS with/without ESS are compared under different tariffs. We assume that the HRS with ESS contains an ESS with installed capacity equal to 500 kwh and maximum charge/discharge power equal to 50 kw. The HRS without ESS has the same facilities with the HRS with ESS, except the ESS. The comparison is based on Economy 7 and weekend traffic flow data.
The comparison is under the scene where the electricity tariff is Economy 7, traffic flow is predicted from weekend data. When compared to benchmark operation, the total cost of system without ESS can only be reduced to $2270 which is 92.6% of original cost. After adding a battery with a capacity of 500 kwh, the cost can be significantly reduced to $2143 (reducing $127 per day), which is 87.1% of original cost.
Figure 8 shows the operation of battery, gas compressor, gas tank, and hydrogen production under two conditions (with/without ESS). The changes of their operation are complex, but one thing for sure is that without battery, gas compressors and hydrogen electrolytes tend to act more actively in valley period and the acting behaviors are usually concentrated, unlike in the case of system with ESS where they are intermittent. The existence of ESS results in the increase of equipment operation frequency and the decrease of equipment lifespan.
Results have proved that ESS can reduce the operation cost to a certain extent (saving about $127 per day). However, whether the ESS is profitable should also be determined by the purchase cost and maintain cost. When considering the nature characters of different kinds of battery, lithium battery is used to evaluate the ESS economic benefits in this paper. The purchase cost of a 500 kwh lithium battery is around $104,500, the battery lifespan is around 5.5 years(one day is assumed to be one charge-discharge cycle), the maintain cost is about $0.28 per day [37]. Based on this condition, the ESS payback period is 2.3 years, the total profit of ESS is $254,000 more than the system without ESS, and the gross profit (subtracting the purchase cost and maintain cost) is $148,945.

4.5. Hybrid Refueling Station with High/Low Capacity of Storage Tank

When the natural gas storage capacity of the system is low, the compressor operating frequency will increase, but in a limiting case where no storage tank is contained in the system, the gas pump can only compress and provide gas to NGV on demand. If the system has high gas storage capacity, a large amount of gas can be stored at a lower price, and the cost of buying the gas can be correspondingly reduced. Thus, it is valuable to explore the influence of gas storage capacity on the station operation cost. This paper have brought different gas and hydrogen storage capacity (the storage capacity of gas and hydrogen are assumed to be the same) into the optimal algorithm, the optimized cost is presented in Table 7. The maximum gas transmission power for each half hour of natural gas and hydrogen is assumed as 300 m 3 / h .
From the results shown in Table 7, it is found that the increase of gas storage capacity does reduce the operating costs effectively. Due to the up-limits of gas transmission power, there is a limit to the cost reduction. The gas storage system requires high purchase and maintenance costs and large land space for the gas tank. Therefore, when selecting gas storage capacity at design stage, it is not economical to use large gas tank. To access the detailed operation of the gas system, a comparison of operation strategy of the refueling station with 1500 m 3 and 8000 m 3 gas storage capacity is given in Figure 9.
It can be clearly seen from Figure 9 that when the gas storage capacity is increased, the device state-change frequency is correspondingly reduced while the storing behavior is concentrated around the two periods when the RTP price is the lowest and tend to be the maximum value. Battery operation seems to be similar in two conditions.

5. Conclusions

In this paper, a detailed model for hybrid refueling station (HRS) that can serve EV, FCV, and NGV is presented, and the energy management approach for HRS operation is also proposed. The algorithm aims at maximally increasing the operation profits with considerations of forecasting of renewable energy, electricity price, and traffic flow. To evaluate the proposed energy approach, comprehensive analysis of the HRS operation under different electricity tariffs are presented as well. The influence of ESS and gas tanks to the HRS are also investigated. The main conclusions and results are given, as below.
(1)
A hybrid refueling station model is proposed. Detailed models including CNG refueling facilities, Hydrogen refueling facilities, EV charging facilities, and ESS are formulated, and the operation constraints of these facilities are also presented.
(2)
The HRS energy management approach presented in this paper achieved reasonable performance under different electricity tariffs. The proposed energy management approach reduced the HRS operation cost by more than 10%. Among the four kinds of tariffs, the proposed energy management approach has the best performance under RTP tariff. The daily operation cost is the least and the operation frequency (start/stop) of equipment is the least under RTP tariff, which is beneficial to the daily maintenance of the system.
(3)
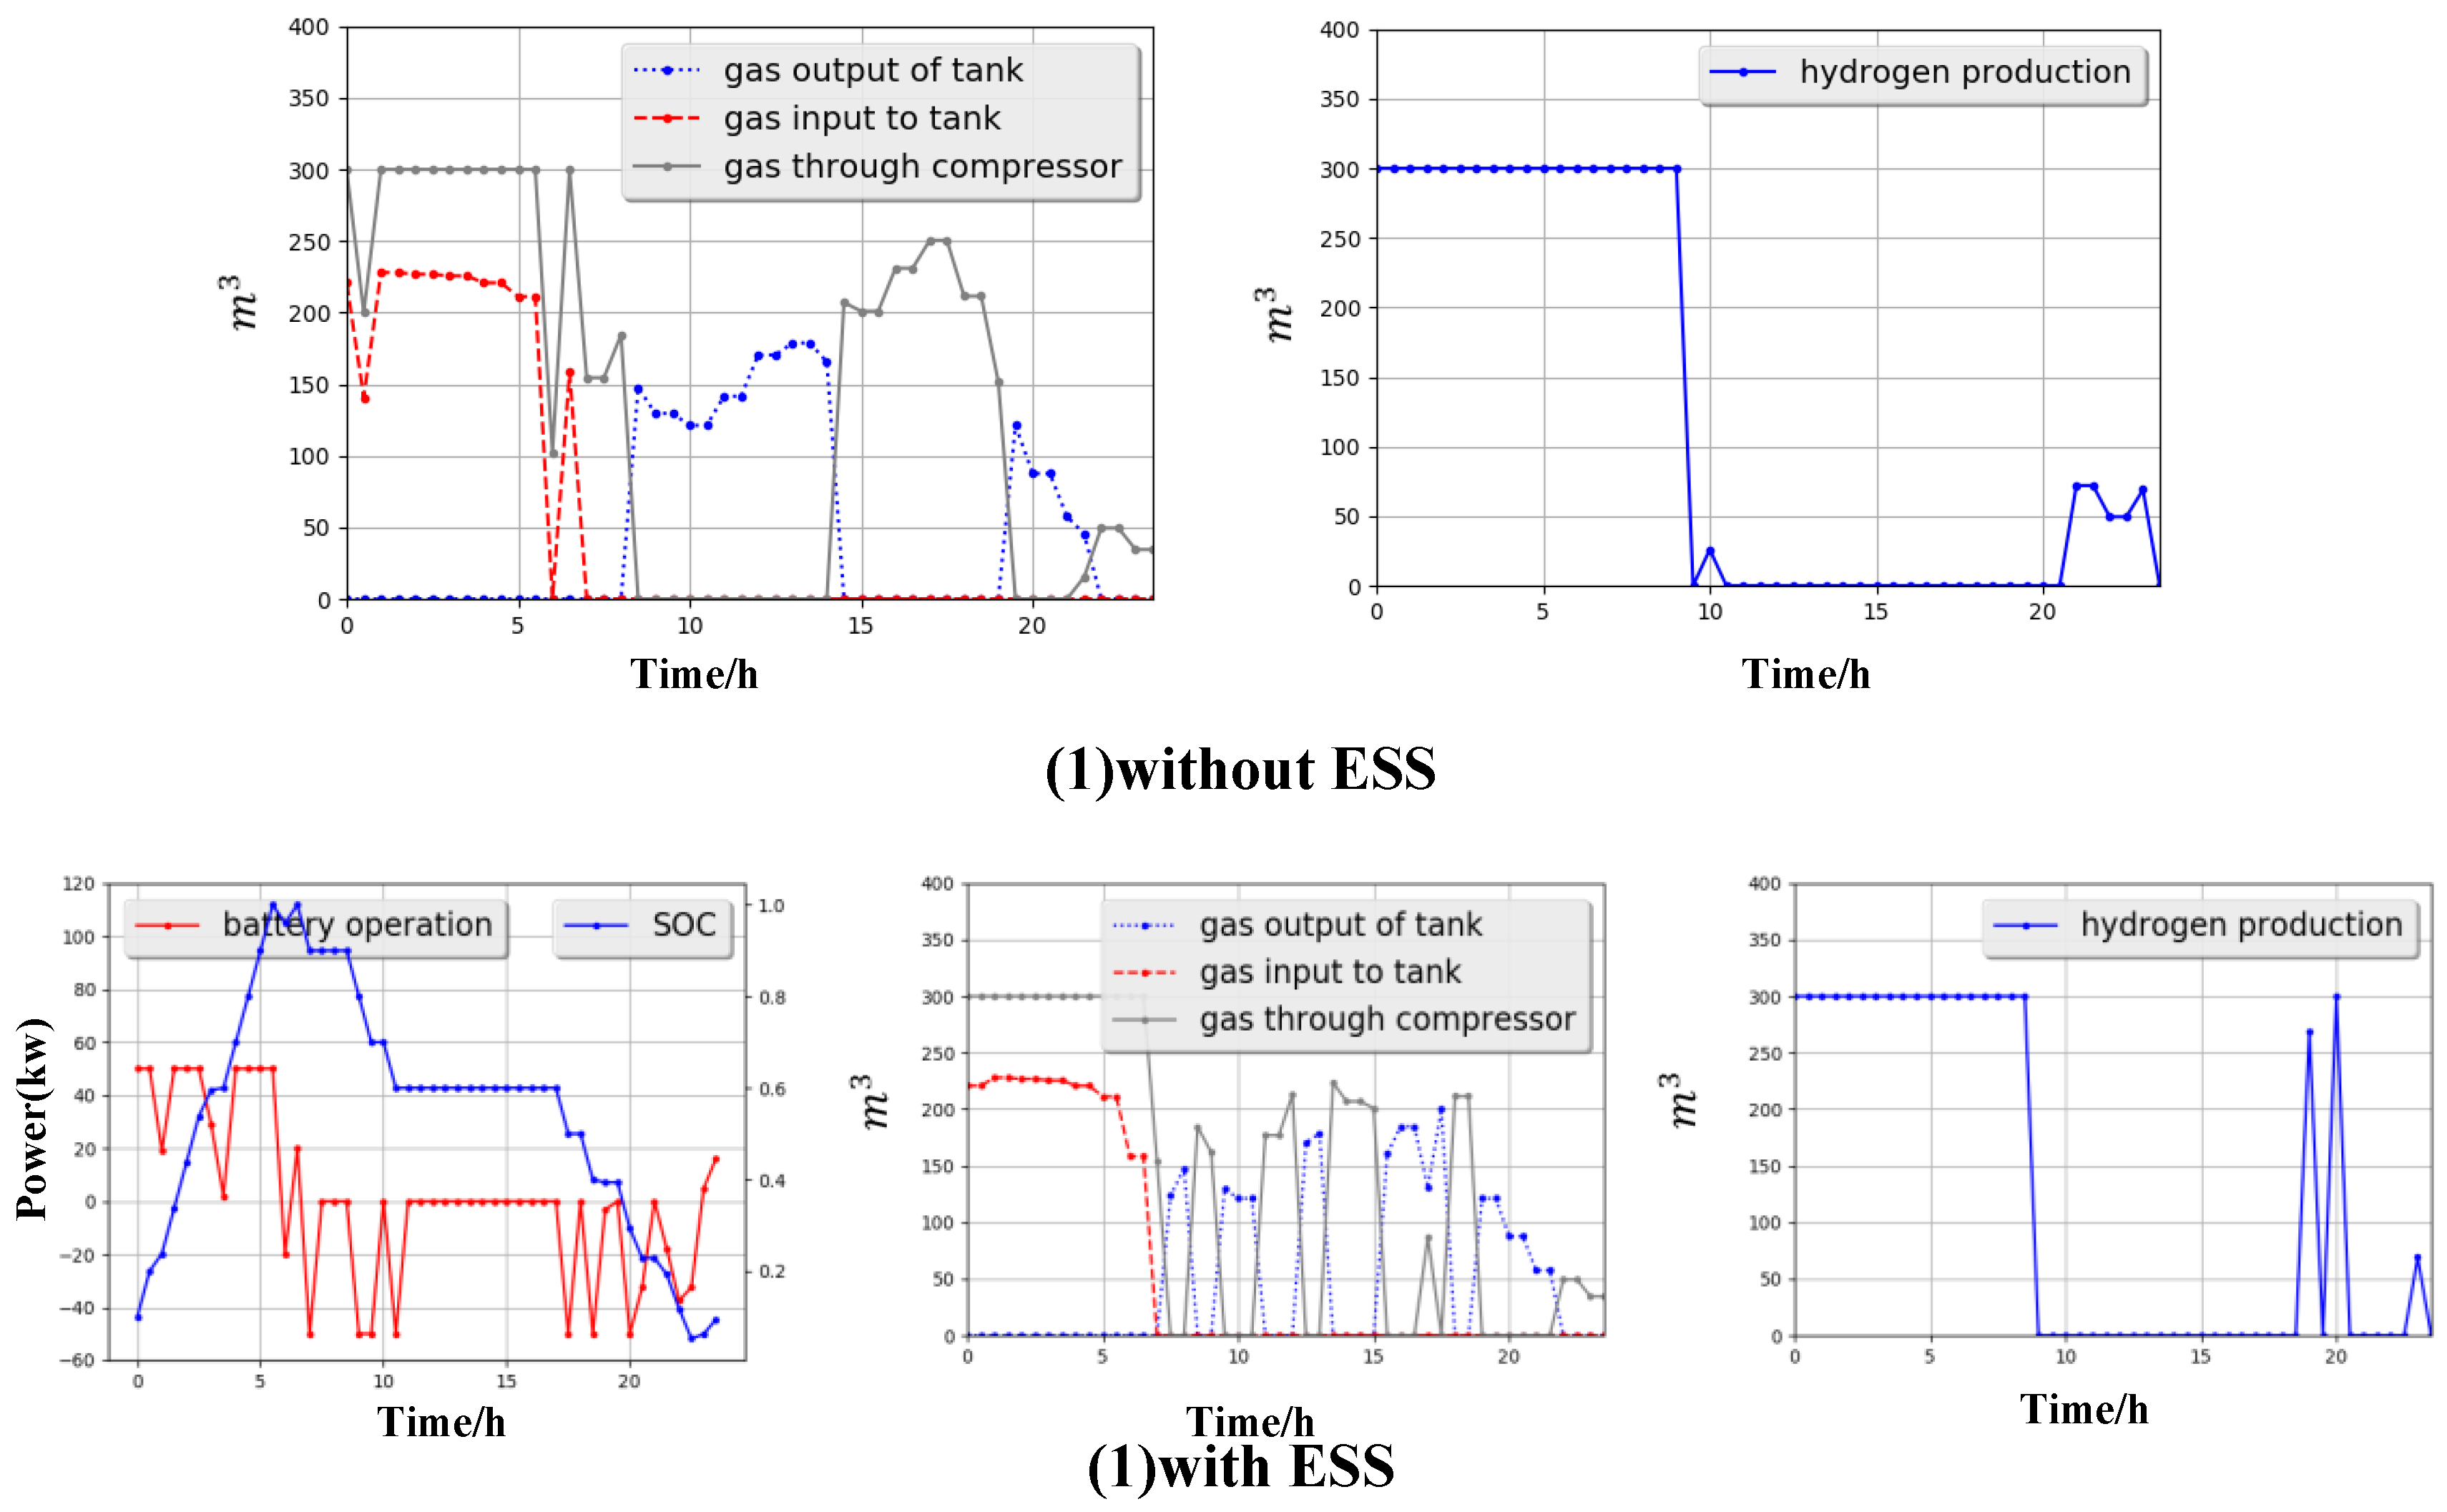
The economic assessment of energy storage system within the HRS is investigated. With the proposed energy management approach, the daily operating cost ($2143) for an ESS with a 500 kwh battery is $127 less than the daily operating cost of a system without an energy storage system ($2270), the payback period for ESS with lithium battery is 2.3 years, and the gross profit is $148,945.
(4)
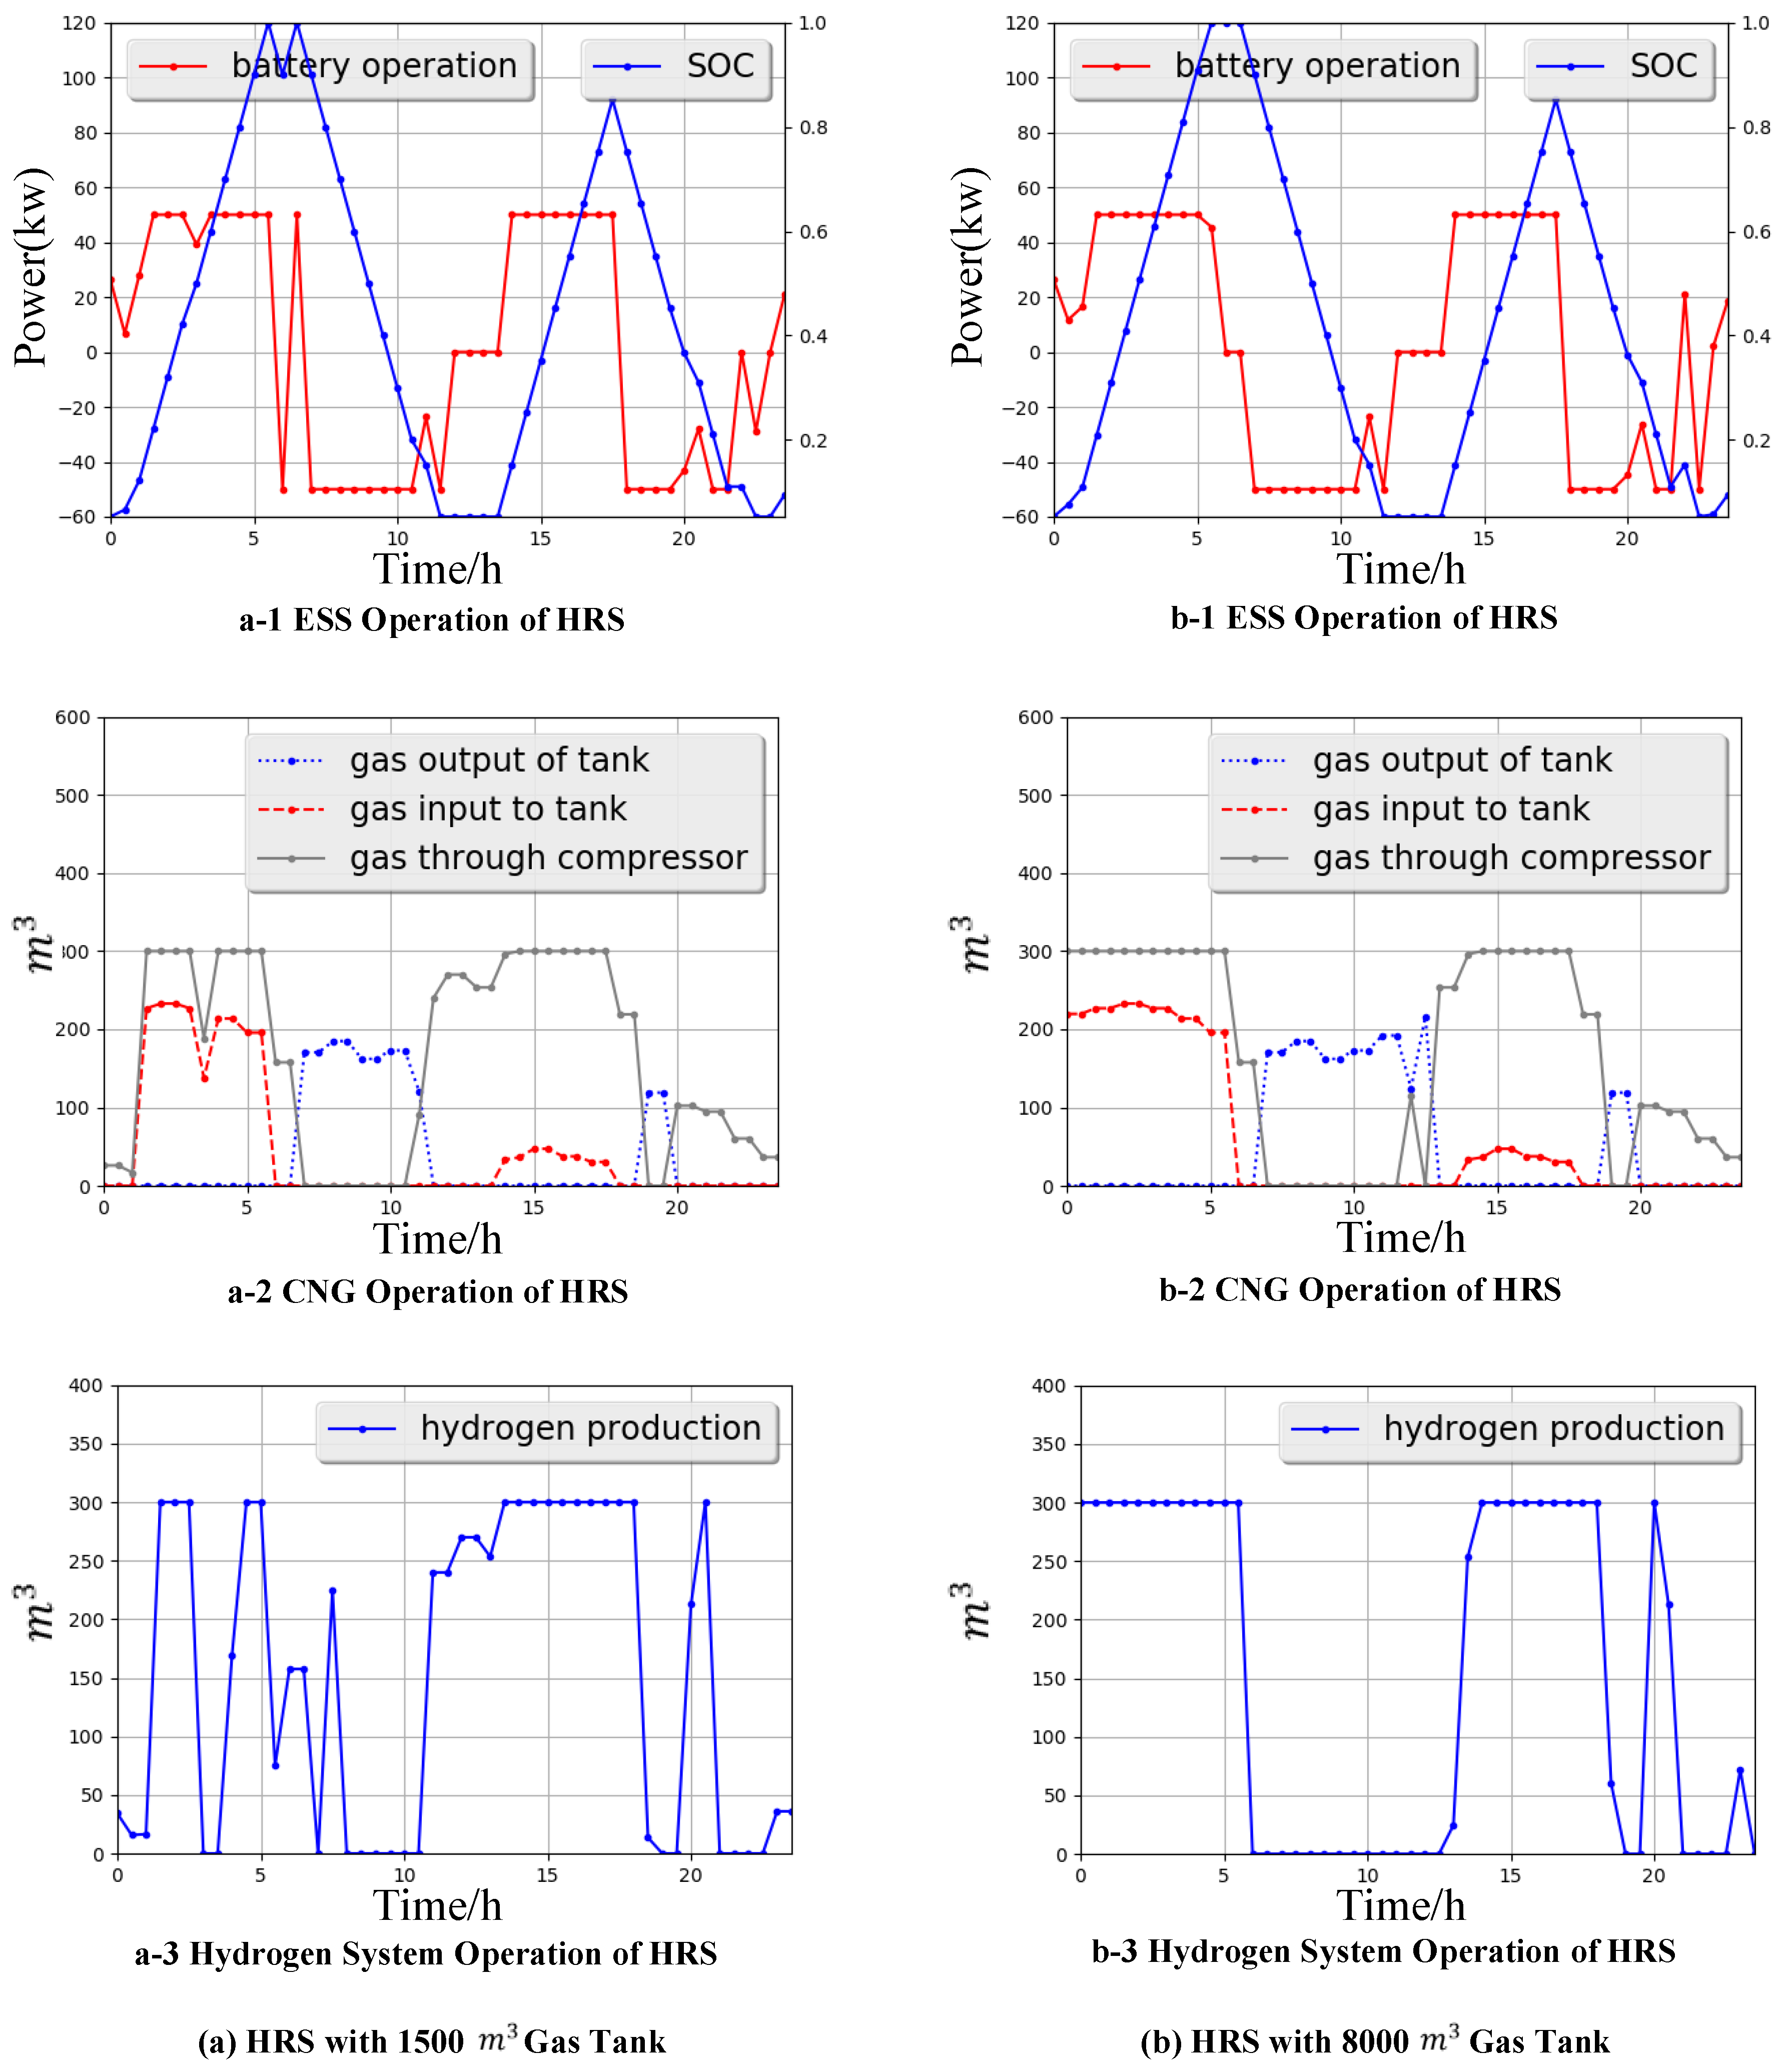
The influence of the gas tank capacity on HRS operation is analyzed. It is found that the increase of gas storage capacity can reduce the operating cost. However, according to the upper limit of gas refueling demand, the cost reduction by increasing the gas tank capacity is limited. The operation cost is only reduced by 5.7% when the tank size is increased from 1500 m3 to 8000 m3.
Due to the limited information of the cost of landspace, hydrogen refueling system, and gas refueling system, the economic assessment of the whole hybrid refueling station was not performed in this paper. Future research will complete the full economic assessment, including break-even analysis and risk analysis in investment of the hybrid refueling station once the aforementioned data are ready.

Author Contributions

S.Z. and Y.Z. conceived and designed the experiments; Z.W. performed the experiments; Y.Z. analyzed the data and contributed analysis tools; S.Z. wrote the paper; W.G. reviewed, revised and polished the manuscript.

Funding

The research performed in this paper is sponsored by Fundamental Research Funds for the Central Universities.

Conflicts of Interest

The authors declare no conflicts of interest.

References

  1. Li, Y.; Kaewpuang, R.; Wang, P.; Niyato, D.; Han, Z. An energy efficient solution: Integrating plug-in hybrid electric vehicle in smart grid with renewable energy. In Proceedings of the 2012 IEEE INFOCOM Workshops, Orlando, FL, USA, 25–30 March 2012. [Google Scholar]
  2. Clement-Nyns, K.; Haesen, E.; Driesen, J. The impact of charging plug-in hybrid electric vehicles on a residential distribution grid. IEEE Trans. Power Syst. 2010, 25, 371–380. [Google Scholar] [CrossRef] [Green Version]
  3. ADFC. Monthly Plug-In Sales Scorecard. 2016. Available online: https://insideevs.com/monthly-plug-in-sales-scorecard (accessed on 17 February 2018).
  4. Hu, S.; Sun, H.; Peng, F.; Zhou, W.; Cao, W.; Su, A.; Chen, X.; Sun, M. Optimization Strategy for Economic Power Dispatch Utilizing Retired EV Batteries as Flexible Loads. Energies 2018, 11, 1657. [Google Scholar] [CrossRef]
  5. Ul-Haq, A.; Cecati, C.; Al-Ammar, E.A. Modeling of a Photovoltaic-Powered Electric Vehicle Charging Station with Vehicle-to-Grid Implementation. Energies 2016, 10, 4. [Google Scholar] [CrossRef]
  6. Yan, Q.; Zhang, B.; Kezunovic, M. Optimized Operational Cost Reduction for an EV Charging Station Integrated with Battery Energy Storage and PV generation. IEEE Trans. Smart Grid 2018. [Google Scholar] [CrossRef]
  7. Zheng, Y.; Song, Y.; Hill, D.; Meng, K. Online Distributed MPC-based Optimal Scheduling for EV Charging Stations in Distribution Systems. IEEE Trans. Ind. Inform. 2018. [Google Scholar] [CrossRef]
  8. Martinsen, T. A business model for an EV charging station with battery energy storage. In Proceedings of the CIRED Workshop 2016, Helsinki, Finland, 14–15 June 2016. [Google Scholar]
  9. Reddy, B.M.; Samuel, P.; Reddy, N.S.M. Government Policies Help Promote Clean Transportation in India: Proton-Exchange Membrane Fuel Cells for Vehicles. IEEE Electr. Mag. 2018, 6, 26–36. [Google Scholar] [CrossRef]
  10. Swenson, P.F.; Eversole, G.H. System for Fast-Filling Compressed Natural Gas Powered Vehicles. U.S. Patent 5409046A, 25 April 1995. [Google Scholar]
  11. Bang, H.J.; Stockar, S.; Muratori, M.; Rizzoni, G. Modeling and analysis of a CNG residential refueling system. in ASME 2014 dynamic systems and control conference. Am. Soc. Mech. Eng. 2014. [Google Scholar] [CrossRef]
  12. Kagiri, C.; Wanjiru, E.M.; Zhang, L.; Xia, X. Optimized response to electricity time-of-use tariff of a compressed natural gas fuelling station. Appl. Energy 2018, 222, 244–256. [Google Scholar] [CrossRef]
  13. Kagiri, C.; Zhang, L.; Xia, X. Compressor and priority panel optimization for an energy efficient CNG fuelling station. In Proceedings of the 2017 11th Asian Control Conference (ASCC), Gold Coast, Australia, 17–20 December 2017. [Google Scholar]
  14. Kagiri, C.; Zhang, L.; Xia, X. Optimal energy cost management of a CNG fuelling station. IFAC PapersOnLine 2017, 50, 94–97. [Google Scholar] [CrossRef]
  15. Hienuki, S. Environmental and Socio-Economic Analysis of Naphtha Reforming Hydrogen Energy Using Input-Output Tables: A Case Study from Japan. Sustainability 2017, 9, 1376. [Google Scholar] [CrossRef]
  16. Samsatli, S.; Staffell, I.; Samsatli, N.J. Optimal design and operation of integrated wind-hydrogen-electricity networks for decarbonising the domestic transport sector in Great Britain. Int. J. Hydrogen Energy 2016, 41, 447–475. [Google Scholar] [CrossRef]
  17. Zhang, H.; Qi, W.; Hu, Z.; Song, Y. Planning hydrogen refueling stations with coordinated on-site electrolytic production. In Proceedings of the IEEE Power & Energy Society General Meeting, Chicago, IL, USA, 16–20 July 2017. [Google Scholar]
  18. Kuby, M.; Lim, S. Location of alternative-fuel stations using the flow-refueling location model and dispersion of candidate sites on arcs. Netw. Spat. Econ. 2007, 7, 129–152. [Google Scholar] [CrossRef]
  19. You, P.-S.; Hsieh, Y.-C. A hybrid heuristic approach to the problem of the location of vehicle charging stations. Comput. Ind. Eng. 2014, 70, 195–204. [Google Scholar] [CrossRef]
  20. MirHassani, S.; Ebrazi, R. A flexible reformulation of the refueling station location problem. Transp. Sci. 2012, 47, 617–628. [Google Scholar] [CrossRef]
  21. Donnelly, F.W.; Dewis, D.W.; Watson, J.D. Multi-Fuel Service Station. U.S. Patent 9284178B2, 15 March 2016. [Google Scholar]
  22. Divya, K.; Østergaard, J. Battery energy storage technology for power systems—An overview. Electr. Power Syst. Res. 2009, 79, 511–520. [Google Scholar] [CrossRef]
  23. Sarker, M.R.; Pandžić, H.; Ortega-Vazquez, M.A. Optimal operation and services scheduling for an electric vehicle battery swapping station. IEEE Trans. Power Syst. 2015, 30, 901–910. [Google Scholar] [CrossRef]
  24. Holladay, J.D.; Hu, J.; King, D.L.; Wang, Y. An overview of hydrogen production technologies. Catal. Today 2009, 139, 244–260. [Google Scholar] [CrossRef]
  25. Ball, M.; Basile, A.; Veziroglu, T.N. Compendium of Hydrogen Energy: Hydrogen Use, Safety and the Hydrogen Economy; Woodhead Publishing: Cambridge, UK, 2015. [Google Scholar]
  26. Melaina, M.; Penev, M. Hydrogen Station Cost Estimates: Comparing Hydrogen Station Cost Calculator Results with Other Recent Estimates; National Renewable Energy Lab (NREL): Golden, CO, USA, 2013.
  27. Koponen, J. Review of Water Electrolysis Technologies and Design of Renewable Hydrogen Production systems. Master’s Thesis, Lappeenranta University of Technology, Lappeenranta, Finland, 2015. [Google Scholar]
  28. Flores, R.J.; Shaffer, B.P.; Brouwer, J. Electricity costs for an electric vehicle fueling station with Level 3 charging. Appl. Energy 2016, 169, 813–830. [Google Scholar] [CrossRef] [Green Version]
  29. Amini, M.H.; Kargarian, A.; Karabasoglu, O. ARIMA-based decoupled time series forecasting of electric vehicle charging demand for stochastic power system operation. Electr. Power Syst. Res. 2016, 140, 378–390. [Google Scholar] [CrossRef]
  30. Potter, C.W.; Archambault, A.; Westrick, K. Building a smarter smart grid through better renewable energy information. In Proceedings of the IEEE/PES Power Systems Conference and Exposition, Seattle, WA, USA, 15–18 March 2009. [Google Scholar]
  31. Rodriguez, C.P.; Anders, G.J. Energy price forecasting in the Ontario competitive power system market. IEEE Trans. Power Syst. 2004, 19, 366–374. [Google Scholar] [CrossRef]
  32. Luo, L.; Gu, W.; Zhang, X.P.; Cao, G.; Wang, W.; Zhu, G.; You, D.; Wu, Z. Optimal siting and sizing of distributed generation in distribution systems with PV solar farm utilized as STATCOM (PV-STATCOM). Appl. Energy 2018, 210, 1092–1100. [Google Scholar] [CrossRef]
  33. Newquay Weather Station. Newquay Harbour Weather Station Data—2017. 2018. Available online: http://www.newquayweather.com/index.php (accessed on 7 April 2018).
  34. National Rifle Association (NRA). Automatic Traffic Counter Statistis; National Rifle Association: Fairfax, VA, USA, 2018. [Google Scholar]
  35. EPEX. Market Data—European Electricity Index (ELIX). 2018. Available online: https://www.epexspot.com/en/market-data/elix (accessed on 7 April 2018).
  36. Office of Gas and Electricity Markets (OFGEM). Feed-in Tariff (FIT) Rates. 2018. Available online: https://www.ofgem.gov.uk/environmental-programmes/fit/fit-tariff-rates (accessed on 7 April 2018).
  37. Cleantechnica. Batteries Keep on Getting Cheaper. 2017. Available online: https://cleantechnica.com/2017/12/11/batteries-keep-getting-cheaper/ (accessed on 7 April 2018).
Figure 1. Schematic Diagram of Hybrid Refueling Station (HRS).
Energies 11 01991 g001
Figure 2. Schematic Illustration of an Refueling Station with on-site Hydrogen Production [6].
Energies 11 01991 g002
Figure 3. Schematic Layout for the fast-fill CNG Station.
Energies 11 01991 g003
Figure 4. (a) The predict and actual value of wind speed using KNN method; (b) The predict and actual value of insolation using SVM method; (c) Output of the Wind and PV Generation; Forecasting Results of Renewable Energy.
Energies 11 01991 g004aEnergies 11 01991 g004b
Figure 5. (a) Weekend; and, (b) Weekday. Forecasted Traffic Flow Data for Weekend and Weekday.
Energies 11 01991 g005
Figure 6. The Pricing Information of Tariffs.
Energies 11 01991 g006
Figure 7. Operation of HRS under Different Tariffs.
Energies 11 01991 g007
Figure 8. Operation Performance of System with/without energy storage system (ESS).
Energies 11 01991 g008
Figure 9. The Operation of HRS with Gas Tank between 1500 m3 and 8000 m3.
Energies 11 01991 g009
Table 1. Evaluation of Support Vector Machine (SVM), Artificial Neural Network (ANN), and K-Nearest Neighbors (KNN).
Forecasting TypesWind SpeedInsolation
Error RateRMSEError RateRMSE
SVM0.291.020.450.64
ANN0.751.340.630.26
KNN0.080.490.420.71
Table 2. Traffic Flow Forecasting Evaluation.
Forecasting TypesWeekdayWeekend
Error RateRMSEError RateRMSE
SVM0.291.020.450.64
ANN0.751.340.630.26
KNN0.280.880.420.71
Table 3. Real-Time Pricing (RTP) Tariff Evaluation.
Forecasting TypesRTP
Error RateRMSE
SVM0.581.47
ANN0.542.94
KNN0.410.86
Table 4. Model Parameters.
ConstantValueRemark
η c h a 0.9Charging efficiency
η d i s c h a 0.9Discharging efficiency
ζ H 1.2hydrogen demand for each FCV
η H E 0.8hydrogen loss during the progress from gas storage tank to the gas filling station
γ H 2 O 0.5the exchange rate of water for hydrogen production
γ H 2 E 0.2compression efficiency
η C E 0.8gas loss during the progress of compression
η G L 0.8gas loss during the transferring progress
ζ G 1.2refueling demand for each NGV
γ H 2 G 0.2electricity loss when compressor is working
H 0.06The possibility of the FCVs stopping to refuel
G 0.06The possibility of the NGVs stopping to refuel
E 0.06The possibility of the EVs stopping to refuel
Table 5. Hybrid Refueling Station Benchmark Operation Strategy.
ModuleValley PeriodPeak PeriodThreshold
ESSCharging S O C ¯ · 500 T 1 for each intervalDischarging S O C ¯ · 500 T 2 for each intervalnone
Hydrogen systemHydrogen production at each interval is H S C ¯ T 1 Generally not working β H · H S C ¯
Gas refueling systemGas delivered to the tank at each interval is G S C ¯ T 1 Generally not working β G · G S C ¯
Table 6. Comparison of Optimization Performance under Different Tariffs.
TariffOriginal Cost ($)Optimized Cost ($)Optimization Percentage
Economy 73158275587.3
Economy 103073261985.2
RTP3151258882.1
Flat-rate3053266087.1
Table 7. Relationship between Gas Storage Capacity and Operating Expenses.
Gas Storage Capacity (m3)Optimized Cost ($)
15003022
30002923
50002855
80002850

