Experimental Assessment of a Methodology for the Indirect in-Cylinder Pressure Evaluation in Four-Stroke Internal Combustion Engines


 , ,
, , 
Abstract
:1. Introduction
- Acoustic emissions: The acoustic emissions generated during the combustion phase are a good indicator of the combustion phenomena, and therefore they can be used quite easily to reconstruct the pressure trend inside the cylinder [20]. The typical experimental layout consists of a microphone mounted on top of the cylinder block. During the engine operation, unfortunately, a wide range of possible spurious sources as piston slap, valve clatter, gas turbulent flow and many other fluid and mechanical events can generate acoustic emissions that can lead to bias errors in the measurement process: it is then mandatory to develop specific signal processing algorithms to isolate the significant features and remove the events not related to combustion. For example, the complex spectrum analysis (i.e., the one using the complex value of the Fourier Transform [21]) is applied to the acoustic emission signal. The main advantage of the acoustic emissions analysis is that it has a high signal-to-noise ratio in comparison to engine vibration signals, being then particularly suitable for the pressure curve reconstruction, especially on diesel engines. The pressure signal reconstructed from the acoustic emissions is then generally more accurate than that obtained from vibrations [22,23]. On the other hand, data acquisition and analysis require expensive and highly-specialized devices, due to the very high frequency content of acoustic emissions.
- Crankshaft speed fluctuation: During each thermodynamic cycle of the engine, the crankshaft speed changes because of the in-cylinder pressure: when the pressure inside the cylinder increases, the engine torque also increases and this causes a temporary acceleration of the crankshaft. On the other hand, during the compression stroke, the pressure inside the cylinder decrease, causing the crankshaft deceleration. Thus, by measuring with a high acquisition frequency the crankshaft speed (e.g., with a phonic wheel or with an optical encoder) it is possible to trace back the in-cylinder pressure. Between the two measurement techniques, the phonic wheel has the advantage that it is already available in all modern engines [19]. This approach however has some limitations that could be overcome only by an accurate modeling of the vehicle and the engine mechanism [24]. Between these limitations is worth briefly mentioning: (a) the incremental errors due to the construction tolerance and the inaccurate mounting of the cogs [19]; (b) the higher the number of cylinders, the lower the speed variations of the crankshaft and then, the lower the applicability of this method; moreover, the higher the engine speed, the lower are the speed variations of the crankshaft because of the engine inertia; (c) the inertia on the entire vehicle and its operating conditions; (d) the torsional deflections, especially at high engine speeds [25,26];
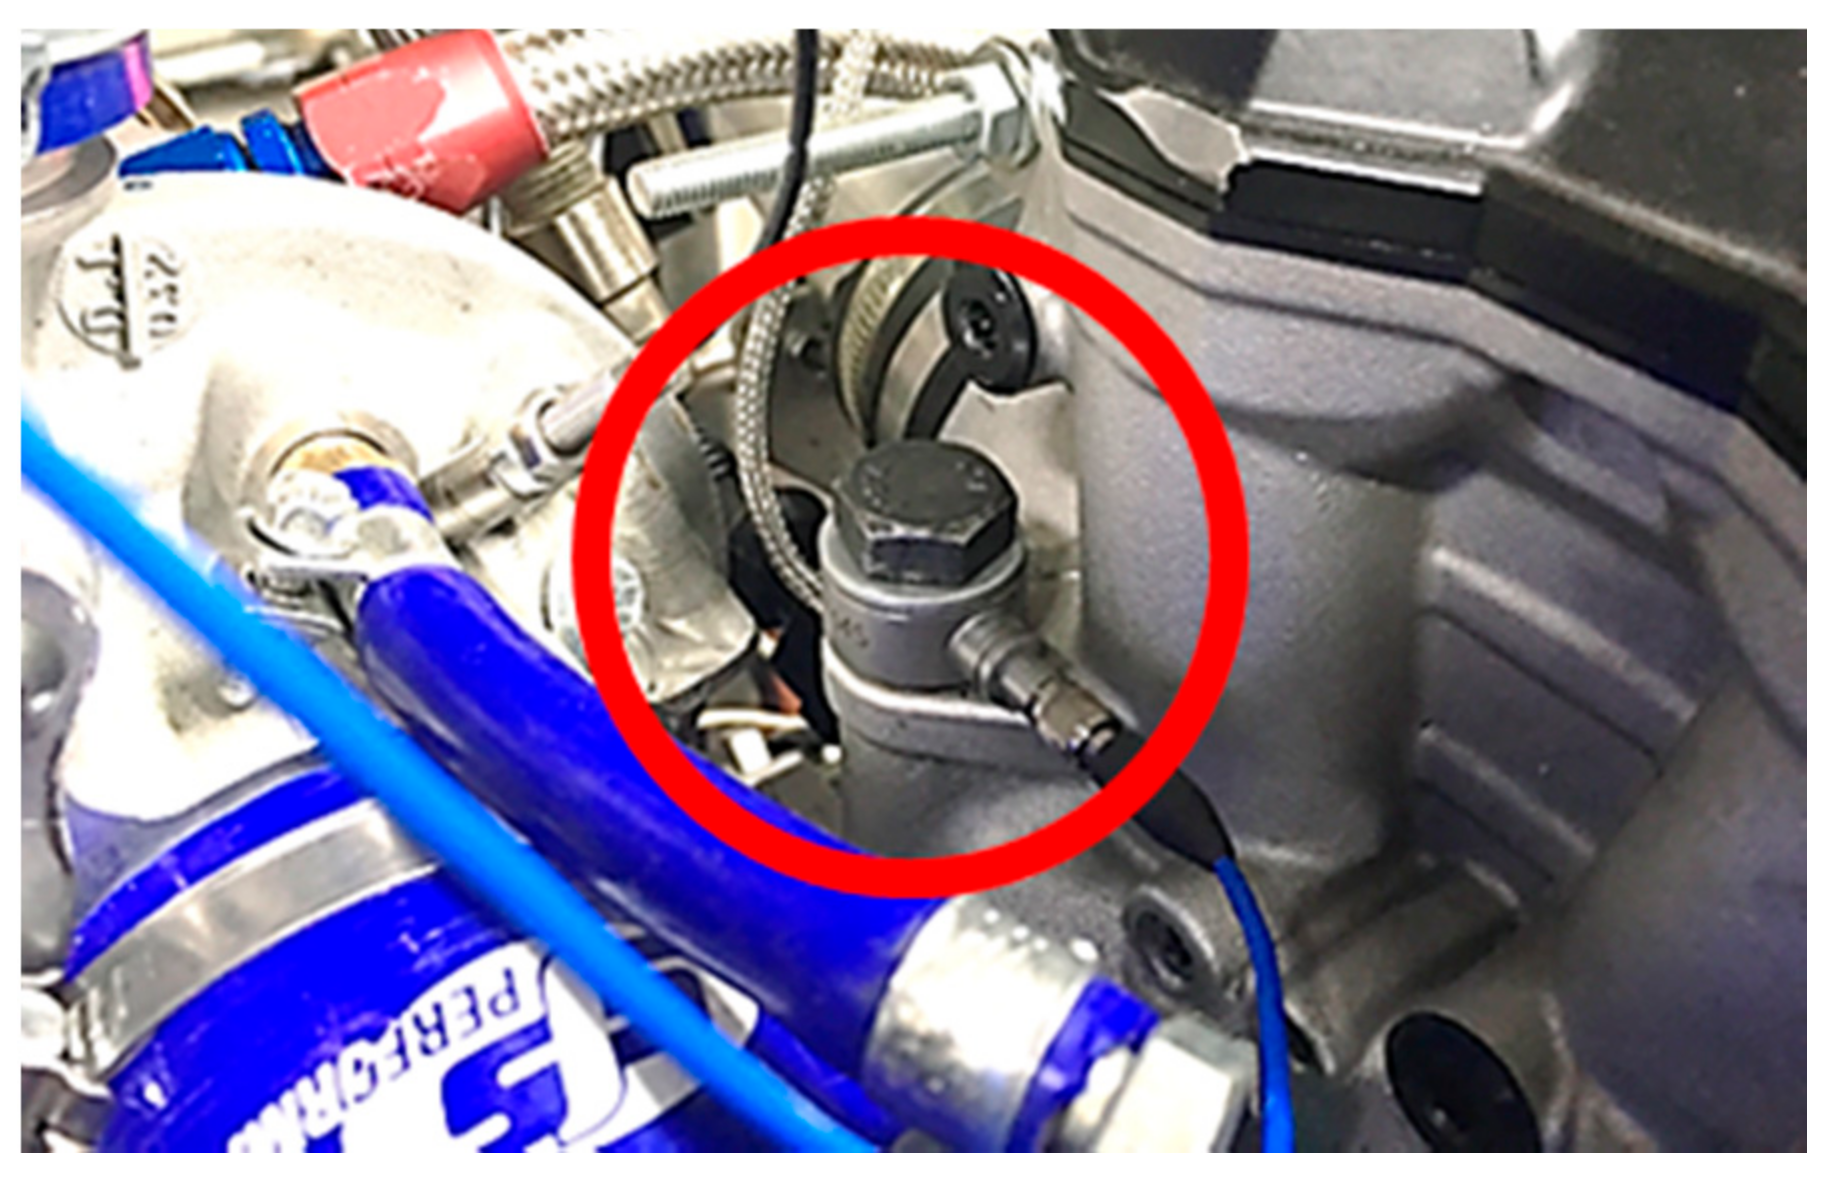
- Force on spark plug: The in-cylinder pressure curve can be obtained also by the measurement of the compression forces acting on the cylinder head structure. The measurement devices can be mounted in various ways [27,28,29,30], but the most common location is beneath the spark-plug [31]. This setup requires the modification of the cylinder head, but the output of the strain washers can be easily correlated to the in-cylinder pressure. The main advantage of this arrangement is that the loads on the spark plug caused by the pressure inside the cylinder are greater than those caused by other loads (valve train dynamics, thermal loads, etc.). For these reasons, the post-processing of the data is quite easy. On the other hand, the main drawback of this setup is that the head of the engine has to be modified to house the strain washer. In addition, the spark ignition could cause electrical noises that can affect the accuracy of the in-cylinder pressure measurement.
- experimental tests on an engine test rig. The signal from a piezoelectric strain washer (SW) and that from a piezoelectric dynamic pressure sensor (PS) were acquired for different engine loads and rotation speeds;
- the signal from the strain washer was post-processed to estimate the in-cylinder pressure with particular focus on the combustion angular range and the main combustion parameters (maximum pressure value, its angular position, and the 50% mass burned fuel, MBF50, angular position), useful for the close-loop engine control;
- the capabilities of the methodology were finally assessed in both steady-state and transient conditions (considering also non-standard operating conditions) in order to evaluate the reliability on the detection of malfunctioning conditions like knock, pre-ignition and misfire.
2. Proposed Approach
3. Methods and Experiments
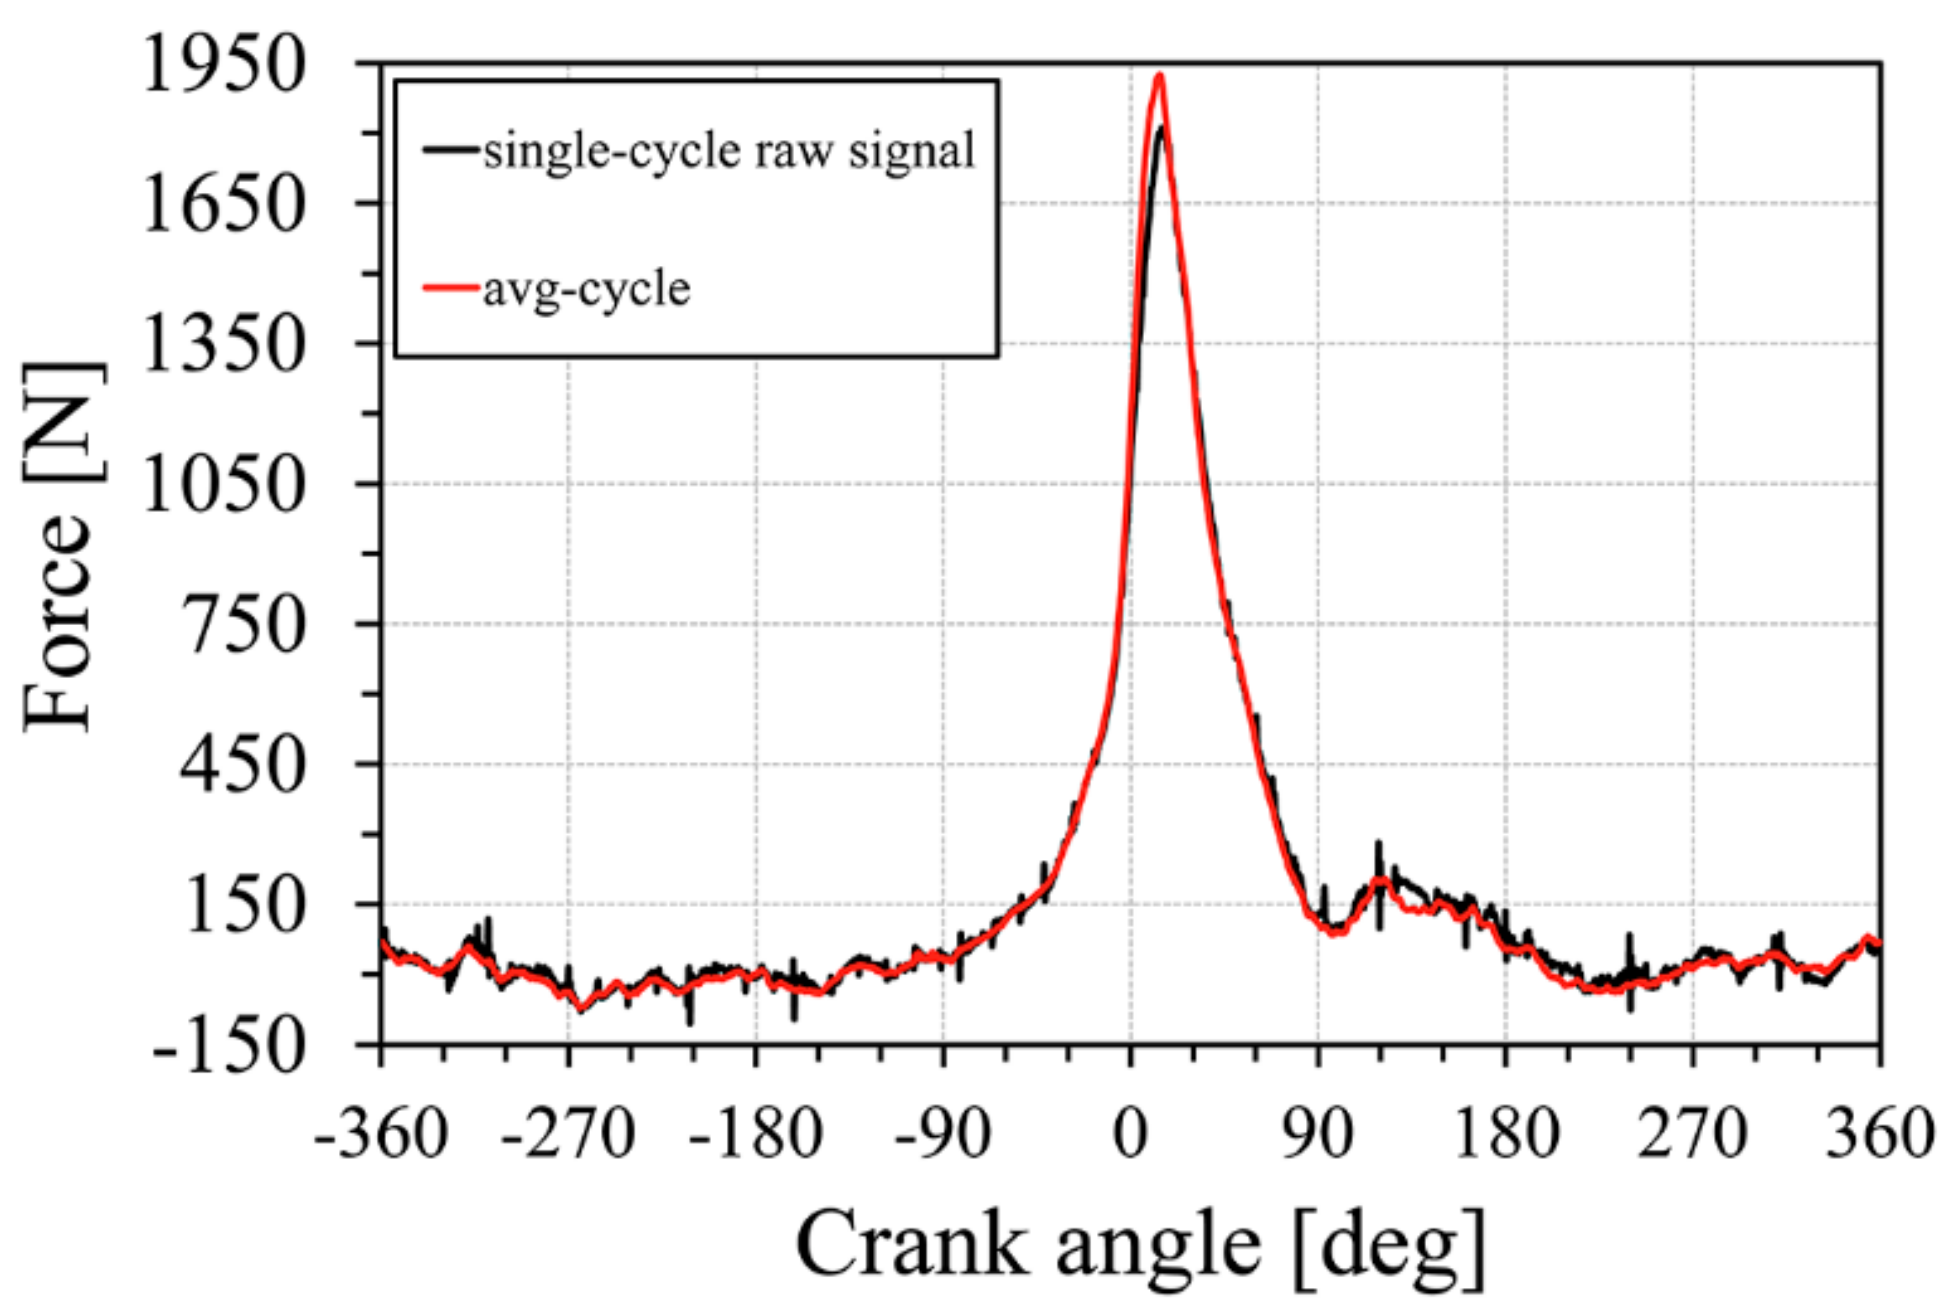
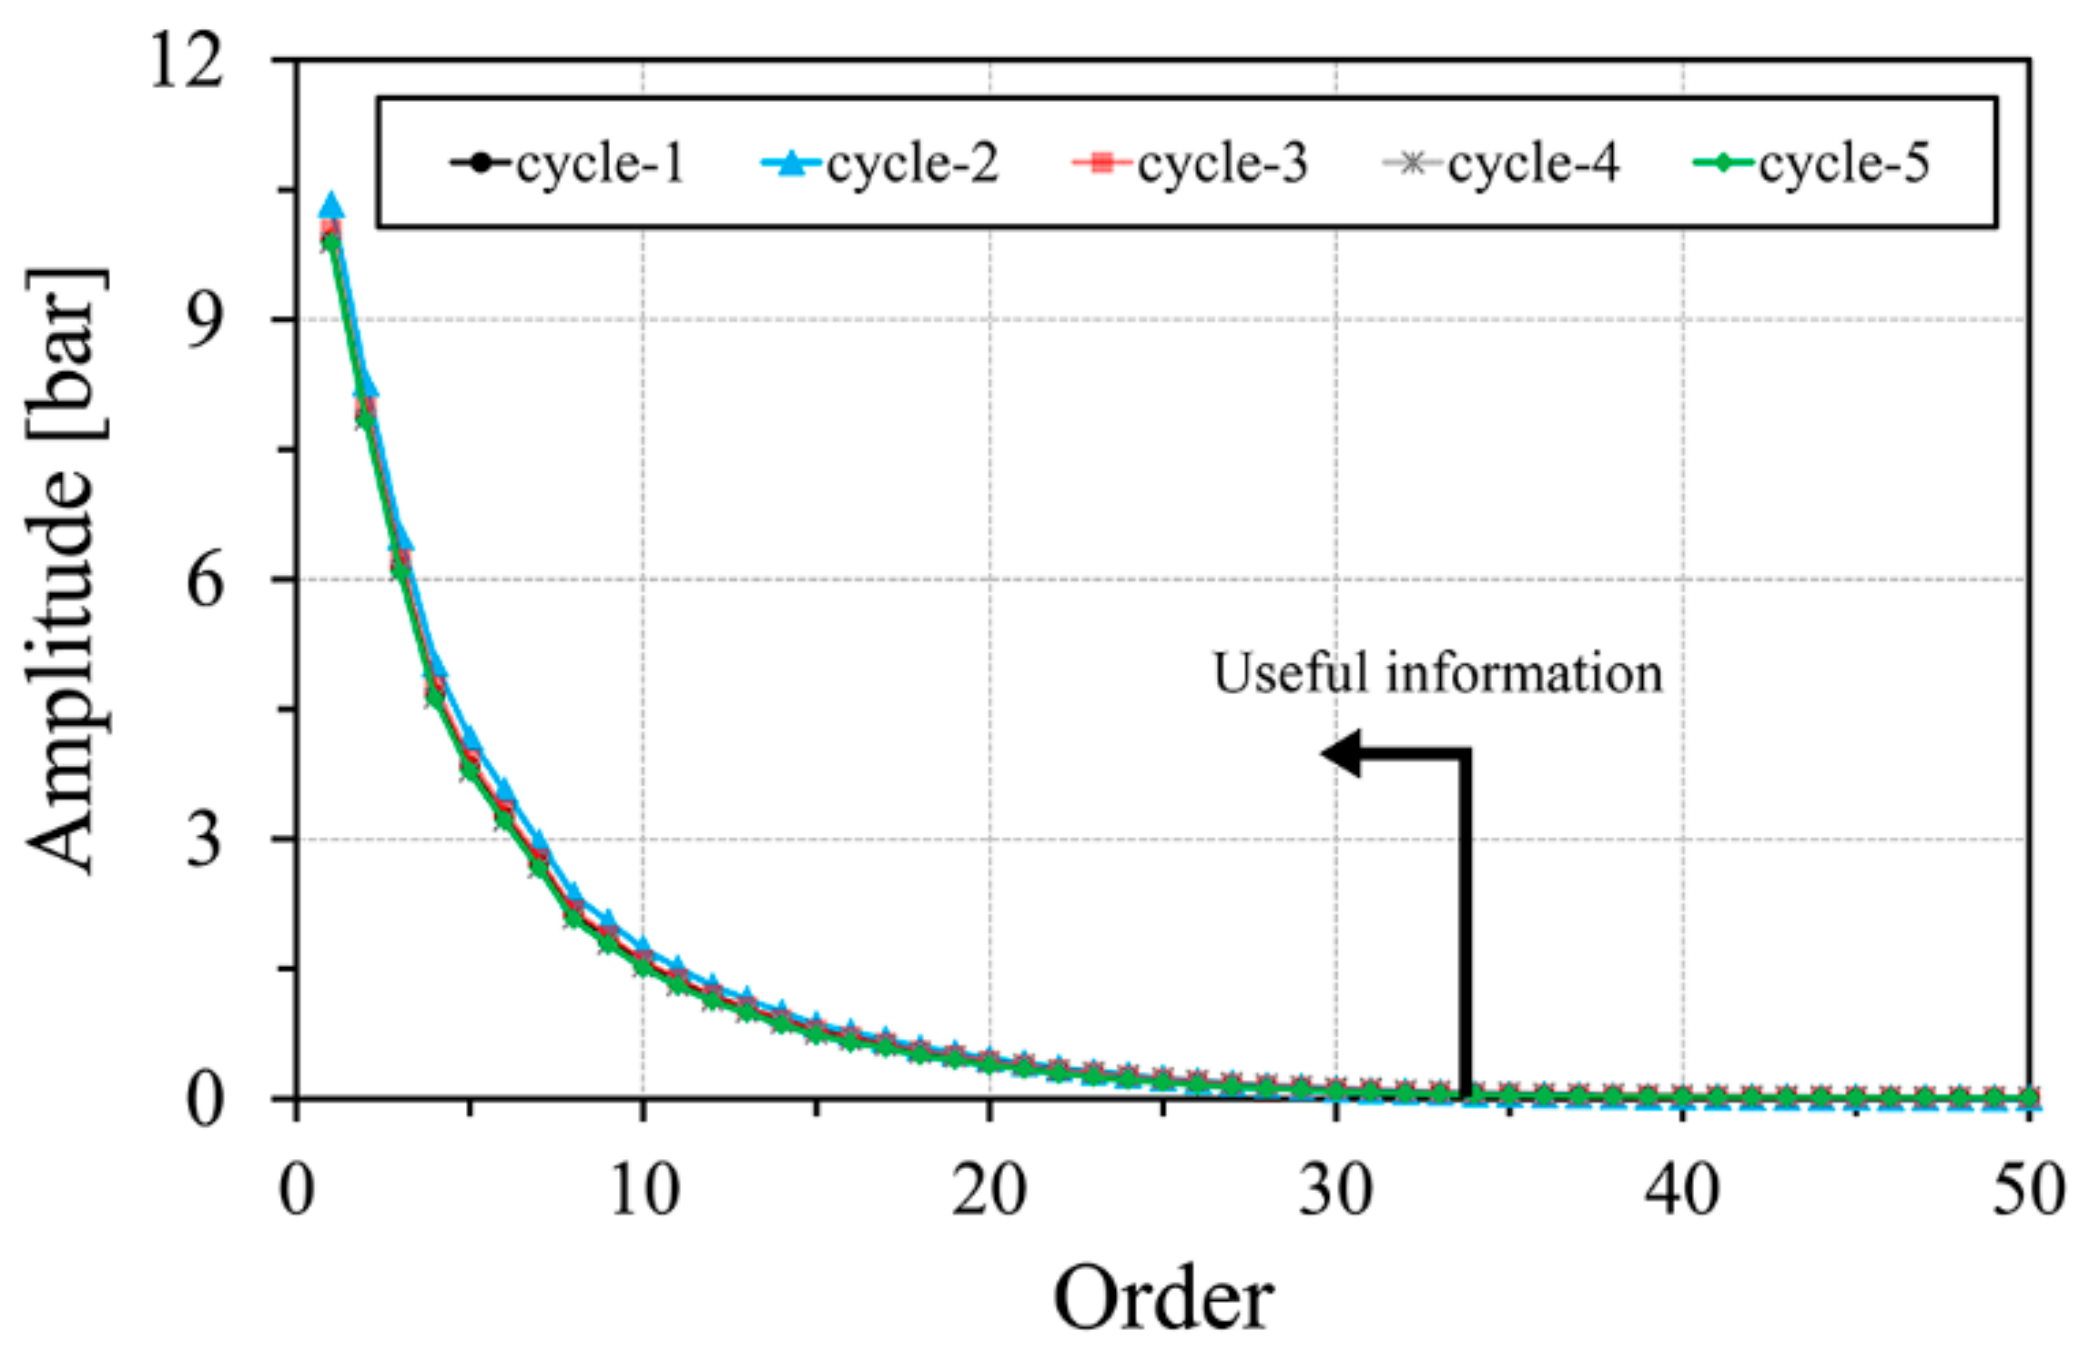
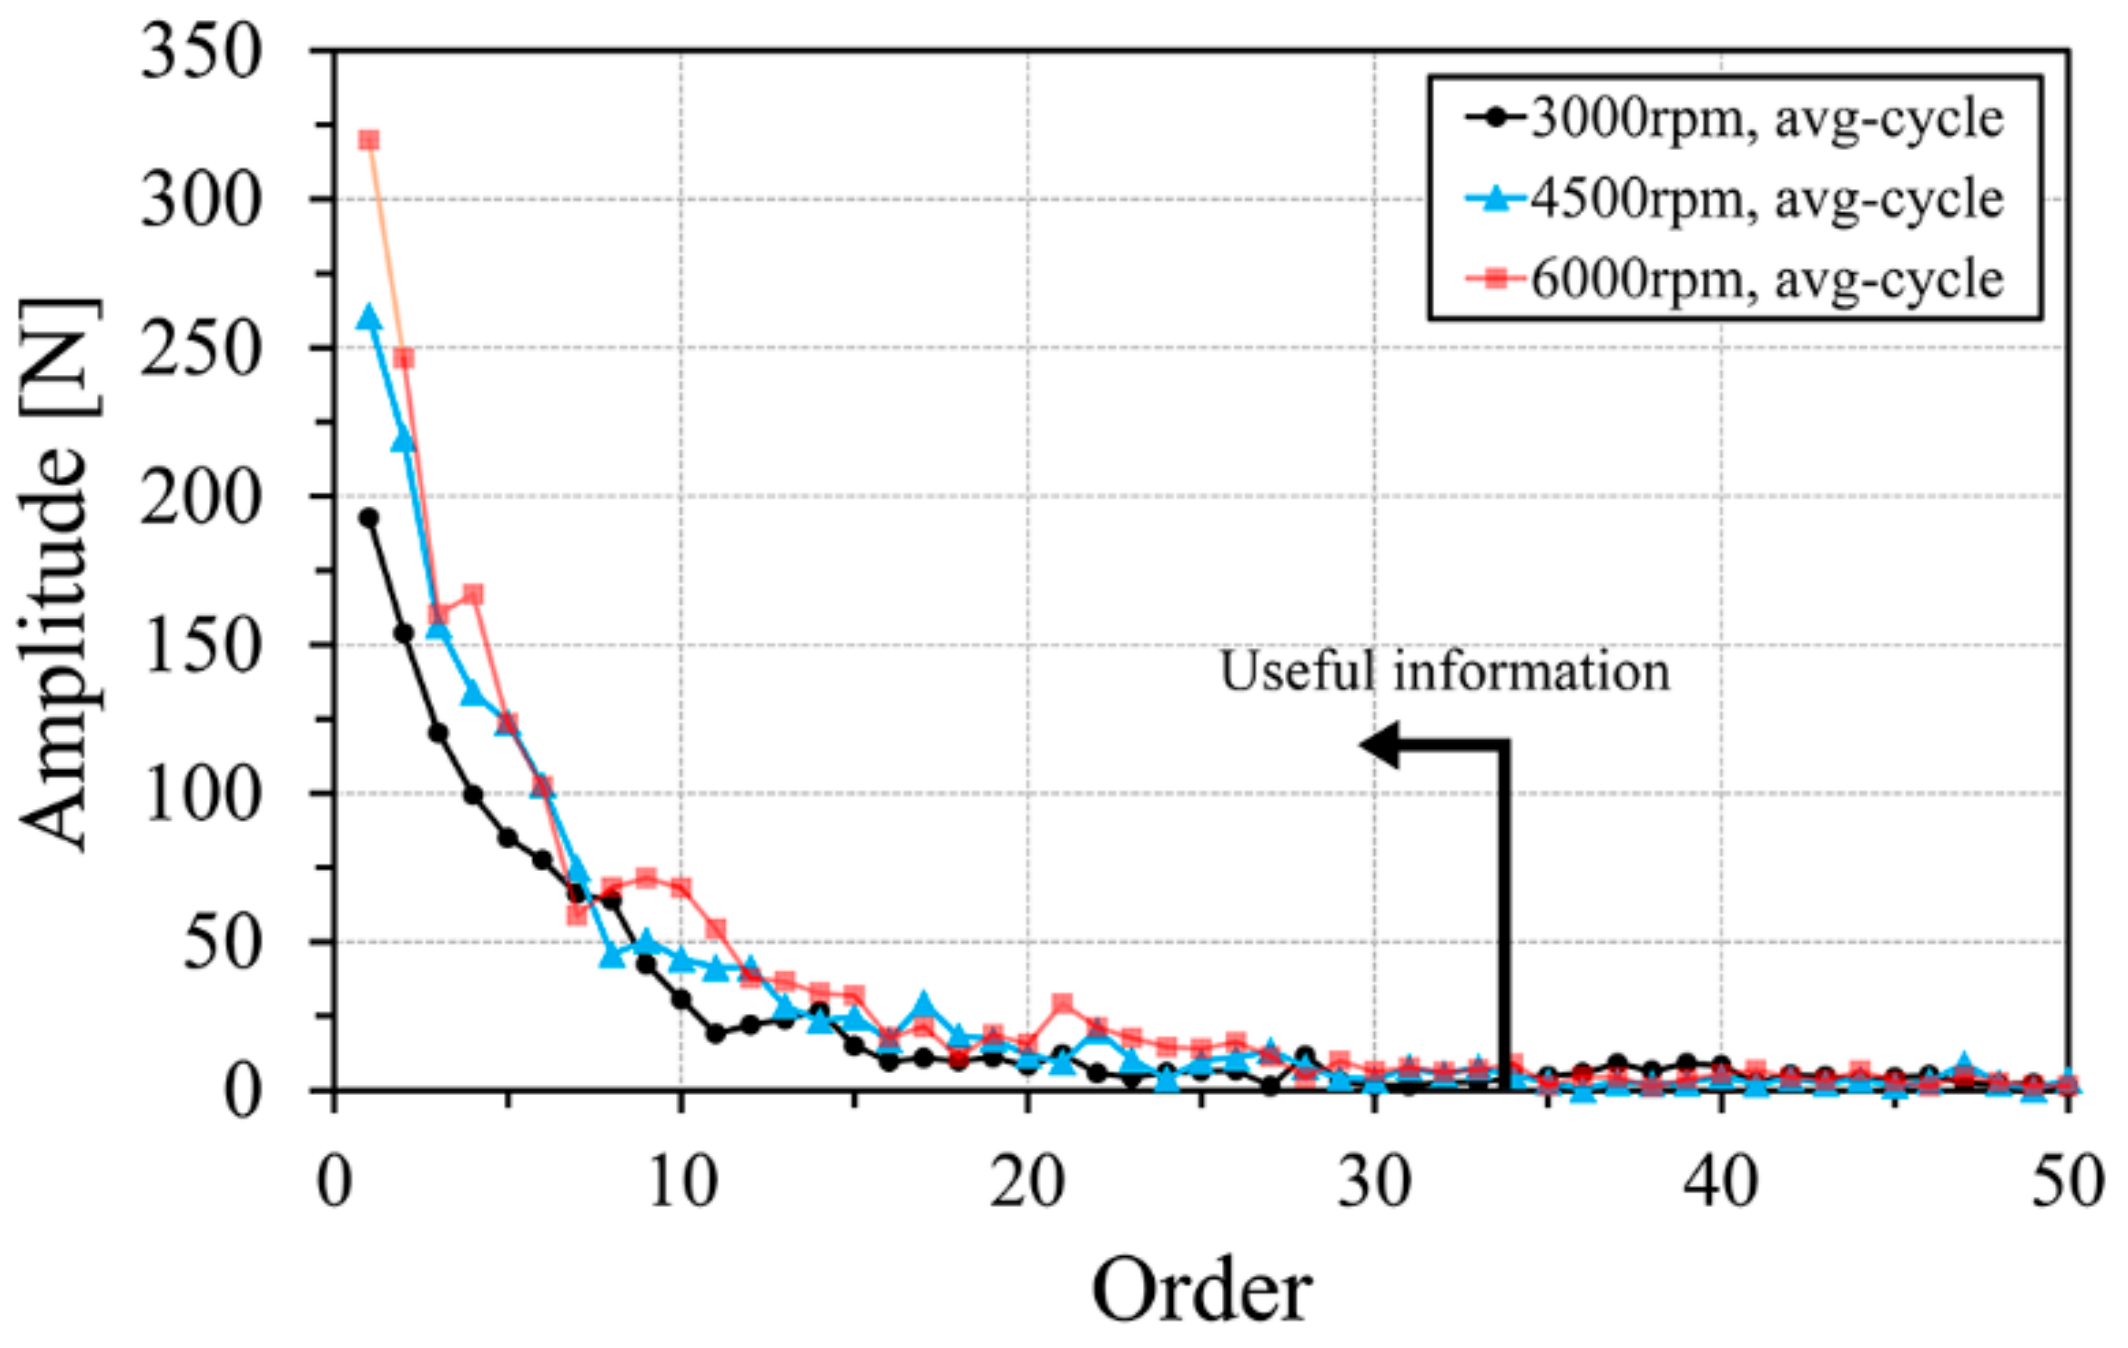
Strain Washer Data Analysis
4. Model Capabilities
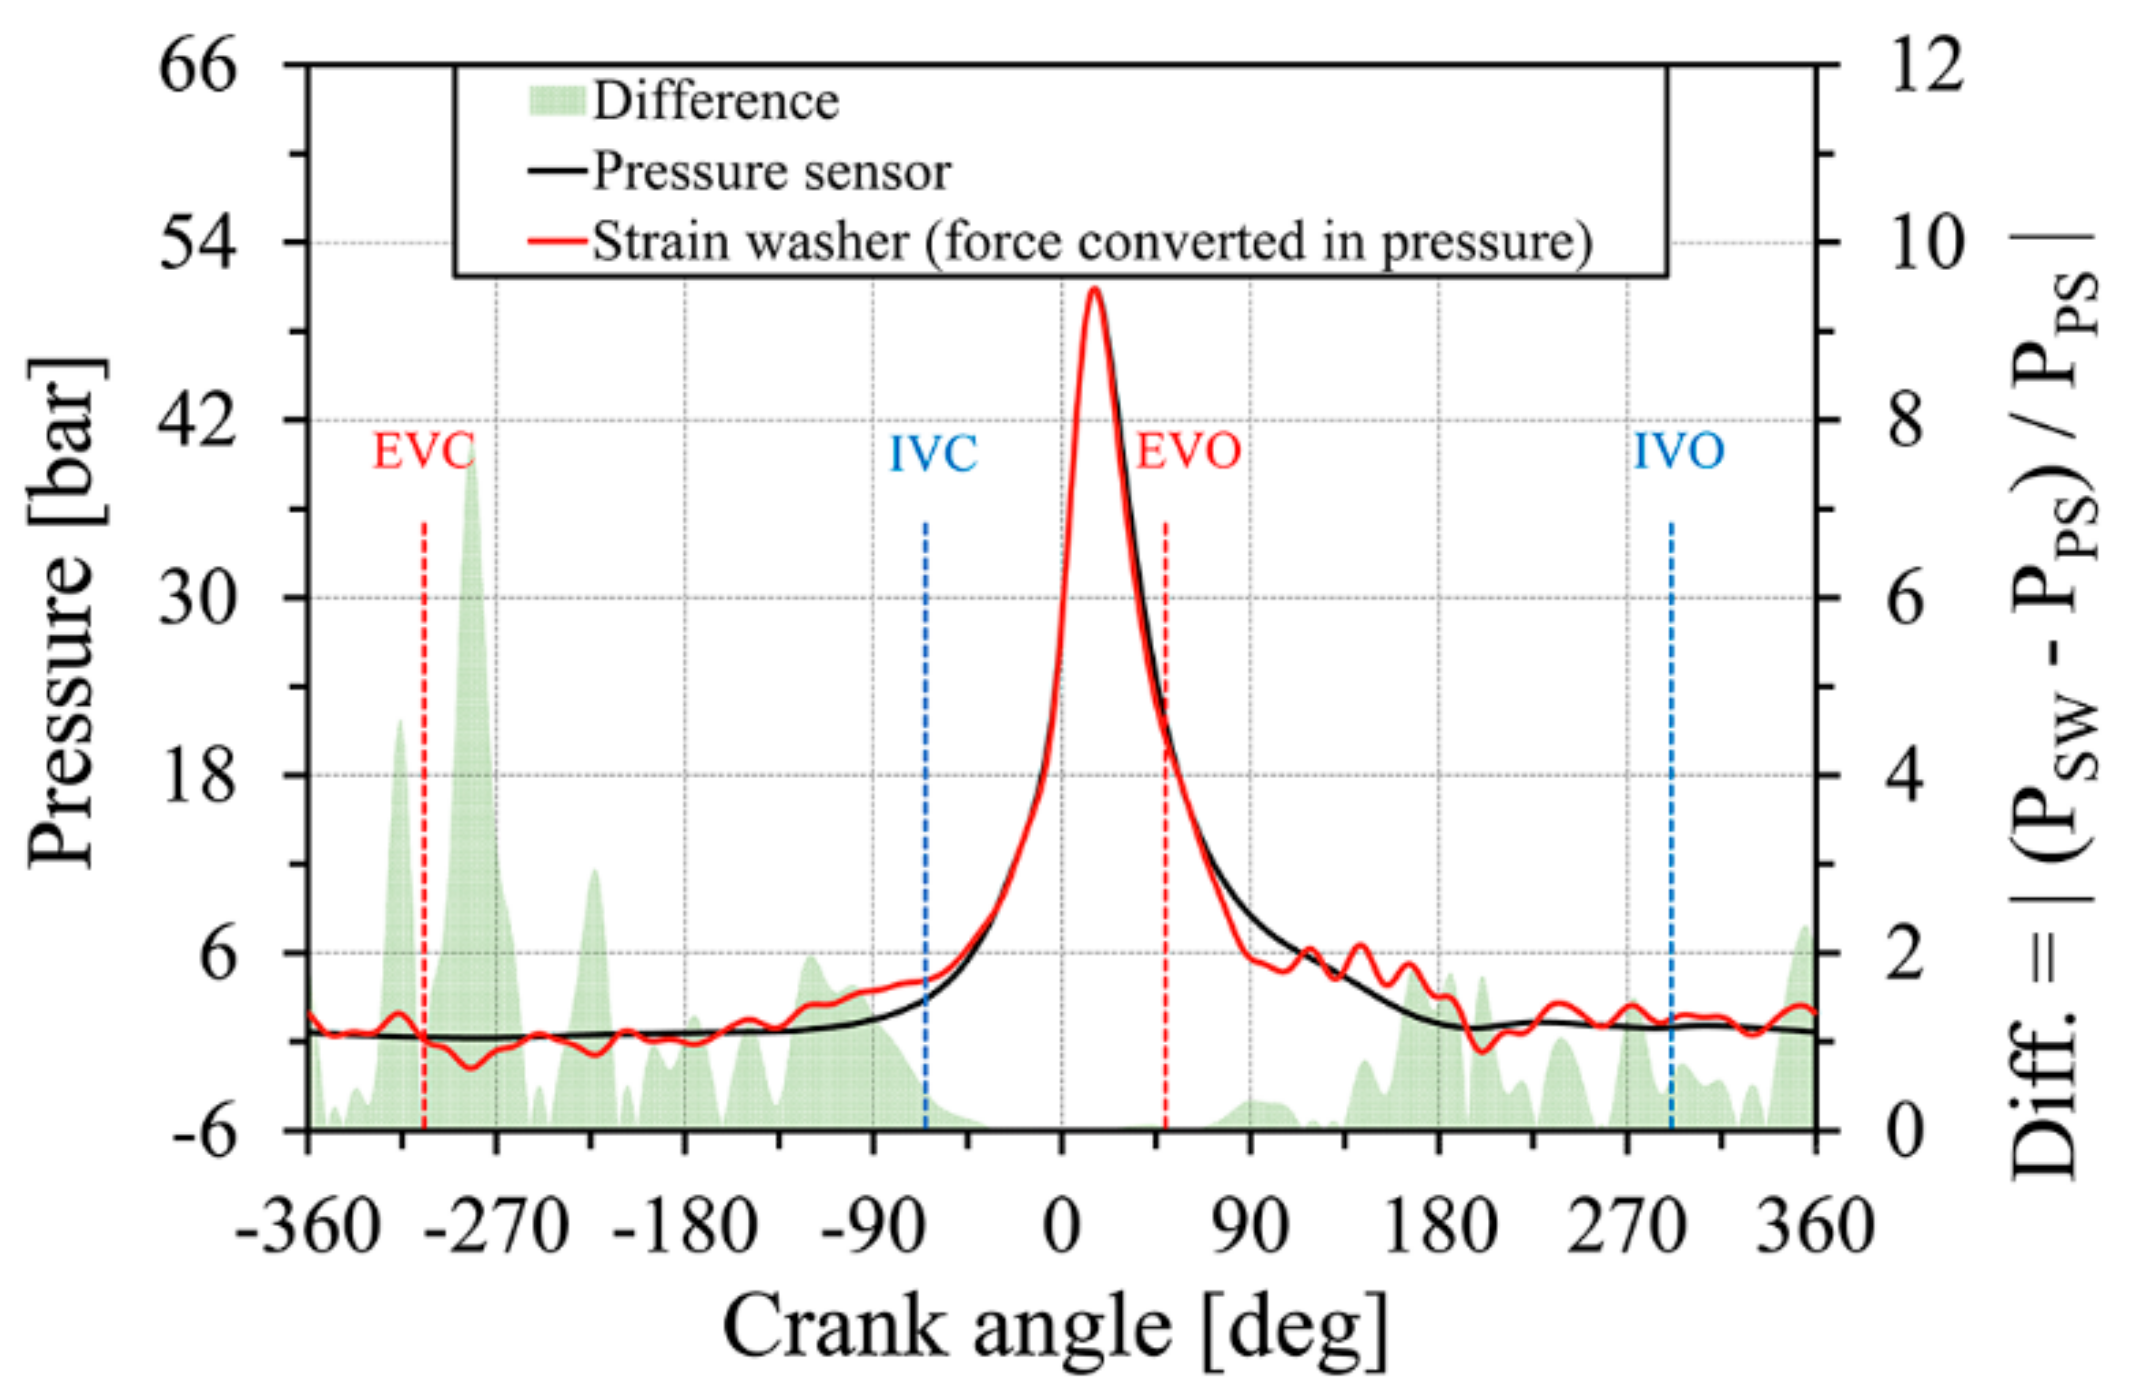
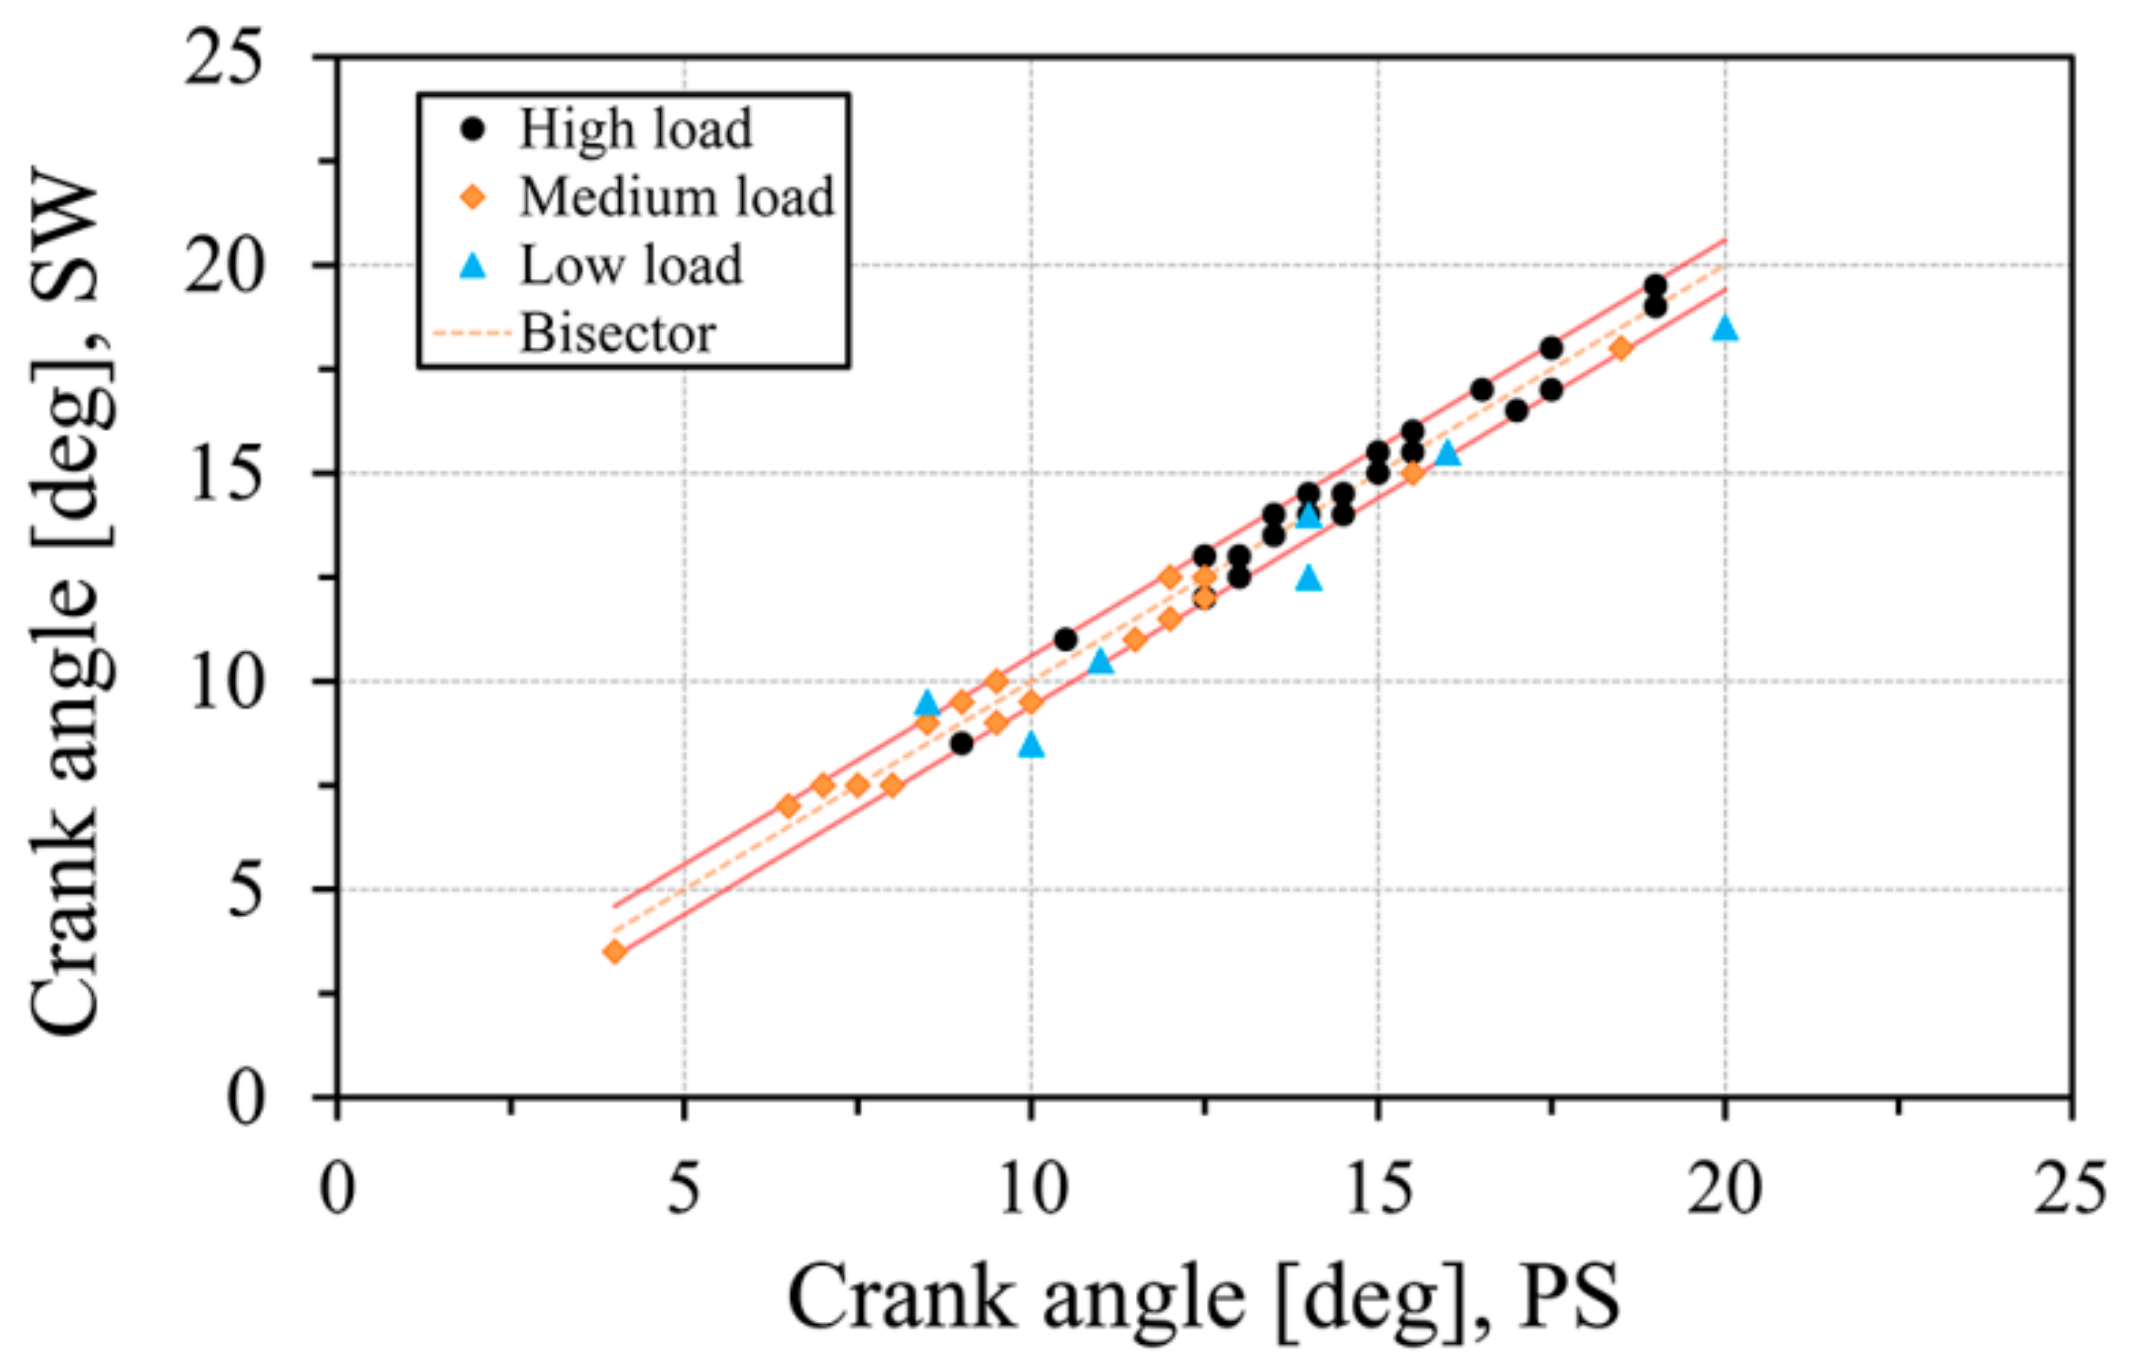
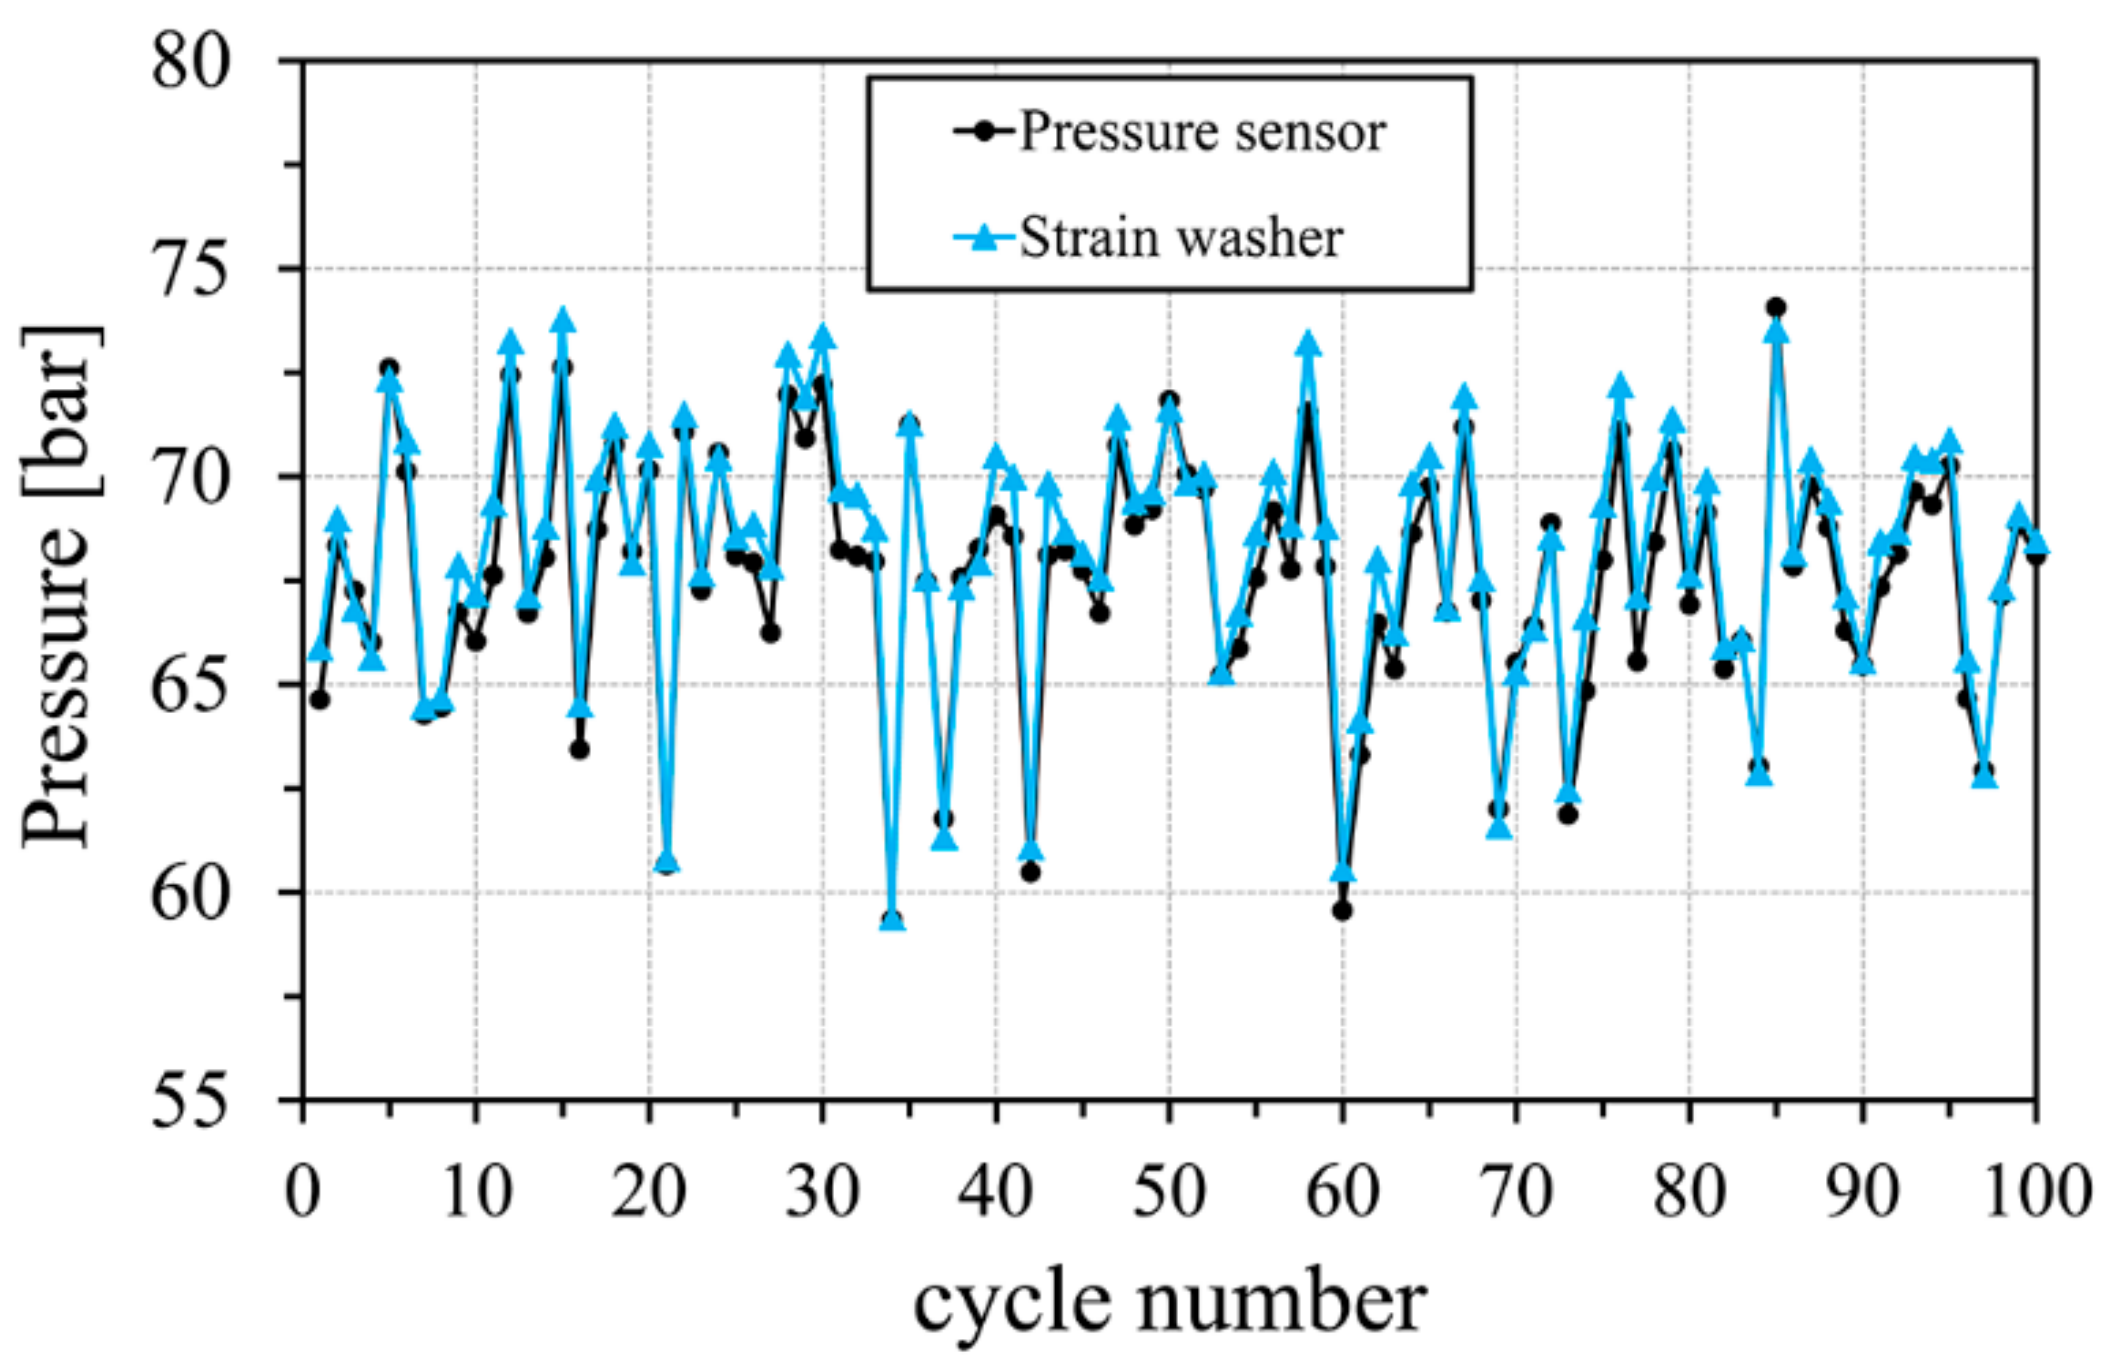
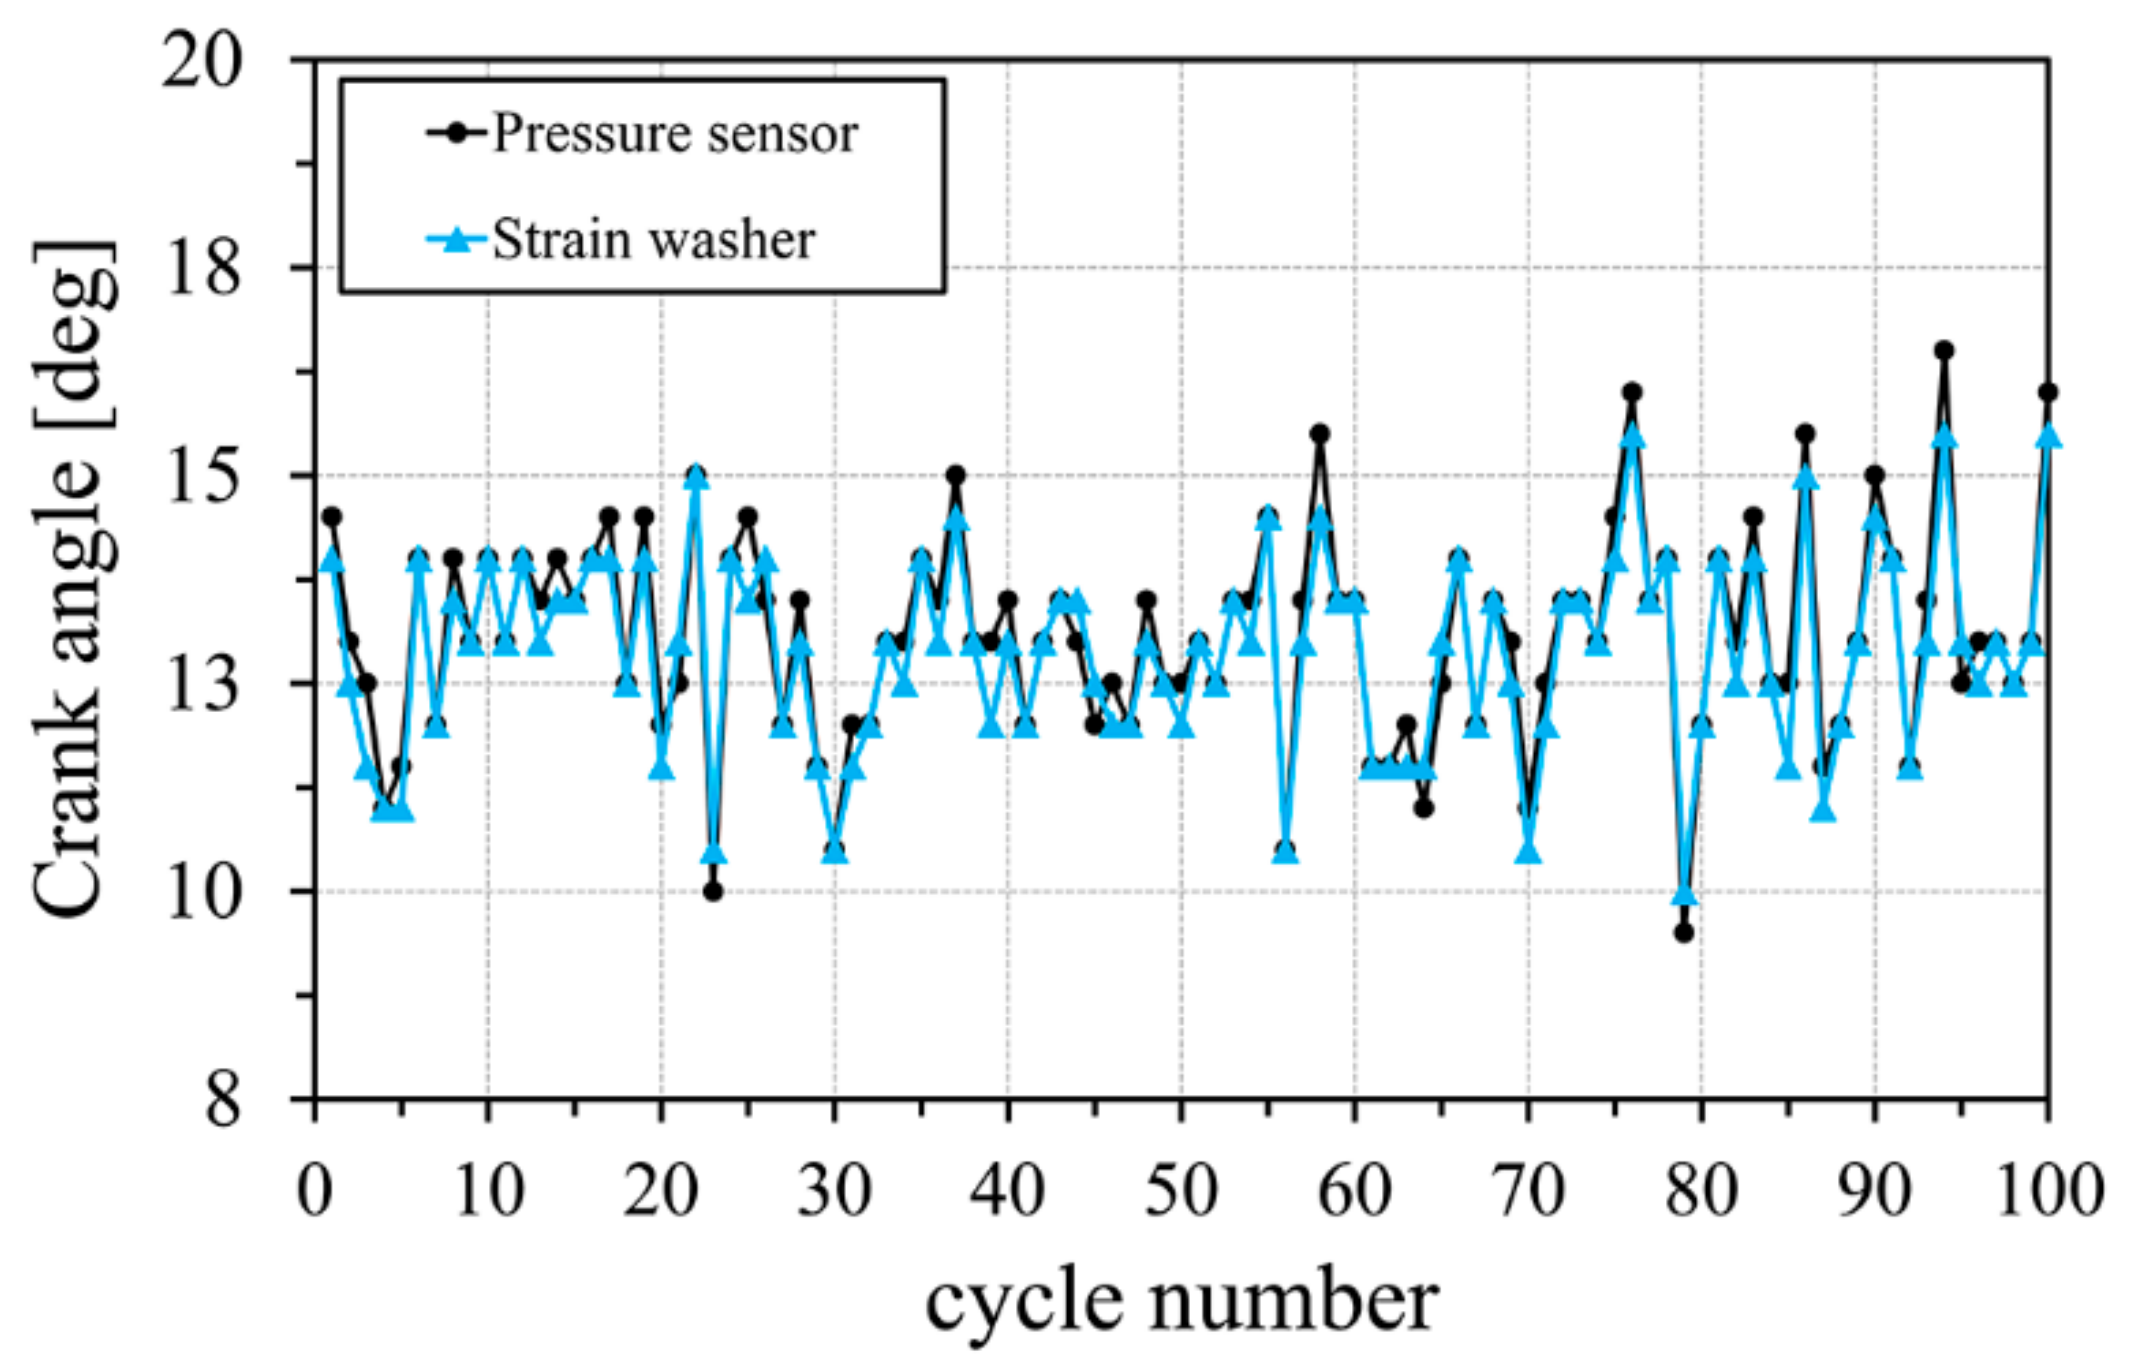
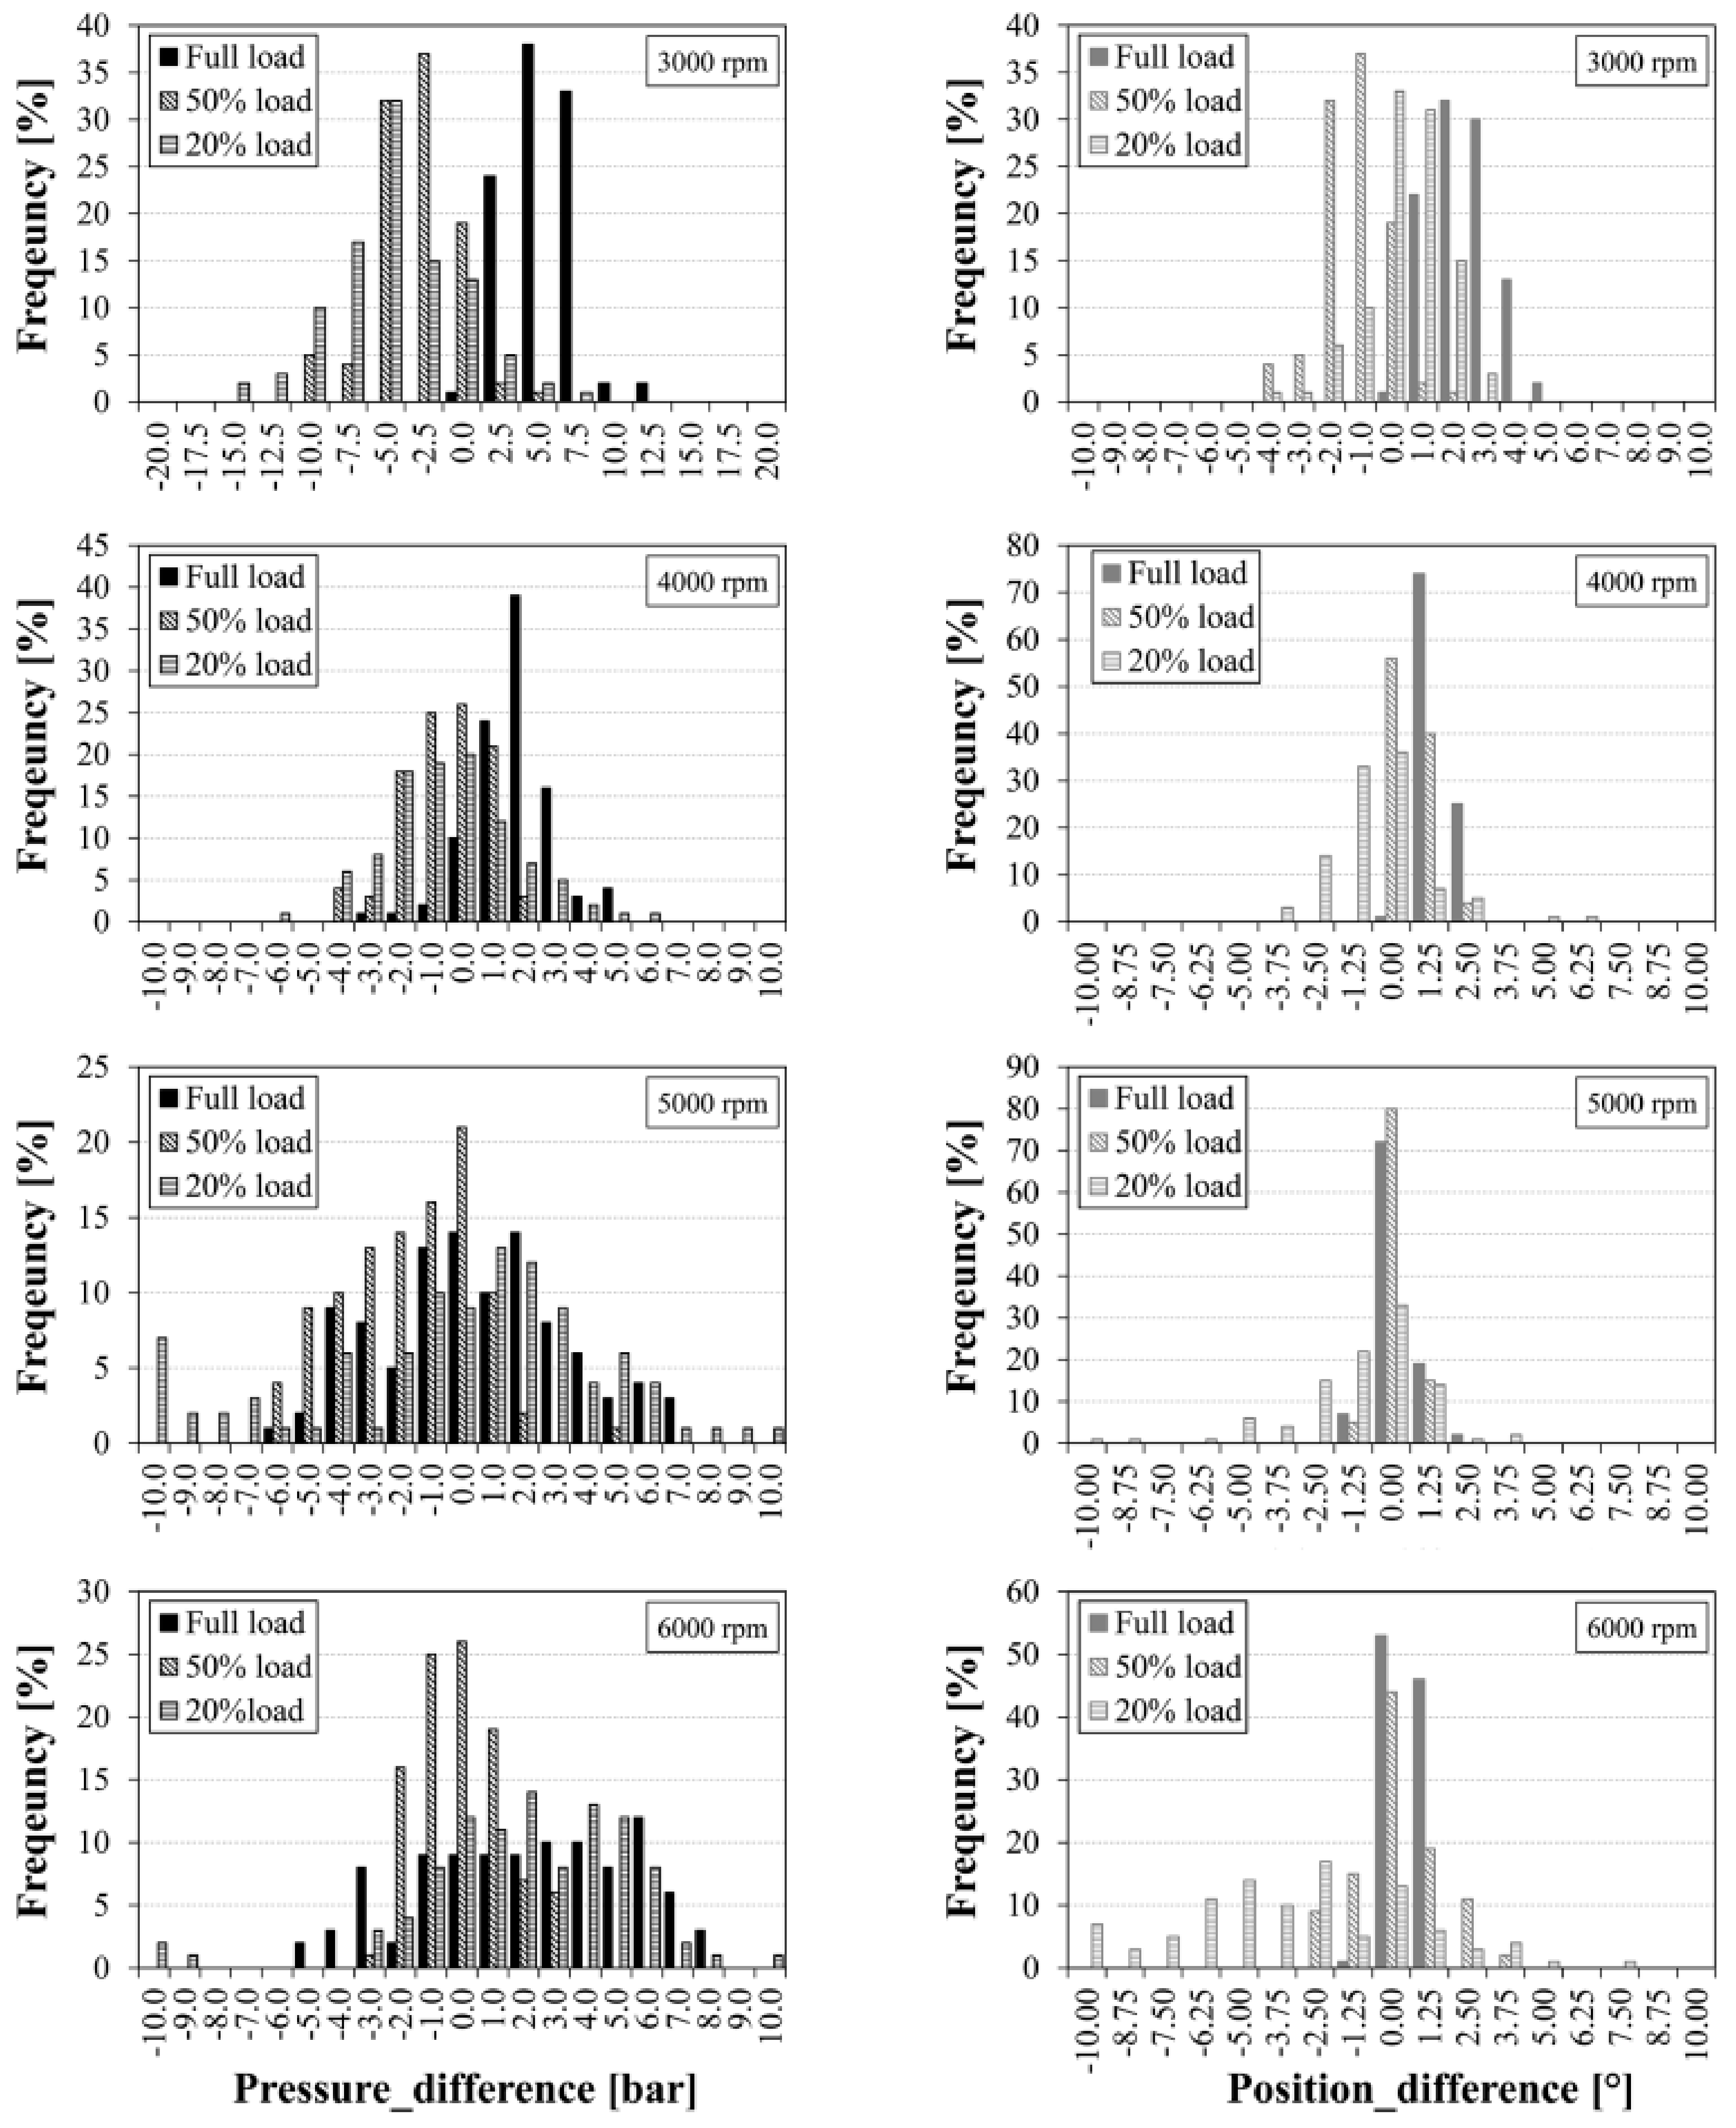
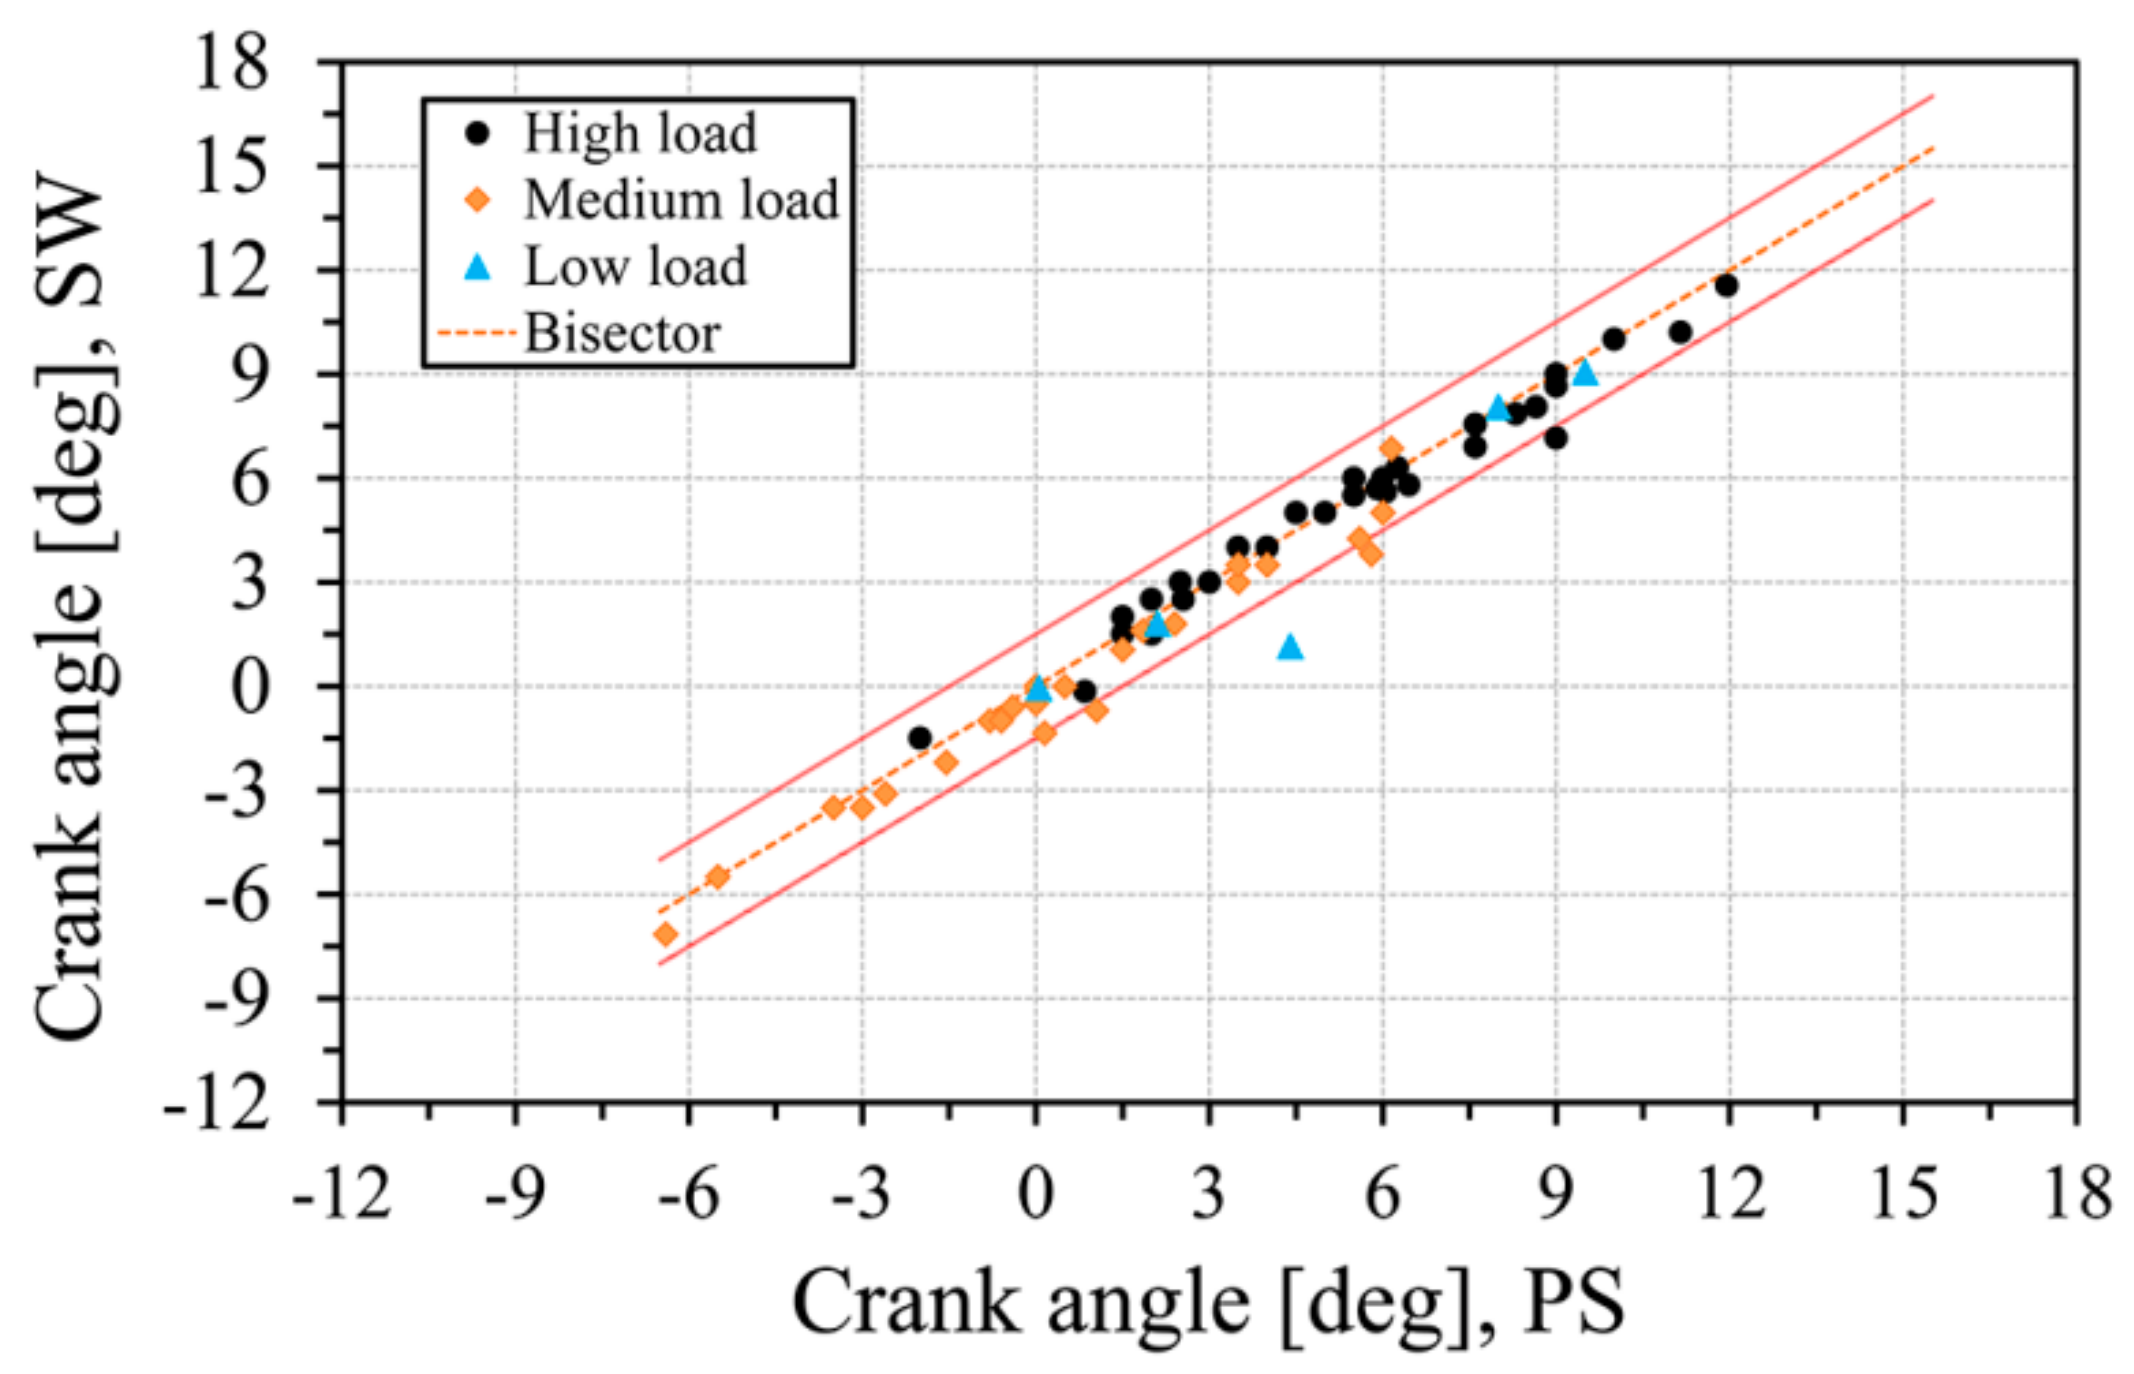
4.1. Detection of the Main Combustion Parameters
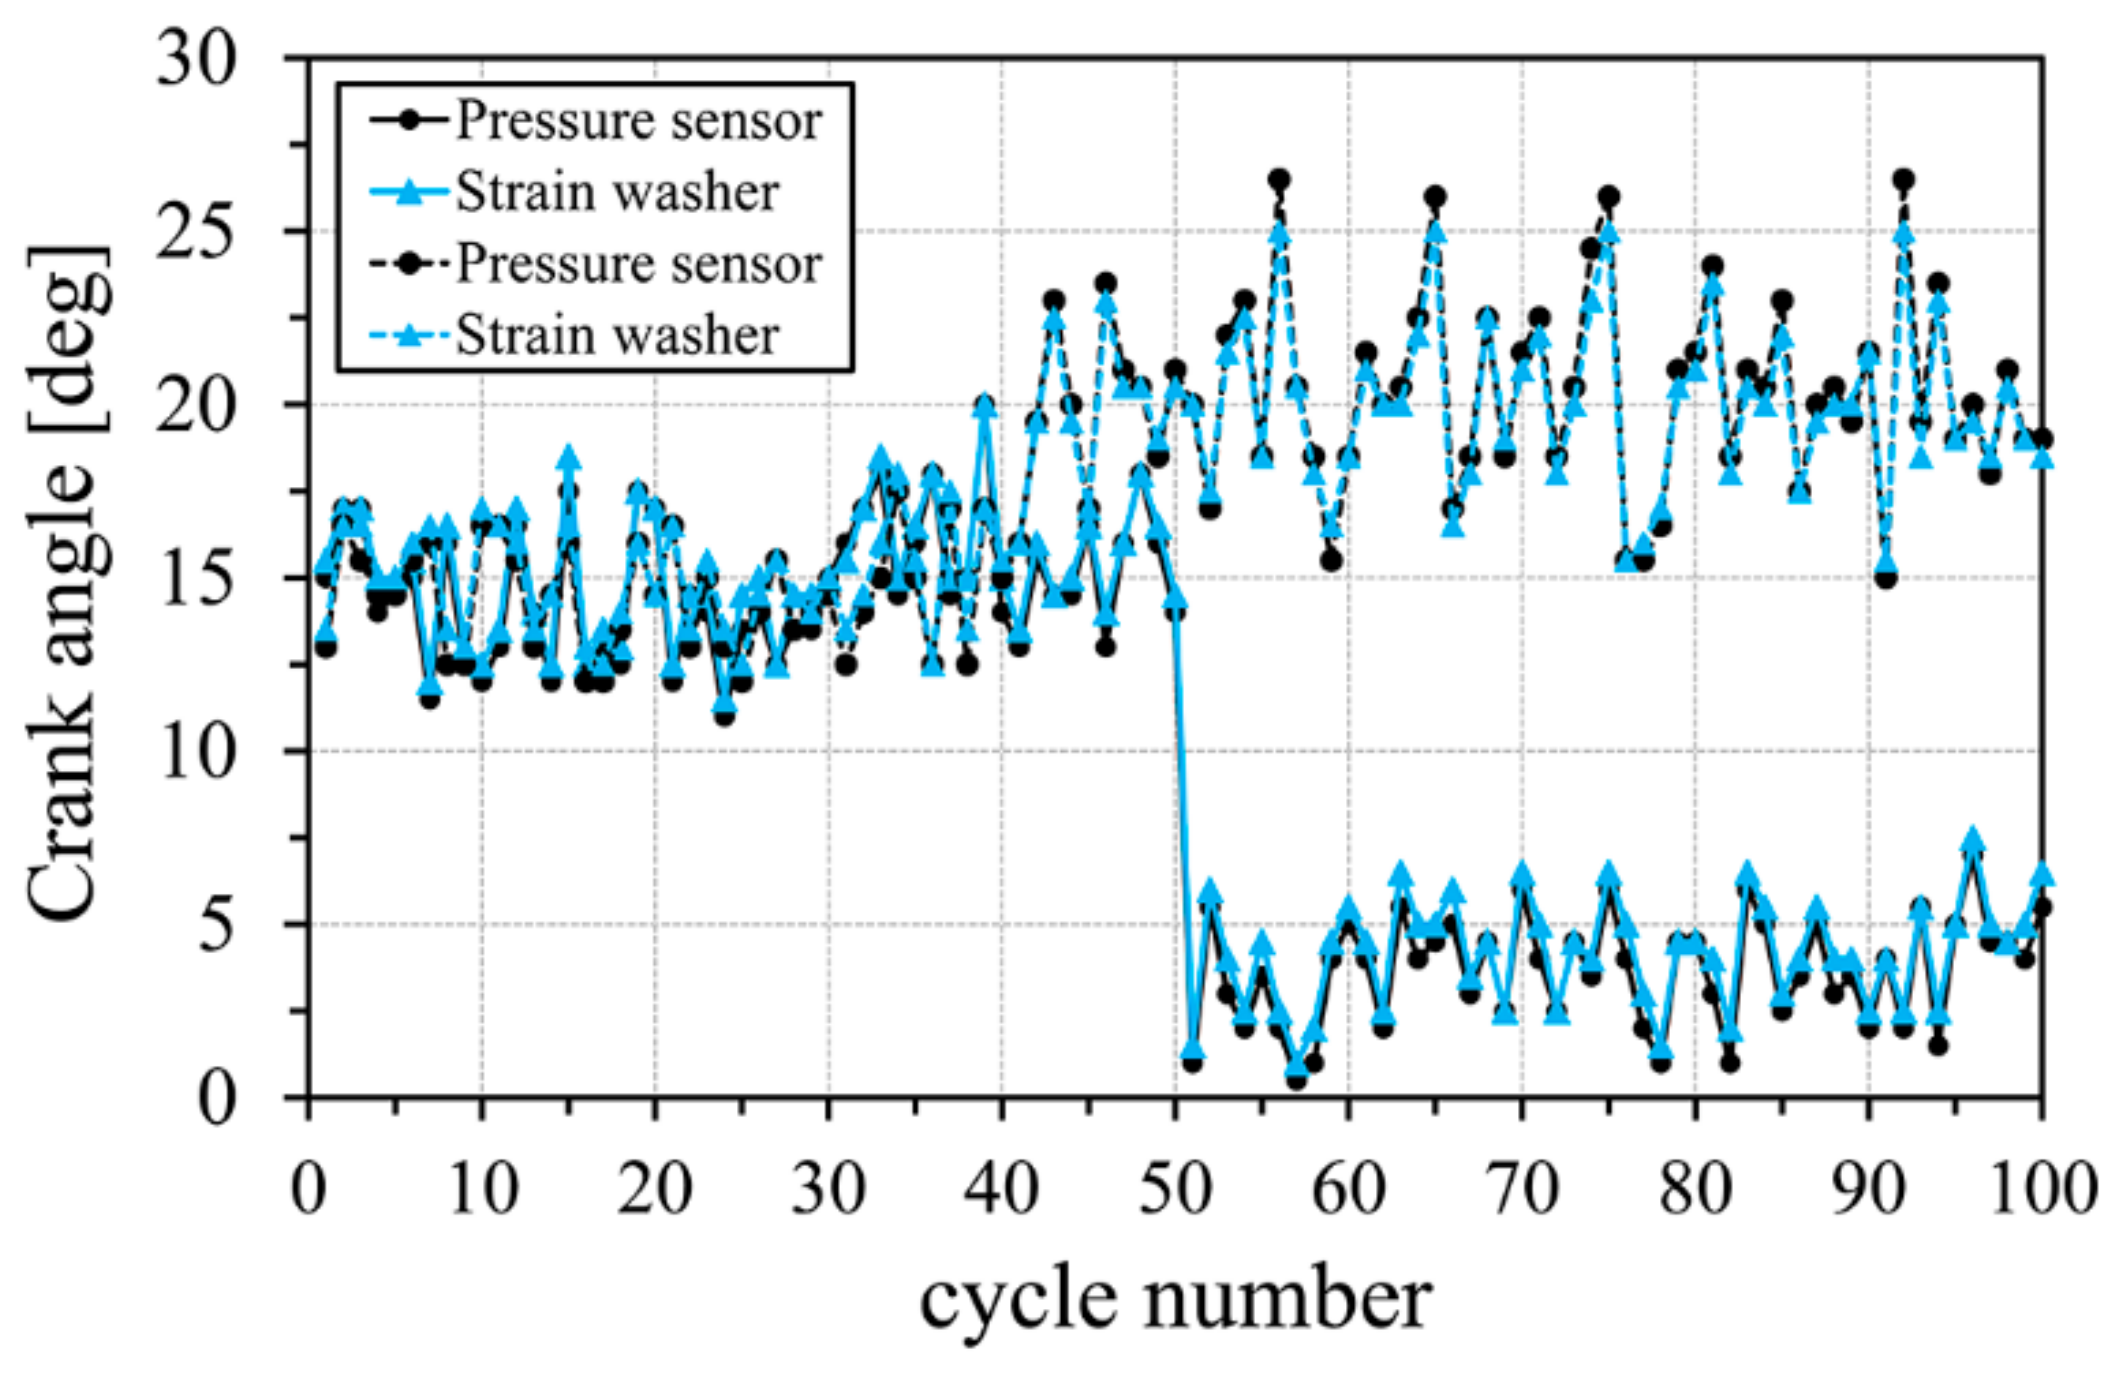
4.2. Misfiring
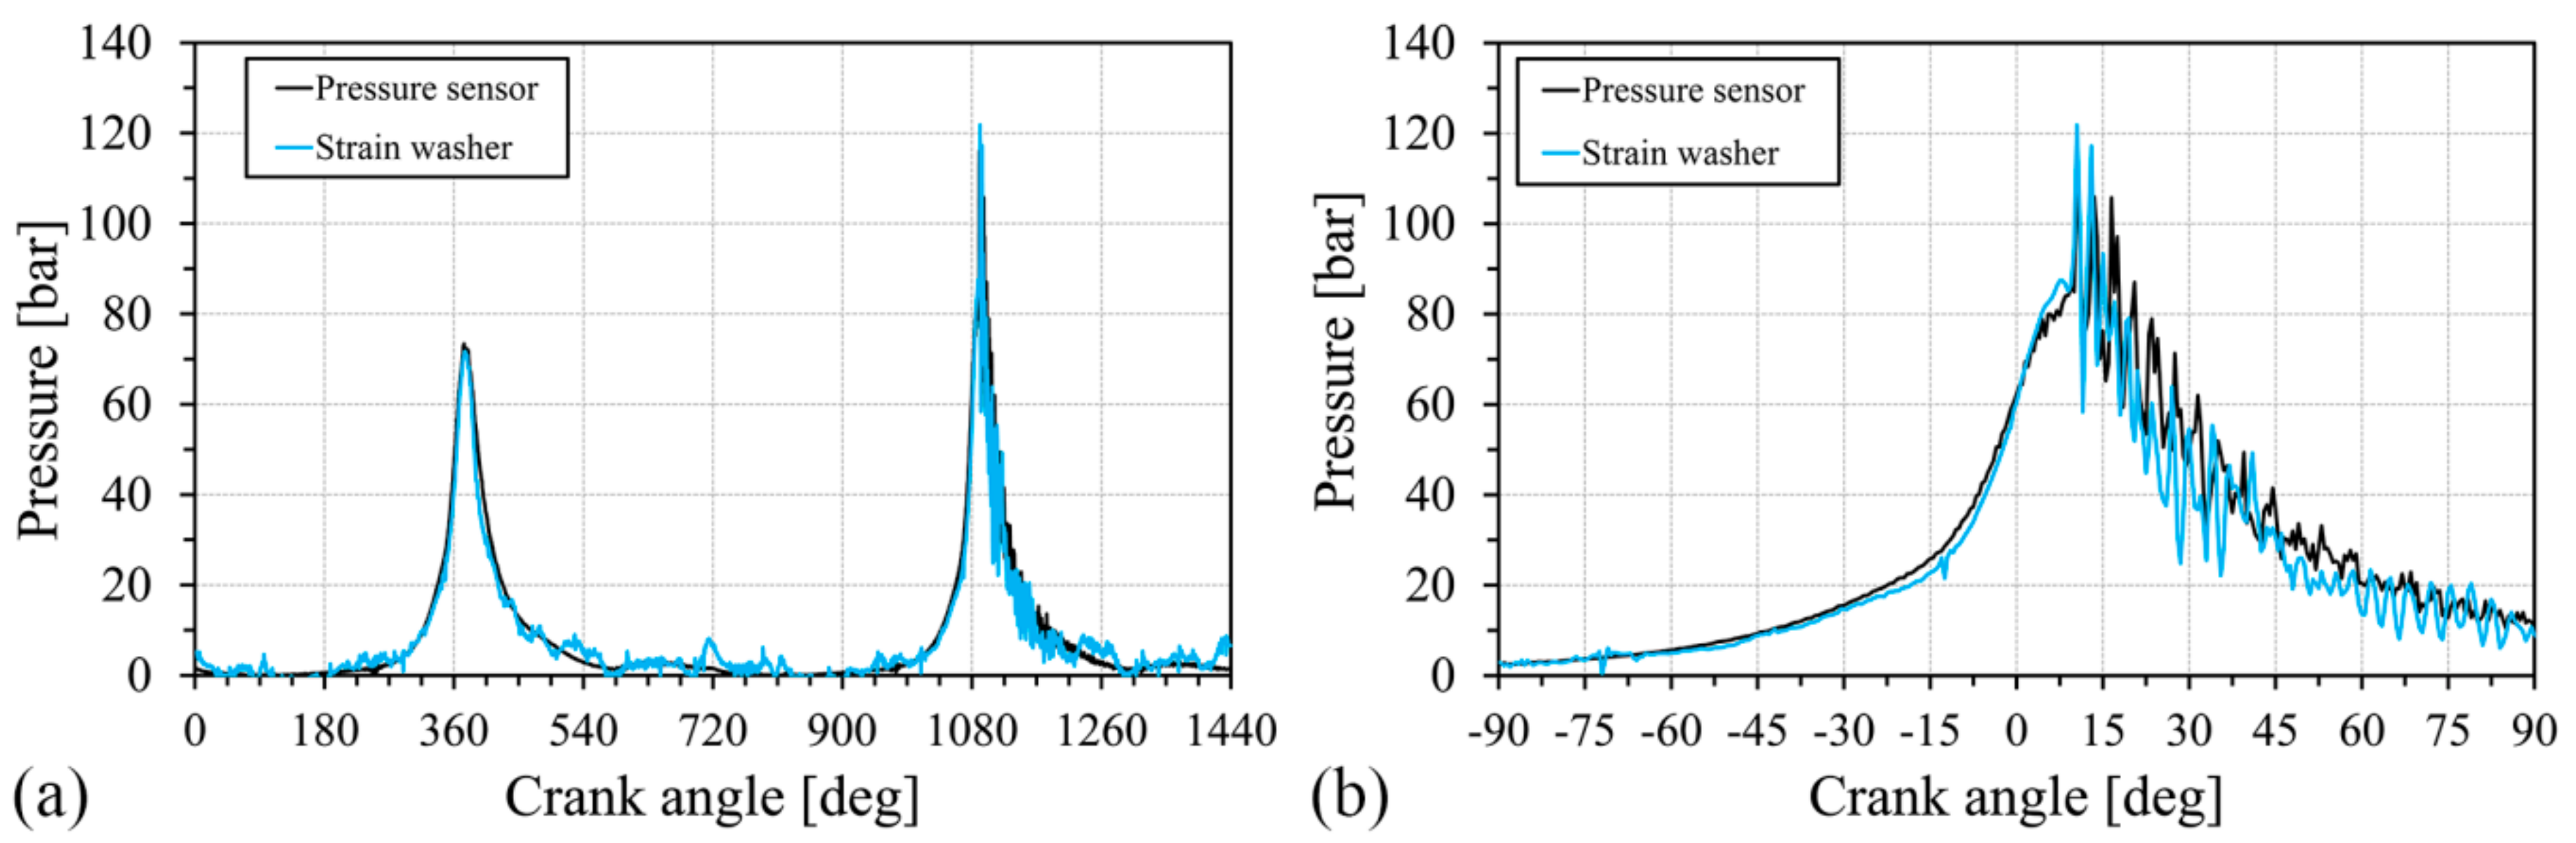
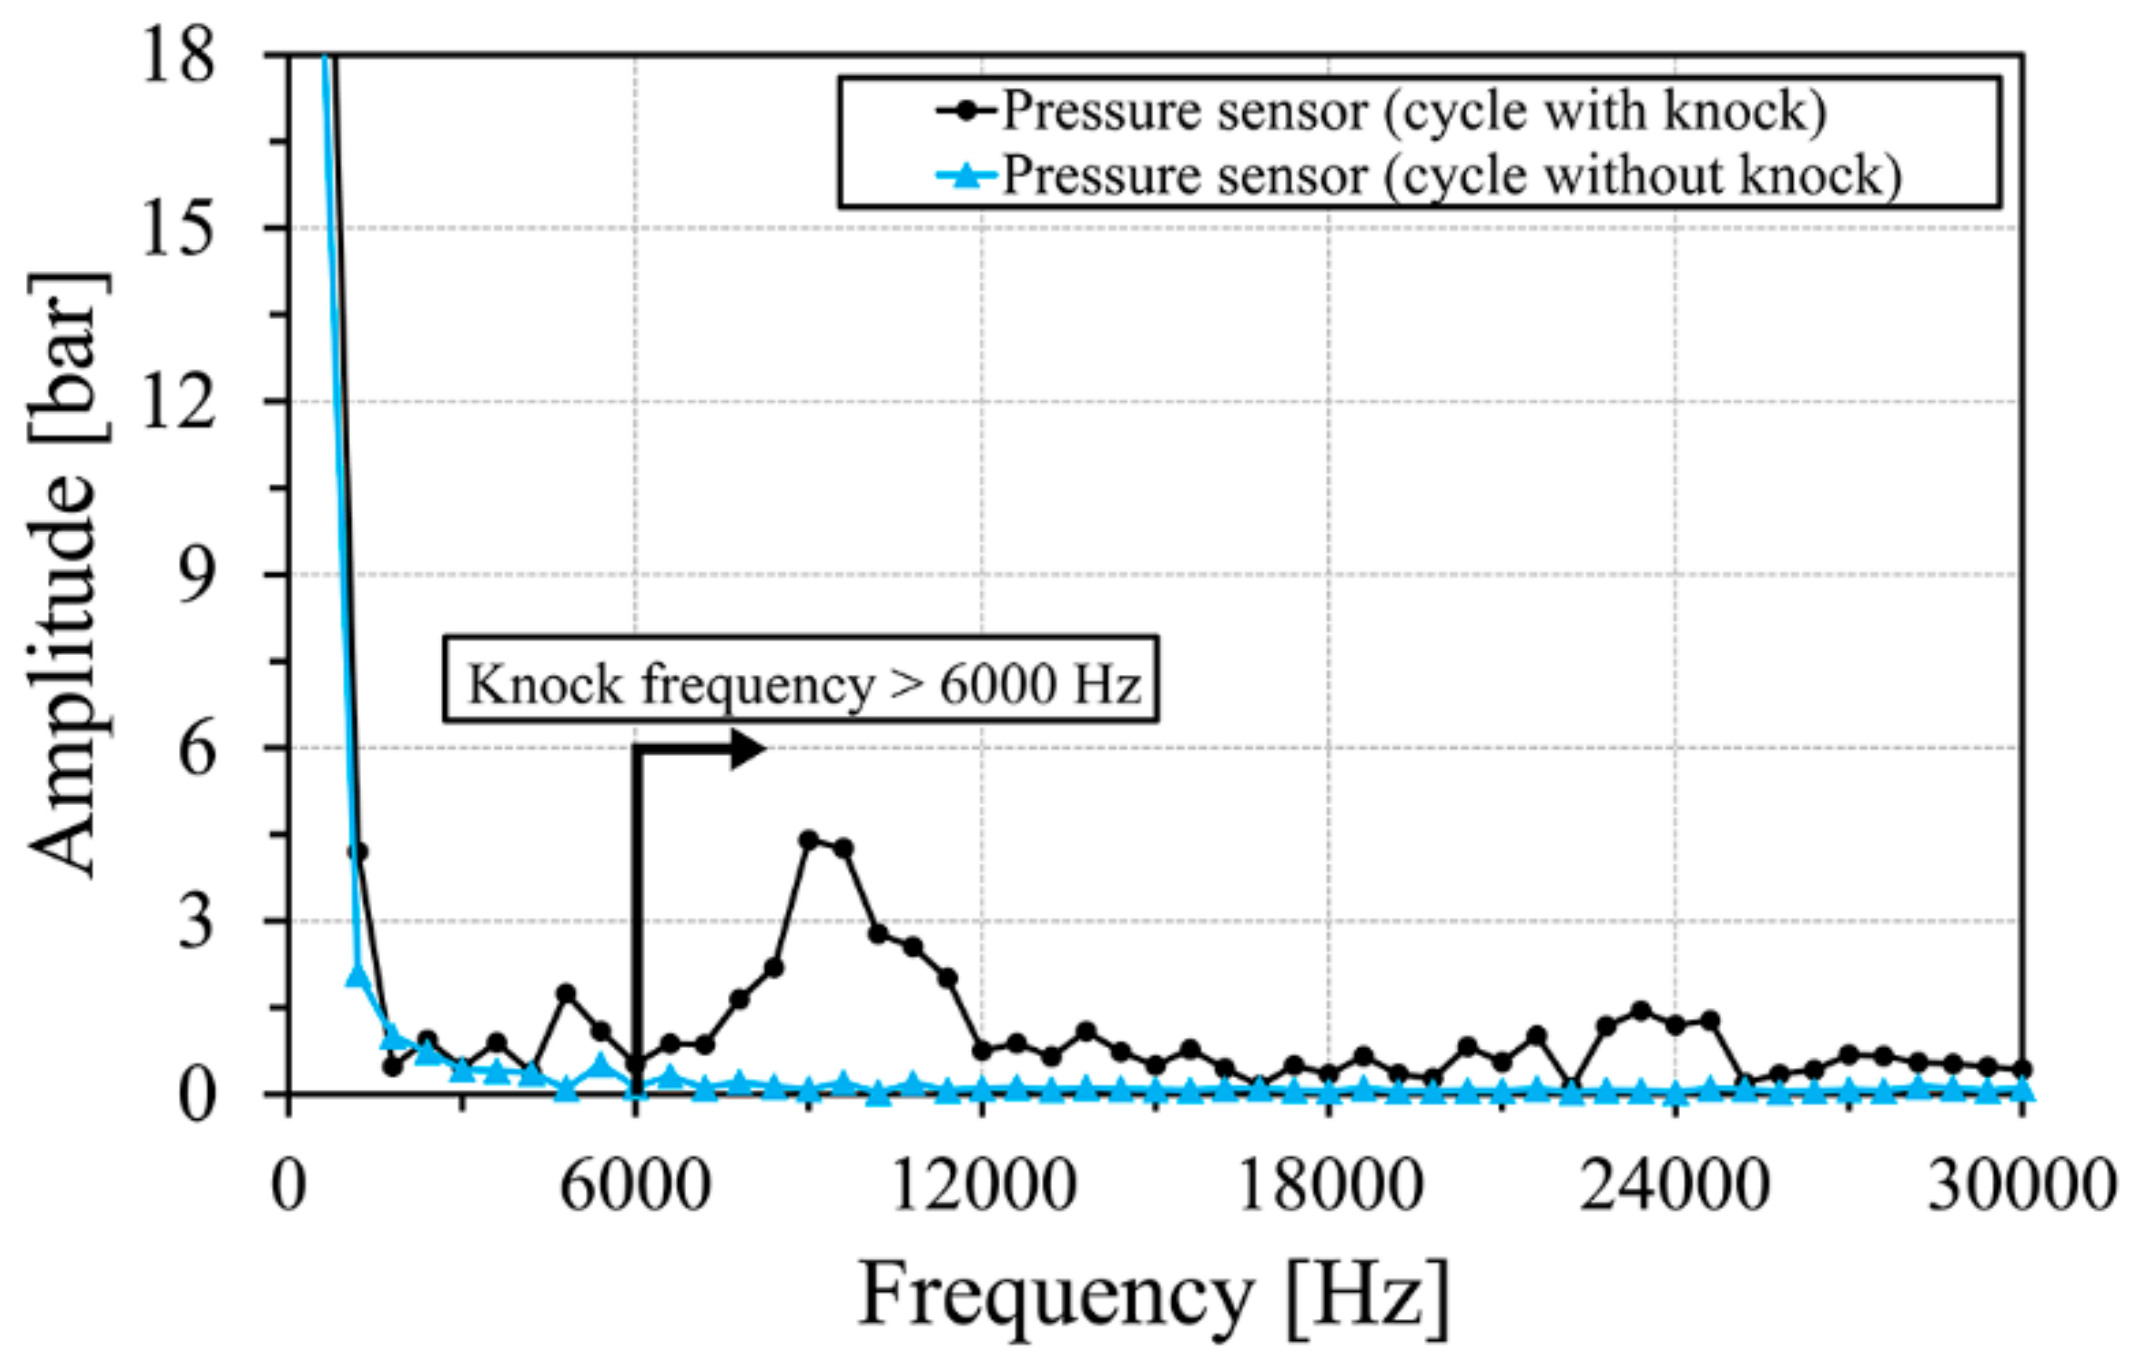
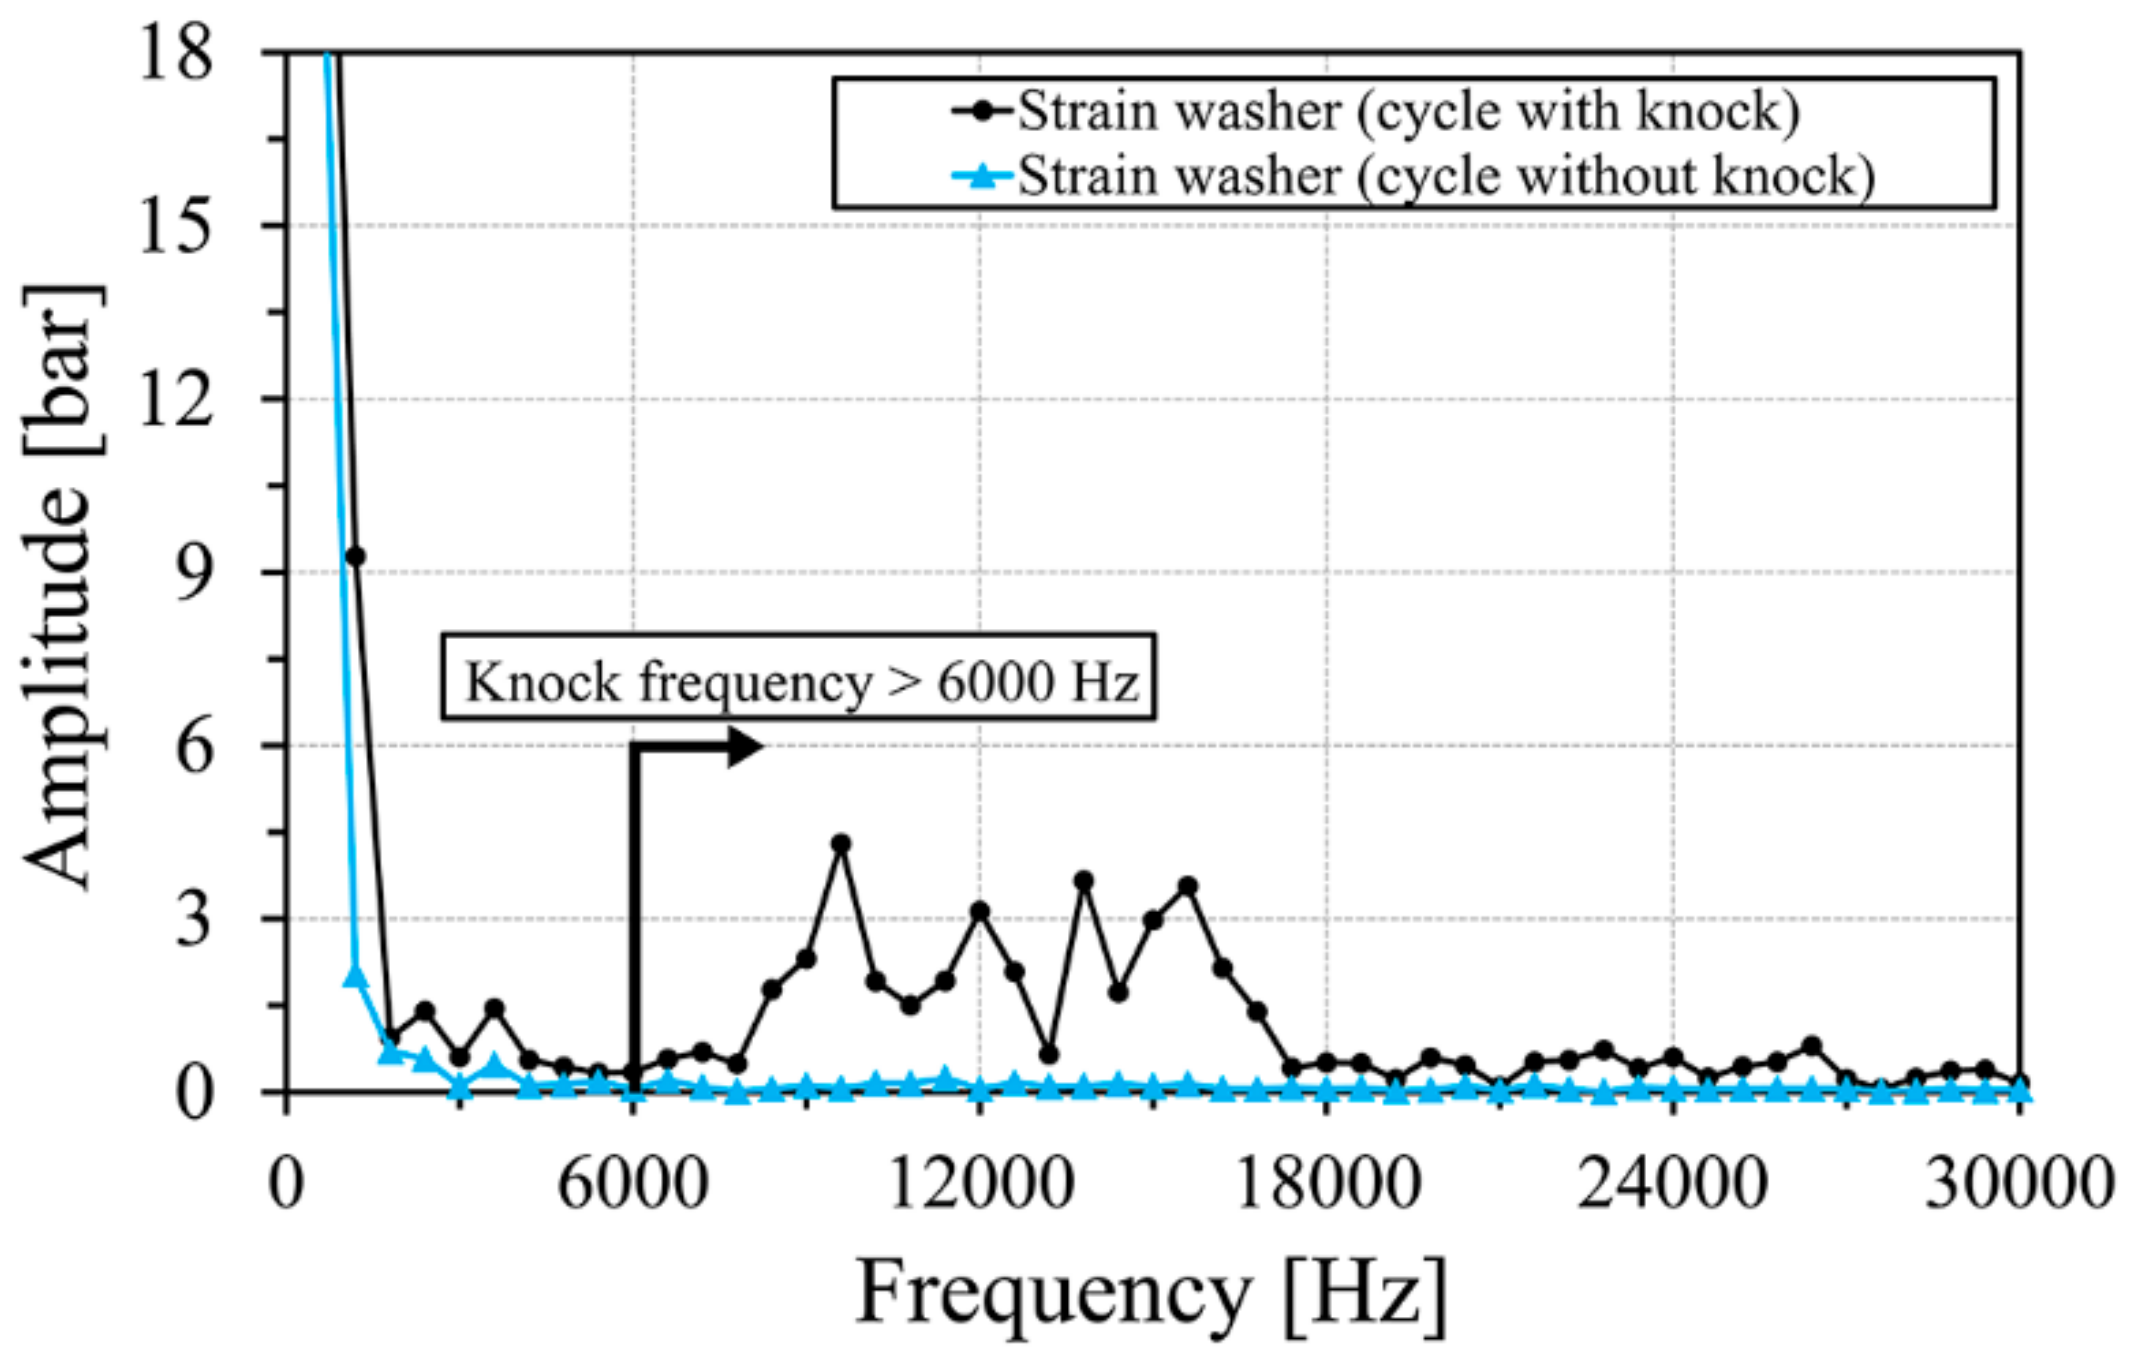
4.3. Knocking
5. Conclusions
- the existence of a linear correlation between the strain washer signal and the in-cylinder pressure was proved. The two tuning variables in the correlation were shown to be easily definable choosing reference points in proximity of the pressure peak. These results do represent the key potential of the present method, ensuring high robustness and applicability.
- the suitability of the use of the strain washer data to monitor the engine behavior was proved also in anomalous engine working conditions like misfiring, pre-ignition and knocking.
- in the case of single-cylinder, the accuracy in the prediction of IMEP was further improved by means of an additional correction of the method making use of a numerical 0D model in order to simulate the scavenging phase of the engine that falls in the uncertainty range of the sensor selected for the present activity.
Author Contributions
Conflicts of Interest
Nomenclature
| 4S | Four Stroke | - |
| 0D | 0 Dimensional | - |
| AFR | Air Fuel Ratio | - |
| ARMA | Autoregressive Moving Average | - |
| ATDC | After Top Dead Center | - |
| BDC | Before Dead Center | - |
| BTDC | Before Top Dead Center | - |
| CA | Crank Angle | - |
| Dr | Dynamic Range | [N] |
| EGR | Exhaust Gas Recirculation | - |
| EVC | Exhaust Valve Closing | - |
| EVO | Exhaust Valve Opening | - |
| FFT | Fast Fourier Transform | - |
| FRF | Frequency Response Function. | - |
| FTDC | Firing Top Dead Center | - |
| IA | Ignition Advance | - |
| IMEP | Indicated Mean Effective Pressure | - |
| IVO | Intake Valve Opening | - |
| MBF50 | 50% Mass Burned Fuel | - |
| Mr | Measuring Range | [N] |
| NN | Neural Network | - |
| RPM | Revolutions Per Minute | - |
| SI | Spark Ignition | - |
| PS | Pressure Sensor | - |
| PFI | Port fuel Injection | - |
| SW | Strain Washer | - |
Variables
| k | Slope | [N/bar] |
| q | y-intercept | [bar] |
| γ | Ratio of specific heat | - |
| V | Volume | [m3] |
| p | Pressure | [bar] |
| θ | Crankshaft angular position | [deg] |
| Qb | Released heat | [kJ] |
Subscripts
| i | Initial | - |
| f | Final | - |
References
- Puškár, M.; Kopas, M. System based on thermal control of the HCCI technology developed for reduction of the vehicle NOX emissions in order to fulfil the future standard Euro 7. Sci. Total Environ. 2018, 643, 674–680. [Google Scholar] [CrossRef] [PubMed]
- Carlucci, A.P.; Laforgia, D.; Motz, S.; Saracino, R.; Wenzel, S.P. Advanced closed loop combustion control of a LTC diesel engine based on in-cylinder pressure signals. Energy Convers. Manag. 2014, 77, 193–207. [Google Scholar] [CrossRef]
- Pestana, G. Engine Control Methods Using Combustion Pressure Feedback; SAE Technical Paper 890758; SAE: Warrendale, PA, US, 1989. [Google Scholar] [CrossRef]
- Wibberley, P.; Clark, C. An Investigation of Cylinder Pressure as Feedback for Control of Internal Combustion Engines; SAE Technical Paper 890396; SAE: Warrendale, PA, USA, 1989. [Google Scholar] [CrossRef]
- Giglio, V.; Iorio, B.; Police, G.; Rispoli, N. In-Cylinder Pressure Measurement for Control and Diagnostics in Spark Ignition Engines; SAE Technical Paper 2005-24-062; SAE: Warrendale, PA, USA, 2005. [Google Scholar] [CrossRef]
- Carlucci, A.; Benegiamo, M.; Camporeale, S.; Ingrosso, D. Improvement of the Control-Oriented Model for the Engine-Out NOX Estimation Based on In-Cylinder Pressure Measurement; SAE Technical Paper 2017-24-0130; SAE: Warrendale, PA, USA, 2017. [Google Scholar] [CrossRef]
- Olsson, J.; Tunestål, P.; Johansson, B. Closed-Loop Control of an HCCI Engine; SAE Technical Paper 2001-01-1031; SAE: Warrendale, PA, USA, 2001. [Google Scholar] [CrossRef]
- Kang, J.; Chang, C.; Chen, J.; Chang, M. Concept and Implementation of a Robust HCCI Engine Controller; SAE Technical Paper 2009-01-1131; SAE: Warrendale, PA, USA, 2009. [Google Scholar] [CrossRef]
- Aulin, H.; Bentioulis, P.; Tunestål, P.; Hyvönen, J.; Johansson, B. Improving Ion Current Feedback for HCCI Engine Control; SAE Technical Paper 2007-01-4053; SAE: Warrendale, PA, USA, 2007. [Google Scholar] [CrossRef]
- Herden, W.; Küsell, M. A New Combustion Pressure Sensor for Advanced Engine Management; SAE Technical Paper 940379; SAE: Warrendale, PA, USA, 1994. [Google Scholar] [CrossRef]
- Mobley, C. Non-Intrusive In-Cylinder Pressure Measurement of Internal Combustion Engines; SAE Technical Paper 1999-01-0544; SAE: Warrendale, PA, USA, 1999. [Google Scholar] [CrossRef]
- Zhang, H.; Du, L.; Shi, X. Reconstructing cylinder pressure from vibration signals based on radial basis function networks. Proc. Inst. Mech. Eng. D-J. Automob. Eng. 2001. [Google Scholar] [CrossRef]
- Gao, Y.; Randall, R.B. Reconstruction of diesel engine cylinder pressure using a time domain smoothing technique. Mech. Syst. Signal Process. 1999, 13, 709–722. [Google Scholar] [CrossRef]
- Sellnau, M.; Matekunas, F.; Battiston, P.; Chang, C.; Lancaster, D.R. Cylinder-Pressure-Based Engine Control Using Pressure-Ratio-Management and Low-Cost Non-Intrusive Cylinder Pressure Sensors; SAE Technical Paper 2000-01-0932; SAE: Warrendale, PA, USA, 2000. [Google Scholar] [CrossRef]
- Ausserer, J.; Rowton, A.; Grinstead, K.; Litke, P.; Polanka, M.D. Comparison of In-Cylinder Pressure Measurement Methods in a Small Spark Ignition Engine; SAE Technical Paper 2014-32-0007; SAE: Warrendale, PA, USA, 2014. [Google Scholar] [CrossRef]
- Roth, K.; Sobiesiak, A.; Robertson, L.; Yates, S. In-Cylinder Pressure Measurements with Optical Fiber and Piezoelectric Pressure Transducers; SAE Technical Paper 2002-01-0745; SAE: Warrendale, PA, USA, 2002. [Google Scholar] [CrossRef]
- Anderson, R. In-Cylinder Measurement of Combustion Characteristics Using Ionization Sensors; SAE Technical Paper 860485; SAE: Warrendale, PA, USA, 1986. [Google Scholar] [CrossRef]
- Jia, L.; Naber, J.; Blough, J.; Alireza Zekavat, S. Accelerometer-Based Combustion Metrics Reconstruction with Radial Basis Function Neural Network for a 9 L Diesel Engine. J. Eng. Gas Turb. Power-Trans. ASME 2014, 13. [Google Scholar] [CrossRef]
- Moro, D.; Cavina, N.; Ponti, P. In-cylinder Pressure Reconstruction Based on Instantaneous Engine Speed Signal. J. Eng. Gas Turbines Power 2001, 124, 220–225. [Google Scholar] [CrossRef]
- El-Ghamry, M.; Steel, J.; Reuben, R. Indirect measurement of cylinder pressure from diesel engines using acoustic emission. Mech. Syst. Signal Process. 2005, 19, 751–765. [Google Scholar] [CrossRef]
- Antoni, J.; Randall, R.; Guillet, F. Indirect Reconstruction of ICE pressure trace through structural vibration inverse filtering. In Proceedings of the International Congress and Exhibition on Noise Control Engineering, Nice, France, 27–30 August 2000. [Google Scholar]
- Fleming, W.J. New automotive sensors—A review. IEEE Sens. J. 2008, 8, 1900–1921. [Google Scholar] [CrossRef]
- Moskwa, J.; Bucheger, D. A new methodology for use in engine diagnostics and control, utilizing “synthetic” engine variables: Theoretical and experimental results. J. Dyn. Syst. 2001, 123, 528–534. [Google Scholar] [CrossRef]
- Bengtsson, F. Estimation of Indicated—And Load—Torque from Engine Speed Variations. Master’s Thesis, Linkoping University, Linköping, Sweden, 21 June 2006. [Google Scholar]
- Vignocchi, D. Elementi di Progettazione del Motore; Athena srl: Modena, Italy, 2002. [Google Scholar]
- Hamedovic, H.; Raichle, F.; Breuninger, J.; Fischer, W.; Dieterle, W.; Klenk, M. IMEP-Estimation and In-Cylinder Pressure Reconstruction for Multicylinder SI-Engine by Combined Processing of Engine Speed and One Cylinder Pressure. In Proceedings of the SAE World Congress & Exhibition, Detroit, MI, USA, 21–23 April 2015. [Google Scholar]
- Frelund, A.R. Engine Combustion Chamber Pressure Sensor. U.S. Patent 4,601,196, 22 July 1986. [Google Scholar]
- Sellnau, M. Combustion Pressure Sensor. U.S. Patent 4,969,352, 13 November 1990. [Google Scholar]
- Sellnau, M. Non-Intrusive Cylinder Pressure Sensor Having Improved Response Characteristics. U.S. Patent 5,367,904, 29 November 1994. [Google Scholar]
- Sawamoto, K. Combustion Pressure Sensor Arrangement. U.S. Patent 4,602,506, 29 July 1986. [Google Scholar]
- Romani, L.; Lenzi, G.; Ferrari, L.; Ferrara, G. Indirect Estimation of In-Cylinder Pressure through the Stress Analysis of an Engine Stud; SAE Technical Paper 2016-01-0814; SAE: Warrendale, PA, USA, 2016. [Google Scholar] [CrossRef]
- Romani, L.; Vichi, G.; Ferrara, G.; Balduzzi, F.; Trassi, P.; Fiaschi, J.; Tozzi, F. Development of a Low Pressure Direct Injection System for a Small 2S Engine. Part II—Experimental Analysis of the Engine Performance and Pollutant Emissions; SAE Technical Paper 2015-01-1730; SAE: Warrendale, PA, USA, 2015. [Google Scholar] [CrossRef]
- Heywood, J.B. The Two-Stroke Cycle Engine; SAE International: Warrendale, PA, USA, 1989. [Google Scholar]
- Romani, L.; Vichi, G.; Bianchini, A.; Ferrari, L.; Ferrara, G. Optimization of the Performance of a Formula SAE Engine by means of a Wastegate Valve Electronically Actuated. Energy Procedia 2016, 101, 654–661. [Google Scholar] [CrossRef]
- Heywood, J.B. Internal Combustion Engine Foundamentals; McGraw-Hill: New York, NY, USA, 1988. [Google Scholar]
- Hadelmovic, H. IMEP-Estimation and In-Cylinder Pressure Reconstruction; SAE International: Warrendale, PA, USA, 2005. [Google Scholar]
- Horner, T. Knock Detection Using Spectral Analysis Techniques on a Texas Instruments TMS320 DSP; SAE Technical Paper 960614; SAE: Warrendale, PA, USA, 1996. [Google Scholar] [CrossRef]
- Wang, Z.; Liu, H.; Rolf, D.R. Knocking combustion in spark-ignition engines. Prog. Energy Combust. Sci. 2017, 61, 78–112. [Google Scholar] [CrossRef]


| Engine type | Gasoline PFI turbocharged |
| Strokes for cycle | 4 |
| Number of cylinders | 1 |
| Displaced volume | 520 cc |
| Stroke | 63.4 mm |
| Bore | 101.98 mm |
| Compression ratio | 9.02:1 |
| Number of valves | 4 |
| Turbocharger | Single-stage turbine with WG |
| Sensitivity | 123.6 mV/kN |
| Measurement range | 44.48 kN |
| Low frequency response | 0.0003 Hz |
| Upper frequency limit | 60 kHz |
| Uncertainty | ±1% FS (±450 N) |
| Minimum preload | 8.896 kN |
| Temperature range | −54 to +121 °C |
| Sensitivity (T 250 °C) | 16.1 pC/bar |
| Measurement range | 150 bar |
| Uncertainty | ±0.13% FSO |
| Diameter | 5 mm |
© 2018 by the authors. Licensee MDPI, Basel, Switzerland. This article is an open access article distributed under the terms and conditions of the Creative Commons Attribution (CC BY) license (http://creativecommons.org/licenses/by/4.0/).
Share and Cite
Romani, L.; Bianchini, A.; Vichi, G.; Bellissima, A.; Ferrara, G. Experimental Assessment of a Methodology for the Indirect in-Cylinder Pressure Evaluation in Four-Stroke Internal Combustion Engines. Energies 2018, 11, 1982. https://doi.org/10.3390/en11081982
Romani L, Bianchini A, Vichi G, Bellissima A, Ferrara G. Experimental Assessment of a Methodology for the Indirect in-Cylinder Pressure Evaluation in Four-Stroke Internal Combustion Engines. Energies. 2018; 11(8):1982. https://doi.org/10.3390/en11081982
Chicago/Turabian StyleRomani, Luca, Alessandro Bianchini, Giovanni Vichi, Alessandro Bellissima, and Giovanni Ferrara. 2018. "Experimental Assessment of a Methodology for the Indirect in-Cylinder Pressure Evaluation in Four-Stroke Internal Combustion Engines" Energies 11, no. 8: 1982. https://doi.org/10.3390/en11081982
APA StyleRomani, L., Bianchini, A., Vichi, G., Bellissima, A., & Ferrara, G. (2018). Experimental Assessment of a Methodology for the Indirect in-Cylinder Pressure Evaluation in Four-Stroke Internal Combustion Engines. Energies, 11(8), 1982. https://doi.org/10.3390/en11081982