Article

Experimental Research on Hydraulic Collecting Spherical Particles in Deep Sea Mining

1
State Key Laboratory of Ocean Engineering, Shanghai Jiao Tong University, Shanghai 200240, China
2
Collaborative Innovation Center for Advanced Ship and Deep-Sea Exploration, Shanghai 200240, China
*
Author to whom correspondence should be addressed.
Energies 2018, 11(8), 1938; https://doi.org/10.3390/en11081938
Submission received: 28 June 2018 / Revised: 16 July 2018 / Accepted: 16 July 2018 / Published: 25 July 2018

Abstract

:
Hydraulic collecting is the key technology in deep sea mining and dredging engineering. It determines economic benefits of the project and environmental issues. However, mechanistic studies of hydraulic collecting are rarely described. In this study, the mechanism of collecting spherical particles is researched by dimensional analysis and experimental study. The experimental system is established to carry out three kinds of tests including 253 different test cases. The empirical model of collecting performance prediction is established by the tests of vertical force characteristics and vertical incipient motion characteristics of particles in suction flow field. The results show that the vertical suction force coefficient (Cvs) decreases exponentially with the ratio of bottom clearance to diameter of the particle (h/d), increases linearly with the ratio of diameter of the suction pipe to diameter of the particle (D/d), and is nearly independent of Reynolds number (Re). The empirical formula of vertical force and criterion-formula of vertical incipient motion of particles are obtained with the maximum tolerance less than 15%. The phenomenon that the vortex could help strengthen the suction force was observed in the tests. In addition, the characteristics of suction flow field were obtained by flow visualization tests, and applied to explain the force characteristics of particles in the suction flow field.

1. Introduction

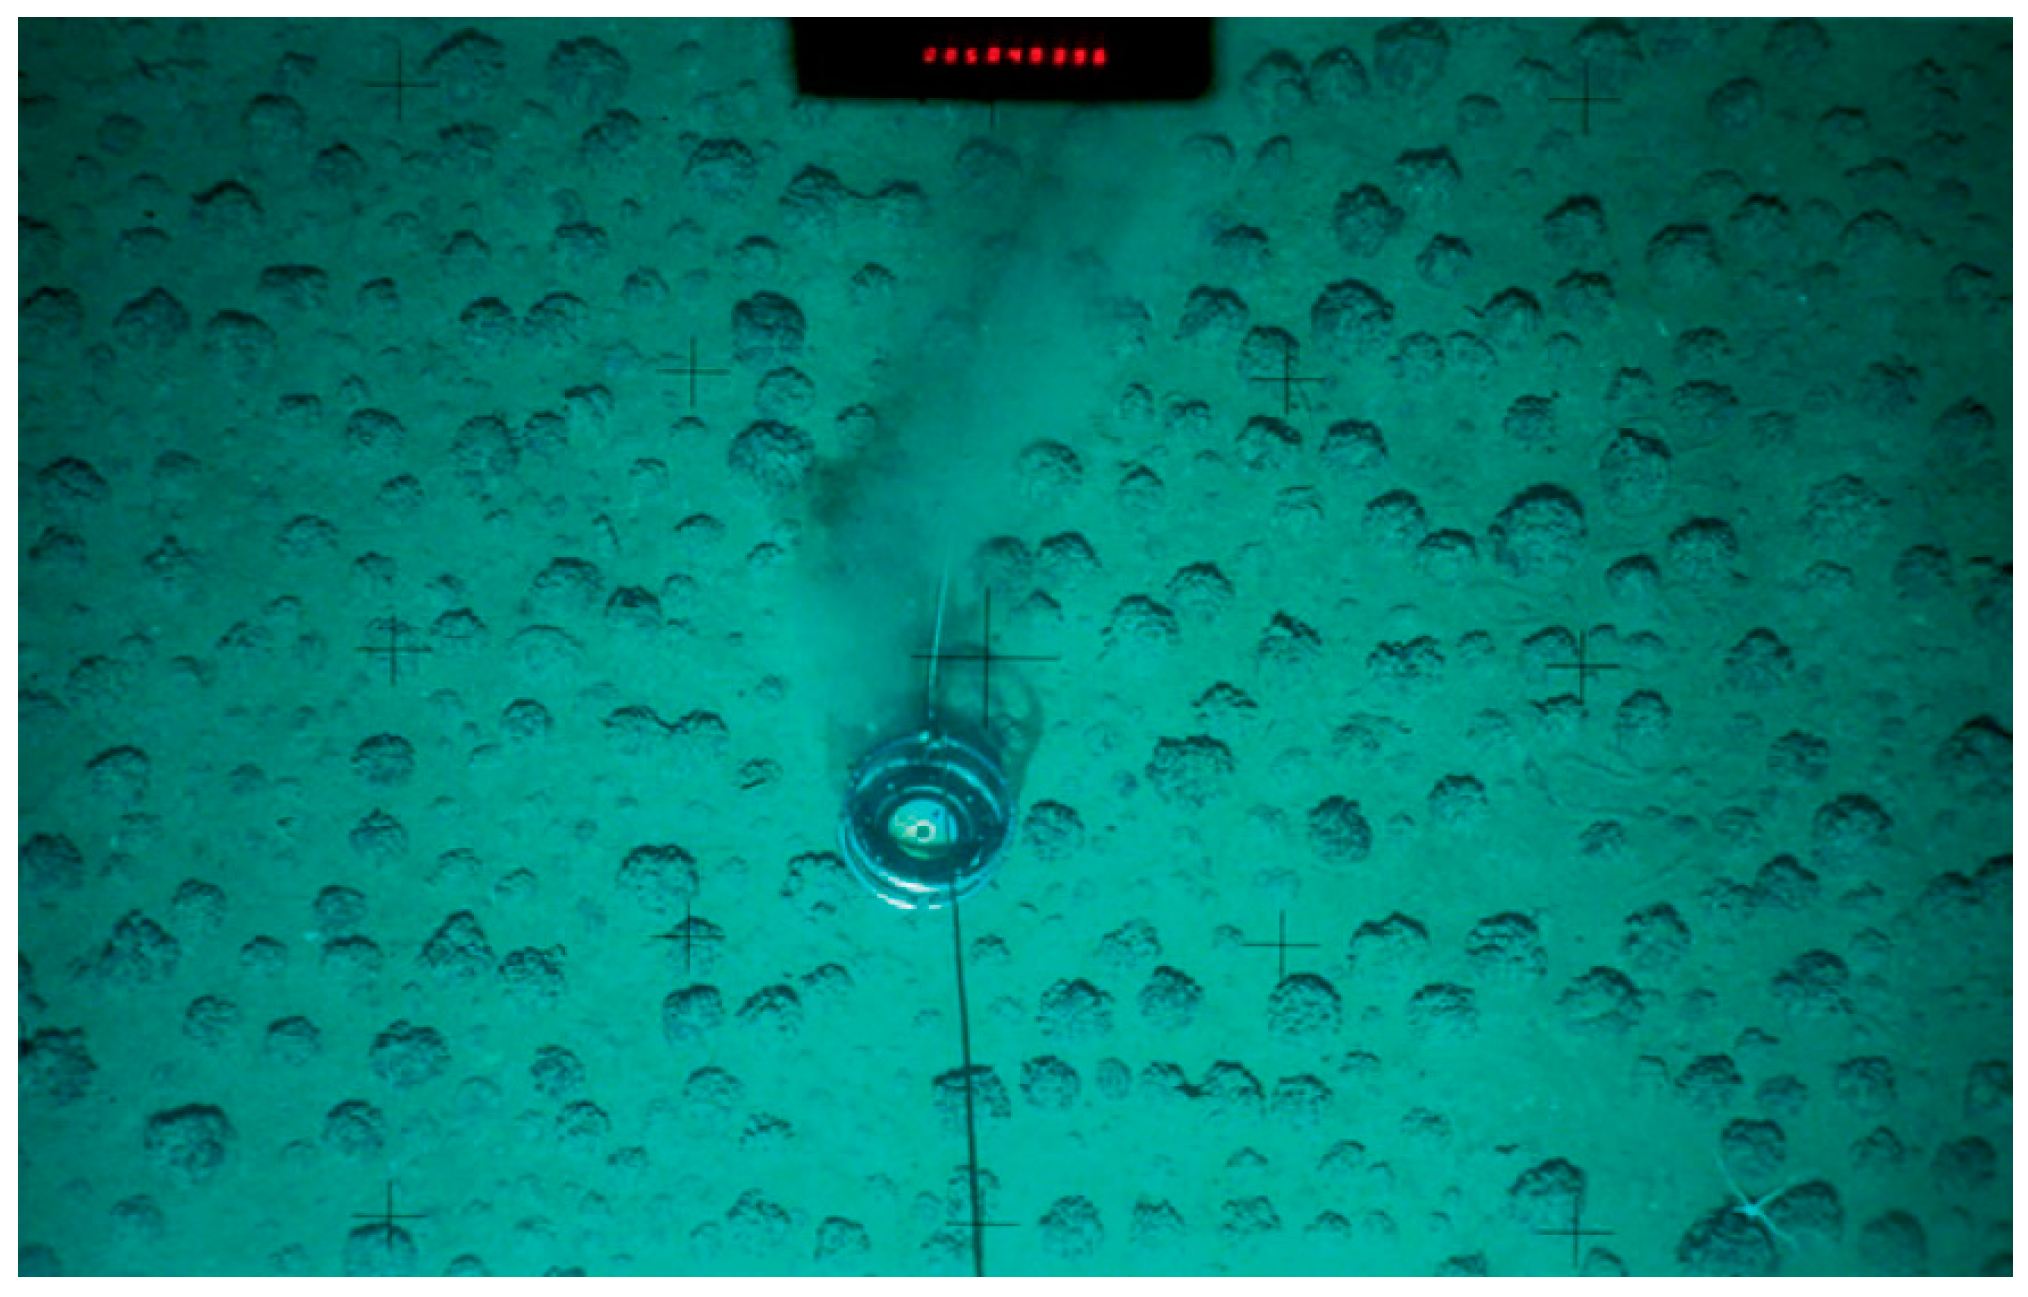
Enormous mineral resources are deposited in the international seabed, of which polymetallic nodules have attracted more and more attention around the world for their high economic value and easy prospecting. With increasing demand for various mineral resources and gradual exhaustion of land resources in modern society and industry, research and development of seabed mineral resources is becoming increasingly urgent [1]. Therefore, deep sea mining is thought to be a key approach to the sustainable development of human beings and many countries around the world are stepping up exploration and exploitation of seabed mineral resources [2,
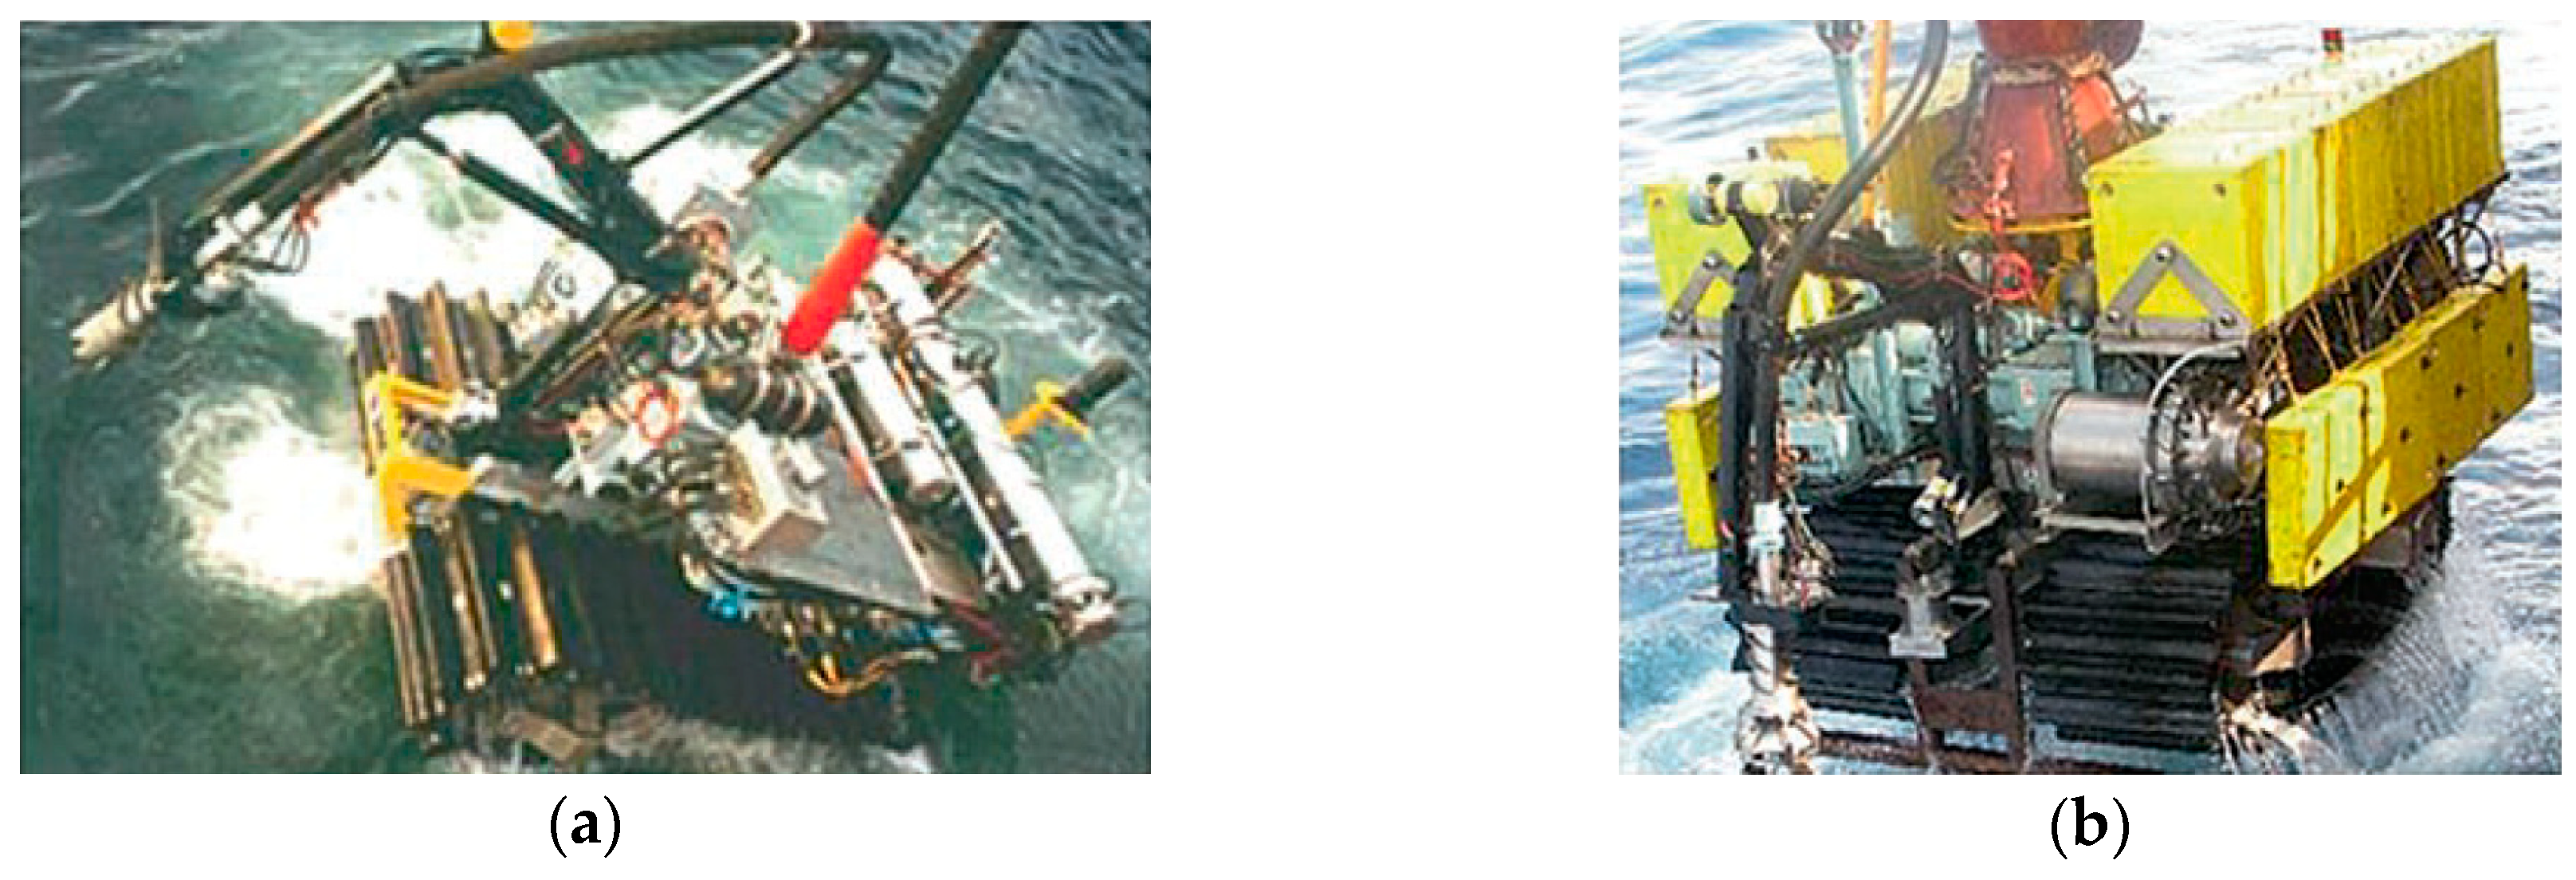
3]. Most of the deep sea mining technologies and systems for exploration, recovery and processing were originally been done in the 1970s. Four subsystems are usually included in deep sea mining systems: surface systems, pipe systems, buffer systems and collector systems [4]. Chung [5,6] presented a brief summary of the developments in mining systems and technologies in the past years, and pointed out that the mobility, safety, collection efficiency and sweep efficiency of the collector system are the most important parameters in deep sea mining system design. The collecting part in the miner system is also considered as the key technology, because commercial production must achieve high sweep efficiency [7], and profitable deep sea mining exploitation is only feasible on the premise that there is a nodule collector with maximum collecting capacity of 140 kg of wet nodules per second [8]. Except for the high collecting efficiency, eco-friendly mining processes are also in demand because deep sea mining could be a new environmental challenge related to ocean biology [9,
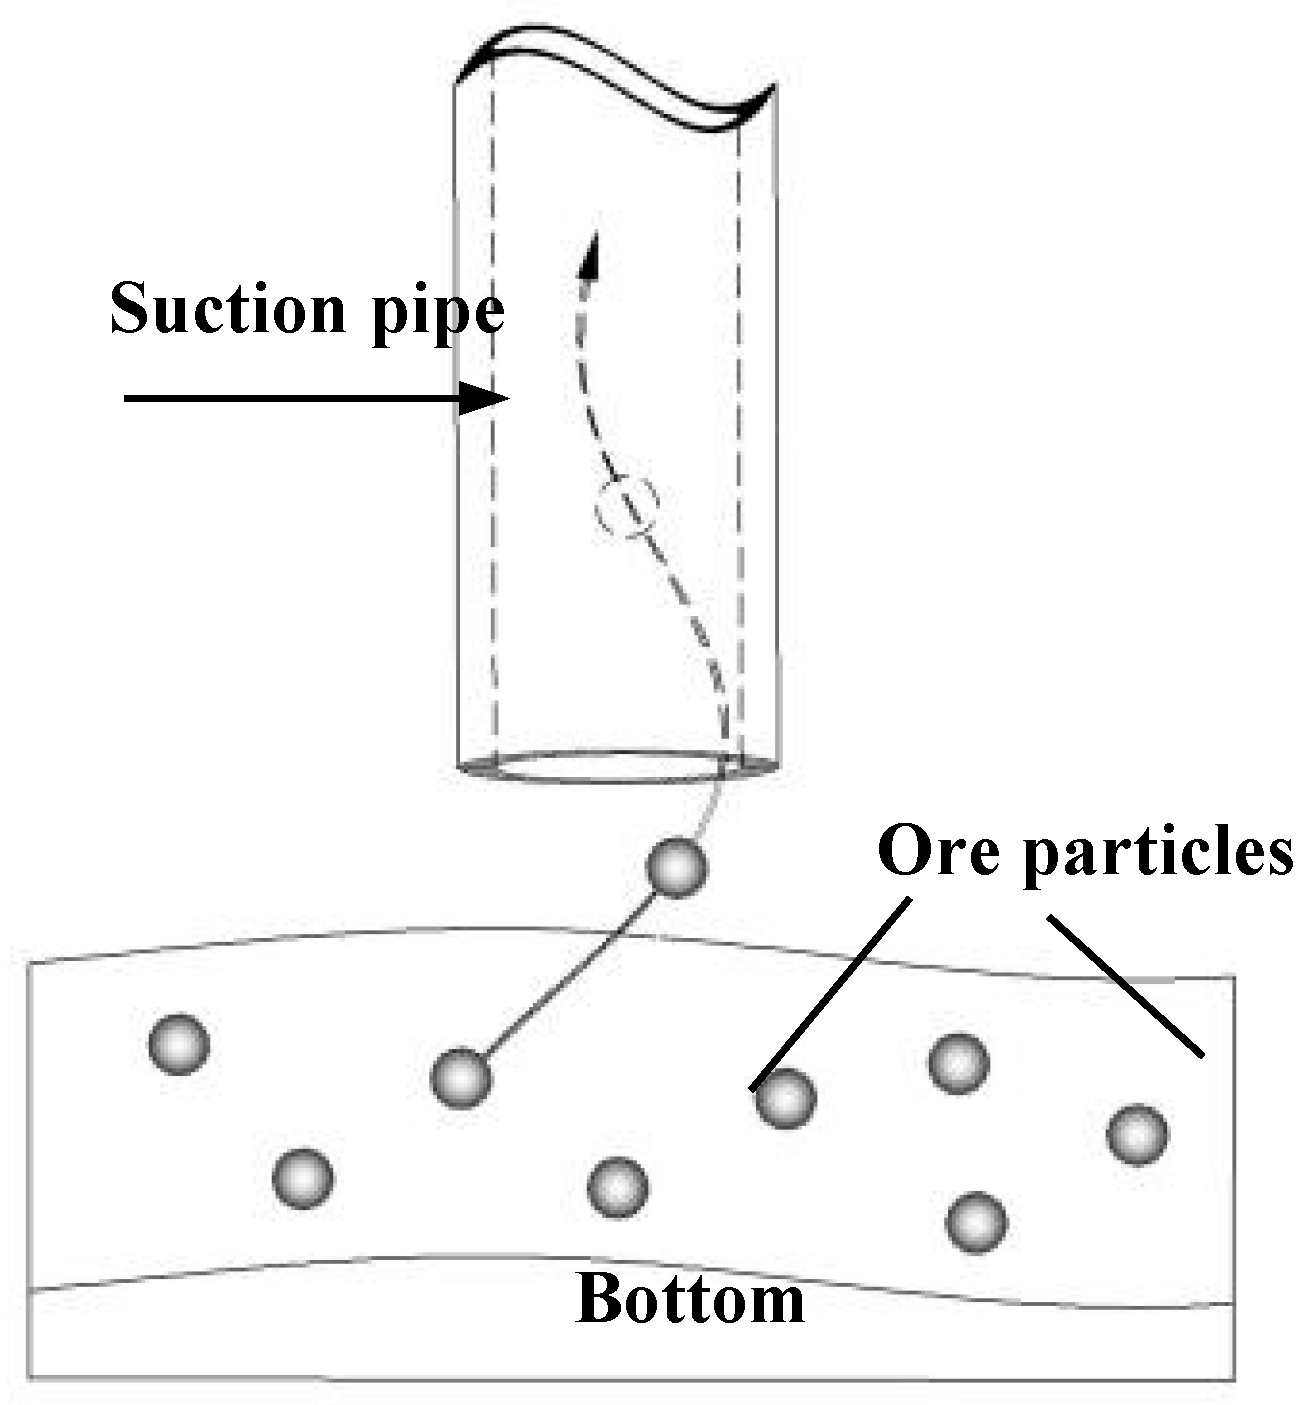
10]. To pick up nodules, a variety of collecting methods such as hydraulic methods, mechanical methods and hybrid collection methods have been developed. Ocean Management Incorporated (OMI’s) sea trial results in 1978 showed that the hydraulic method has higher collection efficiency than the mechanical method [11]. Therefore, the problem of hydraulic collecting will be studied in this paper.
The mechanism of hydraulic collecting is fairly complicated because the collecting efficiency is influenced by a lot of factors such as particle size, bottom clearance, collector structure and flow rate. Several studies have been conducted to examine the process of hydraulic collecting. Hong et al. [12] dealt with experimental approaches for enhanced understanding of the hydraulic performance of a hybrid pick-up device. The experiments were conducted in a 2-D flume tank. By parametric experiments they found position and shape of baffle plates are significant factors for effective design of hydraulic nodule lifter. Yang et al. [13] discussed major parameters and their influences on the performance of the pick-up device by tests. The results showed that the hydraulic pick-up device with proper dimensions and parameters could get high pick-up rate and low content sediments. Tsutsui [14] had an experimental study of the flow field and the aerodynamic force on a sphere above a plane. The surface pressures on the sphere and the plane were measured by inclined multi-pipe manometers and the results were compared with photographs showing the flow visualization of the sphere. Lim et al. [15] analyzed flow field characteristics with outflow discharge from a collecting device in deep ocean by using software FLUENT. The study revealed seawater velocity and streamline distributions along with complicated flow characteristics downstream including nodule particles behavior. Zhao et al. [16] carried out studies of hydraulic collection of single spherical particle at various collecting bottom clearances and flow rates by both experiments and numerical simulations. It was verified that the vertical force prediction is feasible for single ore particle in collecting condition based on numerical simulation. The study revealed that the variation of the wake vortex is the dominant factor of force vibration.
The problems of hydraulic lifting have been studied, which could be helpful to understand the process of hydraulic collecting. Chung et al. [17] conducted experimental investigations to study the shape effect of solids on pressure drop in a 2-phase vertically upward transport. Sobota et al. [18] had an experimental study on nodule and water velocities at upward flow in a pipeline of D = 150 mm. The slip velocity values of 10-, 30- and 50-mm-dimeter nodules at the volume concentration 10% were measured. The results illustrated that the slip velocity values are of the same order as the fall velocity of these solids. Jiang et al. [19] had an investigation into the concentration characteristics of large size particles in vertical pipes for hydraulic lifting. Particles of different diameters (5–30 mm) were used for experimental studies. A formula for the radial distribution of particle concentration was developed and validated. Jiang et al. [20] did the experiments on single particle settling velocity in the static fluid, floating velocity for a single particle and critical velocity in a vertical hydraulic lifting system. They had found that the larger the size and concentration of particles were, the more possibly the particles moved to the pipe wall. Yang et al. [21] analyzed the influence of factors such as particle concentration, diameter, gradation and boundary conditions on single and group suspension velocity by doing numerous experiments. A relation between particle group and single particle suspension velocity ratio and volumetric concentration was given. Behavior of single particle in vertical lifting pipe is the foundation of the group particles in vertical lifting pipe. In addition, the studies of deep sea air-lift have been researched. Fan et al. [22] investigated the performance of an air-lift pump for artificial upwelling of deep water theoretically and experimentally with a vertical pipe of 0.4 m diameter and 28.3 m height. An empirical model of the air-lift artificial upwelling is presented. The performance of the model has been confirmed by the experimental findings. Pougatch et al. [23] presented a numerical model of the three-phase flow in the upward air-lift pipe. And the influence of the pipe diameter on the lifting efficiency has been investigated numerically. Ma et al. [24] assessed the technological feasibility and profitability analyses in terms of solid production rate, energy consumption per tonnage of mineral, and profitability per tonnage of mineral. The effects of submergence ratio, pipe diameter, particle diameter, mining depth, and gas flux rate are investigated.
The research of flow around a sphere is the foundation of study on hydraulic collecting. Achenbach [25] had experiments on the flow past spheres in the Reynolds number range 5 × 10⁴Re ≤ 6 × 10⁴. He compared his results with other available data and pointed out the dependence of friction forces on Reynolds number. Johnson and Patel [26] investigated the flow of an incompressible viscous fluid past a sphere at different Reynolds numbers by Detached Eddy Simulation (DES). Constantinescu and Squires [27] applied Large Eddy Simulation (LES) and DES to investigate the flow around a sphere at a Reynolds number of 10,000 in the subcritical regime.
Collecting efficiency and environmental issues from the collecting process are the biggest challenges for deep sea mining. Therefore, providing sufficient suction force and avoiding unnecessary disturbance by predicting the performance of collecting accurately is very important. In view of the previous studies including experiments and numerical simulations, however, there are few studies treated the mechanism study of hydraulic collecting and the research of collecting performance prediction.
In this study, mechanism of hydraulic collecting is researched by dimensional analysis and experiments. The characteristics of vertical force, vertical incipient motion and wake flow of spherical particles in suction flow field have been investigated. The empirical formula of vertical force of particles is obtained from measurements and further verified by the vertical incipient motion tests. Furthermore, the criterion-formula of vertical incipient motion of particles is derived to predict the collecting performance. The characteristics of flow field were observed by flow visualization tests. The results of this study will serve to further understand the hydrodynamic characteristics of the hydraulic collecting in deep sea mining and provide reference for the design of the deep sea miner collector.

2. Mechanism of Hydraulic Collecting

Firstly, the simplified models of manganese nodules and hydraulic collecting are founded. Then the method of dimensional analysis is used to study the mechanism of hydraulic collecting and instruct the design of the test program. At last, the empirical formula of vertical force and criterion-formula of vertical incipient motion of particles are derived to predict the hydraulic collecting performance.

2.1. Model of Manganese Nodules

Manganese nodules occur as potato-shaped concretions on the seafloor of abyssal plains in about 4000–6000 m water depth in all major oceans. They form two-dimensional deposits on the surface or within the first 10 cm of the deep-sea sediments (Figure 1).
Nodules in the eastern tropical Pacific and the central Indian Ocean are of special economic interest due to their high enrichment of metals such as Ni, Cu, Co, Mo, Li, rare earth elements (REEs), and Ga [28]. The dry bulk density of nodules ranges between 1.00 and 2.40 g/cm3 [29,30]. They can have different sizes, shapes, and surface textures and can reach a size of up to 15 cm in diameter (general range from 2 cm to 10 cm). Some extremely large specimens of 21 cm have been found in the Peru Basin [31]. Moritani [32] did a study about the description and classification of manganese nodules. It is found that nodule occurrence is generally confined to the sediment-water interface of the sea bottom, in which nodules are buried in the sediments in different degrees. The relative position of occurrence seems to result in difference in surface texture, namely rough texture on the buried parts and smooth ones on the exposed parts. And the most common shapes of nodules are either ideal individual forms of spheroidal, ellipsoidal, discoidal, etc. or polylobate or intergrown aggregate form.
In terms of the studies, the assumptions are made to simplify the physical problems in this study:
(1)
The shape of particles is spheroidal as a common shape of nodules.
(2)
The surface texture of particles is smooth because the roughness of the exposed parts of nodules is usually small.
(3)
The particles are on a flat surface because some parts of the mining area are flat and they are usually where we start deep sea mining; in addition, the sediments near the particles are so soft that the particles are always rolling out from sediments before being lifted by the collecting pipe.
(4)
No deposit sediments surround particles because sediments contents are very low in the process of hydraulic collecting in engineering test.

2.2. Model of a Kind of Hydraulic Collecting

An underwater mining system was developed for operations and the flexible riser concept was validated in the Indian seas at 410 m water depth in 2000 jointly by National Institute of Ocean Technology (NIOT) and Institut für Konstruktion (IKS) of the University of Siegen (Germany). The underwater mining systems are shown in Figure 2 [33]. The collecting principle of these underwater mining systems is to suck the particles through a suction pipe. The suction flow field was formed near the bottom of suction pipe when water pump was running. The particles are lifted and sucked into the pipe by vertical suction force induced by pressure difference near the particles.
According to the collecting principle of these underwater mining systems, the physical model in this study is simplified as Figure 3.
The main parameters are given in Figure 4, which represent various cases and determine the characteristics of flow field. The main parameters in relation with the vertical force of the particle in this study are listed in Table 1.
The vertical suction force of the particle is similar to the drag force because both of them are induced by the pressure difference near the sphere or the velocity slippage between liquids and solids. The differences between them are: (1) different definitions, a fluid flowing past the particle exerts a force on it, the vertical force is the component of this force that is normal to ground (parallel to the gravity direction) while the drag force is the in-line component of the force parallel to the flow direction; (2) the drag force is usually defined in an oncoming flow with one direction while the vertical force is defined in the suction flow field which is clearly different with an oncoming flow. In this research, the flow velocity in pipe is used for 2 reasons: (1) the average velocity in pipe is stable along the whole pipe; (2) the flow velocity in pipe is one of the key parameters for engineering application because we could change the vertical force on particles by changing pump flow (the average velocity in pipe) to ensure collection efficiency in different cases.

2.3. Dimensional Analysis

2.3.1. Vertical Force F of Particles in Suction Flow Field

To indicate the vertical force of particles in suction flow field, vertical suction force coefficient Cvs is introduced. And the characteristics of flow field can be described by Reynolds number Re. Because of the complexity of the suction flow field, it is difficult to define Re and Cvs by using normal definition. In this study, the definition of Re and Cvs is proposed to be based on the flow velocity v in the collecting pipe as characteristic velocity.
The vertical force F of the particle fixed on the bottom boundary depends on the fluid density of water ρw, the viscosity coefficient of water μ, the velocity of the flow in pipe v, the diameter of the particle d, the diameter of the suction pipe D and bottom clearance h. As a result, the function of F is defined as:
F = f ( ρ w , μ , v , D , d , h )
The dimensions of these parameters are as follows:
FρwμvdDh
MLT−2ML−3ML−1T−1LT−1LLL
Therefore, we can get three basic dimensions of this problem with L, M and T, and then the theorem of dimensional analysis is used to obtain:
Π 1 = F ρ w v 2 d 2
Because d2 of the spherical particle section has area dimension, the cross-section area A of the sphere is used instead:
Π 1 , modified = F 1 2 ρ w v 2 A = C v s
If the viscosity coefficient of fluid μ is used as dependent variable, then it can be achieved:
Π 2 = μ ρ w v d
It can be derived by formula transformation:
Π 2 , modified = ρ w v d μ = Re
It is important to emphasize that the velocity v used in the Re definition is the flow velocity in the suction pipe, rather than the velocity around the particle.
In the same way, we can get the dimensionless variables:
Π 3 = D d
Π 4 = h d
The final dimensional relationships can be obtained:
Π 1 , modified = f ( Π 2 , modified , Π 3 , Π 4 )
The vertical suction force coefficient is following:
C v s = F 1 2 ρ w v 2 A = f ( Re , D d , h d )
It is found that the vertical suction force coefficient Cvs could be related to the Reynolds number Re, D/d, and h/d.

2.3.2. Critical Bottom Clearance h for the Vertical Incipient Motion of Particles

According to the force balance analysis of the particle, we compare the theoretical wet weight mg-Fbuoy of spherical particle to the vertical force calculated by Cvs. Therefore, the relationship between Cvs and Froude number Fr should be studied.
Based on the force analysis of the particles, the vertical incipient motion condition is as follows:
F + F b u o y = m g
Using the functions of vertical force and volume of spherical particle:
F = 1 2 ρ w A v 2 × C v s = 1 8 π ρ w C v s v 2 d 2
m g F b u o y = 4 3 g ( ρ ρ w ) π r 3 = 1 6 g ( ρ ρ w ) π d 3
The following function can be obtained from Equation (10):
C v s = 4 3 ρ ρ w ρ w g d v 2
In terms of the definition of the Froude number Fr:
F r = v g d v 2 g d
The relationship between Cvs and Fr could be obtained:
C v s = 4 3 ρ ρ w ρ w 1 F r 2
In consequence, if the vertical suction force coefficient determined by D/d and h/d is greater than the vertical suction force coefficient calculated by Fr, the particles will be lifted. Therefore, the criterion-formula is established to predict the vertical incipient motion of particles.

3. Experimental Description

In order to investigate the characteristics of ore particles in the suction flow field, the test system has been designed and constructed in the laboratory and three kinds of experiments are carried out: (1) vertical force tests: to measure the vertical force of particles in various cases; (2) vertical incipient motion tests: to measure the critical bottom clearances of particles and further validate the accuracy of the vertical force tests; (3) flow visualization tests: to observe the characteristics of flow field around the particle.

3.1. Test Set Up

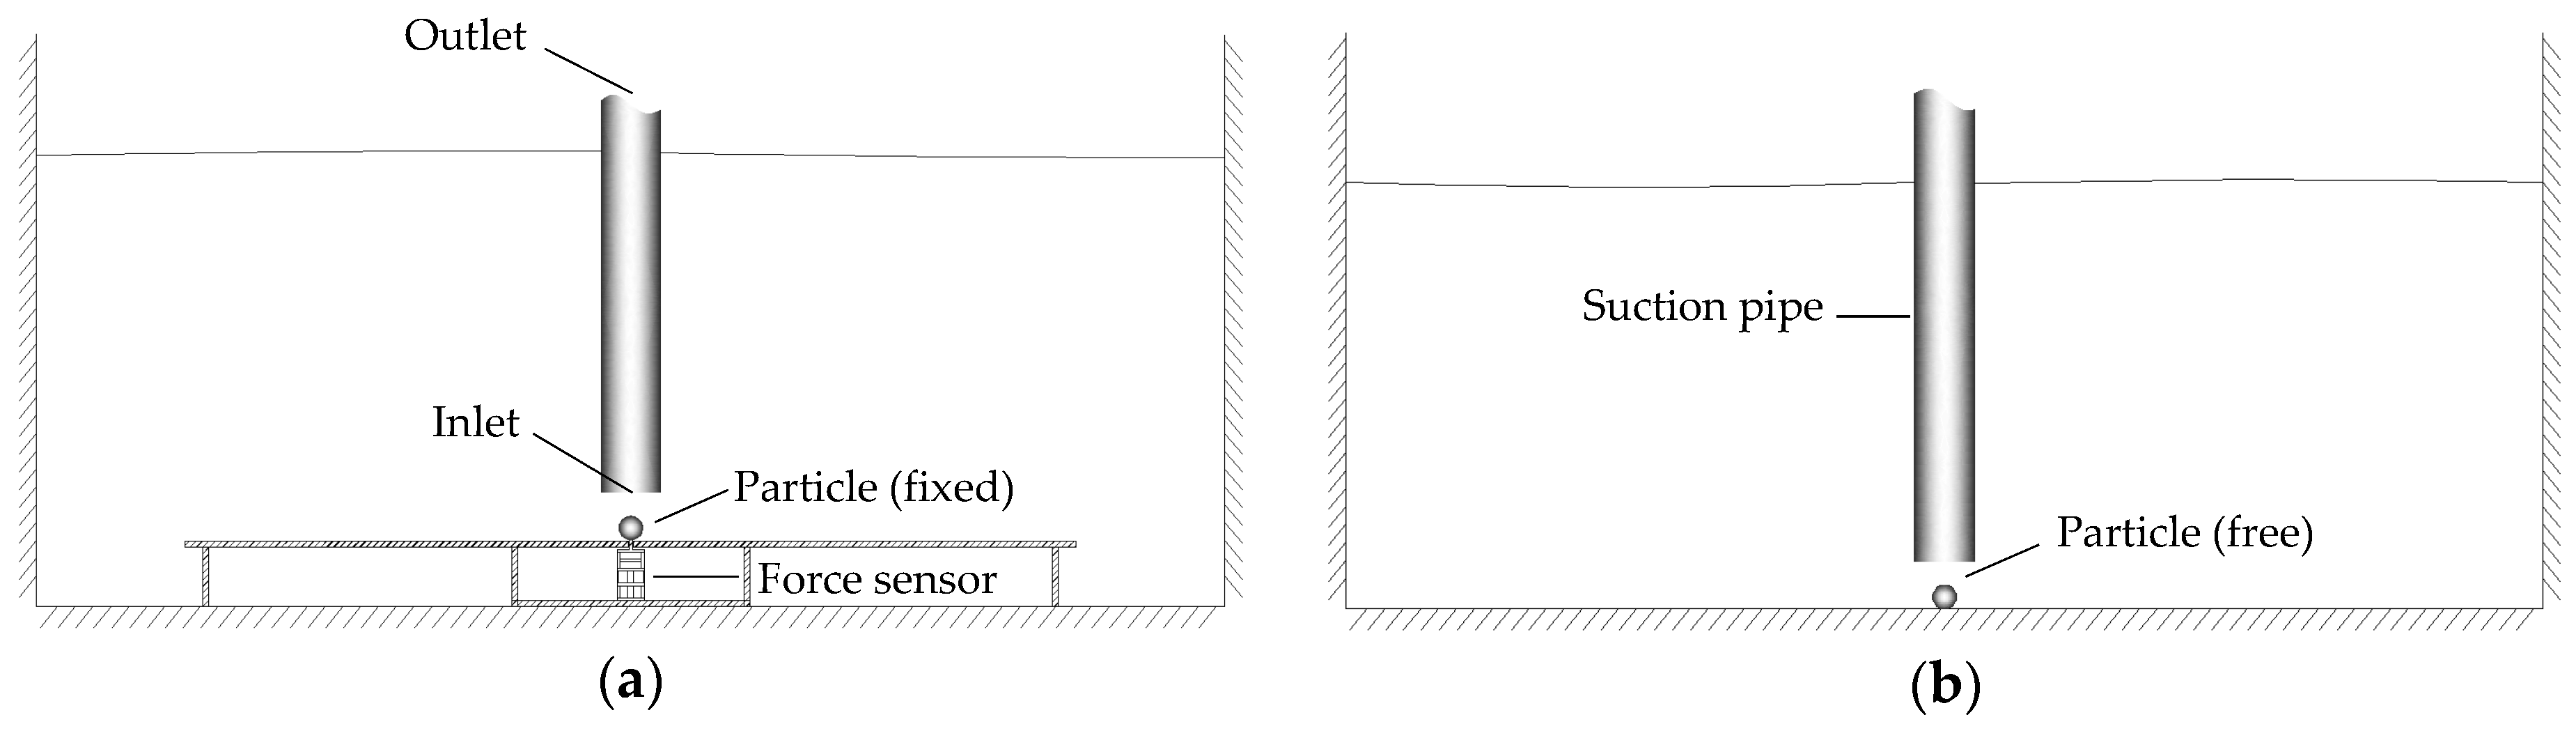
Figure 5 is the sketch of vertical force tests. In Figure 5a, the spherical particle is fixed on the three-component force sensor, separated by an intermediate acrylic board. Tests aimed to measure the vertical force of the particle without relative velocity with the pipe. In 
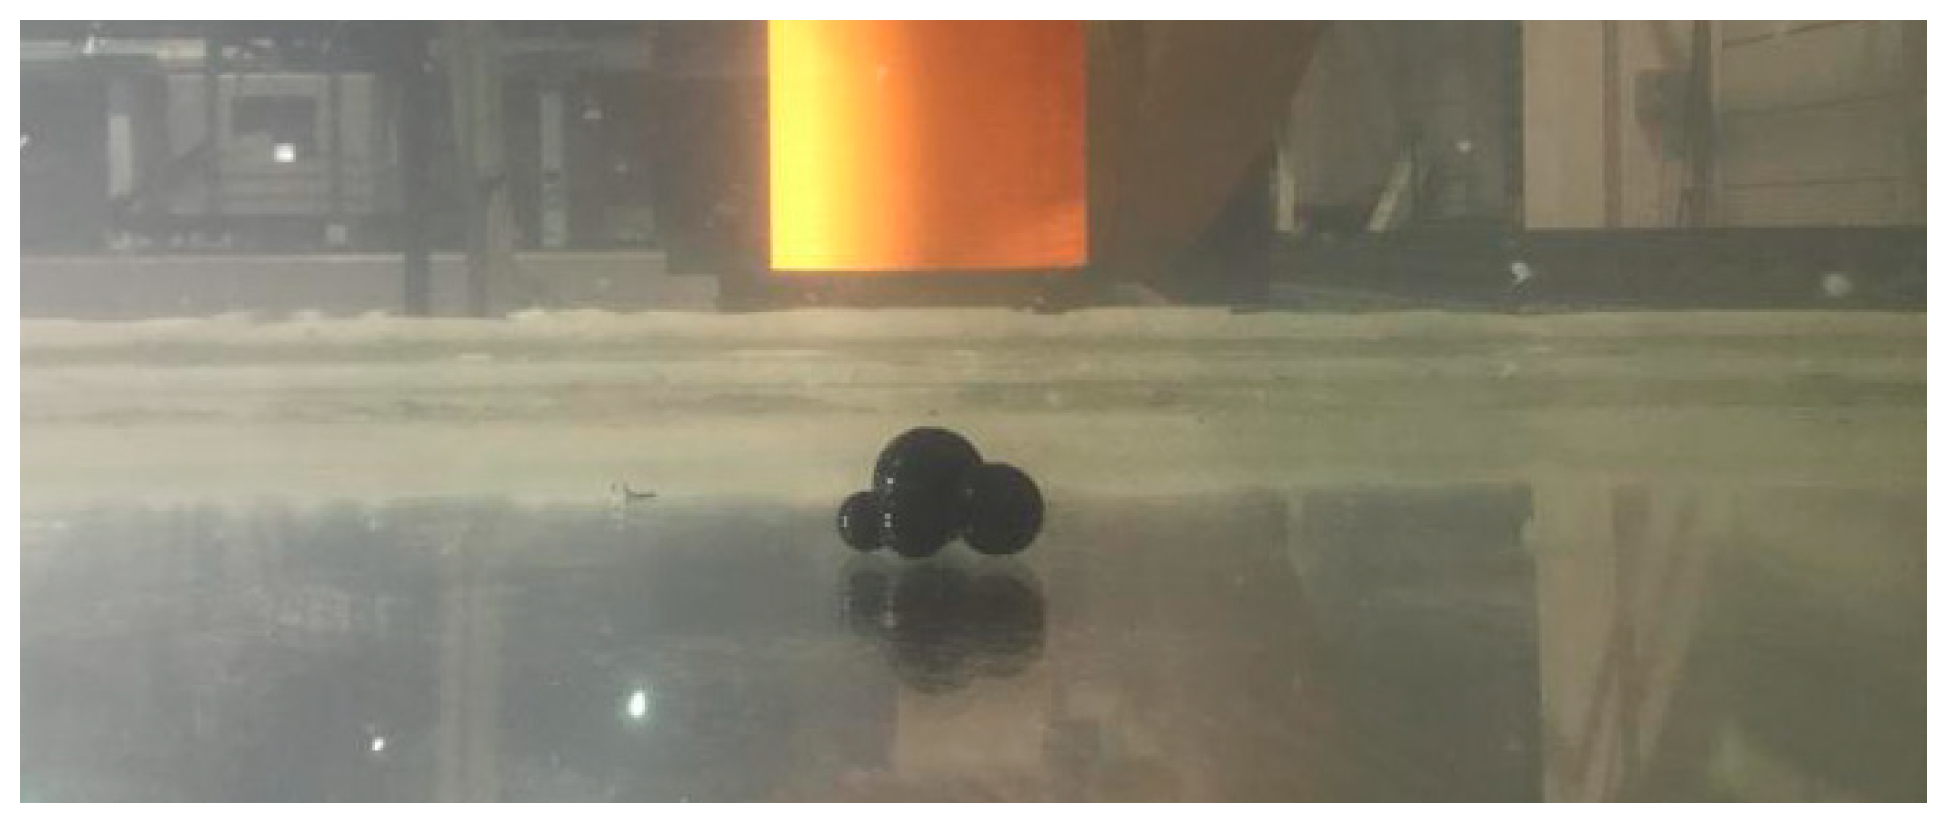
Figure 5b, the spherical particle is free on the bottom to measure the vertical incipient motion clearance in suction flow field. The particle is also still relative with the pipe before starting to lift in most tests. But in some exception, the particle will rotate around a vertical axis on the bottom and the phenomenon will be discussed later.
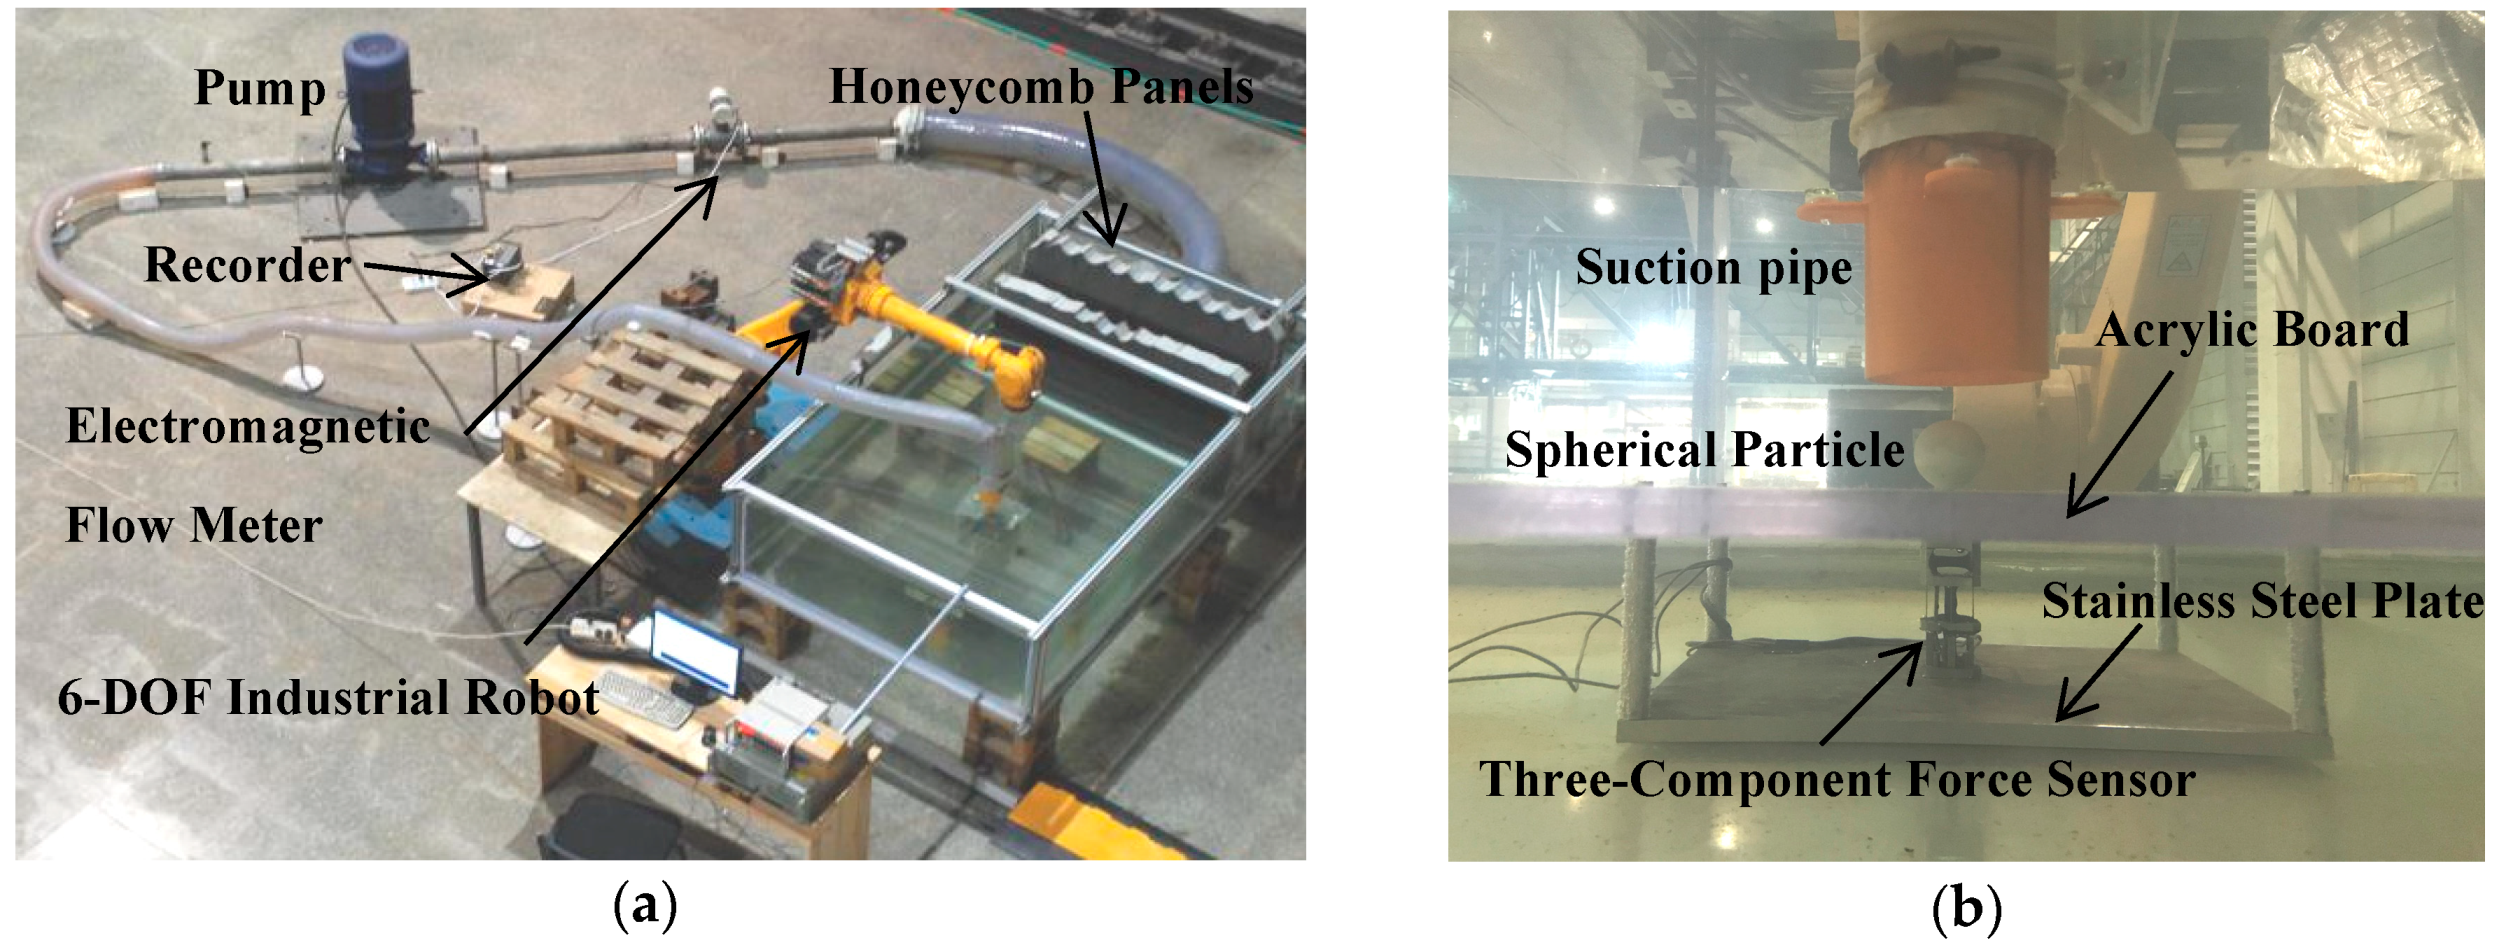
The whole test system consists of three parts: suction, movement and measurement as shown in 
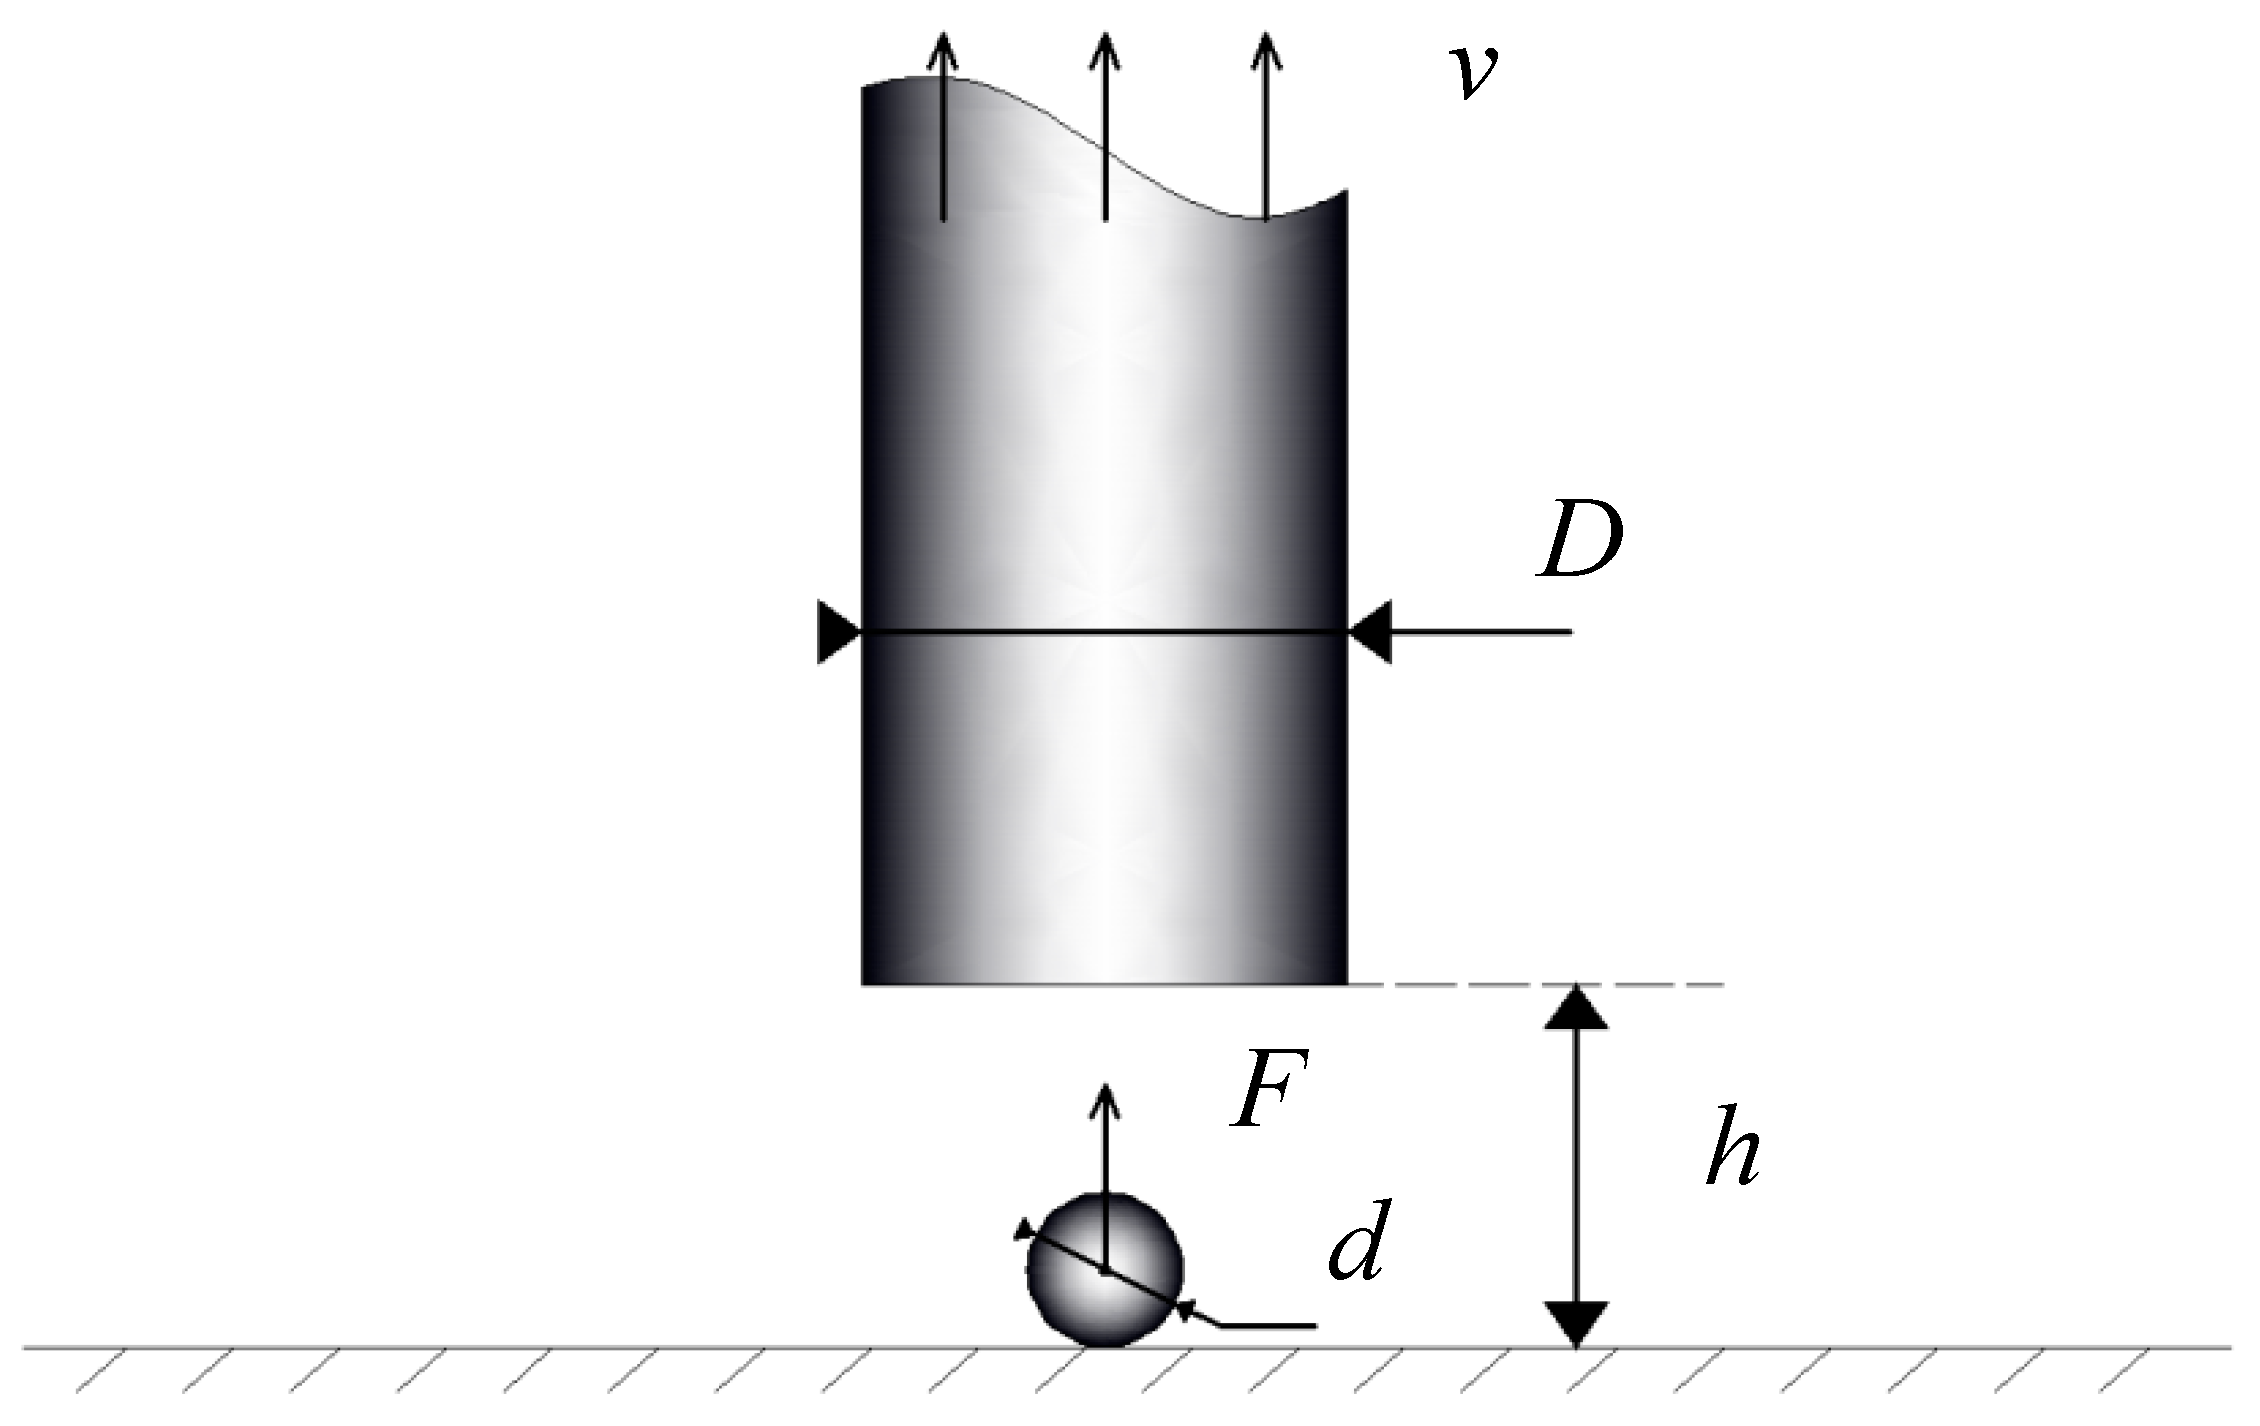
Figure 6. The suction part is mainly composed of glass flume and pump circulation device. The size of glass flume is 2.5 m × 1.5 m × 1.0 m. The water in the flume is connected to the pump through a pipe, in which the rated power is 22 kW and the maximum flow rate is 100 t/h. The LDG-SIN-DN100 electromagnetic flow meter (made by MEACON, Hangzhou, Zhejiang, China) is installed at the outlet of the pump to measure the flow rate through the pump. Considering the fact that the flow rate at the inlet of the pipe is almost the same as the measured one, the average flow velocity is calculated and called flow velocity in pipe. In addition, a 0.7 m baffle is installed and two parallel honeycomb plates are placed to weaken the impact of water wave on force measurement. The movement part is composed of an ER50-C10 six-degree-of-freedom robot (made by Effort, Wuhu, Anhui, China), whose lower arm is fixed to the inlet of the pipe. By adjusting the motion of the mechanical arm to change the position of the pipe entrance, the precision can reach 0.01 mm and 0.01°. The measurement part adopts three-component force sensor. The top of the sensor is rigidly connected with the measured particle, and its bottom is rigidly connected to the stainless-steel plate placed on the bottom of the flume. In addition, an acrylic plate is installed under the particle, so that the acrylic plate can be considered as a boundary, and the force sensor has no effect on the flow field above the plate. In the experiment, the vertical distance between the inlet and the particle is measured as the vertical distance between the bottom of pipe and the acrylic plate, and it is defined as the bottom clearance h.
The force sensor is connected with the data acquisition system, and it can measure the data of the vertical suction force of the particles within a period of time. To ensure the accuracy of the measurement results, the layout structure of force sensor in the experiment has been improved many times, and the system tolerance is successfully maintained within 1%. In addition, in previous tests, it was found that if the measured particle is too heavy or too light, it will cause an oscillation of the measured value. Therefore, the particles used in the vertical force tests are designed to balance their buoyancy with the proper gravity, so that the measurement results can be more accurate.
In each of the test cases, the critical bottom clearance h was determined for the incipient motion of particles by accurately controlling the position of the ER50-C10 robot. The flow velocity is measured by the electromagnetic flow meter and shows the value of quantity of flow. 
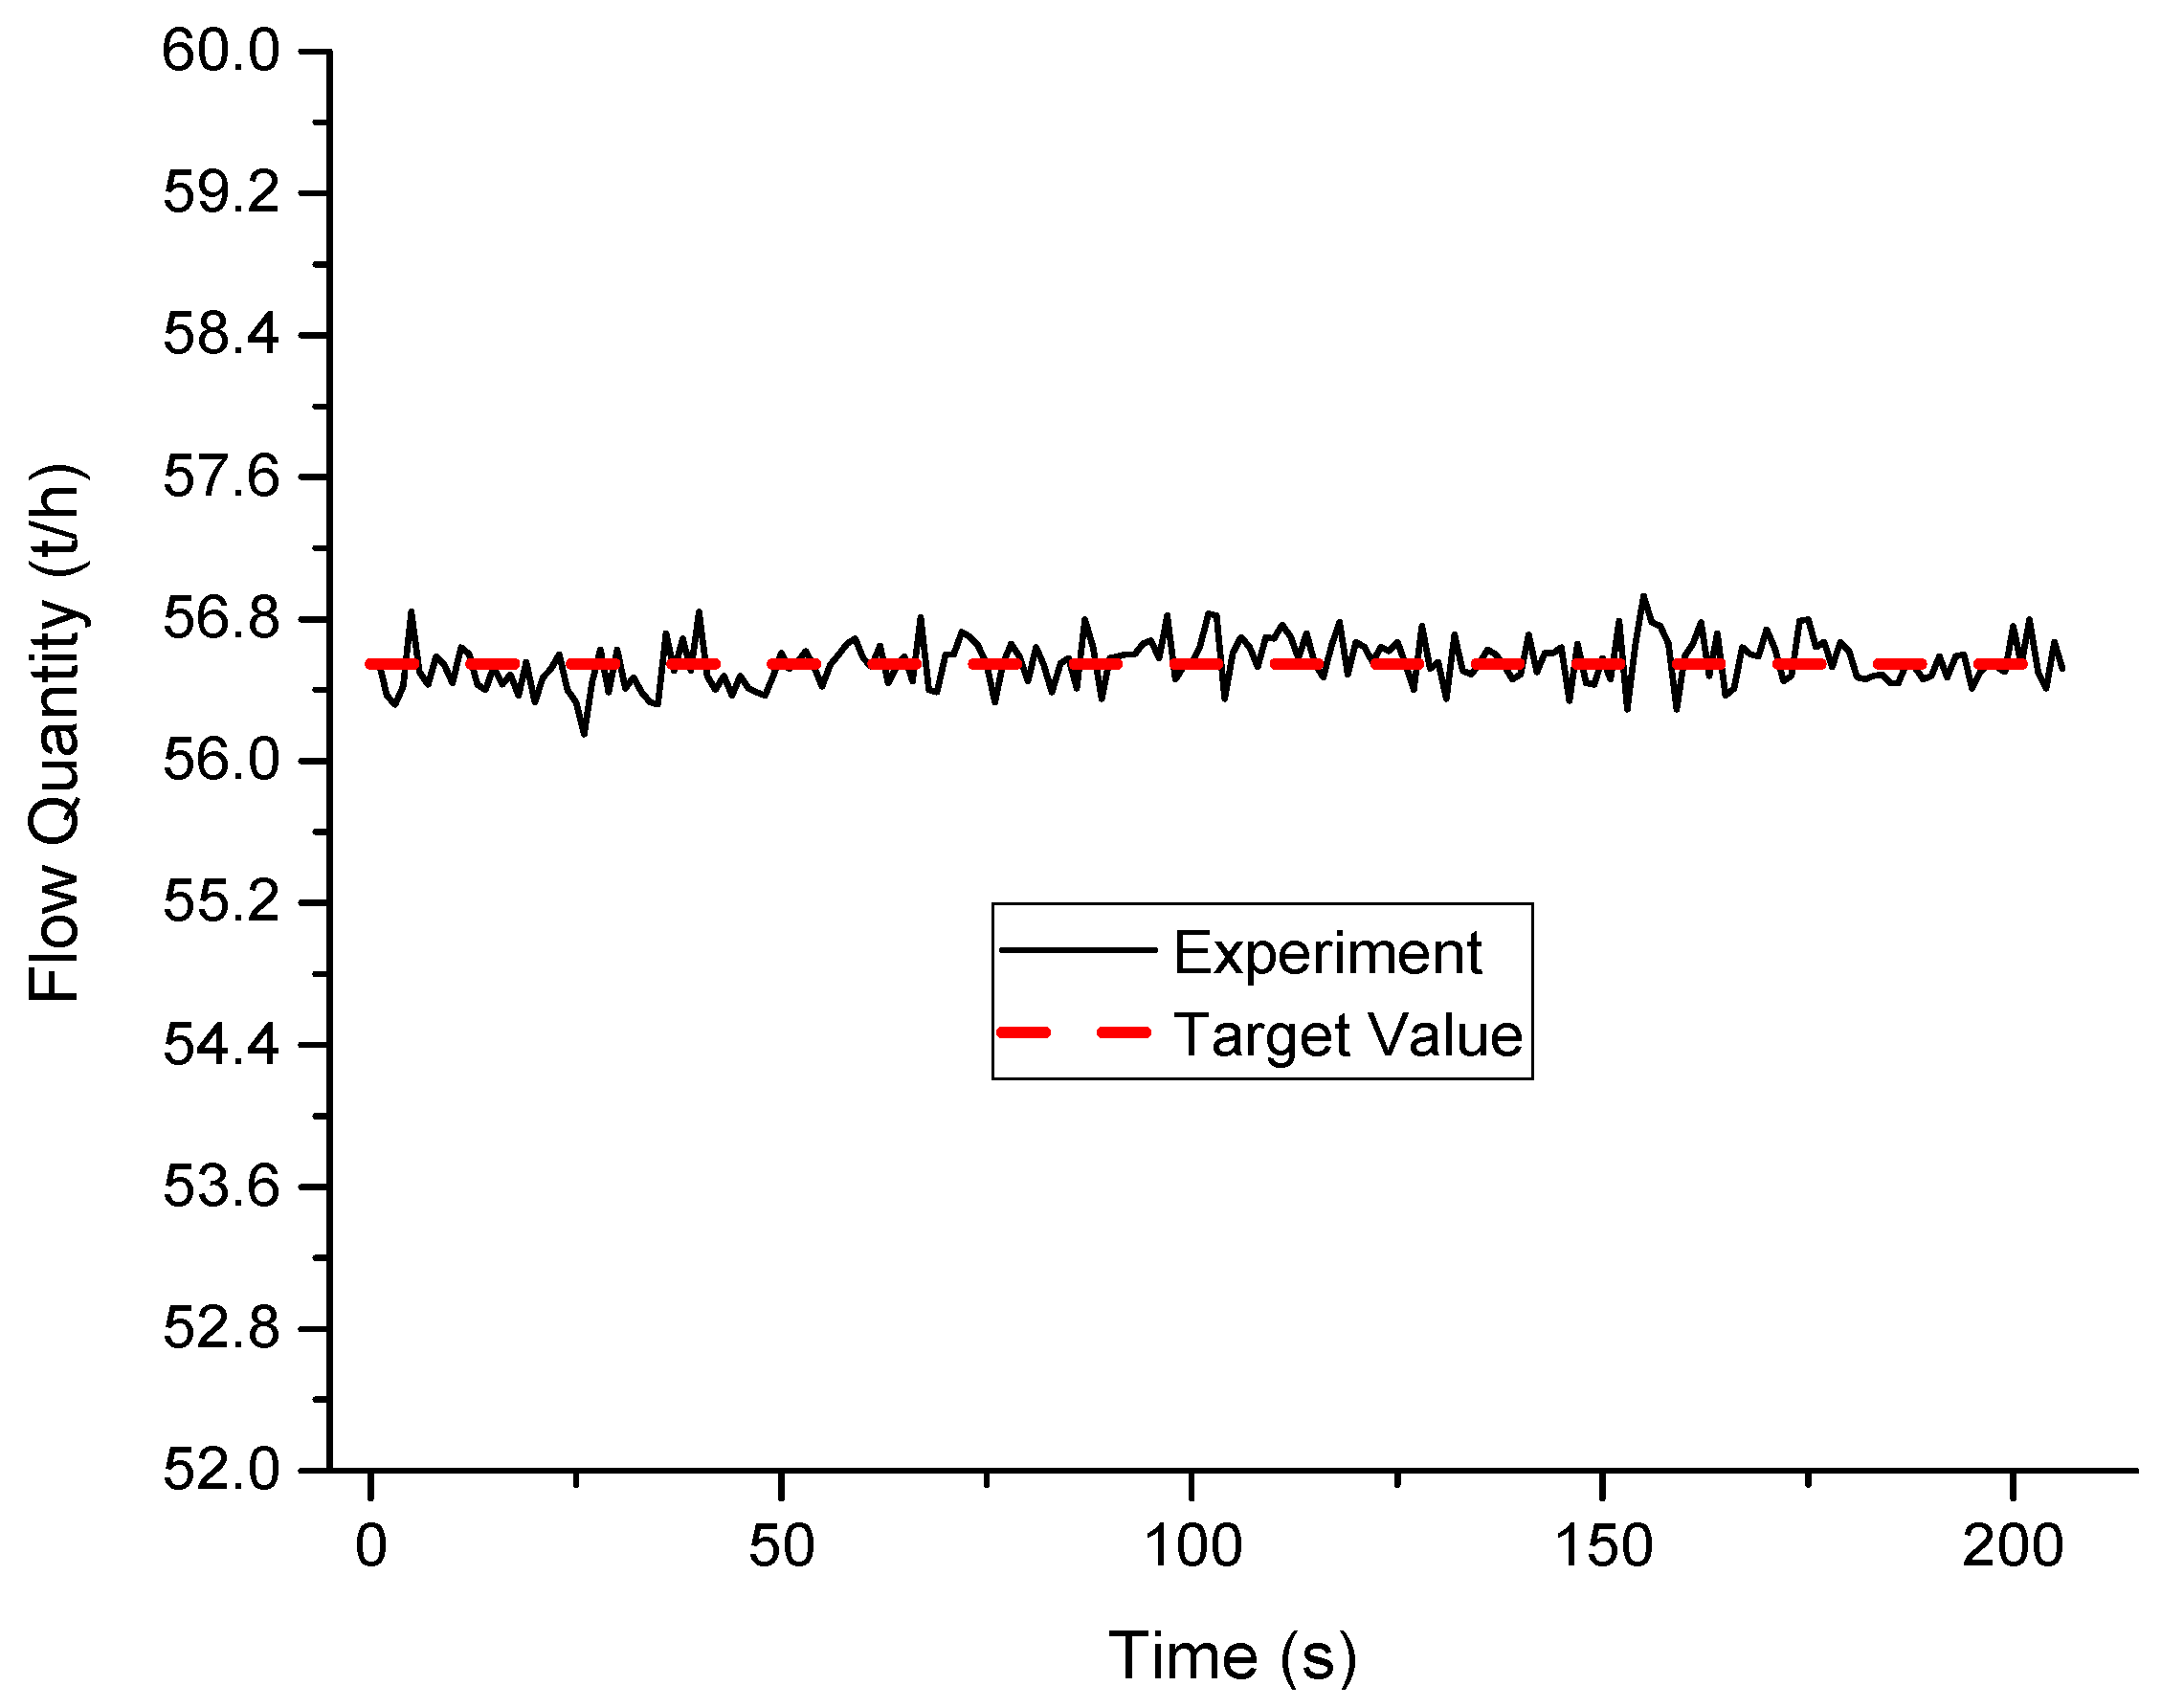
Figure 7 shows the experimental value in the recorder of the flow in the pipe for a period of 200 s. The red line in the figure means that the target value of the flow quantity is 56.55 t/h in terms of the specified flow velocity. In comparison, the tolerance between the average of the experimental value and the target value is within 0.3%. The standard deviation is 0.1323 t/h, which is 0.2% of the target value of flow quantity. Thus the tolerance of flow velocity is small enough and can be acceptable in this study.

3.2. Test Program

To examine the effects on Cvs of Re, h/d, D/d and other parameters, a series of values of each factor has been chosen. The diameters of suction pipe are 0.075 m, 0.1 m and 0.125 m, and the diameter of spherical particles are 0.032 m, 0.036 m and 0.040 m. In total, 234 cases were carried out with 3~5 flow velocities in pipe ranging from 1 m/s to 2 m/s. In this range, the vertical forces of particles can be bigger and smaller than its weights in water. Moreover, each case was repeated three times with 3 min each time. The water temperature in this study is 10 °C and the dynamic viscosity coefficient μ equals 1.308 × 10⁻³ Pa·s. Therefore the range of dimensionless parameters can be determined. The range of Re is from 30,581 to 61,162, the range of D/d is from 1.875 to 3.906, and the range of h/d is from 1.389 to 2.375.
To obtain the incipient motion characteristics of spherical particles in suction flow field and further validate the accuracy of the vertical force tests, a total of 18 cases of vertical incipient motion tests were carried out with different parameters, as shown in Table 2. Each test was repeated ten times to measure the bottom clearance of vertical incipient motion of the particles when they were lifted into the suction pipe. The single particle is free on the bottom and right below the suction pipe.
In addition, more vertical incipient motion tests of single and multiple particles were carried out to study the relations between the vertical incipient motion characteristics of single and multiple particles, such as the critical bottom clearance of each particle and the sequence of each particle to be lifted. Each test was also repeated ten times to measure the bottom clearance and the sequence of lifted particles. The parameters are listed in Table 3.
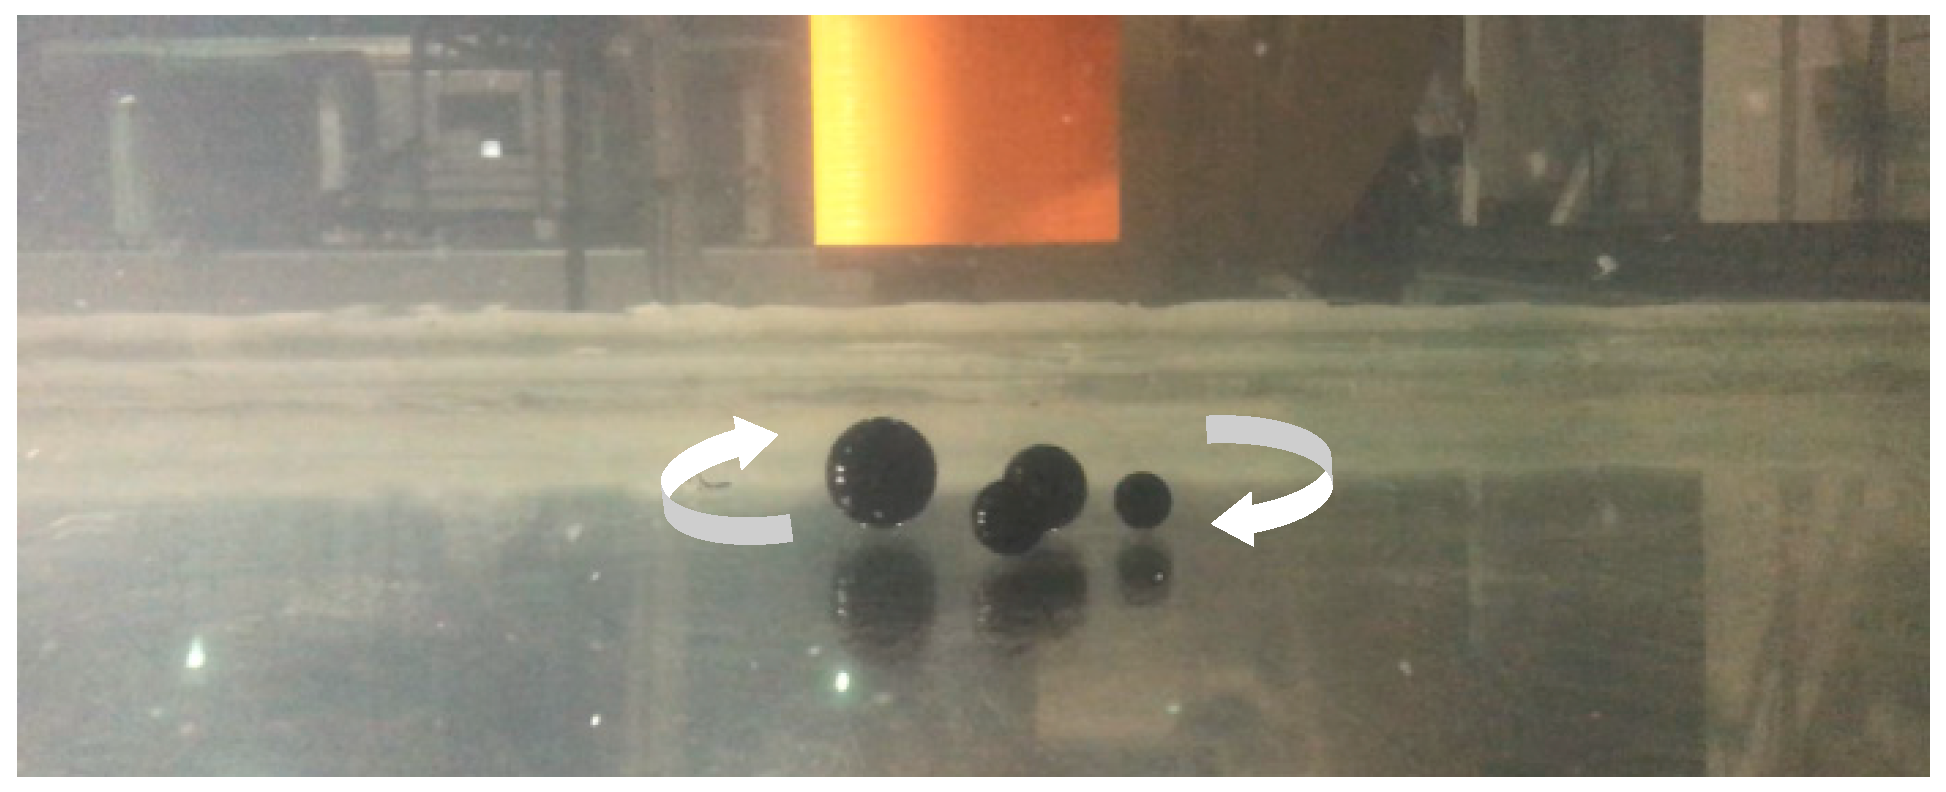
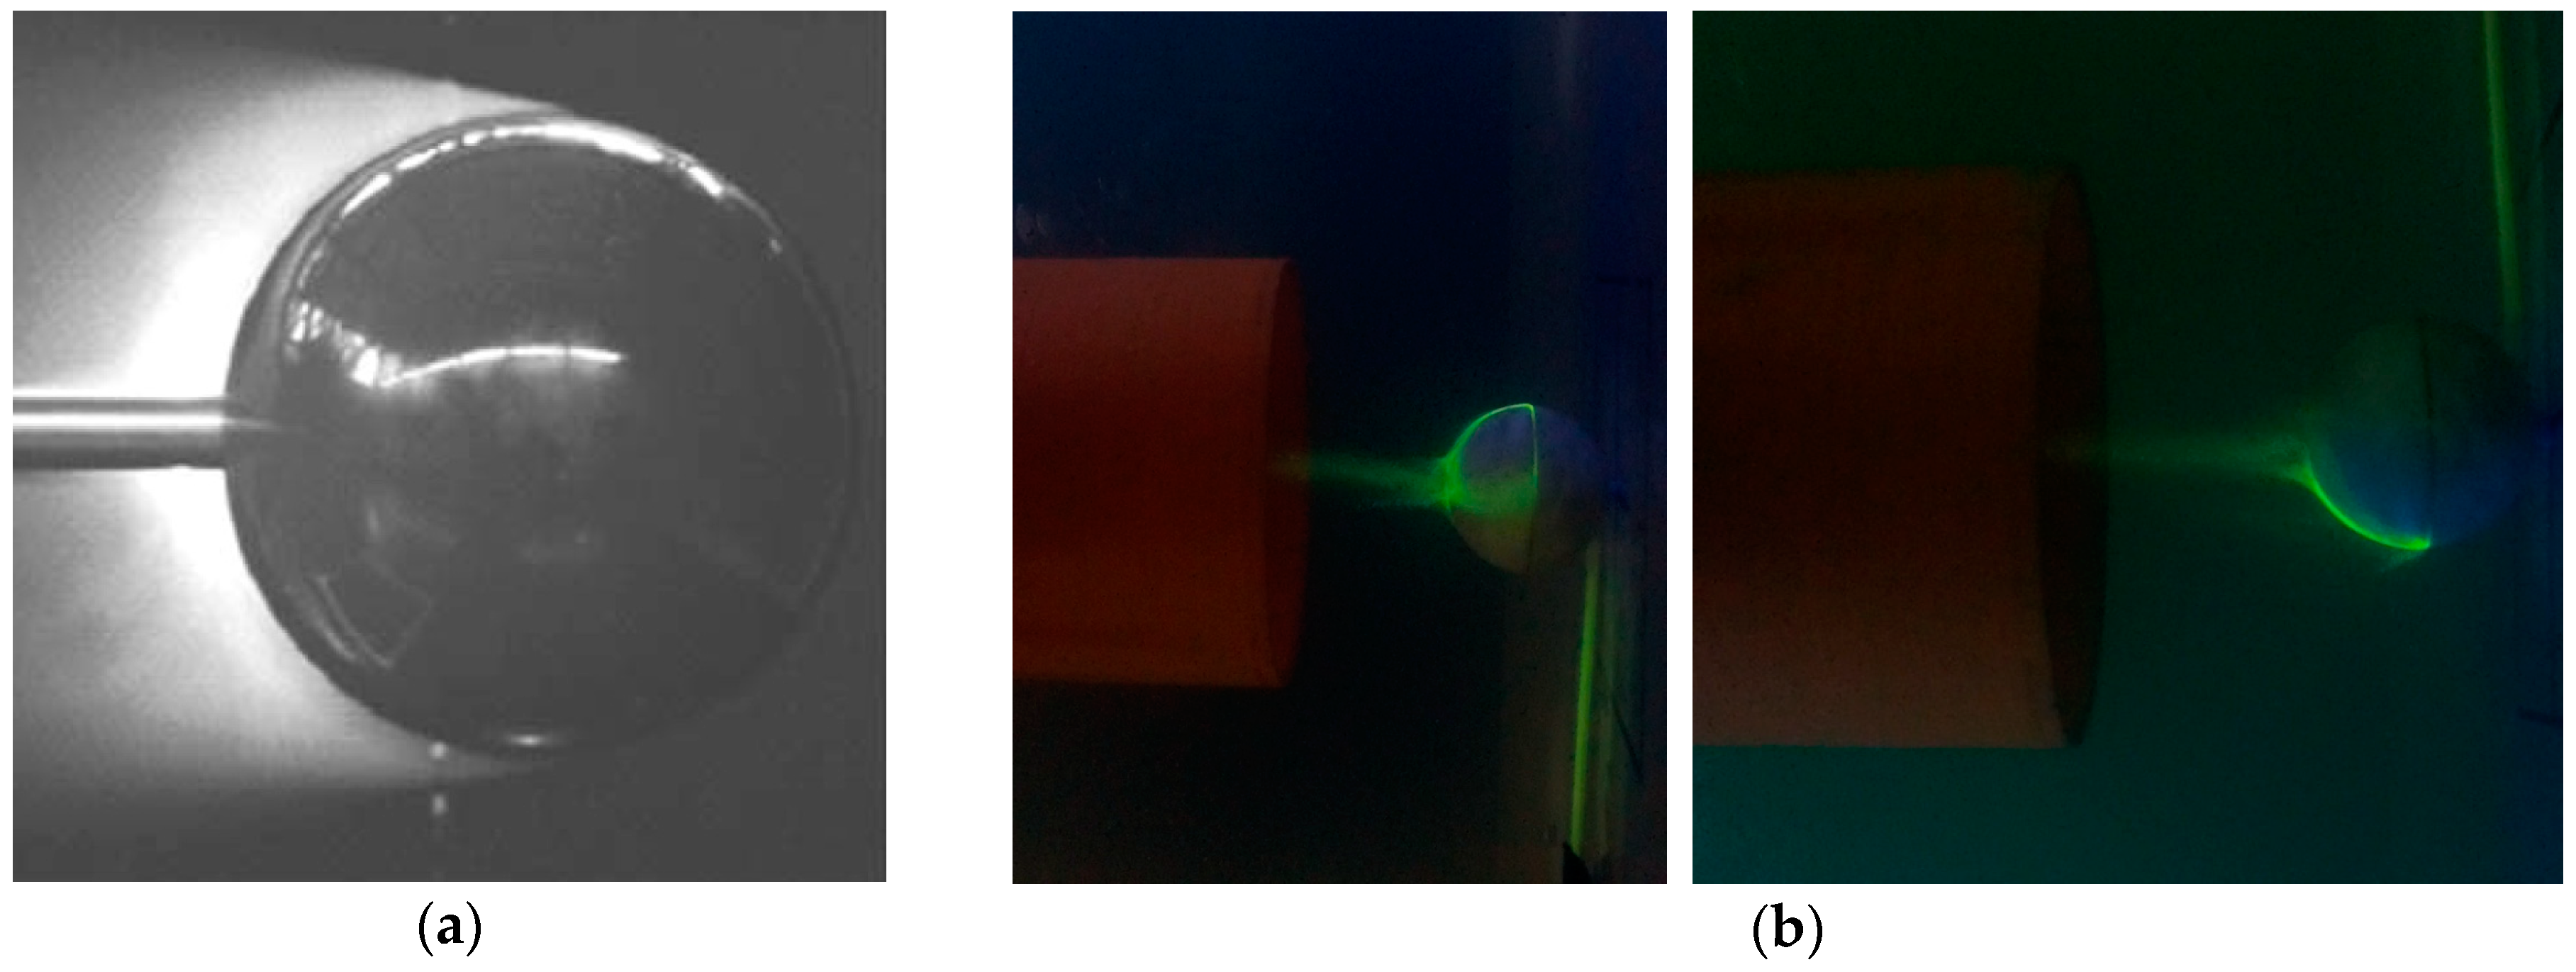
Flow visualization tests were carried out to observe the characteristics of suction flow field. To compare with the results in references [16,34], the test cases are set as Table 4.

4. Results and Discussion

Based on the measurements, the empirical formula of vertical force and criterion-formula of vertical incipient motion of particles are established separately. By comparing experiments of single and multiple particles, the correspondence of both incipient motion characteristics is obtained. The phenomenon that the vortex could help strengthen the suction force was found in both tests. In addition, the characteristics of flow field were observed by flow visualization tests, and applied to explain the force characteristics of particles in suction flow field.

4.1. Vertical Force Characteristics of Particles in Suction Flow Field

4.1.1. Influence of Re on Cvs

Figure 8 shows the test results of Cvs for different Re and h/d. It can be seen that the vertical suction force coefficient is nearly independent of Reynolds number when Re is in the range from 30,581 to 61,162. This range is subjected to the subcritical flow regime for flow around a sphere in a uniform flow, which also has the feature that the vertical suction force coefficient is nearly independent of Reynolds number [22]. Therefore, Equation (9) for Cvs can be simplified to:
C v s = f ( D d , h d )
In addition, the vertical suction force coefficients of spheres in suction flow are smaller than those in a uniform flow. One reason for this phenomenon is that the velocity close to the solid surface of particle is much smaller than that in the pipe. The velocity used to define Cvs is the velocity in pipe, however, the velocity used to define Cd is the oncoming flow velocity which is similar to that close to the solid surface of particles.

4.1.2. Influences of D/d and h/d on Cvs

The test results of Cvs for different D/d and h/d are shown in Figure 9 and Figure 10. As shown in Figure 9, with the increase of D/d, the Cvs almost increases linearly. The coefficients of determination (R2) of linear fitting functions for seven different fitting curves are over 0.9804.
Unlike the influence of D/d, Figure 10 shows that the Cvs decreases exponentially with h/d in the hydraulic collecting process. The coefficients of determination (R2) of exponential fitting functions are over 0.9996 and thus the fitting quality is extremely good. In consequence, h/d is a dominant factor to influence the Cvs. If the deep sea miner collector could work with a small h/d, large amount of collecting energy consumption will be saved and the disturbance to the sea floor will be minimized.

4.1.3. Empirical Formula among D/d, h/d and Cvs

The empirical formula among D/d, h/d and Cvs is required to predict the collecting performance under different cases. As a result, the functions between the natural logarithm of Cvs (lnCvs) and h/d for different D/d are drawn in Figure 11. An interesting phenomenon is observed that all the linear fitting lines tend to meet at one point.
By further analyzing the linear fitting parameters listed in Table 5 and making data fittings between the D/d and the two parameters, other two exponential fitting formulas for those parameters can be obtained respectively, as shown in Table 6.
As a result, the empirical formula among D/d, h/d and lnCvs is established:
ln ( C v s ) = 5.70 ( D d ) 0.788 ( h d ) + 5.33 ( D d ) 0.567
The graph of the empirical formula can be drawn as in Figure 12.
Figure 13 shows the tolerance between calculated value Cvs by the empirical formula Equation (17) and measured value Cvs by experiments for 234 cases.
The maximum tolerance is less than 10% and this indicates that the suction force prediction formula is sufficiently accurate to predict the vertical force of particles in different cases.

4.2. Vertical Incipient Motion Characteristics of Particles in Suction Flow Field

4.2.1. Criterion-Formula of Vertical Incipient Motion of Particles

In this study, the vertical suction force coefficient Cvs is used to represent the characteristics of vertical force of the particle in suction flow field. Because the equation (F + Fbuoy = mg) is the critical condition to trigger the vertical incipient motion of particles, therefore, if Cvs determined by D/d and h/d is bigger than that calculated by Equation (15), the particles will be lifted theoretically.
Figure 14 shows the tolerance of Cvs between the theoretical values by Equation (15) and the predicted values by Equation (17). The dash dotted line and solid line in the graph represent the theoretical values based on two kinds of densities: ρ = 2164.5 kg/m3 and ρ = 2495.7 kg/m3. Four dotted lines represent the upper and lower bounds with 15% tolerance of the two lines, respectively. The two kinds of data points are obtained based on the measurements of the cases. It can be seen that the measured data are distributed on both sides of the theoretical lines within the range of 15% tolerance. Therefore, the vertical force tests are further verified by the vertical incipient motion tests. Furthermore, the criterion-formula Equation (15) of vertical incipient motion of particles is obtained with the maximum tolerance less than 15% and can be used to predict the collecting performance in various cases. As a result, it is feasible to provide sufficient suction force and avoid unnecessary disturbance by predicting the performance of collecting accurately.

4.2.2. Vertical Incipient Motion Characteristics of Single Particles

Table 7 shows the test results of critical bottom clearance h in relation with D/d for the incipient motion of single particle. Each of the test cases for a single particle was repeated ten times and the recorded critical bottom clearance was represented by hi (i = 1, 2, …, 10). Then, the mean value h ¯ and standard deviation of the measurements were calculated. The test results show that the smaller particle has a higher standard deviation of h, which means the h of smaller particle exhibits more significant fluctuation. By observing the video taken by a high-speed camera, it is found that the particle d19.2 is always in circular motion with a large h. When particles remain almost still, however, the h is small. The reason for high standard deviation of particle d19.2 could be explained like this: the particle d19.2 tends to rotate around a vertical axis on the bottom before being sucked into the pipe because of the significant impact of vortex. The irregularity of vortex devotes to the high standard deviation of h and the vortex could help strengthen the suction force.

4.2.3. Vertical Incipient Motion Characteristics of Multiple Particles

Table 8 lists the results of the sequence of lifting particles and the critical bottom clearances of test cases for four particles, which are right below the fixed pipe. Similarly, each of the test cases for multiple particles was repeated 10 times. It is clear that for most cases the particles d39.39 and d19.2 would be lifted firstly, and this is consistent with the results in Table 7, where the h ¯ of particles d39.39 and d19.2 are larger than the other particles.
Especially, in Nos.1, 3, 4, 8 and 9, the particle d39.39 is lifted firstly and the particle d19.2 is lifted secondly. Moreover, the relevant experiment video in Figure 15 shows that particles remain almost still before lifted. In Nos.2, 6, 7 and 10, on the other hand, the particle d19.2 is lifted firstly and the video shows that particles are in circular motion before lifted, as shown in Figure 16. As a result, the smallest particle is influenced by the circular motion significantly. The instability of the fluid field generally causes the smallest particle to be sucked firstly, and this supports the supposition in Section 4.2.2 that the vortex could help strengthen the suction force. Therefore, the characteristics of collecting single particle would be meaningful for further research on collecting multiple particles.

4.3. Flow Visualization Results

Flow visualization experiments were carried out to observe the characteristics of suction flow field. The visualizations in Figure 17b are similar to the numerical results [16]. The streamlines gather in the middle and the flow field exhibit cohesive characteristics.
Furthermore, by comparing the flow visualization test results in Figure 18, it is evident that the wake vortex separation point in suction flow is much more near the top of the particle than that in uniform flow. The closer the separation point of the wake vortex near the top of the particle, the smaller area on the particle is influenced by the wake vortex, leading to much smaller vertical suction force coefficient. Therefore, this phenomenon also contributes to the result that the vertical suction force coefficients of spheres in suction flow are smaller than those in a uniform flow in Figure 8. In addition, this physical phenomenon could explain why tests could have good repeatability and the prediction for both vertical force and incipient motion of particles in suction flow field could be accurate.

5. Conclusions

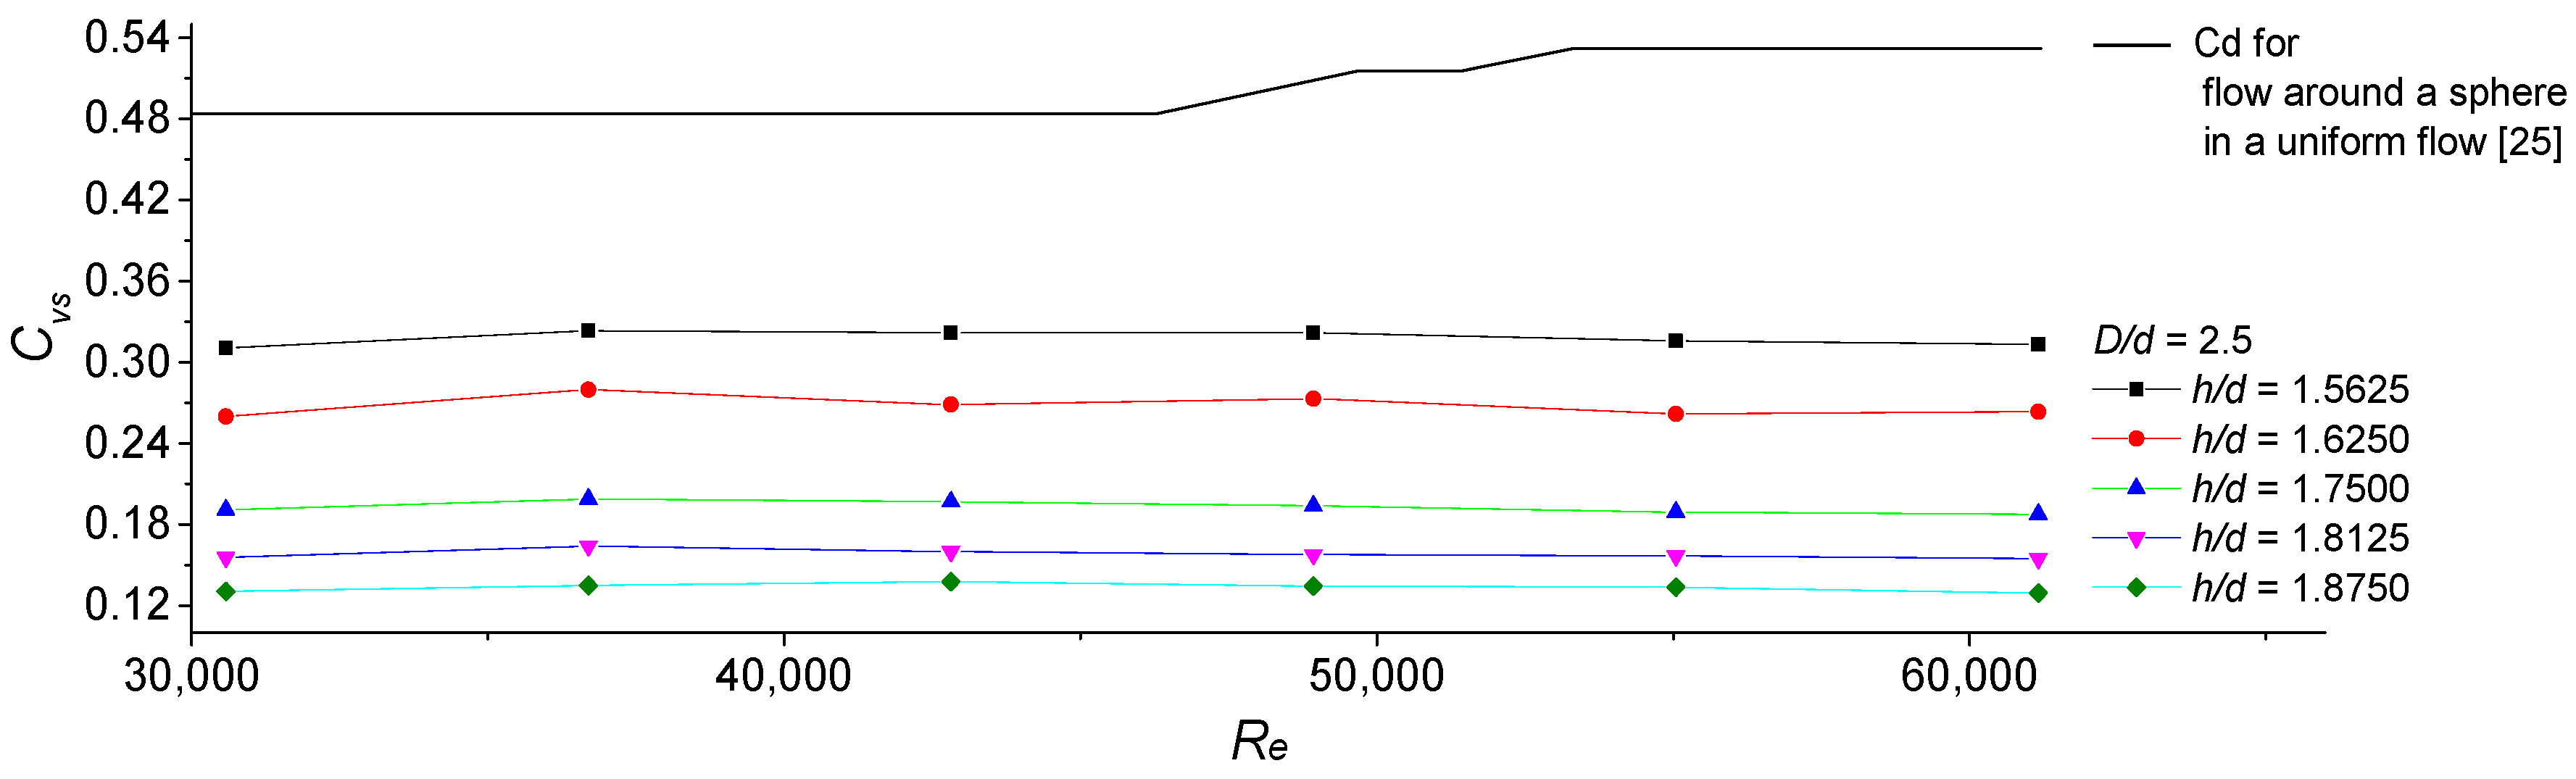
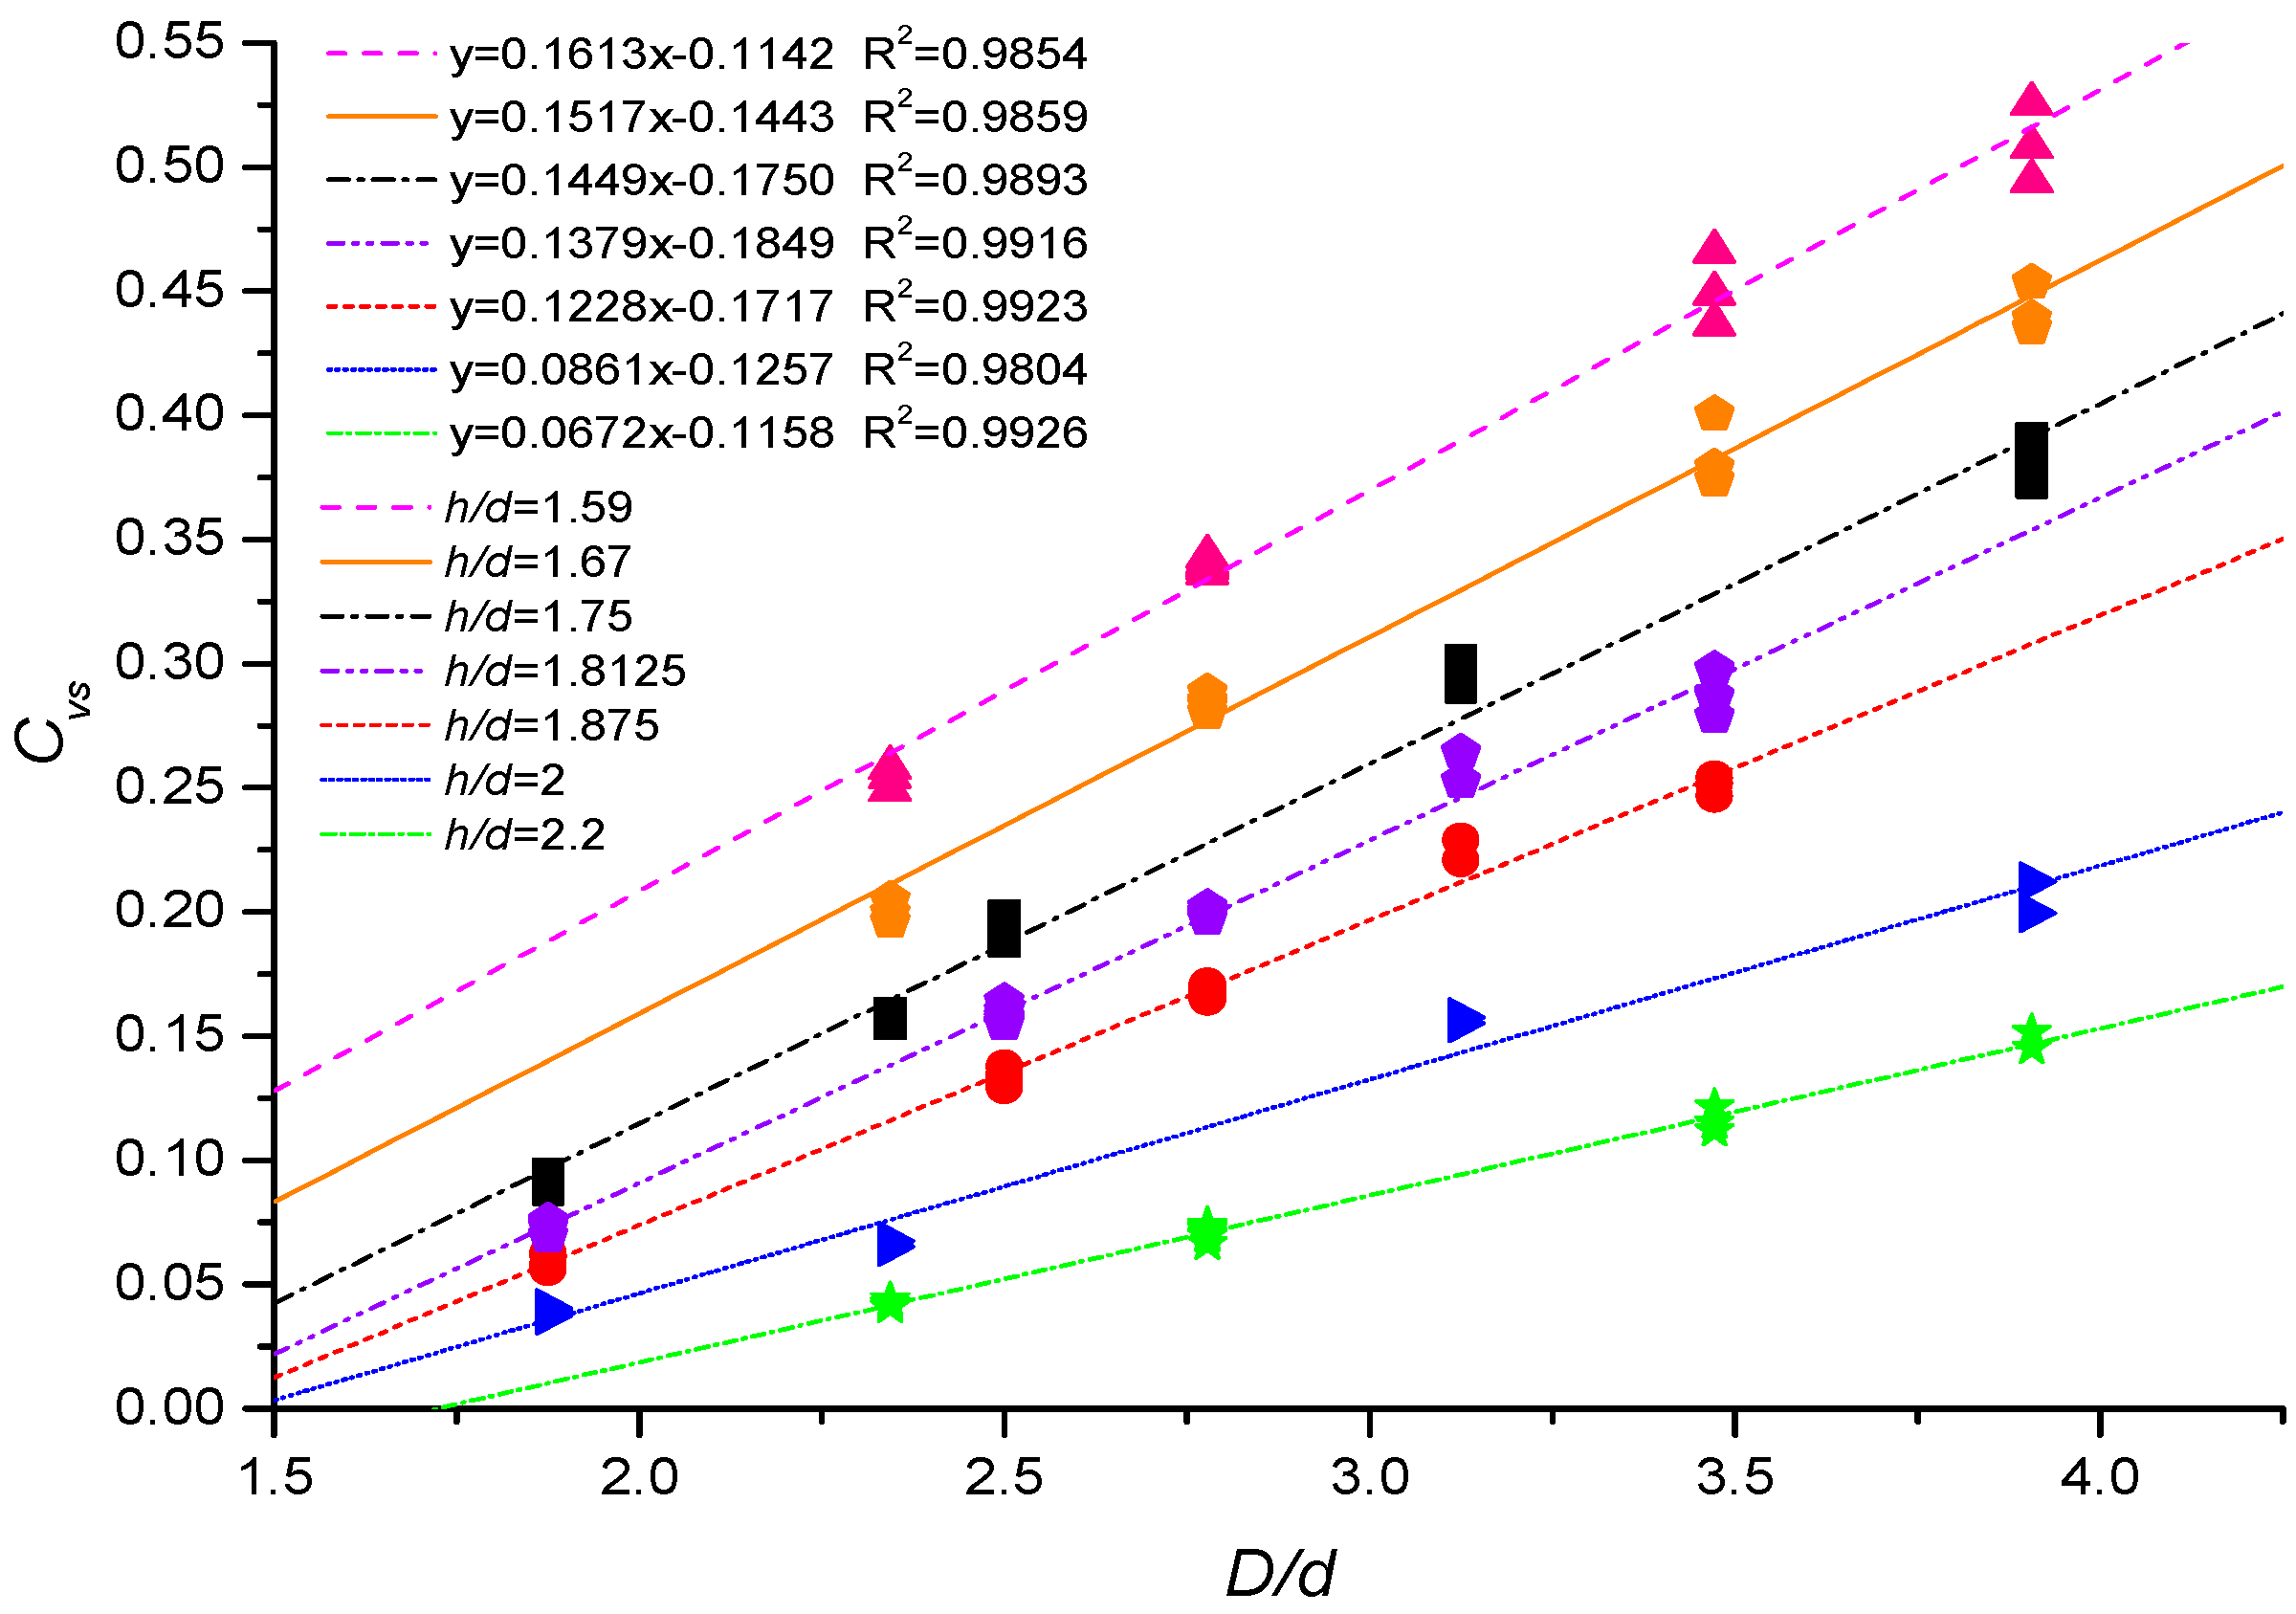
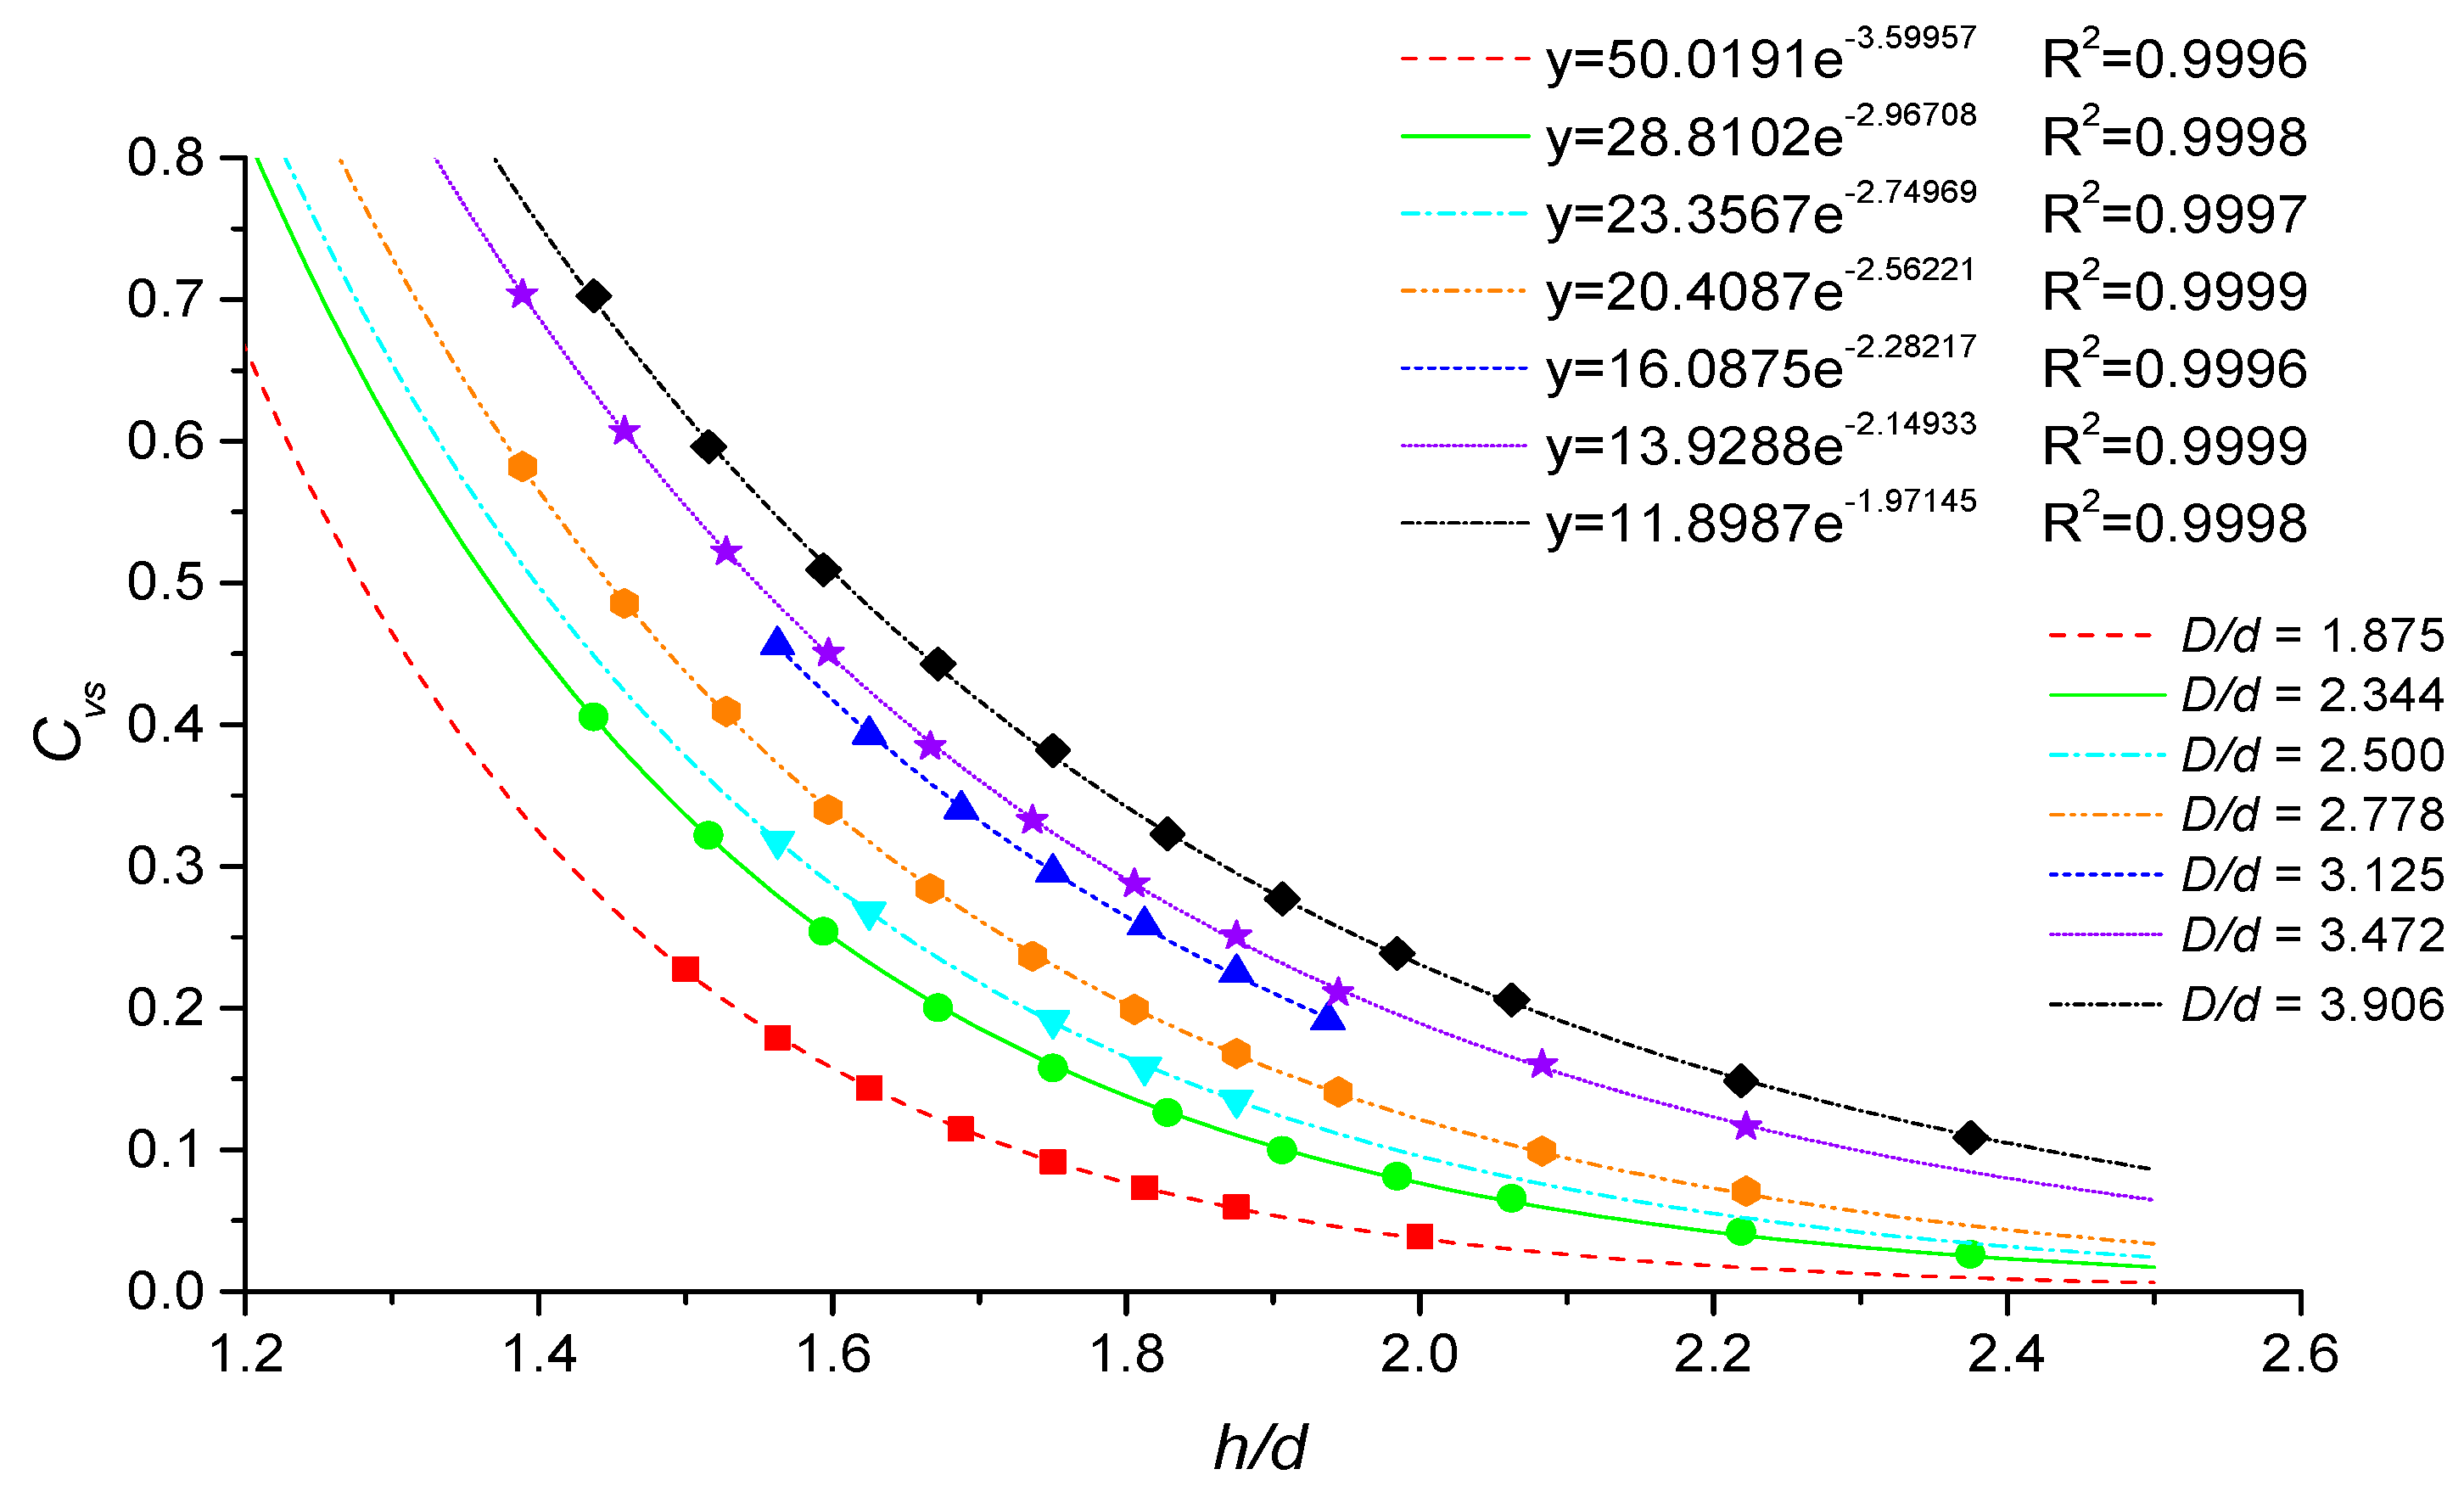
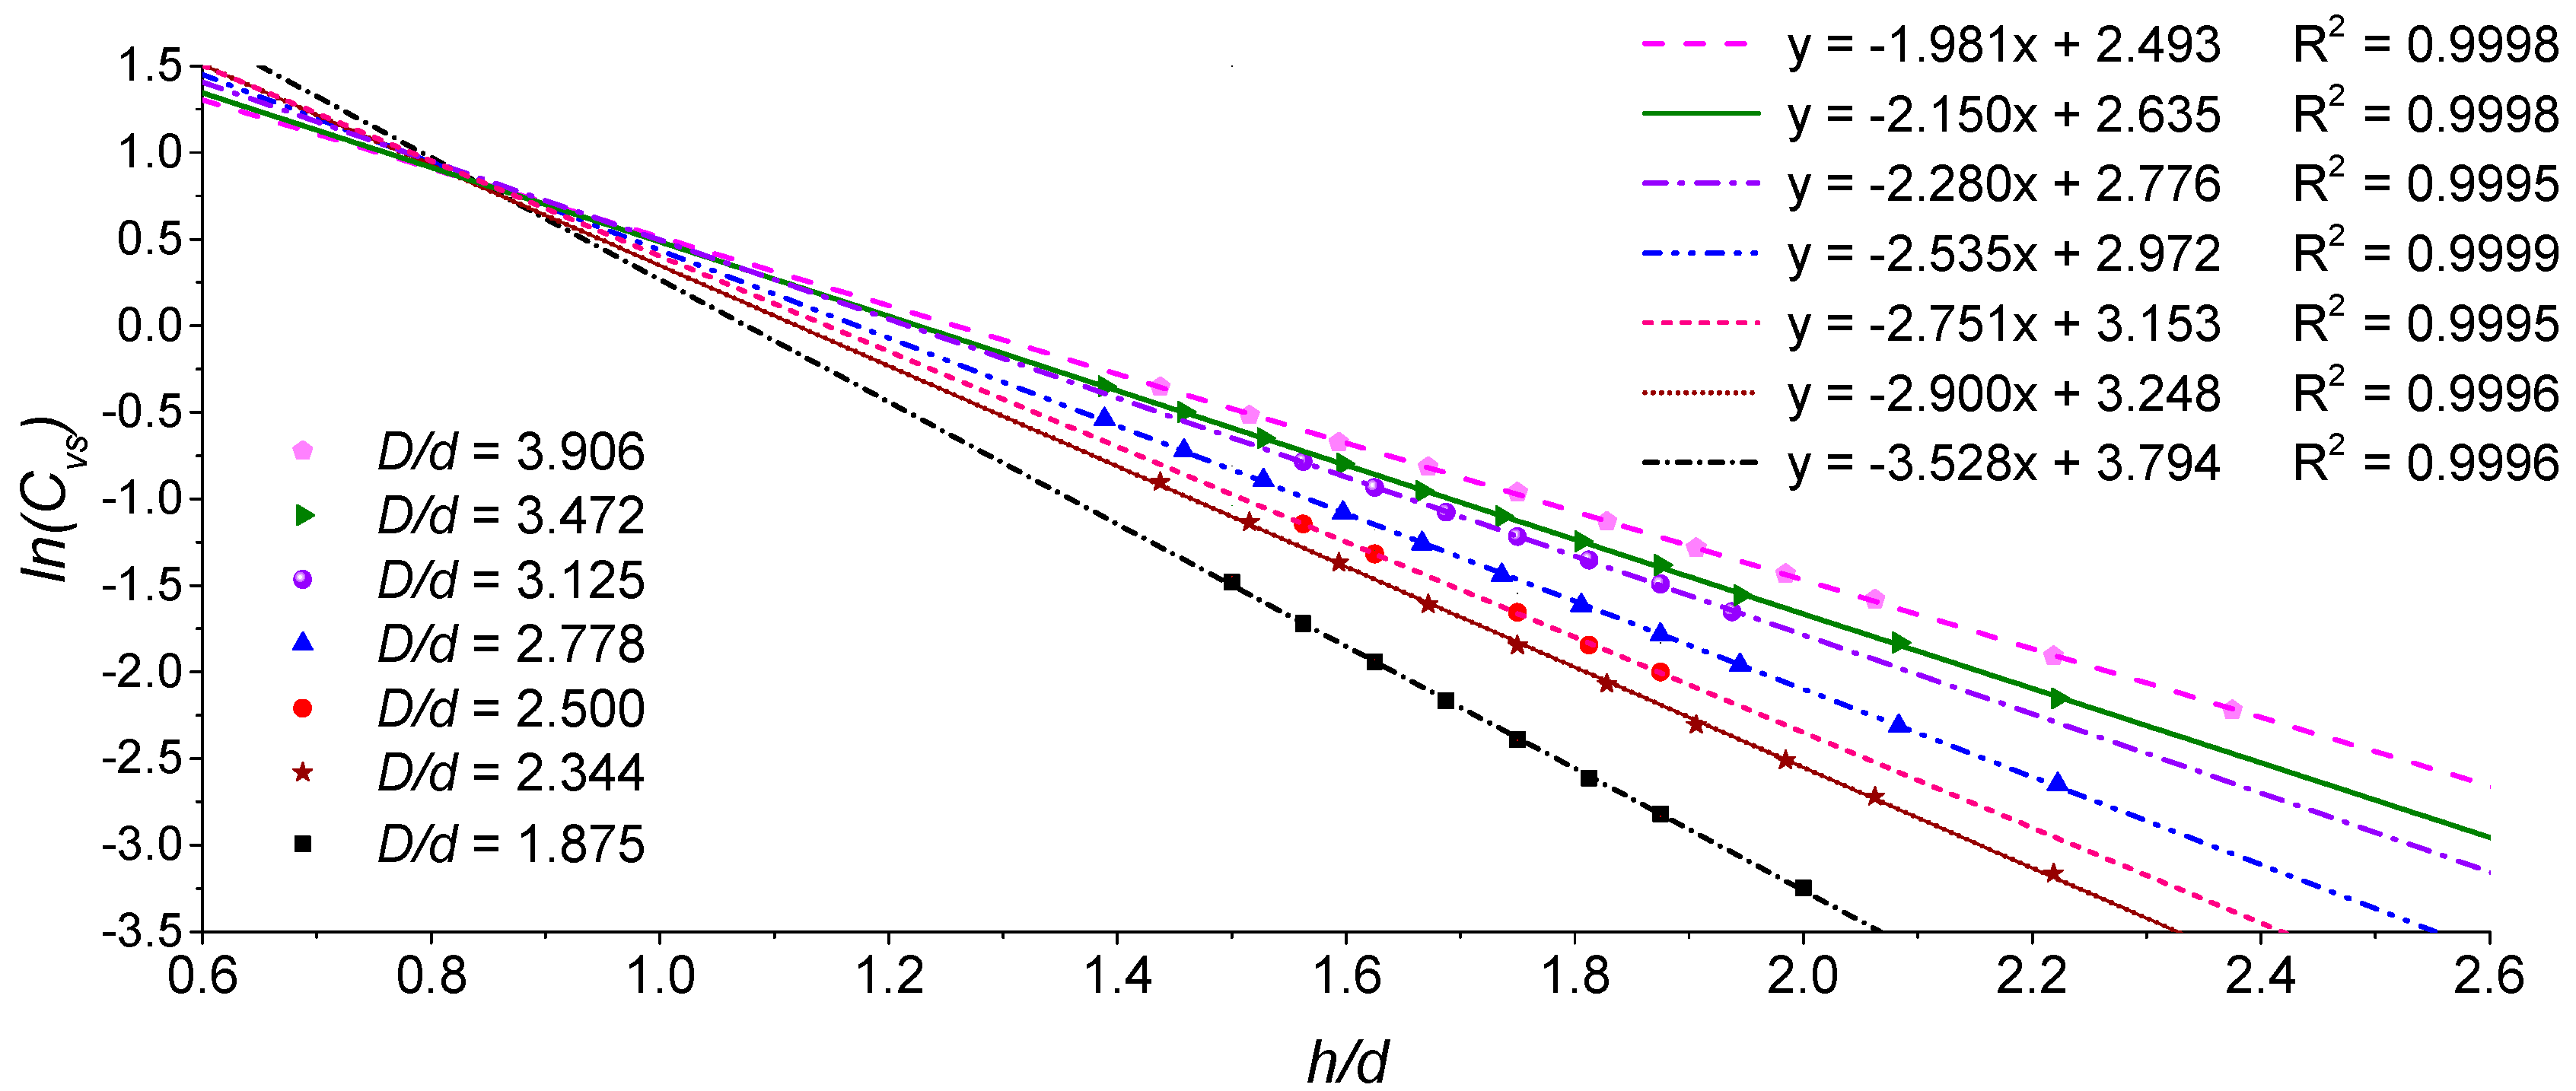
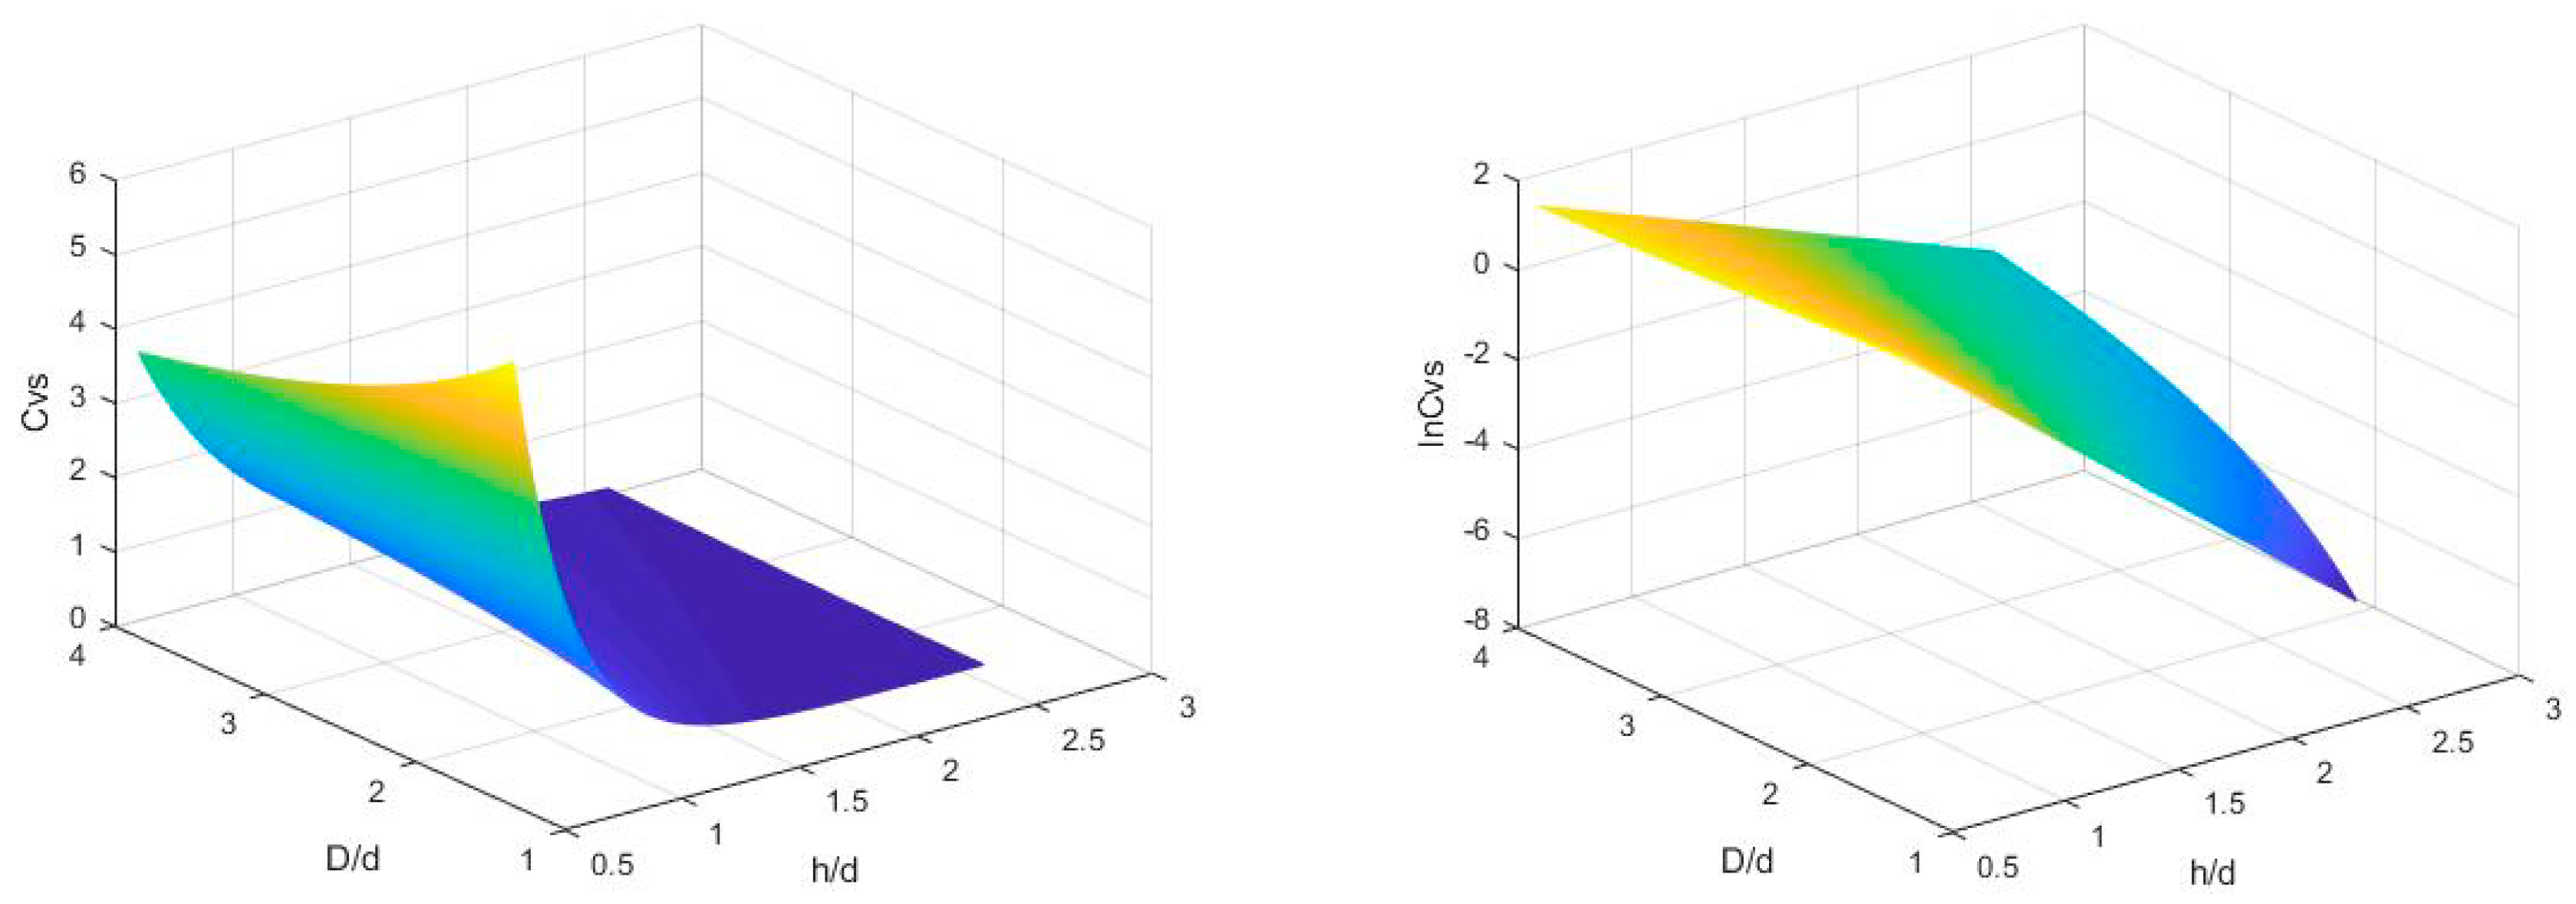
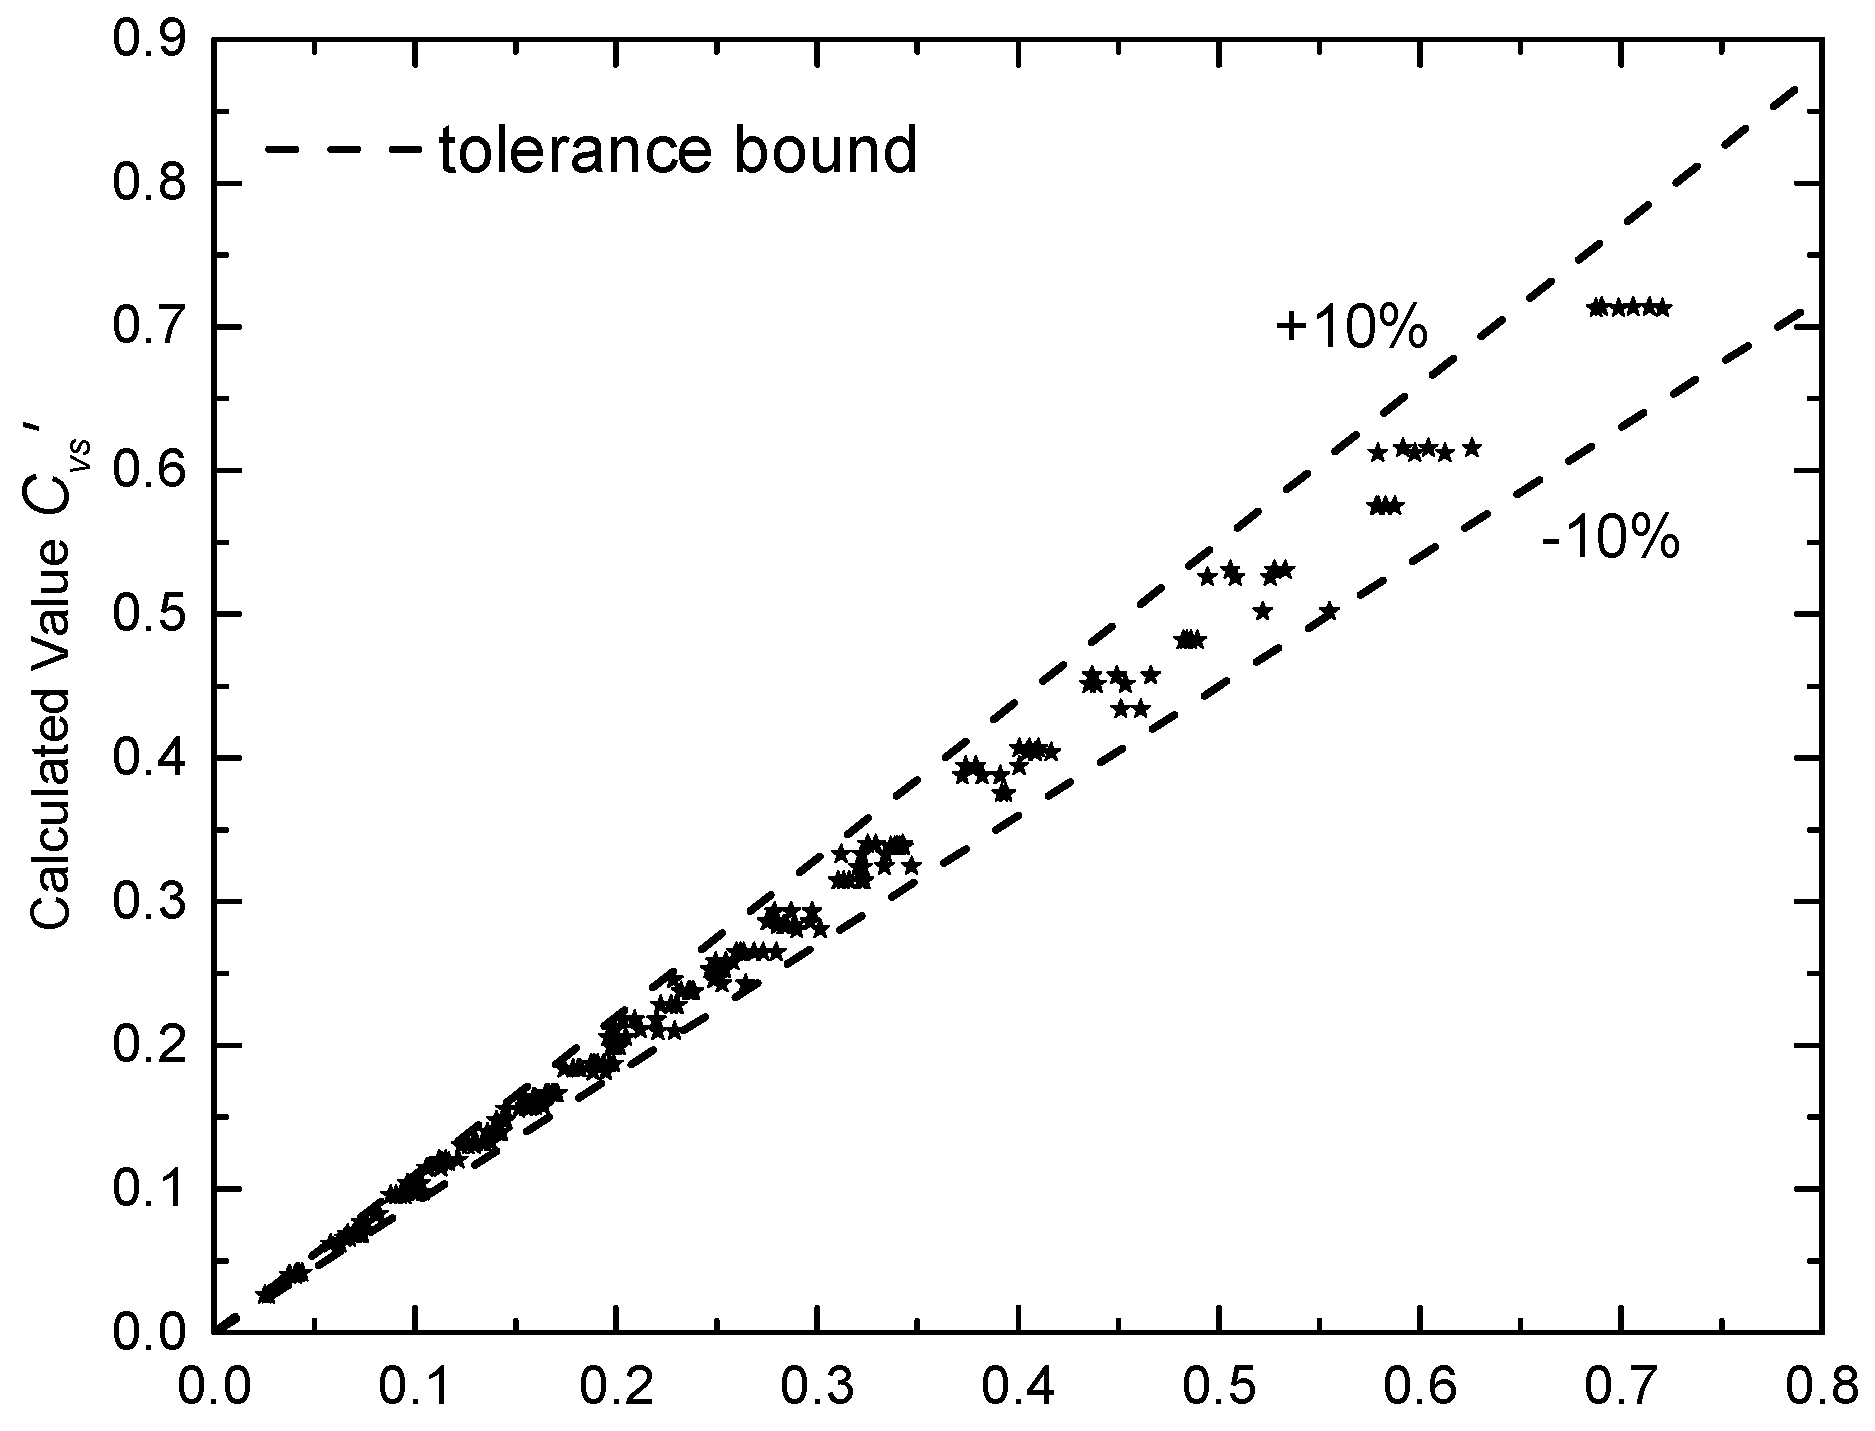
The mechanism of hydraulic collecting is researched by dimensional analysis and experimental studies. The experimental system is established in laboratory to carry out three kinds of tests including 253 different test cases. The results show that the vertical suction force coefficient (Cvs) decreases exponentially with the ratio of bottom clearance to diameter of the particle (h/d, range from 1.875 to 3.472), increases linearly with the ratio of diameter of the suction pipe to diameter of the particle (D/d, range from 1.875 to 3.472), and is nearly independent of Reynolds number (Re, range from 30,581 to 61,162). The empirical formula of vertical force of particles is obtained with respect to h/d and D/d, and the maximum tolerance is less than 10%.
The empirical formula of vertical force of particles in suction flow field is further verified by the vertical incipient motion tests. The criterion-formula of vertical incipient motion of particles is obtained to predict the collecting performance with the maximum tolerance less than 15%. As a result, it is feasible to provide sufficient suction force and avoid unnecessary disturbance by predicting the performance of collecting accurately. By comparing experiments on single and multiple particles, the correspondence of both incipient motion characteristics is obtained, and thus the research on a single particle could reveal some principles of multiple particles. In addition, the phenomenon that the vortex could help strengthen the suction force is observed in the tests.
The characteristics of suction flow field were observed by flow visualization tests. It is found that the wake vortex separation point is near the top of the particle and very small area on the particle is influenced by the unstable wake vortex. This physical phenomenon could contribute to the result that the Cvs in a suction flow is much smaller than the Cd in a uniform flow and explain why the flow field around the particle is stable enough to guarantee the good repeatability in tests.

Author Contributions

Conceptualization, G.Z. and L.X.; Data curation, G.Z. and M.Z.; Formal analysis, G.Z. and M.Z.; Investigation, G.Z., L.X., T.P. and M.Z.; Methodology, G.Z., L.X., T.P. and M.Z.; Resources, L.X. and T.P.; Supervision, L.X. and T.P.; Validation, G.Z., L.X., T.P. and M.Z.; Visualization, G.Z.; Writing—original draft, G.Z., L.X. and M.Z.

Funding

This research was funded by the National Key Research and Development Program of China, grant number 2016YFC0304103 and the APC was funded by the National Key Research and Development Program of China.

Acknowledgments

The present work is supported by the National Key Research and Development Program of China (2016YFC0304103). The support is gratefully acknowledged.

Conflicts of Interest

The authors declare no conflict of interest.

Abbreviations

The following abbreviations are used in this article:
Cvsvertical suction force coefficient
Ddiameter of suction pipe
DESDetached Eddy Simulation
ddiameter of particle
Fvertical suction force of particle
FBbuoyancy in water
FrFroude number
Ggravity of particle
hbottom clearance
IKSInstitut für Konstruktion
LESLarge Eddy Simulation
NIOTNational Institute of Ocean Technology
OMIOcean Management Incorporated
ReReynolds number
REErare earth element
vflow velocity in pipe
ρdensity of particle
ρwdensity of water
μdynamic viscosity coefficient

References

  1. Bury, J. Mining mountains: neoliberalism, land tenure, livelihoods, and the new Peruvian mining industry in Cajamarca. Environ. Plan. A 2005, 37, 221–239. [Google Scholar] [CrossRef]
  2. Mero, J.L. The mineral resources of the sea. Elsevier Oceanogr. Ser. 1965, 1, 1–5. [Google Scholar]
  3. Willums, J.O.; Bradley, A. MIT’s deep sea mining project. In Proceedings of the 6th Offshore Technology Conference, Houston, TX, USA, 6–8 May 1974; pp. 1072–1076. [Google Scholar]
  4. Chung, J.S. Deep-Ocean Mining Issues and Ocean Mining Working Group (OMWG). In Proceedings of the 3rd ISOPE Ocean Mining Symposium, Goa, India, 8–10 November 1999. [Google Scholar]
  5. Chung, J.S. Deep-ocean Mining Technology: Development II. In Proceedings of the 6th ISOPE Ocean Mining Symposium, Changsha, China, 9–13 October 2005; pp. 1–6. [Google Scholar]
  6. Chung, J.S. Deep-ocean mining technology III: Developments. In Proceedings of the 8th ISOPE Ocean Mining Symposiumth, Osaka, Japan, 20–24 September 2009. [Google Scholar]
  7. Chung, J.S. Advances in manganese nodule mining technology. Mar. Technol. Soc. J. 1985, 19, 39–44. [Google Scholar]
  8. Herrouin, G.; Lenoble, J.P.; Charles, C.; Mauviel, F.; Bernard, J.; Taine, B. A Manganese Nodule Industrial Venture Would Be Profitable: Summary of a 4-Year Study in France. In Proceedings of the Offshore Technology Conference, Houston, TX, USA, 1–4 May 1989. [Google Scholar]
  9. Boetius, A.; Haeckel, M. Mind the seafloor. Science 2018, 359, 34–36. [Google Scholar] [CrossRef] [PubMed]
  10. Ma, W.; Schott, D.; Lodewijks, G. A new procedure for deep sea mining tailings disposal. Minerals 2017, 7, 47. [Google Scholar] [CrossRef]
  11. McFarlane, J.; Brockett, T.; Huizingh, J.P. Analysis of Mining Technologies Developed in the 1970s and 1980s; International Seabed Authority: Kingston, Jamaica, 2008. [Google Scholar]
  12. Hong, S.; Choi, J.S.; Kim, J.H.; Yang, C.K. Experimental study on hydraulic performance of hybrid pick-up device of manganese nodule collector. In Proceedings of the Third ISOPE Ocean Mining Symposium, Goa, India, 8–10 November 1999; pp. 69–77. [Google Scholar]
  13. Yang, N.; Tang, H. Several considerations of the design of the hydraulic pick-up device. In Proceedings of the Fifth ISOPE Ocean Mining Symposium, Tsukuba, Japan, 15–19 September 2002; pp. 119–122. [Google Scholar]
  14. Tsutsui, T. Flow around a sphere in a plane turbulent boundary layer. J. Wind Eng. Ind. Aerodyn. 2008, 96, 779–792. [Google Scholar] [CrossRef]
  15. Lim, S.J.; Kim, J.W.; Jung, S.T.; Cho, H.Y.; Lee, S.H. Deep Seawater flow Characteristics around the Manganese Nodule Collecting Device. Procedia Eng. 2015, 16, 544–551. [Google Scholar] [CrossRef]
  16. Zhao, G.; Xiao, L.; Lu, H.; Chen, Z. A Case Study of Hydraulic Collecting a Single Spherical Particle. In Proceedings of the 27th International Ocean and Polar Engineering Conference, San Francisco, CA, USA, 25–30 June 2017; pp. 30–38. [Google Scholar]
  17. Chung, J.S.; Yarim, G.; Savasci, H. Shape effect of solids on pressure drop in a 2-phase vertically upward transport: silica sands and spherical beads. In Proceedings of the Eighth International Offshore and Polar Engineering Conference, Montreal, PQ, Canada, 24–29 May 1998; Volume 1, pp. 58–65. [Google Scholar]
  18. Sobota, J.; Boczarski, S.; Petryka, L.; Kotlinski, R.; Stoyanova, V. Slip Velocity in Nodules Vertical Flow-Experimental Results. In Proceedings of the Fourth ISOPE Ocean Mining Symposium, Szczecin, Poland, 23–27 September 2001; pp. 127–131. [Google Scholar]
  19. Jiang, L.; Li, P.; Tian, L.; Han, W. Concentration Characteristics of Large-Size Particles in Vertical Pipes for Hydraulic Lifting. In Proceedings of the Sixth ISOPE Ocean Mining Symposium, Changsha, China, 9–13 October 2005; pp. 106–109. [Google Scholar]
  20. Jiang, L.; Li, P.; Tian, L.; Han, W. Experiment Study on Critical Velocity in Vertical Pipes for Hydraulic Lifting. In Proceedings of the Sixth ISOPE Ocean Mining Symposium, Changsha, Hunan, China, 9–13 October 2005; pp. 115–118. [Google Scholar]
  21. Yang, N.; Chen, G.; Tang, D.; Jin, X.; Xiao, H. Behavior of single particle and group particles in vertical lifting pipe in China. In Proceedings of the Ninth ISOPE Ocean Mining Symposium, Maui, HI, USA, 19–24 June 2011; pp. 153–157. [Google Scholar]
  22. Fan, W.; Chen, J.; Pan, Y.; Huang, H.; Chen, C.T.A.; Chen, Y. Experimental study on the performance of an air-lift pump for artificial upwelling. Ocean Eng. 2013, 59, 47–57. [Google Scholar] [CrossRef]
  23. Pougatch, K.; Salcudean, M. Numerical modelling of deep sea air-lift. Ocean Eng. 2008, 35, 1173–1182. [Google Scholar] [CrossRef]
  24. Ma, W.; van Rhee, C.; Schott, D. Technological and Profitable Analysis of Airlifting in Deep Sea Mining Systems. Minerals 2017, 7, 143. [Google Scholar]
  25. Achenbach, E. Experiments on the flow past spheres at very high Reynolds numbers. J. Fluid Mech. 1972, 54, 565–575. [Google Scholar] [CrossRef]
  26. Johnson, T.A.; Patel, V.C. Flow past a sphere up to a Reynolds number of 300. J. Fluid Mech. 1999, 378, 19–70. [Google Scholar] [CrossRef]
  27. Constantinescu, G.S.; Squires, K.D. LES and DES investigations of turbulent flow over a sphere at Re = 10,000. Flow Turbul. Combust. 2003, 70, 267–298. [Google Scholar] [CrossRef]
  28. Hein, J.R.; Koschinsky, A. Deep-ocean ferromanganese crust and nodules. In Earth Systems and Environmental Sciences, Treatise on Geochemistry, 2nd ed.; Holland, H., Turekian, K., Eds.; Elsevier: Amsterdam, The Netherlands, 2013; pp. 273–291. [Google Scholar]
  29. Hein, J.R.; Mizell, K.; Koschinsky, A.; Conrad, T.A. Deep-ocean mineral deposits as a source of critical metals for high- and green-technology applications: comparison with land-based resources. Ore Geol. Rev. 2013, 51, 1–14. [Google Scholar] [CrossRef]
  30. Blöthe, M.; Wegorzewski, A.V.; Müller, C.; Simon, F.; Kuhn, T.; Schippers, A. Manganese-cycling microbial communuties inside deep-sea manganese nodules. Environ. Sci. Technol. 2015, 49, 7692–7700. [Google Scholar] [CrossRef] [PubMed]
  31. Von Stackelberg, U. Growth history of manganese nodules and crusts of the Peru Basin. In: Manganese mineralization: Geochemistry and mineralogy of terrestrial and marine deposits. Geol. Soc. Spec. Publ. 1997, 119, 153–176. [Google Scholar] [CrossRef]
  32. Moritani, T. Description, classification, and distribution of manganese nodules. Geol. Surv. Japan Cruise Rep. 1977, 8, 136–158. [Google Scholar]
  33. Atmanand, M.A.; Shajahan, M.A.; Deepak, C.R.; Jeyamani, R.; Ravindran, M.; Schulte, E.; Panthel, J.; Grebe, H.; Schwarz, W. Instrumentation for underwater crawler for mining in shallow waters. In Proceedings of the International Symposium of Autonomous Robots and Agents, Singapore City, Singapore, 26 May 2000. [Google Scholar]
  34. Bakić, V.; Perić, M. Vizualization of Flow around a Sphere for Reynolds Numbers between 22,000 and 400,000. Therm. AeroMechanism 2005, 12, 307–315. [Google Scholar]
Figure 1. High abundance of large nodules on the seafloor of the Peru Basin (ca. 4000 m water depth) [28].
Energies 11 01938 g001
Figure 2. (a) Underwater mining system with manipulator and cutter for 500 m water depth; (b) Enhanced underwater mining system for 500 m water depth [33].
Energies 11 01938 g002
Figure 3. A Kind of hydraulic collecting model.
Energies 11 01938 g003
Figure 4. Main parameters of the model.
Energies 11 01938 g004
Figure 5. (a) Sketch of vertical force tests and (b) vertical incipient motion tests.
Energies 11 01938 g005
Figure 6. (a) Overlook of the test system; (b) Front view of the suction part.
Energies 11 01938 g006
Figure 7. Target value (56.55 t/h) and experimental value of the flow quantity.
Energies 11 01938 g007
Figure 8. Relations between vertical suction force coefficients and Reynolds numbers.
Energies 11 01938 g008
Figure 9. Relations between vertical suction force coefficients and ratios of D to d.
Energies 11 01938 g009
Figure 10. Relations between vertical suction force coefficients and ratios of h to d.
Energies 11 01938 g010
Figure 11. Relations between ln(Cvs) and h/d.
Energies 11 01938 g011
Figure 12. Relations among Cvs, h/d and D/d.
Energies 11 01938 g012
Figure 13. Tolerance between calculated Cvs and measured Cvs for 234 cases.
Energies 11 01938 g013
Figure 14. Relations between Cvs and 1/Fr2.
Energies 11 01938 g014
Figure 15. A snapshot of multiple particles without circular motion.
Energies 11 01938 g015
Figure 16. A snapshot of multiple particles with circular motion.
Energies 11 01938 g016
Figure 17. (a) Velocity vector distribution from numerical solution (h = 0.07 m, v = 2 m/s, Re = 61162) [16]; (b) Flow visualization results (h = 0.07 m, v = 2 m/s, Re = 61162).
Energies 11 01938 g017
Figure 18. Flow visualization results for flow around a sphere in the uniform flow (Re = 50,000) [34] (a); and the suction flow (Re = 50,000) (b).
Energies 11 01938 g018
Table 1. Definition of main parameters.
Physical ParameterUnitDefinition
dmDiameter of particle
hmBottom clearance 1
DmDiameter of suction pipe
FNVertical suction force of particle
FBNBuoyancy in water
GNGravity of particle
ρkg/m3Density of particle
ρwkg/m3Density of water
vm/sFlow velocity in pipe
1 Bottom clearance h: Indicate the vertical height of the suction pipe; use the vertical distance from the pipe inlet to the bottom boundary.
Table 2. Parameters for vertical incipient motion tests of single particle.
Physical ParameterUnitValue
Particle density ρkg/m32164.5, 2495.7
Particle diameter dm0.040, 0.036, 0.035
Pipe diameter Dm0.100, 0.075
Ratio of diameter D/d 1.87, 2.50, 2.78, 2.89
Flow velocity in pipe vm/s2, 1.8, 1.6
Dynamic viscosity coefficient μPa·s1.308 × 10−3
Table 3. Parameters for vertical incipient motion tests of multiple particles.
Physical ParameterUnitValue
Particle diameter dm0.019, 0.025, 0.030, 0.039
Particle weight GN0.092, 0.194, 0.352, 0.792
Pipe diameter Dm0.1
Ratio of diameter D/d 5.21, 4.06, 3.33, 2.54
Flow velocity in Pipe vm/s2
Table 4. Experimental parameters for flow visualization tests.
Physical ParameterUnitCase1Case2
Bottom clearance hm0.070.07
Flow velocity in Pipe vm/s2.0001.635
Reynolds number Re 61,16250,000
Table 5. Linear fitting parameters of ln(Cvs)~h/d.
D/dSlope kIntercept bR2
3.906−1.9812.4930.9998
3.472−2.152.6350.9998
3.125−2.282.7760.9995
2.778−2.5352.9720.9999
2.5−2.7513.1530.9995
2.344−2.93.2480.9996
1.875−3.5283.7940.9996
Table 6. Exponential fitting relations between parameters and D/d.
Fitting FormulaR2
k = −5.7005(D/d)−0.78760.9958
b = 5.3305(D/d)−0.56690.9944
Table 7. Results of single particle tests.
D/d5.214.053.322.54
hi (i = 1, 2, …, 10)d19.2d24.7d30.1d39.4
h1 (mm)59.8160.7665.0069.32
h2 (mm)62.861.1666.4469.46
h3 (mm)69.1863.0067.4570.45
h4 (mm)84.5363.8368.5171.86
h5 (mm)61.1860.9466.2369.39
h6 (mm)63.5761.8266.5269.57
h7 (mm)65.2861.8666.8669.71
h8 (mm)73.7763.5867.6370.79
h9 (mm)65.7762.2366.9269.81
h10 (mm)67.8162.666.9869.89
h ¯ (mm)67.3762.1866.8570.03
Standard deviation (mm)6.901.020.930.80
Table 8. Results of multiple particle tests.
D/d5.214.053.322.54
No.i, hi (i = 1, 2…,10)d19.2d24.7d30.1d39.4
No.12nd3rd4th1st
h1 (mm)70.3263.9060.3370.32
No.21st2nd4th3rd
h2 (mm)88.1688.1661.5468.23
No.32nd4th3rd1st
h3 (mm)65.7962.1262.1267.84
No.42nd3rd3rd1st
h4 (mm)64.2464.2464.2468.17
No.54th2nd3rd1st
h5 (mm)63.8266.2566.2567.50
No.61st3rd4th2nd
h6 (mm)83.3864.2961.0668.47
No.71st3rd3rd4th
h7 (mm)69.6061.2261.2259.78
No.82nd4th3rd1st
h8 (mm)68.9263.8263.8268.92
No.92nd4th3rd1st
h9 (mm)67.5959.6361.0367.59
No.101st3rd4th2nd
h10 (mm)91.8560.7260.7270.65

