1. Introduction
During the past years, the marine controlled source electromagnetic (CSEM) method has been applied for hydrocarbon exploration. This CSEM method distinguishes the difference between hydrocarbon-saturated rocks and water-filled rocks. The electromagnetic (EM) fields propagate into the subsurface through the sea water, and the measurements at the receivers detect the signal reflection at different locations and depths. The history and detailed description of marine CSEM have been given by MacGregor and Sinha [
1], Edwards [
2], Constable and Srnka [
3], and MacGregor and Tomlinson [
4].
In hydrocarbon exploration, marine CSEM is commonly applied as Seabed Logging (SBL) [
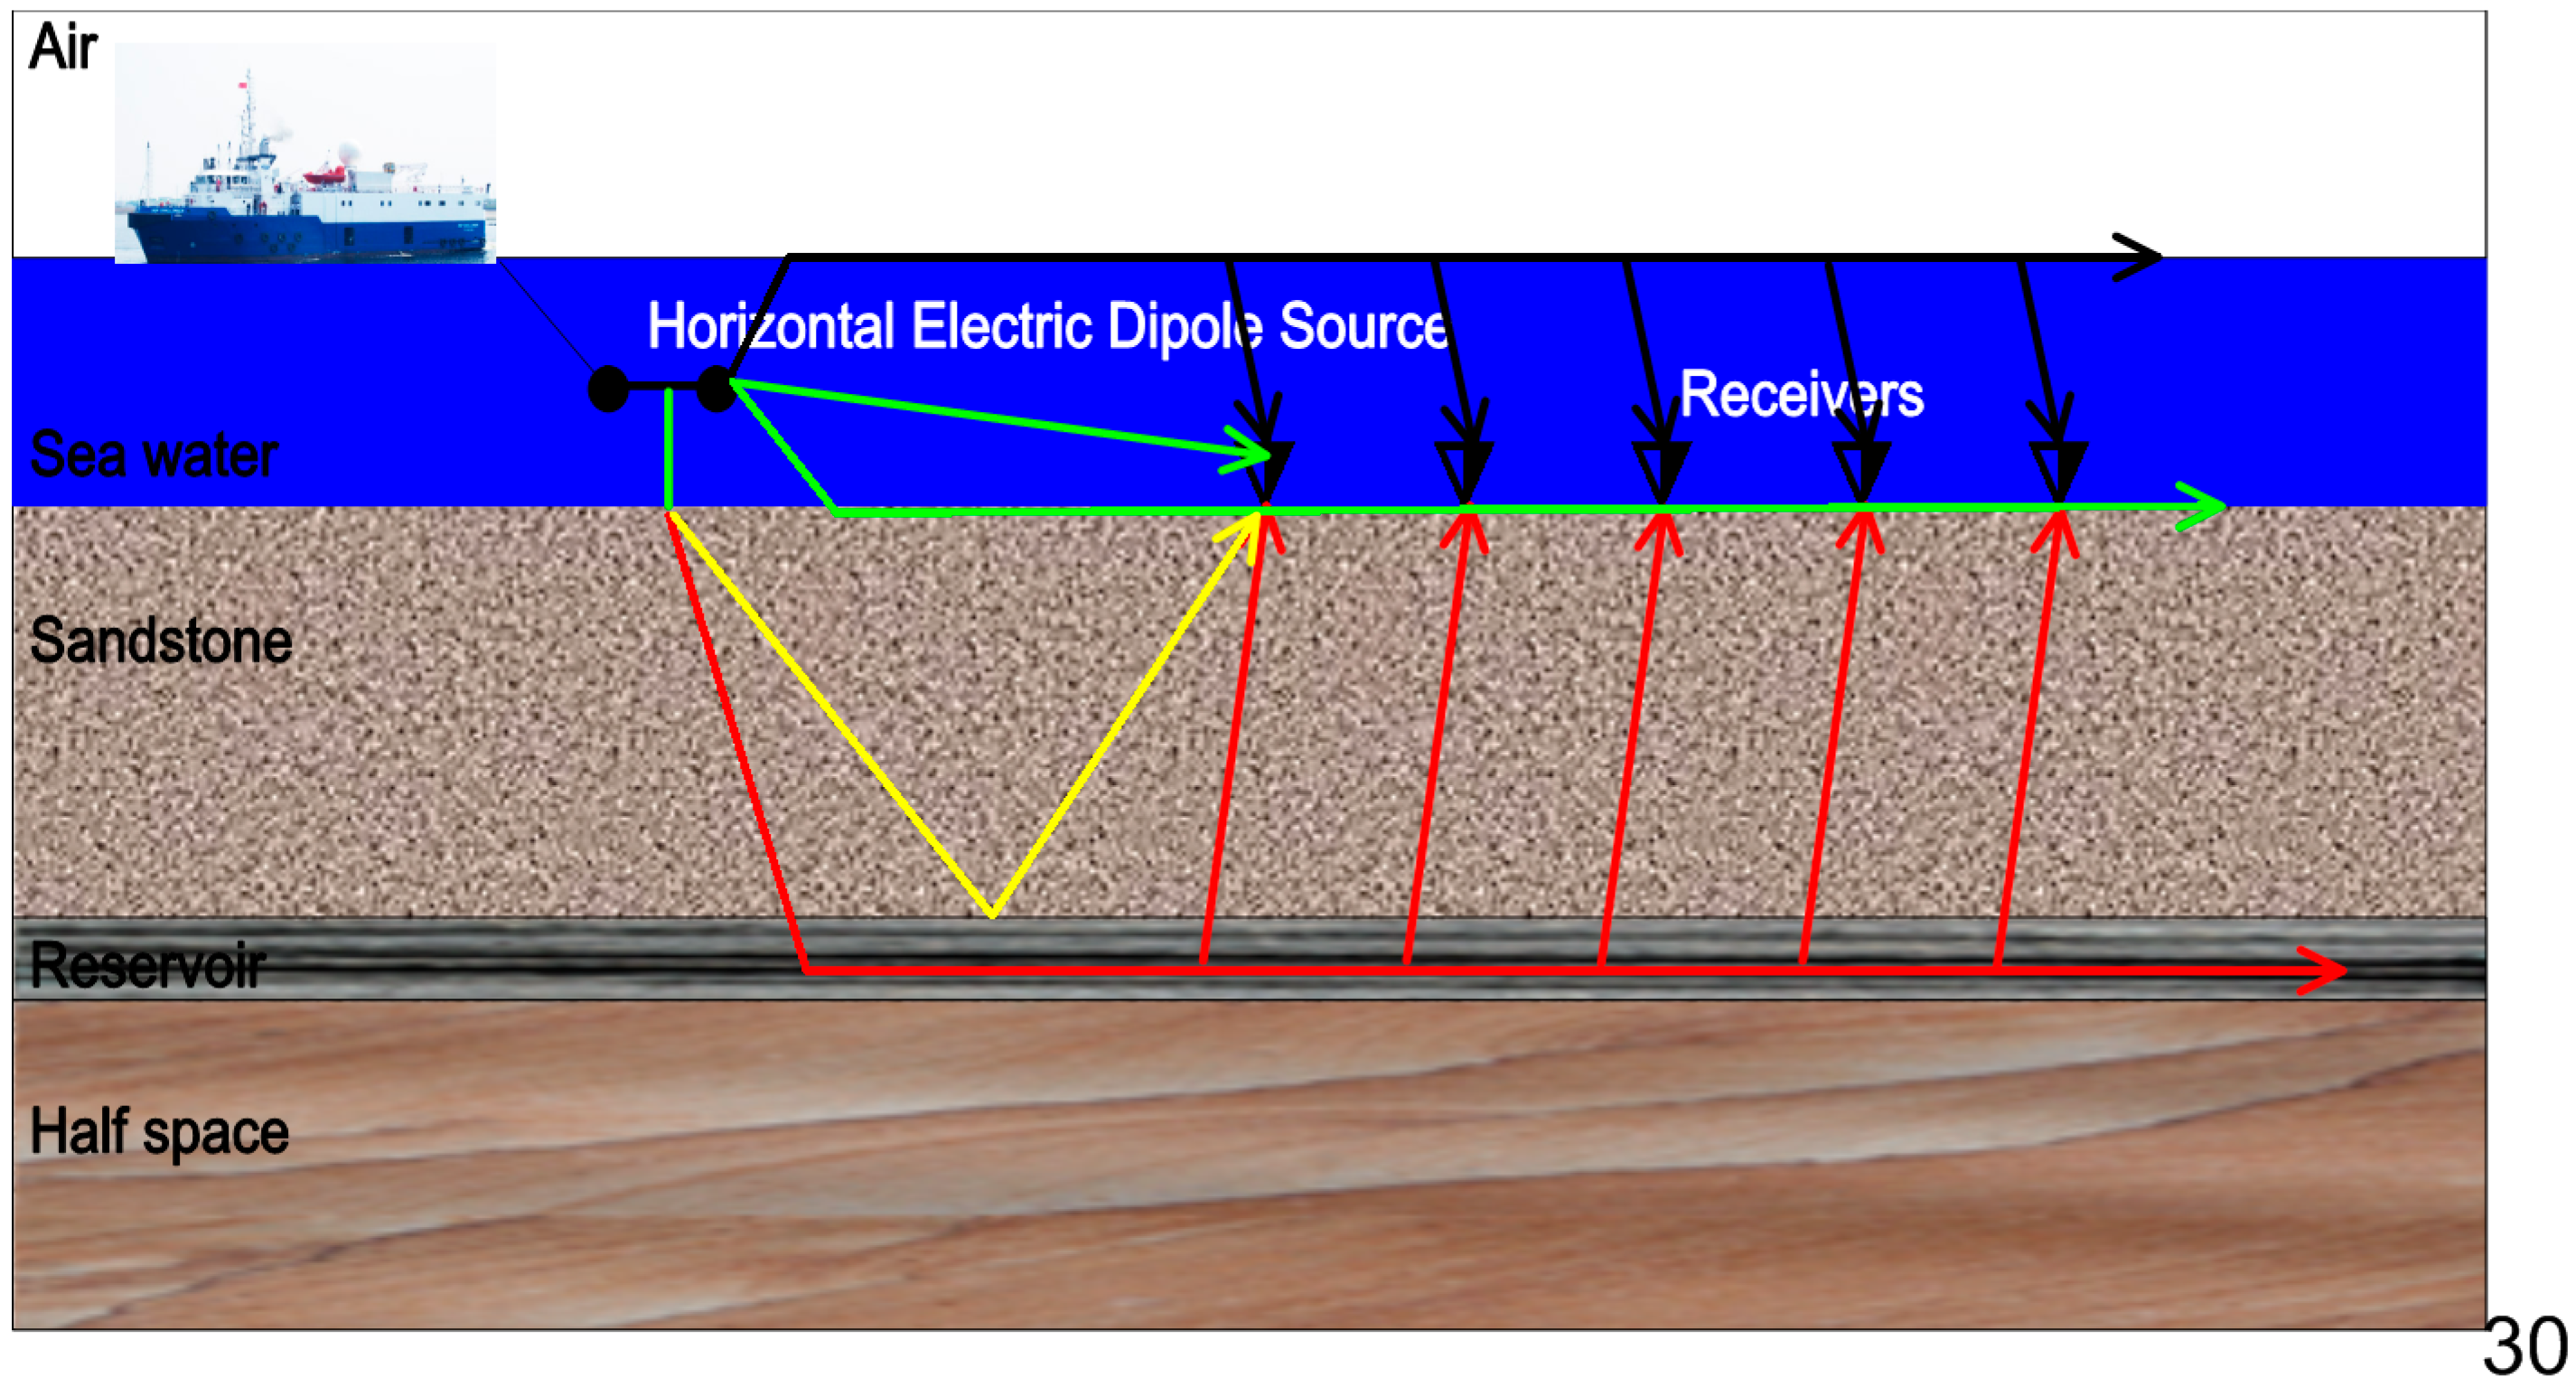
5]. A mobile horizontal electric dipole (HED) source has been towed over an array of seafloor receivers (
Figure 1). The HED source emitted a low frequency electromagnetic signal. The signal diffused outwards into the overlying water column, and it also diffused downwards into the seabed. Normally, the HED source was towed 30 or 50 m above the seafloor. A shallow towed source system was also described by Barker et al. [
6]. The receiver array on the seafloor measured both the amplitude and the phase of the received signal, which depended on the resistivity structure beneath the seabed. Each receiver arm was 10 m in length, and the distance between the two neighbor receivers was around 1–3 km. Concerning the receiver spacing, MacGregor and Tomlinson [
4] discussed this by using the unconstrained inversion of inline synthetic data.
A towed streamer electromagnetic (EM) data acquisition system has been applied in the North Sea [
7,
8], which was suitable for characterization of the subsurface as a successful case in the Troll field, North Sea [
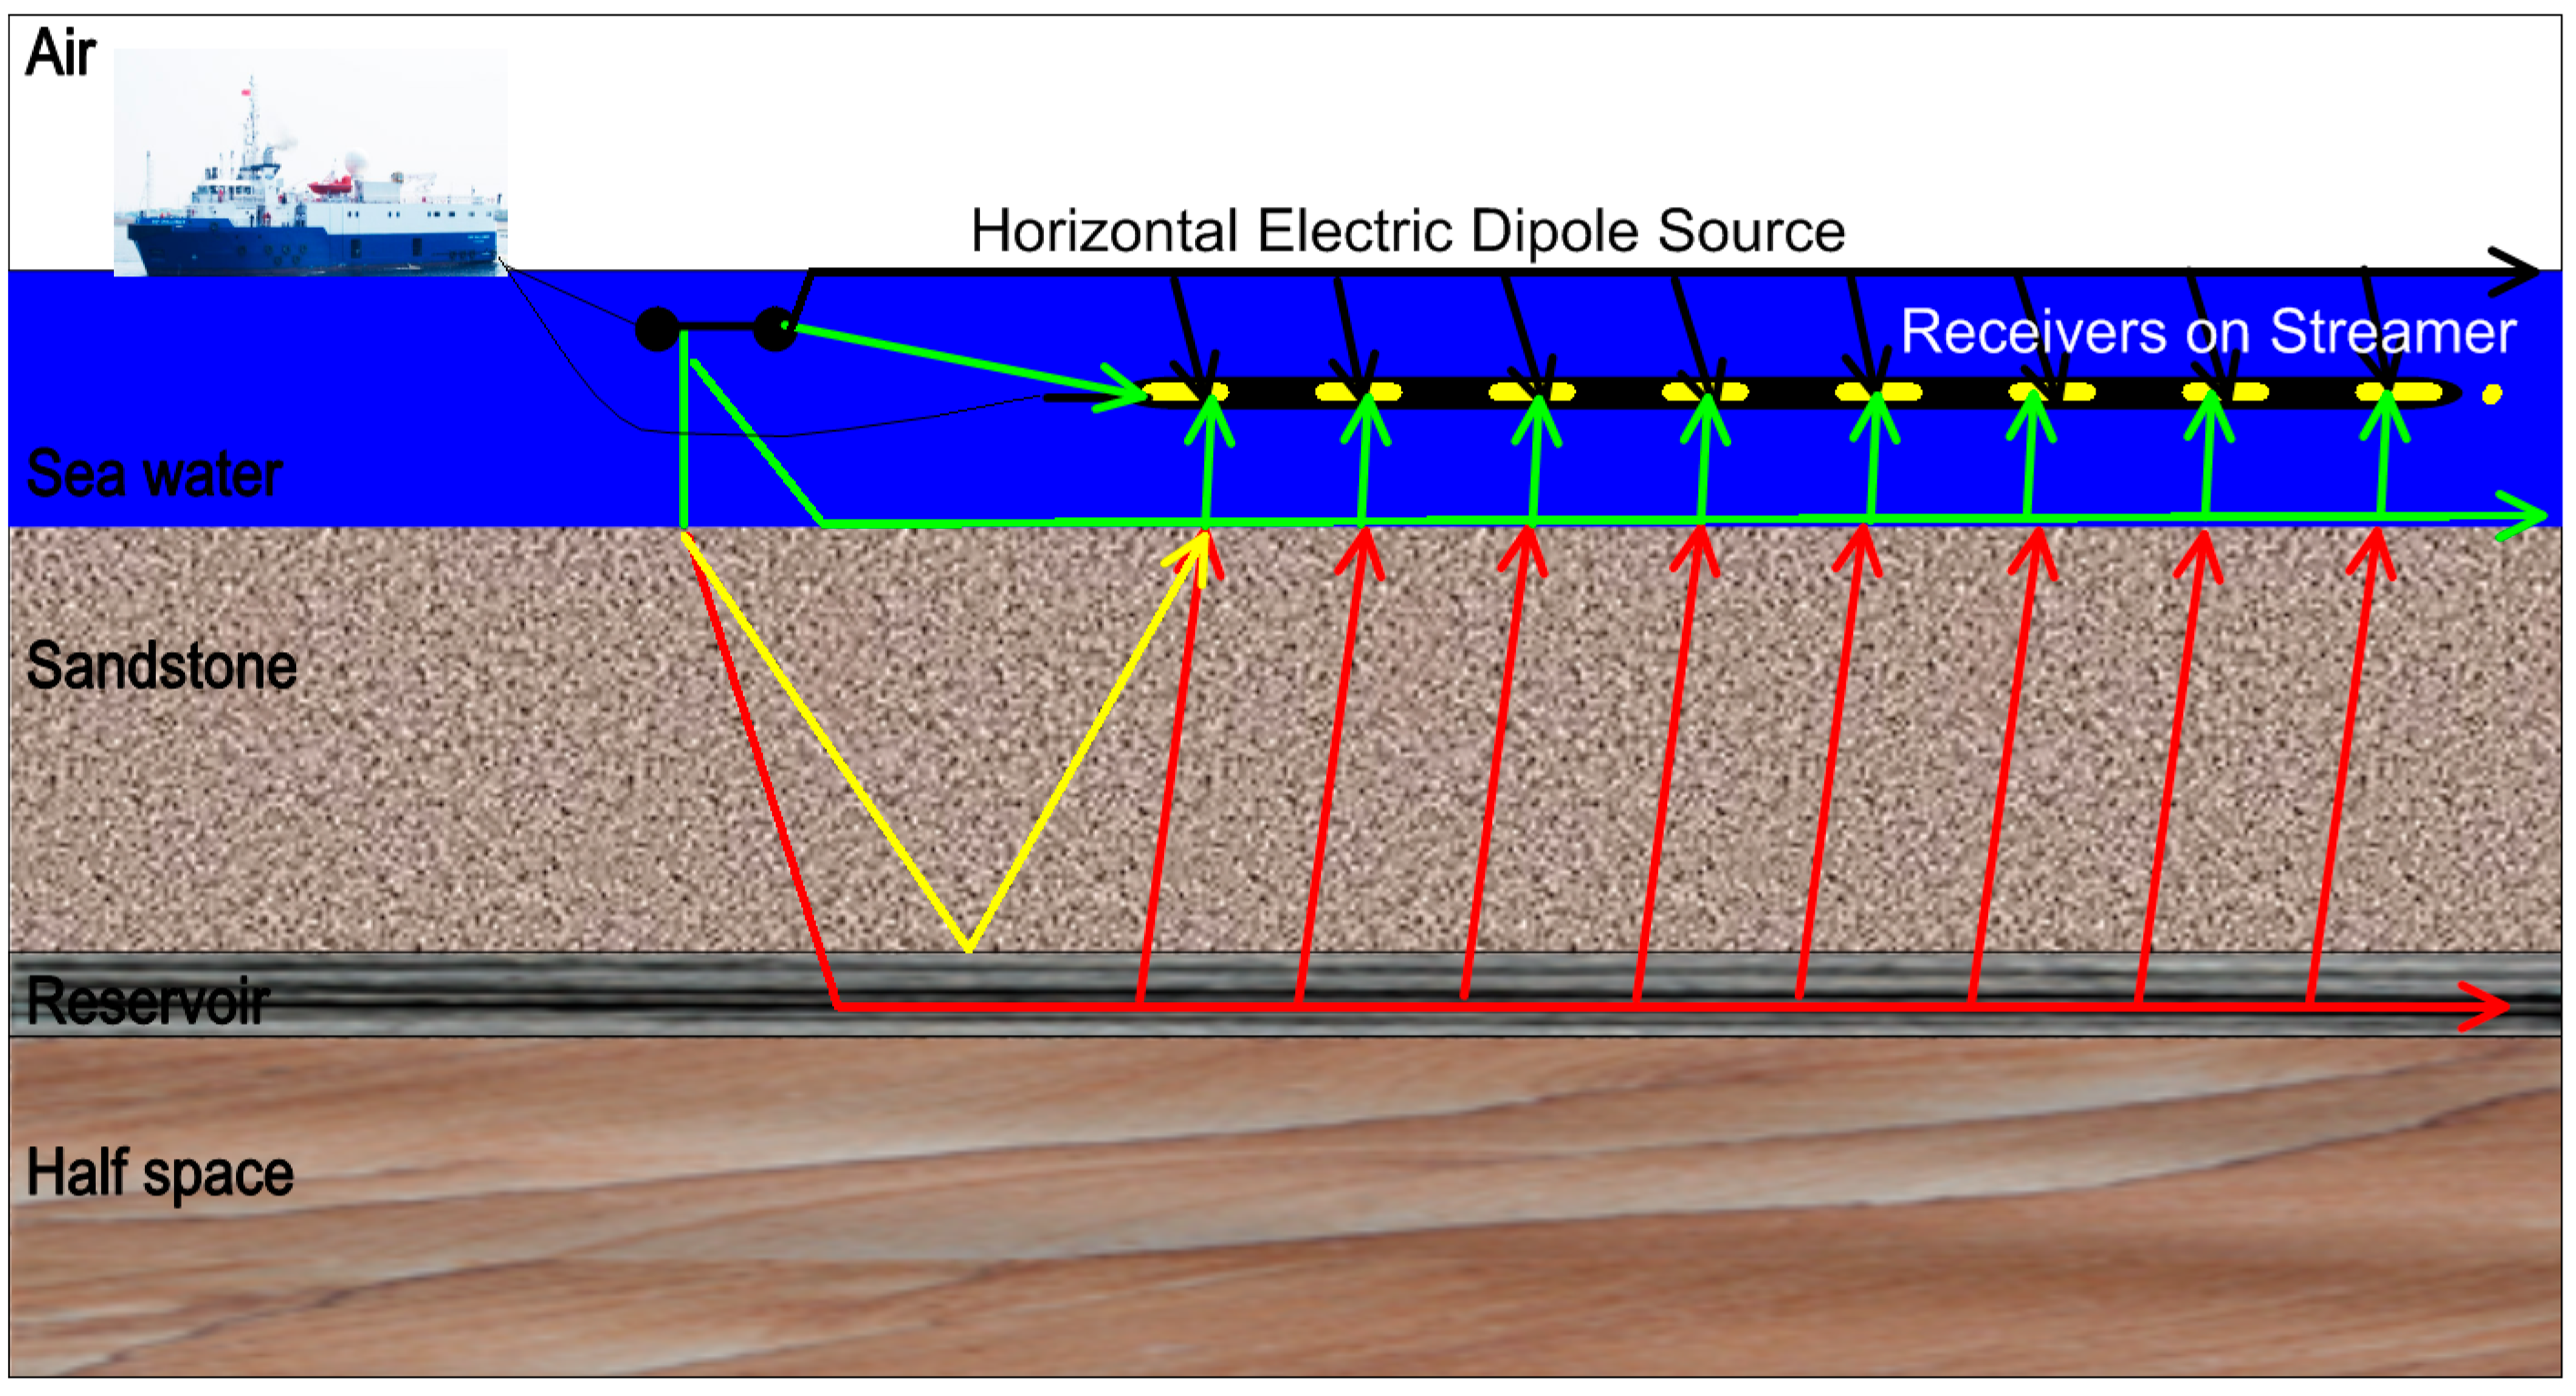
9]. Similar to the towed streamer seismic survey, the towed streamer electromagnetic (TSEM) system was given as in
Figure 2, which deployed a receiver streamer at a 100m depth. A powerful HED source was towed at a 10 m depth to the surface. The offset ranged from 500–7595 m. The receiver pair electrodes lengths were between 200–1100 m, which increased with offsets. The long receiver bipoles provided high sensitivity measurements. The 800 m long source bipole emitted the signal with a current of 1500 A as normal [
10].
The detection capability of the two measuring systems could be estimated by sensitivity studies, e.g., using the normalized magnitude ratio like in Mittet [
11]. For our tests, the sensitivity to the target was defined by Mittet and Morten [
12] to compare the detection capability. The definition was the ratio between the amplitude of the scattered field and the estimated measurement uncertainty. Uncertainty in marine CSEM data included measurement noise and uncertainty of the transmitter and receiver. These uncertainties were from the positions, directions, calibrations, timing, and so on. The noise comes from the self noise, motion noise, swell noise, and Magnetotelluric (MT) noise. Quantitative uncertainties were estimated as a function of offset and frequency, and analyzed by inversion [
13,
14].
Modeling and inversion were another way to evaluate the marine CSEM methods. Shantsev [
15] compared surface towing and deep towing source approaches for acquiring marine CSEM surveys by using 3D modeling and 2.5D inversion, with different frequencies, target depths, and water depths.
The detection capability of different CSEM data acquisition systems was dependent on both environment and equipment, such as water depth, overburden depth, reservoir thickness, background and reservoir resistivity, frequency, offset, noise floor, and uncertainties. MacGregor and Tomlinson provided a tutorial on the marine CSEM method to show four different types of CSEM data acquisition systems, including SBL and TSEM systems [
4]. They studied the sensitivity of a CSEM survey to the reservoir properties and background resistivity by using transverse resistance.
In this paper, the advantages of each method were compared by using 1D sensitivity modeling, 2D modeling, and inversion. An anomaly transverse resistance ratio is defined to evaluate the 2D inversion results of resistivity. We test the comparison by using the same resistivity model to find the sensitivity of two data acquisition systems in different environments. A thin layered 2D model is built to test the horizontal resolution of the CSEM data inversion. Lastly, we analyze the detectability of these two systems by using Occam’s inversion and the anomaly transverse resistance ratio.
2. Method
We simulated synthetic data by a 1D simple model to investigate the effects of parameters, such as reservoir depth, frequency, and offset, on the CSEM data. The synthetic data were also inverted by 2D Occam’s inversion. Firstly, we compare the sensitivity to a buried thin reservoir for various frequencies and offsets. Then, the sensitivity to a thin reservoir is compared at different depths. Finally, an analytic expression for depth resolution is given by using the CSEM inversion with reservoirs buried at different depths.
2.1. Senstivity
A measure of sensitivity is defined by Mittet and Morten [
16].
where
ΔEx is the scattered field, which is calculated by the target response minus the background response;
δEx is the uncertainty of measurement,
rr and
rs are the receiver and source positions, respectively; and
is the angular frequency.
An approximate formula for measurement uncertainty is given as [
12,
17]:
where factor α is the relative uncertainty in the electric field amplitude, and Factorαis the relative uncertainty in the electrical field amplitude. In this paper,
α ≈ 1% is given as a constant [
14].
is the
ith target response. In order to create the synthetic data, random noise
N is added to the data. The noise
N is related to frequency and offset.
For the SBL system, the contributions of noise
N vary with depth. Mittet and Morten presented some typical values [
16], which are used in this paper for the SBL system, and the noise
N by Mattson et al. [
18] isused for the TSEM system. In their article, Mattson et al. presented the noise reduction techniques tailored for TSEM data.
2.2. Occam’s Inversion
In order to compare the data acquired by the SBL and TSEM systems, we employed the MARE2DEM code [
19,
20], which is an implementation of the Occam inversion algorithm [
21]. Occam’s inversion was introduced by Key [
22] to solve the regularized problem of marine CSEM problems. The inversion objective function and root mean squared (RMS) misfit were described by Key [
22].
The objective function is given as:
where
W is a diagonal matrix of the data errors,
is the roughness part to smooth the model,
is a parameter for the trade-off between the model and data misfit,
d is the observed data,
is the forward modeling of the conductivity parameter
m, and
is the target misfit.
The normalized root-mean-squared misfit is given as:
where
is the data uncertainty.
2.3. Anomalous Transverse Resistance Ratio
Transverse resistance is defined as the thickness times the resistivity of a resistive layer model confined between two more conductive layers [
23]. Baltar and Roth [
24] defined transverse resistance as the integral of resistivity over depth. They defined an Anomalous Transverse Resistance (
ATR) of the reservoir as:
where ∆
R is the resistivity anomaly due to hydrocarbons.
To some extent, the interest is the CSEM anomaly resistivity variation over a uniform background. Equation (5) can be discretized and simplified to:
where
is the ATR of the resistivity image, and ∆
is the thickness of the hydrocarbon charged reservoir interval. So, we define an ATR ratio as [
25]:
where
is the ATR of the true model, ∆
Rlog is the resistivity anomaly interval, and ∆
log is the thickness of the hydrocarbon reservoir at the well log scale.
3. Results
In order to compare the two systems, we generated synthetic CSEM data with the MARE2DEM code. Six cases are considered (
Table 1).
Firstly, we studied the sensitivity to a buried thin reservoir for different frequencies, offsets, and reservoir burial depths with 1D modeling. Next, we analyzed the effects of reservoir burial depth, reservoir length, and the distance between two adjacent thin layer reservoirs on the resolution by inverting 2D inline synthetic data. Lastly, we studied the detectability of the two acquisition systems by analyzing the inversion results with the help of the ATR ratio.
3.1. 1D Sensitivity Study
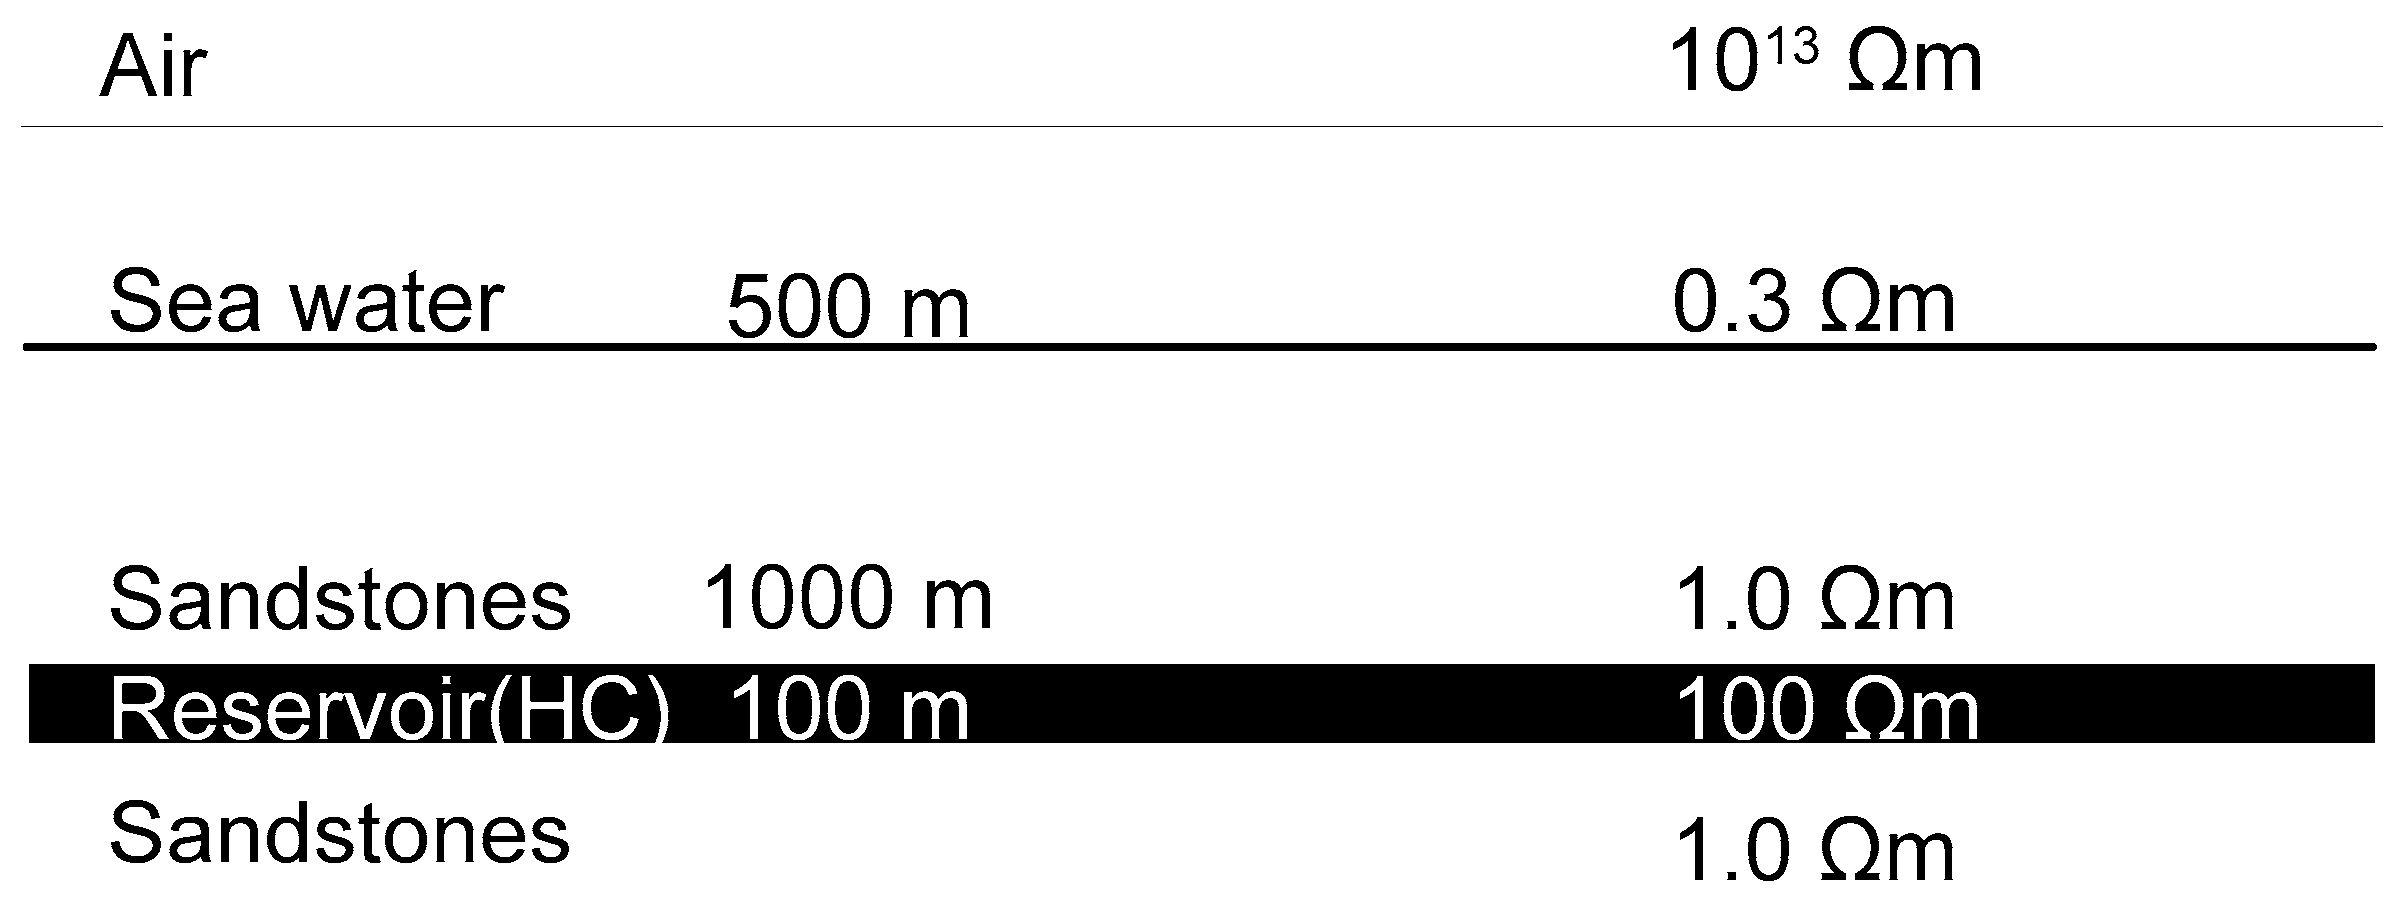
In order to rapidly characterize the sensitivity of marine CSEM, a layer resistivity model was built for Case 1 and Case 2 (
Figure 3). The transmitter was towed 30 m above the seafloor with a 200 m shooting distance for the SBL system. While the transmitter was towed 10 m below the surface with a 250 m shooting distance for the TSEM system. The streamer with receivers was towed 100 m below the surface in the TSEM system. The frequencies were chosen from 0.05 to 0.75 Hz with a 0.05 Hz interval.
3.1.1. Case 1: Effects of Frequency and Offset
The sensitivities variation with frequency and offset are shown in
Figure 4 for a reservoir depth of 2000 m. Due to the limitation of the streamer length in the TSEM system, the maximum offset was 8000 m.
Figure 4a illustrates the sensitivity image as a function of frequency and offset. When the target was buried 2000 m below the seafloor, the receivers could detect the EM signal from the target at double the burial depth. The sensitivity was smaller than 2.0, where the offset was shorter than twice the reservoir depth.
The computed sensitivity for the TSEM system using Equation (1) is shown in
Figure 4b. As mentioned above, the TSEM system had an 800 m long source and source-receiver electrode pairs with lengths between 200 and 1100 m. This meant that accurate modeling required both a bipole source and bipole receivers in the modeling code. In this case, however, we used point dipoles to replace the source and receivers for modeling. For the sensitivity calculations, it was sufficient to apply this first order approximation in this paper.
The high frequency part of the EM field was suppressed by seawater, where the water depth was larger than 500 m. Hence, the sensitivity decreased when the frequencies were larger than 0.4 Hz.
3.1.2. Case 2: Effects of Reservoir Burial Depth
The resistivity model was considered to study the relationship between sensitivity and reservoir depth, which is shown in
Figure 3. The reservoir burial depth was changing for the testing. In these cases, the transmitter frequencies were chosen as 0.25 and 0.75 Hz. The noise
N, which was water-depth-independent, was chosen as 10
−15 V/Am
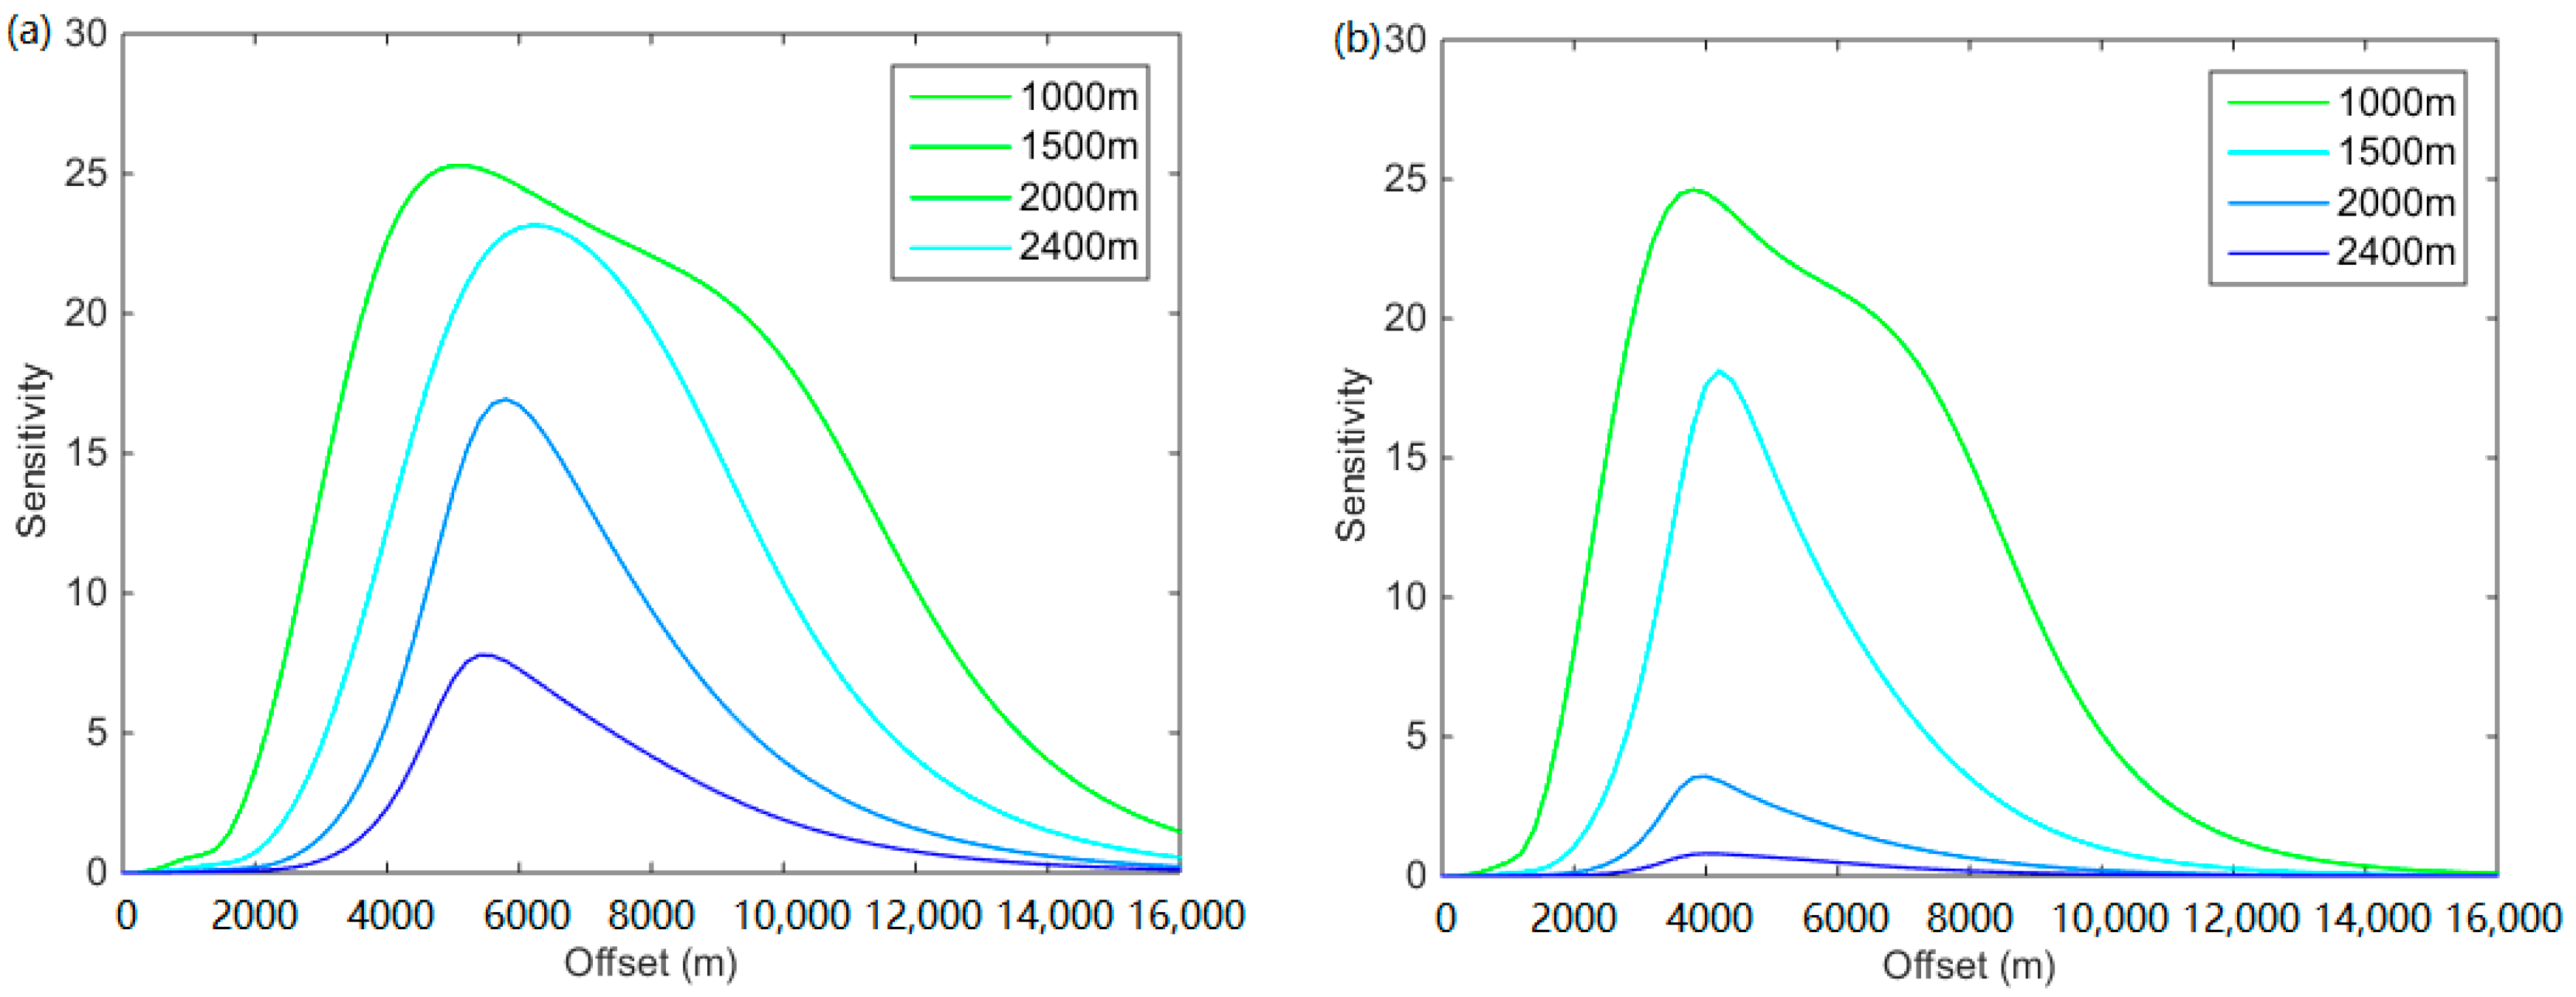
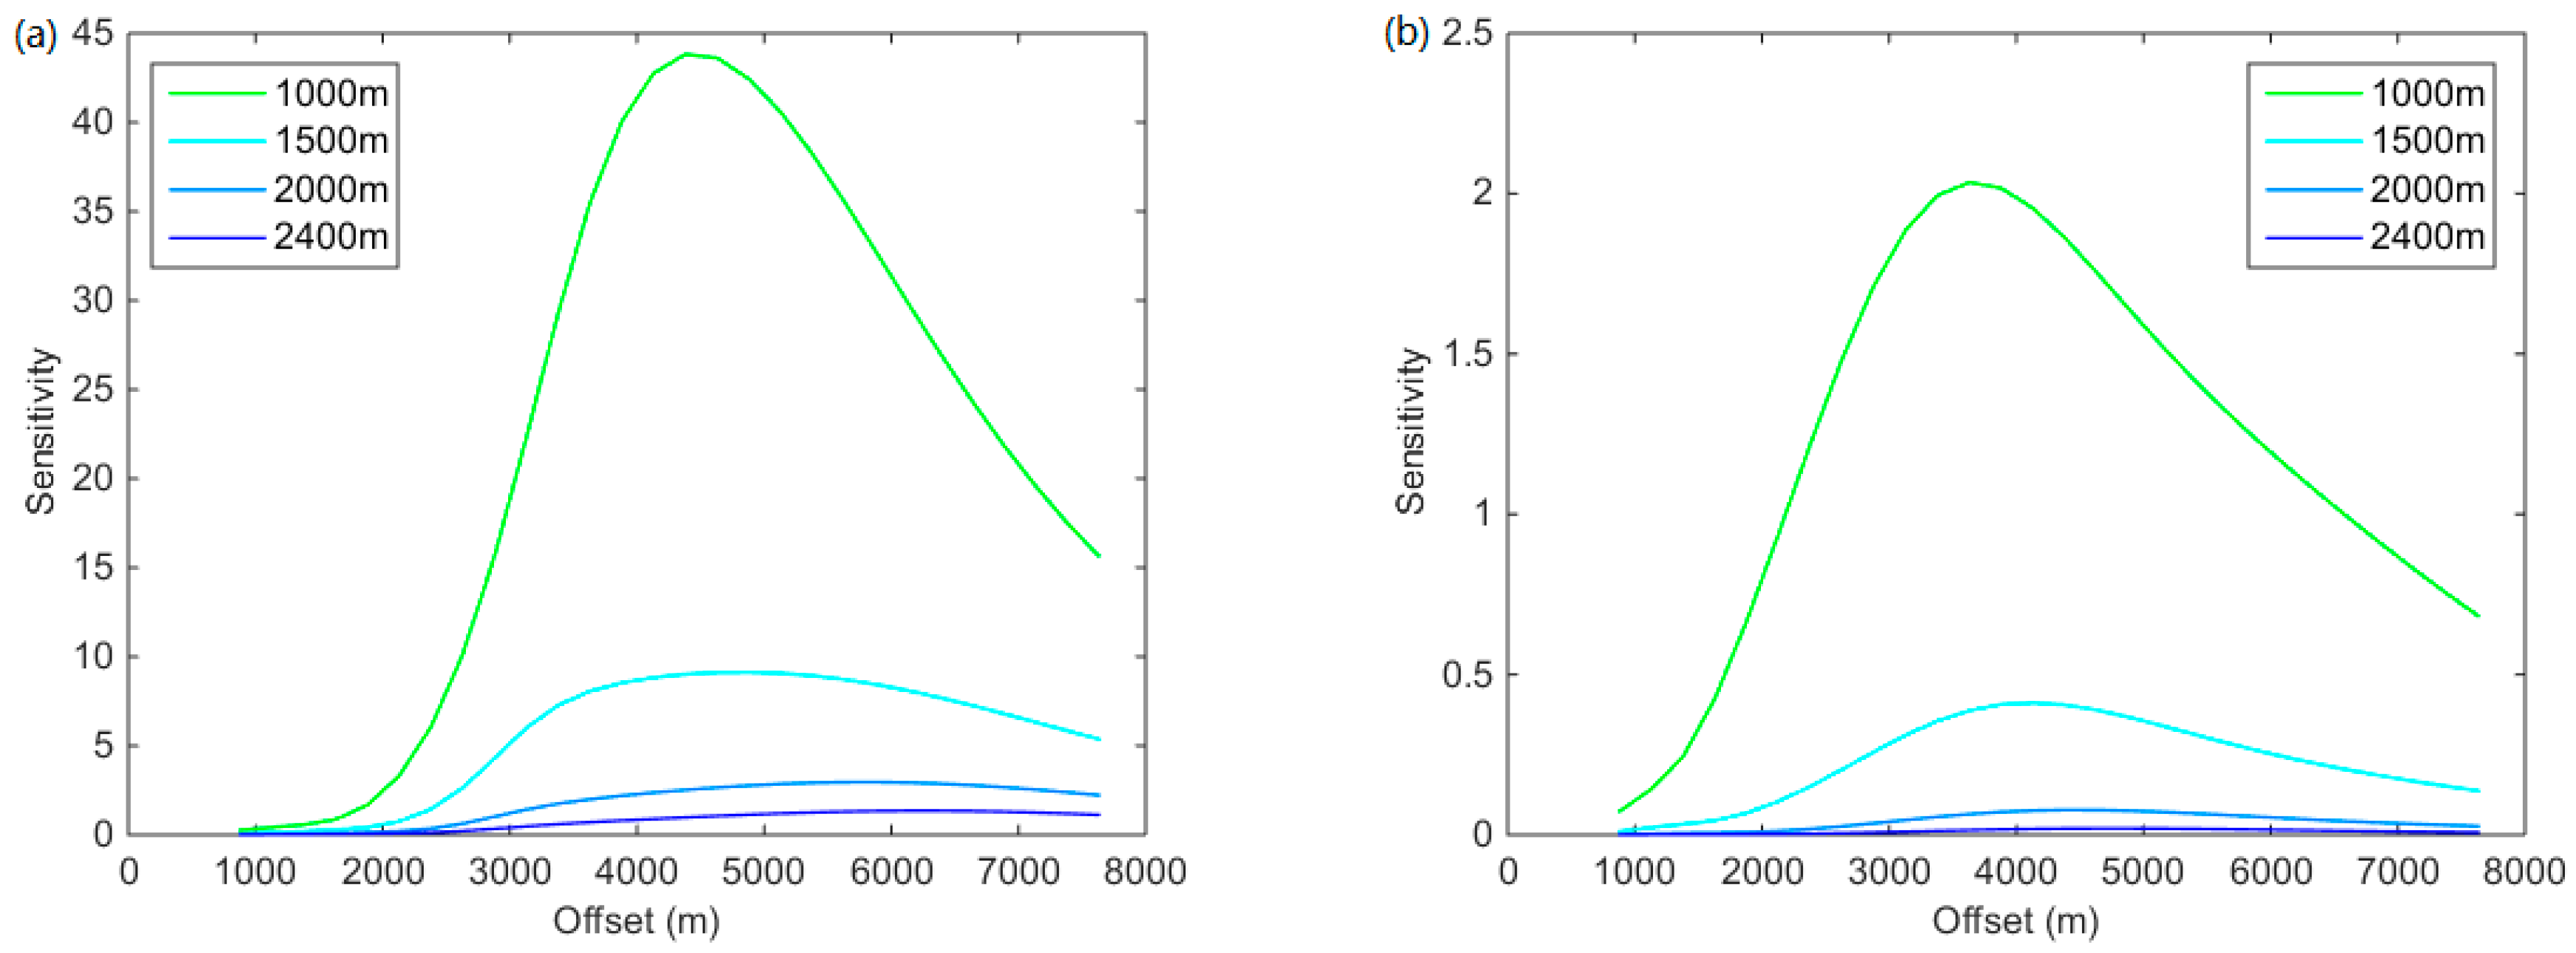
2 for uncertainty. The tops of reservoirs were parameterized at depths of 1000, 1500, 2000, and 2400 m, respectively. The sensitivity and the uncertainty model were calculated for the different burial depths. The sensitivity was related to the transverse resistance, which was calculated from the reservoir thickness and lithology. The results are illustrated in
Figure 5 and
Figure 6. At low frequency at 0.25 Hz,
Figure 5a shows that the sensitivity curves to the target were more than twice the detection threshold by the SBL system. Yet, in the 2400 m case, the sensitivity was below the detection threshold, as shown in
Figure 6a for the TSEM system. The sensitivity was below the detection threshold when the reservoir depth was 2400 m for the SBL system (
Figure 5b).
Figure 6 clearly shows the sensitivity of the TSEM system. In order to show the curve clearly, the label of sensitivity differed with two frequencies. The sensitivity measured by the SBL system was more than the detection threshold at a 2000 m depth. However, the TSEM system could provide the sensitivity to the shallow reservoir for the detection.
Figure 6b illustrates that the sensitivity was above the detection threshold for the 1000 m deep target, which meant that the shallow target was detectable. In other words, the sensitivity to the deep target was too small to be detected at 0.75 Hz by the TSEM system.
Concerning the results shown in
Figure 5 and
Figure 6, the TSEM system had an advantage at a shallow target, while the SBL system apparently had deeper target detectability. A shallow target could be easily detected by both acquisition methods, but it was difficult to obtain a good sensitivity for a deep target using the TSEM system. By contrast, when the frequency increased to 0.75 Hz, the deep target was undetectable by both acquisition systems. For the TSEM system, only the 1000 m deep reservoir showed sensitivity to the target in these cases. In other words, the sensitivity of the TSEM system was sharply reduced. As expected, the sensitivity was below the detection threshold at a high frequency due to the strong attenuation.
3.2. 2D Synthetic Marine CSEM Survey Examples
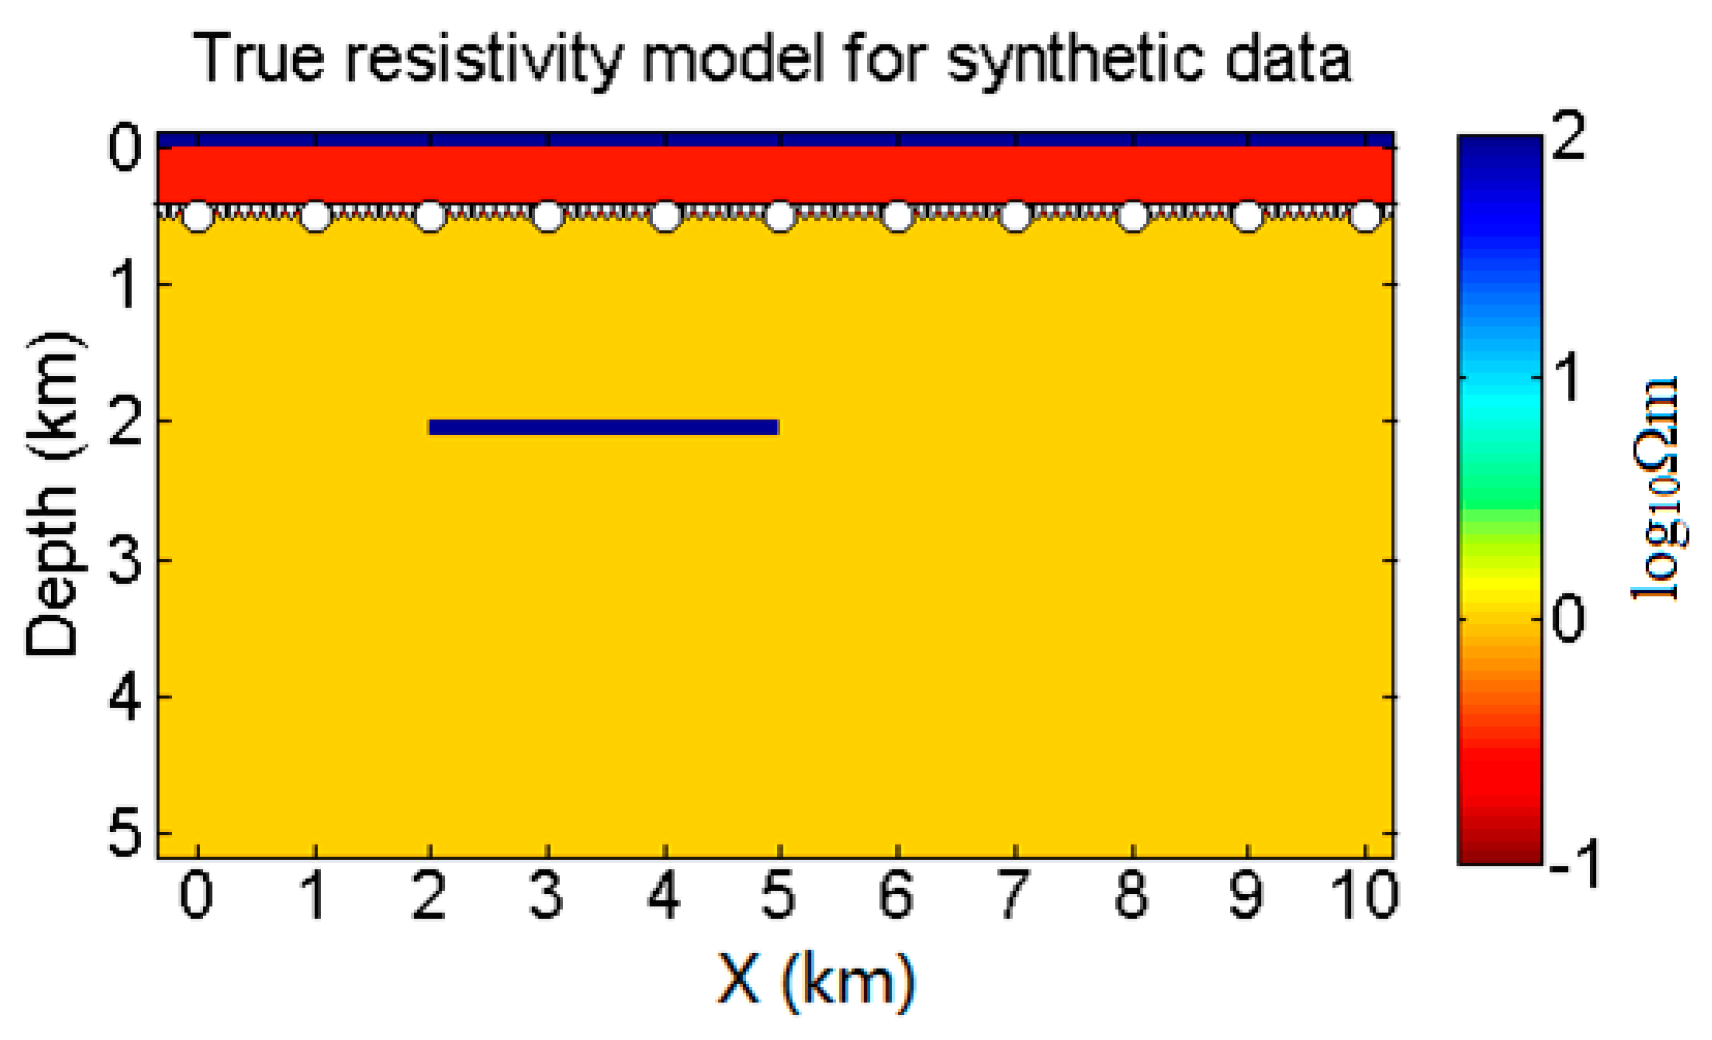
In this section, we studied the resolution of three cases by using Occam inversion. Cases studied the resolution with various reservoir buried depths, reservoir lengths, and horizontal intervals between two targets. The true resistive model was designed as a thin resistive layered embedded in a conductive medium for cases 3 and 4 (
Figure 7). The air and seawater resistivity was the same as shown in
Figure 3. The acquisition parameters were given in
Table 2. All the results were shown in
Figure 8,
Figure 9,
Figure 10,
Figure 11,
Figure 12 and
Figure 13. The white dots in figures represented the receivers with 1 km spacing. There was a 250 m distance between each shot of the TSEM system. The offsets of the TSEM system ranged from 883 to 7595 m.
Both the HED source and receivers streamer were towed for the TSEM system. In total, 72 shots were located between −7.7 km and 10 km positions for all the cases. Due to the 7.7 km long streamer, the last receiver was located at 0 km, where the system could cover the whole investigation area. The SBL system is introduced above (
Figure 7).
3.2.1. Case 3: Occam Inversion Results with Variation of Reservoir Depth
Case 3 studied the detectability with various reservoir depths. The synthetic data of the examples were obtained from a simple 2D reservoir model (
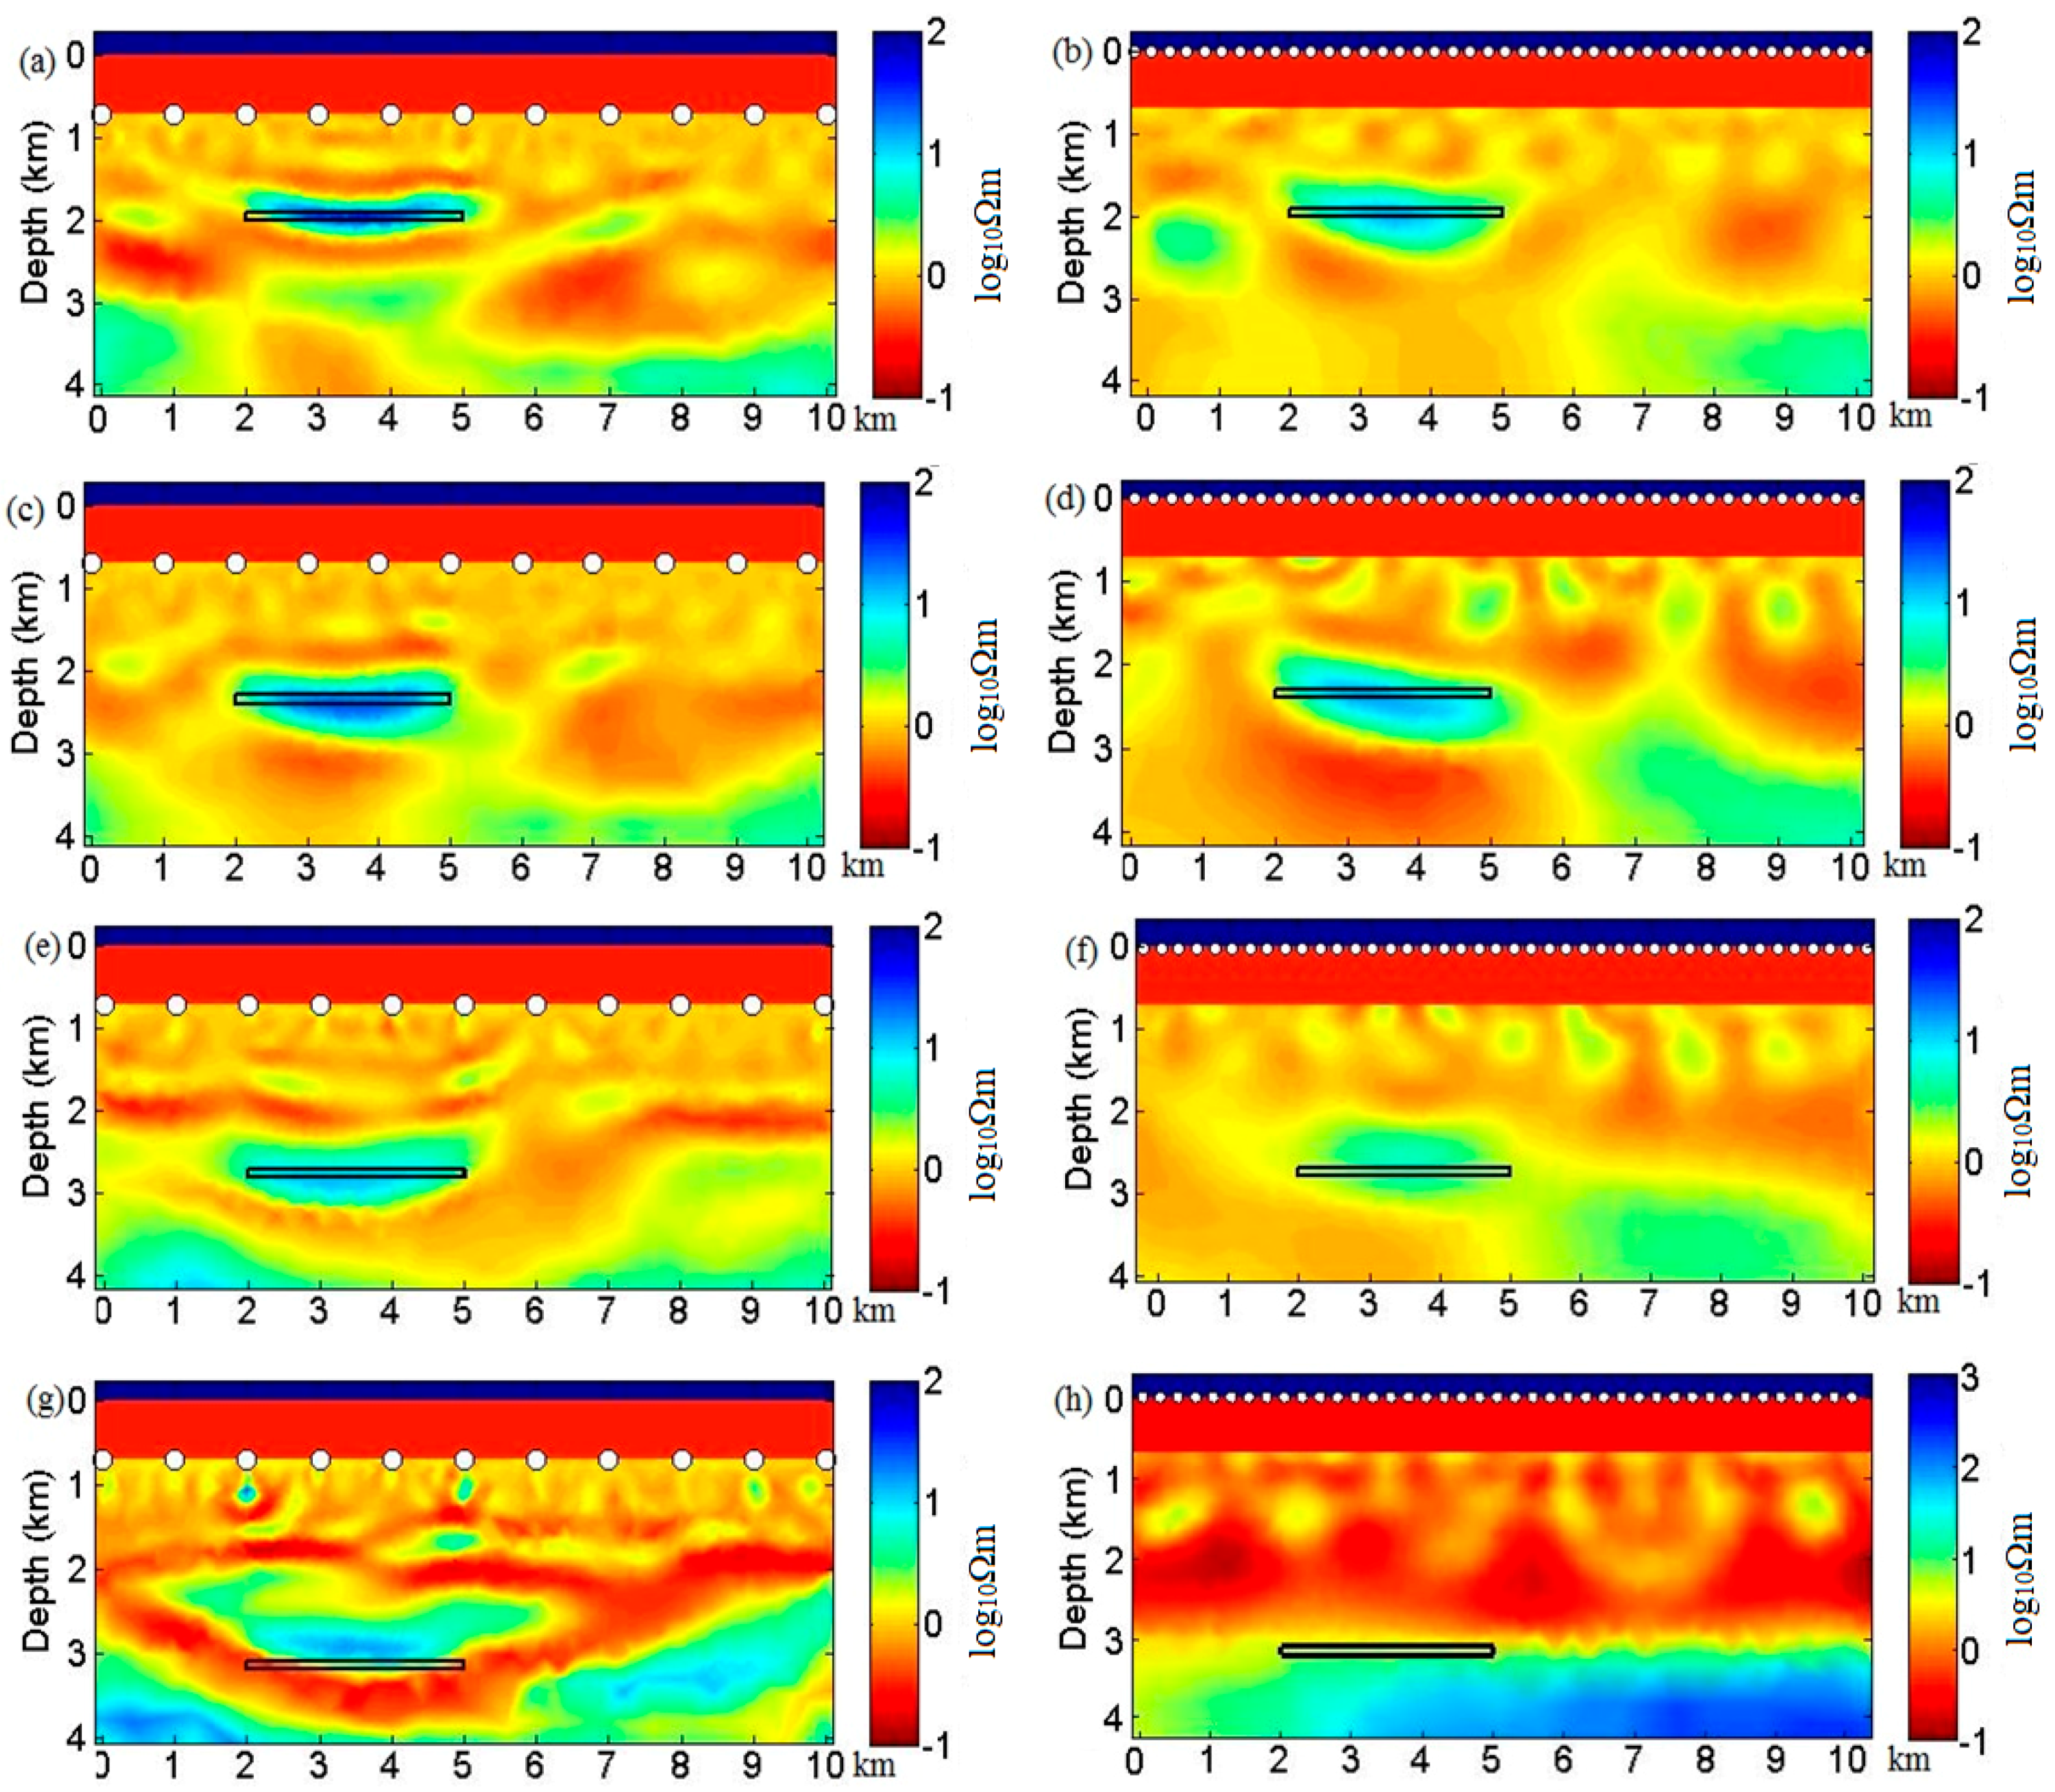
Figure 7). It consists of a resistive reservoir of size 3.0 km × 0.1 km along X and Z directions, respectively. The reservoir was located between 2 km and 5 km in the X direction with 100 Ωm resistivity. The target was embedded in a homogeneous and isotropic conductive layered background (1.0 Ωm). The top of the thin resistive layer lay at a depth of 1.2 km, 1.6 km, 2.0 km, and 2.4 km below the seafloor for testing of the reservoir depth resolution. The measuring parameters are listed in
Table 2. An unstructured triangle mesh was used for the starting model of the inversion. Three water depths were considered at 300 m, 500 m, and 700 m.
Firstly, we inverted CSEM data for testing the shallow water example (1), where the water depth was 300 m. The resistivity images in
Figure 8 show that neither SBL nor TSEM could obtain interpretable inversion results with a 2400 m deep reservoir. The anomaly area increased with the reservoir depth, but the value of the resistivity parameter decreased, as shown in
Figure 8a,c,e,g for the SBL system or
Figure 8b,d,e,i for the TSEM system.
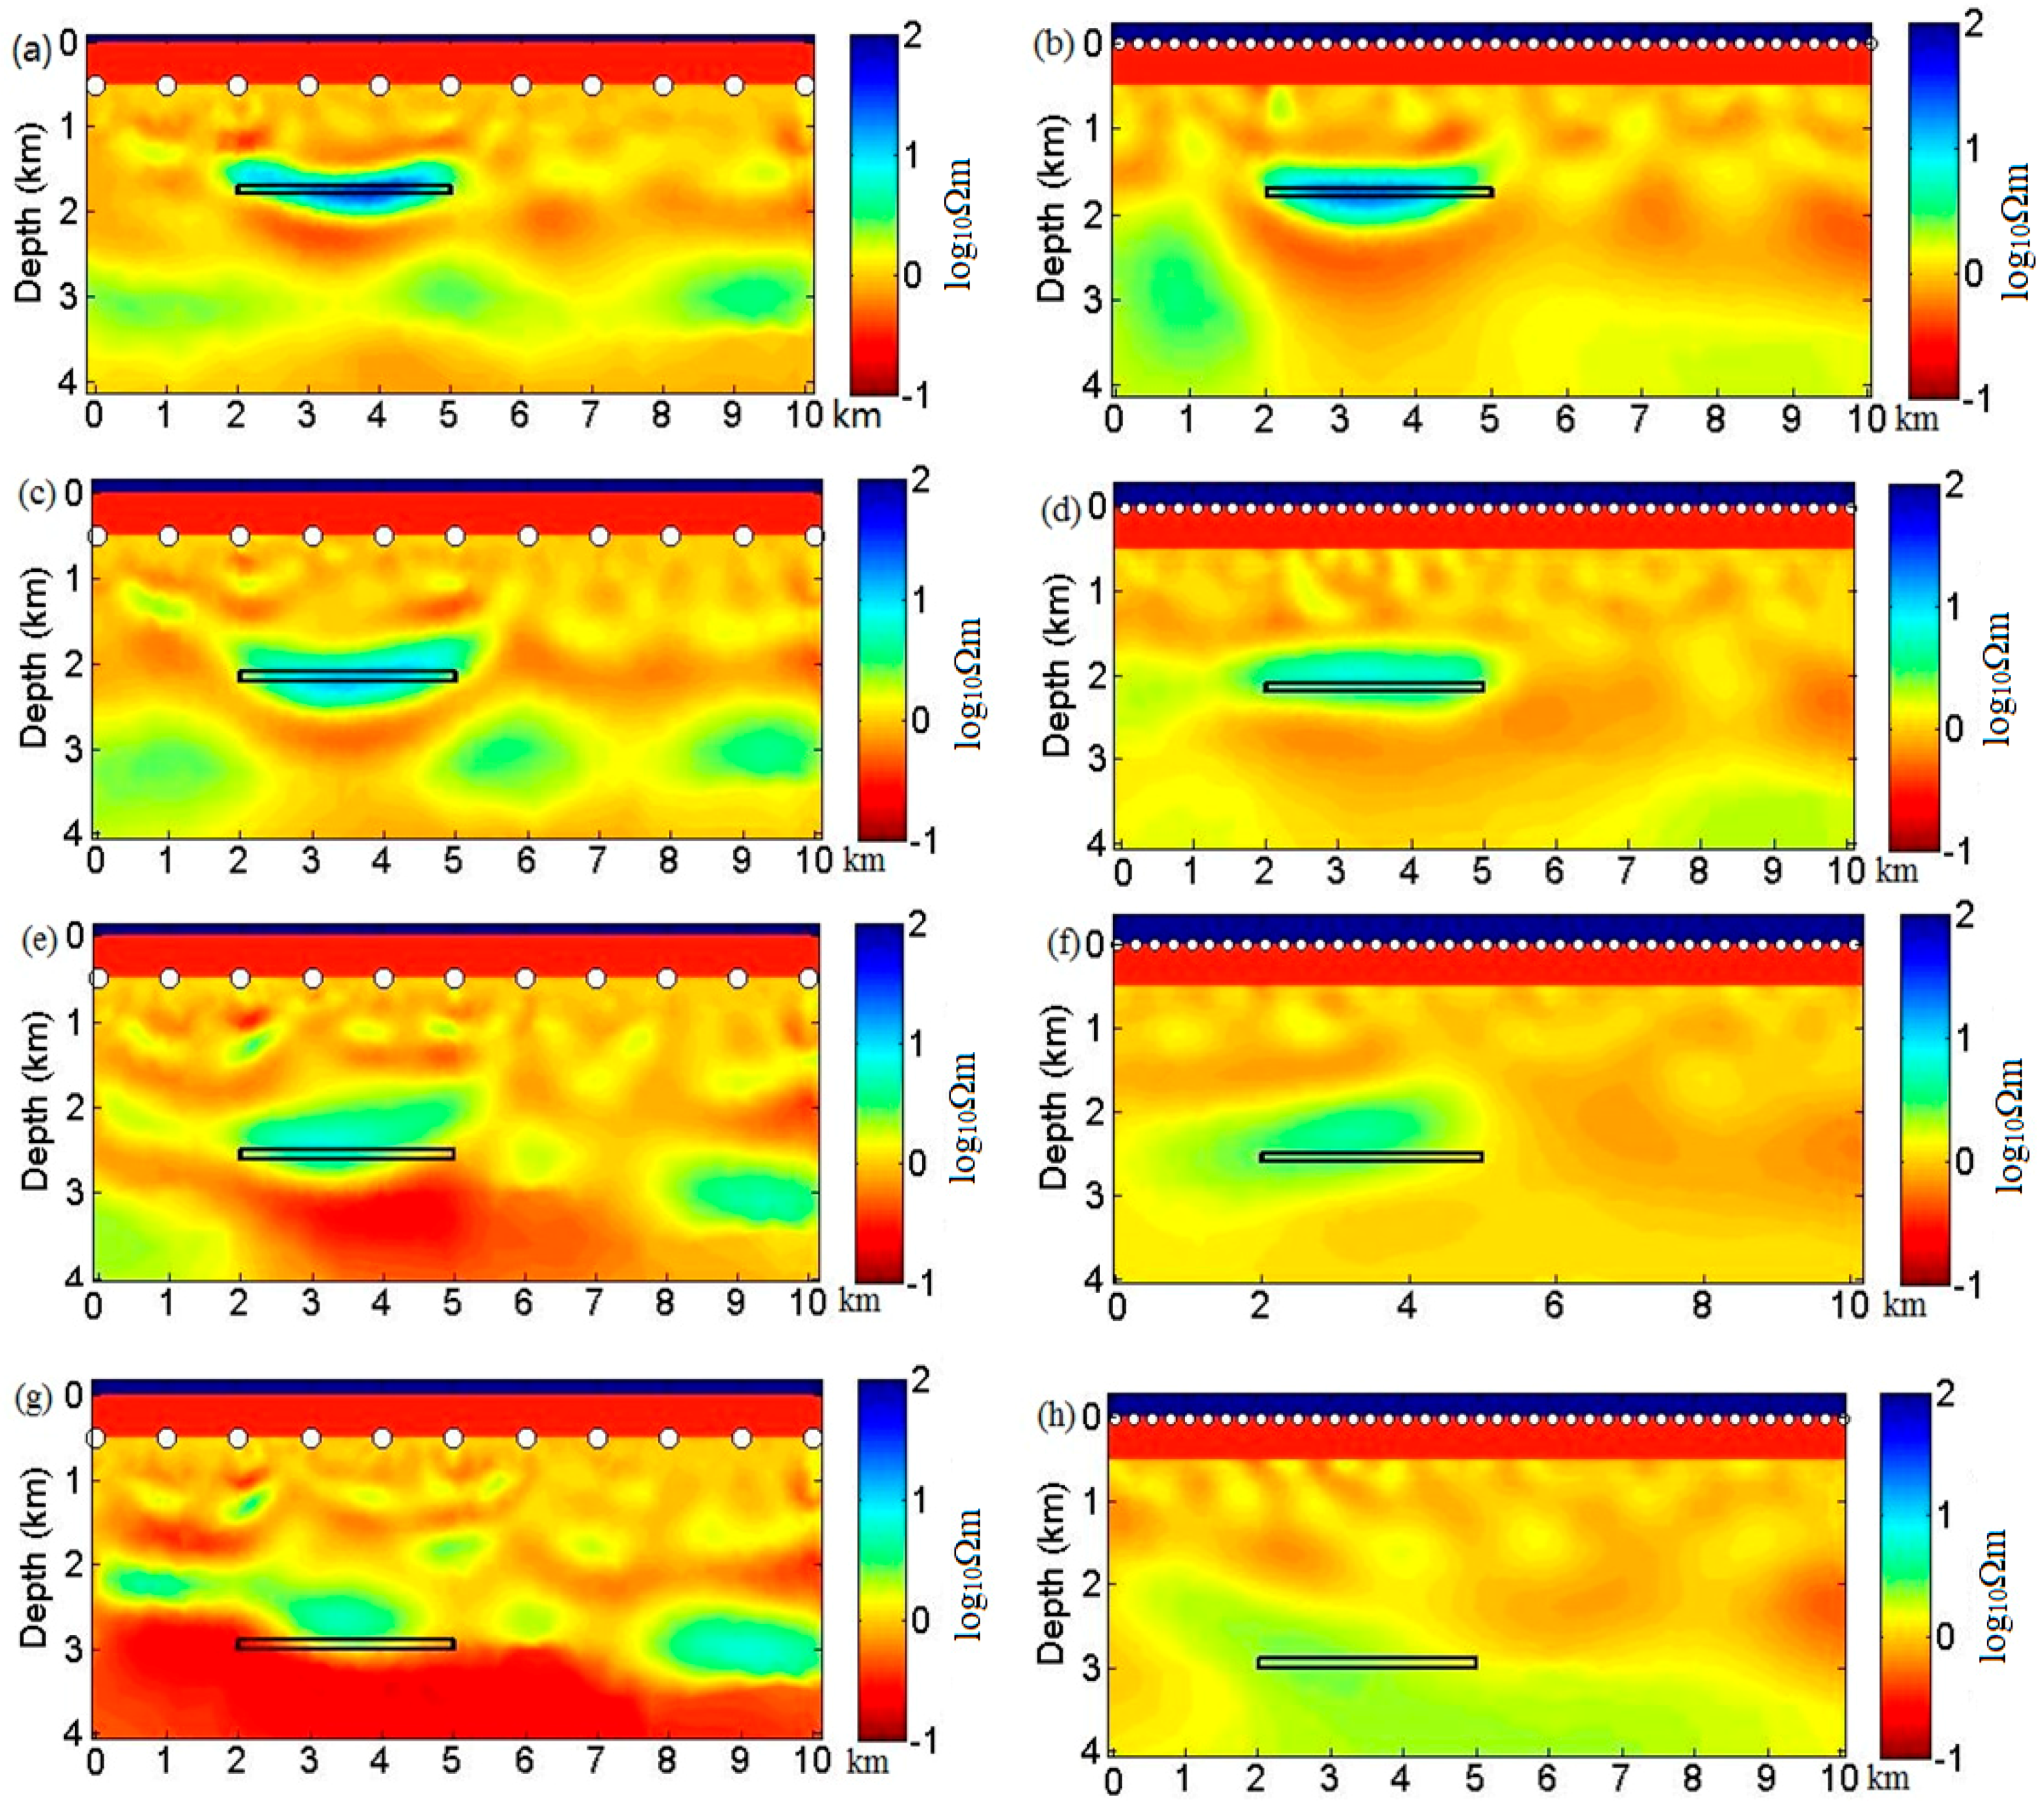
Moreover, CSEM inversion was also carried out to test the example (2) with an intermediate water depth of 500 m. As shown in
Figure 9, the inversion result of the synthetic data generated by the SBL system was different from the TSEM system in the shallow reservoir case, such as 1200 m and 1600 m. At a 2400 m reservoir depth, neither of the two systems could detect a qualified resistive image.
Finally, Occam’s inversion was also tested by an example (3) with a 700 m water depth and the results are shown in
Figure 10. Since the water depth is 700 m, the noise of the airwave was reduced in the SBL system. The sensitivity was larger than in the shallow water case. The deep target could not provide a response as strong as the shallow reservoir, so the resolution of the inversion result became worse with an increasing reservoir depth, as shown in
Figure 10a,c,e,g for the SBL system or
Figure 10b,d,f,i for the TSEM system.
In order to evaluate the inversion results which can produce almost the same resistive images, such as the results of the 2400 m reservoir depth, we used the transverse resistance to evaluate the CSEM data inversion results in the next section.
3.2.2. Case 4: Occam’s Inversion Results with Variation of Reservoir Length
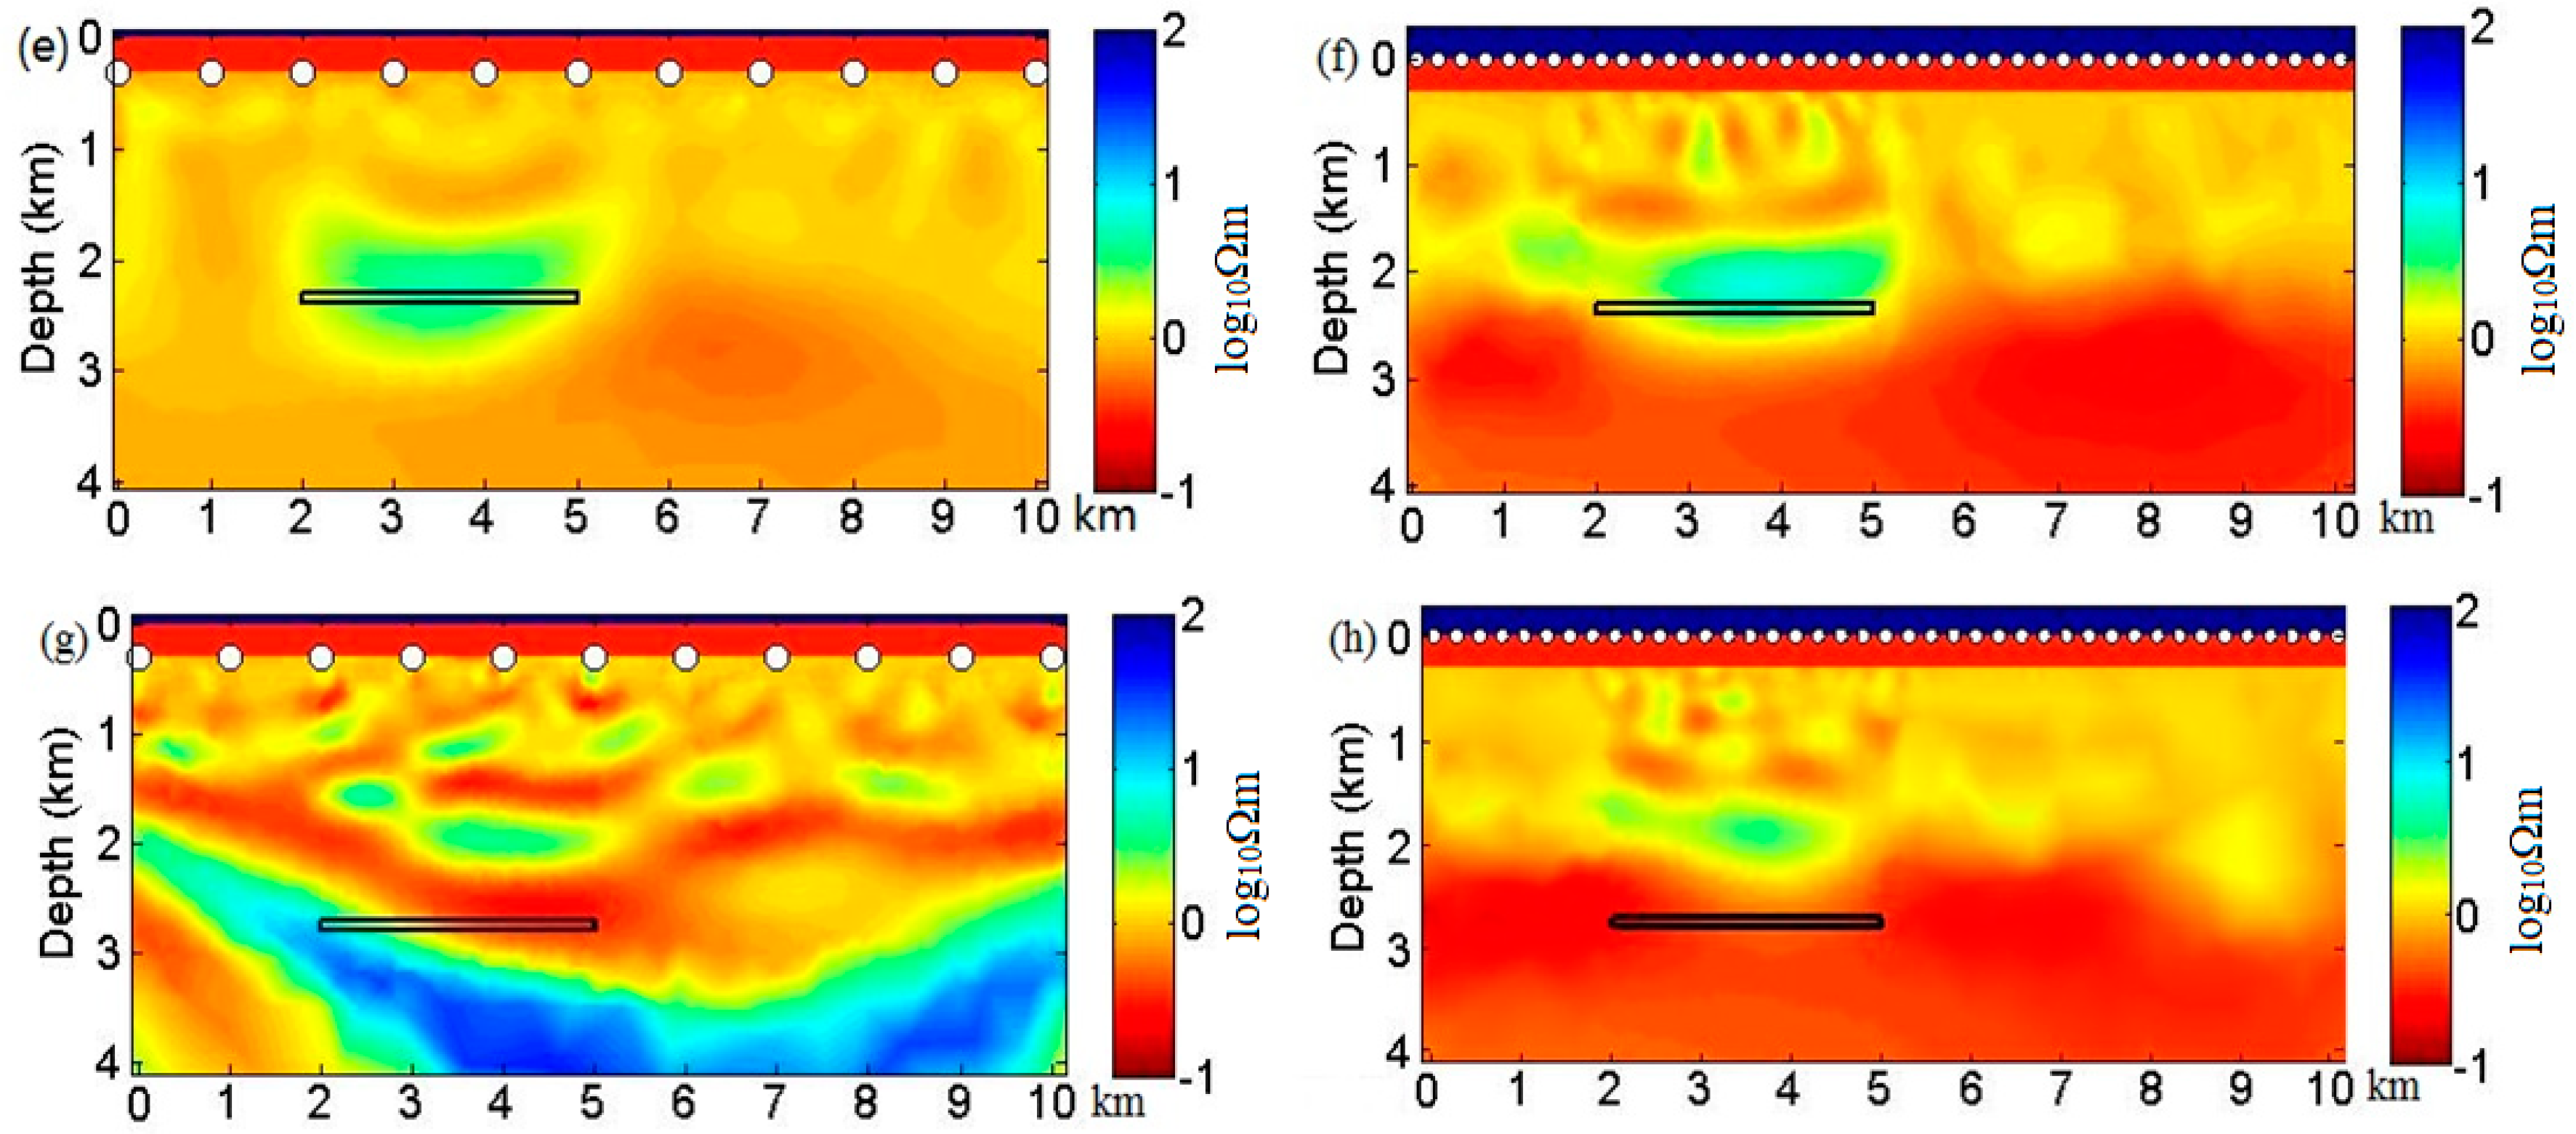
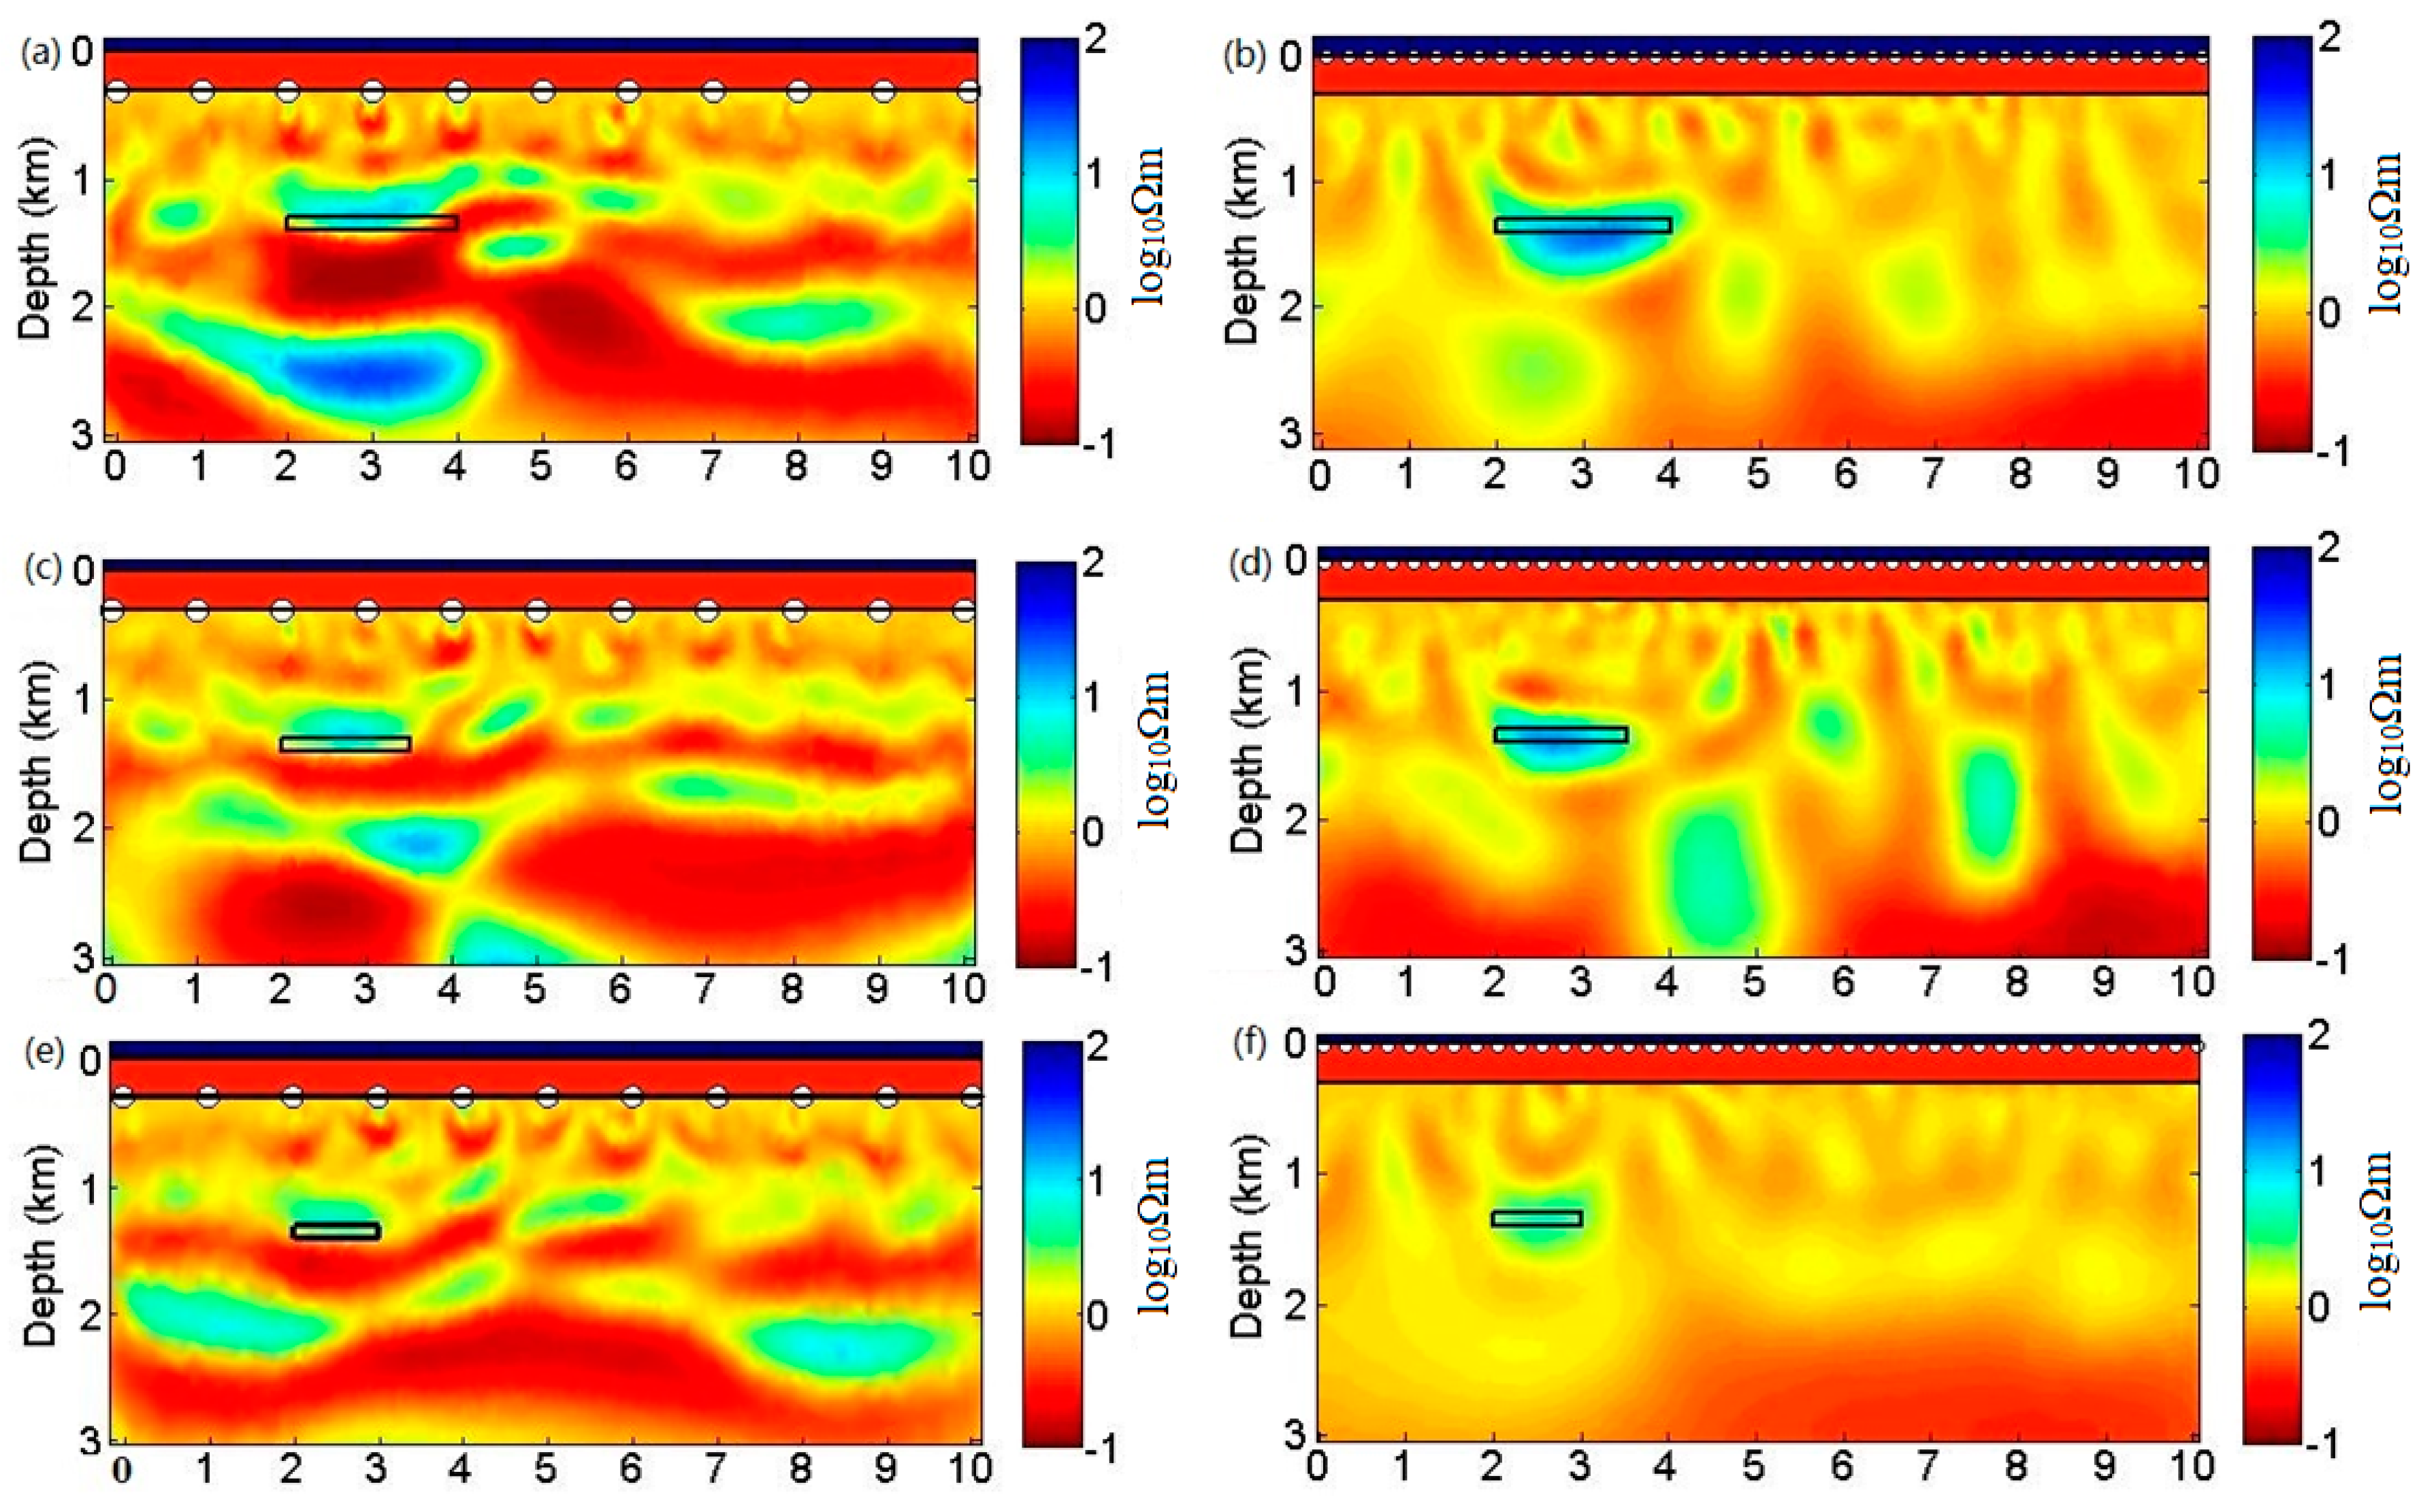
In order to study the horizontal resolution of the two acquisition methods, we tested a simple model with various reservoir lengths of 2.0, 1.5, and 1.0 km (
Figure 7). The reservoir depth was 1 km below the seafloor, and the water depth was 300 m. An unstructured triangle mesh was used for the starting model of the inversion.
Figure 11 illustrates the Occam’s inversion results for the variation of reservoir model length. With the reduction of reservoir length, there were artificial anomalies in the Occam’s inversion results by the SBL system. Results from the TSEM system had a better horizontal resolution than the SBL system.
3.2.3. Case 5: Horizontal Resolution in Occam’s Inversion of Two Reservoirs Model
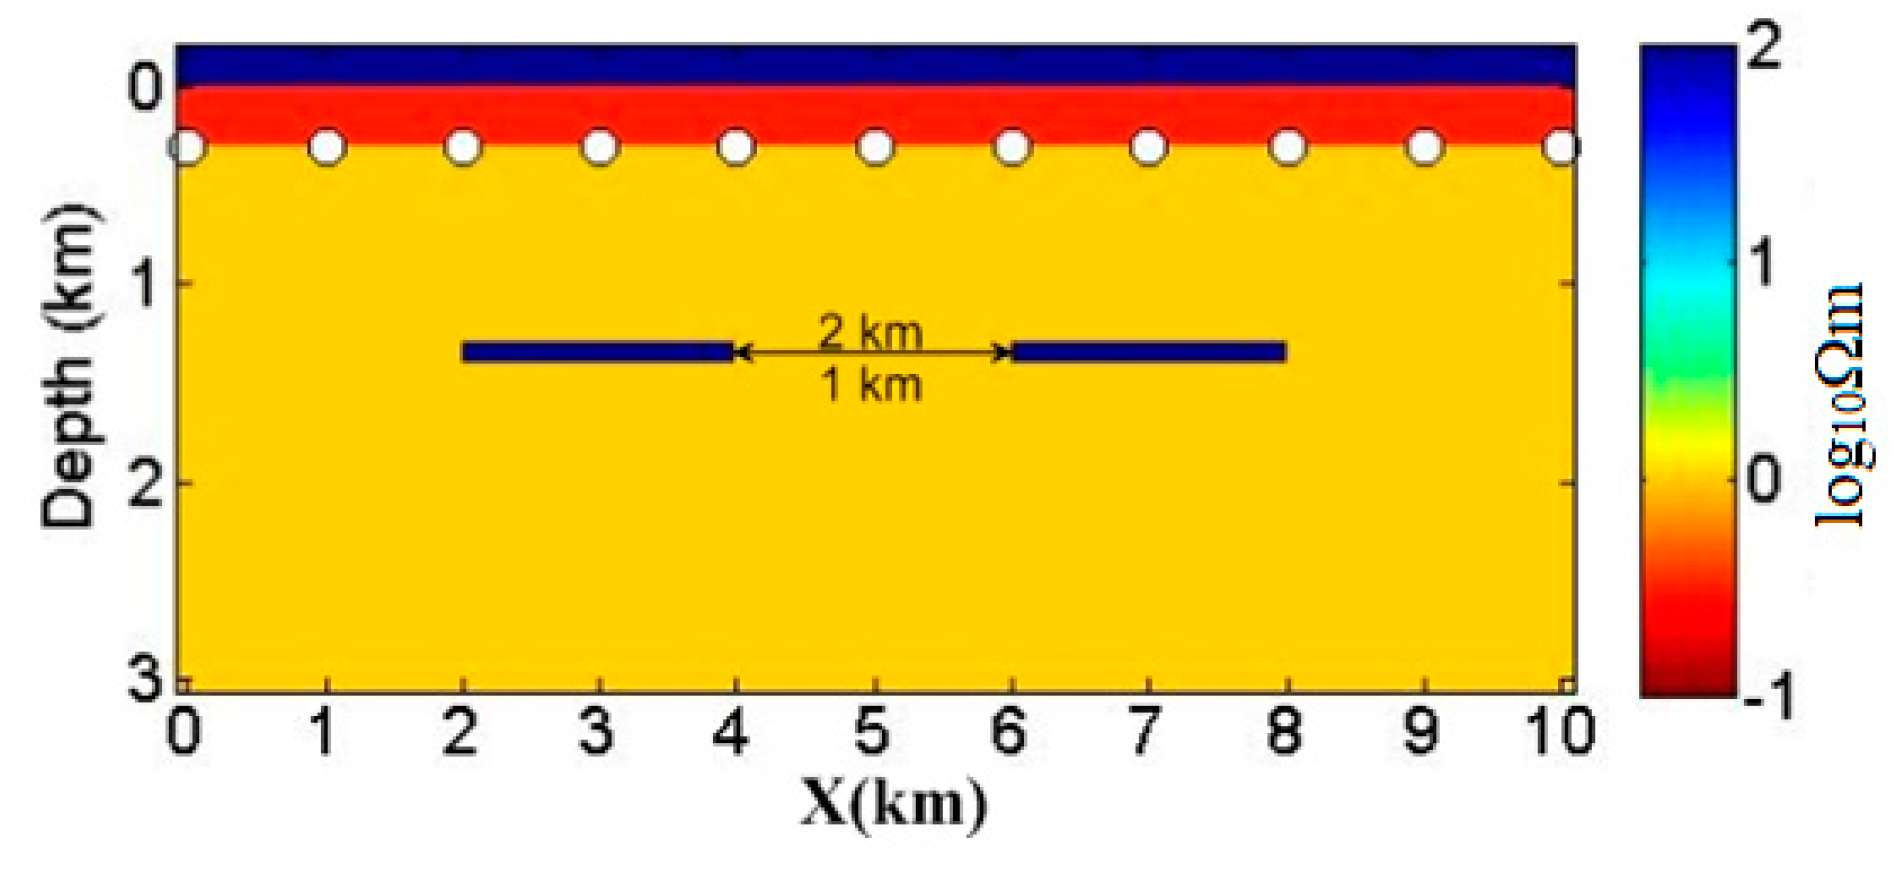
In this section, the horizontal resolution was tested for a model with two close reservoirs. A model for Case 5 (
Figure 12) was created for simulation synthetic data. The 2D model consisted of two of the same sized resistive reservoir targets of 2.0 km along X and 0.1 km along Z directions, respectively. One target was positioned between 4 km and 6 km in the X direction with a 100 Ωm resistivity. The other reservoir had the same burial depth and resistivity. The distances of the two targets were 2 km and 1 km. The inversion parameters are given in
Table 2.
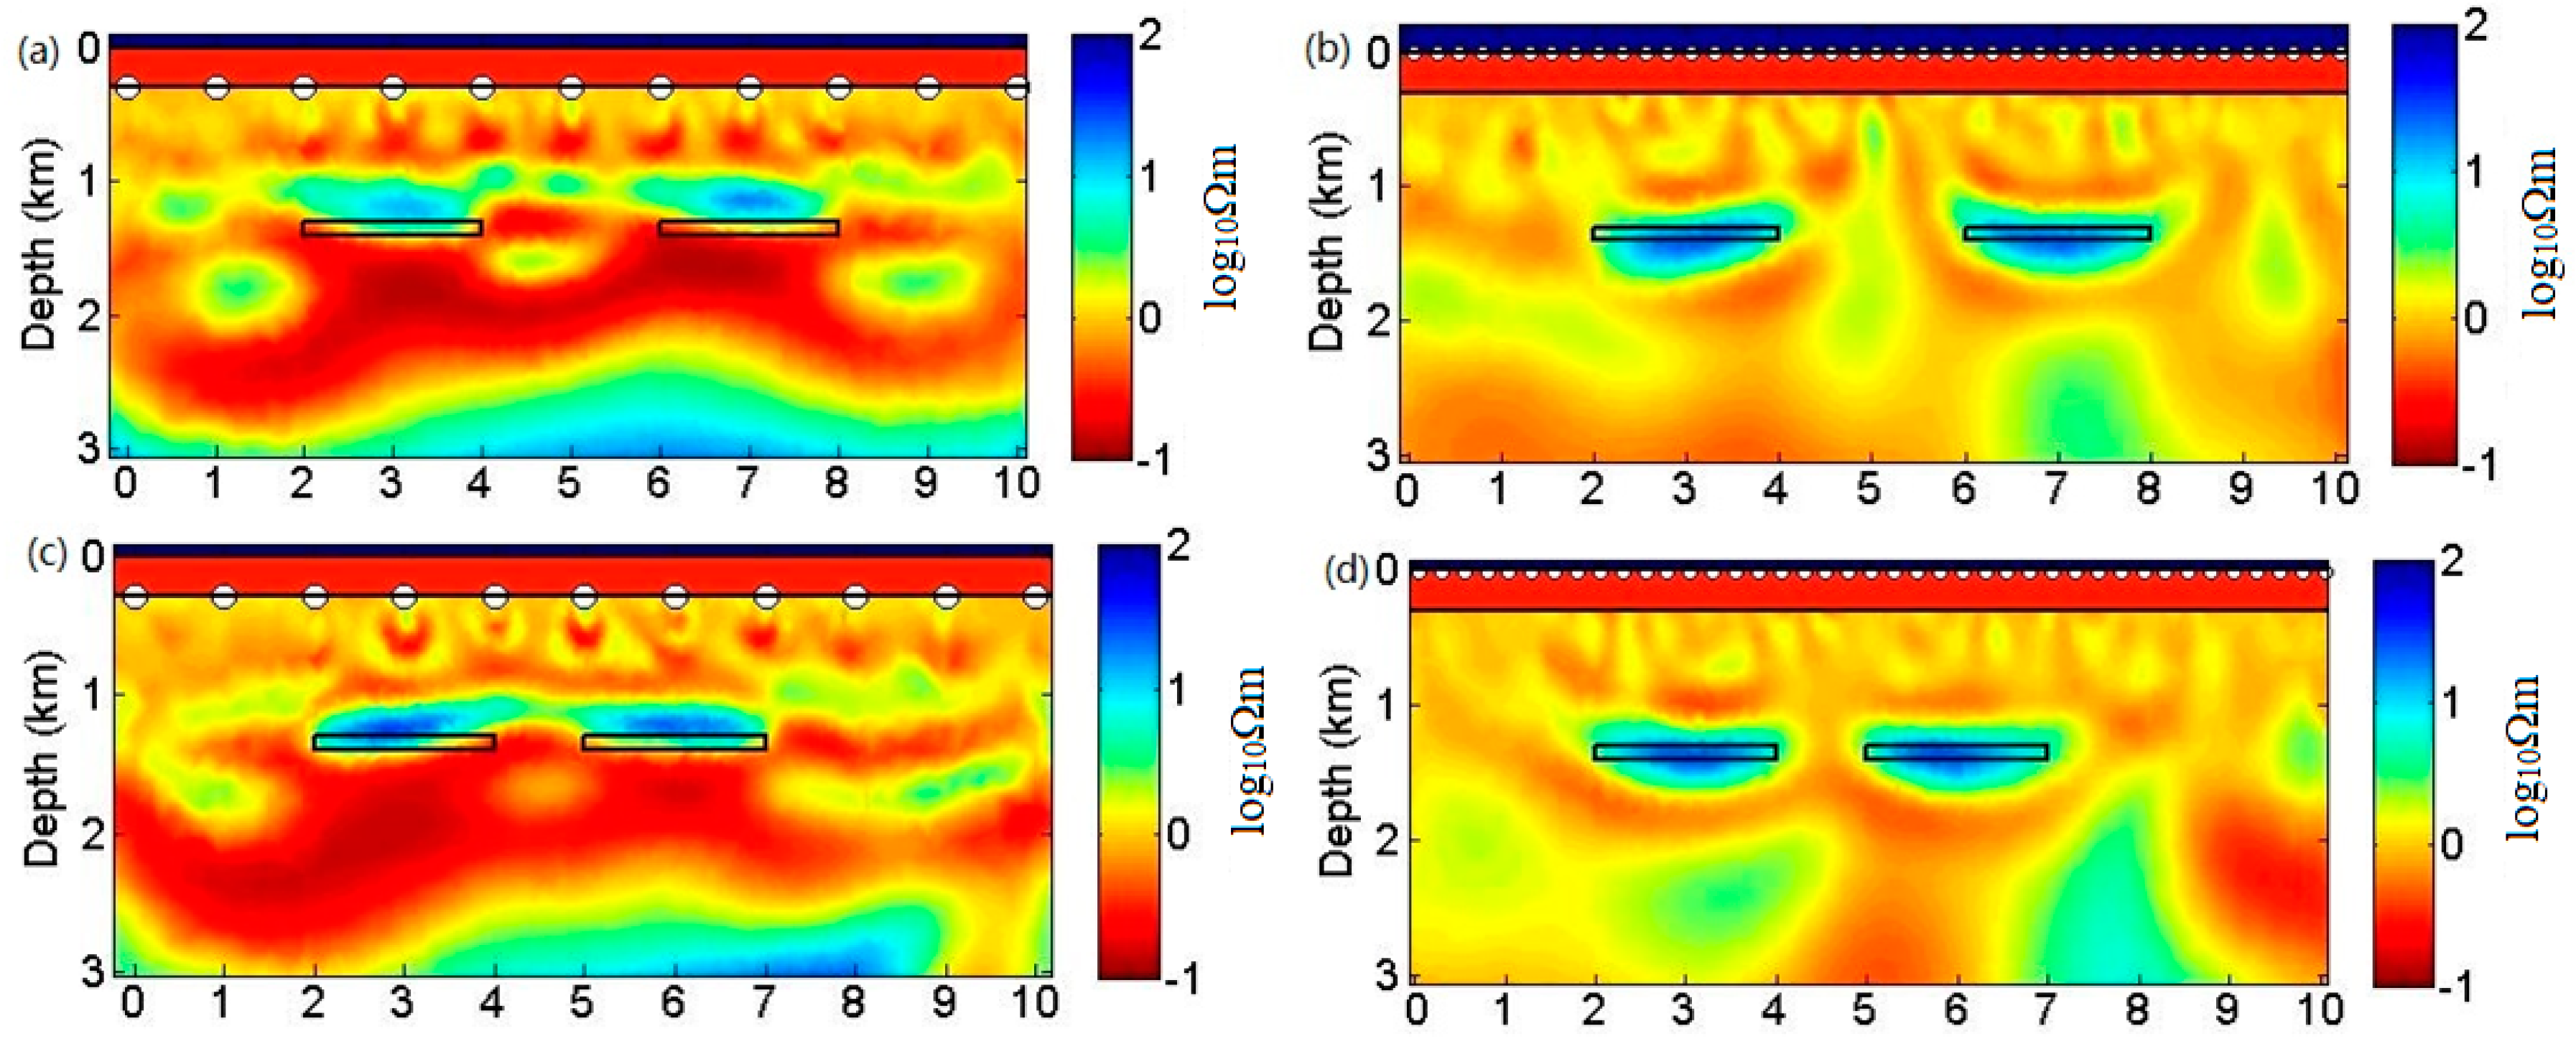
Inversion results of the synthetic data generated by the two acquisition systems are illustrated in
Figure 13. When the reservoirs spacing was 2 km in the true model, the results showed that the two systems could detect the two resistive anomalies. The depths of the anomalies detected were shallower compared to the true model (
Figure 13a), while the clear anomalies were located at the correct depth and lateral position by the TSEM system (
Figure 13b).
Figure 13c,d showed the results by Occam’s inversion where the interval of the reservoirs was 1 km. The resistivity estimated by the SBL system in
Figure 13c is illustrated as a large anomaly. In contrast, the two resistive anomalies are clearly displayed by the TSEM system in
Figure 13d.
3.3. Case 6: Anomaly Transverse Resistance Ratio
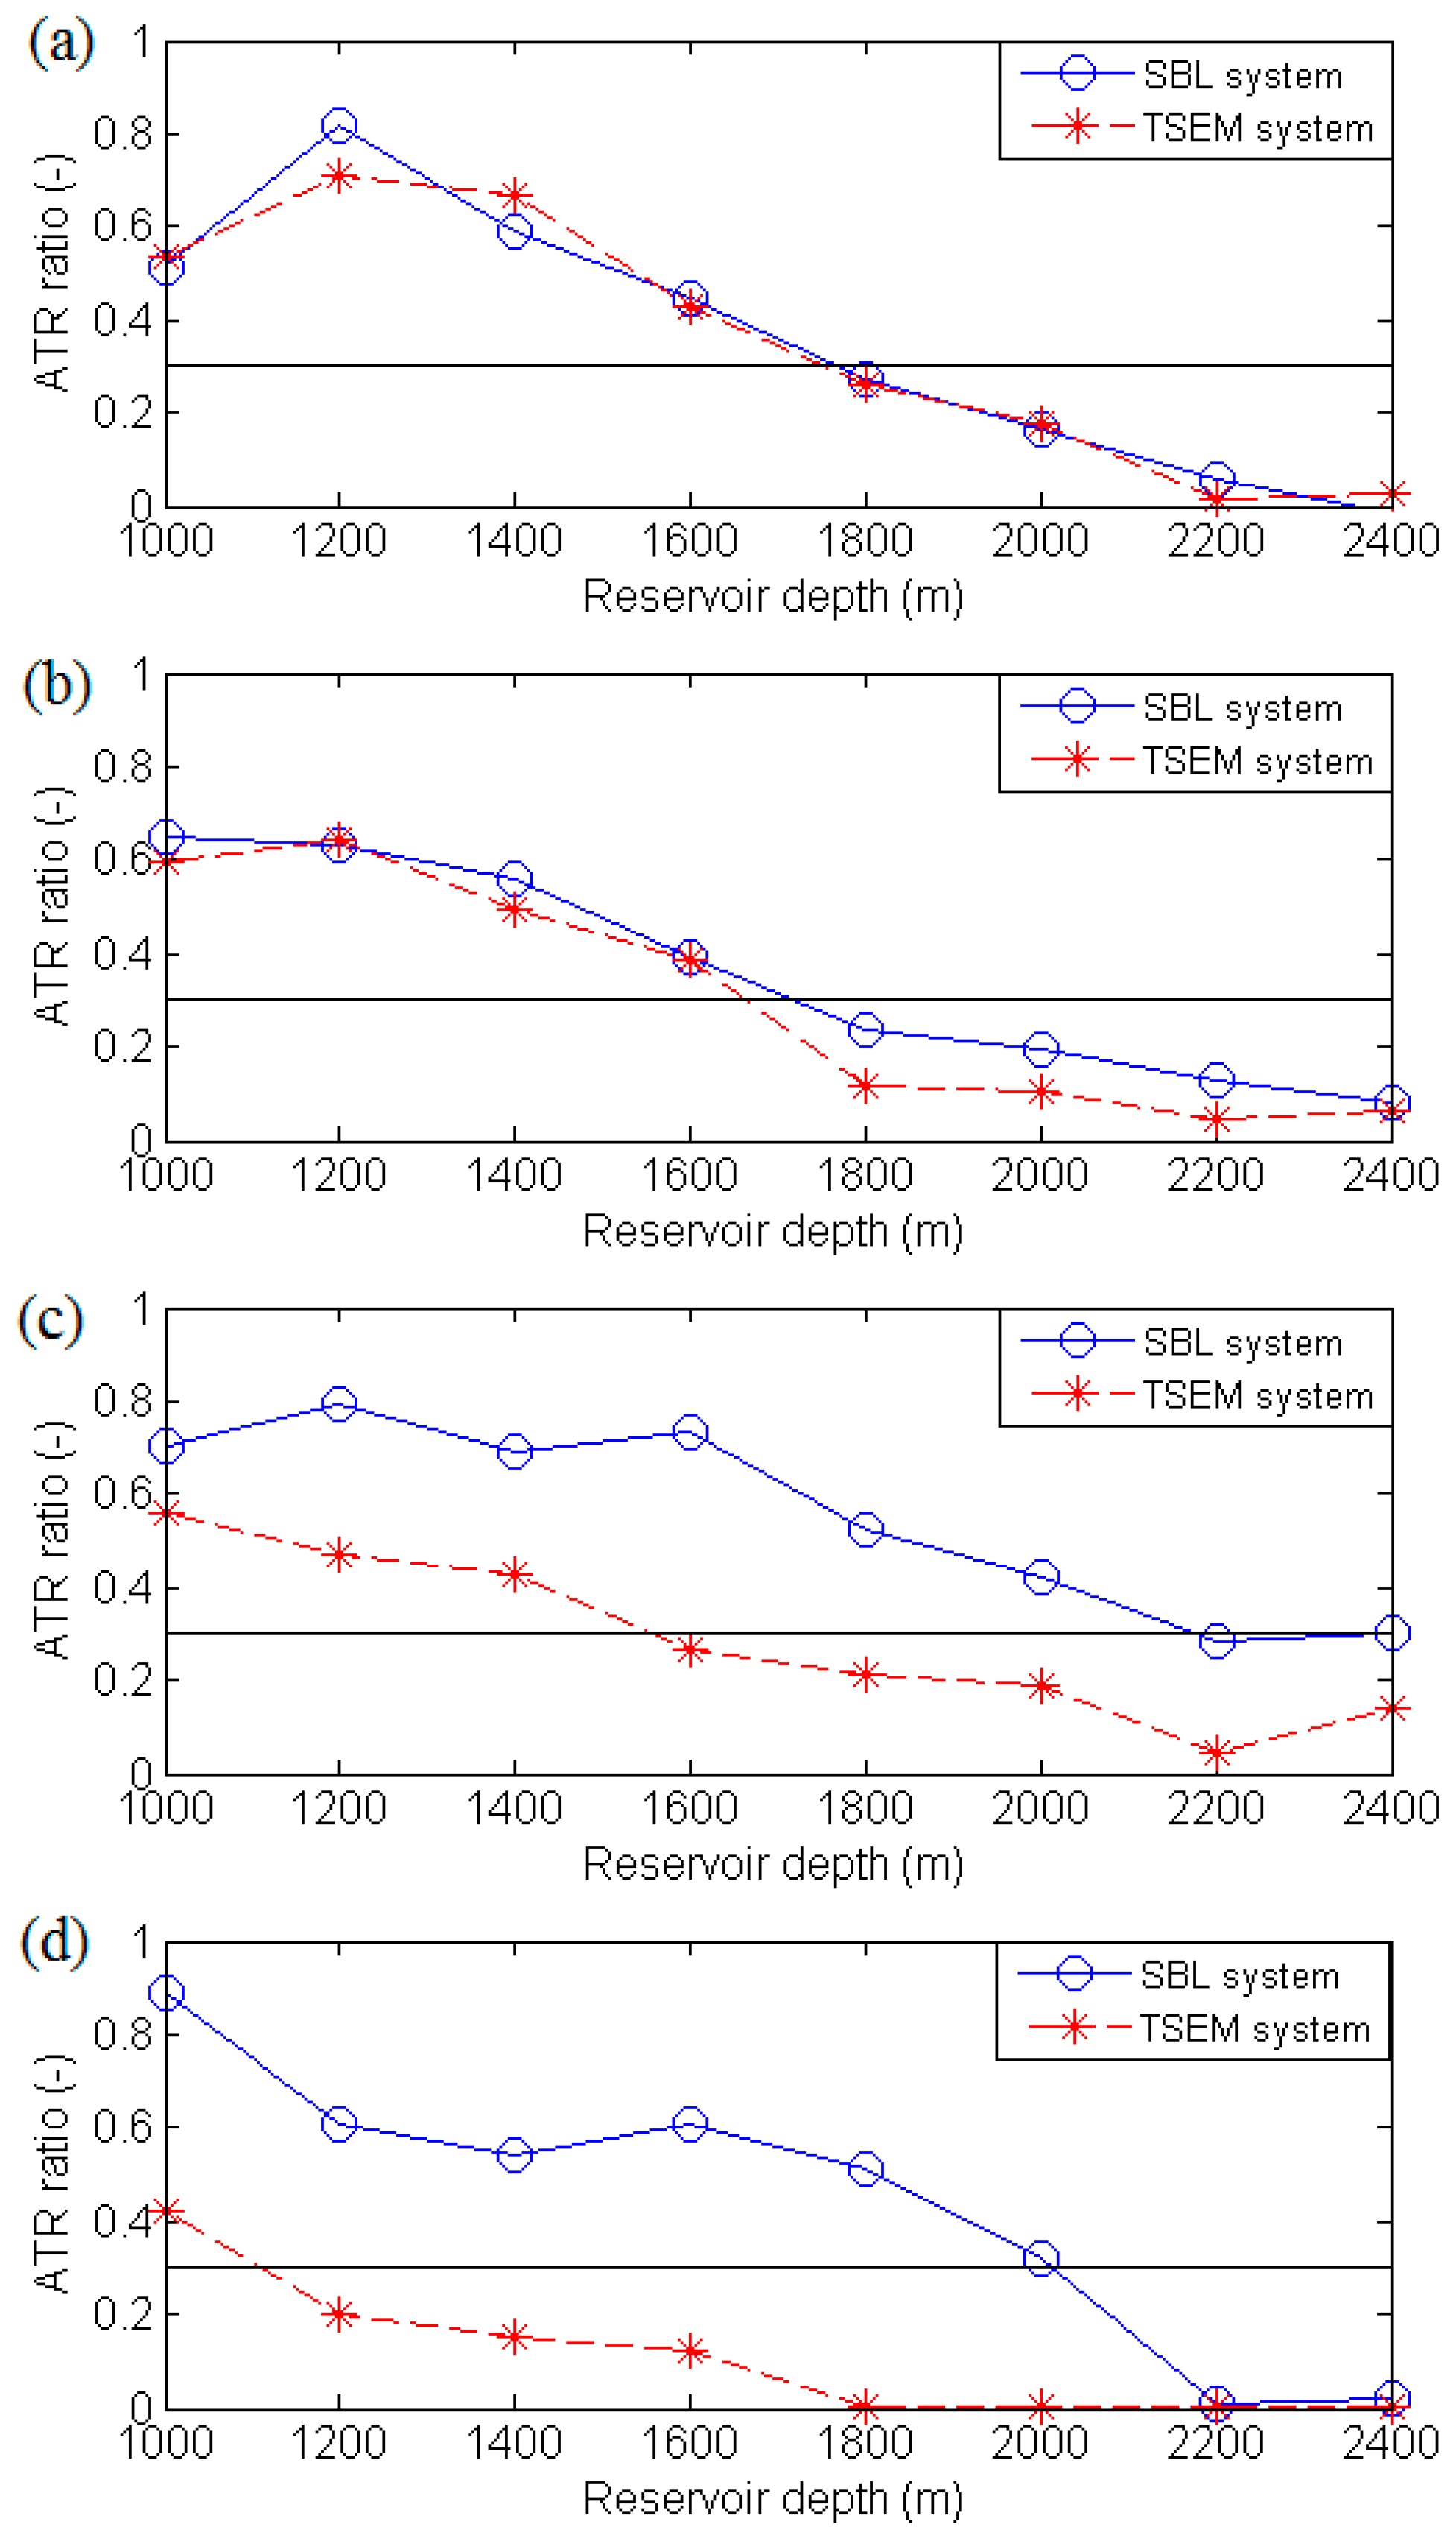
The inversion results in Case 3 were employed to study the ATR ratio. The ATR ratio is shown in
Figure 14. A ratio of 0.3 was applied as the quality criteria. When the ratio was below 0.3, the image could be applied for interpretation.
Figure 14 illustrated the various ATR ratio changes with reservoir depth. The water depth was 300 m (
Figure 14a), 500 m (
Figure 14b), and 700 m (
Figure 14c), respectively.
In
Figure 14a, the ATR ratio varied with increasing reservoir depth at 300 m deep water. The ATR ratio reduced with growing reservoir depth. Because of the airwave effects in the shallow target case, the ratios in these two acquisition systems at a 1000 m reservoir depth were lower than that in the 1200 m deep reservoir case. The fact that a linear curve reflected the ATR ratio decrease with reservoir depth indicated that the detectability of the CSEM method declined with the increasing target depth. Both of these two systems could detect the target when the reservoir was buried shallower than 1800 m.
For the intermediate 500 m deep water, the ATR ratio of the two systems was similar in
Figure 14b. As shown in
Figure 14b, the ATR ratio value sharply declined sharply when the reservoir depth was larger than 1600 m for the TSEM system. The CSEM inversion result could not provide a high resolution image for a 1800 m deep target when employing the TSEM system. The ATR ratio of the SBL system was larger than that of the TSEM system at 1800 m, where the ATR ratio was smaller than 0.3. Compared to the TSEM system, the SBL system had a detectable advantage at an intermediate water depth.
In
Figure 14c, obviously, the ATR ratio of the SBL system is higher than that of the TSEM system in deep water of 700 m. When the reservoir was buried at 2000 m, the resistivity image obtained by the SBL system had a high resolution.
The detectable limitation of the TSEM system decreases with increasing water depth. The ATR ratio is illustrated in
Figure 14d, where the water was 900 m deep. The TSEM system might provide a quality resistivity image in a very shallow reservoir.
4. Discussion
Similarly to other geophysical methods, the marine CSEM method had both advantages and disadvantages. We compared the sensitivity and resolution of the marine CSEM method for a thin hydrocarbon reservoir for the SBL system and the TSEM system. In order to evaluate the CSEM method, we studied the sensitivity and resolution versus the frequency, offset, buried reservoir depth, reservoir lateral size (length), and interval of the two reservoirs models for the two data acquisition systems. The SBL system had a wider range of frequency and offset than the TSEM system. 1D sensitivity modeling results indicated that the SBL system could acquire qualified data at a high frequency. However, the TSEM system had a limitation of the streamer length. Therefore, the TSEM system method only had in-tows or out-tows data with a limited offset. In order to overcome the reduced sensitivity, the TSEM system employed the 3 by 3 dipole source-receiver pairs to replace the single node source-receiver pair. Both SBL and TSEM systems had a good sensitivity for shallow targets. As the water depth increased, the depth at which a given target could be detected decreased.
The advantage of the SBL system was in the deep water environment because less EM energy was lost during propagating. Large source-receiver offset could receive the EM signal for the low frequency EM wave. In a shallow water environment, both acquisition systems had a good sensitivity to the resistive targets, and the TSEM system might provide as qualified responses as the SBL system in terms of sensitivity and inversion results.
The resistivity images from CSEM inversion illustrated that the depth resolution varies with water depth. With increasing water depth, the SBL system had a better deep resolution than the TSEM data.
Concerning the horizontal resolution, the TSEM system had an advantage in 2D inline data acquisition. The TSEM system provided a clear resistivity image when the reservoir size was 1 km and was able to distinguish two shallow targets, even though the reservoirs were at a 1 km distance. The TSEM system was considered to have an advantage of the horizontal resolution in the 2D case.
By analyzing the ATR ratio of the resistive image, we defined 30% as the criteria to evaluate the resistivity image. The detectable limitation was dependent on the parameters like water depth, geologic setting, frequency, and offsets. The exact target detection limitation depth was tested at the water depths of 300, 500, 700, and 900 m. Based on these results, in a deep water environment, the SBL system was preferable.
In this paper, we only considered the 1D and 2D cases. In 3D data acquisition cases, the SBL system acquired both azimuth and inline data. The SBL system has been applied in the Barents Sea since 2008. The TSEM system was also applied in 3D for the survey area covering a total of 5206 sq. km in the Barents Sea [
26]. In the 3D data acquisition cases, the parameters for the two systems were different.
Considering the cost of the survey, these two systems had their own advantages. The SBL system needed to drop the receivers on the seafloor, and then, the HED source would be towed above the seafloor. When the survey was finished, the receivers should be recovered again. But, the SBL system had an advantage in terms of the 3D survey. It could drop the receivers to acquire the signal for a large scale survey. The TSEM could be towed by the vessel together with the seismic survey. Both the EM and seismic systems had a similar survey design. Then, the TSEM system could save costs in 2D surveying.
5. Conclusions
In this paper, we investigated the detection capability of the marine CSEM method for hydrocarbon offshore exploration. To compare the two systems, acquisition parameters were tested by analyzing the sensitivity and resolution.
The resistivity images inverted by the Occam algorithm illustrated the relationship between the depth resolution and the absolute reservoir depth. Both the systems had a good resolution in the shallow water environment. However, in the deep water environment, the SBL system provided a superior depth resolution to the TSEM system.
Concerning the horizontal resolution, the TSEM system had an advantage in the dense acquisition. The horizontal dense data acquirement provided a clear resistivity image for a small size reservoir. It could also distinguish two shallow resistive targets when the interval was 1 km.
Here, we employed a criterion to evaluate the resistivity image. An ATR ratio was defined to analyze the resistivity image of the subsurface. The detection capability of the CSEM method varied with water depth and absolute target depth. Based on these results, the SBL system was preferable in the deep water environment; by contrast, the TSEM system was preferable in the shallow water environment.
Some limitations of these comparisons should also be introduced here. The simplified geological model was employed to test the methodology basics. So the simple isotropic model could not describe a 3D and anisotropic world. The broadside data was not considered in these comparisons either. Moreover, the selected parameters for inversion might result in the different results. Finally, in 1D sensitivity modeling cases, the lengths of the HED source and receiver electrodes were not considered. In the future, we would study the sensitivity and resolution in 3D and anisotropic environments.
Considering the acquisition cost, the SBL system measured the 3D data by dropping and recovering the receivers once. The TSEM system could measure the EM data with seismic data together. Both the EM and seismic system could be towed at 4 knots.
We believe that the comparative studies can be useful for improving acquisition methods. Our analysis can be applied to identify experimental limiting factors. It can be used to guide the survey design for hydrocarbon exploration.
Author Contributions
The author contributions are as in the following statements “Conceptualization, Z.G.; Methodology, Z.G.; Validation, Z.G., J.L. (Jianping Liao) and J.L. (Jianxin Liu); Formal Analysis, Z.G.; Writing—Original Draft Preparation, Z.G.; Writing—Review & Editing, J.X.; J.L. (Jianping Liao); Visualization, J.L. (Jianping Liao); Supervision, J.L. (Jianxin Liu); Project Administration, J.L. (Jianxin Liu); Funding Acquisition, J.L. (Jianping Liao) and J.L. (Jianxin Liu)”.
Funding
This research was funded by the National Natural Science Foundation of China grant number [41274126]. The author has the financial support of “The International Postdoctoral Exchange Fellowship Program”. Project funded by China Postdoctoral Science Foundation grant number [2017M622607]; State Key Laboratory for Coal Resources and Safe Mining, China University of Mining & Technology [SKLCRSM17KFA07, SKLCRSM11KFB01]; Open fund of Hunan Provincial Key Laboratory of Shale Gas Resource Utilization, Hunan University of Science and Technology [E21817, E21821].
Acknowledgments
The authors would like to express their gratitude to Kerry Key and his colleagues at Scripps Institution of Oceanography for the use of their MARE2DEM codes, which made this work possible. We thank E. Causse, A.K. Nguyen, and P.A. Olsen from Statoil and H. Dong and Å. Kristensen from Norwegian University of Science and Technology (NTNU) for valuable discussion on the results and preparation of this paper. Additionally, we thank J. Midgley from Petroleum Geo-Services for providing the details of the towed streamer EM system.
Conflicts of Interest
The authors declare no conflict of interest.
References
- MacGregor, L.; Sinha, M. Use of marine controlled source electromagnetic sounding for sub-basalt exploration. Geophys. Prospect. 2000, 48, 1091–1106. [Google Scholar] [CrossRef]
- Edwards, N. Marine Controlled Source Electromagnetics: Principles, Methodologies, Future Commercial Applications. Surv. Geophys. 2005, 26, 675–700. [Google Scholar] [CrossRef]
- Constable, S.; Srnka, L.J. An introduction to marine controlled-source electromagnetic methods for hydrocarbon exploration. Geophysics 2007, 72, WA3–WA12. [Google Scholar] [CrossRef]
- MacGregor, L.; Tomlinson, J. Marine controlled-source electromagnetic methods in the hydrocarbon industry: A tutorial on method and practice. Interpretation 2014, 2, SH13–SH32. [Google Scholar] [CrossRef]
- Ellingsrud, S.; Eidesmo, T.; Johansen, S.; Sinha, M.C.; MacGregor, L.M.; Constable, S. Remote sensing of hydrocarbon layers by seabed logging (SBL): Results from a cruise offshore Angola. Lead. Edge 2002, 21, 972–982. [Google Scholar] [CrossRef]
- Barker, N.D.; Morten, J.P.; Shantsev, D.V. Optimizing EM data acquisition for continental shelf exploration. Lead. Edge 2012, 1276–1284. [Google Scholar] [CrossRef]
- Linfoot, J.P.; Clarke, C.; Mattsson, J.; Price, D. Modeling and analysis of towed EM data—An Example from a North Sea field trial. Presented at the 73rd Annual International Conference and Exhibition (EAGE), Vienna, Austria, 23–26 May 2011. [Google Scholar]
- Zhdanov, M.S.; Cuma, M.; Endo, M.; Cox, L.H.; Wilson, G.A.; Linfoot, J. The first practical 3D inversion of towed streamer EM data from the Troll field trial. In Proceedings of the SEG Las Vegas 2012 Annual Meeting, Las Vegas, NV, USA, 4–9 November 2012. [Google Scholar]
- Linfoot, J.; Mattsson, J.; Price, D. Case study of a towed streamer EM survey over the Troll field, North Sea. In Proceedings of the SEG San Antonio 2011 Annual Meeting, San Antonio, TX, USA, 18–23 September 2011; pp. 594–598. [Google Scholar]
- Engelmark, F.; Mattsson, J.; Linfoot, J. Efficient marine CSEM with a towed acquisition system. In Proceedings of the 21st EM Induction Workshop, Darwin, Australia, 25–31 July 2012. [Google Scholar]
- Mittet, R. Normalized amplitude ratios for frequency-domain CSEM in very shallow water. First Break 2008, 26, 47–54. [Google Scholar] [CrossRef]
- Mittet, R.; Morten, J.P. Detection and imaging sensitivity of the marine CSEM method. Geophysics 2012, 77, E411–E425. [Google Scholar] [CrossRef]
- Myer, D.; Constable, S.; Key, K. CSEM uncertainties and inversion. In Proceedings of the SEG Las Vegas 2012 Annual Meeting, Las Vegas, NV, USA, 4–9 November 2012. [Google Scholar]
- Roth, F.; Jensen, H.; Berre, L.; Hansen, K.; Barker, N. Multi-component, full-azimuth 3D CSEM data acquisition. In Proceedings of the SEG Dubai 2016 Workshop, Dubai, UAE, 4–6 October 2016; pp. 1–3. [Google Scholar]
- Shantsev, D.V.; Roth, F.; Ramsfjell, H. Surface towing versus deep towing in marine CSM. In Proceedings of the SEG Las Vegas 2012 Annual Meeting, Las Vegas, NV, USA, 4–9 November 2012. [Google Scholar]
- Mittet, R.; Morten, J.P. The marine controlled-source electromagnetic method in shallow water. Geophysics 2013, 78, E67–E77. [Google Scholar] [CrossRef]
- Maaø, F.A.; Nguyen, A.K. Enhanced subsurface response for marine CSEM surveying. Geophysics 2010, 75, A7–A10. [Google Scholar] [CrossRef]
- Mattsson, J.; Lindqvist, P.; Juhasz, R.; Erik, B. Noise reduction and error analysis for a towed EM. In Proceedings of the SEG Las Vegas 2012 Annual Meeting, Las Vegas, NV, USA, 4–9 November 2012. [Google Scholar]
- Key, K. Marine EM inversion using unstructured grids: A 2D parallel adaptive finite element algorithm. In Proceedings of the SEG Las Vegas 2012 Annual Meeting, Las Vegas, NV, USA, 4–9 November 2012; pp. 1–5. [Google Scholar]
- Key, K. MARE2DEM: A 2-D inversion code for controlled-source electromagnetic and magnetotelluricdata. Geophys. J. Int. 2016, 207, 571–588. [Google Scholar] [CrossRef]
- Constable, S.C.; Parker, R.L.; Constable, C.G. Occam’s inversion—A practical algorithm for generating smooth models from electromagnetic sounding data. Geophysics 1987, 52, 289–300. [Google Scholar] [CrossRef]
- Key, K. 1D inversion of multi-component, multi-frequency marine CSEM data: Methodology and synthetic studies for resolving thin resistive layers. Geophysics 2009, 74, F9–F20. [Google Scholar] [CrossRef]
- Harb, N.; Haddad, K.; Farkh, S. Calculation of transverse resistance to correct aquifer resistivity of groundwater saturated zones: Implications for estimating its hydrogeological properties. Leban. Sci. J. 2010, 11, 105–115. [Google Scholar]
- Baltar, D.; Roth, F. Reserves estimation methods for prospect evaluation with 3D CSEM data. Frist Break 2013, 31, 103–111. [Google Scholar]
- Guo, Z.; Dong, H.; Liu, J. Comparison of marine controlled-source electromagnetic data acquisition systems by a reservoir sensitivity index: Analyzing the effect of water depths. Acta Oceanol. Sin. 2016, 35, 113–119. [Google Scholar] [CrossRef]
- Malmberg, J.A.; Mattsson, J. Large-scale 3D inversion of Towed Streamer Electromagnetic data using the Gauss-Newton method. In SEG Technical Program Expanded Abstracts; Society of Exploration Geophysicists: Houston, TX, USA, 2017; pp. 1142–1143. [Google Scholar]
Figure 1.
Typical in-line towing configuration of the Sea Bed Logging (SBL) system.
Figure 1.
Typical in-line towing configuration of the Sea Bed Logging (SBL) system.
Figure 2.
Typical in-line towing configuration of the towed streamer electromagnetic (TSEM) system.
Figure 2.
Typical in-line towing configuration of the towed streamer electromagnetic (TSEM) system.
Figure 3.
Geometry of a thin resistive layer model for Case 1 and Case 2.
Figure 3.
Geometry of a thin resistive layer model for Case 1 and Case 2.
Figure 4.
Sensitivity to the resistive layer target variation with frequency and offset for the (a) SBL system and (b) TSEM system.
Figure 4.
Sensitivity to the resistive layer target variation with frequency and offset for the (a) SBL system and (b) TSEM system.
Figure 5.
The synthetic data measured by the SBL system in different reservoir absolute depths at (a) 0.25 Hz and (b) 0.75 Hz.
Figure 5.
The synthetic data measured by the SBL system in different reservoir absolute depths at (a) 0.25 Hz and (b) 0.75 Hz.
Figure 6.
The synthetic data measured by the TSEM system in different reservoir absolute depths at (a) 0.25 Hz and (b) 0.75 Hz. The horizontal black line is 1, which represents the detection threshold.
Figure 6.
The synthetic data measured by the TSEM system in different reservoir absolute depths at (a) 0.25 Hz and (b) 0.75 Hz. The horizontal black line is 1, which represents the detection threshold.
Figure 7.
A thin resistive layered model embedded in a conductive background medium for analysis of the response for Case 3 and Case 4.
Figure 7.
A thin resistive layered model embedded in a conductive background medium for analysis of the response for Case 3 and Case 4.
Figure 8.
Resistivity image inverted from SBL (left) and TSEM (right) data for a 300 m water depth. The reservoir absolutely depths were 1.2 km in (a) and (b), 1.6 km in (c) and (d), 2.0 km in (e) and (f), 2.4 km in (g) and (h), respectively.
Figure 8.
Resistivity image inverted from SBL (left) and TSEM (right) data for a 300 m water depth. The reservoir absolutely depths were 1.2 km in (a) and (b), 1.6 km in (c) and (d), 2.0 km in (e) and (f), 2.4 km in (g) and (h), respectively.
Figure 9.
Resistivity image inverted from SBL (left) and TSEM (right) data for a 500 m water depth. The reservoir absolutely depths were 1.2 km in (a) and (b), 1.6 km in (c) and (d), 2.0 km in (e) and (f), 2.4 km in (g) and (h), respectively.
Figure 9.
Resistivity image inverted from SBL (left) and TSEM (right) data for a 500 m water depth. The reservoir absolutely depths were 1.2 km in (a) and (b), 1.6 km in (c) and (d), 2.0 km in (e) and (f), 2.4 km in (g) and (h), respectively.
Figure 10.
Resistivity image inverted from SBL (left) and TSEM (right) data for a 700 m water depth. The reservoir absolutely depths were 1.2 km in (a) and (b), 1.6 km in (c) and (d), 2.0 km in (e) and (f), 2.4 km in (g) and (h), respectively.
Figure 10.
Resistivity image inverted from SBL (left) and TSEM (right) data for a 700 m water depth. The reservoir absolutely depths were 1.2 km in (a) and (b), 1.6 km in (c) and (d), 2.0 km in (e) and (f), 2.4 km in (g) and (h), respectively.
Figure 11.
Resistivity image inverted from SBL (left) and TSEM (right) data for a 300 m water depth and the reservoir buried depth of 1 km. The reservoir lengths were 2.0 km in (a) and (b), 1.5 km in (c) and (d), and 1.0 km in (e) and (f), respectively.
Figure 11.
Resistivity image inverted from SBL (left) and TSEM (right) data for a 300 m water depth and the reservoir buried depth of 1 km. The reservoir lengths were 2.0 km in (a) and (b), 1.5 km in (c) and (d), and 1.0 km in (e) and (f), respectively.
Figure 12.
Thin resistive targets (reservoir (HC)) model embedded in a conductive background medium (sandstone) for analyzing the horizontal resolution (Case 5).
Figure 12.
Thin resistive targets (reservoir (HC)) model embedded in a conductive background medium (sandstone) for analyzing the horizontal resolution (Case 5).
Figure 13.
Inversion results from the SBL system (left) and TSEM system (right) for a 300 m water depth. The thickness of the reservoir was 100 m. The length of the two reservoirs was 2.0 km and the distance between the two reservoirs was 2.0 km in (a) and (b), and 1.0 km in (c) and (d).
Figure 13.
Inversion results from the SBL system (left) and TSEM system (right) for a 300 m water depth. The thickness of the reservoir was 100 m. The length of the two reservoirs was 2.0 km and the distance between the two reservoirs was 2.0 km in (a) and (b), and 1.0 km in (c) and (d).
Figure 14.
The Anomalous Transverse Resistance (ATR) ratio variation with reservoir depth employing the SBL system (solid line) and TSEM system (dashed line) for a water depth of 300 m (a), 500 m (b), 700 m (c), and 900 m (d).
Figure 14.
The Anomalous Transverse Resistance (ATR) ratio variation with reservoir depth employing the SBL system (solid line) and TSEM system (dashed line) for a water depth of 300 m (a), 500 m (b), 700 m (c), and 900 m (d).
Table 1.
Cases for sensitivity and resolution comparison.
Table 1.
Cases for sensitivity and resolution comparison.
| Cases | Goals | Method |
|---|
| Case 1 | Sensitivity with frequency and offset | Sensitivity modeling |
| Case 2 | Sensitivity with buried depth | Sensitivity modeling |
| Case 3 | Depth resolution | Occam inversion |
| Case 4 | Sensitivity VS target dimensions | Occam inversion |
| Case 5 | Horizontal resolution | Occam inversion |
| Case 6 | Detectable limitation | ATR ratio |
Table 2.
The CSEM acquisition parameters.
Table 2.
The CSEM acquisition parameters.
| Parameters | Sea Bed Logging | Towed Streamer Electromagnetic |
|---|
| Source distance | 200 m | 250 m |
| Frequencies | 0.25 Hz, 0.75 Hz | 0.25 Hz, 0.75 Hz |
| Noise floor | 10−15 V/Am2 | 10−15 V/Am2 |
| Standard error | 0.1 | 0.2 |
| Source length | 270 m | 800 m |
| Source location | 30 m above the seafloor | 10 m below the sea surface |
| Receivers position and spacing | On the seafloor & 1 km | 100 m below sea surface & 160 m |
© 2018 by the authors. Licensee MDPI, Basel, Switzerland. This article is an open access article distributed under the terms and conditions of the Creative Commons Attribution (CC BY) license (http://creativecommons.org/licenses/by/4.0/).
