1. Introduction
Massive prospection activities and natural gas production has been seen offshore the North Adriatic Sea since the 1960s. Because of the high urbanization rate of the North Adriatic coast, particular attention has been paid to predicting long-term induced subsidence, as good practice of a sustainable oil industry approach [
1,
2]. To this end, numerous fluid-flow and geomechanical numerical models have been set up and eventually calibrated to analyze the phenomena both at single reservoir scale as well as at global regional scale [
3,
4,
5,
6].
The North Adriatic gas bearing formations are complex, multi-layered and connected to large aquifers—in fact they often share common aquifers. Production can induce non-homogeneous depletion because of different aquifer influxes and high formation anisotropy, which usually generates permeability barriers in the vertical flow direction. Furthermore, in case of shallow and weakly compacted reservoirs, petrophysical effects (in terms of porosity and permeability variation) relating to compaction can be particularly pronounced. In this scenario, subsidence induced by reservoir compaction can be very complex phenomena.
Compaction and subsidence analyses via numerical modeling approaches can be performed with different increasing degrees of coupling between fluid-flow and stress-strain phenomena [
7,
8,
9]. The one-way coupling technique (or uncoupled approach) represents the lower degree of coupling and it is widely adopted for subsidence analysis because it is a straightforward and less expensive method (in terms of required input parameters and computational time). Nevertheless, only a two-way coupling or a fully coupled approach can capture the effect of rock deformation on petrophysical characteristics (i.e., porosity/permeability) and, consequently, on pressure evolution, particularly pronounced in shallow, poorly consolidated formations [
7,
8,
10].
The scope of this paper is to investigate the effect of coupling techniques for compaction and subsidence phenomena simulation induced in shallow, weakly compacted reservoirs by gas exploitation. To this end, a synthetic case representing a typical off-shore, multi-layered gas reservoir in the North Adriatic Sea was set up and analyzed. These sedimentary sequences exhibit anisotropic permeability, so they represent an appropriate domain to investigate the potential improvement in phenomena simulation via coupling stress and permeability [
5,
6].
Three 3D numerical models were defined, each one dedicated to a specific domain of investigation: (1) geological model representing structural and geological features; (2) fluid-flow model for simulating pressure evolution in time and space; and (3) geomechanical model for predicting the system’s stress-strain behavior. Real data and information from an existing gas-bearing formation in off-shore Croatia was adopted for model set-up. In particular, an accurate geotechnical characterization of the reservoir formation was developed via laboratory tests on available cores. The routine analyses for deformation and strength parameter determination were conducted together with dedicated tests for the definition of the coupling law required by the adopted coupling technique. Fluid flow and stress-strain phenomena evolution was then simulated for different scenarios, in terms of primary drive mechanism and geomechanical characterization together with different degrees of coupling techniques and coupling laws.
2. Case Study Definition
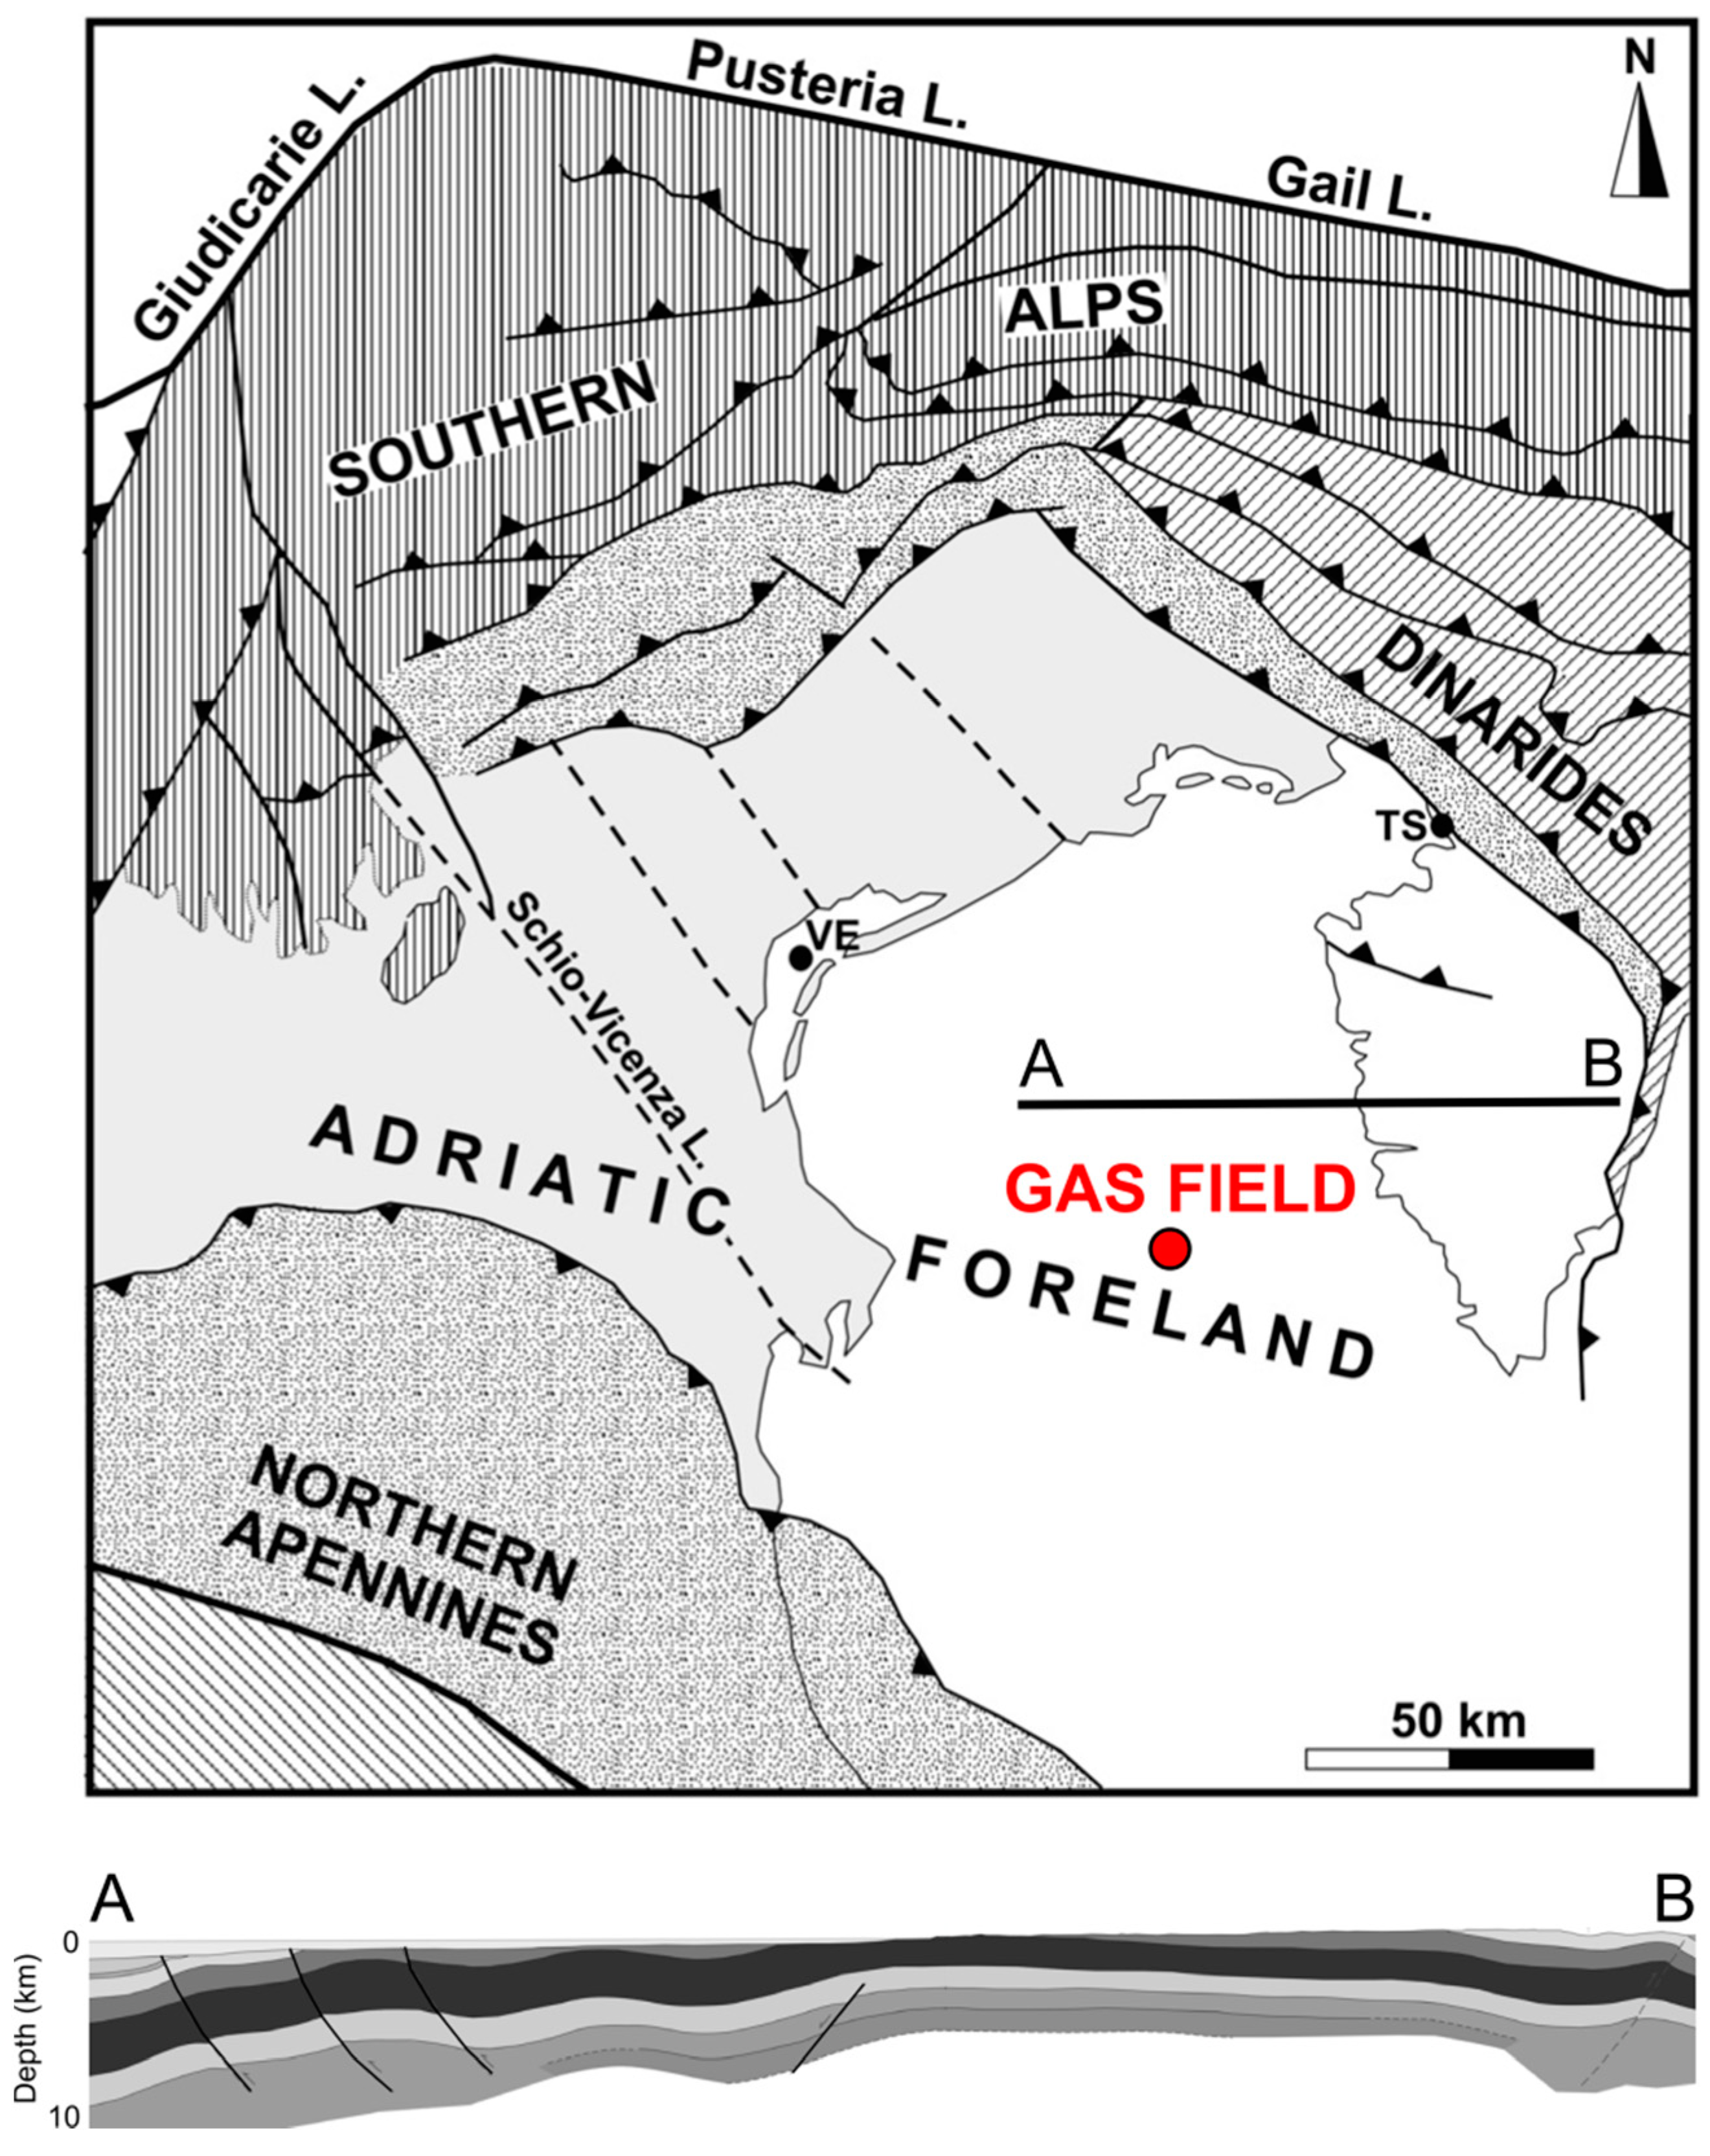
The investigated area (
Figure 1) is the Northern area of the Adriatic basin bounded by three collisional belts: the Dinarides to the E, the Southern Alps to the N and the Northern Appenines to the W. During the Cenozoic the Northern Adriatic basin acted as a foredeep-foreland basin for the three collisional belts and its present day geological configuration is the result of the orogenic history experienced by the surrounding belts during the Paleocene-Eocene (Dinaric system), Miocene-Early Pliocene (Southern Alpine system) and Pliocene-Pleistocene (Apennine system) [
11].
The Cenozoic history was recorded by the basin fill and it is well preserved in the subsurface and, locally, in surface exposures [
14]. Its subsurface stratigraphic and structural framework was essentially defined through seismic reflection data and well data collected for hydrocarbon exploration [
15,
16,
17,
18].
The Late Mesozoic-Early Eocene stratigraphic units consist of carbonate deposits that recorded the regional extension related to the Thetyan rift. The Late Permian-Mid Triassic dolomites, limestones and evaporites were deposited during early stages of the Adria microplate extension; regional extension continued throughout the Mesozoic to Early Eocene leading to the development of shallow-water carbonate platforms separated by deep-water basins [
19]. The extensional regime was followed by Cenozoic compression linked to the convergence between the European and African plates. The Paleocene-Miocene marly hemipelagites (Gallare Group) recorded a basin-wide increase in terrigenous input related to orogenic events.
During the Pliocene, the flexure of the basin margin driven by the ENE-ward migration of the Apennine front caused rapid subsidence and an abrupt marine transgression. As a result, transgressive hemipelagic marine clays (Santerno Formation; Istra Formation according to the Croatian nomenclature) were deposited over a large part of the foreland and foreland ramp, whereas thick turbiditic sequences (Porto Corsini and Porto Garibaldi Fms.) accumulated in the deeper foredeep domain [
20].
From the late Pliocene/Early Pleistocene the Adriatic basin infill recorded the transition from deep-water to deltaic depositional environment due to a gradual decrease of the Appenine compressional deformation and increase of sediment supply from the Po river system. As a consequence of the slope progradation, the Adriatic foredeep migrated SE reaching the central Adriatic Sea. During the Pleistocene-Holocene, the Appeninic progradation was accompanied by the onlap deposition of foredeep turbidites deposits on the W-ward dipping foreland margin. These deposits record a basin-scale tabular geometry developing over gentle anticlines formed through differential compaction of Pliocene-Pleistocene turbidite sandstones. The Pliocene-Pleistocene deposits are represented by clastic sequences of the Carola and Ravenna Formations (Asti Group; Ivana Formation according to the Croatian nomenclature) [
17,
21,
22].
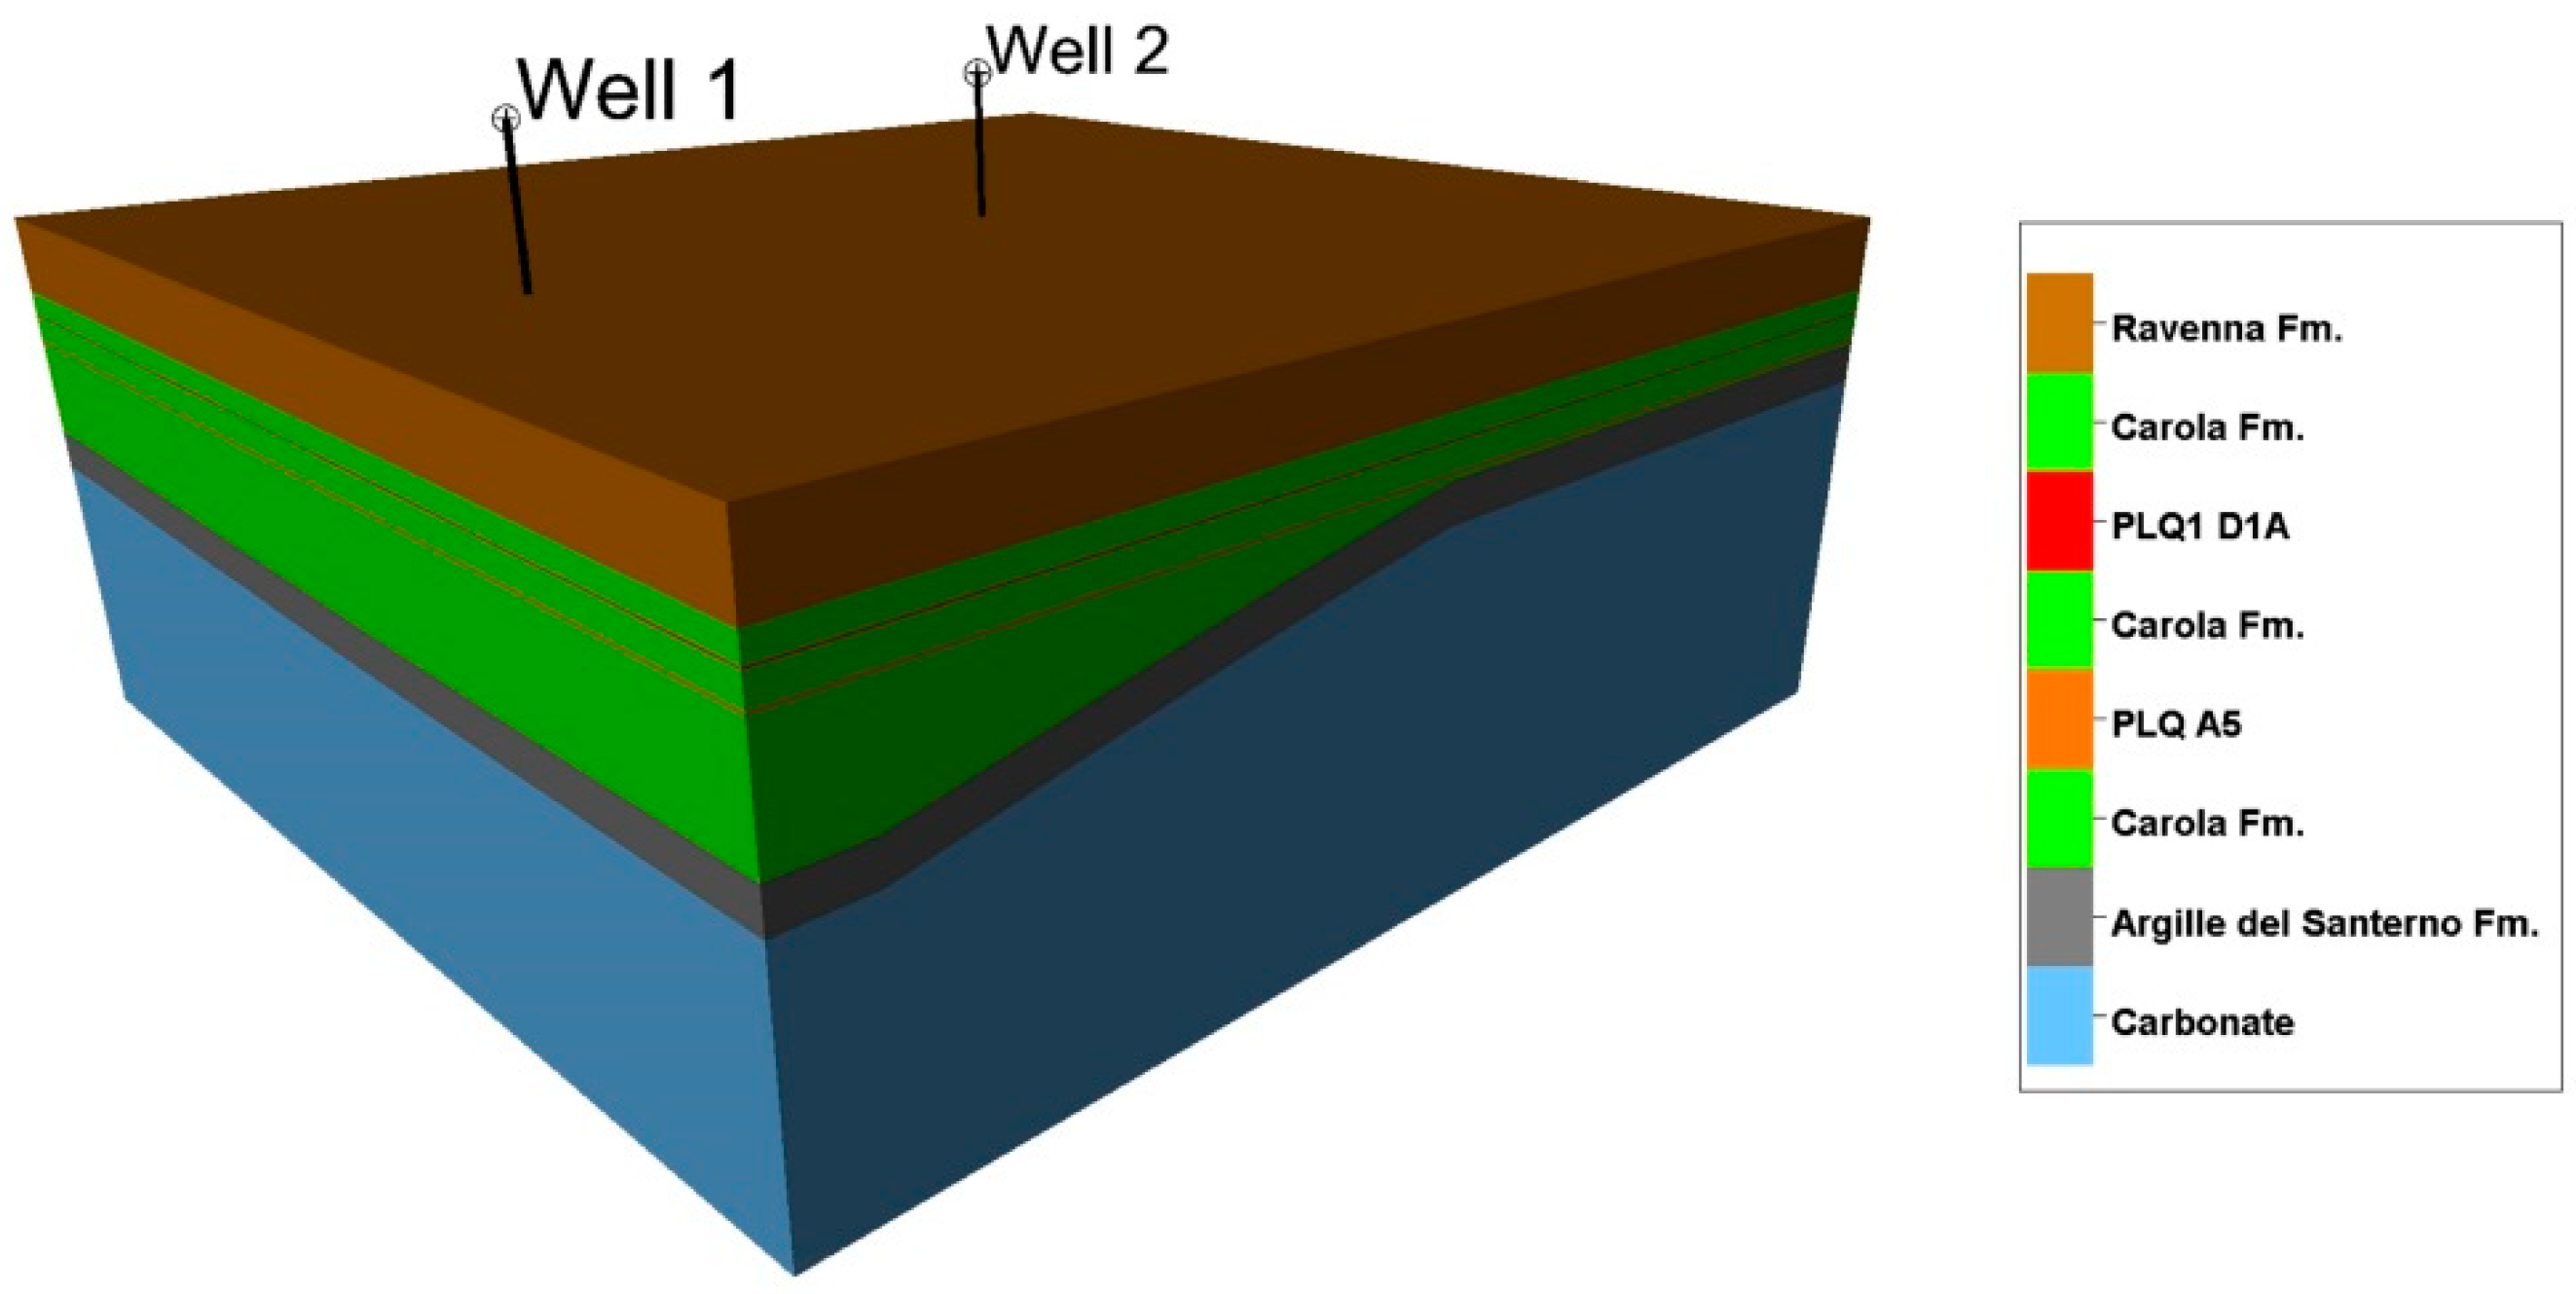
The synthetic model reproduces a typical anticline with gas pool. The reservoir formation is composed of a Pleistocene sedimentary sequence, with a decimeter-thick alternation of sands and silty-clay sands, coherently with the real gas field where the available logs were acquired and the available cores were retrieved. The synthetic reservoir consists of two overlapping pools, named PLQ1 D1A and PLQ A5 (at an average depth of 600 and 800 m below sea level, respectively) which are hydraulically separated. The structural trap is a gentle NW-SE trending anticline. The hydraulic seal of the reservoir is ensured by a continuous clayey layer (Carola Formation) with an average thickness of 5–6 m.
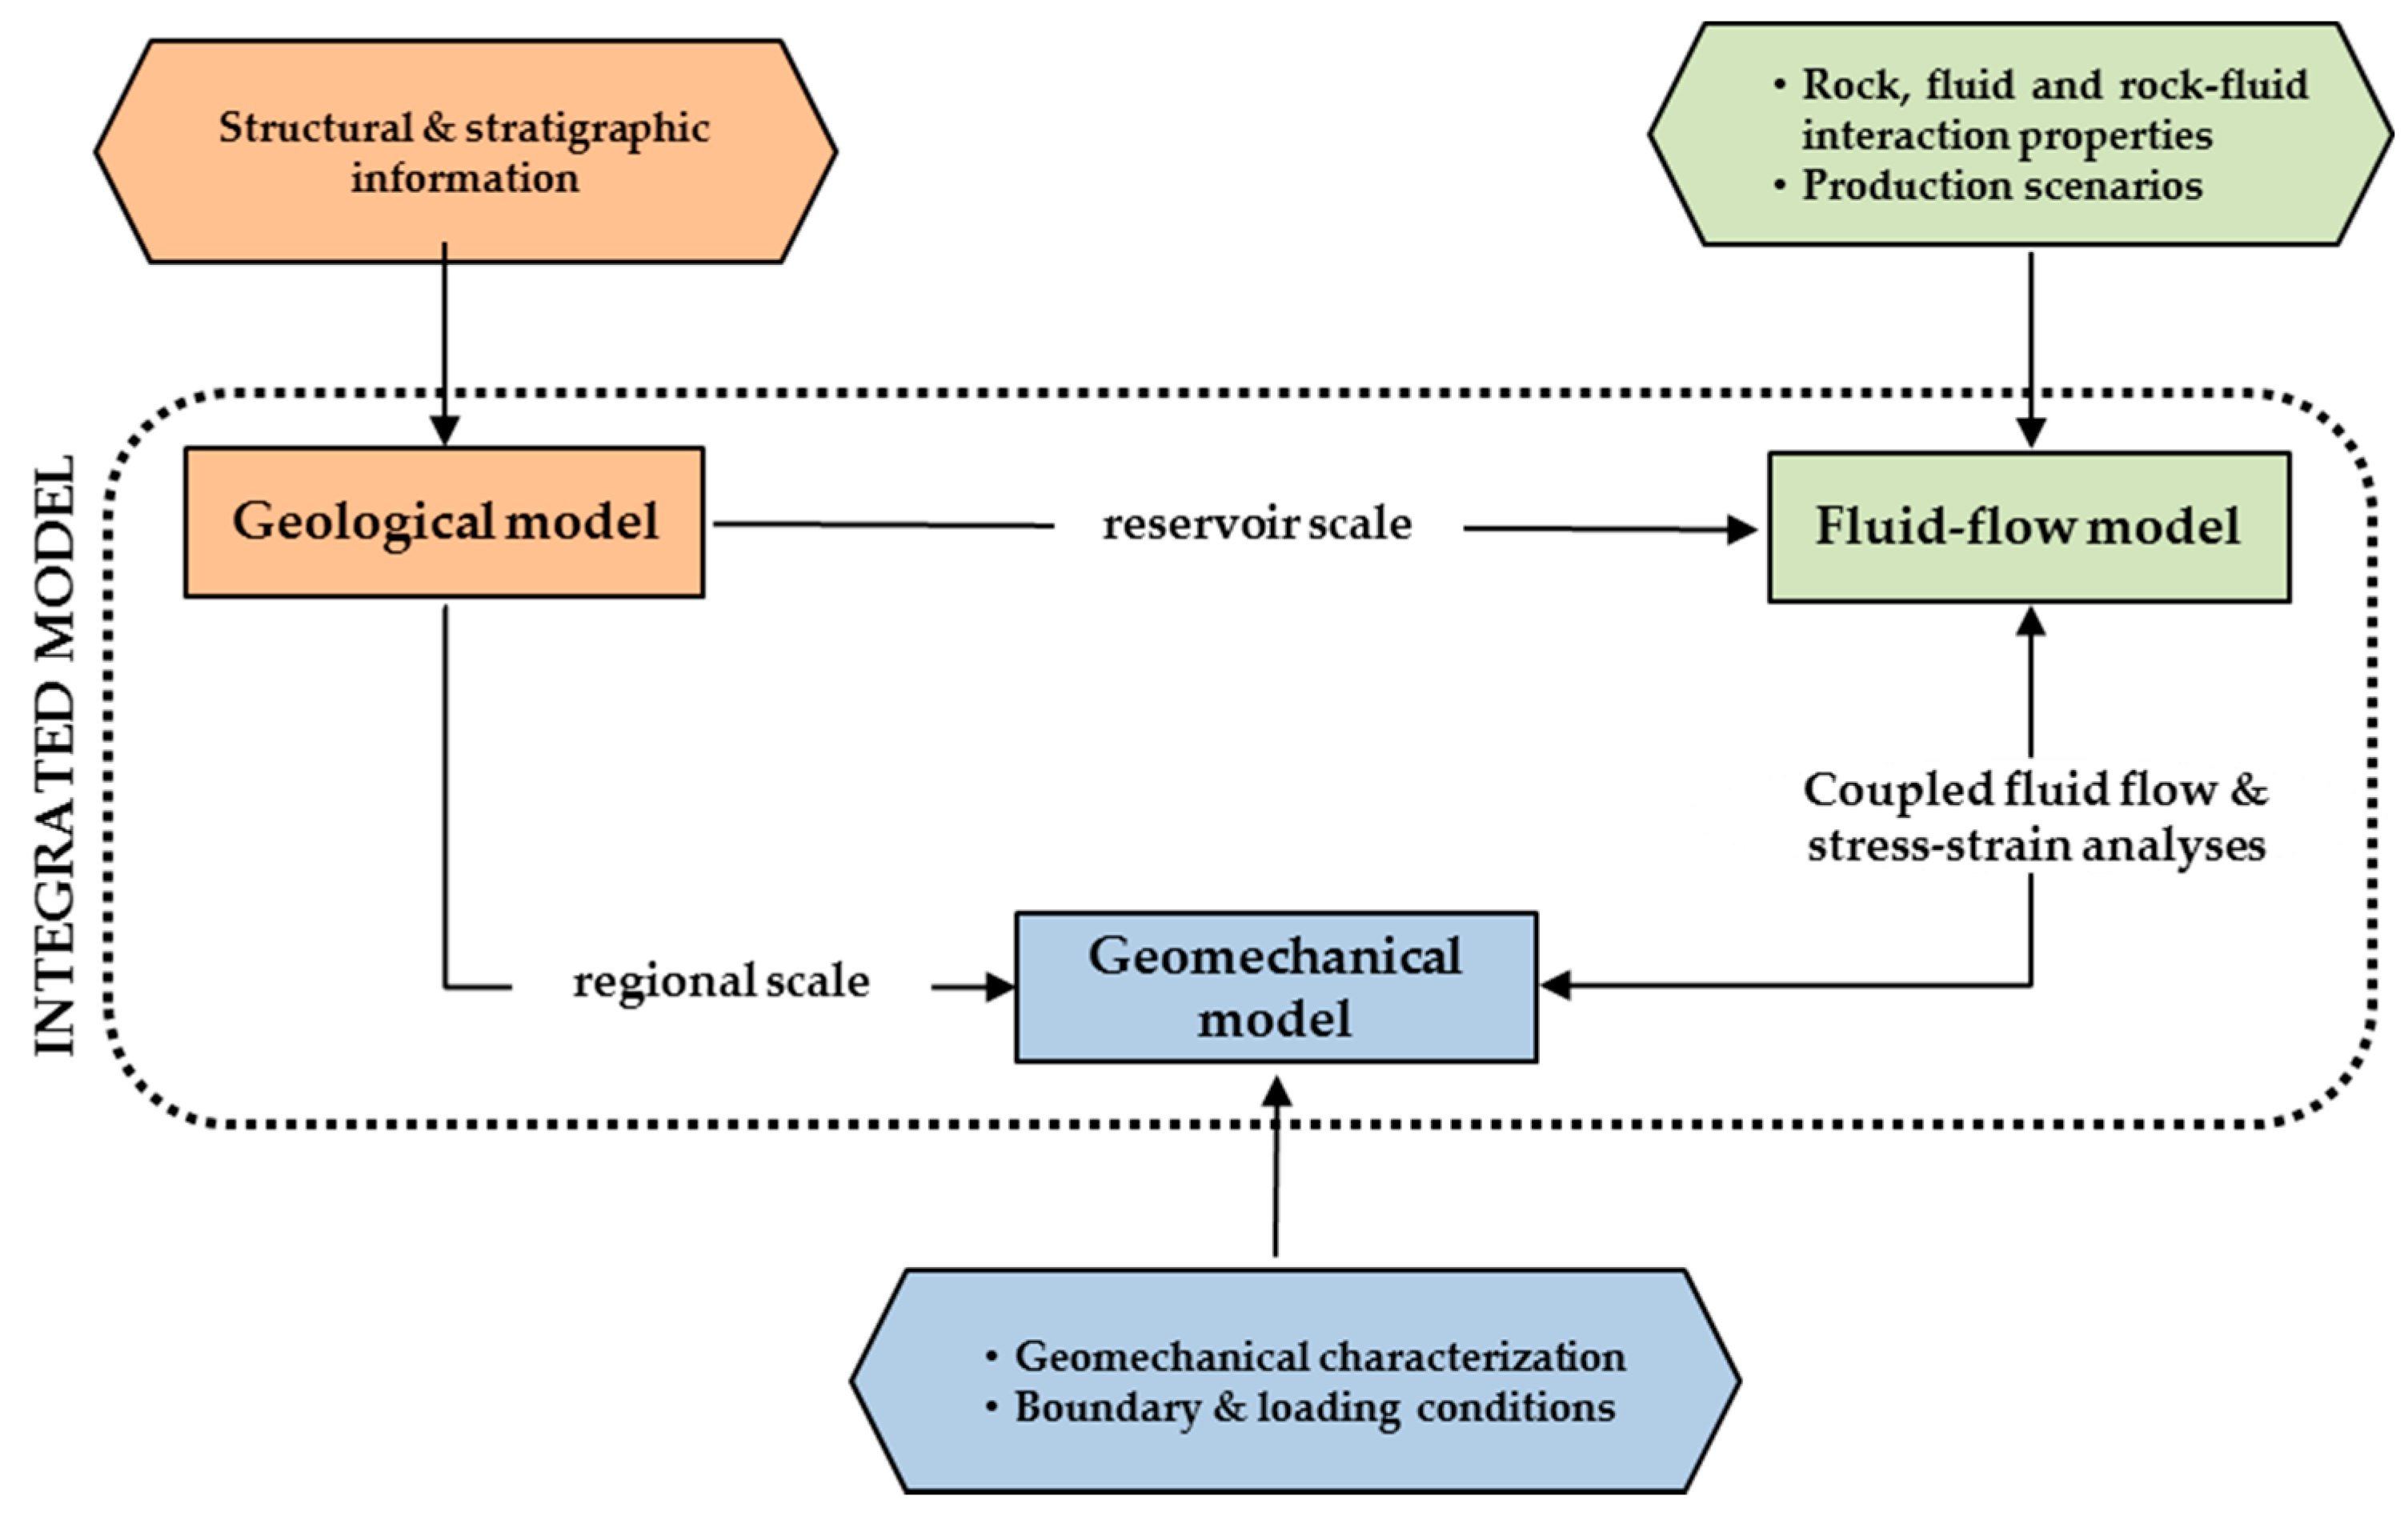
3. Workflow for the integrated model
The coupled fluid-flow and geomechanical analyses can be carried out once the geological, fluid-flow and geomechanical modeling processes have been completed. The different modeling processes can be performed in accordance with each singular workflow, but their later combination is necessary to generate the integrated model (
Figure 2).
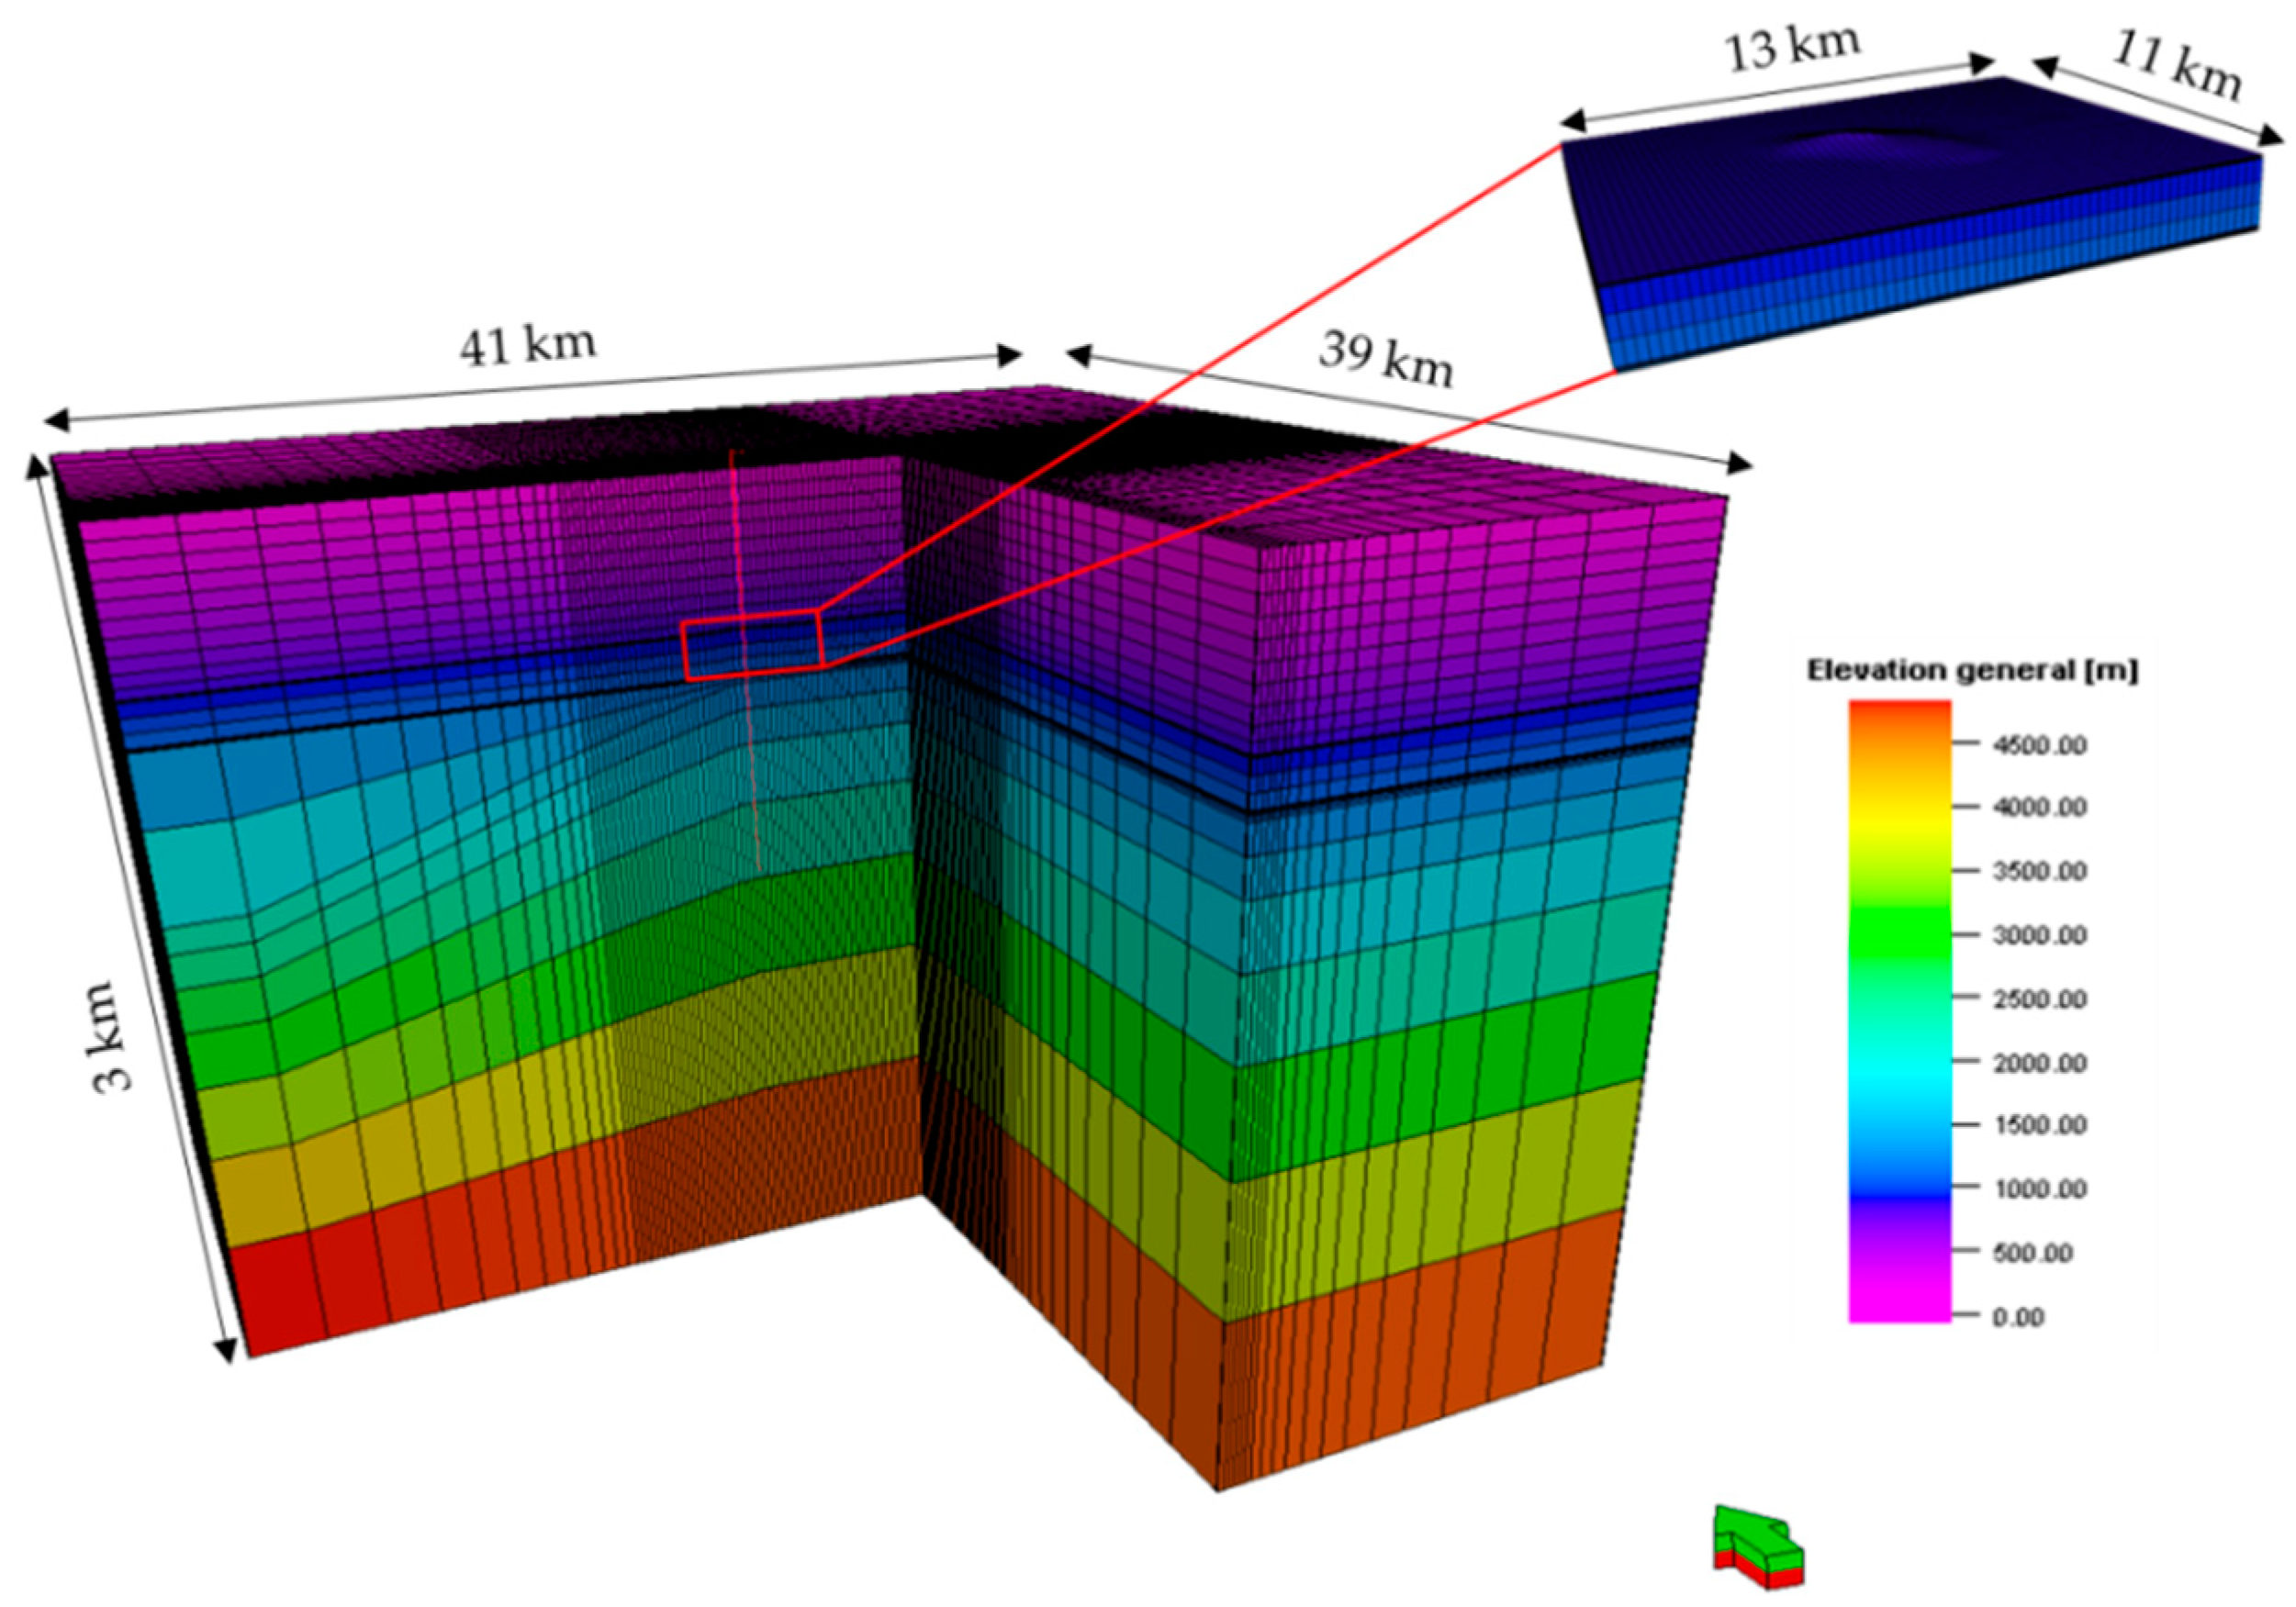
A regional 3D geological model was set up to target the mechanical analysis. The extension of the model at regional scale (41 km × 39 km horizontally, 3 km vertically) ensured an adequate representation of the stratigraphic and structural features in the domain of investigation together with undisturbed boundary conditions (
Figure 3).
The surface interpreted from seismic data [
21] (
Figure 4) provided a map at reservoir scale for the definition of the structural model. This surface was adjusted to available well tops in order to recreate the horizons of the two pools. The top and bottom surfaces of the reservoir were extended and integrated into the model at regional scales. The seismic interpretation (Croatian Hydrocarbon Agency) and well correlation allowed mapping of four marker surfaces corresponding with (from the deepest to the shallowest): the top of the Ravenna Formation, the top of the Carola Formation, the top and the base of the Santerno Formation. The basal surfaces of the model were located inside the carbonate substratum. The literature review also provided useful geological information [
20,
21,
22,
23].
Moreover, the overall regional stratigraphy (
Table 1 and
Figure 5) of the investigated area was inferred from the integrated analysis of the composite well logs (at 1:1000 scale), seismic interpretation and literature [
21].
As for the petrophysical model characterization, initial porosity and permeability were inferred from laboratory tests on samples retrieved from the gas-bearing reservoir in the Carola Formation (off-shore Croatia). The porosity values range from 29% to 36%, while the permeability values show the characteristic high dispersion (from 0.05 mD to 884 mD) of the sand/silty-clay sedimentary alternation. Due to computational limit in fluid-flow simulation the decimeter-thick sequences cannot be numerically reproduced at reservoir level and the up-scaled porosity and permeability values were adopted. The initial porosity was assumed equal to 0.35. The anisotropy in permeability was kept, imposing the horizontal permeability at 250 and 60 mD for levels PLQD1A and PLQA5, respectively, with a significant reduction in vertical permeability.
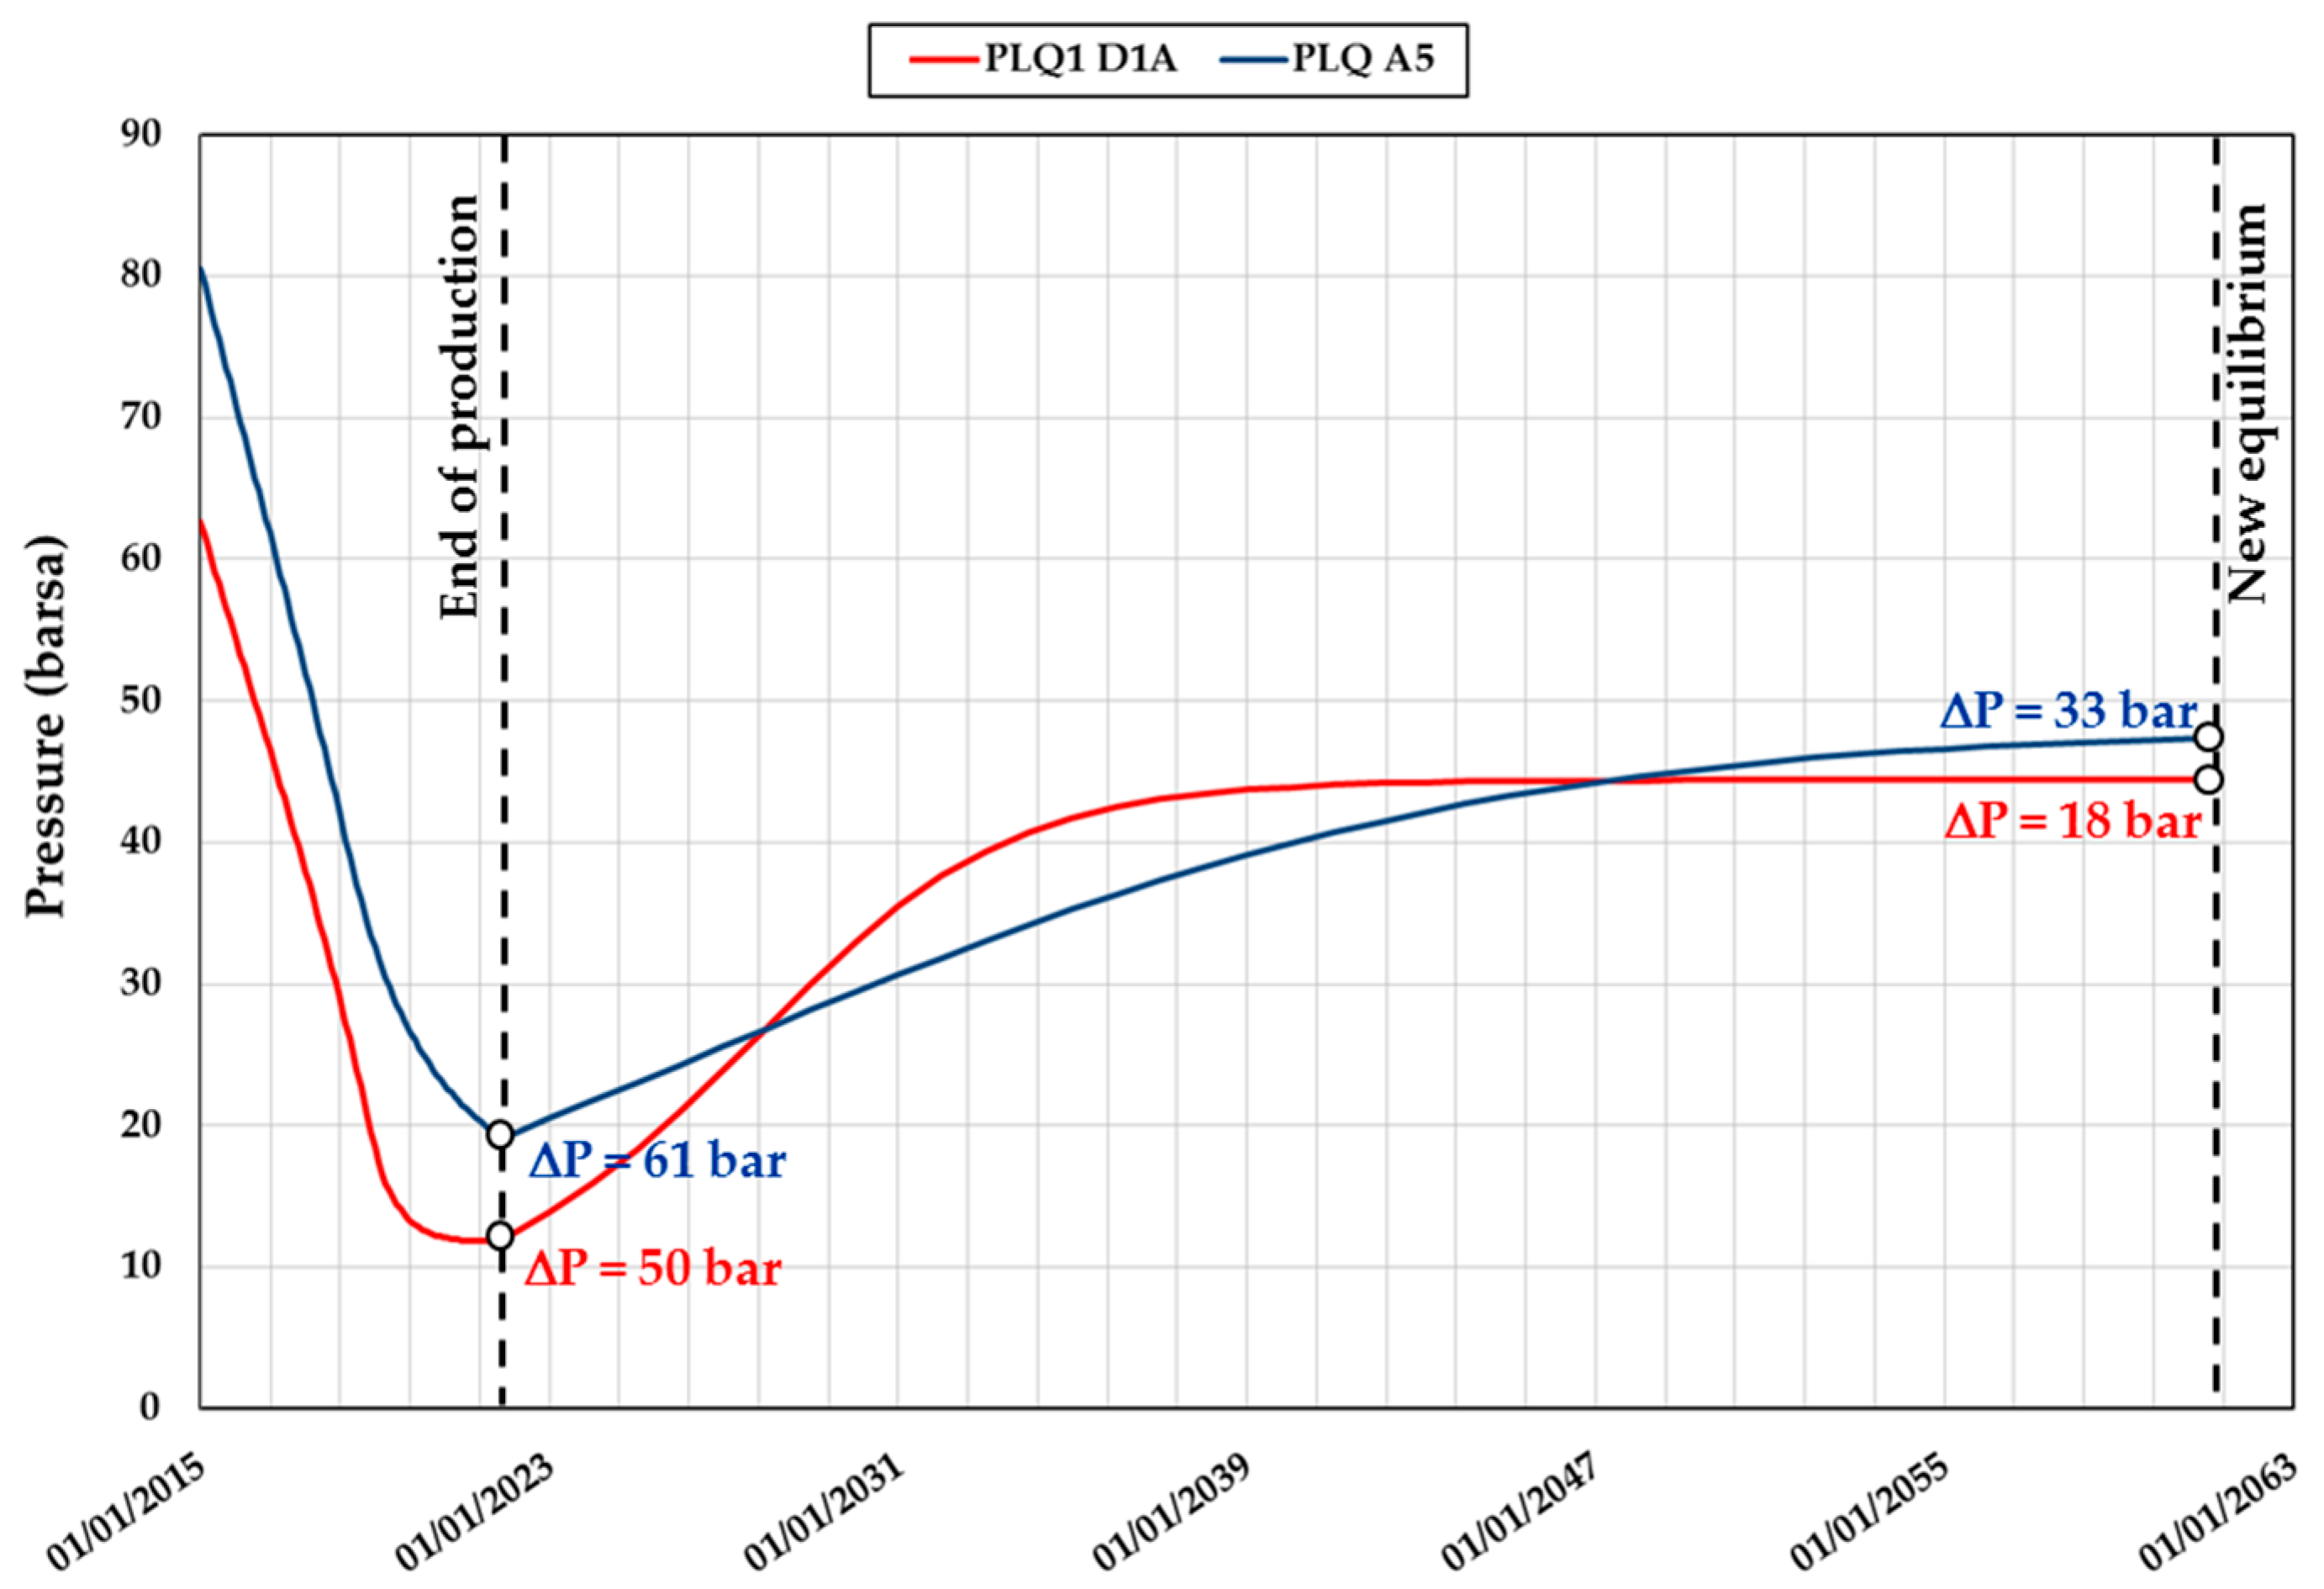
Subsequently, a 3D Finite Difference Method (FDM) fluid-flow model was built upon the geological model as well as all the available petrophysical, fluid and rock-fluid interaction properties. The model comprises both the gas-bearing reservoir and the surrounding aquifer, with total dimension equal to 13 km × 11 km in the areal directions and a total thickness of 180 m. A realistic but stressing exploitation strategy was imposed: a seven-year production period from five wells is followed by a 40-year timeframe to ensure new pressure equilibrium.
A 3D FEM geomechanical model was finally set up based on the geological and structural features together with the key petrophysical and geotechnical properties obtained from laboratory analyses. During the initialization phase, a hydrostatic pressure regime together with normal fault conditions was imposed, in accordance to the available information and data. In particular, the total vertical stress was calculated from rock-density information acquired via wireline logs; the minor principal stress was estimated from hydraulic fracturing measurements and the major horizontal stress from regional trends in the area. The state of stress is gravitational and the vertical effective stress gradient is approximately 0.103 bar/m whereas the minimum horizontal effective stress gradient is 0.062 bar/m. Finally, the initialized model was used as predictive tool to assess the behavior of the system, both in terms of deformation (compaction and subsidence) and evolution of the stress field in the rock mass according to different scenarios.
Several sensitivities were performed to assess the impact of different factors on the evolution of subsidence. In particular, the different dynamic scenarios (i.e., strong aquifer support, medium aquifer support and gas expansion) (
Figure 6) were considered. Furthermore, two geomechanical cases, relating to the choice of the elastic modulus (static and dynamic) used for the geomechanical characterization, were assumed.
3.1. Rock Mass Geotechnical Characterization
The modeled volume was subdivided into different materials identified by their mechanical features, which mainly depend on lithology and geological history. The interpretation of the composite logs (scale 1:1000) used for model construction together with the results of grain-size tests showed five prevailing lithologies in the investigated volume: shales, sand, conglomerates, marls and carbonates. The stratigraphic sequence reproduced in the geomechanical model is shown in
Figure 5. Deformation and strength parameters were assigned to each unit of the stratigraphic sequence (under the assumption of homogeneous and isotropic mechanic behavior) according to geotechnical laboratory test results and literature, as will be described later on.
3.1.1. Routine Geotechnical Laboratory Test
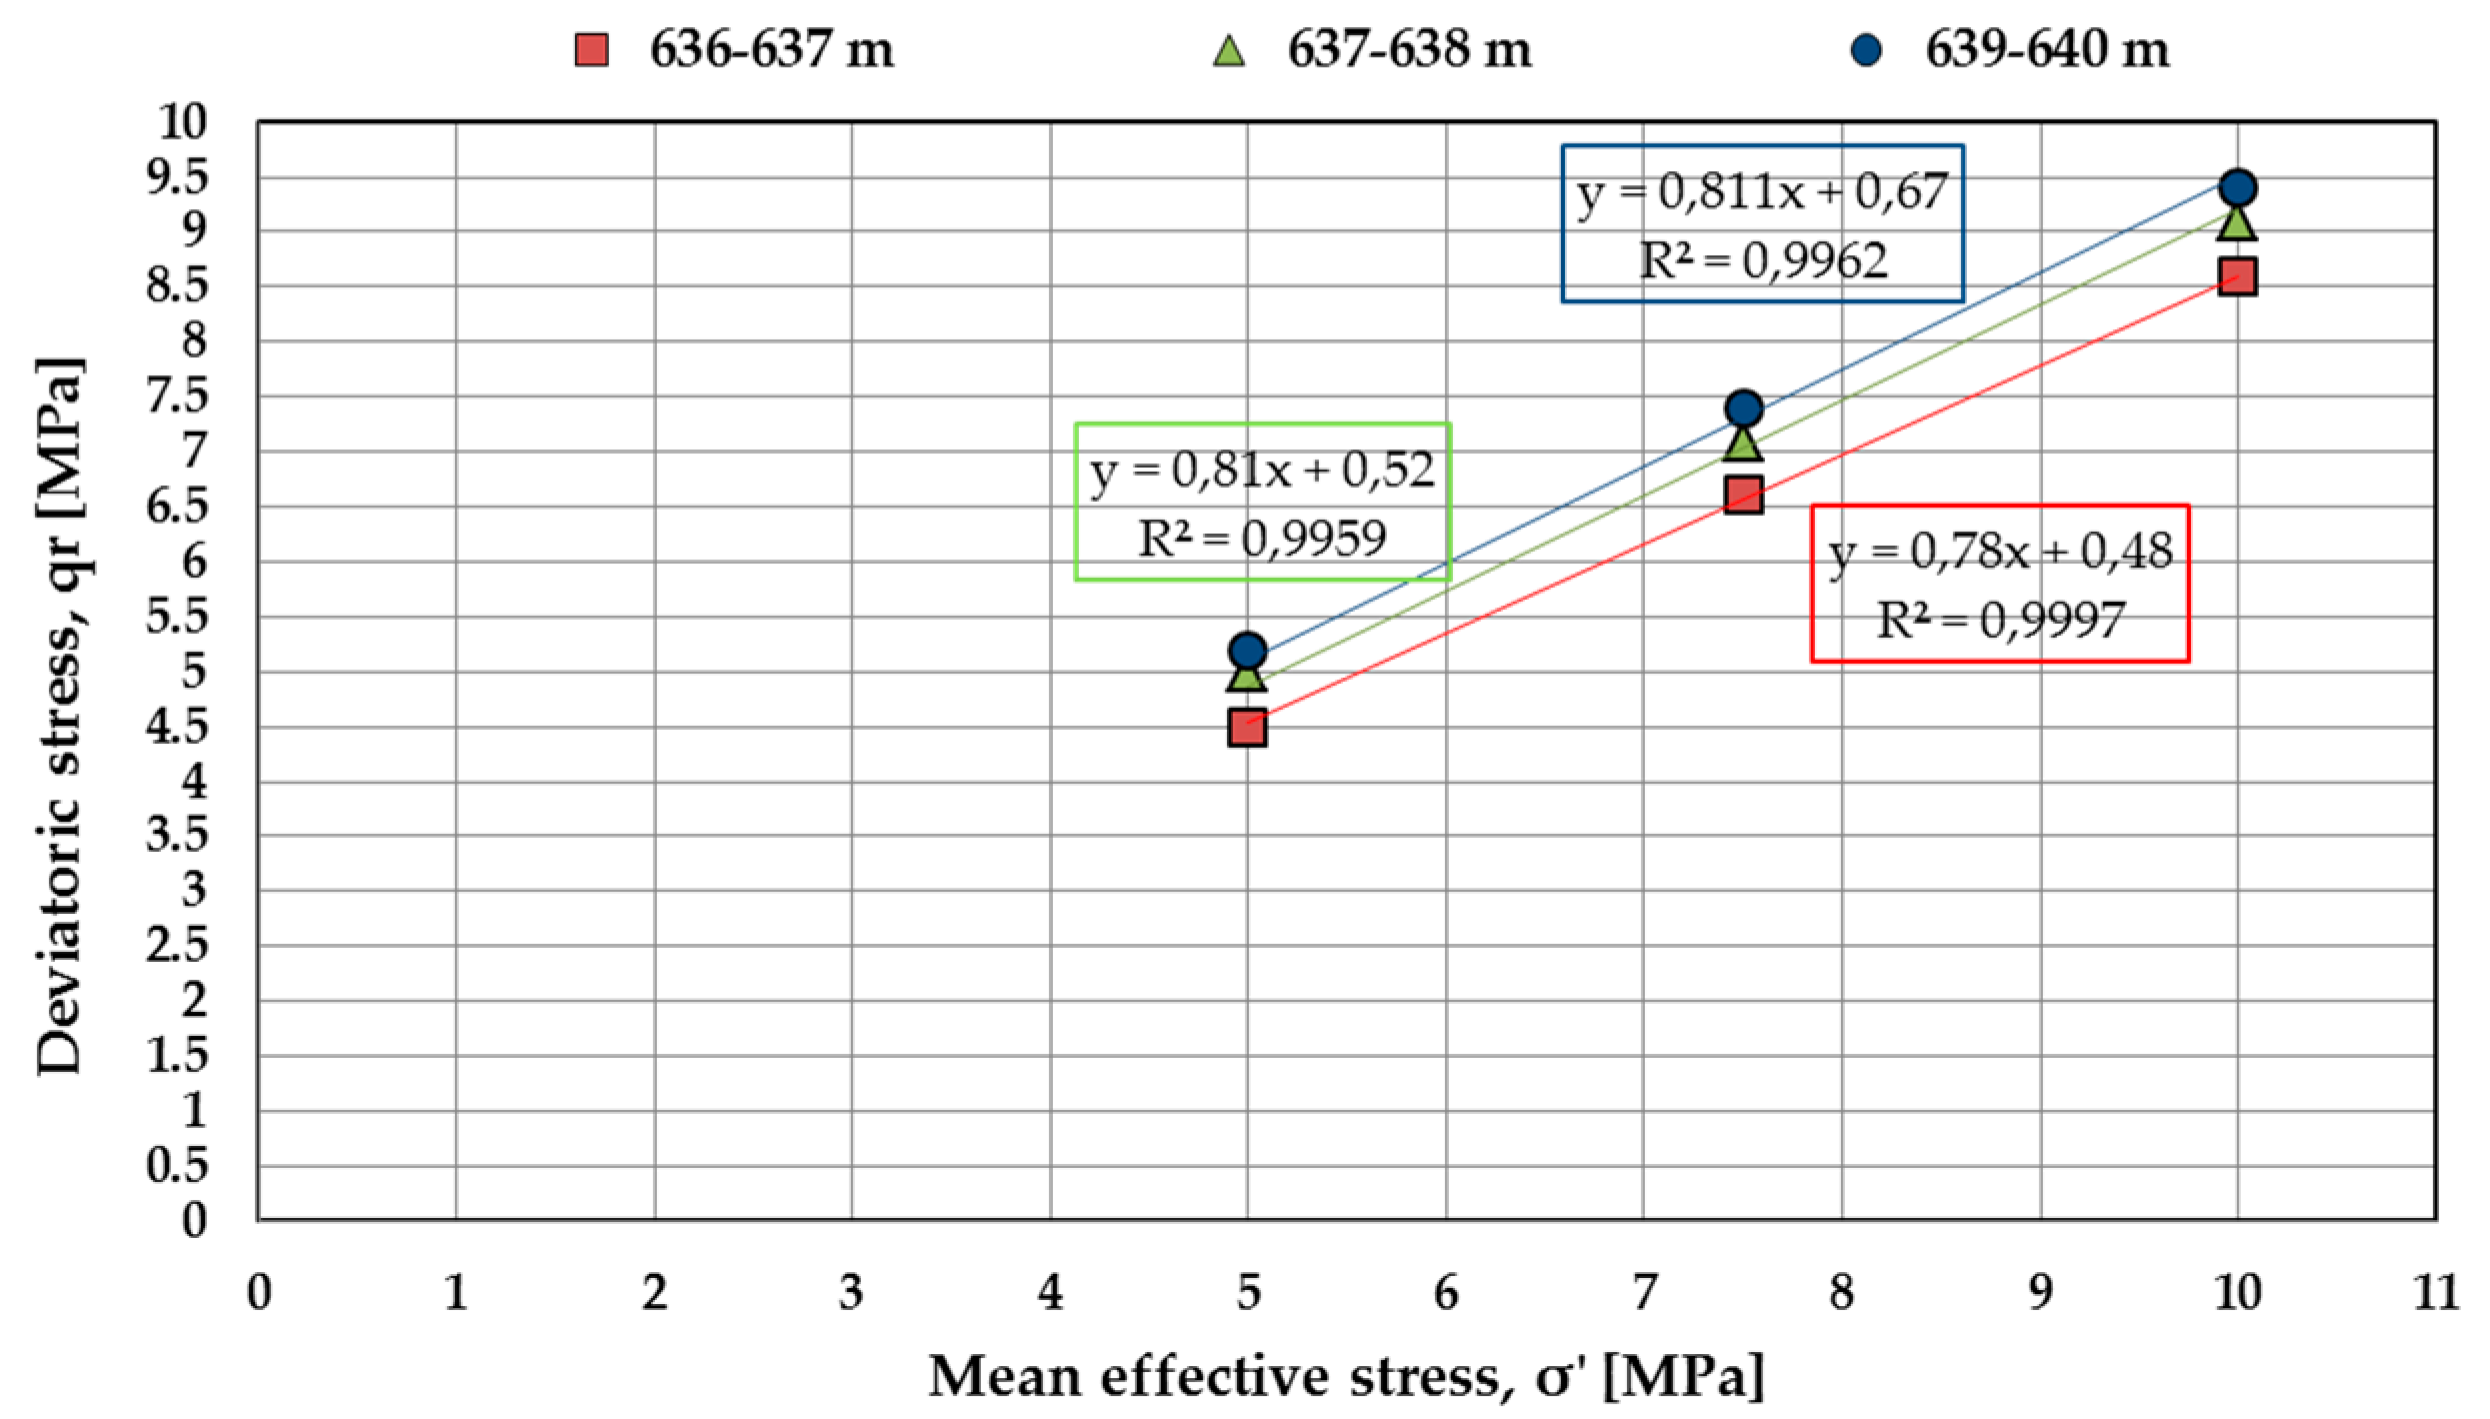
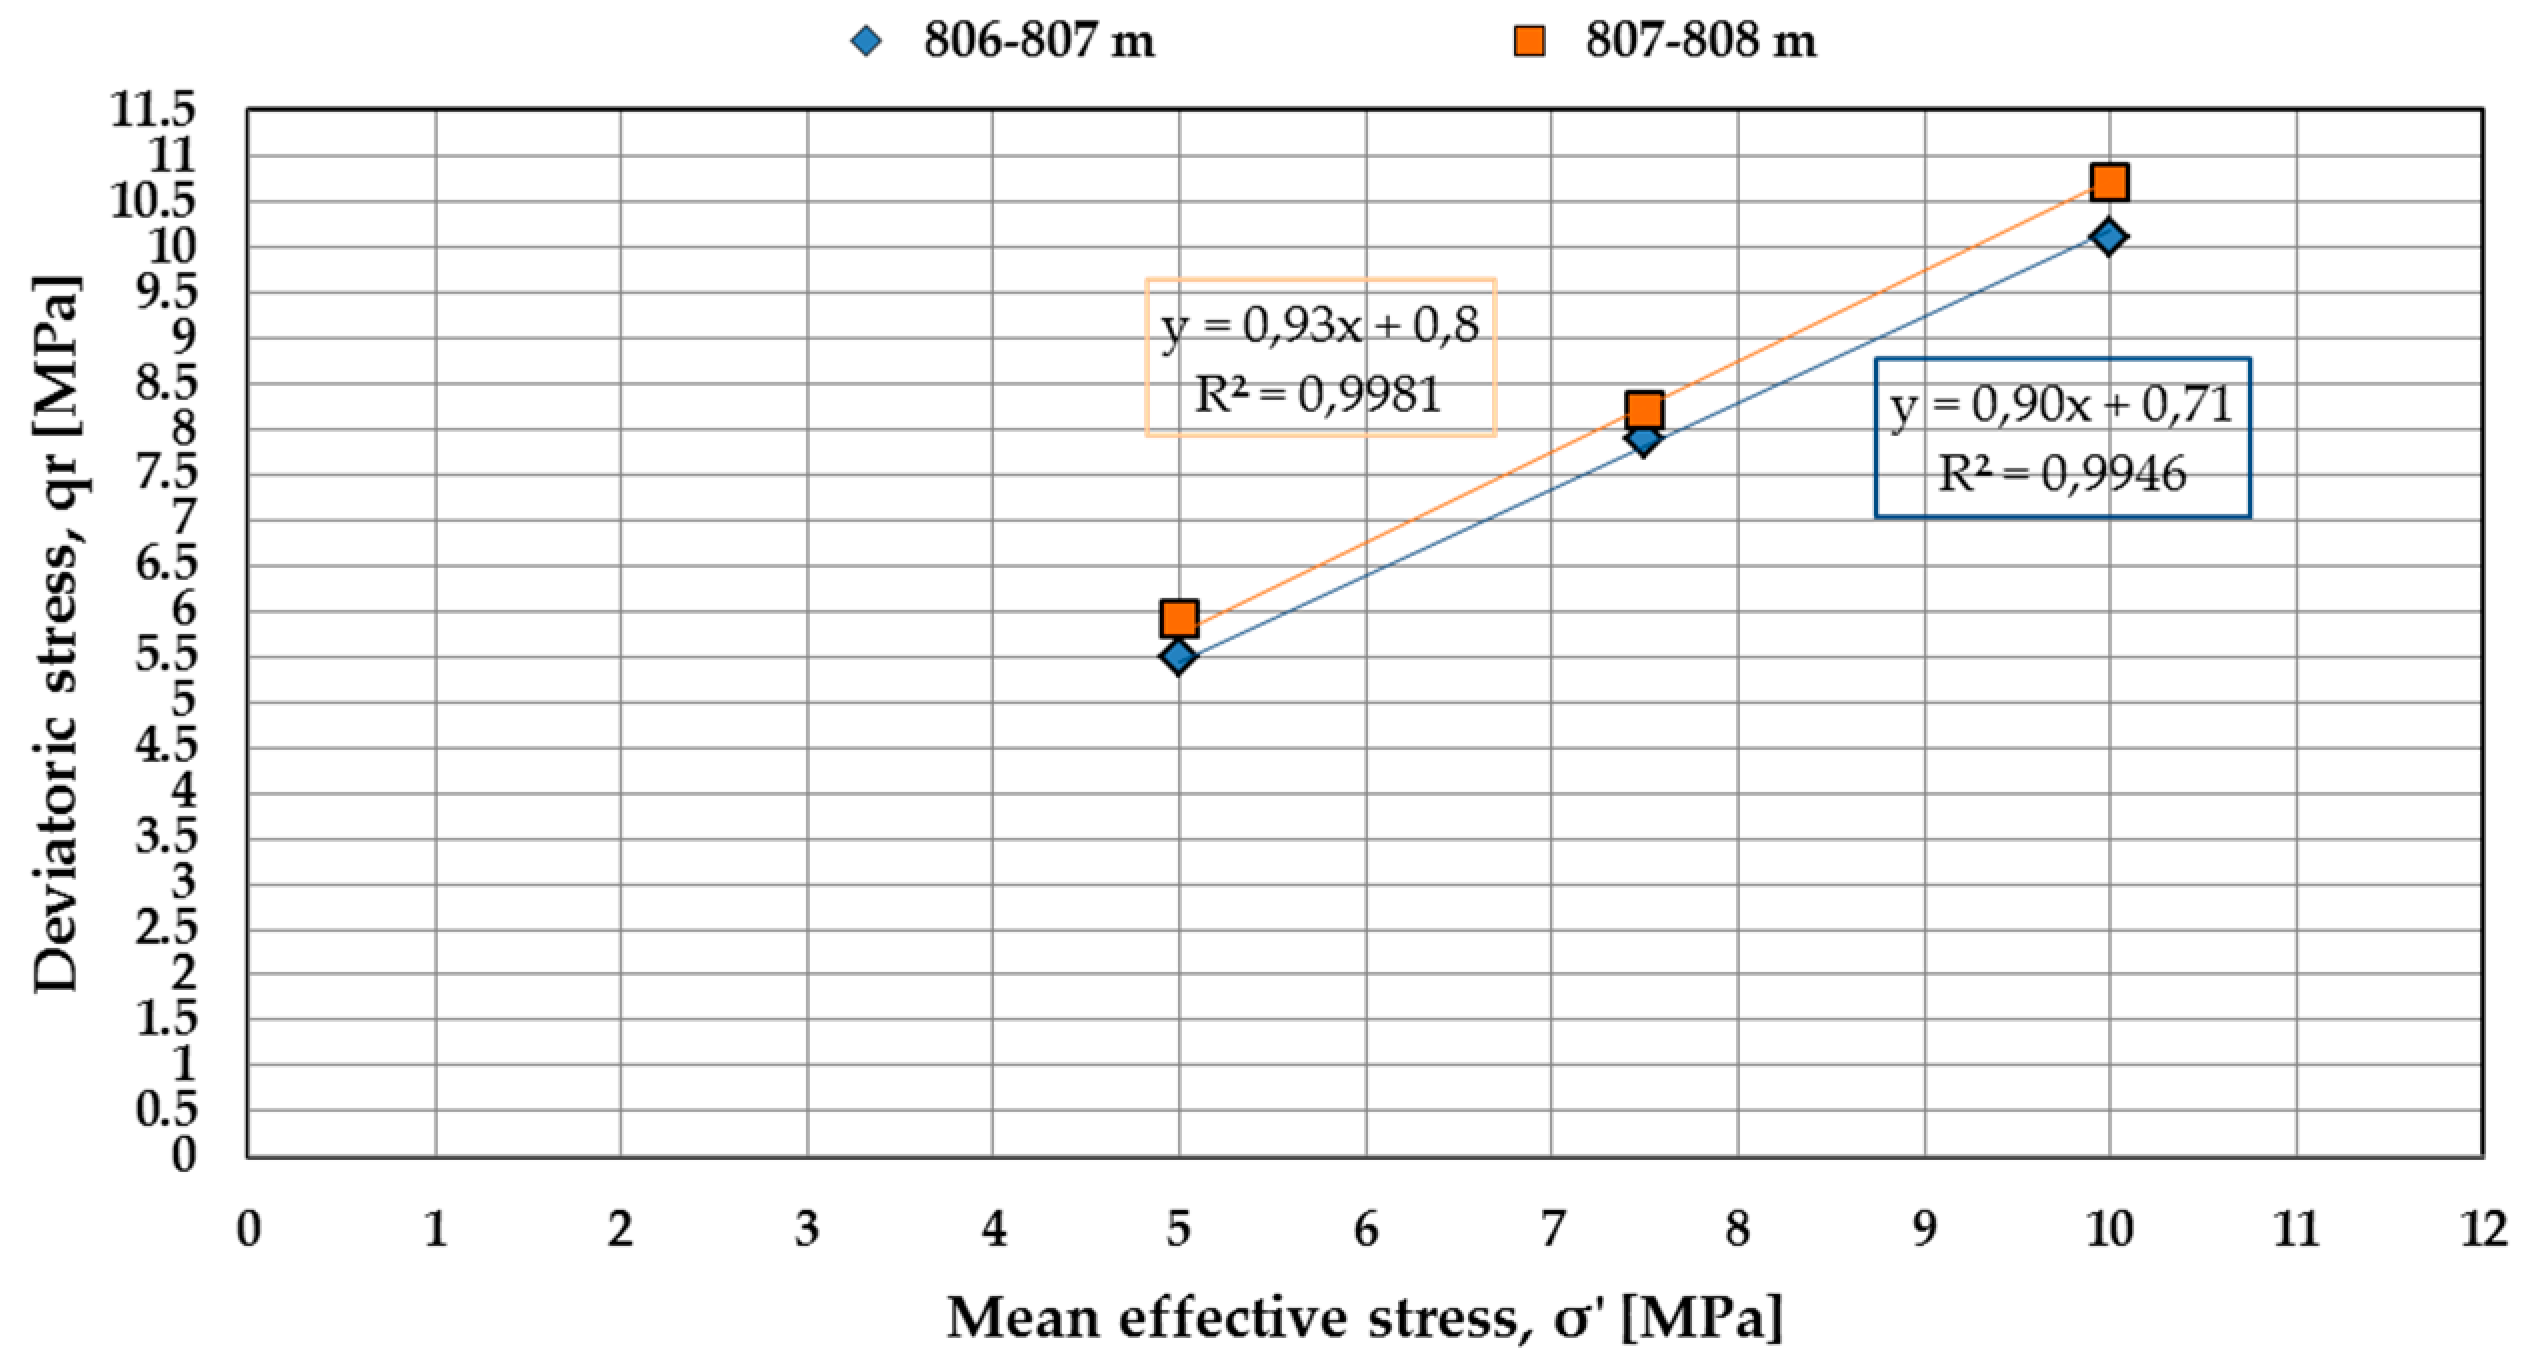
Drained and undrained triaxial tests, isotropically consolidated (CID and CIU, respectively), were performed on silty-sand samples retrieved from gas-bearing layers (PLQ1 D1A and PLQ A5) belonging to the Carola Formation. These specimens were tested using a triaxial apparatus (Hoek cell); the imposed confining stresses varied around the measured initial state of stress (from 5 to 10 MPa). Project boundary conditions suggested the use of integrative components of the rock testing apparatus to guarantee proper execution of CIU and CID: a dedicated saturation panel connected to the Hoek cell was designed for pore pressure control during every phase of the analysis.
The analysis of grain size distribution of the samples, with varying densities and fines content, allowed the drainage choice during the deviatoric application phase of the triaxial tests. The samples of the PLQ1 D1A with sand-silt mixtures with significant fines content (about 30%) were tested under undrained conditions (CIU), while the samples of the PLQ A5 with low fines content (about 10%) were tested under drained conditions (CID).
Reservoir strength properties at the 5–10 MPa effective stress were determined in terms of effective strength parameters (effective cohesion and friction angle) from the Mohr–Coulomb failure envelope (effective mean stress—deviatoric stress) (
Table 2 and
Figure 7 and
Figure 8).
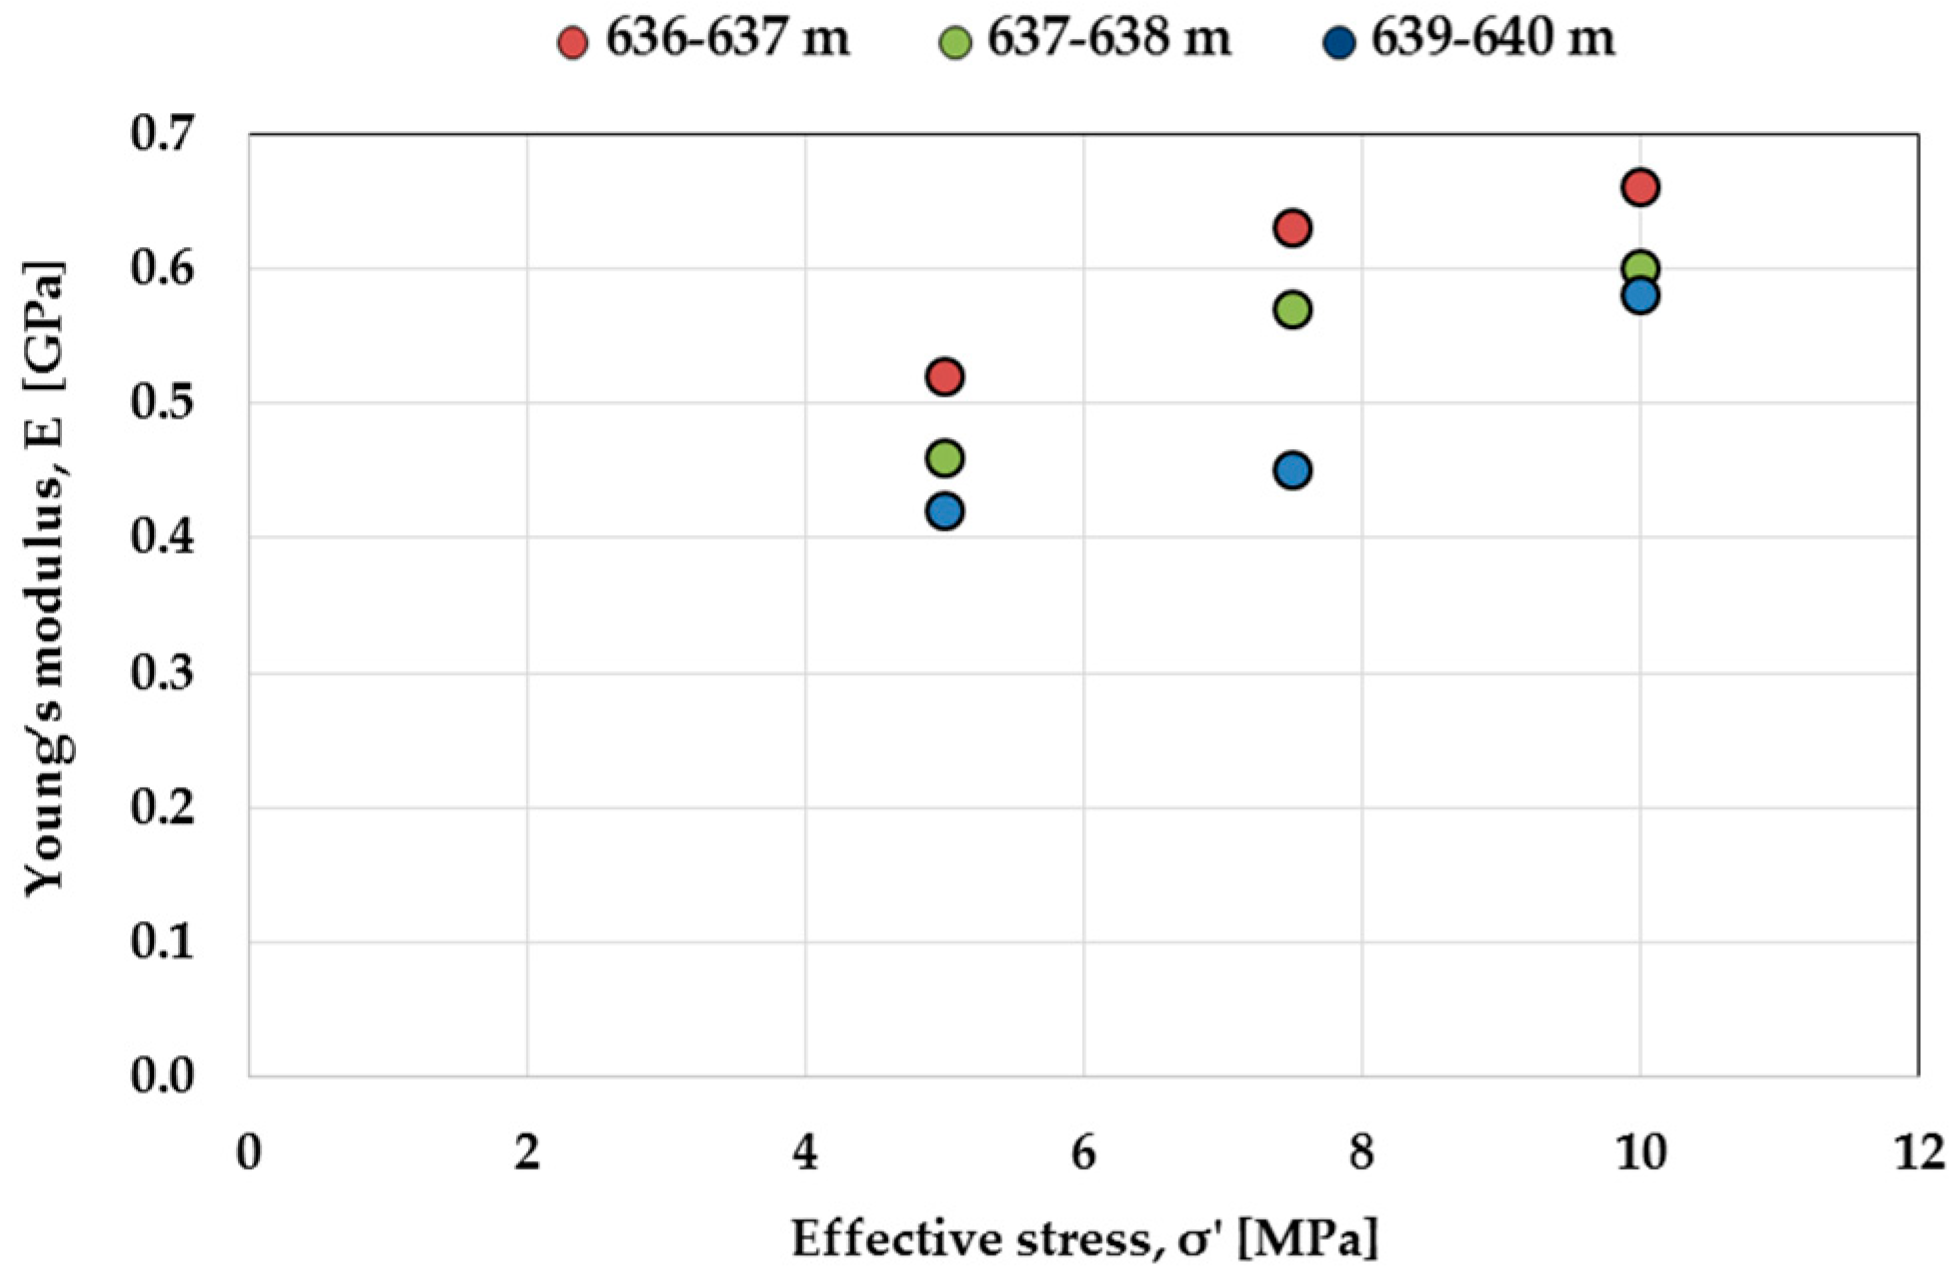
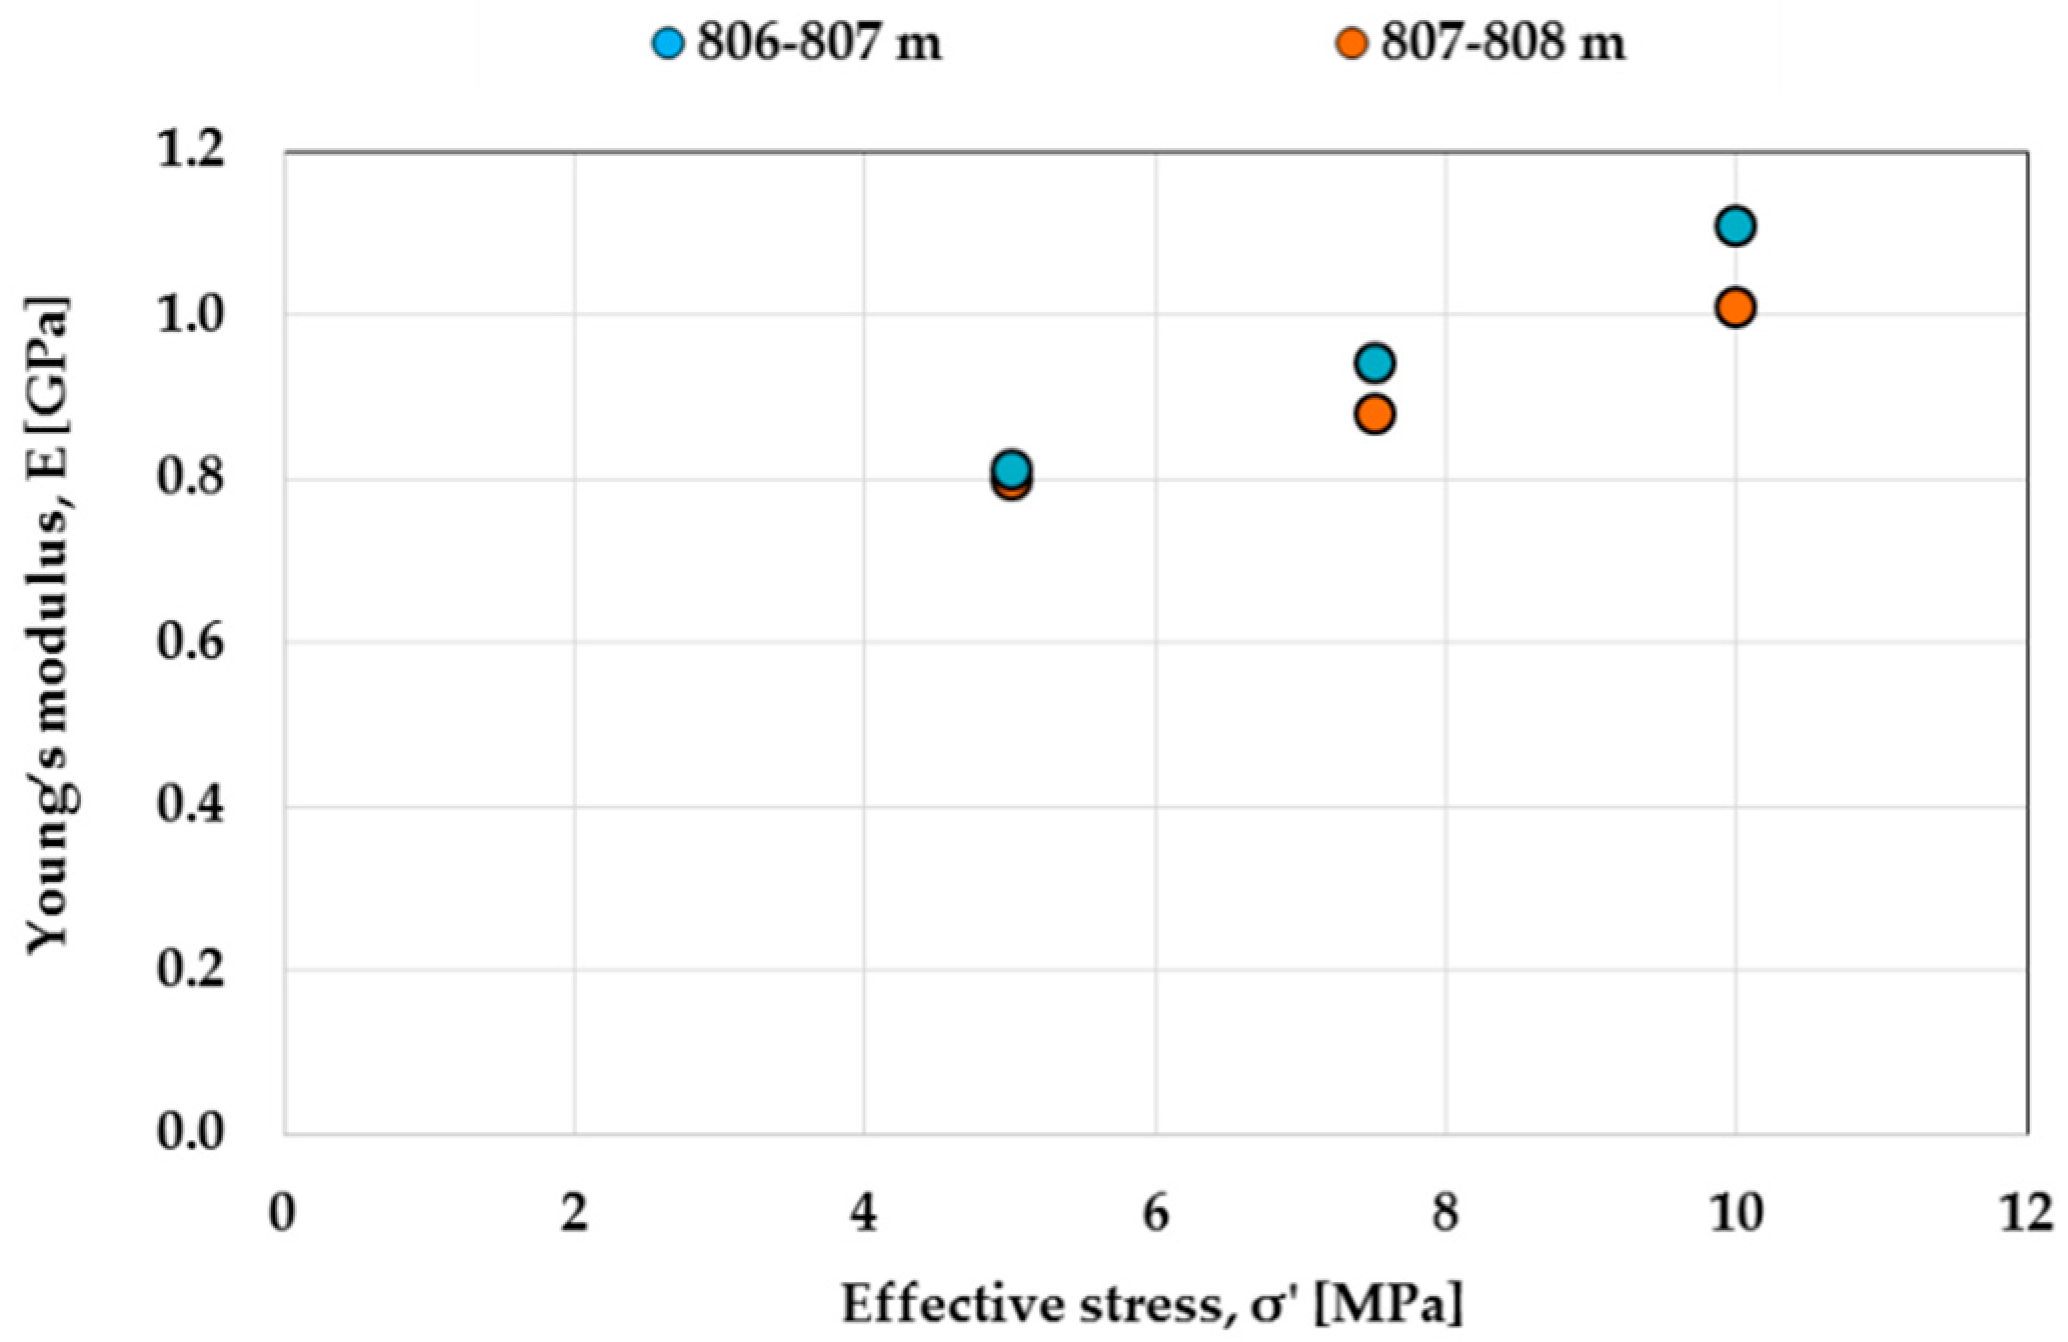
In addition, the triaxial test results in terms of effective stress and strain allowed the definition of the pseudo-elastic modulus during the consolidation phase (i.e., static elastic Young’s modulus). Young modulus increases with effective stress and thus with sample depth (
Figure 9 and
Figure 10).
3.1.2. Elastic Moduli Definition
Two scenarios were defined regarding deformation parameters: static and dynamic elastic moduli. The static elastic moduli obtained from laboratory analysis for the reservoir formation were integrated and extended to the model scale according to the following empirical correlation [
24]:
which provides the vertical uniaxial compressibility,
, as an exponential function of the vertical effective stress,
. This basin-scale compressibility law was derived by [
24] from in situ deformation measurements via the radioactive markers. In that work the investigated formations were silty to fine-grained sandstones, which are similar to the lithologies investigated in this case study. Equation (1) holds true for rock compression in virgin loading conditions, thus was adopted for the calculation of the static elastic modulus E
I as a function of depth during primary production. Furthermore, coherently with laboratory test results and with the technical literature [
24,
25], the elastic modulus E
II was triplicated during the simulation of the field re-pressurization phases. These assumptions are in agreement with the consolidation theory: primary production induces loading conditions in the virgin normally consolidated sandy formation of the reservoir, which deforms according to E
I by following the normal consolidation line (NCL). During subsequent reservoir re-pressurization the soil formations are subject to unloading conditions and their deformation response is ruled by the higher unloading E
II modulus.
The interpretation of sonic and density logs, acquired in the reservoir where the cores were retrieved, provided the dynamic elastic modulus values as a function of depth. The dynamic modulus values turned out to be 3 to 4 times larger than the static ones, in substantial agreement with the technical literature [
26,
27].
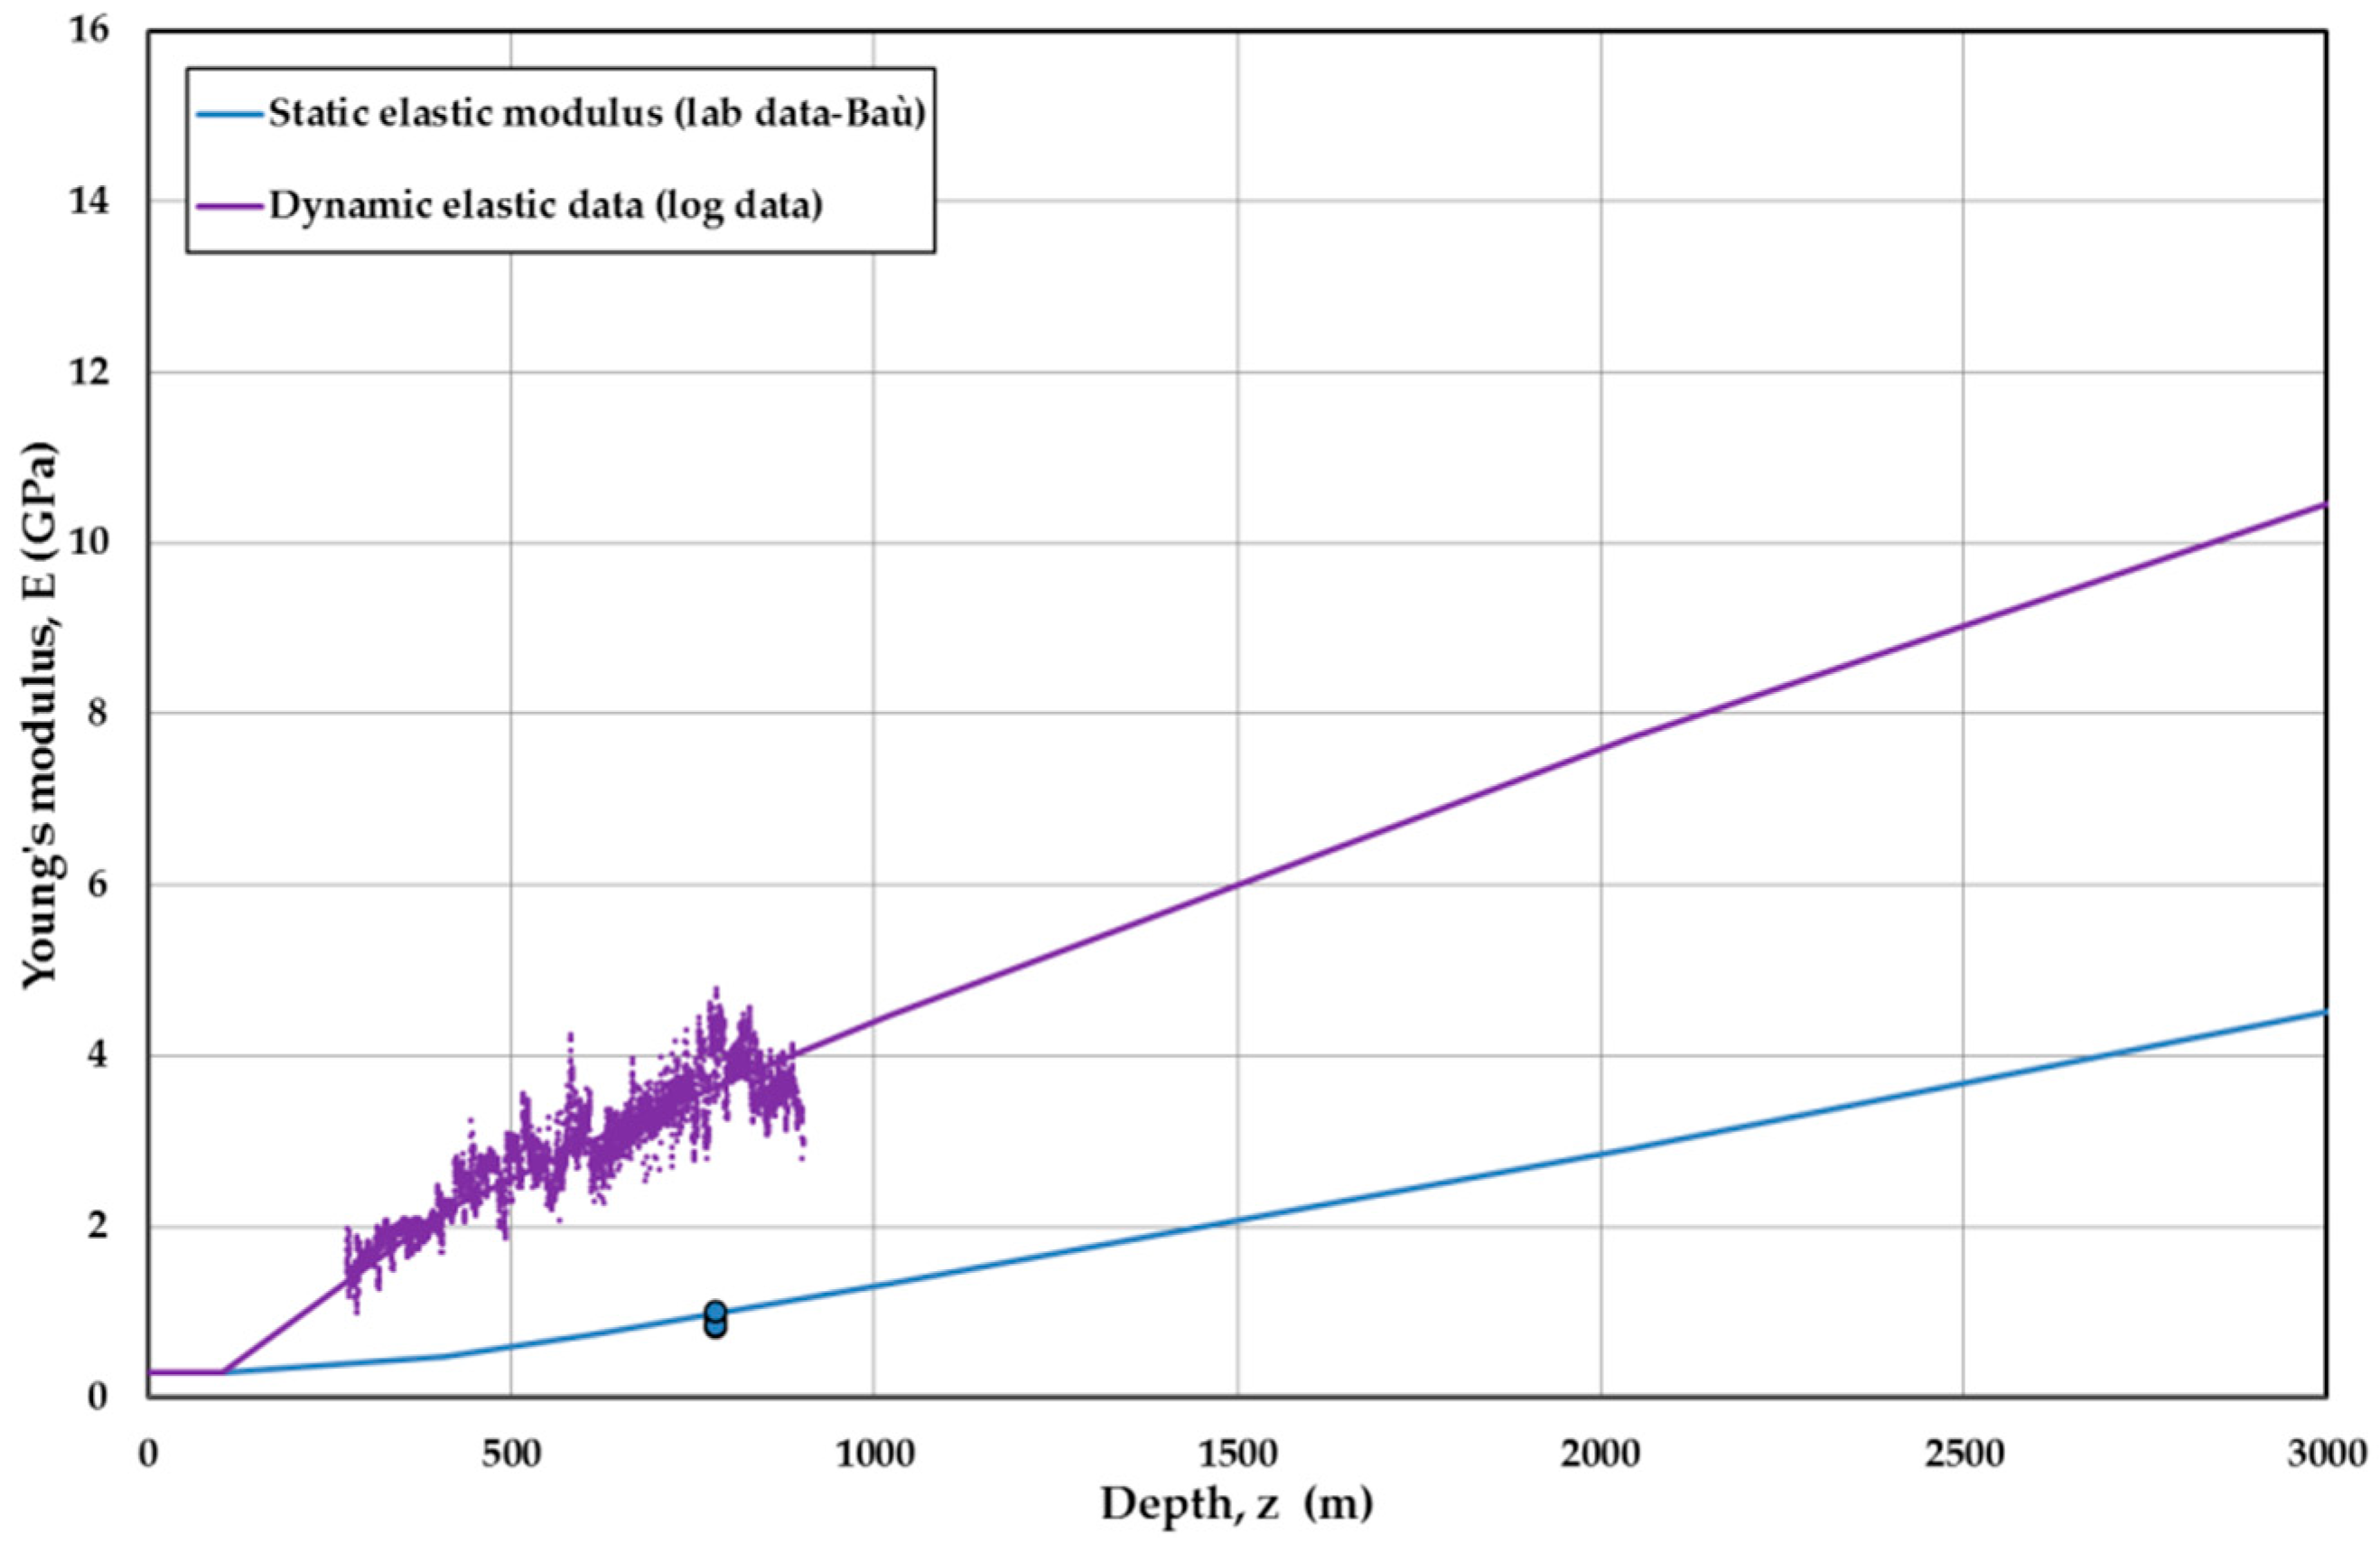
The defined static and dynamic Young’s modulus values as linear function of depth are reported in
Figure 11 together with the data obtained from laboratory tests and well log interpretation. In agreement with the research results published by [
24], the effect of lithology variation on the elastic modulus values was considered negligible compared to the influence of depth in shaly-sand formations. Conversely, the lithological change between the upper shaly-sandy formations and the lower carbonate sequence has a substantial impact on the elastic response; this was reproduced by significantly increasing the Young’s modulus values in the basal formation, under both static and dynamic conditions.
4. Coupled Analysis
The techniques of coupling fluid-flow and geomechanics are mainly classified into fully coupled and partially coupled approaches. In the fully coupled approach, also named implicit, fluid flow and displacement calculations are performed together and the software can solve both the fluid-dynamic and the geomechanical variables. However, this approach requires more code development than other techniques [
7].
The partially coupled approach can solve the problem as rigorously as the fully coupled solution if iterated to full convergence [
10]. The partially coupled approach solves fluid-flow and stress-strain equations separately for each time step. The coupling is carried out using an interface code to allow communication between a standard reservoir simulator and geomechanical software. These interface codes can be developed according to different methodologies such as explicit coupling (one-way coupling) or iteratively coupling (two-way coupling).
In this study the system behavior was investigated according to the one-way and two-way coupling techniques. According to the one-way coupling approach, the formation stress-strain evolution is determined as a consequence of pore pressure variations, but the pressure field is supposed to be independent from the induced rock mass deformations, i.e., formation petrophysical properties remain unchanged. The fluid-flow and the stress-strain equations are solved separately using dedicated reservoir and geomechanical simulators. As has been discussed in the literature [
8,
9,
10,
28,
29,
30,
31], the one-way coupling approach represents the primary method for subsidence calculation due to its relative tight computational time and easiness of application together with reliable phenomena simulation and prediction. Moreover, the geomechanical model characterization can be properly achieved via routine geotechnical laboratory analysis for strength and deformation parameters determination.
Conversely, the two-way coupling approach also allows simulating the effect on pressure evolution of the petrophysical variation induced by the rock mass deformation. The fluid flow and the stress-strain equations are solved separately and sequentially for each selected time step of analysis via dynamic software and geomechanical software. The coupling is achieved via an interfacial code for the back-and-forth data exchange, eventually involving an iterative technique for the update of porosity/permeability. The latter is usually assumed as coupling variables: they become a function of the main problem unknowns, i.e., pressure and stress/strain. Numerous case studies demonstrate the importance of the two-way coupling approach for reliable subsidence prediction in case of high stress-dependent porosity/permeability. It is usually used for analyzing shallow, poorly consolidated formations [
7,
8,
10]. Nevertheless, this approach can be computationally time consuming and it requires dedicated laboratory analysis to identify the coupling law which describes petrophysical parameters variation in relation to pressure/deformation.
The coupling approach should produce the same results when using small time steps and tight convergence tolerances. In elastic domain, the choice of time step size depends mainly on the magnitude of the pore pressure variation. For the investigated system, smaller time steps are used at the beginning of the run to produce an accurate solution during the production period and looser time-stepping for the following 40-year timeframe.
Coupling Laws
For the case at hand, the coupling law was defined by integrating experimental data and theoretical references. The general formulation to solve the coupling fluid-flow and geomechanics in a finite element setting problem is formulated in [
6].
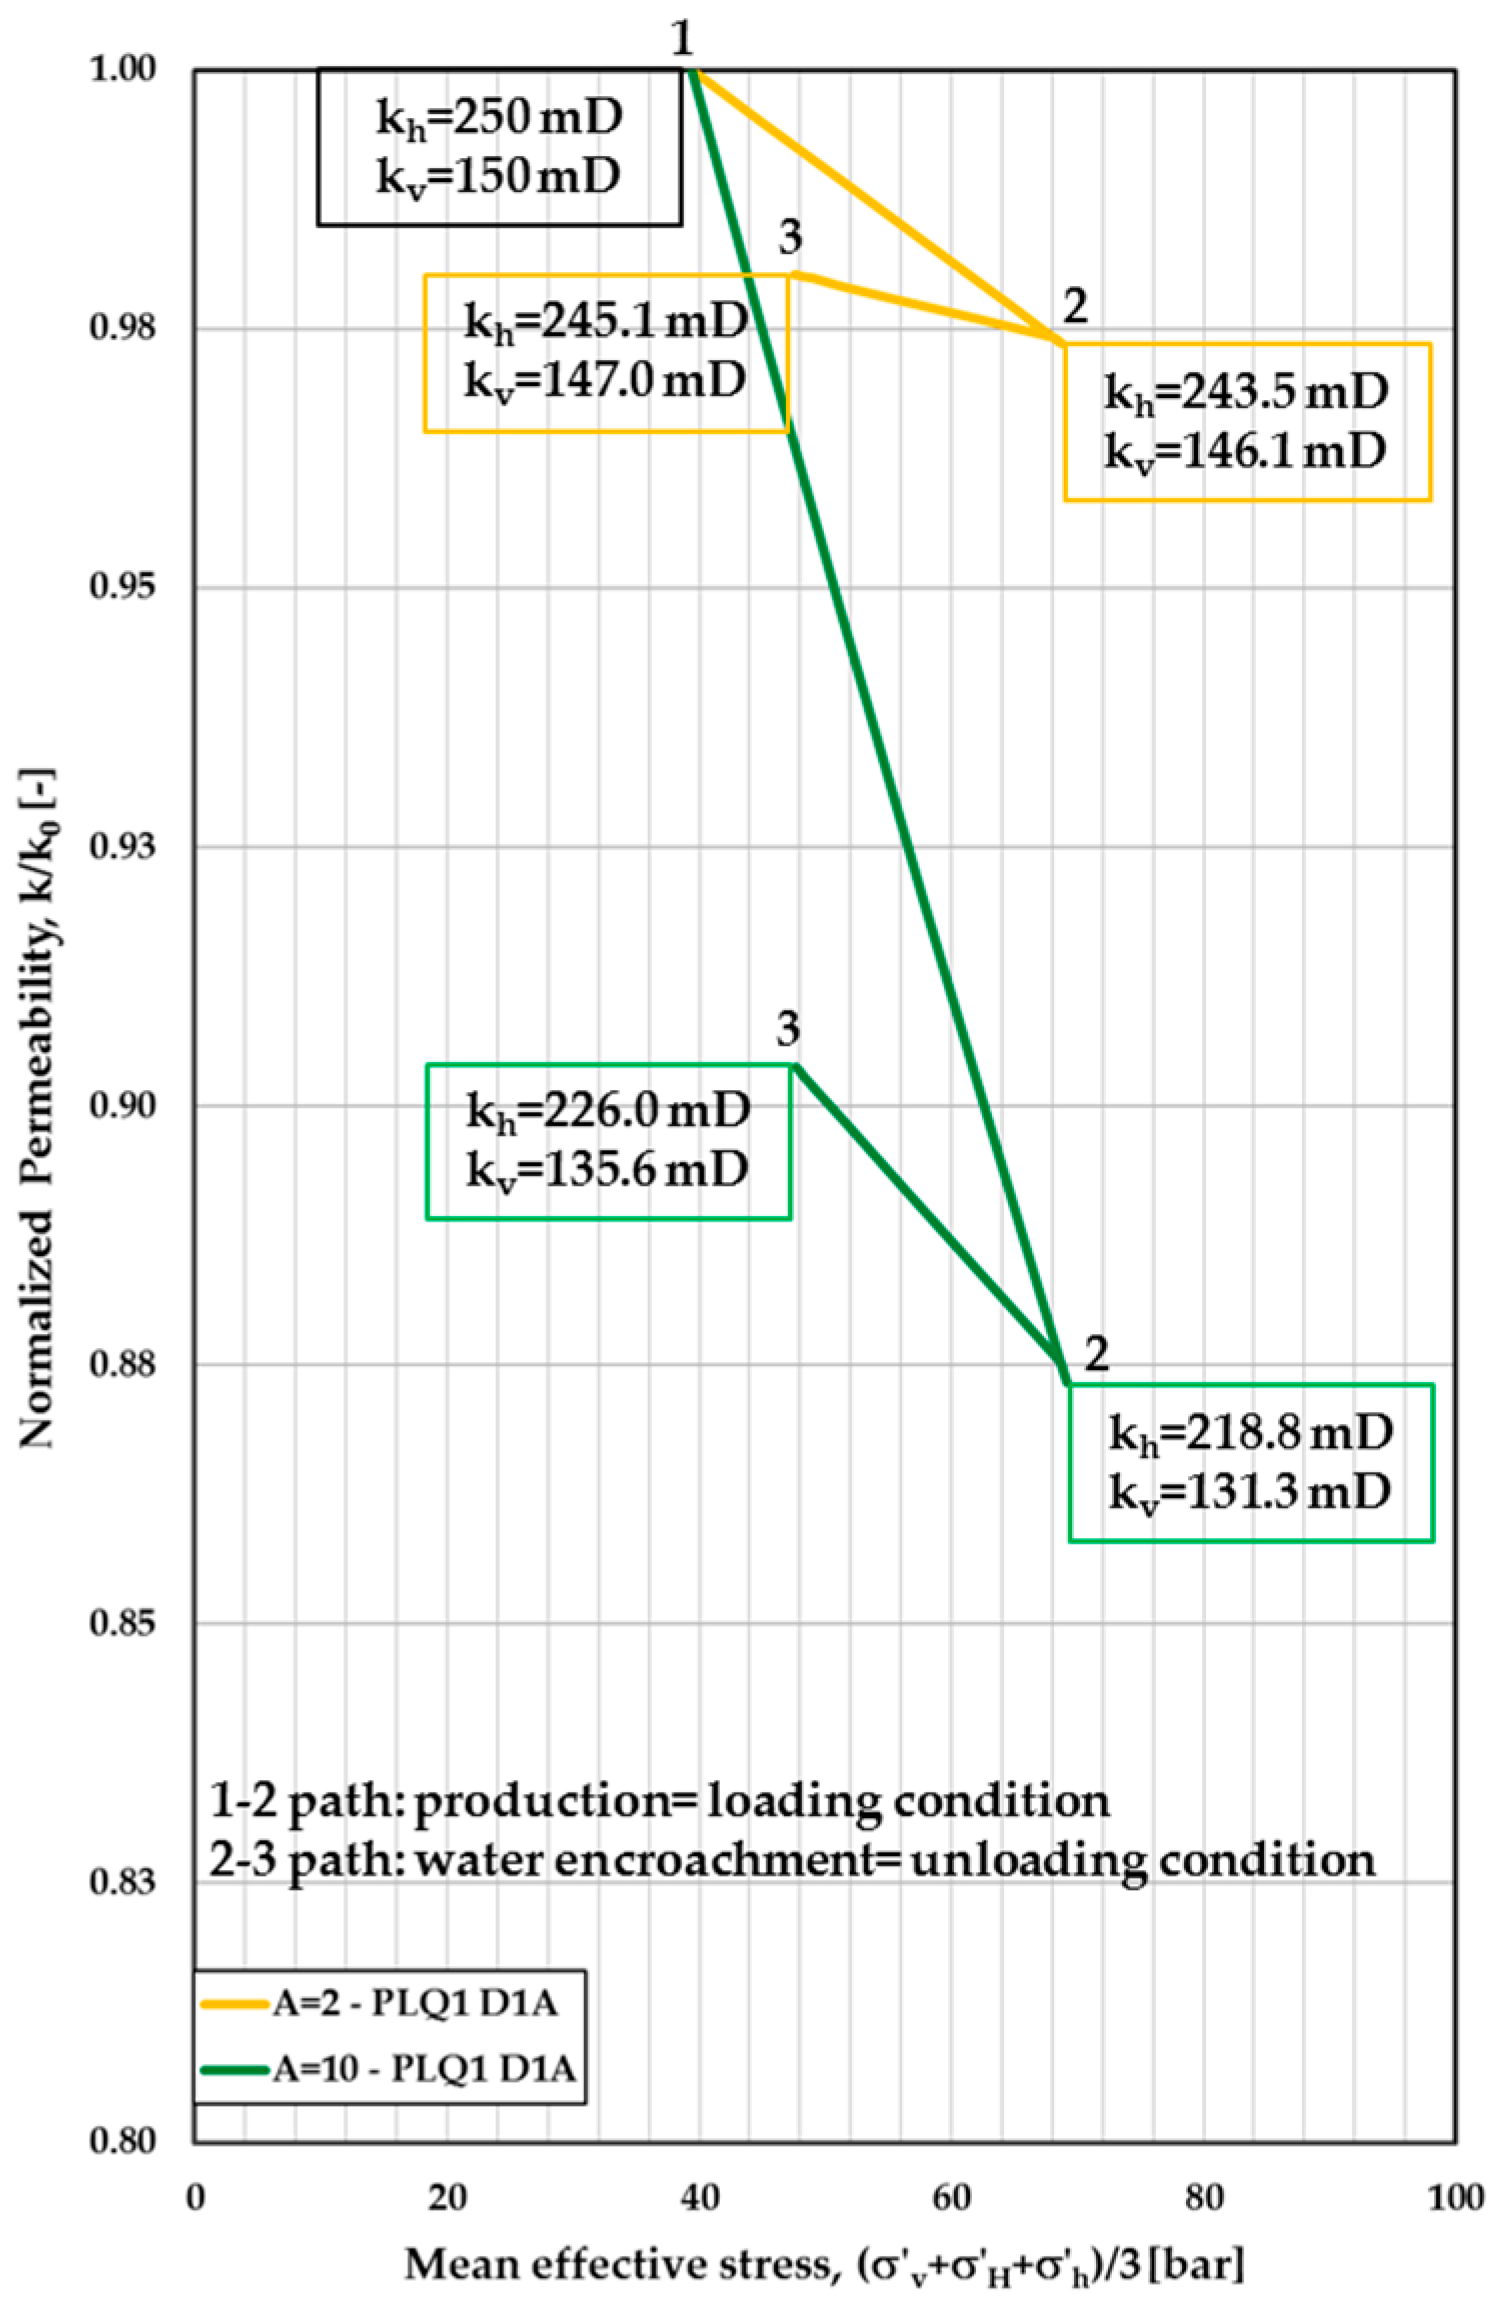
The porosity and permeability variations as a function of different confining stresses were investigated via dedicated laboratory tests carried out on samples retrieved from PLQ1D1A and PLQA5 levels, in the Carola Formation. In particular, loading and unloading ramps were imposed under a hydrostatic loading condition. The majority of the tests were performed by imposing a confining cycle at increasing stress steps of 2, 6.5, 8 and 10 MPa to reproduce loading conditions during fluid production. Some specimens were subsequently subject to a new loading cycle (of 2, 4.5, 8, MPa stress steps) and to an unloading cycle (of 8, 4.5, 2 MPa stress steps) to investigate the specimen hysteretic behavior. This test reproduced the reservoir stress state not only during the production phase (loading condition) but also during the subsequent re-pressurization phase due to water encroachment (unloading condition).
The experimental data show deformation behavior governed by permeability variation as a function of the confining stress, rather than a porosity variation. This behavior is also stated in published technical research. As reported by [
32], the net effective increase due to production can alter the detailed pore geometry of the reservoir rock, specifically the shape and dimensions of the pore bodies and the pore throats: the predominant effects are in terms of permeability variation rather than porosity change. Furthermore, where rock formation exhibits important anisotropic permeability, the full permeability tensor can be modified by the deformation of the rock with consequent changes in the directionality of the fluid flow [
33]. Also [
5,
6] report that in case of rock masses exhibiting anisotropic permeability (as the Adriatic sedimentary sequences under investigation) coupling stress/permeability analysis can improve the quality of the results.
For all of the above considerations, the available measurements were interpreted according to the well-known Carman-Kozeny relation, which is adopted as coupling law. Considering the formulation rearranged by [
34], the law expresses permeability variation as a function of porosity variation:
In the work of Carman-Kozeny, A, the porosity exponent, is 3 but it can vary depending on the mechanical characteristics and on the lithology of the reservoir rocks: for example, in relation to sandstones, it varies between 2 and 10 [
35].
Because porosity is dependent on effective stresses, also permeability, due to the Carman-Kozeny relation, becomes an indirect function of geomechanical responses.
Figure 12 shows the experimental data interpretation according to Equation (2): the normalized permeability is plotted as a function of normalized porosity, where
and
are porosity values corresponding to the permeability values
and
, respectively measured at the same confining cycles. Parameter
ranges between
and
, in agreement with literature data for the lithology under analysis [
35].
A univocal correlation between permeability variations and porosity variations could not be defined due to the dispersion of the experimental data; therefore sensitivity analyzes were carried out aimed at assessing the impact of the coupling law on the evolution of subsidence.
5. Results and Discussion
The laboratory experimental data of the analyzed case showed a considerable permeability stress-dependent behavior of the reservoir core samples. Nevertheless, because the net effective stress increase due to production is very limited (about 4–5 MPa at maximum depletion), the system stress-strain evolution always remains in the elastic domain and the deformation magnitude is extremely narrow (10
−4 m/m). As a consequence the compaction-induced porosity reduction is negligible (about 0.5 p.u. max) and the maximum permeability variation reaches 9% considering the conservative case (i.e.,
) (green dots in
Figure 12).
Figure 13 expresses the results in terms of normalized permeability and permeability variation as a function of mean effective stress and highlights the hysteretic aspects of permeability variation.
The obtained results were then compared with literature data: [
36] reported normalized permeability reduction due to compaction under hydrostatic confinement for 11 specimens retrieved from a sandstone reservoir with 15–35% porosity. Considering an effective stress of 9 MPa, a 10% maximum permeability decrease is reached. In agreement with [
36] data, in our case-study the maximum permeability reduction of 12% is obtained in correspondence with an effective stress acting on the reservoir formation equal to 7–9 MPa (corresponding to maximum depletion).
Subsidence Forecast
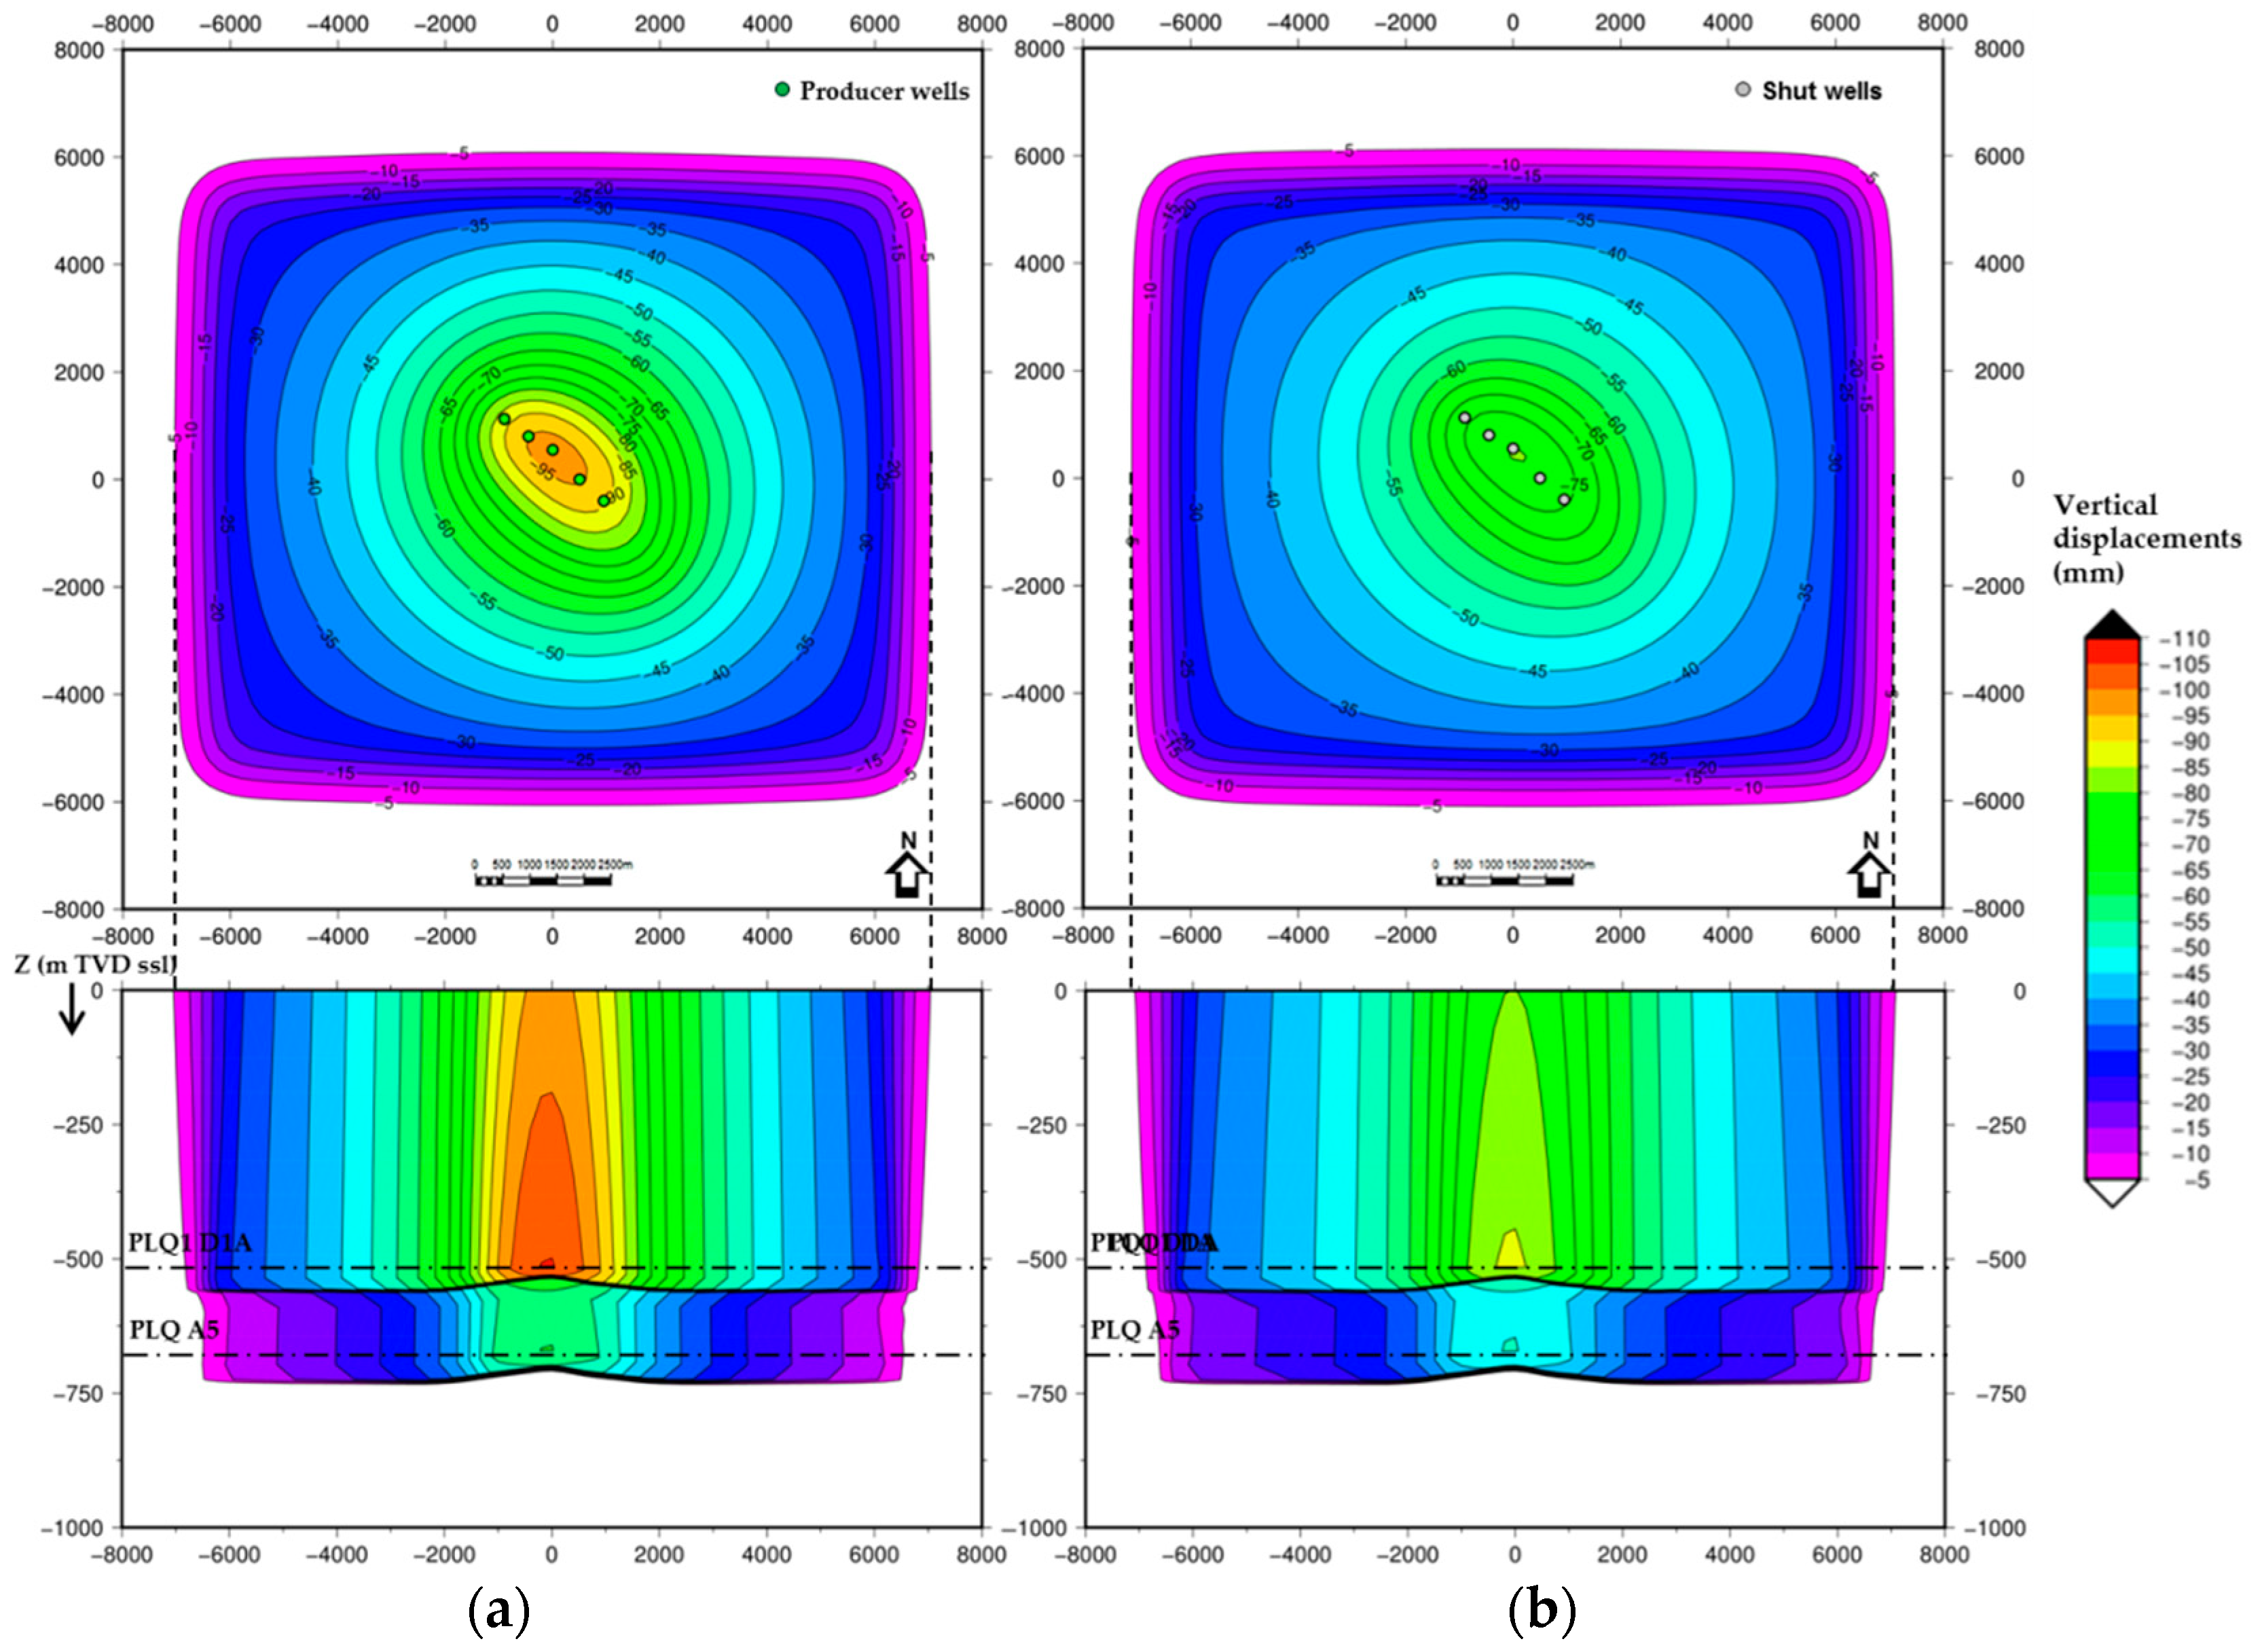
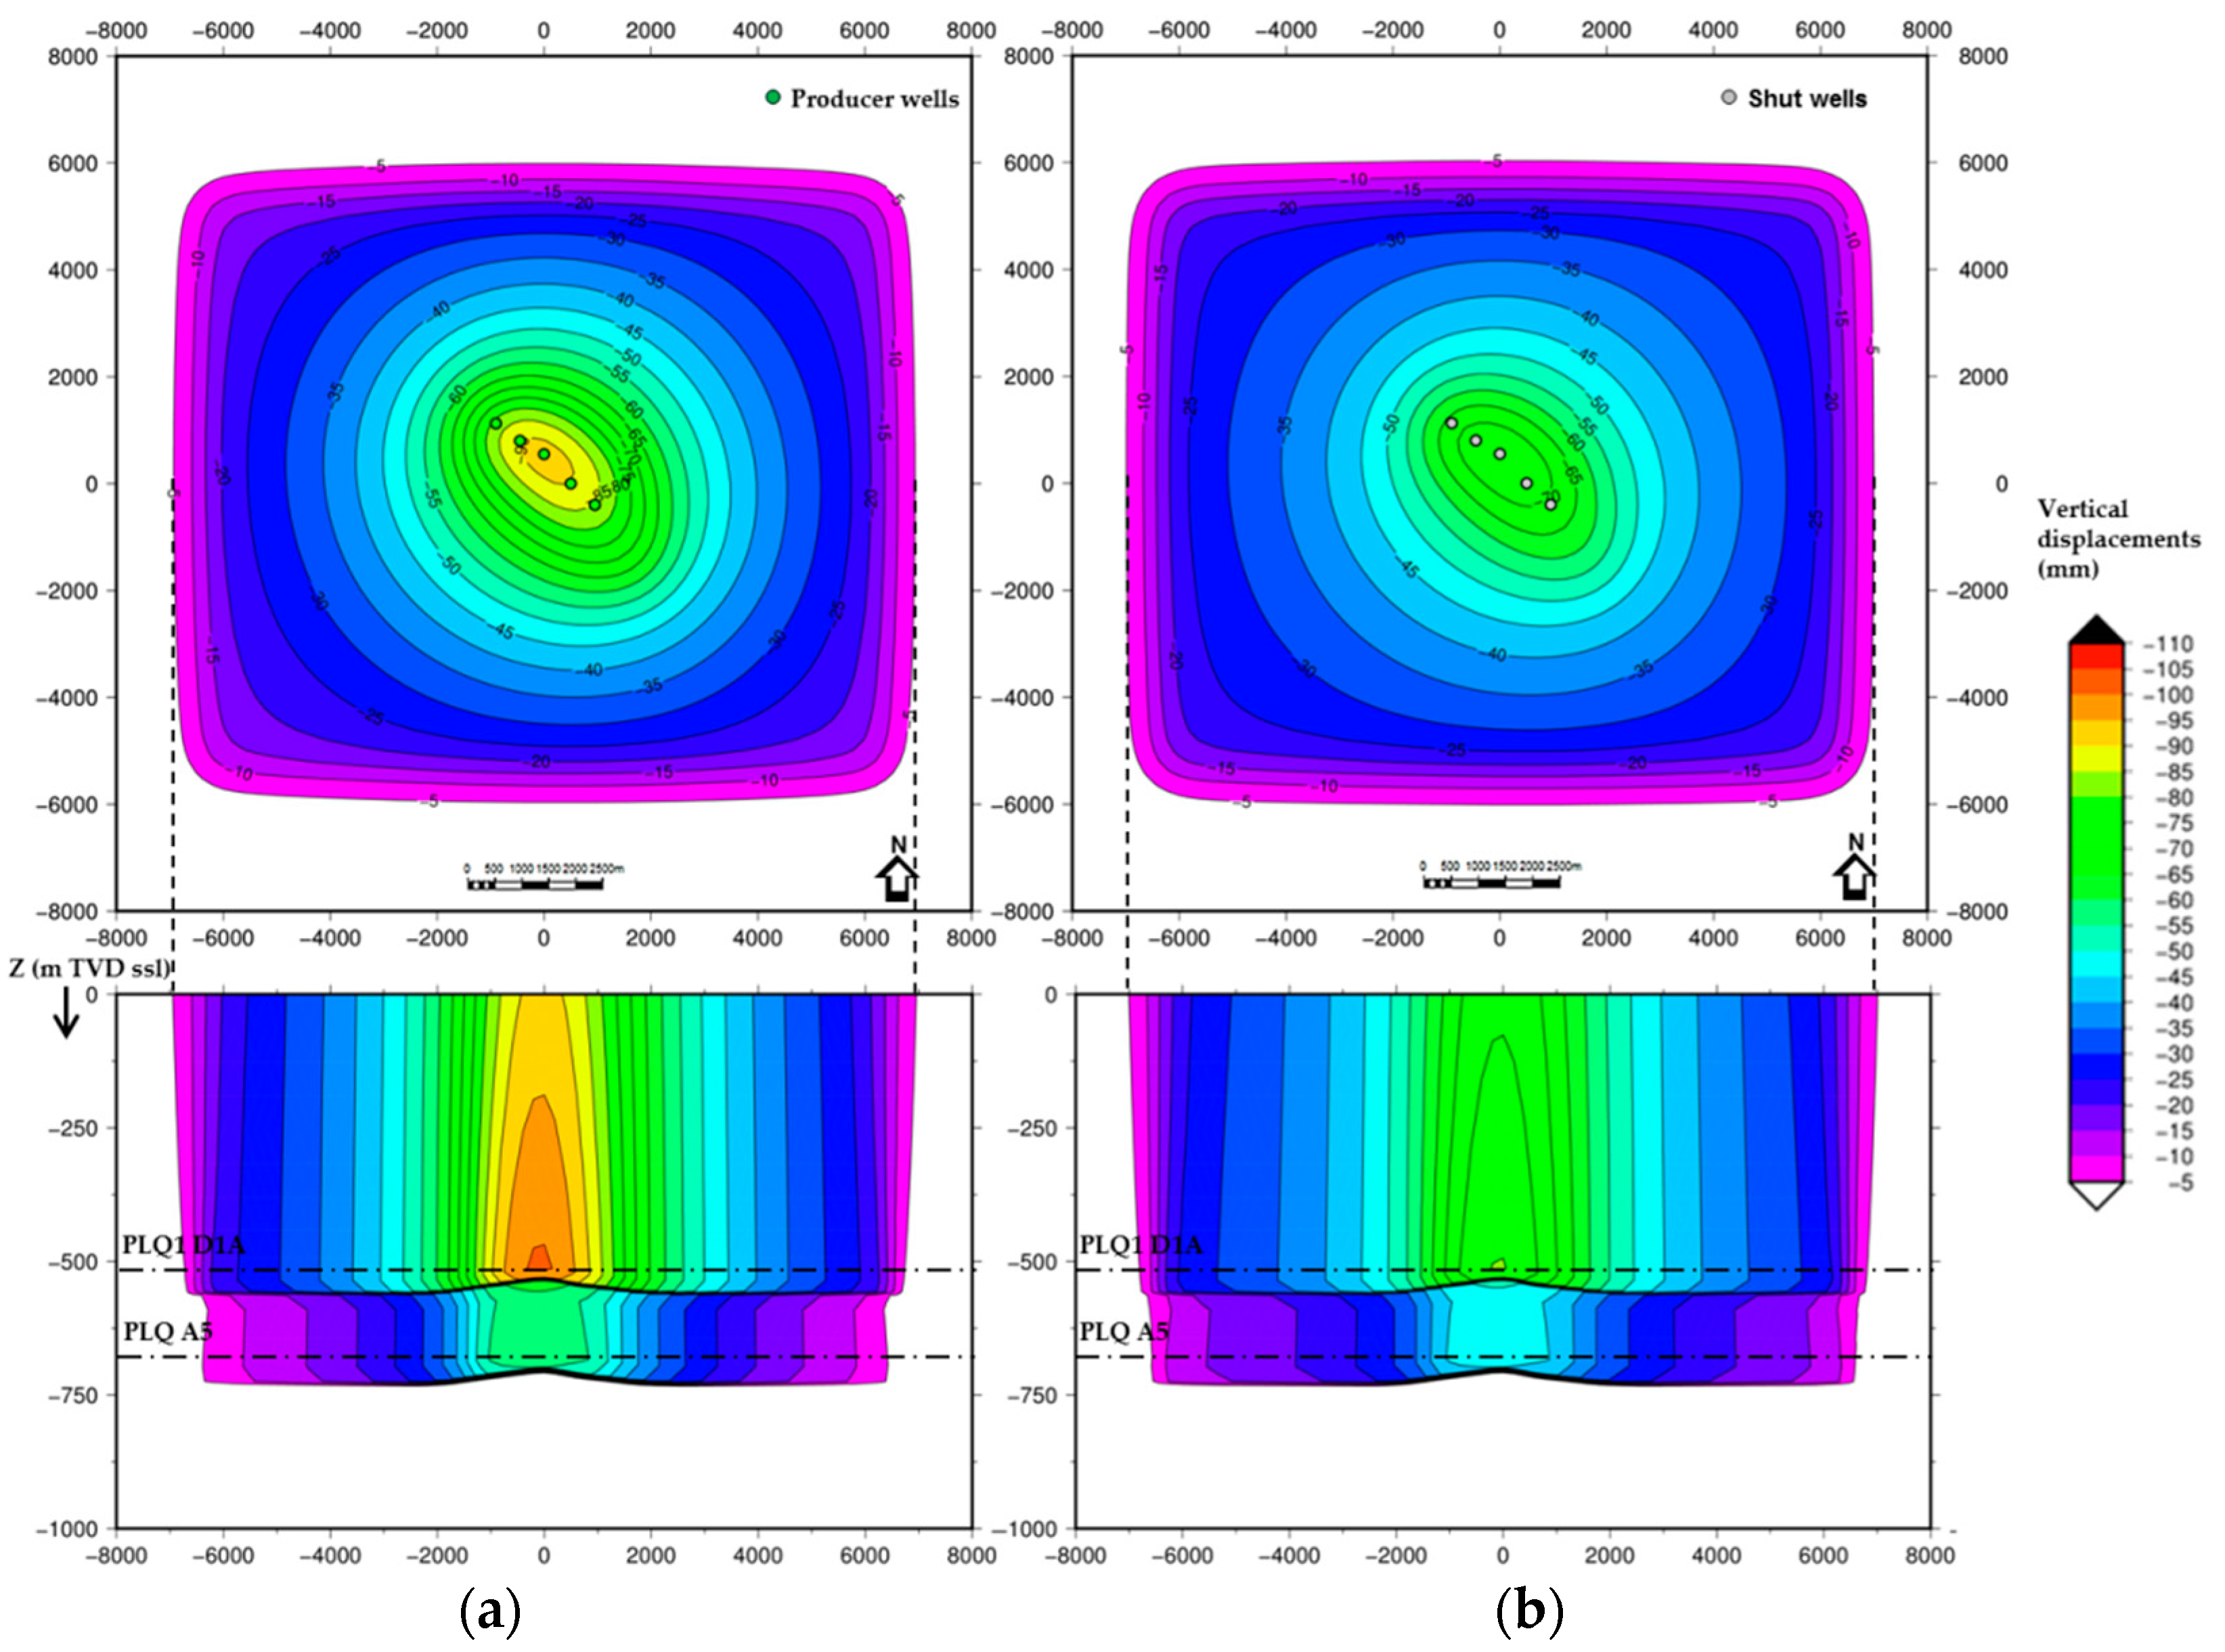
Case study results show the adopted coupling technique has no marked effects on subsidence phenomena evolution (both vertical displacement and radius) at the surface. However, the effects can be seen in terms of compaction at reservoir level. In fact, according to the one-way coupling approach, a larger volume of the reservoir and the cap rock formations must be affected by the maximum vertical displacement values and provides more conservative results, as can be seen when comparing
Figure 14 and
Figure 15.
Results also show that subsidence phenomena evolution is strongly affected by both primary drive mechanism (i.e., strong aquifer support, medium aquifer support and gas expansion) and geomechanical characterization (i.e., dynamic and static elastic modulus).
The worst case scenario assumes gas expansion (maximum depletion greater than the other cases) as production mechanism and static elastic parameters: forecast subsidence shows the maximum vertical displacement and the maximum radius of subsidence. Furthermore, during the following 40 years of monitoring the subsidence bowl remains almost unaltered. In the best case scenario, characterized by dynamic elastic moduli and the support of a strong active aquifer, the subsidence bowl is more limited; with maximum vertical displacement 4–7 times lower than that of the worst case. Moreover, water encroachment should ensure a total recovery of induced subsidence at the end of the re-pressurization phase.
The subsidence results fall within a range bounded by the static and the dynamic domain. The hypothesis of using dynamic elastic moduli should realistically represent the stress-strain behavior of the rock [
37] induced by the production activities of the synthetic reservoir. The results of the geomechanical simulation instead show that the hypothesis of using static elastic moduli is the most conservative. Nevertheless, the static geomechanical characterization is more effective to highlight differences between two coupling techniques and therefore it was used to compare the results of the one-way and two-way simulations.
6. Conclusions
The effect of coupling techniques for subsidence phenomena simulation induced by gas exploitation was investigated in this paper. To this end, a synthetic case representing a typical off-shore, shallow, weakly compacted, multi-layered gas reservoir of the Adriatic Sea was built and populated on the basis of high quality data from an existing gas-bearing formation (off-shore Croatia).
These sedimentary sequences exhibit anisotropic permeability, so they represent an appropriate domain to investigate the improvement in phenomena simulation via coupling stress and permeability [
5,
6]. Furthermore, available laboratory data performed on the investigated formation showed strong permeability stress-dependent behavior.
The subsidence analyses were carried out through the coupling between fluid-flow and stress-strain phenomena, based on the preliminary definition of three numerical models, i.e.: geological, fluid-flow and geomechanical. The weakest coupling approach considers pressure field as independent from induced rock mass deformations whereas, a more complicated numerical technique allows petrophysical parameter update based on net effective stress variation.
In the analyzed case, net effective stress increase generated by a realistic but stressing production strategy is very limited (about 4–5 MPa at maximum depletion); consequently, even in a weakly consolidated and high anisotropic formation, the system stress-strain evolution remains always within the elastic domain and the deformation magnitude is extremely narrow (10−4 m/m). The compaction-induced porosity reduction is negligible (about 0.5 p.u. max) and the maximum permeability variation reaches 12% considering the conservative case. If gas withdrawal induced plastic deformation and/or shear failure, the porosity/permeability variation would be much more pronounced.
The difference between the adopted coupling techniques is negligible in terms of subsidence evolution at ground level but not in terms of compaction at reservoir level. In fact, the two-way coupled technique could be used for better development planning by integrating reservoir, drilling and completion management [
38].
Author Contributions
Conceptualization, V.R.; Methodology, G.G. and C.P.; Software, G.G. and C.P.; Validation, G.G., S.O. and C.P.; Formal Analysis, G.G.; Investigation, S.O.; Resources, S.O.; Data Curation, G.G. and C.P.; Writing-Original Draft Preparation, G.G. and C.P.; Writing-Review & Editing, G.G., S.O. and C.P; Visualization, G.G., S.O. and C.P.; Supervision, V.R.; Project Administration, V.R.
Funding
This research received no external funding.
Acknowledgments
The authors wish to thank Edison RD&I for permission to publish the data presented in this paper.
Conflicts of Interest
The authors declare no conflict of interest.
References
- Rocca, V.; Viberti, D. Environmental sustainability of oil industry. Am. J. Environ. Sci. 2013, 9, 210–217. [Google Scholar] [CrossRef]
- Benetatos, C.; Codegone, G.; Deangeli, C.; Giani, G.; Marzaono, F.; Rocca, V.; Verga, F. Guidelines for the study of subsidence triggered by hydrocarbon production. Geoingegneria Ambientale e Mineraria 2017, 152, 85–96. [Google Scholar]
- Gambolati, G.; Ricceri, G.; Bertoni, W.; Brighenti, G.; Vuillermin, E. Mathematical simulation of the subsidence of Ravenna. Water Resour. Res. 1991, 27, 2899–2918. [Google Scholar] [CrossRef]
- Teatini, P.; Gambolati, G.; Tomasi, L.; Putti, M. Nonlinear simulation of land subsidence over the Angela-Angelina gas field at Ravenna, Italy. IGEA 1998, 11, 41–48. [Google Scholar]
- Stright, D.H.; Settari, A.; Walters, D.A.; Aziz, K. Characterization of the pliocene gas reservoir aquifers for predicting subsidence on the Ravenna Coast. Pet. Sci. Technol. 2008, 26, 1267–1281. [Google Scholar] [CrossRef]
- Settari, A.; Walters, D.A.; Stright, D.H., Jr.; Aziz, K. Numerical techniques used for predicting subsidence due to gas extraction in the North Adriatic Sea. Pet. Sci. Technol. 2008, 26, 1205–1223. [Google Scholar] [CrossRef]
- Dean, R.H.; Gai, X.; Stone, C.M.; Minkoff, S.E. A Comparison of Techniques for Coupling Porous Flow and Geomechanics. In Proceedings of the SPE Reservoir Simulation Symposium, Houston, TX, USA, 3–5 February 2003. [Google Scholar]
- Settari, A.; Walters, D.A. Advances in couplet geomechanical and reservoir modeling with applications to reservoir compaction. SPE J. 2001, 6, 334–342. [Google Scholar] [CrossRef]
- Settari, A.; Sen, V. The role of geomechanics in integrated reservoir modeling. Lead. Edge 2007, 26, 622–627. [Google Scholar] [CrossRef]
- Settari, A.; Maurits, F.M. A coupled reservoir and geomecanichal simulation system. SPE J. 1998, 3, 219–226. [Google Scholar] [CrossRef]
- Cazzini, F.; Dal Zotto, O.; Fantoni, R.; Ghielmi, M.; Ronchi, P.; Scotti, P. Oil and gas in the Adriatic foreland, Italy. J. Pet. Geol. 2015, 38, 255–279. [Google Scholar] [CrossRef]
- Castellarin, A.; Vai, G.B.; Cantelli, L. The alpine evolution of the Southern Alps around the Giudicarie faults: A late cretaceous to early Eocene transfer zone. Tectonophysics 2006, 414, 203–223. [Google Scholar] [CrossRef]
- Croatian Hydrocarbon Agency. Available online: http://www.azu.hr/en-us/E-P/Geological-overview-offshore (accessed on 9 July 2018).
- Mancin, N.; Cobianchi, M.; Di Giulio, A.; Catellani, D. Stratigraphy of the cenozoic subsurface succession of the Venetian-Friulian basin (NE Italy): A review. Rivista Italiana di Paleontologia e Stratigrafia 2007, 113, 401–418. [Google Scholar]
- Casero, P. Structural Setting of Petroleum Exploration Plays in Italy. In Proceedings of the 32nd International Geological Congress, Florence, Italy, 20–28 August 2004. [Google Scholar]
- Mancin, N.; Di Giulio, A.; Cobianchi, M. Tectonic vs.climate forcing in the Cenozoic sedimentary evolution of a foreland basin (Eastern Southalpine system, Italy). Basin Res. 2009, 21, 799–823. [Google Scholar] [CrossRef]
- Ghielmi, M.; Minervini, M.; Nini, C.; Rogledi, S.; Rossi, M.; Vignolo, A. Sedimentary and tectonic evolution in the eastern Po-Plain and northern Adriatic Sea area from Messinian to Middle Pleistocene (Italy). Rend. Lincei Sci. Fis. E Nat. 2010, 21, 131–166. [Google Scholar] [CrossRef]
- Ghielmi, M.; Minervini, M.; Nini, C.; Rogledi, S.; Rossi, M. Late Miocene-Middle Pleistocene sequences in the Po Plain-Northern Adriatic Sea (Italy): The stratigraphic record of modification phases affecting a complex foreland basin. Mar. Pet. Geol. 2013, 42, 50–81. [Google Scholar] [CrossRef]
- Donda, F.; Civile, D.; Forlin, E.; De Santis, L. The northernmost Adriatic Sea: A potential location for CO2 geological storage? Mar. Pet. Geol. 2013, 42, 148–159. [Google Scholar] [CrossRef]
- Velić, J.; Malvić, T.; Cvetković, M.; Velić, I. Stratigraphy and petroleum geology of the Croatian part of the Adriatic basin. J. Pet. Geol. 2015, 38, 281–300. [Google Scholar] [CrossRef]
- Malvić, T.; Dureković, M.; Šikonja, Ž.; Čogelja, Z.; Ilijaš, T.; Kruljac, I. Exploration and production activities in northern Adriatic Sea (Croatia), successful joint venture INA (Croatia) and ENI (Italy). NAFTA 2011, 62, 287–292. [Google Scholar]
- Velić, J.; Malvić, T. Depositional conditions during Pliocene and Pleistocene in Northern Adriatic and possible lithostratigraphic division of these rocks. NAFTA 2011, 62, 25–32. [Google Scholar]
- Tari, V. Evolution of the northern and western Dinarides: A tectonostratigraphic approach. EGU Steph. Mueller Spec. Publ. Ser. 2002, 1, 223–236. [Google Scholar] [CrossRef]
- Baù, D.; Ferronato, M.; Gambolati, G.; Teatini, P. Basin-scale compressibility of the Northern Adriatic by the radioactive marker technique. Géotechnique 2002, 52, 605–616. [Google Scholar] [CrossRef]
- Ferronato, M.; Gambolati, G.; Teatini, P. Unloading-reloading Uniaxial Compressibility of Deep Reservoirs by Marker Measurements. In Proceedings of the 11th International FIG Symposium on Deformation Measurements, Santorini Island, Greece, 25–28 May 2003. [Google Scholar]
- Ciccotti, M.; Almagro, R.; Mulargia, F. Static and dynamic moduli of the seismogenic layer in Italy. Rock Mech. Rock Eng. 2004, 37, 229–238. [Google Scholar] [CrossRef]
- Mashinsky, E.I. Differences between static and dynamic elastic moduli of rocks: Physical causes. Russ. Geol. Geophys. 2003, 44, 953–959. [Google Scholar]
- Benetatos, C.; Rocca, V.; Sacchi, Q.; Verga, F. How to approach subsidence evaluation for marginal fields: A case history. Open Pet. Eng. J. 2015, 8, 214–234. [Google Scholar]
- Rutqvist, J.; Wu, Y.-S.; Tsang, C.-F.; Bodvarsson, G.A. A modeling approach for analysis of coupled multiphase fluid flow, heat transfer, and deformation in fractured porous rock. Int. J. Rock Mech. Min. Sci. 2002, 39, 429–442. [Google Scholar] [CrossRef]
- Codegone, G.; Rocca, V.; Verga, F.; Coti, C. Subsidence modeling validation through back analysis for an italian gas storage field. Geotech. Geol. Eng. 2016, 34, 1749–1763. [Google Scholar] [CrossRef]
- Giani, G.P.; Gotta, A.; Marzano, F.; Rocca, V. How to address subsidence evaluation for a fractured carbonate gas reservoir through a multi-disciplinary approach. Geotech. Geol. Eng. 2017, 35, 2977–2989. [Google Scholar] [CrossRef]
- Davies, J.P.; Davies, D.K. Stress-dependent Permeability: Characterization and Modelling. In Proceedings of the SPE Annual Technical Conference and Exhibition, Houston, TX, USA, 3–6 October 1999. [Google Scholar]
- Gutierrez, M.; Lewis, U. The Role of Geomechanics in Reservoir Simulation. In Proceedings of the SPE/ISMR Eurock’98, Trondheim, Norway, 8–10 July 1998. [Google Scholar]
- Petunin, V.V.; Tutuncu, A.N.; Prasad, M.; Kazemi, H.; Yin, X. An Experimental Study for Investigating the Stress Dependence of Permeability in Sandstones and Carbonates. In Proceedings of the 45th US Rock Mechanics/Geomechanics Symposium, San Francisco, CA, USA, 26–29 June 2011. [Google Scholar]
- Santos, R.S.E.; Borba, M.A.; Ferreira, H.F. Stress-dependent Permeability Measurement of Indiana Limestone and Silurian Dolomite Samples in Hydrostatic Tests. In Proceedings of the SBMR—ISRM Specialized Conference, Goiania, Brazil, 9–13 September 2014. [Google Scholar]
- Schutjens, P.M.T.M.; Hanssen, T.H.; Hettema, M.H.H.; Merour, J.; de Bree, P.; Coremans, J.W.A.; Helliesen, G. Compaction-induced porosity/permeability reduction in sandstone reservoirs: Data and model for elasticity-dominated deformation. SPE Reserv. Eval. Eng. 2004, 7, 202–216. [Google Scholar] [CrossRef]
- Davich, P.; Labuz, J.; Guzina, B.; Drescher, A. Small Strain and Resilient Modulus Testing of Granular Soils; Minnesota Department of Transportation, Research Services Section: St. Paul, MN, USA, 2004. [Google Scholar]
- Rocca, V. Development of a fully coupled approach for evaluation of wellbore stability in hydrocarbon reservoirs. Am. J. Environ. Sci. 2009, 5, 781–790. [Google Scholar] [CrossRef]
Figure 1.
Field location and simplified structural map of the western sector of the North Adriatic Basin (modified from [
12,
13]).
Figure 1.
Field location and simplified structural map of the western sector of the North Adriatic Basin (modified from [
12,
13]).
Figure 2.
Workflow for integrated modeling.
Figure 2.
Workflow for integrated modeling.
Figure 3.
Extension of the reservoir and the regional model.
Figure 3.
Extension of the reservoir and the regional model.
Figure 4.
Typical Pleistocene anticline in the Northern Adriatic Sea.
Figure 4.
Typical Pleistocene anticline in the Northern Adriatic Sea.
Figure 5.
Stratigraphic sequence adopted for the characterization of the geomechanical model.
Figure 5.
Stratigraphic sequence adopted for the characterization of the geomechanical model.
Figure 6.
Example of static pressure variations in case of medium water encroachment.
Figure 6.
Example of static pressure variations in case of medium water encroachment.
Figure 7.
Pool 1: Triaxial CIU test results.
Figure 7.
Pool 1: Triaxial CIU test results.
Figure 8.
Pool 2: Triaxial CID test results.
Figure 8.
Pool 2: Triaxial CID test results.
Figure 9.
Pool 1: Young’s modulus vs effective stress.
Figure 9.
Pool 1: Young’s modulus vs effective stress.
Figure 10.
Pool 2: Young’s modulus vs effective stress.
Figure 10.
Pool 2: Young’s modulus vs effective stress.
Figure 11.
Static and dynamic Young’s modulus values as a linear function of depth together with data obtained from laboratory tests and well log interpretation.
Figure 11.
Static and dynamic Young’s modulus values as a linear function of depth together with data obtained from laboratory tests and well log interpretation.
Figure 12.
Normalized permeability vs normalized porosity for PLQ1 D1A (red) and PLQ A5 (blue).
Figure 12.
Normalized permeability vs normalized porosity for PLQ1 D1A (red) and PLQ A5 (blue).
Figure 13.
Simulation data: normalized permeability (and permeability) vs reservoir mean effective stress in PLQ1 D1A.
Figure 13.
Simulation data: normalized permeability (and permeability) vs reservoir mean effective stress in PLQ1 D1A.
Figure 14.
Subsidence phenomena evolution in case of medium aquifer support, static elastic modulus and one-way coupling approach. (a) Subsidence (figure on top) and cumulative vertical displacement along a vertical section (figure on the bottom) at the end of primary production; (b) Subsidence (figure on top) and cumulative vertical displacement along a vertical section (figure on the bottom) at the end of simulation.
Figure 15.
Subsidence phenomena evolution in case of medium aquifer support, static elastic modulus and two-way coupling approach. (a) Subsidence (figure on top) and cumulative vertical displacement along a vertical section (figure on the bottom) at the end of primary production; (b) Subsidence (figure on top) and cumulative vertical displacement along a vertical section (figure on the bottom) at the end of simulation.
Table 1.
Stratigraphic zonation of the 3D model.
Table 1.
Stratigraphic zonation of the 3D model.
| Age | Formation | Lithology | Zone in 3D Model | Mean Thickness (m) | Surface | |
|---|
| Holocene | Ravenna | Unconsolidated gravel, clay, silt, sand | 1 | 50 | | | |
| Pleistocene | Clay with local sand interlayer | 2 | 400 | | Top Carola ** | |
| Carola | Alternating thin sands and clays | 3 | 130 | | Top pool 1 | |
| Sand with sandy claystone interlayer | 4 * | 10 | | Bottom pool 1 | |
| Alternating thin sands and clays | 5 | 150 | | Top pool 2 | |
| Sand with sandy claystone interlayer | 6 * | 15 | | Bottom pool 2 | |
| Alternating thin sands and clays | 7 | 50 | | Top Santerno ** | |
| Pliocene | Santerno | Clays | 8 | 250 | | Bottom Santerno ** | |
| Miocene-Palaeocene | Undifferentiated carbonate substratum | Marls e calcareous marls | 9 | 2000 | | | |
| Limestone | |
| Mesozoic | |
Table 2.
Mechanical parameters adopted for rock characterization.
Table 2.
Mechanical parameters adopted for rock characterization.
| Stratigraphic Sequence | Geomechanical Class | Rock Density (g/cm3) | Poisson’s Ratio (−) | Biot’s Coeff. (−) | Uniaxial Compressive Strength, UCS (bar) | Cohesion (bar) | Friction Angle (°) | Dilation Angle (°) |
|---|
| Ravenna | 1 * | 1.9 | 0.3 | 1 | 8 | 2 | 38 | 5 |
| 2 | 2.0 | 35 | 10 | 30 |
| Carola | Upper Carola | 3 | 2.0 | 50 | 15 | 28 |
| Pool 1 | 4 ** | 2.1 | 26 | 6.3 | 38.8 |
| Interlayer | 3 | 2.0 | 50 | 15 | 28 |
| Pool 2 | 4 ** | 2.1 | 26 | 6.3 | 38.8 |
| Lower Carola | 3 | 2.0 | 50 | 15 | 28 |
| Santerno caly | 5 | 2.0 | 57 | 18 | 25 |
| Carbonatic substratum | 6 | 2.5 | 115 | 30 | 35 |
© 2018 by the authors. Licensee MDPI, Basel, Switzerland. This article is an open access article distributed under the terms and conditions of the Creative Commons Attribution (CC BY) license (http://creativecommons.org/licenses/by/4.0/).


