Abstract
Insulators play a crucial role in ensuring the normal operation of the power system, and the creepage distance is an important electrical parameter of insulators. Most available solutions focus mainly on offline measurement methods, and online measurement for insulator creepage distance on transmission lines remains a challenging task. To address this issue and to further improve the corresponding work efficiency, an online measurement method for insulator creepage distance is presented in this paper. Considering the glass material of the insulator and the long measuring distance, this method recognizes the insulator type indirectly by calculating the structural parameters of the insulators based on their geometric features, and then obtaining the creepage distance. Accordingly, a measurement system, which mainly includes an electronic total station and a camera with a telephoto lens, is designed in this paper. Moreover, this paper also proposes an error analysis model aimed at reducing the errors caused by the layout of this system. In the conducted experiments, this proposed method effectively obtains the creepage distance and the error correction model can further improve the measurement accuracy of structural parameters.
1. Introduction
Electrical power systems are expanding daily all over world, so situations of unscheduled power supply interruptions can cause problems ranging from simple inconveniences up to significant losses [1]. As a basic part of the power system, insulators play an important role in transmission lines. Several factors affect the performance of outdoor insulators, pollution probably being the most significant one. Contamination of insulators can cause flashovers in distribution lines as well as outages [1,2,3,4]. Therefore, electric power departments must conduct regular inspections and timely maintenance on electric transmission lines. The traditional inspection on electric transmission lines mainly depends on manpower inspection, which implies high labor intensity and low inspection efficiency [5]. In recent years, much work has been dedicated to address the above issues. For example, various types of robots are used to inspect power transmission lines. Power line robots (PLRs) have been developed throughout the world for inspection or maintenance tasks [6], but this emerging type of outdoor mobile robot do not use LIDAR to detect obstacles. Lately the Hokuyo UTM-30LX laser range finder has been used in power line robots to detect obstacles in their paths and has good performance when encountering the challenging, outdoor, power line environmental conditions [7]. For power transmission lines (PTLs) located in coastal and mountainous areas, inspection by aircraft is expensive and can be dangerous under bad weather conditions. Therefore, various types of maintenance robots for PTLs have been developed. In [8], state-of-the-art maintenance robots for power transmission lines, including PTL maintenance robots that have been developed by eight major research institutions, were summarized and tested. Moreover, due to the importance of smart sensing and power line tracking in a smart grid system, inspection robots are also used to detect illegal electricity usage by remote current measurement on overhead power lines [9]. For the possibility of remote detection of defective devices on power transmission lines, an inspection robot with cameras which combine ultraviolet, infrared and visual imaging techniques has been applied to execute the navigation and inspection tasks on 500 KV power transmission lines [10]. However, these robots do not support the inspection of other power line components and surrounding objects.
Besides manually inspecting power lines, which is still the main method, using unmanned aerial vehicles (UAVs) for performing automatic inspection of overhead power lines instead of foot patrols is an attractive option, since doing so is safer and offers considerable cost savings [11]. Some researchers have started to use unmanned helicopters to inspect power lines, such as an applied inspection robot called Smart Copter based on an Unmanned Autonomous Helicopter (UAH) [12]; a low-altitude unmanned aerial vehicle (UAV) remote-sensing platform, equipped with an optical digital camera, which is used to inspect power line corridors and locate obstacles within the power line corridor with accuracy [13]. Detecting and localizing the insulators automatically are very important for intelligent inspection tasks, which are the prerequisites for fault diagnoses. Images of transmission lines can also be acquired by using cameras or video cassette recorders (VCRs) carried on an UAV. After obtaining these aerial photographs, many methods have been proposed to detect and locate the insulators in the images with the difficulty of complex background and low image resolution [14,15,16,17,18,19,20]. In [14], an improved segmentation Fuzzy C-Means algorithm (FCM) is proposed to accurately segment insulators from the image. In [15], a method based on the Histogram Oriented Gradient which could precisely extract the insulators from the images and is suitable for many practical applications such as insulator fault diagnosis, insulator contamination grade determination and so on was described. Alternatively, many researchers have further analysed the insulators in the images. In [19], an intelligent discriminant diagnosis method for porcelain fuselage insulators in transmission lines which is based on a convolutional neural network (CNN) model is presented. In [20], a multi-saliency aggregation-based porcelain insulator flashover fault detection approach is proposed to identify the damaged area based on the color features of the damaged areas on the insulator surface in a color model. However, these methods are limited to the insulator image information, and ignore the typical structural parameters of insulators.
Because the electrical parameters of insulator are of great significance in preventing flashover of electric transmission lines [21], among which creepage distance is a very important parameter index [22,23,24], the measurement of the insulator creepage distance is meaningful. The creepage distance is the shortest path between two conductive media measured along the surface of nonconductive media [25]. The traditional approach is to measure the shortest distance between two electrodes of a test piece along the insulator surface using a non-stretch tape (or wire), but this method is not suitable for large-scale investigation of insulation creepage distance and has the disadvantage of being time-consuming and causing outages. Much work has been dedicated to address the above issue. In [26], auto CAD software has been used with the relationships between the curve and the geometric equations of the insulator to calculate creepage distance and surface area; however, this approach introduces man-made effects and still requires an offline state. The shape of the insulator shed is arc-shaped, so the upper and lower surface area of the shed can’t be simply made by the plane circle. In order to accurately measure the arc section of the outer skirt of the umbrella skirt, which is the creepage distance, a sensor is used to acquire the insulator image with a laser strip and obtain the creepage distance of the insulator in combination with the line structure light and visual photogrammetry methods [27], but it is relatively complicated to obtain a complete laser stripe image using a multi-pitch angle. In recent years, 3D reconstruction technology has been widely used in inspecting power transmission lines. Comprehensive 3D point cloud data can be obtained by 3D laser scanning and 3D modeling can also be performed by professional software. Then the creepage distance of the insulator is calculated based on the model [28,29,30]. However, this method requires fixed targets around measured insulators and is not applicable to glass insulators due to the detrimental effects of the glass on the laser. Therefore, how to realize the online measurement of the glass insulator creepage distance has recently become a challenging problem.
2. Overview
The creepage distance is an important parameter of the insulator that affects the safe operation of transmission lines. It refers to the shortest distance between two electrodes along the outer surface of the insulating member under a normal operating voltage. The creepage distance measurement mainly includes offline and online measurements. Generally, offline methods are adopted, however, those methods are not applicable in practical situations because of the power-off and low efficiency. On the other hand, there are certain difficulties with online measurements, mainly reflected in the following three aspects: (1) most of the currently used insulators on transmission lines are glass materials; (2) insulators located in the high-voltage transmission line tower are at a large distance; and (3) non-contact measurements are required.
Different insulator types generally present different electrical parameters. In Figure 1, the first row shows four different insulator types and the second row describes the corresponding section outlines. The red path describes the creepage distance of the insulator. Because the insulator type has in one-to-one correspondence with the creepage distance, and the structural parameters of different insulator types are also different, the insulator type can be obtained by calculating the structural parameters of the insulator and then the creepage distance is determined.
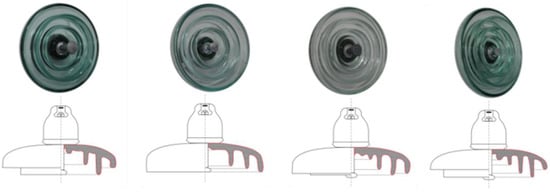
Figure 1.
Profile of different insulators.
In this paper, an online measurement method of insulator creepage distance is proposed, which indirectly obtains the insulator type by calculating the structural parameters of the insulators based on their geometric features and then obtains the creepage distance. The idea behind the proposed solution is depicted in Figure 2. Firstly, the electric power engineers set up a non-contact measurement system consisting of an electronic total station and a camera module. The camera module is used to capture images of the insulators and the electronic total station acquires the depth distance of the insulator through laser ranging. Next, the contours of umbrella skirts are extracted in the image and then the absolute dimensions of the insulator’s structural parameters are obtained based on geometrical feature of area ratio and geometrical feature of radius. Finally, a structural parameter processing step is performed to match the type and then determine the creepage distance. However, because the glass has detrimental effects on the laser, the existing laser ranging method has a large measurement error and may even cause the failure of the measurement. Therefore, the measured depth distance from the system to the metal umbrella handle is used to approximately replace the distance from the system to the glass umbrella skirt of each layer. Simultaneously, the errors caused by the layout of the measurement system are also corrected to improve the measurement accuracy of the insulator structural parameters, thereby achieving accurate recognition of the insulator types and acquisition of the creepage distance.

Figure 2.
Flowchart of the proposed insulator creepage distance measurement approach.
3. Methods
3.1. Design of the Measurement System
Based on the proposed solution, the electric power engineer needs to establish a measurement system. As shown in Figure 3, the system includes three parts: (a) the measured insulator; (b) the electronic total station with a laser transmitter; and (c) the camera module. The measured insulator whose umbrella skirts are made of glass is placed on a transmission line at a large distance. Since the measurement distance is far the visual method leads to a large error in the depth measurement of the insulator. Therefore, the electronic total station is used to obtain the depth distance of the insulator. Because the transparent glass umbrella skirts scatter limits the laser light, causing from large measurement errors up to failures of measurement, the depth distance is measured by hitting the laser on the metal handle of the insulator, which is regarded as the distance from the system to each umbrella skirt, and the error caused by this replacement has been verified to be negligible in the following experiment. At the same time, the camera module is used to capture a clear image of the measured insulator from a large distance and obtain the two-dimensional parameters of the insulator.
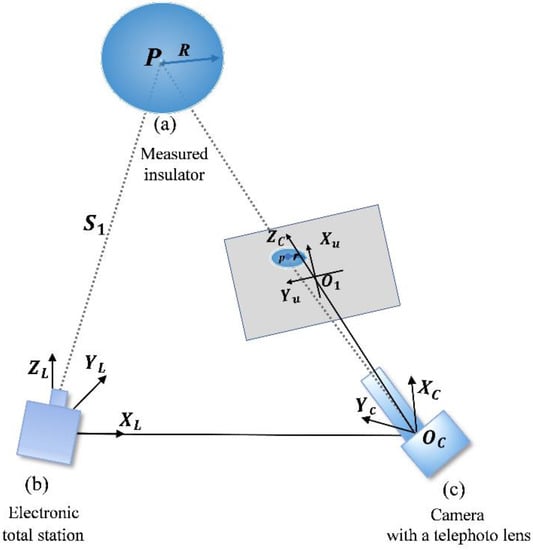
Figure 3.
Illustration of the measurement system.
3.2. Saliency Geometry Features of the Insulator
The insulator type can be obtained through calculating the structural parameters of the insulator. These structural parameters should meet the characteristics of easy capture and good distinction. The method proposed in this paper uses the salient geometric features of the insulator to obtain the structural parameters. The feature of the radius is used to preliminarily distinguish insulator types and the feature of the area ratio of umbrella skirts can further distinguish similar insulators. Thus, the type of insulator can be determined.
3.2.1. The Radius Feature of the Target
Figure 4 shows a projection sketch map of an insulator with three layers. According to the invariant theory of projective properties, a circle in 3D space is generally projected to an ellipse in an image. In particular, the long axis of the ellipse equals the diameter of the circle. Since all the umbrella skirts of an insulator are concentric circles, their plane projections are also all concentric ellipses. Moreover, the long shaft of each concentric ellipse is as long as the diameter of the corresponding umbrella skirt.
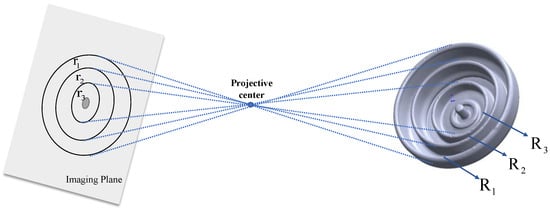
Figure 4.
Projection of an insulator with three layers.
In this measurement model as shown in Figure 3, XLYLZL is the coordinate system of the electronic total station, and the depth distance denoted as from the system to the insulator can be obtained in this coordinate system; In computer vision [31], XcYcZc is called the camera’s coordinate system, and the intersection of the optical axis and the image plane is O1. Setting f as the focal length of the lens, illustrated explanations are made as follows: O1Oc is the distance from the image plane to the projective centre and is denoted m; POc is the distance from the point P to the projective centre and is denoted n. Thus, according to the Gaussian imaging formula, Equation (1) is satisfied:
The electronic total station and the camera are on the same horizontal line, and the distance between them is small compared with the measured depth distance, so the object distance n is replaced with the measured depth distance . Thus, the following equation is obtained:
Since n >> f, the small hole imaging model can be used here. Thus, the relationship between the radius r in the image and the actual radius R is established, where , is the pixel value of the insulator radius on the image and which is the size conversion of pixels and physical distances:
Thus the solution of the real radius R could be described using Equation (4). The serial number of insulator layers from outside to inside recorded as i is less than or equal to four, i.e., i ≤ 4. The same definition is adopted in the rest of this paper:
The evolution of the real radius R with respect to depth distance is given by:
Since f is much larger than r and has little effect on R, the depth distance from the system to the metal handle can be used to represent the depth distance of each umbrella skirt in theory.
Furthermore, the error caused by this replacement is considered and discussed in Figure 5. For example, consider an insulator where the measured distance from the system to the metal handle O is 44.501 m, the radius r of the 2th layer in the image is 5.4788 mm, and the distance recorded as t from the 2th layer of the umbrella skirts to the metal handle O is changing within 40 mm. From Table 1, it can be seen that the error of the measured radius caused by the replacement is less than 0.1 mm, and the statistical error is 0.042 mm calculated from 40 sets of data. Therefore, the error introduced by the approximate substitution has a very small influence on the measured values of our system and can be ignored here.
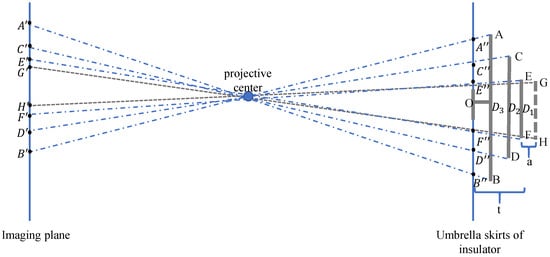
Figure 5.
Example of two similar insulators.

Table 1.
Radius error caused by the replacement.
Because an ellipse has five degrees of freedom, the position and shape of an ellipse can be determined solely by five parameters. The implicit equation of ellipse is written as follows:
Using the least squares method based on the algebraic distance to fit the ellipse, the engineers select five evenly distributed points on the ith layer of the umbrellas in the image, which are denoted as (xij, yij) j = [1, 2, 3, 4, 5]. Due to some errors, the above equation does not necessarily have a solution matching the actual measured points. In this case, the best approximation theorems are introduced to explore the existence of an approximate solution. The specific solution process has been described in [32,33]. Thus, the long shaft of ellipse can be computed with the following equation:
3.2.2. The Area Ratio Feature of the Target
As shown in Figure 5, AB, CD, and EF are the umbrella skirts of one insulator, and AB, CD, and GH are the umbrella skirts of another insulator. The two insulators differ only in the thickness of the third layer, both of which are projected as on the plane of the metal handle O and both have the same measured radius values. In this case, they will be misrecognized as the same insulator if only the radius feature is used. To address the shortcomings of the radius feature, this paper further proposes the feature of the area ratio, namely, the area ratio between each layer of the fitted umbrella skirts in the image.
According to the dependency and definite proportion of line projections, collinear line segments will retain the same length ratio before and after projection. As illustrated in Figure 6, a concentric hemisphere has a line segment, denoted O1-A1-B1 passing through its centre, and its corresponding projection on the 2D imaging is denoted O2-A2-B2.
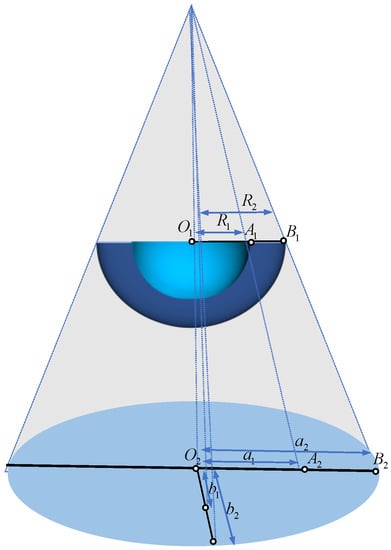
Figure 6.
Projection of a spatial circle on imaging plane.
Thus, the following equation is satisfied:
Furthermore, the area ratio is defined as follows:
Therefore, the engineer can directly calculate the area ratio in the image with the long and short shafts of the ellipse to obtain the actual area ratio of the umbrella skirt. In Figure 5, the projections to the imaging plane from EF and GH are regarded as and , respectively; thus, their area ratios are different and can be used to distinguish these two similar types.
3.3. Correction of the Errors Caused by the Geometric Layout
In the above established measurement system, as shown in Figure 3, the distance measured by the electronic total station is considered the depth distance from the projective centre to the insulator in the camera model; this distance is an approximate substitution based on ignoring the distance between the electronic total station and the camera. However, in this section, the paper will consider the above distance and will analyse the error caused by the geometric layout of this system; subsequently, an error correction model is established to improve the measurement accuracy of the radius values. As shown in Figure 6, the electronic total station and the camera are fixed separately on screws OL and OR, and the distance between OL and OR is denoted as d, which leads to the error; the correction calculation equation is also given in this section.
In Figure 7, the coordinate system for the electronic total station OL-XLYLZL is established. Moreover, the distance of OLOR is 320 mm, and point P is one point on the metal handle of the insulator. The distance from P to OL is , and θ denotes the angle between and ; this angle can also be obtained by the electronic total station directly. Moreover, the point Oc is the projective centre, P1 is the projected point of P in the imaging plane, and the distance between OR and the imaging plane written as c is 4.88 mm. In this established model, the corrected distance from the point P to the projective centre can be calculated as follows:
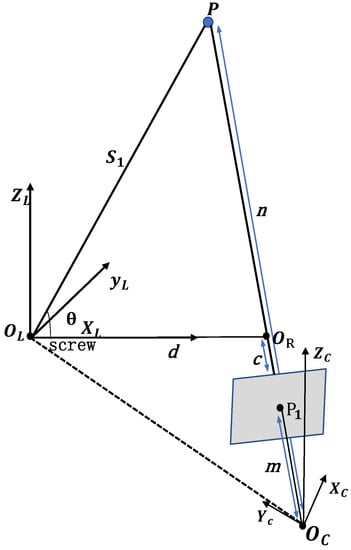
Figure 7.
Correction model of error caused by geometric layout.
Substitute this into Equation (1), the following equation set is established:
Assume that , and then solve Equation (10) to obtain m:
Therefore, in this model, the calculation equation of the measured radius is given by:
3.4. Structural Parameters Processing
The measured area ratio of the ellipse and the standard value are defined as and , respectively (i and j are serial numbers of umbrella skirts and i < j, , represent the ellipse area and standard area of jth layer). Moreover, and are the measured radius and the standard value of the jth layer, respectively, and N represents the total number of umbrella skirts. Thus, the matching error E is calculated as the root-mean-square error (RMSE). Therefore, the problem is transformed to seeking the insulator type with the minimum matching error. Then the creepage distance of the insulator is determined:
4. Experimental Results and Discussion
Several experiments are conducted to evaluate the performance of the proposed online measurement system. First of all, the experimental schedules are managed, and the experimental setup is described in detail; secondly, the pose stability of the measurement is verified in Test_1, comparative testing for the error correction model is established in Test_2, and the results of insulator type matching and creepage distance are described in Test_3; Finally, the practical performance of the proposed system is evaluated outdoors.
4.1. Experimental Setup
The proposed measurement system is illustrated in Figure 8. The workflow is listed as follows:
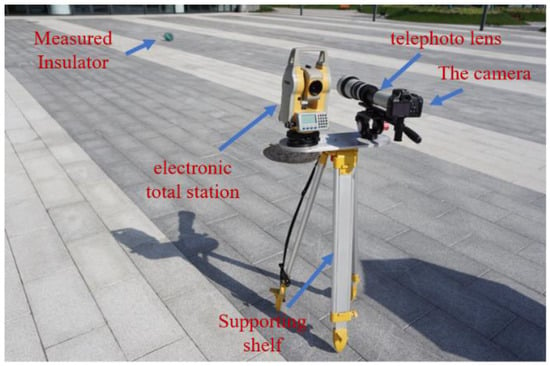
Figure 8.
Composition of the measurement system.
- (1)
- Data collection: Construct the measurement system as shown in Figure 8. Next, adjust the electronic total station to make the laser precisely hit the metal handle of the insulator and then capture a clear image of the distant insulator on the transmission lines using the camera with a telephoto lens.
- (2)
- Solving parameters: Combine the measured depth distance of the insulator and the captured image to calculate the structural parameters of the insulator.
- (3)
- Creepage distance measurement: Post-process these parameters, obtain the matching result that is the expected insulator type, and then gain the final creepage distance.
4.2. Several Experiments
4.2.1. Test_1: Pose Stability Testing
The experiment of test_1 is aimed at verifying the pose stability of the measurement. As shown in Figure 9, an insulator with six slight postural changes is placed at a fixed distance, which simulates the slight pose difference of the same insulator on an actual transmission line. In this experiment, the measurement system is used to obtain the structural parameters of the insulator in different poses, and experimental results are analysed and discussed in the following paragraphs.
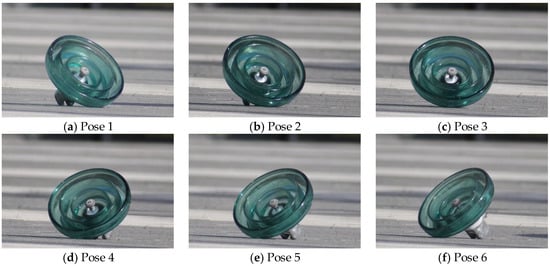
Figure 9.
An insulator with six different poses.
In Figure 10, the abscissa indicates the different structural parameters of the insulator, and the ordinate shows the relative error between the measured structural parameters value and the standard value. Different colours represent the above six different poses. From the diagram, the following analyses can be obtained:
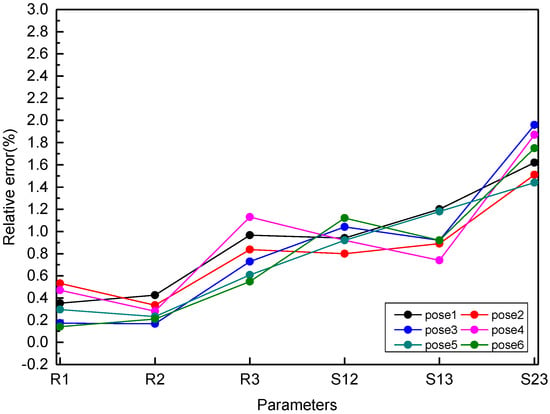
Figure 10.
Relative errors graph of the insulator with different poses.
(1) About R1 and R2, points on the polylines are close, while points are relatively dispersed regarding R3. Because R3 represents the radius of the innermost layer of the insulator, and in the case of the same measurement error, the smaller the radius is, the more obvious the relative error is.
(2) The area ratios of the insulators generally range from 0 to 10; however, relative to the measured insulator radiuses which usually range from 40 mm to 200 mm, the measurement error is more obviously reflected in the figure that these points representing the area ratios are more dispersed compared with radiuses.
(3) Based on the actual measurement requirements, the measurement error is within the allowable range, so the polylines approximately coincide together, indicating that the measured results tend to be stable when the insulators have slight postural changes.
4.2.2. Test_2: Comparative Testing with Error Correction
The experiment of test_2 is to verify the effectiveness of the error correction model, multiple insulators at different distances are measured by the measurement system and the error correction model is used to correct the measured values. In Figure 11, diagrams (a–d) are comparison charts before and after the error correction of the radius in the different skirt layers, where the subscripts a and b represent the radius-measured value after and before the correction, respectively and the subscript s denotes the standard values. Moreover, the red line represents the measured radius before the error correction, the blue line represents the measured radius after the error correction, and the standard value is displayed by the grey line.
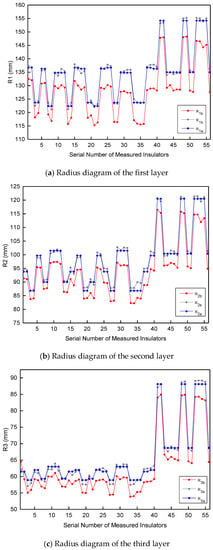
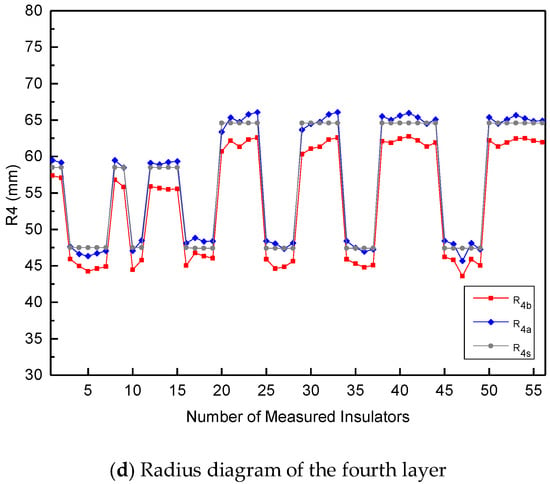
Figure 11.
Radius comparison diagrams.
From the figure, it can be seen that the red line has greater deviation from the grey line and these errors are introduced by the geometric layout of the measurement system. Then the RMSE is used here to evaluate the deviation between the measured values and the standard values. The RMSE of , , , and are 6.646 mm, 4.568 mm, 3.464 mm, and 2.495 mm, respectively; whereas the blue line appears to overlap with the grey line. Similarly, the RMSE of , , , and are 0.849 mm, 1.046 mm, 0.830 mm, and 0.827 mm, respectively, indicating that the error correction model can effectively reduce the deviation to a certain degree.
Therefore, these above experimental results show that the error correction model can effectively improve the measurement accuracy of the insulator structure parameters, thereby further improving the accuracy of pattern matching.
4.2.3. Test_3: Creepage Distance Determination
The creepage distance determination is an important part of proposed method. After obtaining the structural parameters of the insulator, the matching error between the measured insulator and the standard insulator is calculated by screening the insulator types in the database. Here, the insulator labelled A10 is taken as a measured insulator and searched the database to seek the correct matching type. In Figure 12, the abscissa indicates the standard insulators in the database, and the ordinate shows the matching error between the queried insulator and the galleried insulators.
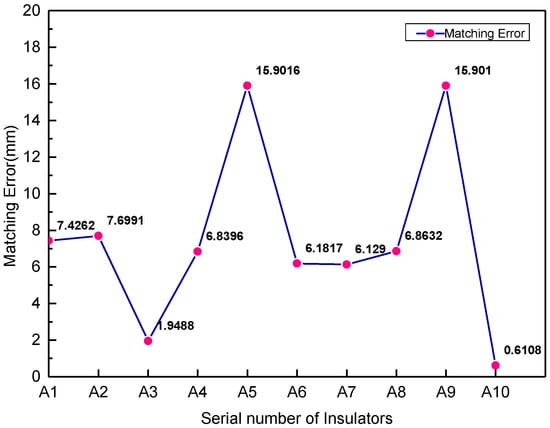
Figure 12.
The matching errors between the query insulator and gallery insulators.
In the experimental results, insulators with different structures have obvious differences in matching errors. In the figure, the matching error ranges from 0.6108 mm to 15.901 mm. The minimum matching error is 0.6108 mm and its matching type is A10, which is the correct one, indicating that the insulator style matching is effective.
Table 2 enumerates the matching errors between the targeted insulators and the searched insulators, and the creepage distances of the corresponding insulator types are also displayed; Q denotes the queried insulator types, G denotes the galleried insulator types, and E denotes the matching error. T denotes the matching types; Y/N shows its correctness, where Y denotes correct, and N denotes incorrect. The value in bold is the minimum.

Table 2.
Matching results of insulators.
From the table, each queried insulator can be matched to the correct type based on the minimum matching error and the corresponding creepage distance is determined. On the one hand, the matching error of the insulator with similar structures is relatively close, but it can also be matched to the correct type by seeking the minimum matching error. On the other hand, insulators with similar creepage distances but different types are also different. For example, the difference in creepage distance between A2 and A6 is only 10 mm, but the matching error is obviously different in Table 2, indicating that their structural parameters are very different. Therefore, the experimental results show that the proposed measurement method is effective and can distinguish types and obtain corresponding creepage distances even if the insulators with similar creepage distances.
4.3. Outdoor Testing
The outdoor testing is aimed at verifying the practicality of the measurement system and effectiveness of the proposed measurement method on multiple transmission lines. A large number of outdoor transmission lines in Huizhou of Guangdong, Shanghai and so on are tested using the measurement system; selected images are shown in Figure 13. Moreover, corresponding experimental results are clearly displayed in Table 3, Table 4 and Table 5. In Table 3 and Table 4, N is the serial number of the insulators shown in Figure 13, and θ are the distance and the angle measured by the electronic total station, the measured value is denoted as M, and the standard value is denoted as S. The measured values of the structural parameters, including the radius and the area ratio, along with its standard values, are listed in the table.
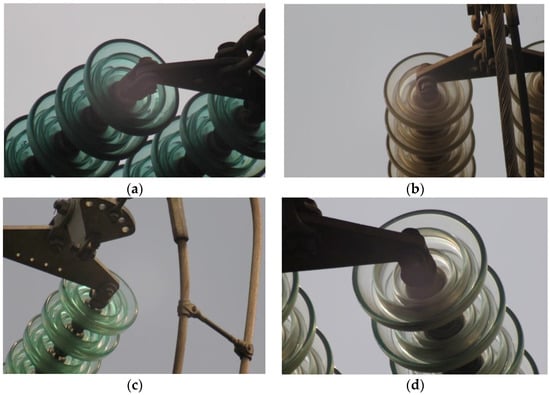
Figure 13.
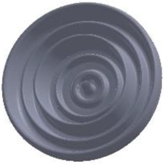
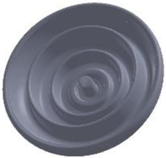
Examples of insulators on high tension lines; (a) the first type of the insulators; (b) the second type of the insulators; (c) the third type of the insulators; (d) the fourth type of the insulators;

Table 3.
Measured and standard values of radius.

Table 4.
Measured and standard values of area ratio.

Table 5.
Corresponding Parameters and Models.
In Table 3, (a–d) represent the four types of insulators with different angles and at far distances ranging from 30 m to 60 m, which have different structural parameters reflecting the differences in the type. The measurement system is used to measure the structural parameters of the insulators and experimental results show that the deviations between the measured radius and the standard value of each layer of the insulators are within 2 mm, which indicates that the measuring system can effectively achieve the accurate measurement of the structural parameters of the insulators on different transmission lines.
In Table 4, the area ratios of each layer of the four insulators are listed, and the deviations between the measured area ratios from the standard values are within 0.1, which indicates that the contour fitting used in the proposed method is effective and accurate, and the feature of area ratio can greatly assist the feature of radius to accurately distinguish the type.
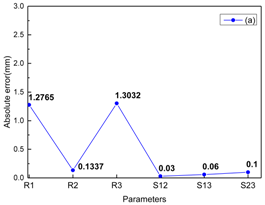
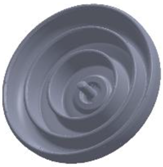
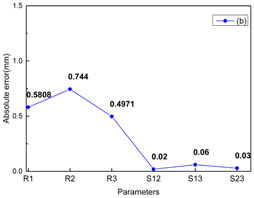
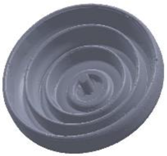
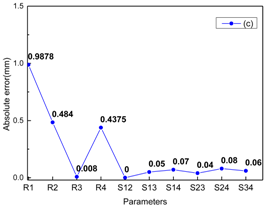
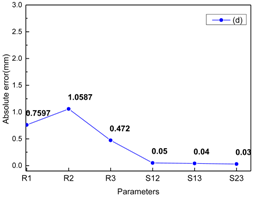
In Table 5, the matching errors are calculated from the previously measured structural parameters and the matching types of the insulator are sought. The experimental results including the matching errors, the absolute error of the structural parameters, the matching models and the obtained creepage distances are clearly presented in the table. Here (a) and (b) are insulators with the same creepage distance of 450 mm, but they are obviously different in structure which can be clearly seen from the insulator models; (a) and (c) are the insulators whose creepage distances differ greatly and their structure are also significantly different. Therefore, these experimental results indicate that the proposed method in this paper, which obtains the creepage distance of the insulators by calculating structural parameters to indirectly match the type, is effective and has practical application value.
5. Conclusions
In order to measure the creepage distance of insulators online, which is a very significant and challenging task in the inspection of transmission lines, an online measurement method that indirectly obtains the creepage distance by calculating the structural parameters of the insulators is proposed in this paper. Based on the typical geometric features of the insulators, including area ratio and radius, this paper establishes a measurement system consisting of an electronic total station and a camera module to obtain the depth distance and the image information of the insulators. Simultaneously, this paper also establishes an error correction model to reduce the errors introduced by the geometric layout of the designed measurement system, which could improve the measurement accuracy of the structural parameters. Next, by matching the measured insulator with the standard insulators and calculating the matching errors, the insulator type can be obtained, thereby the acquisition of the creepage distance is achieved. Finally, multiple sets of outdoor experiments show that the established measurement system has good measurement stability when the insulators undergo slight postural changes; the designed error correction model can effectively improve the measurement accuracy; the proposed online measurement method can accurately achieve the online creepage distance measurement of glass insulators on multiple transmission lines. Therefore, experimental results verify that the online measurement method proposed in this paper has a good practical engineering application value.
In the future, our research group will carry out further work in the following areas: the measurement range will be expanded to include glass, ceramic and composite insulators, so that this online measurement method for insulator creepage distance can be widely applied in various transmission lines and improve the working efficiency of electric power engineers, the use of the random forest and other optimized algorithms to efficiently fit the insulator profile will be examined and the integration and automation of this measurement system will be improved to make it more compact and convenient.
Author Contributions
Z.Z., D.Z., J.H. and K.L. developed the system modeling and algorithm design; Z.Z. has supervised the research work; J.H. and K.L. performed the experiments; J.H. and K.L. analyzed the experimental data; J.H. wrote the paper. All authors reviewed the manuscript.
Funding
This research received no external funding.
Conflicts of Interest
The authors declare no conflict of interest.
References
- Vita, V.; Ekonomou, L.; Chatzarakis, G.E. Design of artificial neural network models for the estimation of distribution system voltage insulators’ contamination. In Proceedings of the 12th WSEAS International Conference on Mathematical Methods, Computational Techniques and Intelligent Systems, Sousse, Tunisia, 3–6 May 2010; pp. 196–200. [Google Scholar]
- Zhao, Z.; Xu, G.; Qi, Y. Representation of binary feature pooling for detection of insulator strings in infrared images. IEEE Trans. Dielectr. Electr. Insul. 2016, 23, 2858–2866. [Google Scholar] [CrossRef]
- Pylarinos, D.; Siderakis, K.; Thalassinakis, E. Comparative investigation of silicone rubber composite and room temperature vulcanized coated glass insulators installed in coastal overhead transmission lines. IEEE Electr. Insul. Mag. 2015, 31, 23–29. [Google Scholar] [CrossRef]
- Sp, P.S.; Ekonomou, L. Comparison of adaptive techniques for the prediction of the equivalent salt deposit density of medium voltage insulators. WSEAS Trans. Power Syst. 2017, 12, 220–224. [Google Scholar]
- Xie, X.W.; Liu, Z.J.; Xu, C.J.; Zhang, Y.Z. A Multiple Sensors Platform Method for Power Line Inspection Based on a Large Unmanned Helicopter. Sensors 2017, 17, 1222. [Google Scholar] [CrossRef] [PubMed]
- Toussaint, K.; Pouliot, N.; Montambault, S. Transmission line maintenance robots capable of crossing obstacles: State-of-the-art review and challenges ahead. J. Field Robot. 2009, 26, 477–499. [Google Scholar] [CrossRef]
- Richard, P.L.; Pouliot, N.; Montambault, S. Introduction of a LIDAR-based obstacle detection system on the LineScout power line robot. In Proceedings of the International Conference on Advanced Intelligent Mechatronics, Besacon, France, 8–11 July 2014; pp. 1734–1740. [Google Scholar]
- Seok, K.H.; Kim, Y.S. A State of the Art of Power Transmission Line Maintenance Robots. J. Electr. Eng. Technol. 2016, 11, 1412–1422. [Google Scholar] [CrossRef]
- Byambasuren, B.E.; Kim, D. Inspection Robot Based Mobile Sensing and Power Line Tracking for Smart Grid. Sensors 2016, 16, 250. [Google Scholar] [CrossRef] [PubMed]
- Zheng, L. Fault diagnosis system for the inspection robot in power transmission lines maintenance. In Proceedings of the International Conference on Optical Instruments and Technology, Shanghai, China, 24 November 2009; Volume 7513. [Google Scholar]
- Liu, C.A.; Dong, R.; Wu, H.; Yang, G.T.; Lin, W. A 3D Laboratory Test-platform for Overhead Power Line Inspection. Int. J. Adv. Robot. Syst. 2016, 13, 72. [Google Scholar] [CrossRef]
- Wang, B.H.; Chen, X.G.; Wang, Q.; Liu, L.; Zhang, H.L.; Li, B.Q. Power line inspection with a flying robot. In Proceedings of the 1st International Conference on Applied Robotics for the Power Industry, Montreal, QC, Canada, 5–7 October 2010; pp. 1–6. [Google Scholar]
- Zhang, Y.; Yuan, X.; Fang, Y.; Chen, S.Y. UAV Low Altitude Photogrammetry for Power Line Inspection. ISPRS Int. J. Geo-Inf. 2017, 6, 14. [Google Scholar] [CrossRef]
- Wang, B.W.; Gu, Q.A. Detection Method for Transmission Line Insulators Based on an Improved FCM Algorithm. Telkomnika 2015, 13, 164. [Google Scholar] [CrossRef]
- Raihan, M.; Hossain, S.M.I.; Ghosh, K. Gradient Based Power Line Insulator Detection. Ph.D. Thesis, East West University, Dhaka, Bangladesh, 2017. [Google Scholar]
- Zhao, Z.; Liu, N.; Wang, L. Localization of multiple insulators by orientation angle detection and binary shape prior knowledge. IEEE Trans. Dielectr. Electr. Insul. 2016, 22, 3421–3428. [Google Scholar] [CrossRef]
- Park, J.P.; Lee, J.K.; Cho, B.H.; Oh, K.Y. An Inspection Robot for Live-Line Suspension Insulator Strings in 345-kV Power Lines. IEEE Trans. Power. Deliv. 2012, 27, 632–639. [Google Scholar] [CrossRef]
- Park, J.Y.; Lee, J.K.; Cho, B.H.; Oh, K.Y. Development of Insulator Diagnosis Algorithm Using Least-Square Approximation. IEEE Trans. Power. Deliv. 2011, 27, 3–12. [Google Scholar] [CrossRef]
- Liu, Y.P. The discrimination method as applied to a deteriorated porcelain insulator used in transmission lines on the basis of a convolution neural network. IEEE Trans. Dielectr. Electr. Insul. 2017, 24, 3559–3566. [Google Scholar] [CrossRef]
- Zhai, Y.J.; Cheng, H.Y.; Chen, R.; Yang, Q.; Li, X.X. Multi-Saliency Aggregation-Based Approach for Insulator Flashover Fault Detection Using Aerial Images. Energies 2018, 11, 340. [Google Scholar] [CrossRef]
- Zhang, Y.Q.; Li, L.C.; Han, Y.X.; Ruan, Y.X.; Yang, J.; Cai, H.S.; Liu, G.; Zhang, Y.; Jia, L.; Ma, Y.T. Flashover Performance Test with Lightning Impulse and Simulation Analysis of Different Insulators in a 110 kV Double-Circuit Transmission Tower. Energies 2018, 11, 659. [Google Scholar] [CrossRef]
- Li, W.; Zou, D.H.; Zou, M.; Luo, R.C.; Yan, Y. Study on Insulator Deterioration Mechanism of ±800 kV Transmission Lines and Live Detection Method of Faulty Insulator. DEStech Trans. Comput. Sci. Eng. 2016. [Google Scholar] [CrossRef]
- Bashir, N.; Ahmad, H. Ageing of transmission line insulators: The past, present and future. In Proceedings of the Power and Energy Conference, Johor Bahru, Malaysia, 1–3 December 2008; pp. 30–34. [Google Scholar]
- Wijayatilake, A.C.S. Reviewing of Insulator Selection Criteria for Overhead Power Lines in Coastal Areas of Sri Lanka. J. Inst. Eng. 2014, 47, 57. [Google Scholar] [CrossRef]
- Gilbert, J.A. Method of Manufacturing Tissue Sealing Electrodes. U.S. Patent No. 8,814,864, 26 August 2014. [Google Scholar]
- Wang, Z.N. Calculation of Insulator Creepage Distance, Weight and Surface Area with AutoCAD. Insul. Surge Arresters 2012, 5, 9–11. [Google Scholar]
- Liu, Y.W.; Jiang, J.W.; Tang, M.; Zhao, L.; Wang, W.J. Insulator Creepage Distance Measurement Based on Photogrammetry Method. Bull. Surv. Mapp. 2012, 12, 15–17. [Google Scholar]
- Yang, H.; Wu, W. Insulator icing monitoring based on 3D image reconstruction. Electr. Power Autom. Equip. 2013, 33, 92–98. [Google Scholar]
- Pei, H.K.; Jiang, S.; Lin, G.A.; Huang, H.; Jiang, W.S. 3D reconstruction of transmission route based on UAV oblique photogrammetry. Sci. Surv. Mapp. 2016, 41, 292–296. [Google Scholar]
- Li, X.W.; Liu, W.D.; Wang, L.D.; Zhou, G.C. Research on new technology for on-line measurement of external insulation creepage distance. High Volt. Appar. 2013, 49, 96–100. [Google Scholar]
- Qiu, Z.; Fang, H.; Zhang, Y.; He, Y. Measurement of leaf area index using image-processing technology. In Proceedings of the SPIE—The International Society for Optical Engineering, Wuhan, China, 3 November 2005; Volume 6043, pp. 68–73. [Google Scholar]
- Halir, R. Numerically Stable Direct Least Squares Fitting of Ellipses. Cent. Eur. Comput. Graph. Vis. 1998, 98, 125–231. [Google Scholar]
- Fitzgibbon, A.W.; Pilu, M.; Fisher, R.B. Direct Least Squares Fitting of Ellipses. IEEE Trans. Pattern Anal. Mach. Intell. 1999, 21, 476–480. [Google Scholar] [CrossRef]
© 2018 by the authors. Licensee MDPI, Basel, Switzerland. This article is an open access article distributed under the terms and conditions of the Creative Commons Attribution (CC BY) license (http://creativecommons.org/licenses/by/4.0/).
