1. Introduction
During the last decades, several environmental policies aiming at slowing down the climate change phenomenon (thus lowering the related negative effects, such as the increase in the average global temperature, the reduction in Artic Sea and land ice, and the increase in sea level) have been defined and implemented. In particular, referring to global warming, the Intergovernmental Panel on Climate Change (IPCC), in its Fifth Assessment Report [
1], underlined the need for a strong greenhouse gases (GHG) emissions reduction over the next decades (to zero or nearly zero by the end of this century), in order to ensure a temperature rise lower than 2 °C with respect to the pre-industrial value. Referring to this aspect, it has to be remarked that Article 2.1(a) of the Paris Agreement, approved by the 2015 Conference of the Parties (COP21) of the United Nations Framework Convention on Climate Change (UNFCCC), and entered into force on 4 November 2016, states that efforts have to be pursued to keep the global temperature increase below 1.5 °C in comparison with the pre-industrial level [
2]. According to this target, the IPCC has been requested to deliver, in 2018, a special report on the global warming impacts in the case of a temperature rise equal to 1.5 °C and on the GHG emission pathways that have to be set to reach this goal [
3].
The issues mentioned above and the goals lead to an increasing attention towards the decarbonization of economic and energy systems (i.e., the reduction in the carbon intensity, which quantifies the amount of CO2 emissions per unit of gross domestic product (GDP) generated). It has to be highlighted that planning, regulation, and actions promoting decarbonization currently do not share a common framework at a global level, and that different approaches are adopted by single countries or groups of countries, such as the European Union (EU).
Focusing on the first world contributors, it has to be highlighted that in 2015, six countries or areas accounted for more than 63% of the overall GHG emissions. In particular, the share on the total was equal to 28.1% for China, 15.5% for the U.S., 9.9% for the EU-28, 6.4% for India, 4.5% for the Russian Federation, and 3.5% for Japan [
4]. For these reasons, it is useful to briefly analyze the climate policies and emissions reduction targets of these countries.
Historically, the EU has devoted relevant attention to climate and environmental policies. Referring to recent years, in 2011, the EU published the “Energy Roadmap 2050” [
5]. This document sets an emission reduction target by 2050, ranging between 80% and 95% with respect to the 1990 level, with an 80% reduction to be obtained only by means of internal measures. Therefore, this reduction has to be achieved avoiding the use of international credits, that is, financial systems corresponding to 1 t of CO
2 removed as a consequence of an emission reduction project, and created by means of two mechanisms (the Clean Development Mechanism and the Joint Implementation), which were introduced by the Kyoto Protocol and that will be substituted by a new approach by 2020, on the basis of the Paris Agreement [
6]). This is justified by an economic reason, as in the mid-/long-term, a global effort towards a reduction in temperature rise could cause a reduction in the availability of credits at an affordable cost. A higher penetration of renewables, carbon capture and storage systems, nearly zero energy buildings, and smart grids (in accordance with the Strategic Energy Technology Plan [
7,
8,
9]) are identified as key factors to reach the decarbonization goal. The carbon price (the amount of money to be paid as a tax by emitters for each ton of CO
2 produced, which is at the basis of carbon taxation systems) is another important element taken into account in the decarbonization strategy. In particular, an increase in the carbon price is considered more effective than an increase in fossil fuel costs, as the carbon pricing revenues could be used by the internal economic system. Referring to the single sectors, the Roadmap plans that the power generation system could be almost totally decarbonized by 2050 (96–99%), and underlined the relevant role that electricity could play in the future, forecasting that in the decarbonization scenarios it could satisfy 36–39% of the EU’s final energy demand by 2050, covering about 65% of the energy demand for light duty vehicles and passenger cars. On the other hand, transport and agriculture are the sectors that, according to the Roadmap analysis, are expected to achieve a lower decarbonization (less than 70% and 50% by 2050, respectively). Furthermore, in the Intended Nationally Determined Contribution (INDC) to the 2015 Paris Climate Agreement, the EU pledged a domestic reduction in GHG emissions of at least 40%, with respect to the 1990 level, by 2030 [
10].
Referring to China (in the framework of the Copenhagen Accord in 2009 [
11]), it promised to reduce its carbon intensity by 40–45% in comparison with the 2005 value, by 2020, and to increase the non-fossil fuels share in primary energy consumption to 15% by 2020 [
12]. Moreover, in the 2015 INDC, it set a reduction in carbon intensity equal to 60–65%, with respect to the 2005 one, by 2030, and it planned the peak in CO
2 emission before 2030, a 20% share of non-fossil fuels in the primary energy mix, and an increase in the forest stock [
13]. Eventually, in the 13th Five Year Plan (approved in 2016), new targets have been defined for carbon intensity (18% reduction from 2015 value by 2020, thus leading to an estimated overall reduction higher than the original 2009 target), for energy intensity (15% reduction from the 2005 value by 2020), for energy consumption (cap set at 5 billion total carbon emissions per year by 2020), and for the penetration of renewables in primary energy consumption (15% share by 2020) [
14].
Japan, in 2012, with the fourth Basic Environment Plan, set a target of an 80% reduction in GHG emissions by 2050, in comparison with the 1990 level, to be reached through an increase in energy efficiency and the penetration of renewables [
15]. The Japanese INDC at the 2015 Paris Climate Agreement defined instead a reduction of 26% from the 2013 value (corresponding to a reduction of 25.4% from 2005 value) in GHG emissions by 2030 as a goal feasible, by considering the current country energy mix [
16]. Furthermore, in 2016, the Ministry of the Environment introduced the Plan for Global Warming Countermeasures [
17], which aims at representing a general policy framework able to ensure the achievement of the mid-term target (−26% by 2030) and the long-term target (−80% by 2050) on GHG emissions reduction, set by the above mentioned documents, suggesting the measures to be implemented by both national and local government, with particular attention devoted to the main end-use sectors (industry, residential, commerce, and transport), to the energy conversion and to the Land Use, Land-Use Change and Forestry (LULUCF) sector.
India introduced its first plan on climate change, the National Action Plan on Climate Change (NAPCC), in 2008, thus defining a set of policies (promoting energy efficiency, mass transport, renewables, and nuclear energy) aiming at mitigating GHG emissions [
18]. In 2009, in the framework of the Copenhagen Accord, India pledged a 20–25% reduction in the emissions intensity of its GDP, with respect to the 2005 levels, by 2020 [
19], while in 2015, in its INDC [
20], it planned to reduce the emissions intensity by 33–35% from the 2005 value, by 2030. Among the other targets proposed in the INDC, about 40% of the cumulative power generation capacity from renewables, by 2030, and the creation of an additional carbon sink of 2.5–3.0 billion tons of CO
2 equivalent through the enhancement of forest coverage by 2030, can be mentioned.
In the Copenhagen Accord, Russia promised to reduce its GHG emissions by 15–25% in comparison with the 1990 value, by 2020 [
21]. In 2014, with Decree No. 504-p, a new emissions reduction target was set, equal to 75% of the 1990 level, by 2020 [
22], which is consistent with the range defined in the Copenhagen Accord. In the INDC to Paris Climate Agreement submitted in 2015, Russia slightly modified this target, setting the decrease in GHG emissions decrease goal to 70–75% of the 1990 value, by 2030, “subject to the maximum possible accounting of the absorbing capacity of forests” [
23].
The United States, which did not ratify the Kyoto protocol, in the framework of the Copenhagen Accord, pledged a GHG emissions reduction by 17% (including the LULUCF sector) by 2020, with respect to the 2005 value [
21]. Moreover, in the INDC to the Paris Climate Agreement, the Unites States set a target of a GHG emissions reduction equal to 26–28%, with respect to the 2005 value (including LULUCF), by 2025, underlining the need to make efforts for reaching the −28% goal. The United States planned to implement this target without using an international market mechanism, but only through domestic measures and regulations [
24]. Furthermore, under the Obama administration, in 2015, the Clean Power Plan [
25] (having as its objective the CO
2 emissions reduction in power sector by 32%, in comparison with the 2005 value by 2030) has been introduced by the U.S. Environmental Protection Agency (EPA).
It has to be noticed that China and India did not proposed pledges for the overall amount of GHG emissions, but for carbon intensity and emissions intensity, respectively.
It has to be further underlined that in order to reach these goals (in particular, those set by the single countries in the Paris Agreement INDCs), efforts have to be pursued (through ad hoc strategies, policies, and measures) for implementing modifications spreading over the whole energy chain, from the production of energy commodities to final consumption of energy in the end-use sectors. These changes in the energy mix, with a requested transition towards renewables, are strongly needed, in particular, in the power generation sector. In fact, in 2014, the electricity and heat production has been responsible for 42.1% of the global CO
2 emissions from fossil fuels combustion [
4].
In order to evaluate the mid–long term effects of the above-mentioned climate policies and targets and, in particular, the effectiveness of decarbonization pathways, during last decades, several forecasting scenario analyses (mostly focused on the EU) based on energy and climate models have been performed and different studies are available in the scientific literature. Among these, the one carried out by Capros et al. [
26] can be mentioned. It is based on the evaluation of the changes in the energy system configuration and of the related costs to reach the decarbonization targets set by the EU Roadmap 2050, through the use of seven energy and econometric models (whose characteristics, range of application, strengths, and weaknesses have been exhaustively considered [
27]). Capros et al. [
28] also demonstrated (by means of an analysis performed using the PRIMES energy system model [
29]) that the 2050 decarbonization targets can be reached through an improvement in the currently available technologies (i.e., without hypothesizing new breakthrough technologies) if significant modifications in the energy supply and demand are implemented. The decarbonization pathway set by the Roadmap 2050 has been assessed also by Hübler et al. [
30] by means of a computable general equilibrium (CGE) approach, putting into evidence the need for deeply taking into account the interdependencies among technological options, policy design, and sectoral policy effects, in order to reach the defined decarbonization goals. Focusing on the European INDC submitted to the United Nations Framework Convention on Climate Change (UNFCCC) for the COP21, Fragkos et al. [
31] underlined the relevant role played by the increase in energy efficiency and by the electrification of the final demand (especially in transport sector), joined with the decarbonization of the power generation in achieving the planned targets. Böhringer et al. [
32] instead critically examined the costs related to the implementation of EU climate policies, suggesting the need for better choosing goals and instruments to pursue GHG emissions reduction actions, in order to avoid excess cost and ensure the cost-effectiveness of the adopted policies.
At a more general level, the temporal scale of the transition towards decarbonized energy systems and the effects that key factors (such as the spread of innovations worldwide, the actions devoted to guide this transition, and the implementation of the Paris Agreement) could have in speeding up this phenomenon has been investigated by Kern et al. [
33]. Wu et al. [
34] proposed instead a model for assessing the penetration of low-carbon strategies in companies, based on the strategic interaction between enterprises and government in the framework of a complex network system. They thus highlighted that the enterprises’ expectation of government subsidies determines if a certain low-carbon option can have a successful diffusion or not, and how quick the diffusion is.
Referring to the extra-European countries, a lower number of studies is available. Among these, the ones carried out by Li et al. [
35], Chen [
36], and Chen et al. [
37] can be cited. In particular, the first one focuses on the evaluation of the impacts of decarbonization scenarios on the Chinese cement sector using the China TIMES [
38] energy model. The results of this analysis show the relevance of the improvement in energy efficiency in the short-/mid-term and of the shift to alternative fuels in the long-term, as effective strategies to reach the emissions reduction goals.
The United States traditionally has a lack of unique federal clean-energy policies; despite this, each State, during the last decades, has defined and implemented measures and acts aiming at reducing GHG emissions and at decarbonizing the power sector. Yi [
39] considered the historical data series in the period 1990–2008 for 48 states, in order to evaluate the effects of these measures on the overall CO
2 emissions, on the carbon intensity, and on the electricity consumption, suggesting the implementation of more aggressive policies, promoting a high penetration of renewables in the power generation sector. At the country level, the impacts of the above-mentioned Clean Power Plan have been assessed by the U.S. Energy Information Administration (EIA) [
40] through the National Energy Modeling System (NEMS), an economic model used for long-term analyses [
41].
Sakamoto et al. [
42] adopted an econometric energy model to evaluate the Japanese energy demand by 2030, showing a reduction in energy-related CO
2 emissions equal to 14.8% at the end of the considered time horizon, a value that is mostly due to the increase in energy intensity in both residential and service sectors, and that is not sufficient according to the National emissions reduction target, thus highlighting (also in this case) the need for more incisive policies. More in general, referring to the effects of changes in the energy demand on the achievement of long-term decarbonization goals, the crucial role played by the demand response induced by prices in assuring a cost-effective low-carbon transition has been underlined by Pye et al. [
43].
Among the decarbonization strategies, several approaches can be identified. Many of them aim at modifying the consumption patterns in the end-use sectors and there are several studies focusing on their impacts; for example, the one performed by Thiel et al. [
44], which assess the effects of EU policies on the transport sector and, in particular, the role that the electric vehicle could play by 2030, as well as the one carried out by He et al. [
45], based on the evaluation of the contribution that low carbon investments in the residential sector of Chinese mega-cities (like Shanghai and Beijing) could give to the achievement of the CO
2 emissions peak by 2030, according to the Chinese INDC, can be mentioned.
Other approaches also underlined the relevance that alternative fuel options like hydrogen penetration (especially in transport sector) could have in low-carbon scenarios, as described by Sgobbi et al. [
46] and by Gerboni et al. [
47].
One of the most relevant sectors involved in decarbonization measures and policies is the power generation one; as a consequence, different studies have been devoted to the analysis of the related policy options. In particular, Amorim et al. [
48] explored the cost-effectiveness of reaching full decarbonization in the power generation system of Portugal by 2050, through an optimization bottom-up forecasting TIMES model. Mercure et al. [
49] used instead the global macro-economic model FTT: Power-E3MG [
50,
51] to analyze the decarbonization of the electricity sector under ten different scenario in 21 regions, thus showing that, by adopting a suitable combination of policies, a 90% decarbonization of this sector could be obtained without a special technological break-through. Kouloumpis et al. [
52], using the Electricity Technology Life Cycle Assessment (ETLCA) [
53] and by considering 16 scenarios up to 2070, evaluated the effects of the decarbonization of the power generation system in the U.K. on other twelve environmental impacts (including global warming potential, abiotic depletion potential for fossil fuels, acidification potential, etc.), putting into evidence that the decarbonization of electricity production could lead to a reduction in a large part of those impacts. Focusing in detail on the renewables penetration in the power sector, Knopf et al. [
54] analyzed the EU target of a 27% share of renewable energy in the final energy consumption, corresponding to a 49% share of electricity from renewables, in a cost-effectiveness perspective, showing that the additional costs for reaching higher renewables penetration shares in the power sector, in comparison with the target over a long-term time horizon would be lower than 1% of the overall system cost. Eventually, Lilliestam [
55] investigated the security implication of different decarbonization pathways involving the electricity generation sector. In particular, he evaluated and compared the vulnerability to terroristic attacks for the DESERTEC scenario (aiming at importing solar electricity from North Africa and Middle East countries [
56]) and for a decarbonization scenario, in which Europe depends on gas imports for power generation. The results highlight that the electricity import corridors could be more vulnerable than the natural gas ones, because of their overhead configuration and technical criticality, but that, in general, in order to obtain significant large-scale outages and effects, a large number of attacks is requested, thus making these infrastructures unlikely targets for terroristic groups.
As it can be observed by considering the review of the main decarbonization policy targets and pathways, and the analysis of the main impact assessment studies available in the literature, the majority of them are related to a local area (i.e., a single country or a countries union), and none of them (even if the climate change is commonly considered a global issue) refers to the global scale. The aim of this paper is thus to evaluate (through a comparative approach) the impacts of a different long-term scenario, based on a strong decarbonization (totally based on renewables) of the power system at a global level, and on a shift in the final energy uses towards electricity. In accordance to this scenario, proposed by Liu [
57], the electricity from renewables (wind and solar) produced in large world areas, like the North Pole and the African deserts, should be delivered to large consumption areas (like Asian countries, the United States, the EU, etc.) through the adoption of ultra-high voltage (UHV) super-grids. This configuration, as it is evident, could lead to a new paradigm in the global energy system, and could have several challenging implications from the technological, environmental, political, economic, and regulatory point of view.
The world decarbonization through global electrical interconnections requires that the power generation is obtained only from renewable sources, in particular, sun and wind (as previously said), which are potentially abundant with respect to present and (esteemed) future energy needs. Moreover, it requires relevant technological changes in all of the end-use sectors. Consequently, the implementation of this option leads to modifications that spread over the entire energy chain, which need to carefully analyze the whole set of technical, market, regulatory, and policy implications over a mid-/long-term time horizon.
The detailed analysis of the Global Interconnection scenario, the comparison with other forecasting trajectories, and the discussion about the above-mentioned implications, are addressed in the following sections. In particular, in
Section 2 we discuss the role that electricity could play in energy transitions. In
Section 3, we describe the main technological characteristics and the architecture of Global Interconnections. In
Section 4, we analyze the most relevant energy attributes that could drive the energy transition the related interdependencies as well as the indicator that can quantify them. Eventually, in
Section 5, we perform a comparison among the Global Interconnections scenario and other forecasting scenarios available in the scientific literature, with respect to the aforesaid attributes and indicators.
2. The Role of Electricity in the Energy Transition
As mentioned in
Section 1, decarbonization needs to transition towards higher contributions of renewable energy sources (RES) for the fulfilment of the final demands.
Consequently, decarbonization strategies require a significant modification of the global energy mix, currently relying on fossil fuels, which could cause relevant impacts on the environment, the economy, and the energy security. The interactions between these three aspects, the energy chain, and the decarbonization strategies is deeply analyzed in
Section 4, where the positive consequences, but also the possible issues, are considered. However, it can be underlined that, in general, decarbonization could positively affect these dimensions. Of course, it allows the environmental sustainability to enhance, due to the substitution of fossil fuels with renewables. Regarding the economic aspects, even if the penetration of renewable-based technologies could lead to an increase in the costs, economic benefits can arise from the air pollution reduction, which in turn causes economic damages related to health effects and to the agriculture sector (in particular, on the crop production). Referring to the security perspectives, a change in the energy paradigm leading to a higher role played by renewables as well as the exploitation of resources locally available, can allow for a reduction in the energy dependency for several countries, with benefits in terms of supply security. In addition, as electricity becomes energy carriers rather than fossil fuels, electrical transmission networks replace the captive and open sea corridors. Therefore, it would also change the requirement for the capacities of the interconnectors among different areas.
A viable solution to be explored in order to achieve the decarbonization goal is, according to the aims of this paper, the simultaneous increase in the share of electricity directly produced from RES (up to 100%) and a shift from fossil fuels to electricity in the final energy uses.
Focusing, in particular, on the final uses, we adopted one of the classical classification used in the modelling of energy sector, subdividing them into four sectors, industry, transport, residential, and other (including agriculture, commerce and services, energy sector other than power and heat generation). Among these, transport, industry, and residential together accounted for about 78% of the total CO
2 emissions in 2014 at a global level, if the emissions related to electricity and heat production are allocated to the consuming sectors proportionally to the amount of electricity and heat consumed by each sector. Considering instead the power and heat generation as a single sector separated from the others, it can be observed that, in the same year, this sector accounted for 42.1% of the total CO
2 emissions, followed by the transport sector (23.3%), the industry sector (9.6%), and the residential sector (5.7%) [
58].
Referring to the single sectors, the transition towards low-carbon systems can be obtained by means of different approaches and by enhancing the penetration of different technologies.
Considering the industrial sector, the decarbonization through the electrification of the productive processes is an option still relatively unexplored, but potentially feasible from a technical point of view in the next years and decades. Lechtenböhmer et al. [
59] deeply analyzed this alternative for energy intensive industries producing basic materials in a long-term (up to 2050) “what if” scenario perspective, focusing on the EU-28 and highlighting its achievability and the deriving impacts. The authors referred, in particular, to some of the most consuming industrial subsectors, like iron and steel, non-metallic minerals (including cement, glass, and lime production), and chemical (including ammonia, chlorine, and petrochemical production). For each of them, they assumed the full electrification through the implementation of specific viable technologies and processes. For example, the introduction of electrowinning in the production of steel, the adoption of high temperature electro-thermal processes for non-minerals production, the use of hydrogen from water electrolysis in the Haber-Bosch process for ammonia production, and the use of synthetic gases obtained by electricity from renewables for petrochemicals production can be mentioned.
The transport sector is already moving towards the achievement of a full decarbonization, especially regarding road transport, which accounted for 73.5% of the overall world CO
2 emissions of the transport sector in 2014 [
58]. For instance, in the EU, the adoption of electric traction for satisfying the mobility demand of passengers is expected to definitively contribute to the reach the CO
2 emission target of 95 g/km for the new car fleet [
60,
61]. Among the technological options to be implemented, during the last years, specific attention has been paid to the development of electric vehicles, both plug-in hybrid-electric vehicles (PHEVs) and battery electric vehicles (BEVs) [
62]. In a decarbonization framework aiming at maximizing the electrification, in particular, BEVs could represent the best choice, also taking into account the simultaneous reduction of battery costs and the increase in battery performance (i.e., the enhancement in energy density, which allows longer ranges, that, in some cases, are already higher than 300 km) that can be observed when analyzing the trends of the last years [
63], and that could drive the future competitiveness of this solution. Referring specifically to the battery cost, several forecasting studies have been performed to estimate the possible prices in the next decade, and the majority of them assumes a further strong reduction, leading to values of about 100–120
$/kWh by 2030, setting at 150
$/kWh the threshold to make electric vehicles competitive with internal combustion engine vehicles [
63,
64,
65]. Presently, the focus is mostly on cars, but projects for electric trucks, for satisfying the mobility demand of goods, have been recently proposed, given the increase in batteries performance.
Considering the residential sector, it has to be underlined that, in this case, the shift from fossil fuel consumption to full electrification is relatively easy in comparison with other sectors from a technical point of view, as the available technologies could already allow this transition, especially in developed countries. In fact, among the main end-use services demands that characterize this sector (space heating, space cooling, water heating, cooking, lighting, and electrical appliances [
66]), some are almost totally electrified (space cooling, lighting and electrical appliances), while the remaining ones already adopt technologies for the demand fulfilment that are fed by electricity (electrical heat pumps for space heating and cooling, electric stoves for space heating, electric boilers for water heating and space heating, electric ovens, electric hot plates, radiant, and inductive cooktops for cooking). As a consequence, specific policies and subsidies supporting the penetration of these technologies and the reduction in electricity costs could lead to a rapid enhancement of electrification in the residential sector. The same considerations can be applied to the commerce and services sector (which, in the proposed classification, as mentioned, is included in the ‘other sectors’), whose services demands are the same as the residential one.
In order to reach the full electrification of the end-use sectors, improvements and new solutions for electrical grids are needed. In general terms, two approaches at different scales can be identified, namely, microgrids (at a local scale [
67]) and large interconnections (at a global scale).
A microgrid is a locally controlled distinct miniature energy system, cable of operating in parallel with or isolated from the main power grids to ensure reliable, affordable, and secure energy. Due to the vicinity to the loads, a microgrid does not have a transmission layer and it is more suitable to exploit distributed energy sources, including demand response, distributed storage, renewable resources, etc., and to integrate unreliable and small-sized generators, which are difficult to connect to the traditional power systems (such as micro-wind turbine, on-roof photovoltaic (PV), small hydro, and diesel combined heat and power (CHP)). The capability of running in an island mode makes a microgrid more flexible and autonomous, especially in emergencies, avoiding the propagation of the failure to another grid.
On the contrary, the global energy interconnection is based on advanced ultra-high voltage transmission technologies, mainly direct current (DC), to form the backbone system for redistributing on wide areas electricity generated from clean resources. It will form a globally interconnected intelligent and robust transmission, and distribution grids, enabling secure and reliable end-user access to different types of affordable renewable energy. The core of the global energy interconnection is therefore to develop and deploy advanced clean energy technologies and to construct extensive interconnected high voltage intelligent grids.
These two approaches could be probably coexist in the future configuration of electric systems, with a proper mix of the two. However, in this paper, we focus specifically on the large-scale analysis and on the impacts and issues that can arise from global interconnections.
Referring to this option, as mentioned in
Section 1, the power generation from renewables is a crucial aspect. Several studies based on different methodologies and tools have been performed evaluating the theoretical, technical, and economic potential of renewables [
68], and as expected, different values have been calculated, according to the level of detail and the assumptions of the adopted models. Moriarty et al. [
69] reported a global potential of 3,900,000 EJ/y for solar, 28,400 EJ/y for wind, 700 EJ/y for ocean, 130–160 EJ/y for hydro, 3000 EJ/y for biomass, and 1300 EJ/y for geothermal. They also compared the numerical findings of different estimations of the technical potential available in literature, further underlining the relevant discrepancies (even of two or more orders of magnitude) among them. In particular, these potential ranges are 118–2592 EJ/y for solar, 48–600 EJ/y for wind, 1.8–33 EJ/y for ocean, 50–95 EJ/y for hydro, and 27–1500 EJ/y for biomass.
The large variability of the estimation of the renewable potential has been also underlined by Deng et al. [
70]. The authors estimated the long-term potential of electricity from renewable onshore, offshore, and on buildings to range between 730 EJ/y and 3700 EJ/y, on the basis of the considered availability factors, plus an additional potential equal of 50–110 EJ/y from hydro and geothermal. They also explored the ranges of potential proposed in the scientific literature, 1340–14,780 EJ/y for PV, 250–10,790 EJ/y for concentrated solar power (CSP), 350–1800 EJ/y for onshore wind, 1000–3050 EJ/y for the overall wind (both onshore and offshore), 118–1109 EJ/y for geothermal, and 53 EJ/y for hydro.
However, what is important to underline is that the theoretical potentials are significantly higher than the energy needed to satisfy the global yearly demand. For example, the theoretical energy available from sun could be roughly evaluated, starting from the solar constant I
0, assuming an approximated value I
0 = 1360 W/m
2. According to the procedure proposed by Tsao et al. [
71], assuming the earth radius equal to 6378 km and considering that the approximated surface of the Earth is equal to four times the approximated earth cross-sectional area hit by solar radiation at a certain time, the average solar flux F
oa hitting the outer atmosphere is as follows:
Considering approximatively that the fraction of solar flux absorbed by the atmosphere and by clouds is a = 19%, and that assuming an average value of albedo, the fraction of solar flux reflected by the atmosphere is s = 30% [
72], the fraction Fe of solar flux able to reach the earth surface is as follows:
The theoretical solar potential Pt can thus be evaluated by multiplying the average solar flux F
e by the overall earth surface, shown as the Equation (3):
By taking into account that in 2014, the world total primary energy supply (TPES) was equal to 573.6 EJ [
4], corresponding to 159,320.8 TWh, it can be observed that the energy content of the solar flux reaching the Earth in two hours is able to cover the whole annual global energy needs.
Considering traditional PV panels, characterized by an efficiency equal to 15% and assuming a capacity factor (i.e., the ratio between the actual electricity produced in a given time period and the maximum possible amount of electricity that could be produced in the same period, supposing that the plant is always in operation) equal to 20%, the area to be covered in order to fulfil the annual global demand corresponds to 3,496,214.1 km2, corresponding to 2.36% of the world’s land surface.
Of course, these rough estimations could be refined, considering that the solar flux at the top of atmosphere assumes different values in the different Earth’s areas, ranging between 140 W/m
2 at the North Pole to more than 400 W/m
2 at the Equator [
73]. Nevertheless, the approximated estimation previously proposed is, however, useful to highlight the relevant potential of renewables, which makes the global electrification option a significant strategy for future decarbonization pathways.
3. Global Interconnections Technology and Management
The energy transition is best characterized by an electricity triangle, as follows: (1) electricity generation without thermal-electric procedure (thanks to the renewable energy, especially large-scaled), (2) increasing electricity-based end energy use, and (3) energy transport mainly through the electric transmission grid, reducing the role played by pipelines and by maritime and road routes. The global interconnection therefore lies in one of the angles in the energy transition.
Inspired by the needs for low carbon, sustainable, and clean energy, generation technologies such as solar (photovoltaic, concentrated solar), hydro, wind, marine (wave, tidal), geothermal, bio-energy, etc., have attracted the attention of both academia and industry, resulting in their fast development and deployment.
Among all of the clean energy technologies, wind and solar development experienced a large-scale explosion. The annual installed wind capacity increases from 3.7 GW in 2000 to 63.5 GW in 2015, and the global cumulative installed wind capacity reaches 432 GW in 2015, which increased almost 25 times than that in 2000 (17 GW) [
74]. The breakthrough in the wind turbine technology also brings the single-unit capacity up to 8 MW (off-shore) in 2014, while this value was only 0.5 to 1 MW in 2000 [
57]. Advanced control techniques of the blade, such as the variable-speed constant-frequency controller and the variable-speed variable-pitch turbines controller, made a more efficient and safe operation of the wind turbine. However, as the Global Energy Interconnection (GEI) aspires to harvest the wind power from the Arctic area, the technologies of wind turbine insulation, cold-resistant materials, automatic de-frozen technologies for blade, etc., should be developed to achieve such an ambition.
In contrast, the annual installed photovoltaic capacity reached 40 GW in 2014, and the cumulative installed capacity reached 178 GW globally. The energy conversion efficiency of photovoltaic technologies has also seen great change during the last decades. For example, the crystalline silicon cell has achieved a 26.3% conversion efficiency, with an approximately 0.5% increasing rate each year, while the thin film solar cell reaches 28.8% efficiency (e.g., GaAs) with an annual rate of 1–1.5% improvement [
75]. Besides the materials for solar cells, technology advancement is also observed in the solar tracking systems. For example, the single axis tracking system can achieve 30–40% higher power gain from the radiation, while with the double axis tracking, the efficiency can reach up to 80% higher compared with the fixed panel [
76].
The technology for long distance high voltage direct current (HVDC) and high voltage alternative current (HVAC) transmission lines needs the implementing of the Global Energy Interconnection to be considered, as possible future scenario for world energy in the light of energy transitions, have been proven to be technically feasible in the present or in the near future.
For the transmission backbone systems, the ultra-high voltage transmission technologies provide two options (i.e., HVAC and HVDC) with different technical and economic features (
Table 1). The ultra-high voltage technology, including the ultra-high voltage direct current (UHVDC) and ultra-high voltage alternative current (UHVAC), today has already made it possible to form an interconnected global electricity network, even with a hybrid solution of the HVDC and HVAC cables. Experimental lines of various scales of HVAC can be found in many countries, for example, 2362 km of 1150 kV circuits were built in the former USSR, and 427 km of 1000 kV AC circuits have been developed in Japan (Kita-Iwaki powerline). A commercially operating 1000 kV HVAC example can be found in China. A double-circuits 15 GW transmission line connecting Yuheng and Weifang, of 1049 km, was committed in 2017. For the HVDC lines, the up-to-date highest voltage is ±1100 kV, which can economically transmit energy for 5000 km [
77]. The Zhundong-Wannan HVDC Project of the State Grid Corporation of China is under construction (expected to be completed in 2018), with the capability of connecting the two substations of 3400 km with 12 GW installed capacity. Examples of currently operating HVDC lines for long distance can also be found in China, such as in Jiuquan-Hunan with ±800 kV 8 GW HVDC line of 2383 km, Hami-Zhengzhou with ±800 kV 8 GW HVDC line of 2192 km, etc. For the submarine HVDC cables, currently, the longest is the ±450 kV NorNed cable between Norway and the Netherlands, with the length of 580 km for 700 MW. The deepest submarine cable is the bipolar ±500 kV SA.PE.I. connecting mainland of Italy and Sardinia, with a depth of 1650 m. For a project under construction, the IceLink between Iceland and the U.K. is identified to use a submarine cable of ±500 kV HVDC for 1000 km [
78].
For more information on the technology and relevant issues of the ultra-high voltage AC/DC transmission grids, readers are suggested to the references [
79,
80], and on the integrations of the HVDC/HVAC interconnections based on the Global Energy Interconnections vision, readers can refer to the book of Global Energy Interconnection [
57].
It is obvious that for the GEI, which connects major energy sources and load centres ranging from 2000 km to 5000 km, the UHVDC is the better candidate for such point-to-point power delivery needs.
Figure 1 shows the distance and capacity of HVDC between major renewable resources and load centres (red numbers), and the possible energy flows under the assumption of GEI.
Figure 1 also shows the annual generation (E) and installed capacity (P) of renewable generators in major renewable resources, assuming that the generation factors of wind and solar are about 30% globally (they are 34.7% and 27.2%, respectively, for 2016 for America [
82]).
According to the technical-economic characteristics of different UHV transmission technologies (
Table 1), the feasible options of the interconnections can be summarized in
Table 2.
Even though 1000 kV HVAC technology can be used for the EU–North Africa interconnection, considering that the transmission corridor is mostly undersea, the HVDC with submarine cable could be the best option. In general, it is manifest that the UHVDC technology will be the main option for the implementation of the GEI.
The voltage-source converter HVDC (VSC-HVDC) is currently the most advanced technology for HVDC transmission grid, and the basic component for GEI. The VSC-HVDC uses fully controllable valves, which allow independent and quick control of active and reactive power while not consuming a large amount of reactive power from the AC systems. Therefore, it is a very favorable technique for connecting renewable generations, especially offshore wind farms [
83]. However, currently, the VSC-HVDC is still not comparable with its predecessor (the line commutated converter, LCC-HVDC) in terms of both voltage and rating power.
Apart from the transmission technologies, the coordination, monitoring, and control of such a large AC/DC system are also needed for the secure, efficient operation of the GEI. The GEI system accommodates various energy resources, large amounts of transcontinental power flows, and complex control structures and regimes. Therefore, control techniques (like grid access to large-scale intermittent sources, voltage and frequency stability control, synthetic inertia generation and control, advanced protection, fast fault location and recovery, automatic recovery, etc.) are vital for the implementation of the GEI as well. As for the fundamental information based on which control decisions are made, wide area monitoring systems (WAMS) and satellite supported phasor measurement units (PMU) need further deployment.
Even though the technical solutions towards the GEI are not bottlenecks, there are fundamental market and policy barriers for the management of the GEI during and after its implementation. The following issues need to be addressed:
Sovereignty: how to manage the GEI among different governments and their representative system operators. Should the management structural be hierarchical or horizontal? Should the control sovereignty be in proportion to the investment or aligned with the geographic coverage of the country?
Investment: how to allocate the needed investment and share benefit among the involved countries? How to acquire investment for projects of common interest, such as transcontinental ties? Should they be financed by a transnational/regional body, such as the World Bank, the European Union, the Asian Union, the Africa Union, or national governments? How to decide the needed intra grid update plan and investment and regulation for investment recovery?
Benefit and fairness: How to manage the wealth shift from fossil-riched country to renewable-riched countries? How to provide electricity access to poor areas where little financial contribution can be expected for the construction of GEI. How to balance the benefit and fairness among big investors and small investors?
Market schemes: How to manage varieties of dispatching schemes, such as market-based and administration-based [
84,
85]? How to adopt new market clearing mechanism under the essentially zero marginal cost situation? How to incorporation global electricity markets based on the GEI and regional/national electricity markets?
There are many issues and open points that have to be faced. In order to achieve a real implementation of the GEI alternative, efforts, especially those related to the structure of the governance and the management of the infrastructure, the need for common technical standards, the allocation of the investments, the definition of new market schemes (with new market clearing mechanism, due to the essentially zero marginal cost configuration), and the implementation of a global market able to integrate the different regional and national electricity markets, new related regulatory framework needs to be endeavored. Certainly, all of these aspects require a common framework based on the cooperation among countries.
4. Reference Energy Attributes for Driving Energy Transition
In order to comparatively evaluate the effects of different visions and policy actions aiming at promoting low-carbon pathways, we propose a multilayer approach (as done by Han et al. [
86]) for assessing the impact of smart energy policies on the energy systems. This approach is based on the analysis of the impact of specific energy attributes on different stages of the energy chain and on other non-energy domains (hereafter called layers).
In particular, we consider four attributes, which are mainly able to capture the most relevant dimensions of decarbonization and of the related effects, and as a consequence that can be assumed as drivers for the energy transition, namely: energy efficiency, sustainability, security, and economic affordability.
Improvements in energy efficiency can be defined as the capability of ensuring the same services by lowering the quantity of energy used in the input. An increase in efficiency (that mainly involves end-use technologies) could be fundamental in decarbonization strategies, as it allows a reduced consumption of fossil fuels (thus also reducing the costs associated to the satisfaction of final users demands) or to avoid a further increase in their use in the mid-long term to satisfy higher energy services demands (as it can be expected at global scale, unless global economic crises are hypothesized).
Sustainability is one of the most relevant aspects to be considered regarding decarbonization. According to the definition given by Daly [
87], to assure the sustainability for renewable sources, the harvesting rate has to be lower than the regeneration rate, for the fossil sources the resource depletion has to be balanced by a corresponding suitable development of alternative renewables, and for environmental pollution the generation rate of wastes has to be lower than the environmental absorption capacity. Therefore, in a low-carbon perspective, sustainability is mainly related to resource availability, to the penetration of renewables, and to the related impact on emissions, especially CO
2.
Energy security is a key issue that can be defined as the capability of guarantee that the quantities of energy commodities need to fulfil services demands are available, by local production or by import via energy corridors (pipelines, open sea routes, power lines, etc.). Energy security becomes fundamental for those countries characterized by a high level of import dependency, because this dependency involves geopolitical situations that could impact on the effective supply of the requested commodities. Decarbonization and security are strictly related, as the reduction in fossil fuel use and the simultaneous increase in renewables share could easily lead to the improvement in energy security, even if has to be noticed that high penetration rates of renewables in power generation could lead to grid instabilities in terms of their secure operation, thus resulting as potentially critical for the security of the system.
In economic terms, according to Sheth et al. [
88], the affordability is instead the level to which customers are able to pay (economic affordability) and are willing to pay (willingness to pay) a certain price for a specific product. Transferring this definition to the decarbonization dimension, the affordability refers to the economic sustainability, from the point of view of the final users, of the strategies and actions to be implemented in order to promote the transition from fossil to renewable commodities in energy systems, and it involves the taxation and subsidies to be set for respectively penalizing, through carbon pricing mechanisms, the use of fossil fuels, and making renewables competitive form the market perspective.
Figure 2 shows, in a schematic and conceptual way, the interaction between those attributes, the energy chain (which, in turn, includes the production and import of primary commodities, the transformation in secondary commodities, the distribution, and the end-use), and the three main layers considered (i.e., the economic, environmental, and geopolitical ones). In fact, the effects of the analyzed attributes spread not only through the macro-sectors of the energy system, but also involves different domains. In particular, the following:
The environment is influenced by sustainability policies and by the implementation of energy efficiency improving measures (due to the above-mentioned reduction in energy consumption for satisfying the same demand);
The geopolitical level is strictly related to the security of supply issues; and
The economy is affected, as is obvious, by the affordability (due to the effects that taxation and subsidies could have on the energy bill and, more generally, on the economic system), by the energy security (as the loss of a certain supply has a negative impact on the GDP of a country), and by the energy efficiency improvements (because of the reduction in the total energy system costs).
Referring instead specifically to the main four sections of the energy chain, as follows:
The affordability impacts on all of them, the security mainly affects the import of energy commodities, but also their internal distribution (as the related infrastructures could be subject to natural hazards or malicious attacks);
The sustainability is largely related to the availability of resources (thus involving local production and commodity import); and
The energy efficiency mostly concerns the final uses, as it is associated to the improvements in end-use technologies (electrical appliances, heating and cooling systems, industrial equipment, vehicles for mobility of passengers and goods, etc.).
All of the described interactions do not correspond to the whole set of the possible ones, but have been considered representative of the most relevant effects that decarbonization strategies could cause. For this reason, they are useful in comparing different future options and scenarios, in particular the one based on fully electrification of energy consumptions through global interconnections, and other more traditional ones, as explained in
Section 5, coherently with the aims of this paper.
In order to quantitatively assess these attributes, specific metrics and indicators have to be identified and selected. The first criterion for the choice has been the focus on numerical values and parameters as much as possible, commonly evaluated in the forecasting analyses available in the scientific literature. In fact, these studies (usually based on simulation or optimization modelling of the energy system and on macro-economic models), performed at a global scale, are often characterized by a level of detail lower than the one of the studies performed at a smaller scale (single country or group of countries), mostly due to the lack of reliable and homogenous statistic data. According to this, five parameters have been considered, each of them affecting one or more attributes, as follows:
The primary energy intensity (I
p) is the ratio between the total primary energy supply (TPES defined as S in the following relationships) and the GDP (G) and its impacts on energy efficiency, sustainability, and affordability, as follows:
The final energy intensity (I
f) is the ratio between the final energy consumption (F) and the GDP (G), and its impacts on energy efficiency, sustainability, and affordability, as follows:
The final energy consumption per capita (F
pc) is the ratio between the final energy consumption and the population P, and its impacts on energy efficiency and sustainability, as follows:
The emissions per unit of energy consumed (E) is the ratio between the CO
2 emissions (C) and the TPES (S), and its impacts on sustainability, as follows:
The ratio of renewables (R) is the ratio between the gross inland consumption from renewables I
r and the TPES, and its impacts on sustainability and security, as follows:
Focusing on the single parameters, the energy intensities I
p and I
f can be assumed to be representative of the energy efficiency, linking the economic and technological perspectives. In fact, a reduction in the amount of energy needed to obtain a GDP unit corresponds to an increasing efficient use of energy in the system (i.e., the adoption of more efficient technologies, coherently with policy pathways for low-carbon transition). Furthermore, energy intensities can be used as an indicator, useful to evaluate the sustainability (due to the fact that, in a context of growing economy, a decrease in energy intensity corresponds to a reduction in energy consumption, which in turn corresponds to a lower environmental impact), as well as the decoupling between the economic growth and the energy consumption. This decoupling can be considered a driver for decarbonization and, to some extent, an indirect measure of economic affordability, because if an economic system is able to produce the same amount of GDP by using less energy (or, vice versa) it is able to increase its GDP without proportionally increasing the consumption of energy, which means that it is able to implement policies that are sustainable from the economic point of view, and that end-users can bear. Regarding the decoupling, it has to be underlined that a non-unique consideration has been expressed in the studies available in literature. For example, the one performed by Jakob et al. [
89] highlighted the need for this decoupling, especially for developing countries (while for developed countries, a partial decoupling can be already identified), in order to achieve effective future decarbonization. Instead, Csereklyei et al. [
90] pointed out that forecasting scenarios should not hypothesize an increase in the GDP and a simultaneous decrease in energy consumption, avoiding the assumption that the decoupling between the economy and energy will certainly happen. In particular, the authors affirmed that the energy intensity reductions in certain countries like the United States are probably due to an effect of convergence towards a global average value, and so with difficultly, they could be repeated in the next years or decades. Eventually, Fiorito [
91] focused on the usefulness of limits of energy intensity as an indicator to analyze the decoupling phenomena, suggesting deepening the description and characterization of the economic systems without trying to aggregate information that refers to different domains (i.e., the economic an energy ones). It has to be highlighted that final energy intensity only considers the consumption in end-use sectors, thus neglecting the consumption and losses in the transformation sector (which are mainly related to the power generation). The comparison between the two energy intensities is interesting because it could be representative of the electrification level of the system and of the quality of this electrification. In fact, in the mid-long term and in a context of economic growth and efficiency improvement, an increase in the electrification (as the one expected with the implementation of the global interconnection scenario) generally leads to a decrease in the primary energy intensity I
p lower than the reduction in the final energy intensity I
f. This is due to the fact that the final energy intensity does not take into account the transformation losses (which instead are computed inside the primary energy intensity), whose overall amount, in the case of traditional power generation mixes, usually increases with higher electrification rates. However, a high penetration of renewables (which, excluding biomass, are assumed to have no conversion losses in the energy balances) in the power generation mix leads to a reduction rate of the primary energy intensity closer to the one of the final energy intensity.
Similar to the energy intensities, the final energy consumption per capita F
pc can be used to quantify the evolution of the energy efficiency and of the environmental sustainability, as a reduction in this value corresponds to a lower use of energy for satisfying final uses. In particular, in comparison with the energy intensities, this indicator is useful for capturing more of the contribution of households. Regarding this point, in fact, it has to be remarked, according to [
92], that, while for the transport, industry, and services sectors the sectorial energy intensities are calculated dividing the sectoral final energy consumption by the GDP (for transport) or by the gross value added (GVA for industry and services), for the residential sector, the energy intensity is assessed by dividing the household’s final energy consumption by the population.
The emissions per unit of energy consumed E can be used to measure the sustainability by directly considering the pollutant emission content of the single unit of energy consumed; this indicator also reflects the energy mix composition, as higher penetration rates of renewables lead to lower values of the indicator itself.
The ratio of renewables R is used in this paper as an indirect metric for assessing the energy security, as an increase in the R value corresponds to a reduction in the global trades of fossil fuels, which are mostly affected by the international geopolitical tensions, thus enhancing the security of the supply level. Import dependency has not been directly assumed as indicator because the focus of this work is on the global scale. In fact, the import dependency, together with the mix of suppliers and the route of the energy corridors, is a relevant parameter for evaluating the energy security of a single country, while it could not be useful when both the exporting countries (i.e., producers) and importing countries (i.e., consumers) are jointly considered in an overall world energy balance.
The previously described parameters for the quantification of energy attributes are assessed and compared for different future energy scenarios, including the global interconnection one, in
Section 5.
5. Comparative Assessment of Global Interconnections Perspective in Energy Transition
In order to comparatively analyze the possible impact of global electricity interconnections on the future world energy system, and the role that they could play in the energy transition towards low-carbon systems, according to the main energy attributes outlined in
Section 4, the forecasting scenario analyses to 2050, based on the global interconnections proposed by Liu [
57], has been considered and compared to other scenarios available in the scientific literature.
Several forecasting studies, mostly based on models for energy planning, have been performed during the last decades. Among these are the following:
The International Energy Agency (IEA) World Energy Outlook [
93] analyses three main scenarios, the Current Policy Scenario, including only policies already implemented at the mid of 2016; the New Policy Scenario, considering both existing policies and possible effects of planned measures like those pledged for the 2015 Paris Climate Agreement; and the 450 Scenario, focusing on the global temperature rise limitation pathways;
The World Energy Scenarios of the World Energy Council (WEC) [
94] considers three scenarios, two of them (the Modern Jazz scenario, mostly driven by a competitive market, and the Unfinished Symphony scenario, mostly devoted to the implementation of environmental policies driven by government actions) are compliant with a low-carbon perspective, and the other one (the Hard Rock scenario), represents a world mainly based on a nationalistic approach to global challenges and paying a lower attention to climate change issues;
The Energy Information Administration (EIA) International Energy Outlook [
95] defines five scenarios, the Reference case (which takes into account the situation of the world oil market up to the end of 2015 and that assumes that by 2018, an increase in oil prices), the High Economic Growth case (that hypothesises a higher economic development in comparison with the Reference case), the Low Economic Growth cases (that considers a lower economic increase), the High Oil Price case (that assumes higher oil prices with respect to the Reference case), and the Low Oil Price case (that assumes lower oil prices);
The Shell Energy Scenarios to 2050 [
96,
97], which analyses two scenarios, the Scramble scenario, in which the environmental issues are supposed to be deeply considered by policy makers only in the case of relevant climate effects, and the Blueprints scenario, which mostly focuses on clean energy penetration and on measures to address not only the environmental but also the security and economic problems;
the Massachusetts Institute of Technology (MIT) Food, Water, Energy, and Climate Outlook [
98], which provides projections up to 2050;
the British Petroleum (BP) Energy Outlook [
99], whose base case projections cover the time horizon up to 2035;
the ExxonMobil Outlook for Energy [
100], which defines forecasting energy trends up to 2040.
For the aims of the comparison, a subset of the above-mentioned scenarios has been chosen. The main criterion for the selection has been the completeness of information (i.e., the amount of available projection data has been checked in order to verify if it is sufficient to allow an evaluation of the considered metrics to quantify energy attributes). Furthermore, wider time horizons have been preferred, avoiding those ending before 2040.
The main hypotheses that are at the basis of the analyzed scenarios and that lead the proposed projections are qualitatively summarized (together with the corresponding end of time horizons (EOH)) in
Table 3, from a synoptic point of view, by categorizing them according to four domains (socio-political, economic, environmental, and energy), which can be related to the different layers identified in
Section 4 (in particular, the geopolitical, the economic and the environmental layers, and to the energy chain, respectively). It has to be noticed that many of the mentioned hypotheses do not affect only the considered domain, but could spread over several of them.
The projected values of the main macro-economic drivers (population and GDP) in 2040 are summarized in
Table 4. The reference end year 2040 has been chosen as this is the later common year of the different time horizons. Furthermore, in order to homogenize the data across the considered scenarios, several assumptions have been introduced. In particular, the following:
For the GEI scenario, in the absence of further details, the population and the GDP have been calculated by evaluating the Compound Average Growth Rate (CAGR) according to its definition, shown as the Equation (9):
where V
f is the value of the considerer parameter at the end of the time horizon; V
0 is the value of the considered parameter at the beginning of the time horizon; t
f is the last year of the time horizon; and t
0 is the first year of the time horizon. V
0 has been chosen equal to the last statistical data available (7.347 billion people in 2015 for the population [
101] and
$72.909 trillion in 2014 for the GDP [
4]), while V
f has been assumed to be equal to the given projected value in 2050 (9.550 billion people and
$220 trillion, respectively).
Moreover, the GDP has been multiplied by a corrective factor F in order to convert it in constant currency ($) at purchasing power parity (ppp). Because of the lack of information about the decomposition of the projected value at single country level, an approximate procedure has been adopted. For each year of the period 1990–2014, F has been calculated as the ratio between the GDP ppp and the GDP; the obtained historical series has been interpolated through a polynomial best fit of the third order (which shows a good correlation level, with R2 = 0.9947), and then the F value in 2040 has been forecasted.
This procedure causes uncertainties in the GDP estimation. However, we assume that these uncertainties are comparable with those of the scenario projections, and so they do not significantly affect the comparison that we present in this work.
For the ExxonMobil scenario, the MIT scenario, and the three WEC scenarios, the same corrective factor as for the GEI scenario has been applied to the GDP projection.
As it can be observed, the amplitude of the range for the population is small: the GEI scenario is characterized by the lowest value, but the highest one (corresponding to the WEC scenarios) is only 3.35% higher. On the opposite, the GDP projections show a wider variability. In particular, the WEC scenarios include both the extreme values of the range: with respect to the GEI scenario, the Hard Rock scenario forecasts a GDP 5.02% higher while the Modern Jazz scenario GDP is 32.05% lower. However, in general terms, it can be noticed a homogeneity among the considered scenarios from the macro-economic point of view, according to the different hypotheses that are at the basis of each scenario.
Focusing on the derived GDP per capita, a significant increase with respect to the 2014 values [
102] can be observed for all the scenarios. It is interesting to notice that this increase is more relevant for those scenarios that mostly pushes the decarbonization, like the GEI and the WEC Modern Jazz.
For each scenario, the indicators introduced in
Section 4 have been quantitatively evaluated: the obtained values, according to the availability of primary data, are listed in
Table 5, together with the corresponding 2014 statistical values [
102]. It has to be highlighted that for the GEI scenario the emissions per unit of energy consumed E due to the lack of information have been estimated on the basis of the CAGR approach applied to the CO
2 emissions trend, assuming V
0 equal to the statistical value in 2014 (32,381.04 Mt of CO
2 [
4]) and V
f equal to the given forecasted value of 12,000 Mt of CO
2.
In order to easily compare the considered parameters, a normalization with respect to the GEI 2050 value has been performed. The obtained values are graphically shown in
Figure 3.
Only for the primary energy intensity I
p is a full comparison is possible. For all of the scenarios, this parameter is significantly lower than the 2014 value, and comparable to the GEI scenario value. This reduction corresponds to a general increase in the energy efficiency and sustainability (i.e., to a better and more rational use of energy), and as mentioned in
Section 4, it can be considered an indirect measure of a higher level of economic affordability, as to produce the same amount of GDP, a lower amount of primary energy is requested. It can be further noticed that the scenarios forecasting a significant transition towards low carbon energy systems (like the GEI, the WEC Modern Jazz and Unfinished Symphony, and the IEA 450 scenarios) show relatively low values of primary energy intensity.
The final energy intensity is also characterized by a relevant reduction in comparison with the 2014 level; this is due again to the increase in the efficient use of energy in the end-use sectors. It can be highlighted that the GEI scenario shows a stronger reduction in the final energy intensity with respect to the 2014 value (−59.1%) than in the primary energy intensity (−48.3%), but with a discrepancy that it is not significantly large. This could be justified according to what explained is
Section 4, that is, to a combined effect of a relevant electrification (that pushes the divergence between the two energy intensities decrease rates) and of a high penetration of renewables in power generation (that makes the two rate values closer each other). Other more traditional scenarios, such as the IEA Current Policy and New Policy, show decrease rates really similar (−39.9% for I
p and −39.6% for I
f for the Current Policy scenario; −45.3% for I
p and −44.2% for I
f for the New Policy scenario).
The final energy consumption per capita ECf,pc is close to the GEI scenario for all of the considered scenarios (with a few exceptions, like the ExxonMobil scenario), and this value is comparable to the current one. This means that, even if a more efficient and sustainable use of energy is promoted through specific policies, and a significant variation in the energy paradigm is set (with a transition towards low carbon technological solutions and towards a strong electrification of the end-uses), the specific individual consumption remains almost unchanged. This could be caused by the concurrent increase in the world population and improvements in the economies of the countries that are currently developing (as China and India) or not-developed; in fact, this economic growth will probably correspond to an increase in the demands of energy services by the people that presently have not access to them.
The emissions per unit of energy consumed E shows instead a high variability across the scenarios. This reflects the different relevance of the environmental policies supposed to be implemented. For example, in fact, it can be noticed that the value assumed by this parameter in the IEA 450 scenario (which mostly focuses on the decarbonization) is 44.4% lower than the corresponding value for the IEA Current Policy scenario. Considering the GEI scenario, in particular, it can be underlined that E is significantly lower than in all of the other scenarios (−35.5% with respect to the IEA 450 scenario); this gives a quantitative measure of the relevance of the GEI scenario from the environmental point of view as well as its impact as a possible decarbonization pathway to follow.
The ratio of renewables R is higher for the scenarios (like the GEI, the WEC Unfinished Symphony, and the IEA 450), based on the introduction of policies and technological choices oriented to the sustainability and having strong environmental effects, while it shows comparable values (which, in turn, are similar to the present value) for those scenarios characterized by more conservative and traditional hypotheses. R is particularly high in the case of the GEI scenario; this fact is another measure of the change in the energy framework that the global interconnections could determine, especially with respect to the other possible transition pathways.
In general terms, the comparative analysis performed in this paper allows us to highlight the effectiveness of global interconnections in representing a viable option to reach the main decarbonization goals, particularly considering the positive impact on the environment, which could be crucial in a world that is expected to rise its overall population and improve the quality level of life in countries characterized by high population densities (this is coherent with the high increase in the global GDP per capita, foreseen by the GEI scenario, in comparison with other scenarios). The GEI scenario involves a structural modification of the global energy system that spreads over the whole energy chain, affecting production (due to the intensive penetration of renewables), import, transformation (due to power generation mostly based on renewables), and end-use (because of the high level of electrification). Referring to the import, it has to be underlined that the GEI paradigm could also have significant effects on the security of energy supply. In fact, from one side, the switch from fossil fuels to renewables could be beneficial because of the reduction in the energy dependency on few productive countries. From the other side, the expected geographical distribution of power generation from wind and solar could instead potentially lead to geopolitical implications that cannot be evaluated a priori and that need further study. The analysis of the above described energy dimensions cannot allow an economic comparison of the long-term effects on the overall energy system cost, because of the different approaches, hypotheses, and models adopted for the implementation of the considered scenarios. However, it seems to suggest that the GEI option could be sustainable from the economic point of view, because even if significant investments (higher than those that can be forecasted by other scenarios) have to be made, the economic feedback in the long term could be positive, leading to a request for energy to generate the GDP (that is expected to increase, as mentioned) lower than other more traditional future trends.
6. Conclusions
The need for meeting environmental targets, like those set by the 2015 Paris Agreement, requires the identification and implementation of suitable and effective strategies coherent with the so-called ‘energy transition’ towards decarbonized energy systems, due to the relevance that the energy sector has in terms of contribution to the overall greenhouse gases emissions. Among these strategies, a possible option is represented by the electrification of the energy end-uses, coupled to a power generation from renewables. In particular, this scheme can be applied at a global spatial scale through the Global Energy Interconnections, aiming at connecting the main renewable production areas (like the Arctic for wind and the equatorial regions for solar) to the major consumption zones (such as Europe, the United States, and the Asian countries) through long-distance UHVDC power lines. The analysis proposed in this paper underlined that the current technological advancement can provide technical and economic feasibility for the implementation of GEI, and it explored the possible impact of this scenario on the global energy system. In doing this, four different energy attributes (energy efficiency, sustainability, security, and economic affordability), three layers (the geopolitical, environmental, and economic levels), and the whole energy chain (from the production to the final uses) have been considered.
Furthermore, five indicators (the primary energy intensity, the final energy intensity, the final energy consumption per capita, the emissions per unit of energy consumed, and the ratio of renewables) have been used for comparing the GEI scenario to other long-term forecasting scenarios available in the scientific literature, like those developed by the IEA, the EIA, the WEC, and the MIT. The obtained results put into evidence that the GEI option could be particularly beneficial from the environmental point of view (as especially shown by the low values of the emissions per unit of energy consumed and by the high values for the ratio of renewables), with respect to other possible scenarios.
The GEI could be furthermore a key alternative in a world that is expected to increase its overall population and the life quality in several developing countries, where the need for satisfying new demands could lead to a significant future enhancement in energy consumption and in the related GHG emissions.
However, the GEI require a significant structural change in the energy system over the whole chain (involving electricity production from renewables, long-distance transmission of electricity, and electrification in the end-use sectors) and across the different above-mentioned layers. The GEI scenario, in particular, could relevantly impact on the energy security aspects. From one side, the switch from fossil fuels to renewables could be beneficial because of the reduction in the energy dependency from few productive countries. From the other side, however, the expected geographical distribution of power generation from wind and solar could instead potentially lead to geopolitical implications that cannot be evaluated a priori and that need further study. For instance, a unique world macro-grid could represent a high-risk target for terroristic attacks (both physical and cyber), able to cause large-scale damages.
From the economic point of view, the performed analysis does not allow a comparison of the long-term effects on the overall energy system cost, because of the different hypotheses, methodological approaches, and models adopted for the implementation of the considered scenarios. However, this study seems to suggest that the GEI option could be sustainable, also from the economic point of view. Even if significant investments are needed, the economic long-term could be positive, leading to an energy request for a unit of GDP lower than other more traditional future trends.
In order to achieve a real implementation of the GEI alternative, however, several issues and open points have to be faced. Among them, those related to the structure of the governance and the management of the grid, the need for common technical standards, the allocation of the investments, the definition of new market schemes (with new market clearing mechanism, due to the essentially zero marginal cost configuration), and the implementation of a global market able to integrate the different regional and national electricity markets can be mentioned. In general, all of these aspects cannot disregard the need for a common framework based on the cooperation among countries.
For these reasons, further specific sectorial studies have to be performed in order to comparatively assess the effective set of impacts of the GEI option.

 ,
, 


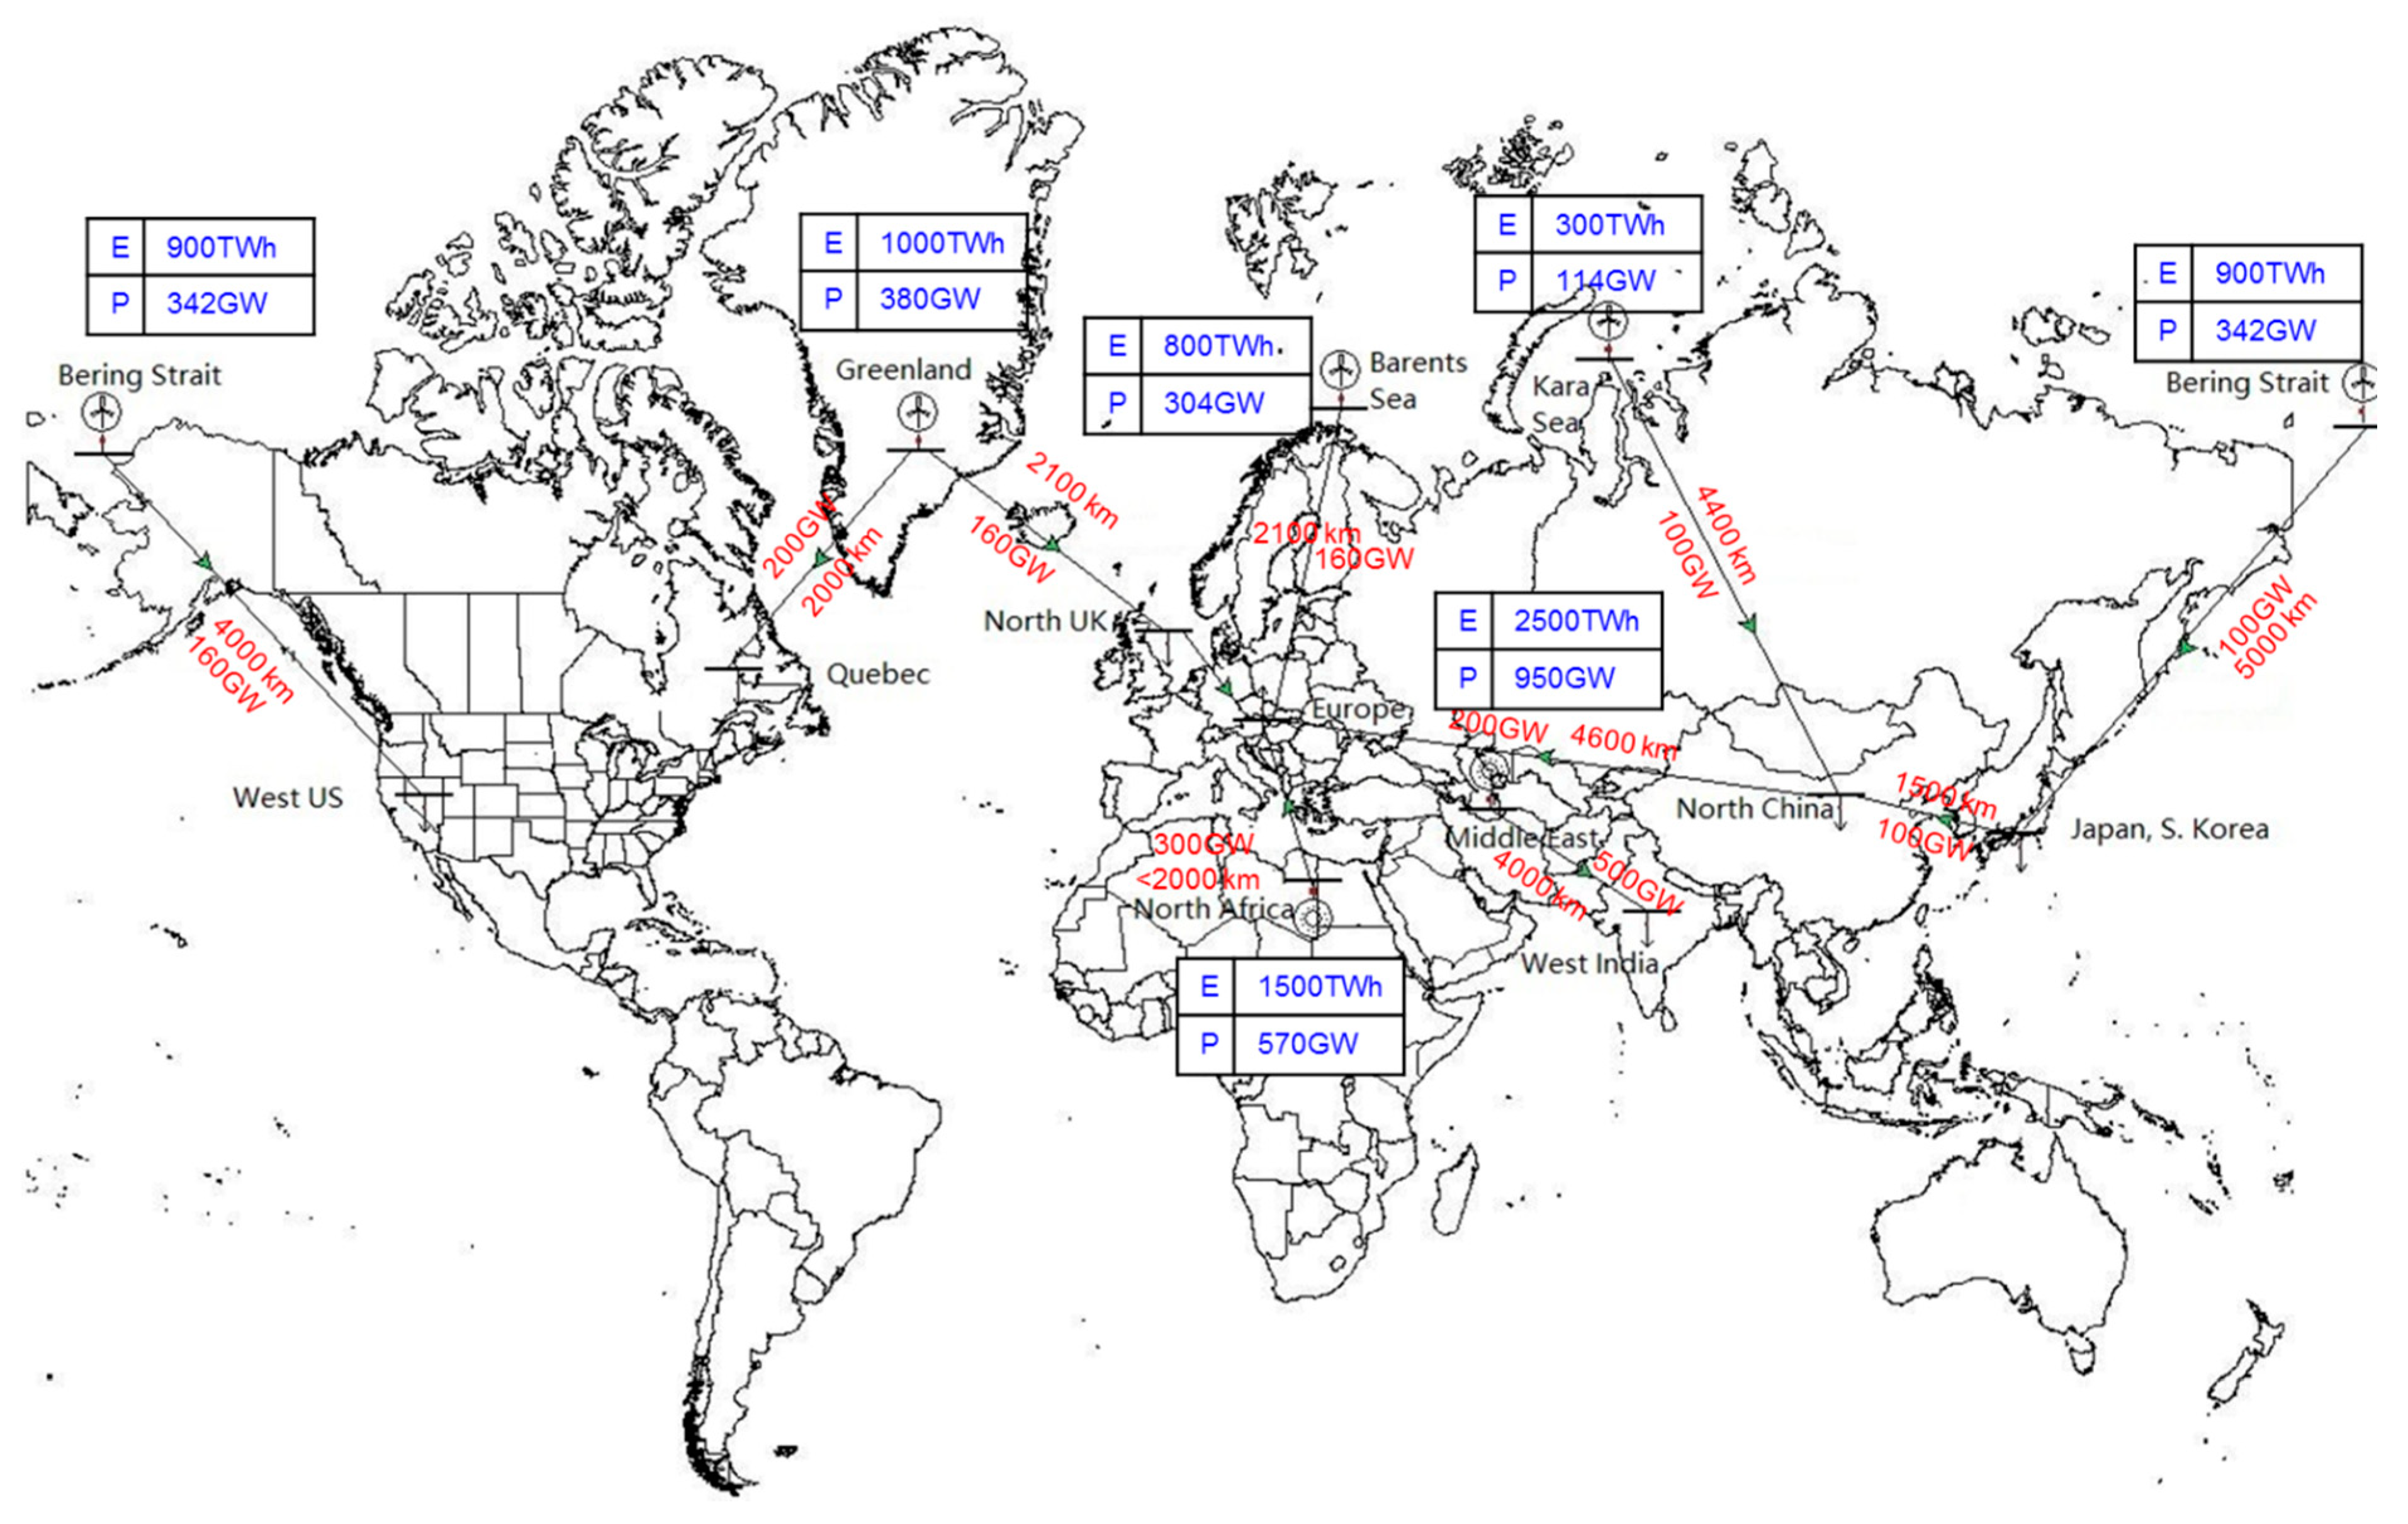