1. Introduction
Wind power is attracting increasing attention across the world. In China, major load areas are far from large-scale wind farms; as a result, wind power is often collected to the point of common coupling (PCC) and then centrally transmitted to load areas [
1]. However, in recent years, as small-scale offshore and near-sea wind farms have developed rapidly in coastal areas, wind power is now dispersedly integrated into regional power grids [
2]. In this situation, the synchronous stability issue has diminished, while short-term voltage stability issues brought by power fluctuation are becoming significant due to the stochastic nature of wind speed, especially in radial grids without local synchronous power supplies [
3]. In coastal areas where typhoons hit frequently, wind turbine tripping due to excessive wind speed often occurs; with the increase of installed capacity of wind power, the resulting impacts can no longer be neglected [
4].
Voltage stability issues caused by wind power fluctuation can be grouped into two categories: static voltage stability and transient voltage stability issues. Existing research mainly focuses on static voltage stability problems resulting from wind power fluctuation in terms of hour and minute time scales, e.g., [
5,
6]; while transient voltage stability issues are generally studied under short-circuit fault scenarios [
7], i.e., transient voltage stability issues caused by disturbances arising from the wind turbines themselves are rarely considered. Once the wind speed is over the cut-off speed, some wind turbines would trip off. In this situation, as the slow-response capacitor banks cannot switch off in time, the wind farm’s voltage could rise to a certain high level and may result in cascading tripping [
8,
9].
Although the hierarchical automatic voltage control (AVC) system can support rational voltage profiles considering the intermittent and stochastic characteristics of wind power [
10], it still requires sufficient dynamic reactive power (VAR) reserve to provide rapid dynamic VAR support when wind turbine tripping occurs [
11]. With this concern, power system usually requires sufficient dynamic VAR compensation capacity to be mandatorily installed in the wind farms. Hence, most of the recently built wind farms in China coastal areas are equipped with dynamic VAR compensators (DVC), e.g., Static Synchronous Compensator (STATCOM), Static Var Compensator (SVC), etc. which significantly increase the total investment cost of the wind farms. Effective planning of the locations and capacity of the DVCs from the system perspective can greatly reduce the investment on DVCs and promote wind farm integration ability.
DVC planning aims at dealing with short-term voltage stability issues using DVC devices with the least investment [
12]. Currently, DVC planning mainly focuses on short-circuit fault scenarios, which can be divided into two inter-related steps: site selection and capacity optimization. Site selection plays a major role in DVC planning, which determines the optimality of the overall planning scheme. Trajectory sensitivity index (TSI) is widely applied to identify proper installation locations with sufficient control ability [
12,
13,
14]. After calculating the TSI regarding voltage dip, low voltage duration, etc. to reactive power injection, buses with strong control ability are distinguished via a ranking method. However, due to the proximity effect of the voltage dip, adjacent buses tend to be simultaneously selected by the TSI ranking based methods, resulting in redundant installation. To overcome this shortcoming, a zoning-based approach is put forward in [
15,
16], which partitions the grid and then determines installation locations by zones.
Capacity optimization is another crucial step following sites selection. As it is computationally expensive, existing references provided two typical optimization strategies: two-stage optimization [
13,
17] and full optimization [
18]. The two-stage optimization approach determines the locations and capacity separately, which is widely adopted due to its less computational complexity. However, its optimality is consequently sacrificed. The full optimization approach optimizes locations and capacity simultaneously for better optimality, generally using intelligent searching algorithms, e.g., Particle Swarm Optimization (PSO), Genetic Algorithm (GA), etc. while due to its huge computation load, it may be hard to solve or even infeasible in a large-scale system. Thus, in engineering practice, the former one is a priority selection and at this point, determining proper locations is of great concern.
As short-term voltage stability issue induced by wind turbine tripping is becoming critical, and few articles deals with it, this paper develops a DVC planning strategy considering wind turbine tripping, so as to restrain transient voltage fluctuations to prevent cascading tripping. Note that as wind turbine tripping is a kind of non-Gaussian intermittency [
19,
20], it is rational to consider the worst condition in the planning stage. The so-called worst conditions would vary depending on the interest of different studies. In our framework, we focus on the dynamic reactive power reserve for wind farms. Therefore, in our proposed framework, we consider the worst condition which will cause severe short-term voltage stability issues. This situation usually refers to the early morning scenario, where the load is light but the wind turbines almost work at rated condition. In this case, the requirement of dynamic reactive power would be great due to the few synchronous generators providing dynamic reactive power support. In this scenario, once wind turbines are tripped, the power imbalance will greatly influence the power flow and lead to short-term voltage stability issues. Dynamic reactive power reserve considering this scenario is sufficient for other scenarios. The contributions of this paper are summarized as follows:
- (1)
A vector-type evaluation indexes system is established, including Disturbance Vector (DV) to assess the influence of wind power large disturbance on system-wide transient voltage; and Supporting Vector (SV) to evaluate a bus’s system-wide transient voltage control ability.
- (2)
The Kendall rank correlation coefficient of DV and SV is calculated and then the grid is partitioned into several parts to differentiate the influenced areas of each wind farm, which helps reduce searching the space for candidate locations.
- (3)
A novel DVC planning scheme is put forward for preventing cascading tripping of wind farms. Based on the above indexes, combined disturbances and their probability are considered to determine proper installation locations. Then, a genetic algorithm is introduced to optimize DVC capacity, considering the transient voltage constraints to prevent cascading tripping.
The rest of the paper is organized as follows:
Section 2 establishes the indexes system including DV and SV to evaluate buses’ transient voltage behavior. Based on the indexes system, a novel DVC planning scheme is proposed in
Section 3, and the sites selection and the capacity optimization steps are provided in detail.
Section 4 provides a case study on a modified NE 39-bus system and application on a real regional grid in Southern China is conducted in
Section 5. Conclusions are given in
Section 6.
2. Evaluation on Buses’ Transient Voltage Behavior
In this section, vector-type indexes describing buses’ transient voltage fluctuation and voltage control ability are defined, respectively. The vector-type indexes record buses’ dynamic characteristics more completely thus provide more information in analysis. Note that the proposed indexes are universal, which can be also applied in other scenarios, e.g., short-circuit faults.
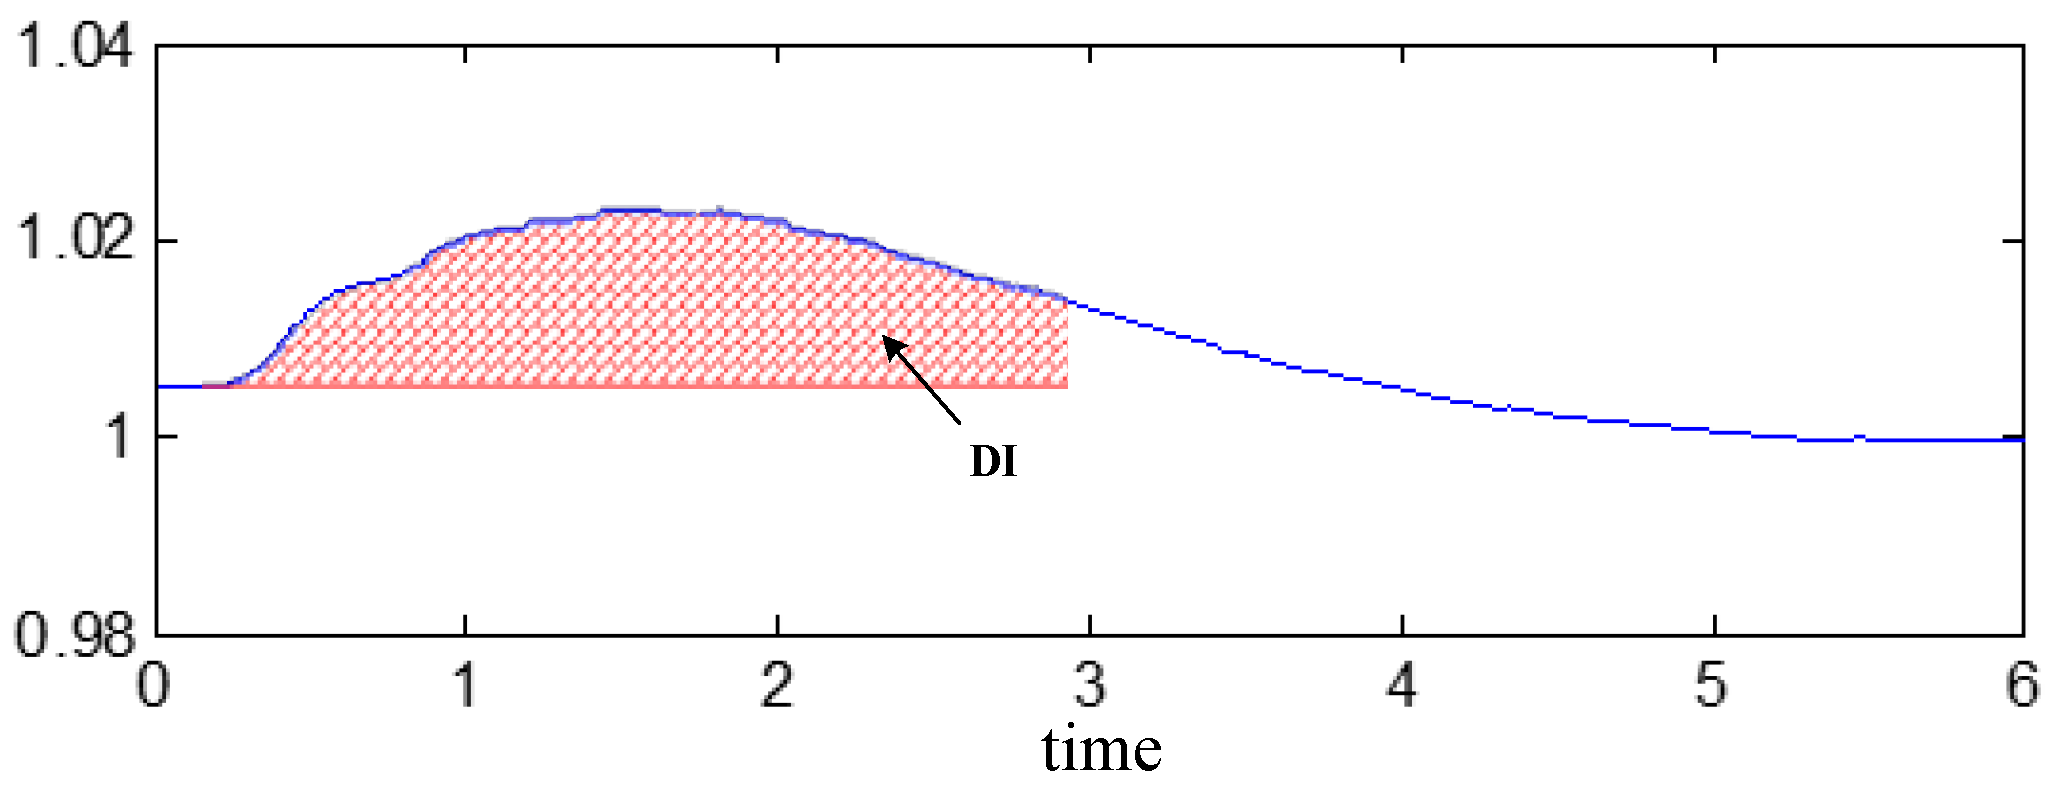
2.1. Voltage Disturbance Index
Once an extremely strong wind, e.g., a typhoon, occurs, the wind turbines would be tripped off by its protection system, resulting in a large amount of unbalanced power. Synchronous generators will then adjust their output to balance the system-wide power flow. Consequently, the change of power flow lead to voltage fluctuation on each bus with varying degree. The difference of voltage fluctuation is reflected in fluctuation amplitude and time duration. To comprehensively consider the above factors, the Disturbance Index (
DI) is defined as in (1):
As shown in
Figure 1,
DI is denoted by the shaded area, reflecting the accumulation of voltage amplitude deviation from steady state value within a certain time span.
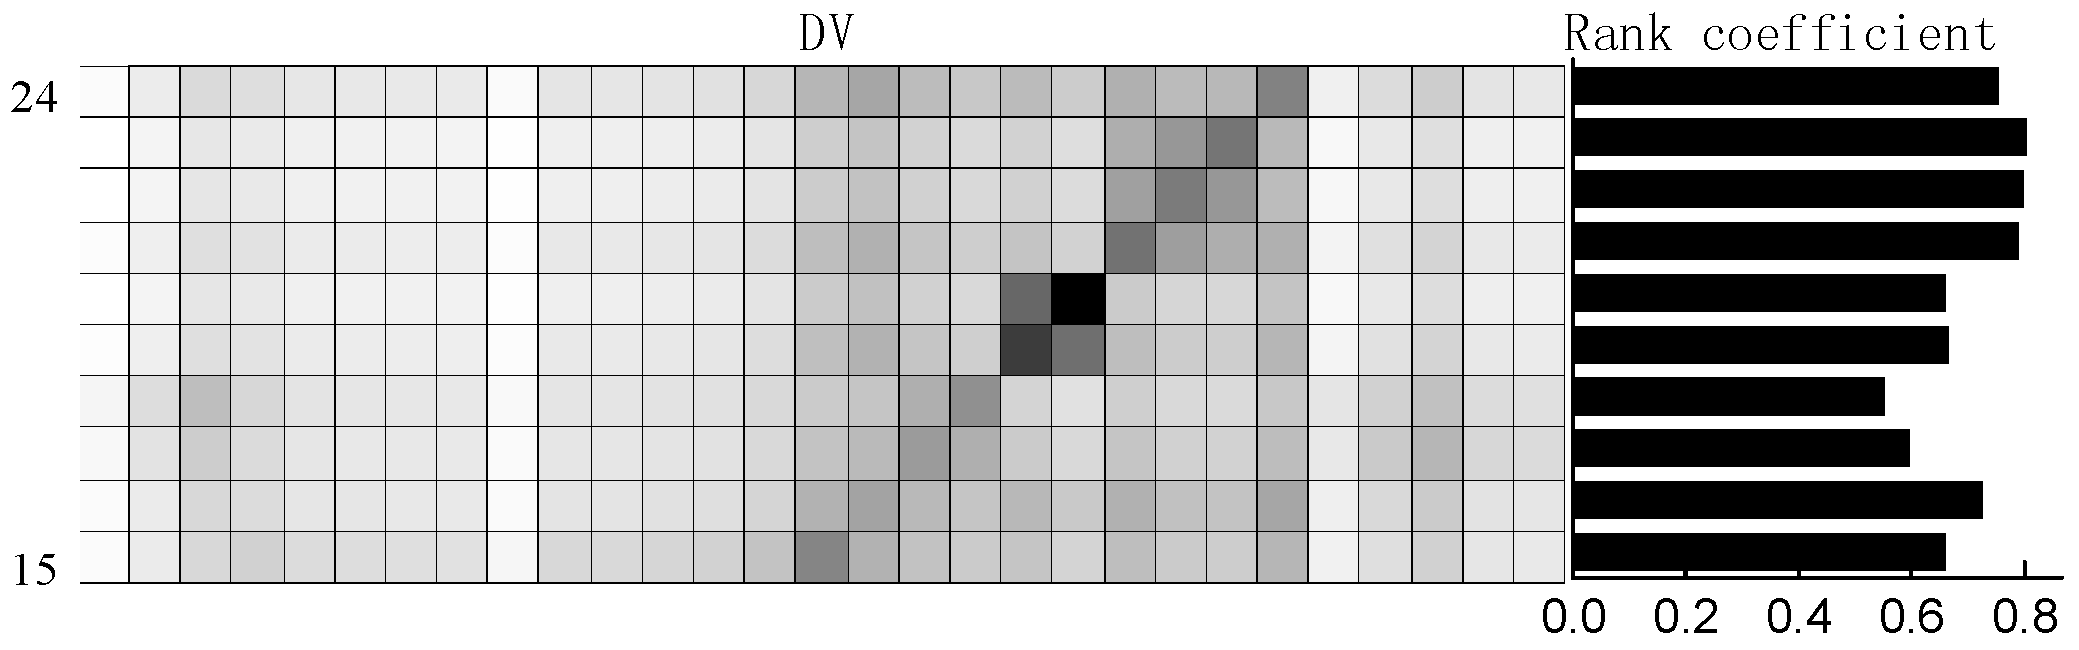
To globally characterize the system-wide influence of a disturbance, Disturbance Vector (
DV) is defined as in (2):
where 1, 2, …,
N is the bus number.
The DV index retains the DI value of each bus under the corresponding disturbance scenario. Therefore, compared with the widely-used scalar-type index, DV can record more information and thus serves as the influencing feature of the disturbance scenario in our study.
2.2. Voltage Supporting Index
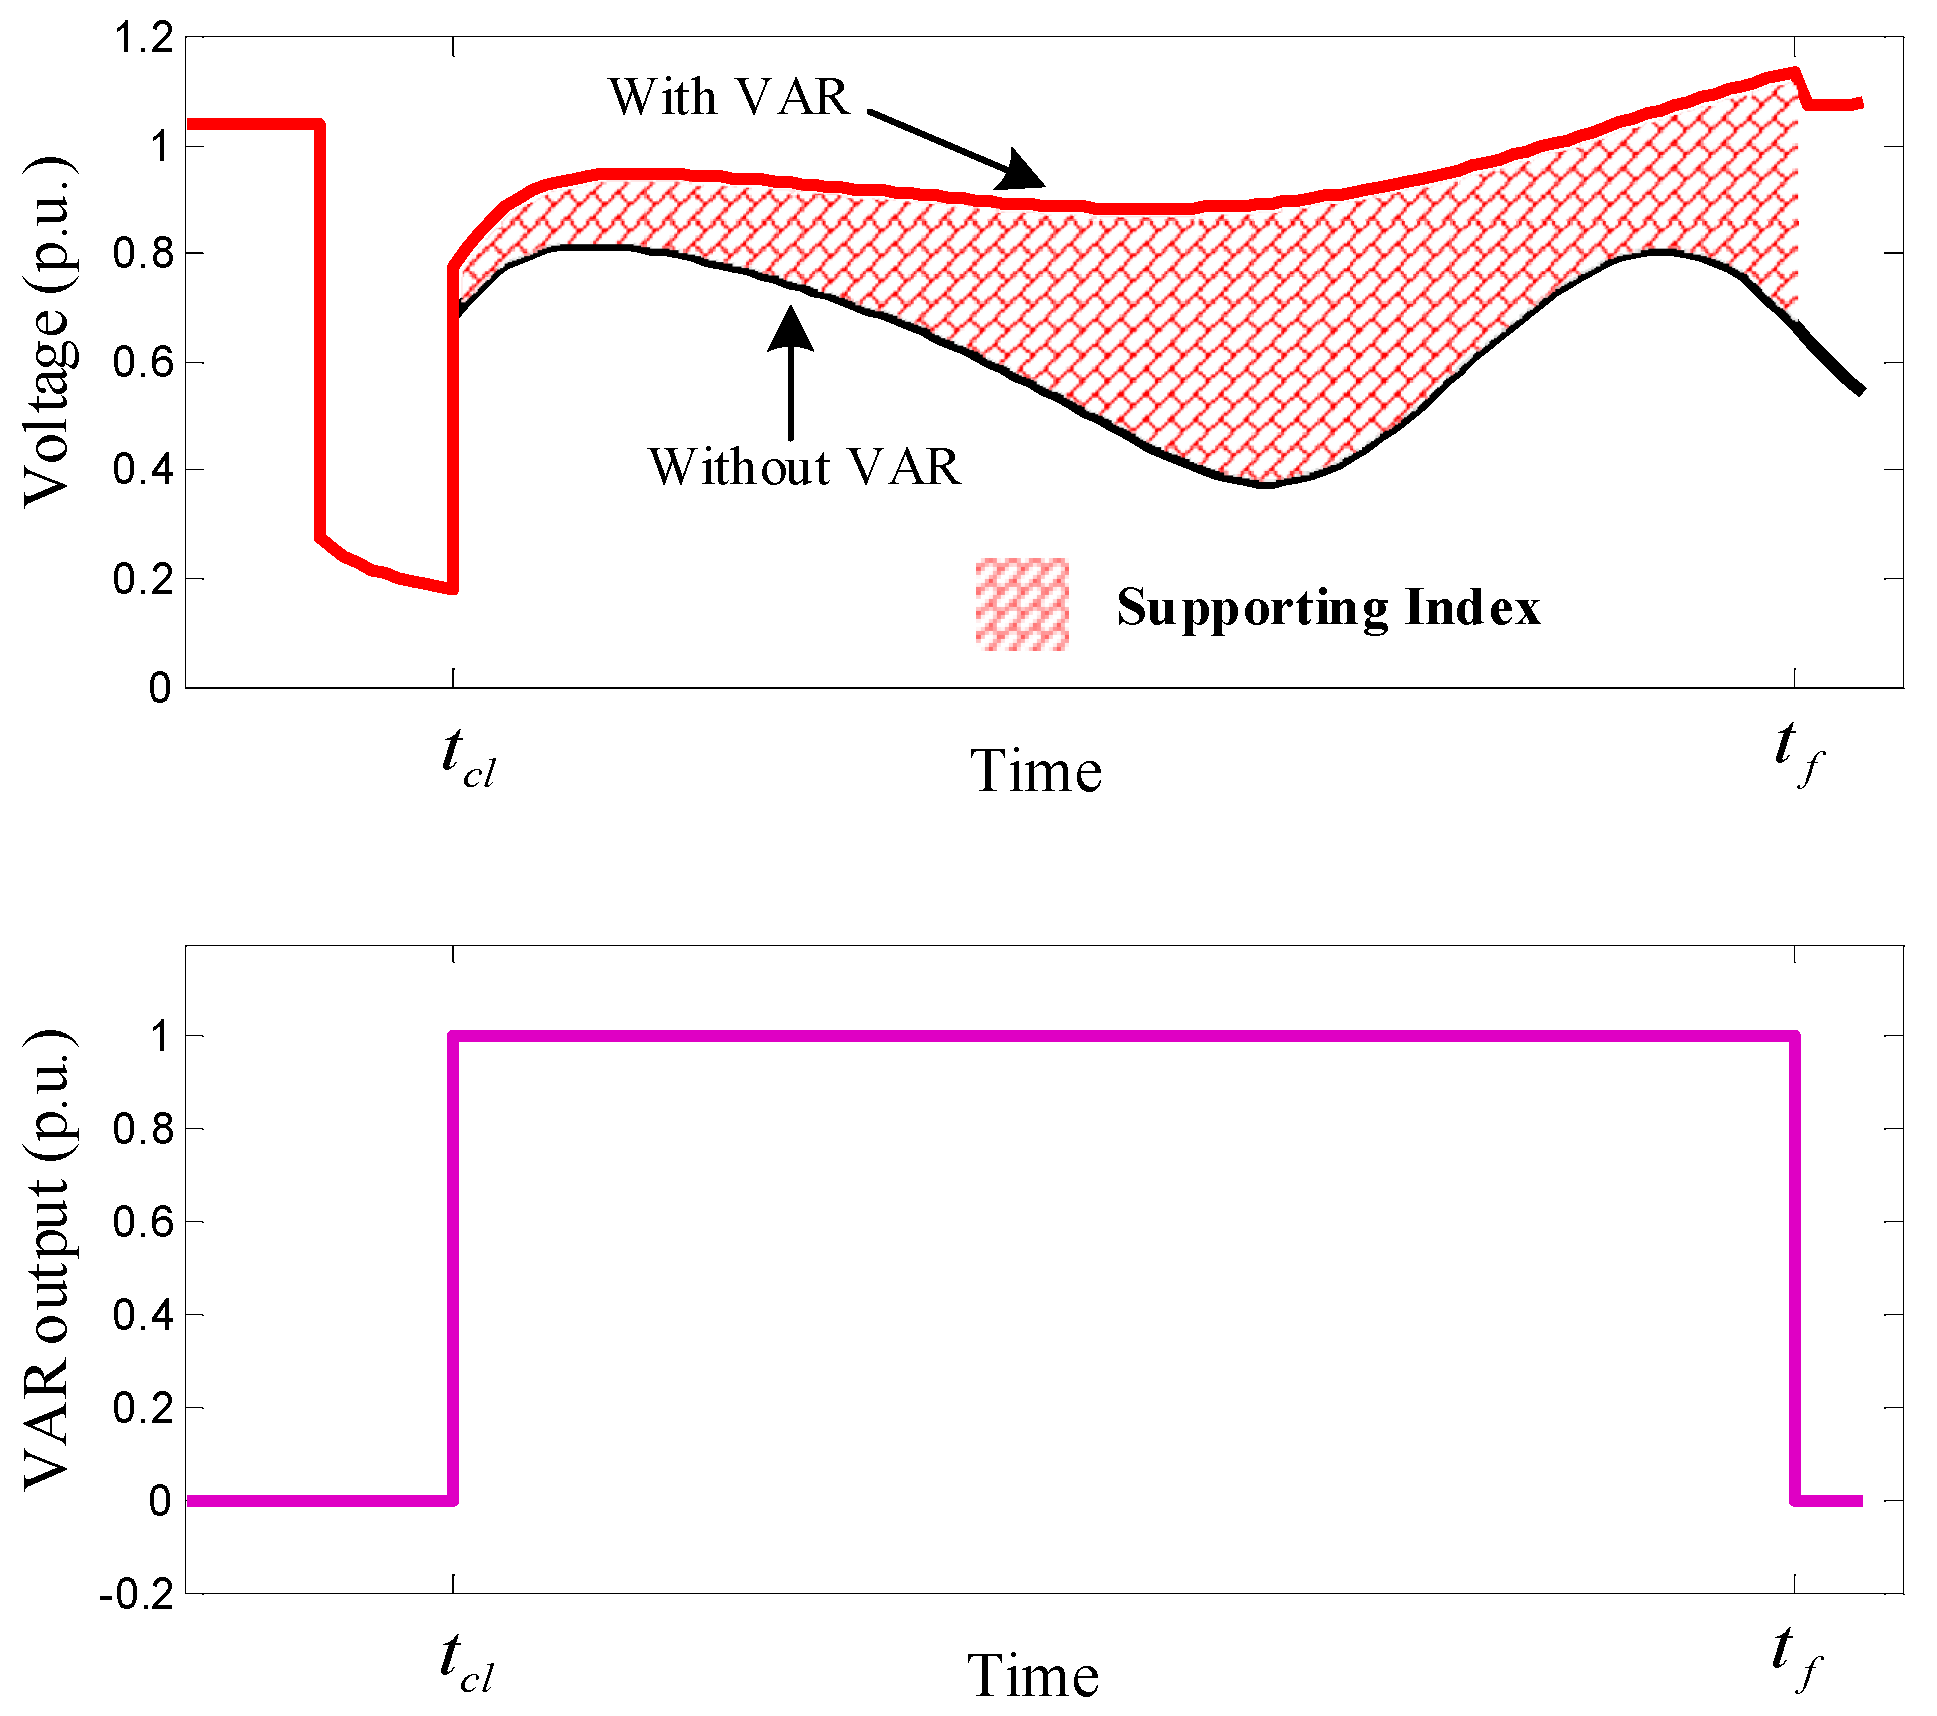
A bus’s voltage will deviate from its specified value when a contingency occurs. Then, a DVC source will quickly respond to absorb or inject reactive power to reduce the degree of voltage fluctuation. DVC planning aims at providing a rational DVC allocation scheme to secure the power system operation on the premise of the economy.
To quantify the compensation effect of a DVC device, we define Supporting Index (
SI) in Equation (3) and its specific meaning is provided in
Figure 2:
where the reactive power signal duration is set as 2~6 s; the amplitude of reactive power signal is determined by testing, with which the maximum voltage improvement is about 0.2 pu to 0.4 pu.
As shown in
Figure 2, the SI represents the accumulation of voltage improvement in time domain thus can be used to evaluate buses’ voltage control ability.
Analogous to the definition of DV, here we use SI to constitute a new vector-type index Supporting Vector (
SV) as given in (4):
where
SIij represents the voltage improvement of bus
j with reactive power injection on bus
i. Therefore, the SV index records the system-wide control ability of a specific bus.
Note that SI value is related to three factors: contingency, the controlling bus (i.e., the bus with reactive power injection) and the controlled bus. Hence, the SV value of a certain bus varies with contingencies. So far, we have built a vector-type indexes system to characterize the influence of disturbance and voltage control ability of buses, respectively. The DVC planning method based on the above indexes system will be described in the following sections.
3. DVC Planning Model
In the existing literatures, DVC planning is mainly applied to solve the problem of large disturbances such as short-circuit faults. The basic framework is as follows: firstly, determine the security range of transient voltage according to operation guidelines. Then select proper locations for DVC allocation and optimize capacity to ensure that transient voltage of all the buses subject to considered faults are all within their security range, at the same time with the least investment. Our study follows the similar framework and takes the wind turbines tripping as the disturbance scenario to carry out DVC planning. It is to be noted that our proposed method is based on simulation results, i.e., we can use any specific simulation models as we need to make a trade-off between the accuracy of the results and the computational cost.
3.1. Objective and Constraints
DVC planning is a mix-integer nonlinear programming problem. Its objective is to minimum the total investment as given in (5):
where
denotes whether the corresponding bus is selected for compensation;
Qi is the DVC capacity on bus
i;
is the unit variable cost and
is the fixed cost of DVC installation. In this study,
=
$1.5 million,
=
$5 million/100 MVar.
Considering the operation security, the constraints are provided in (6) to (8):
where
represents the state variables;
represents the algebraic variables;
represents the control variables;
represents parameters of reactive power compensation devices;
f,
g are the dynamic state function and power flow function, respectively; (8) is the capacity constraint considering the expensive cost of large capacity DVC devices;
and
are voltage boundaries, whose value is determined according to system operation requirements and in our study focusing on transient voltage security after wind turbines tripping, the boundaries are as recommended in (9) considering the operation requirements of wind turbines. Note that as different type of wind turbines have different operation requirements, the boundaries can be adjusted in real applications:
In addition, we define Voltage Violation Index (
VVI), as given in (10) to denote the integral of over-limit voltage in time domain:
Hence, (7) can be rewritten as given in (11):
Then we can obtain the equivalent representation of the optimization problem in (12):
where
M is a large enough positive number to make the objective as large as possible when constraints are not satisfied. In this paper,
.
3.2. Selection of Installation Locations
In DVC planning, it is preferred to provide sufficient reactive power support to the seriously influenced buses. Note that to achieve this goal, SV and DV established in
Section 2 provide a valuable guide for the site selection, which should be comprehensively considered. Then, in this section, the Kendall rank correlation coefficient is introduced to determine the best installation locations.
3.2.1. Kendall Rank Correlation Coefficient
There are various statistical indicators for measuring correlations between data sequences, e.g., the Pearson correlation coefficient and the linear correlation coefficient. However, they may be ineffective in the presence of noise, measurement inaccuracy, etc. Furthermore, we only focus on the relative positions of the elements in a sequence in this field, i.e., focus on their rank correlation. With this concern, Kendall rank correlation coefficient is widely used and proved to have great sensitiveness and discriminative ability [
21,
22].
Let X and Y be vectors, represented by .
Then, calculate conformance value (assumed by
A) of each pair of elements by (13):
That is, if the ranks of and are identical, means that they are concordant. Otherwise, if one ranking is the reverse of the other, means they are discordant.
The n-dimensional vectors can make up
pairs of elements and then calculate all the
A value to compute Kendall correlation coefficient as given in (14):
where
means that the ranking of the two sequence all identical; while
indicates that the ranking of one is the reverse of another;
denotes that they are completely independent.
3.2.2. Selection of Installation Locations
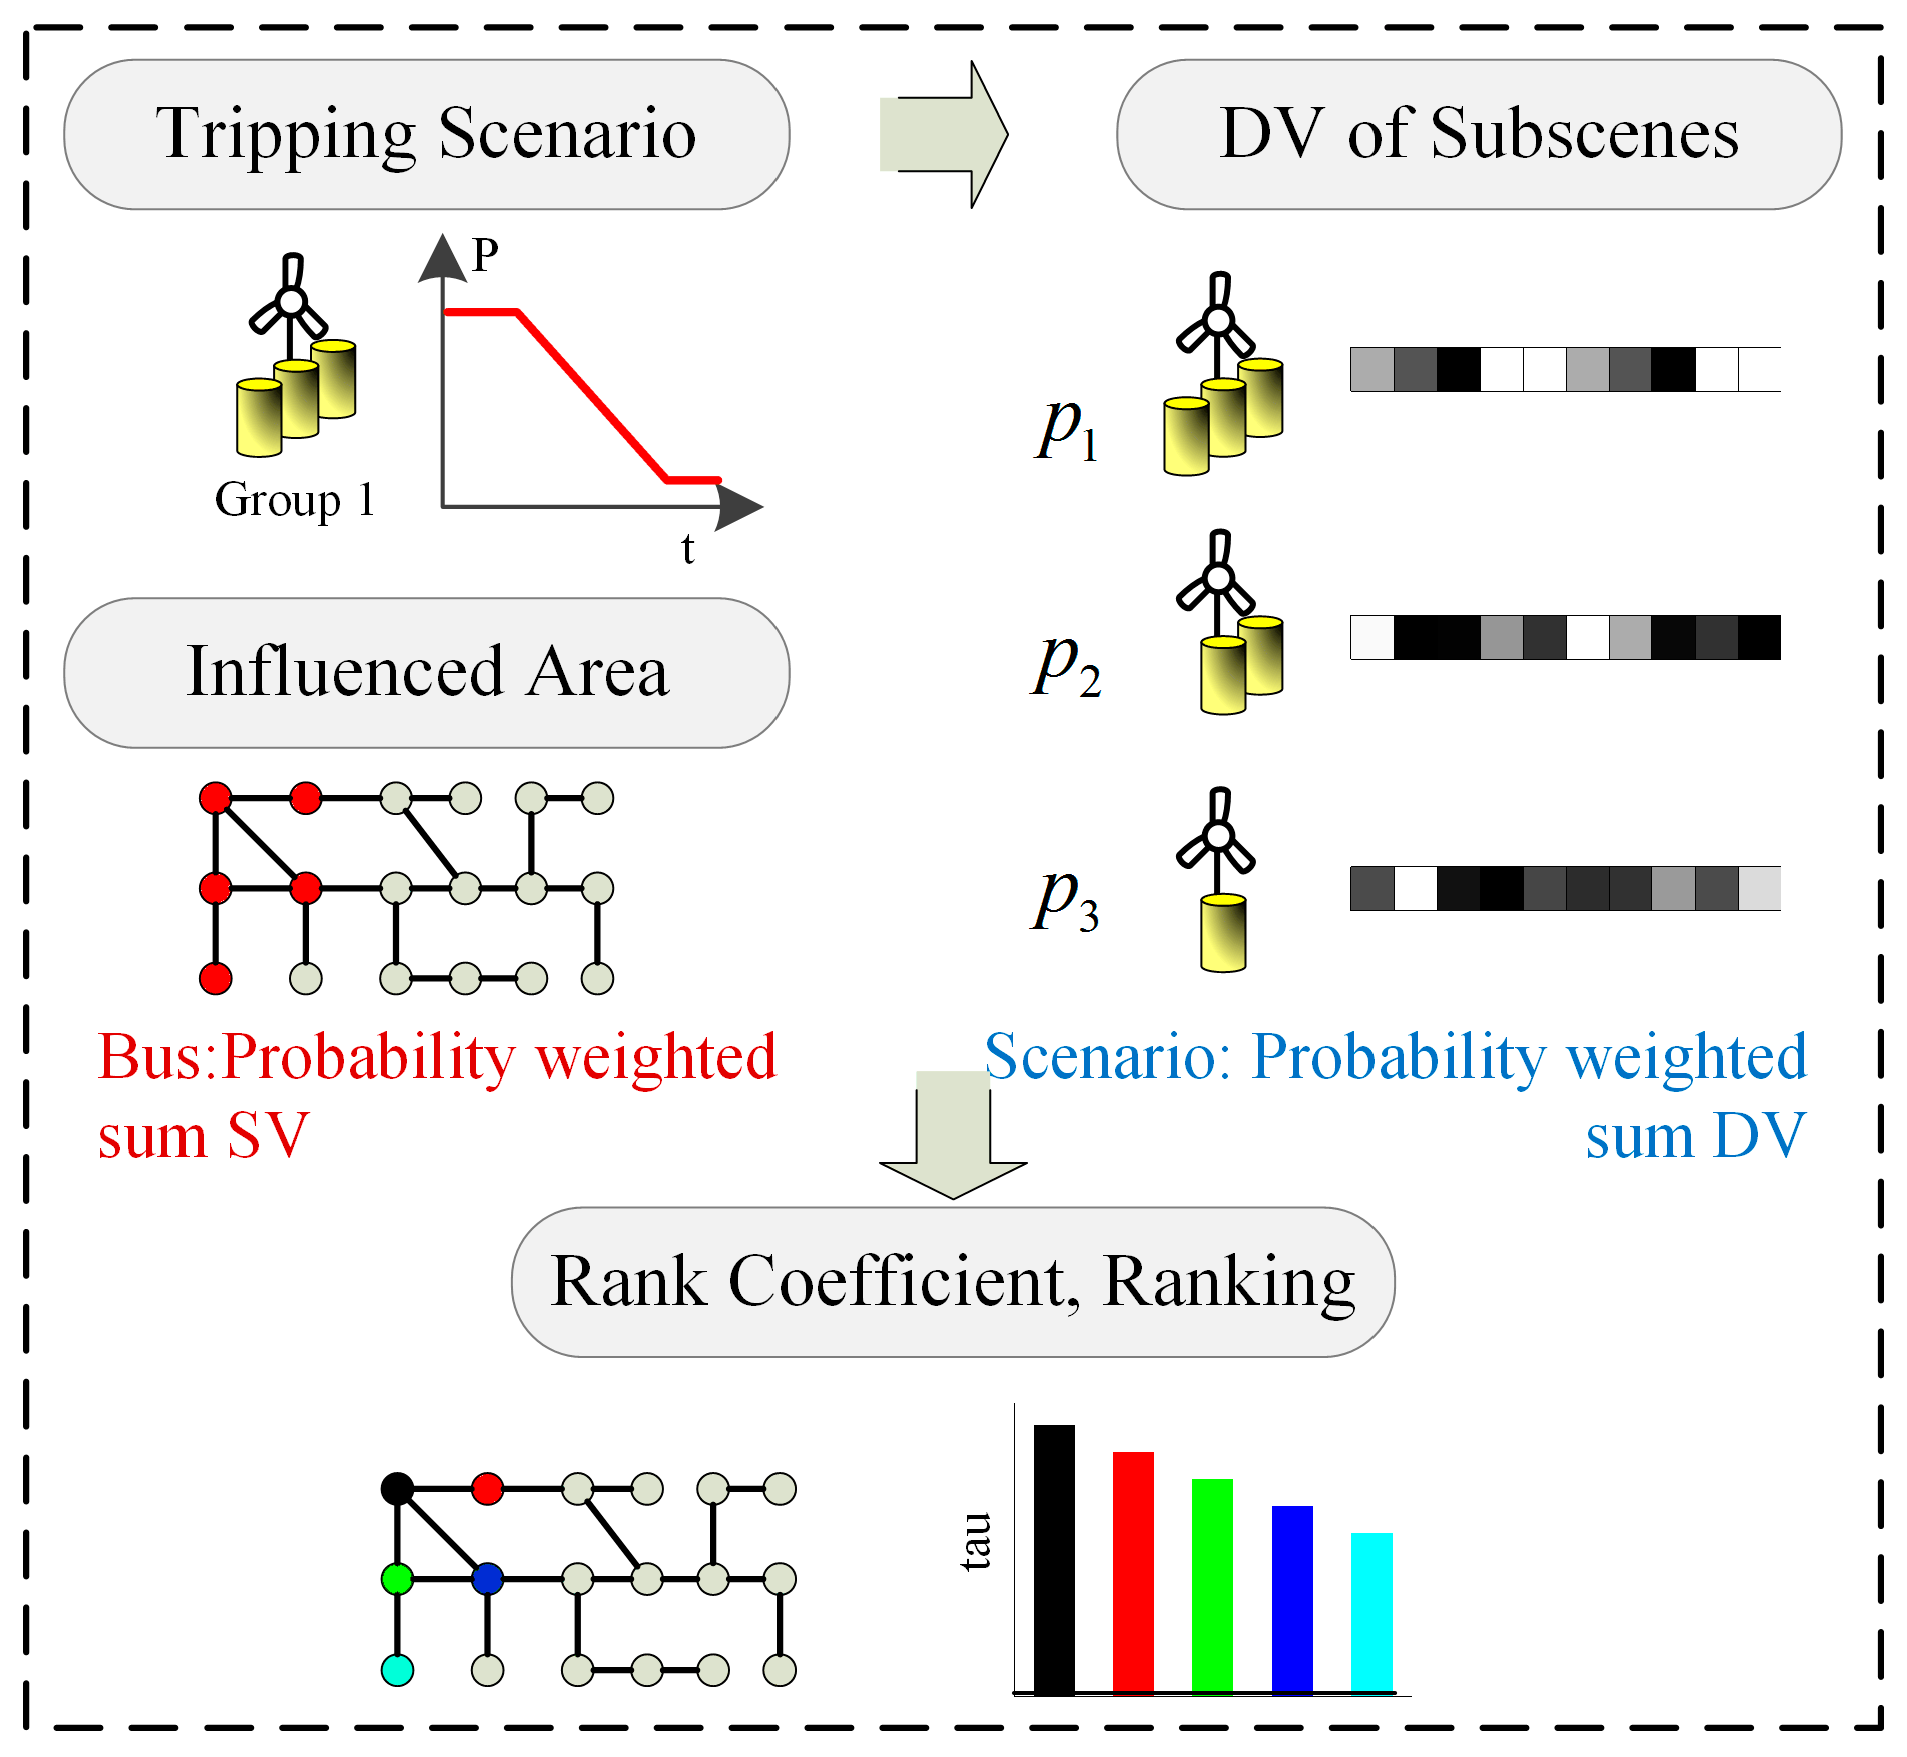
In a wind farm cluster, tripping disturbance of any combination of wind farms may cause different voltage violation issues. In addition, as mentioned before in
Section 2, buses’ voltage supporting ability (denoted by SV) varies with the disturbance. Therefore, it is crucial to select comprehensively optimal installation locations to cope with potential tripping disturbance.
In our study, probability of each potential disturbance scenario is considered to determine installation locations.
Figure 3 provides a detailed illustration of the steps.
Firstly, according to geographical location and historical wind speed data, determine the potential tripping scenarios and their corresponding probability.
Subsequently, calculate DV vector of each considered scenario and then the probability-weighted sum is carried out to obtain a comprehensive vector
DV0 in (15). Similar calculation is applied to get
SV0 in (16):
where
DVi is the
DV of scenario
i;
SVij is the
SV of bus j in scenario
i;
pi is the probability of scenario
i.
Finally, we calculate the Kendall rank correlation coefficient of DV0 and SV0, then rank them in descending order. The bus with the greatest correlation coefficient is selected as the installation location for the corresponding wind farm cluster.
3.3. Capacity Optimization
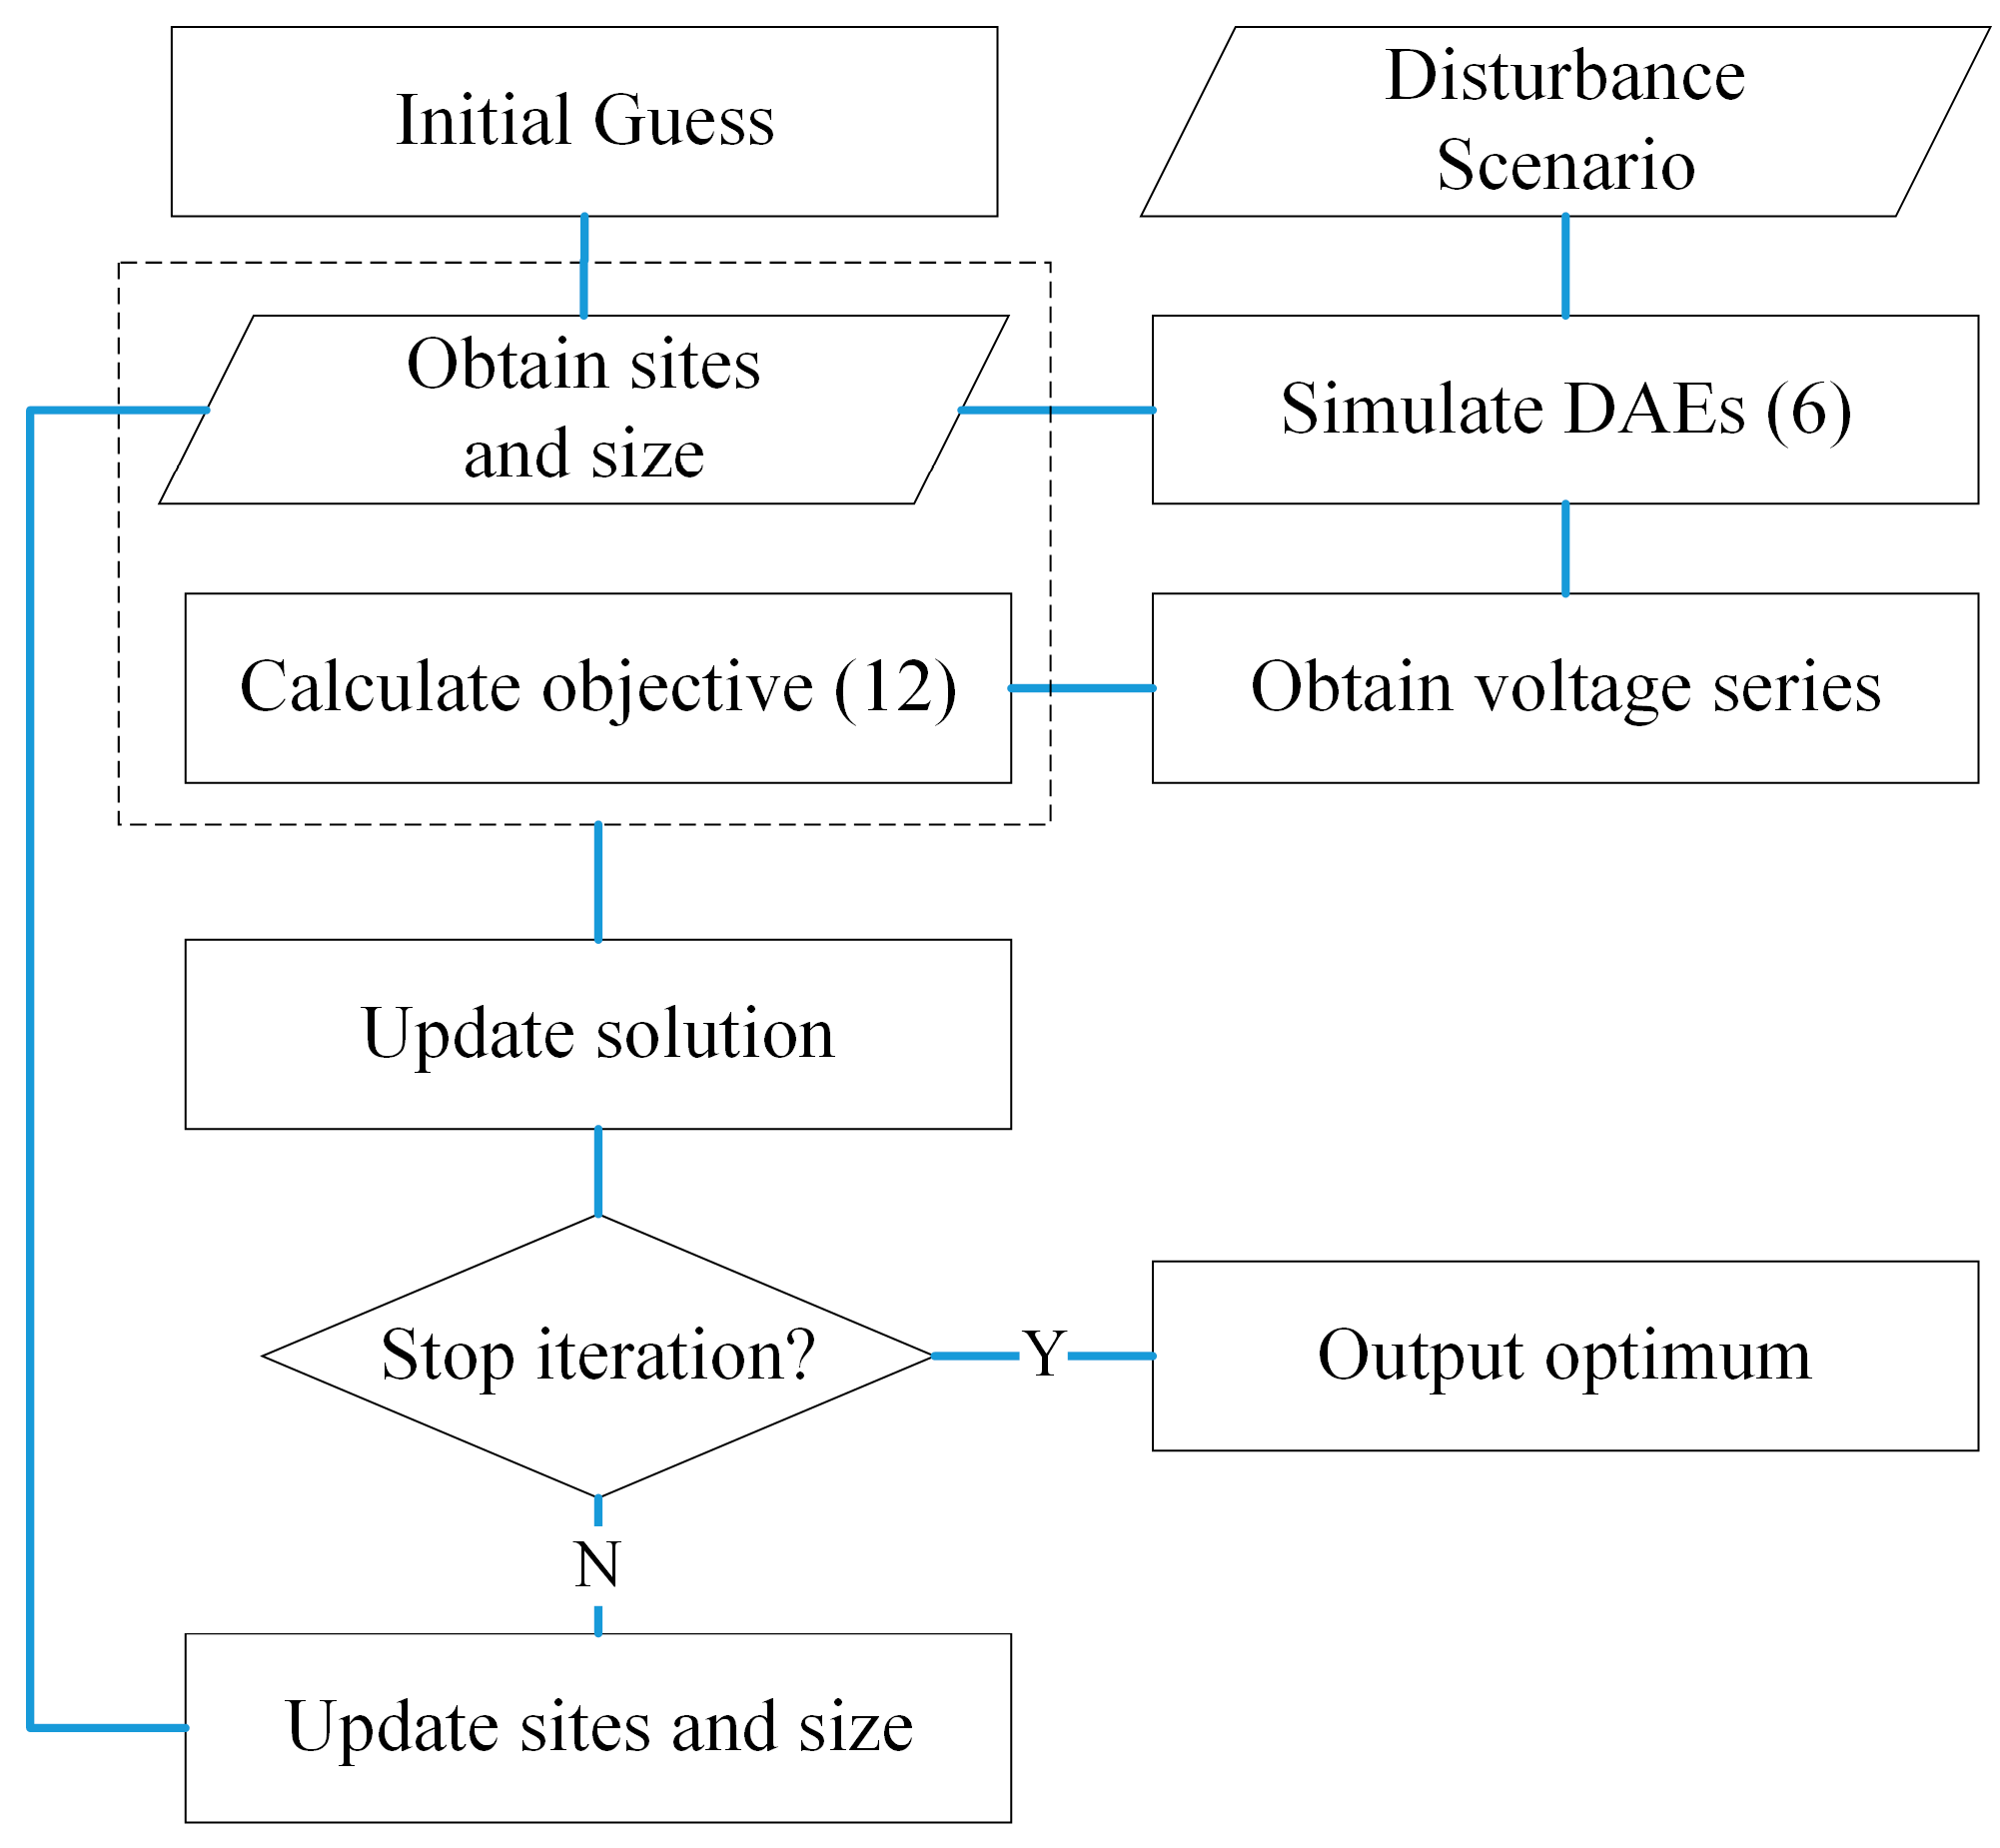
The capacity optimization step purpose is to determine the DVC capacity considering operation security constraints with the least investment. Based on the selected locations, any feasible optimization algorithm, e.g., particle swarm optimization (PSO), genetic algorithm (GA), can be adopted. In this study, we use GA for capacity optimization.
The flow diagram for solving this is shown in
Figure 4. The DAEs’ constraints (6) are solved by a power system simulation tool (e.g., PSD-BPA) and the GA is run in MATLAB. The simulation tool provides a voltage series to MATLAB to transform into a penalty item in (12), then the original problem can be solved by the GA solver directly.
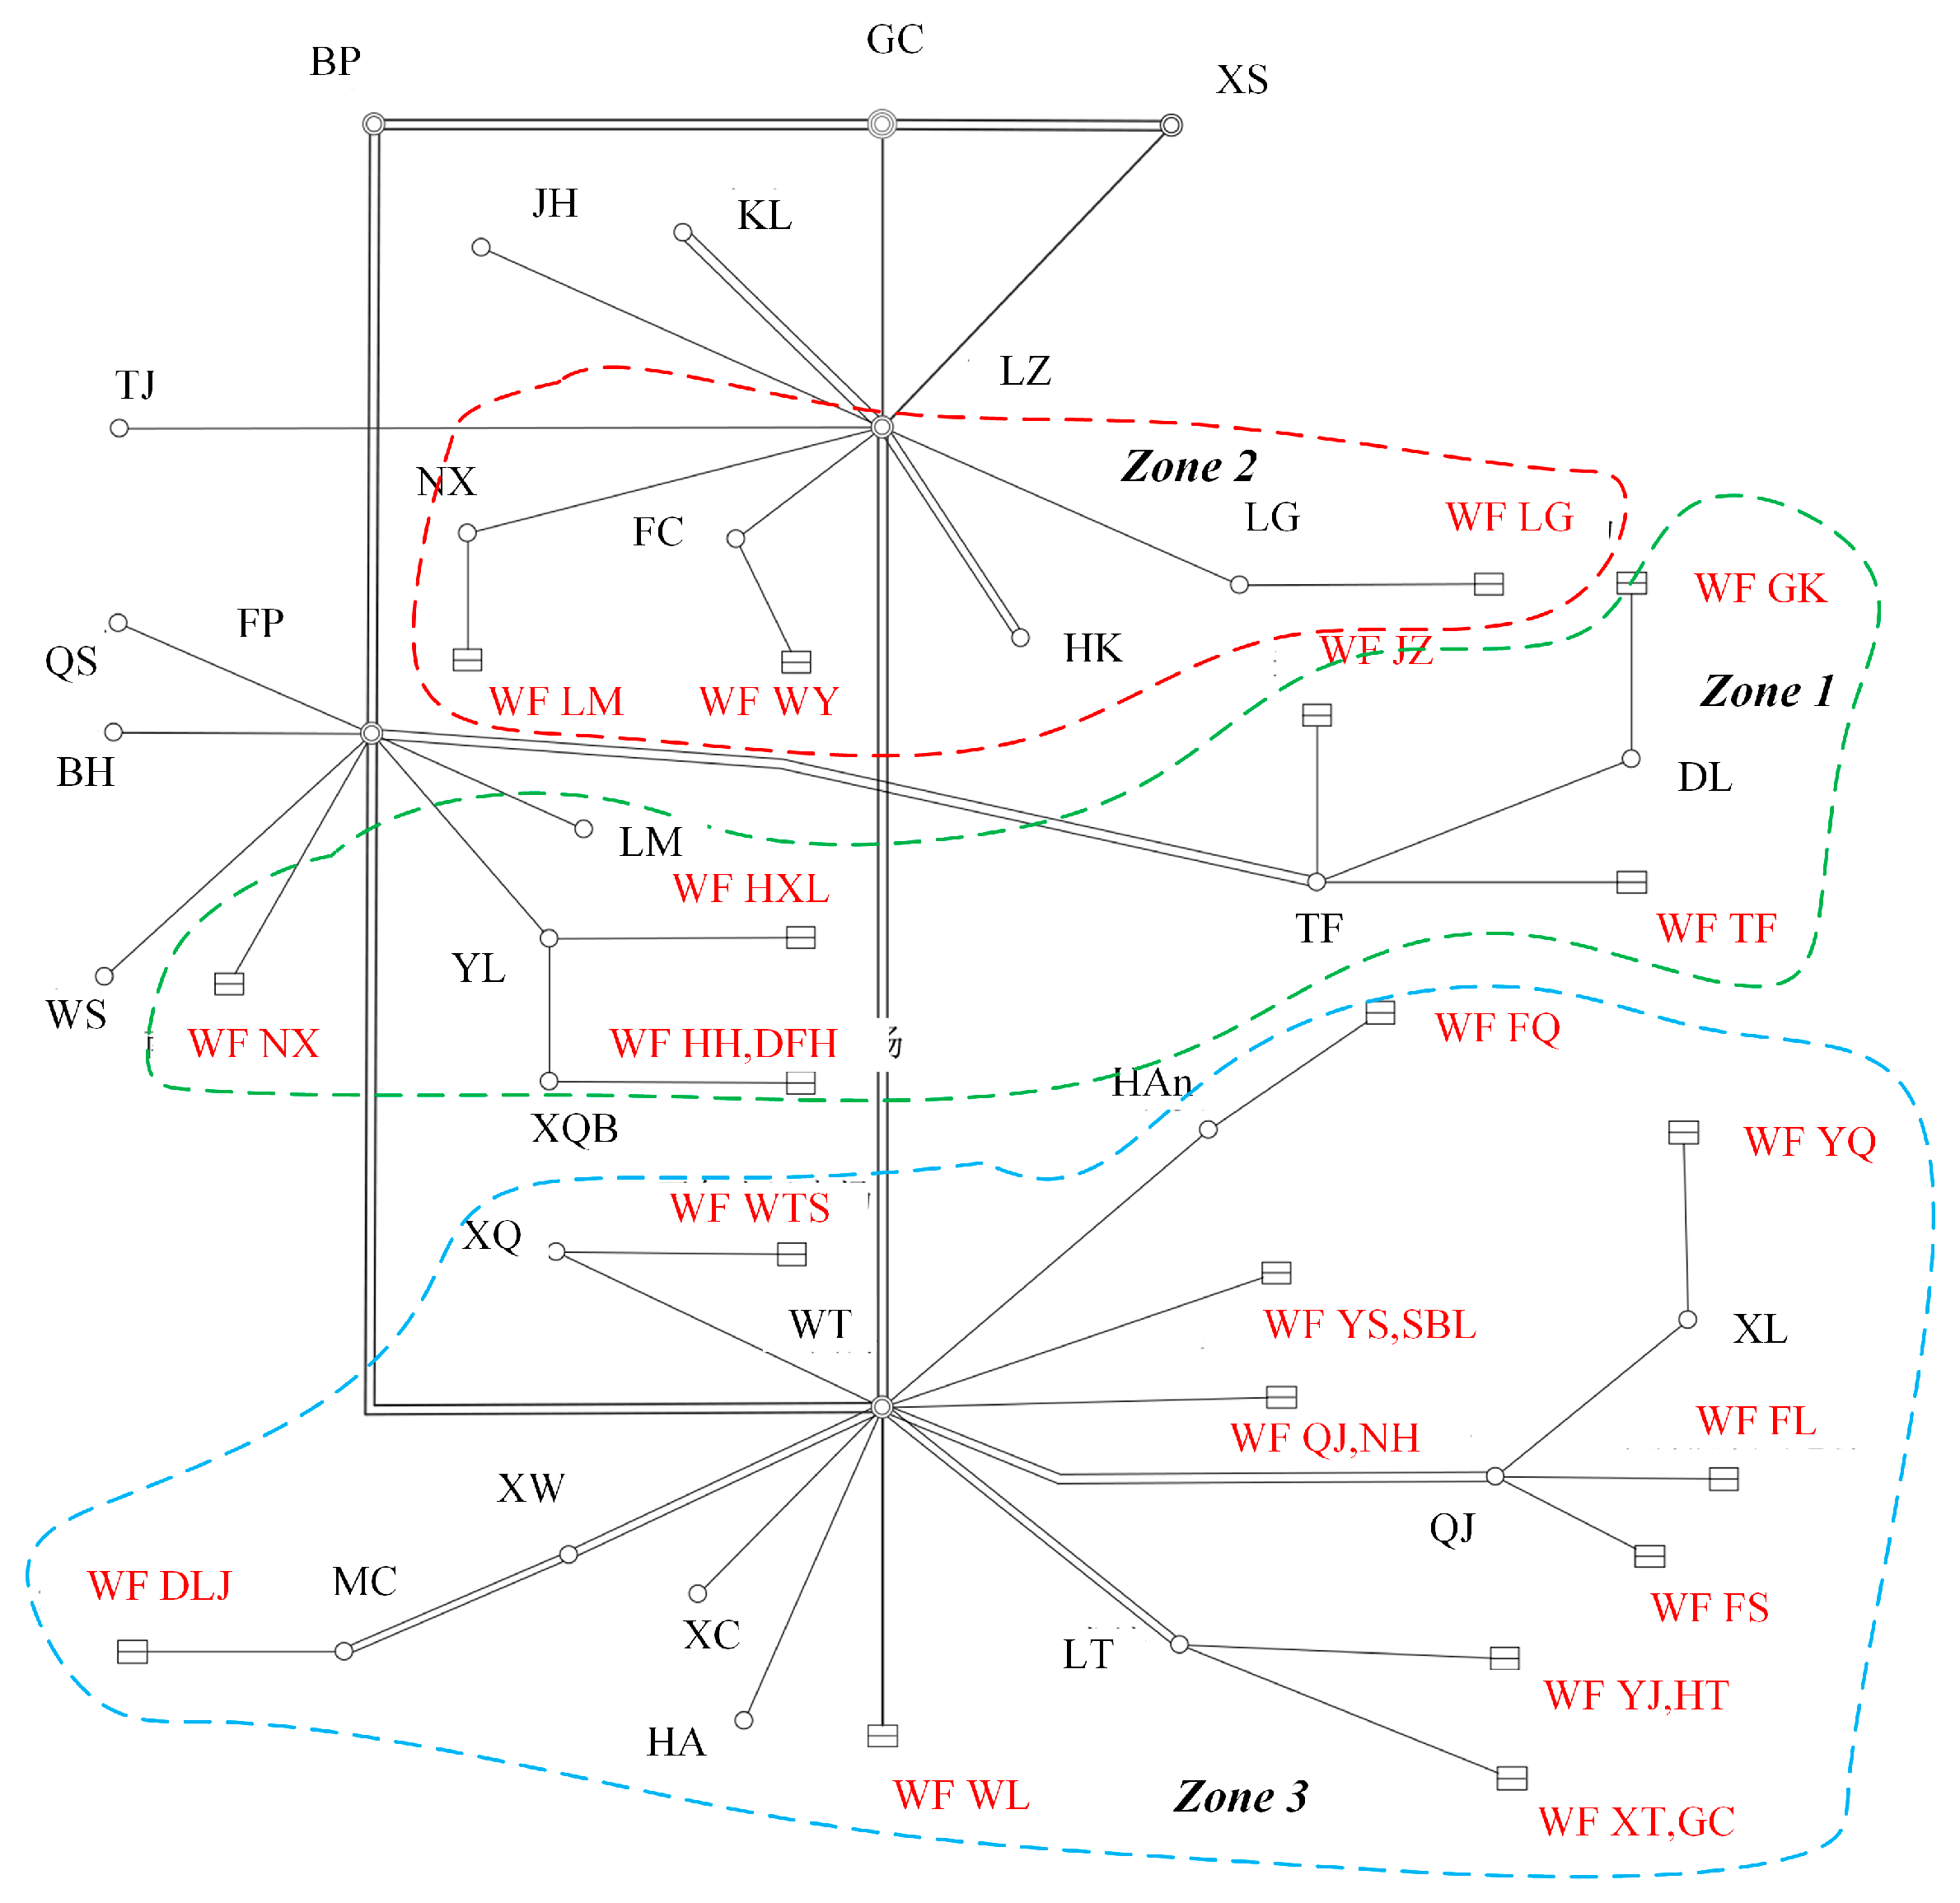
5. Real Application in Southern China
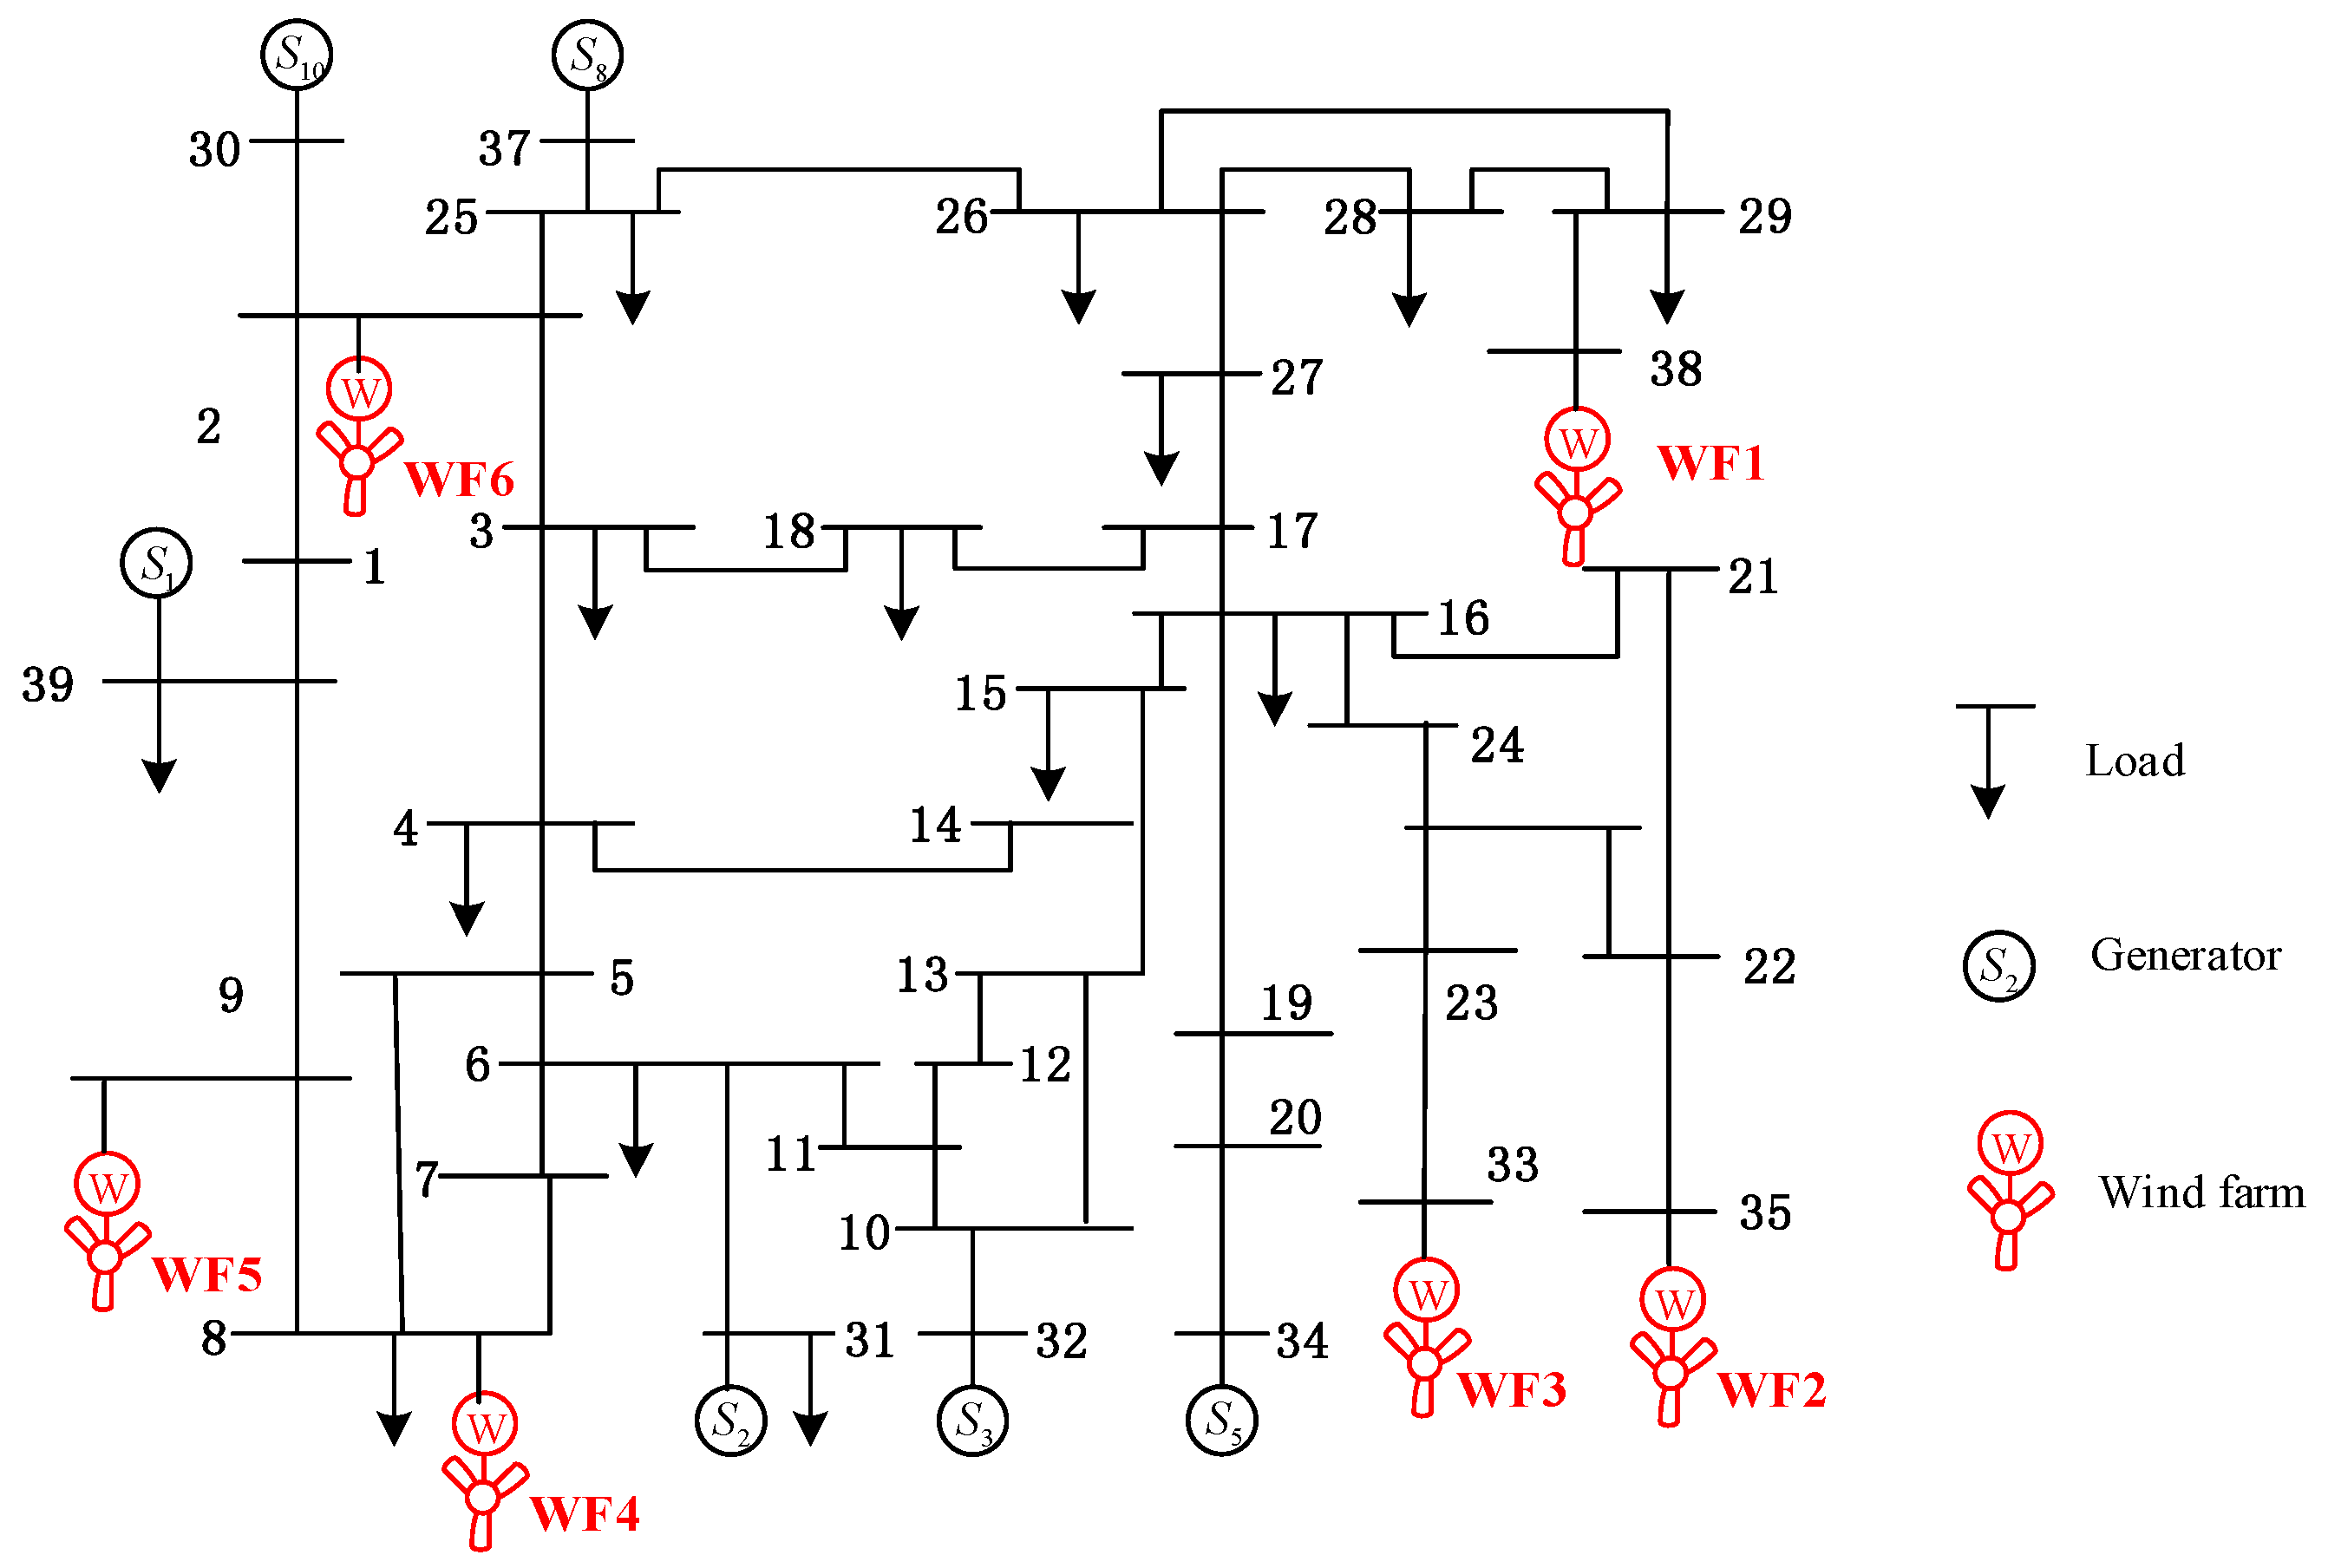
A real application on a regional grid (ZJ grid) in Southern China is carried out. According to the planning data, there will be 25 wind farms integrated into the ZJ grid by 2020 and the total installed capacity will be 1730 MW. The peak load is forecasted to reach 5400 MW in the ZJ grid in 2020 and its grid structure is shown in
Figure 9.
According to the analysis of the wind power correlation, the correlation coefficient of wind power output in the ZJ coastal area is significantly high and the peak output scenarios often appear in the early morning, typically at 5:00 a.m. in summer. The load level at 5:00 is 53% of the peak load, i.e., 2860 MW. Wind turbines work at 90% of the rated capacity and in this situation the proportion of wind power is 54.5%.
As ZJ is located in a typhoon-prone region, according to wind speed data, we consider 70% of the wind turbines collected into the same 220 kV bus trip off and the wind power decreases from 90% to 20%.
5.1. DVC Planning
The 25 wind farms are divided into three clusters according to the connected 220 kV substations. Only 110 kV buses are considered for DVC. A wind turbine tripping disturbance is simulated and the influenced areas of each clusters are provided in
Table 2.
According to geographical location and historical wind speed data, the considered disturbances are as follows:
- (1)
Tripping disturbance happened in each wind farm, with probability 0.05;
- (2)
Only geographically close wind farms are considered for simultaneous disturbance and these combinations are given in
Table 3.
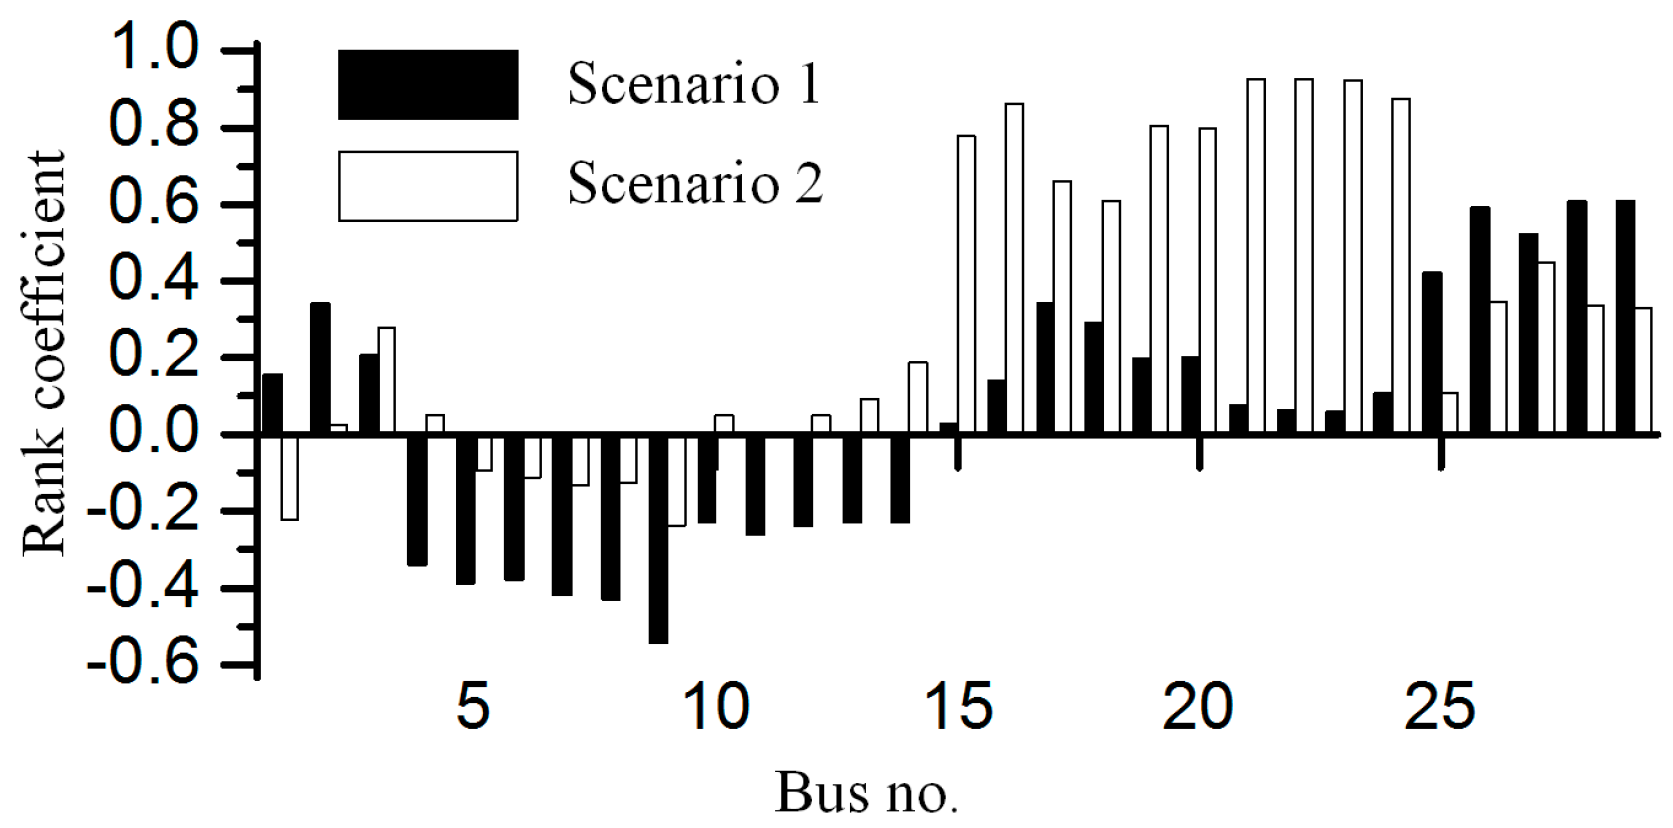
Based on the above scenarios, rank correlation coefficients of SV
0 and DV
0 in each cluster are calculated, and the results are shown in
Figure 10.
As
Figure 10 shows, except for #22 and #23, other buses in zone 1 have a similar rank correlation coefficient value; therefore, further study on their voltage violation is performed.
In zone 2, #9 has the strongest compensation ability and in zone 3, the top 8 buses have similar rank correlation coefficient value. Therefore, further study is required. Using (9) as limits, the buses exceeding the limits are given in
Table 4.
We can find that only the disturbance in zone 3 will cause a voltage violation. The main reason is that zone 1 and zone 2 are closely connected to the GC 500 kV substation. Thus, the voltage of buses in these zones is well controlled, however, zone 3 is located at the end of the gird, with a weak connection to the main grid. In addition, the installed capacity of wind farms in this zone is significantly large. Therefore, the voltage violation is significant under disturbance conditions. With this concern, only zone 3 requires DVC.
The planning result is to allocate 20 MVar STATCOM on #2 (PCC of WF FL), the one with the strongest compensation ability. The reason is that there are several wind farms (FS, YQ, etc.) and when strong wind weather occurs, the tripping will cause a large capacity power fluctuation. Then, DVC on #2 can well cope with the voltage issue.
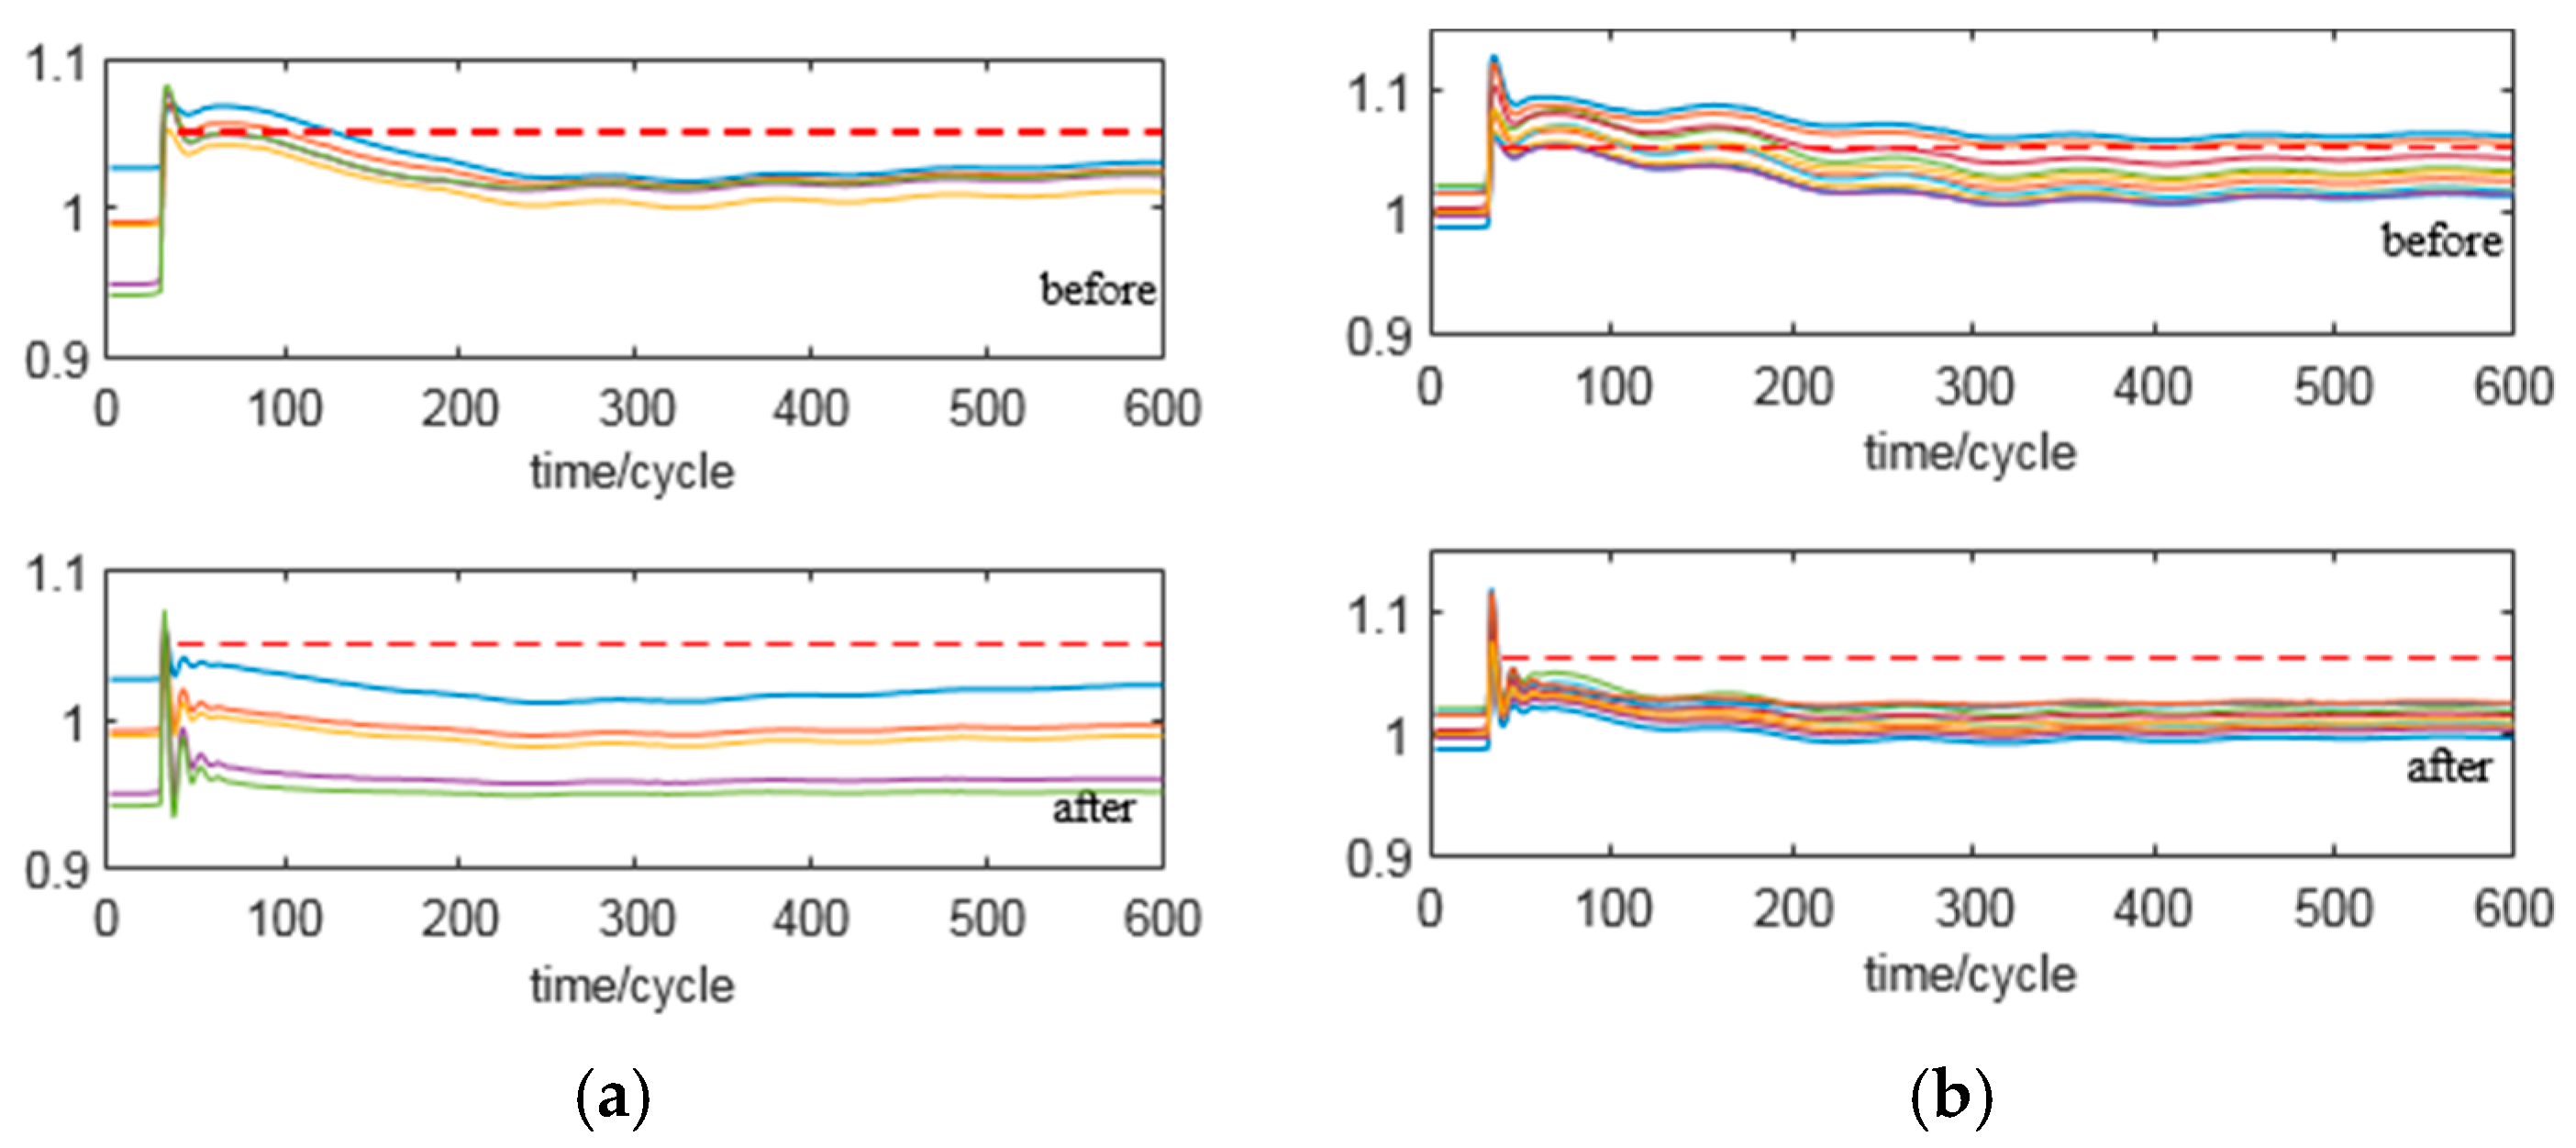
5.2. Comparisons and Discussion
This paper proposes a heuristic DVC planning method based on transient voltage behavior. Installation locations are determined by their voltage control ability. To validate the effectiveness of the proposed method, an engineering experience-based method is carried out.
According to engineering experience, #65 (named WT) is selected as installation location because it is the pivotal 220 kV substation of all the 110 kV lines in zone 3, indicating that it has the strongest control ability to its radial 110 kV substations. Then capacity optimization is accomplished and the result is to allocate 40 MVar STATCOM on #65 to address the voltage violation.
Comparison with the proposed method indicates that the capacity is relevant to the selected locations and it can be found that the proposed method is control ability oriented, which considers the matching degree and the bus voltage control ability and influence of disturbance; while the traditional method considers the central control capacity of the central station but neglecting the imbalance of capacity and location of wind farms. It can be seen from the results of capacity optimization that the proposed scheme can meet the same transient voltage constraints with less capacity, which shows that the proposed scheme is feasible and efficient.
6. Conclusions
This paper proposes a DVC planning method considering wind turbine tripping in regional power grids. A vector-type indexes system is established to evaluate buses’ transient voltage features, including disturbance vector (DV) and supporting vector (SV). Then the Kendall rank correlation coefficient is adopted to evaluate the matching degree of SV and DV, so as to determine the best installation locations. Capacity optimization is subsequently accomplished. The proposed vector-type indexes retain more complete information, thus perform better than the widely-used scalar-type indexes. In addition, rank correlation coefficient of DV and SV is used to determine locations, which provides better locations because it considers the control effect of DVC. The adopted method is simulation based, thus can consider different parameters of wind turbine, generators and any other essential devices to provide a solution of greater accuracy. As the proposed framework is simulation-based, future work can focus on the mechanism of the influence of wind turbines tripping to provide more theoretical explanations to improve our approach. In addition, more scenarios considering the uncertainty characteristics of wind power can be applied for better performance. In short, the proposed framework provides an effective solution to optimal dynamic reactive power planning considering wind turbines tripping. Furthermore, the proposed method is transferable and can be applied to issues considering short-circuit fault and so on.


