Article

Experimental Investigation of Characteristics of Sand Production in Wellbore during Hydrate Exploitation by the Depressurization Method

1
State Key Laboratory of Oil & Gas Reservoir Geology and Exploitation, Southwest Petroleum University, Chengdu 610500, China
2
Guangzhou Institute of Energy Conversion, Chinese Academy of Sciences, Guangzhou 510640, China
3
CAS Key Laboratory of Gas Hydrate, Guangzhou 510640, China
4
Guangdong Provincial Key Laboratory of New and Renewable Energy Research and Development, Guangzhou 510640, China
5
Guangzhou Center for Gas Hydrate Research, Chinese Academy of Sciences, Guangzhou 510640, China
*
Authors to whom correspondence should be addressed.
Energies 2018, 11(7), 1673; https://doi.org/10.3390/en11071673
Submission received: 29 May 2018 / Revised: 19 June 2018 / Accepted: 23 June 2018 / Published: 27 June 2018
(This article belongs to the Section L: Energy Sources)

Abstract

:
Sand production is the process in which formation sand and gravel would migrate into the wellbore by the flow of reservoir fluids. This is a significant problem that endangers the safety of hydrate exploitation. The aim of this study is to understand sand production during hydrate exploitation. A novel experimental apparatus was constructed to examine sand production in the hydrate layer by using the depressurization method. Hydrate production was divided into three periods: water, gas with water drops, and gas. We detected sand production in the first two periods: fine sand in the first period and sand grains in the second. The temperature related characteristics of the hydrate layers and the rates of sand production differed during different stages of hydrate production. The unique sputtering occurring owing to the decomposition of the hydrate might have provided the driving force for sand migration, and water gas bubbles or gaseous water drops from the decomposed hydrate might have enhanced sand carrying capacity. The subsidence of hydrate-bearing sediments was influenced by sand production, whereas the maintenance of crustal stress possibly influenced the rate and magnitude of subsidence. Future experimental and numerical research into the dynamical thermal properties and material balance of the hydrate layer production must consider its dynamic subsidence.

1. Introduction

Natural gas hydrates are crystalline solids composed of water and gas. The gas molecules (guests) are trapped in water cavities (host) composed of hydrogen-bonded water molecules. Typical natural gas molecules include methane, ethane, propane, and carbon dioxide [1,2,3]. Natural gas hydrate is widely distributed in areas with permafrost and offshore regions, and are estimated to contain approximately 20,000 trillion m3 of potential energy [3,4,5].
However, developing hydrate causes changes in the mechanical behaviours of hydrate layers. This leads to geomechanical problems such as wellbore instability, sand production, formation collapse and submarine landslides [5,6,7,8,9,10,11,12,13]. In the petroleum industry, millions of dollars have been spent to prevent, solve and overcome sand control problems and their prediction [14,15,16]. Sand production is a severe problem affecting the safe and efficient hydrate exploitation [4,5,17,18,19,20,21,22,23,24,25,26,27,28,29,30,31,32,33,34,35]. Sand production has been reported in the cases of Messoyakha terrestrial hydrate reservoir [18,19], Mallik terrestrial hydrate production tests in 2007 and 2008 [17,20,31], Alaska’s North Slope terrestrial hydrate exploitation [31] and Nankai offshore hydrate production tests in 2013 and 2017 [22,23,33,34]. In May 2017, China performed two types of hydrate production tests in the Shenhu and Liwan areas of the South China Sea using methods of sand control and sand separation, respectively [26,28,29]. The sand control demonstrated by these production tests may not be sufficient for large-scale commercial hydrate exploitation with larger production rates and times. Therefore, research on the sand production mechanism in hydrate exploitation is essential.
In experimental investigations, the importance of fine sand production during gas production owing to hydrate-bearing sediments has been noted, even when the content of fine sand is relatively low [36], but these tests did not involve wellbores or temperature gradient. Sand production occurs during the depressurization process, when hydrates are unstable. The driving force here is not dissociated gas flow but the water flowing through pores; the water flow rate determined the occurrence of sand production [37], and the effects of the wellbore and layered temperature were not discussed in these tests. Fine sand invasion was observed when the flow rate was increased, but no massive sand production was noted, which was not in agreement with the field-test results [38]. The flow rate has a strong influence on the amount of sand carried by the water flow and, therefore, on the amount of sand produced [39]. It was shown that the initial mechanisms of sand production may be related to the void ratio and confining pressure of the sediments [39]: loose sands appear to produce sand in a uniform flow, where the formation moves as a whole and the sand structure is preserved; in contrast, dense sands exhibit more localized production through the creation of larger voids. Because of the fine sand facies in the Daini-Atsumi Knoll, gas hydrate production in the trial reservoir was likely to behave as loose sand, so the sand production in the trial may behave as a flow where the sand structure is preserved, rather than with localised failures. Unfortunately, only the sand production by hydrate-layer-sand was discussed, and hydrate was not occurred in the tests. However, researchers have confirmed the effectiveness of a commercial sand screen: The amount of sand collected after the hydrate depressurization experiment was less than 0.012% of the total mass of the sediment samples [40]. Therefore, sand production problems can be solved with further research.
Few studies to date have focused on sand production with hydrate depressurization using synthetic sandy sediments. Furthermore, little is known about the mechanism of sand production in a wellbore with hydrate depressurization periods, subsidence, and layered temperature characteristics. This work revealed the sand production related behaviours in the wellbore of methane hydrate production in sediments and to analyse the mechanism of sand production based on observation. We also discussed the affection of sand production and hydrate decomposition on sediment properties like sediments pressure, subsidence and layered temperature. Thus, the sand production behaviours during hydrate depressurization can provide a firm foundation for sand control in hydrate production.

2. Experimental Apparatus and Process

2.1. Experimental Apparatus

Figure 1 shows the methane hydrate sand production and sand control simulator (MHSPSCS), which has a diameter of 200 mm and the height of 200 mm. The inner volume is 117.80 L (ø159 mm × 130 mm). A high-pressure simulator made from stainless steel 316 was the core of the apparatus, and could maintain a pressure up of to 30 MPa. The experimental device consisted of a high-pressure reactor equipped with a wellbore, a temperature-controlled water bath, a production unit, a visual gas-liquid-solid three-phase separation system, a data-acquisition system, and some measurement units. Two top pressure transducers (top pore pressure and crustal stress loader pressure), a middle pressure transducer (middle pore pressure), and a bottom pressure transducer (gas production pressure) were placed in the simulator. The MHSPSCS was enclosed with cooling jacket and heat exchanger tube (−253.15 to 323.15 K, ±0.1 K) to maintain the temperature. The bottom of the reactor had three layers: high (H), middle (M) and low (L). Each layer had four Pt100 thermocouples (WZ-PT 100, Beijing Westzh Science and Techonology Co., Ltd., Beijing, China) with a measurement range of 223.15–373.15 K and accuracy of ±0.01 K. A constant flux pump constructed by Beijing Xingda Science & Technology Development Co., Ltd. (Type SZWeico 2PB, 0–42 MPa, 0.01–10 mL/min, ±0.5%) was used to inject water and maintain the pressure of the moveable crustal stress loader. The visual gas-liquid-solid three-phase separation system separated gas into the gas flow-meter and liquid with sand into the bottom. The liquid with sand was drawn out by a pipe, in order to the blocking the visual window owing to excessive water or sand. The masses of the liquid with sand produced from the reactor and dry sand were measured with an electronic balance (Santorius BS 2200S (Sartorius AG, Göttingen, Germany), 0–2000 g, ±0.01 g). A gas flowmeter supplied by Seven Star Co. (Beijing, China) (D07 type, measurement range of 0–1 L/min, ±2%) was employed to record the gas production rate and cumulative gas production. A wet-type gas meter made by Sh Krom Co., Lotte, Germany (BSD0.5, measurement range of 12.5 L/min, ±1%) was applied to record the gas production rate and cumulative gas production by video. The thermocouples, pressure transducers, and gas flowmeter were calibrated by using a first class mercury thermometer (Wuqiang instrument Co., Wuqiang, China, 273.15–298.15 K, ±0.01 K) with a tolerance of ±0.01 K, pressure gauge with an error of ±0.05%, and wet gas meter with an accuracy of ±10 mL/min. Then, the temperature, pressure, volume of the cumulative gas production, gas production rate, and axial strain were recorded with the data-acquisition system. Deionized water was used in this work. Methane with a purity of 99.9% was supplied by Shiyuan Gas Co. (Guangzhou, China). As shown in Figure 1, the wellbore comprised liner 1 (ø32 mm × 135 mm, 3 mm holes, arrangement: 36°, holes row gap: 10 mm) and liner 3 (ø24 mm × 135 mm, 2.5 mm holes, arrangement: 36°, hole row gap: 10 mm) with a sand screen. Besides gas in from top, the sediment chamber (ø158 mm × 120 mm) had a middle mesh screen that allowed gas and water enter or vacuumize the chamber circumferentially around the sediments (ø158 mm × 100 mm). The wellhead was fixed at the bottom, and sand production into the wellbore, including sand carrying and sand settling could be observed.

2.2. Materials

Seized sand supplied by Guangzhou Marine Geological Survey (GMGS) was extracted from the core drilled at a depth of 1200 m below sea level from the Shenhu hydrate area in the South China Sea. Some properties of the sediment were measured. First, the sediment was dried thoroughly in a drying oven (Anker 101a-1e, (Shanghai Anting scientific Instrument Factory, Shanghai, China) at 375.15 K for more than 24 h. Then, the density and porosity of the dry samples were measured with the PoreMaster 60/30 (Quantachrome) (Quantachrome Instruments Ltd., Boynton Beach, FL, USA). The particles diameter distributions were determined using the Mastersizer 2000 laser particle size analyser (Malvern Instruments Ltd., Malvern, UK). The density and porosity of the sand were approximately 1.63 g/mL and 28.52%, respectively.
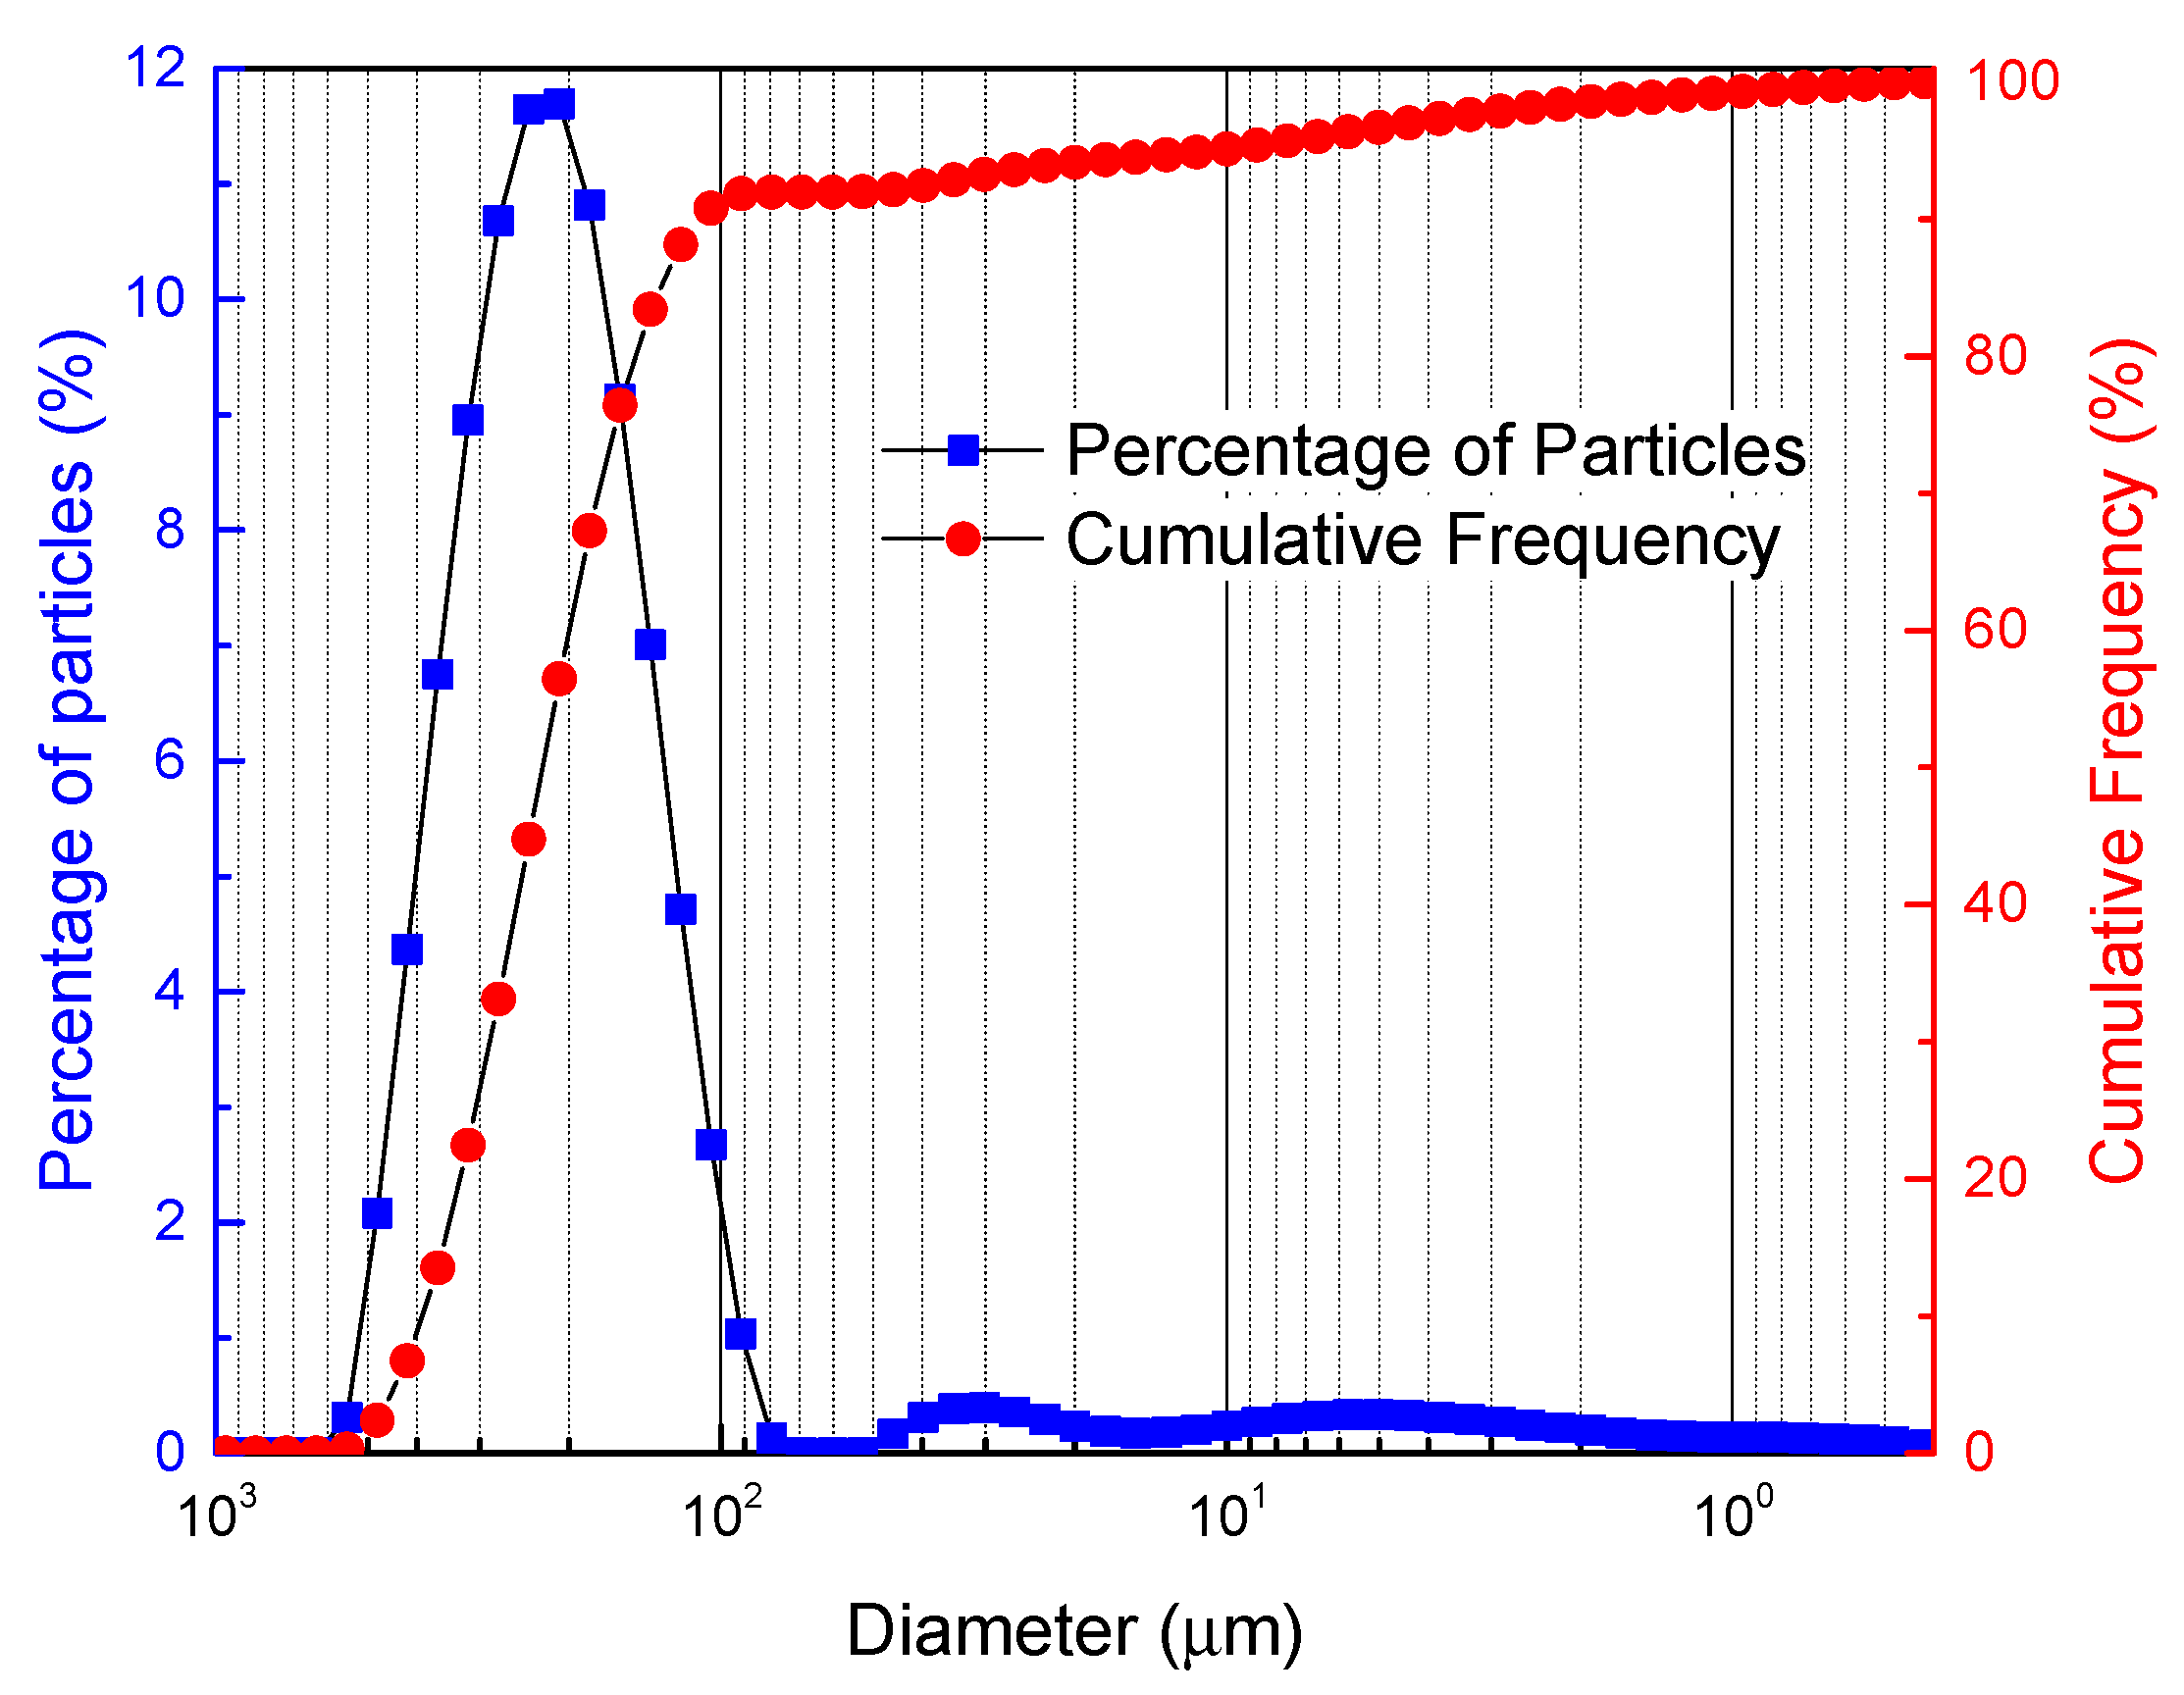
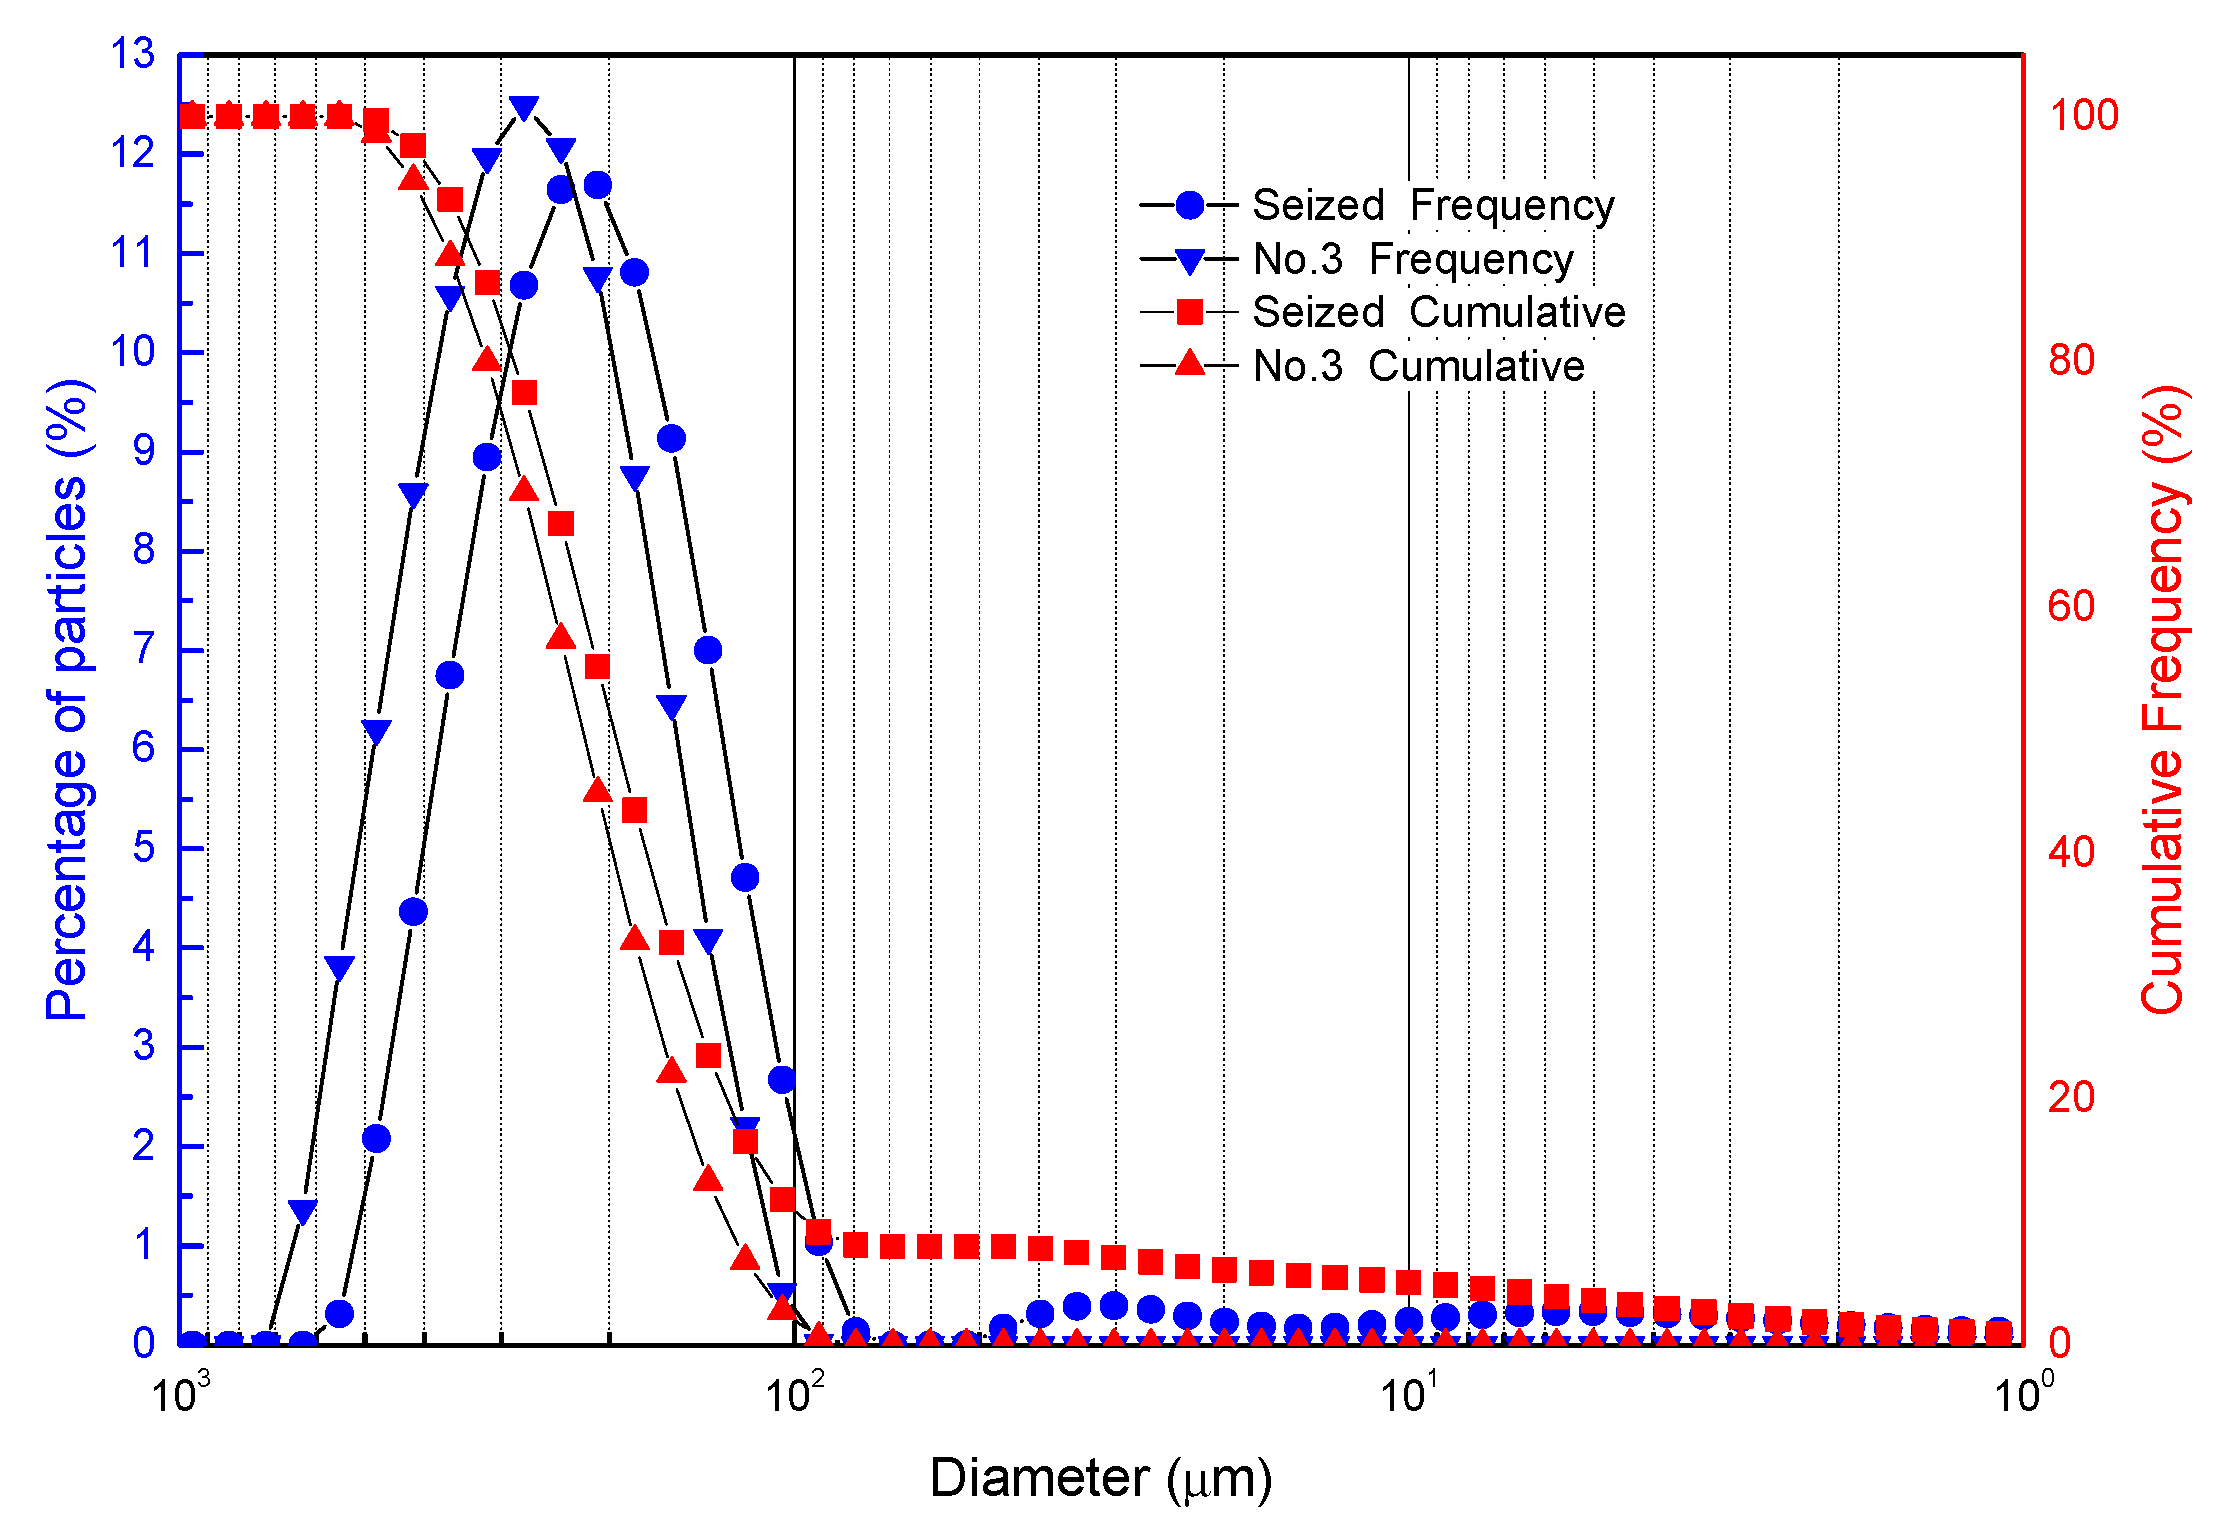
Figure 2 and Table 1 present the particle size of sand. The median diameter of the sand d50 is approximately 225 μm. Saucier’s sand control methods [41] were used to calculate the sand screen size D50 based on the median of sand size d50.
D50 = (5–6) d50
The sand screen size was 1250–1350 μm, which corresponds to a 14–16 mesh. Thus, the 12 mesh (1700 μm) was selected as the sand screen size for the sand production tests to provide adequate pathways for sand production and support for formation stability.

2.3. Experimental Procedure

Experiments were carried out successively in sandy sediment to confirm the reproducibility of the tests. These repeated experiments yielded the same phenomena and conclusions.
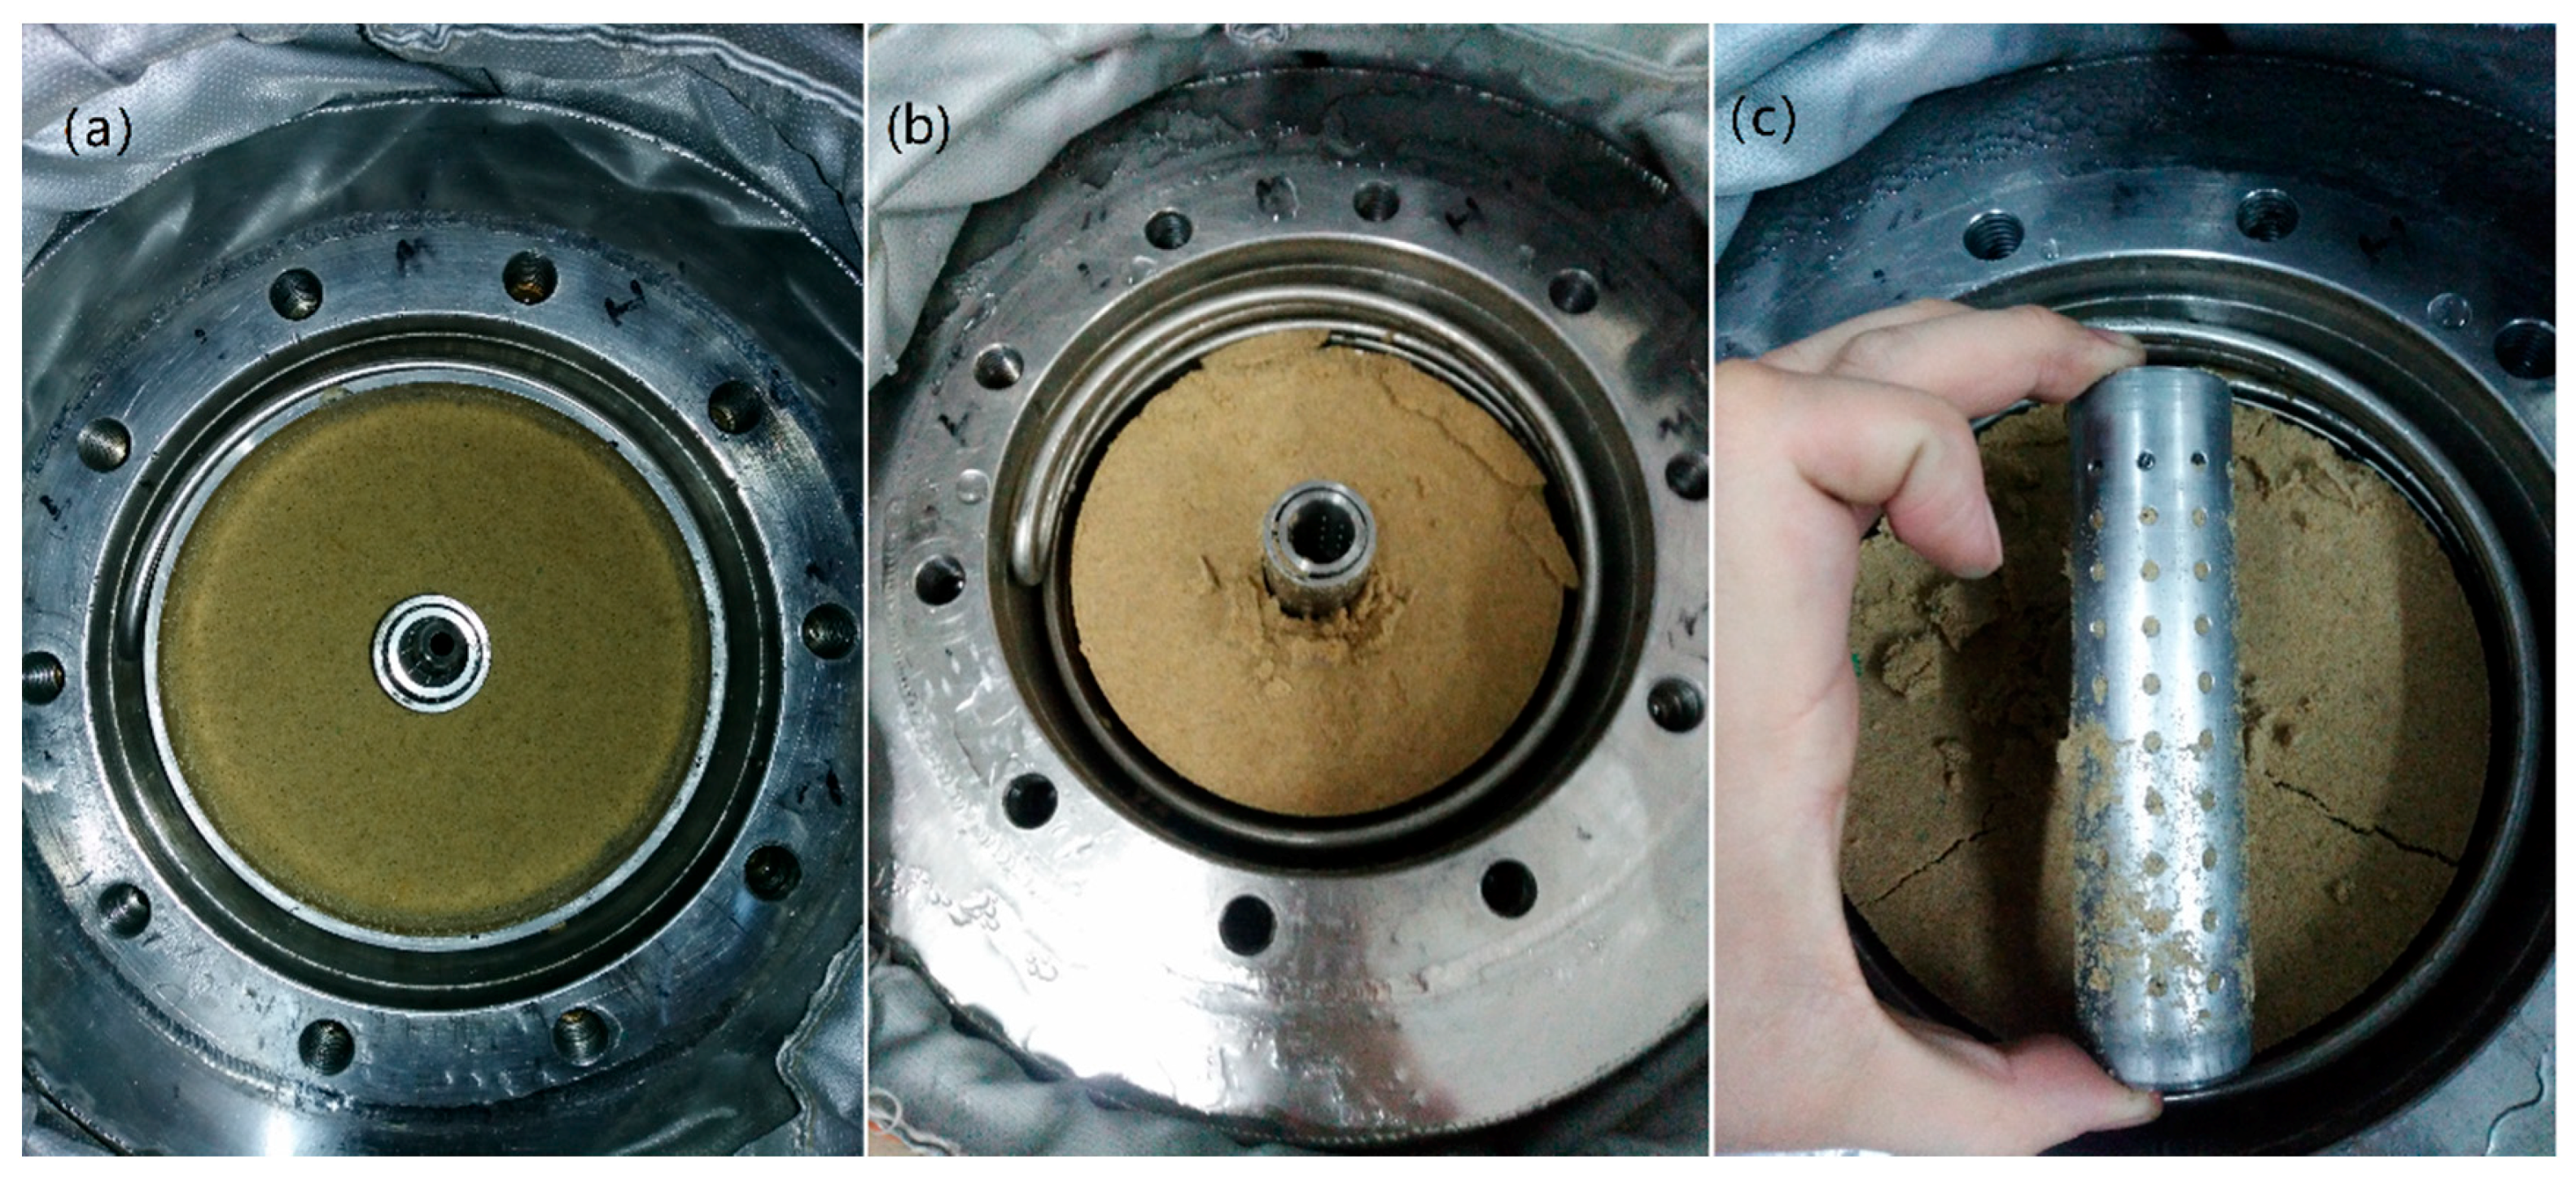
The sediment chamber was filled with the sediments by 2 kg dried sand and quantify deionized water mixed for 24 h (Figure 3a). The sediments were consolidated with the crustal stress loader at 12 MPa for 1 min with vacuuming. Then, methane gas was injected into the reactor and gas buffer tank at 11 MPa. The temperature of the water bath was maintained at 293.15 K for 24 h, to guarantee thorough mixing of sand, water, and gas. Next, the temperature of the water bath was set at 275.15 K to form the hydrates. The hydrate formation rate was considerably higher than that one-way or two-way gas-in at the circumference, while the grains promoted hydrate formation [42]. When gas pressure no longer decreased after approximately 48 hours of hydrate formation, the free gas was driven out of the reactor by deionized water cooled at 273.15 K similar to in marine systems. Pore pressure was maintained at 11 MPa by a constant-flux pump as free gas was forced out from the top. When the water came out of the top valve, the chamber was assumed to be water-saturated, and production experiments were carried out using the depressurization method by opening the automatic valve. The liquid and solid flowed into the gas-solid-liquid separator through the wellbore. Video was recorded through the visual window located in the gas-solid-liquid separator. The gas flow meter was applied to measure the separated gas; the water with sand was drawn out to the beakers; a part of the solid settled down at the bottom of the separator. Throughout the experiments, the experimental system was maintained either at a constant crustal pressure of 12 MPa or no crustal pressure. Table 2 lists the critical conditions for the experimental parameters. As gas was produced, the hydrate gradually decomposed, while water with sand was drawn out to the beakers when the visual window was blocked. The end of the production process was marked by a cessation of gas production.
After production, the weight of the beakers with the water-sand, and the dried beakers with the sand were measured using an electronic balance. The sand content in the water was evaluated according to the production time, and the sand production rates in different hydrate depressurization periods must be determined. The sand rate s (%) in water was calculated:
s = W s d f W w f
where W w f is the weight (g) of the production water in a beaker, W s d f is the weight (g) of the dry sand in the same beaker, and the weight of the beaker was substrated.
The initial water rate w (%) is important to evaluate the hydrate volume at the beginning of experiment:
w = W w i W w i + W s d
which is calculated with the initial water weight W w i (g) and dry sand weight W s d (g).
A property of hydrate sediments, the final hydrate saturation S h f (%) was calculated from the final standard state production volume V g (L). All the free gas was assumed to turn into hydrate. However, the final hydrate saturation differed from the initial ideal hydrate saturation S h i (%) in accordance with the initial water volume V w (L) and pore volume V p (L).
S h f = V g 164 / V p
S h i = V w / V p
V w = W w i / ρ w
V p = V s
where the density of water ρ w is 1000 g/L; (%) and V s (L) are the sediments porosity and sediments volume in chamber.

3. Results

3.1. Pressure Characteristic and Production Periods

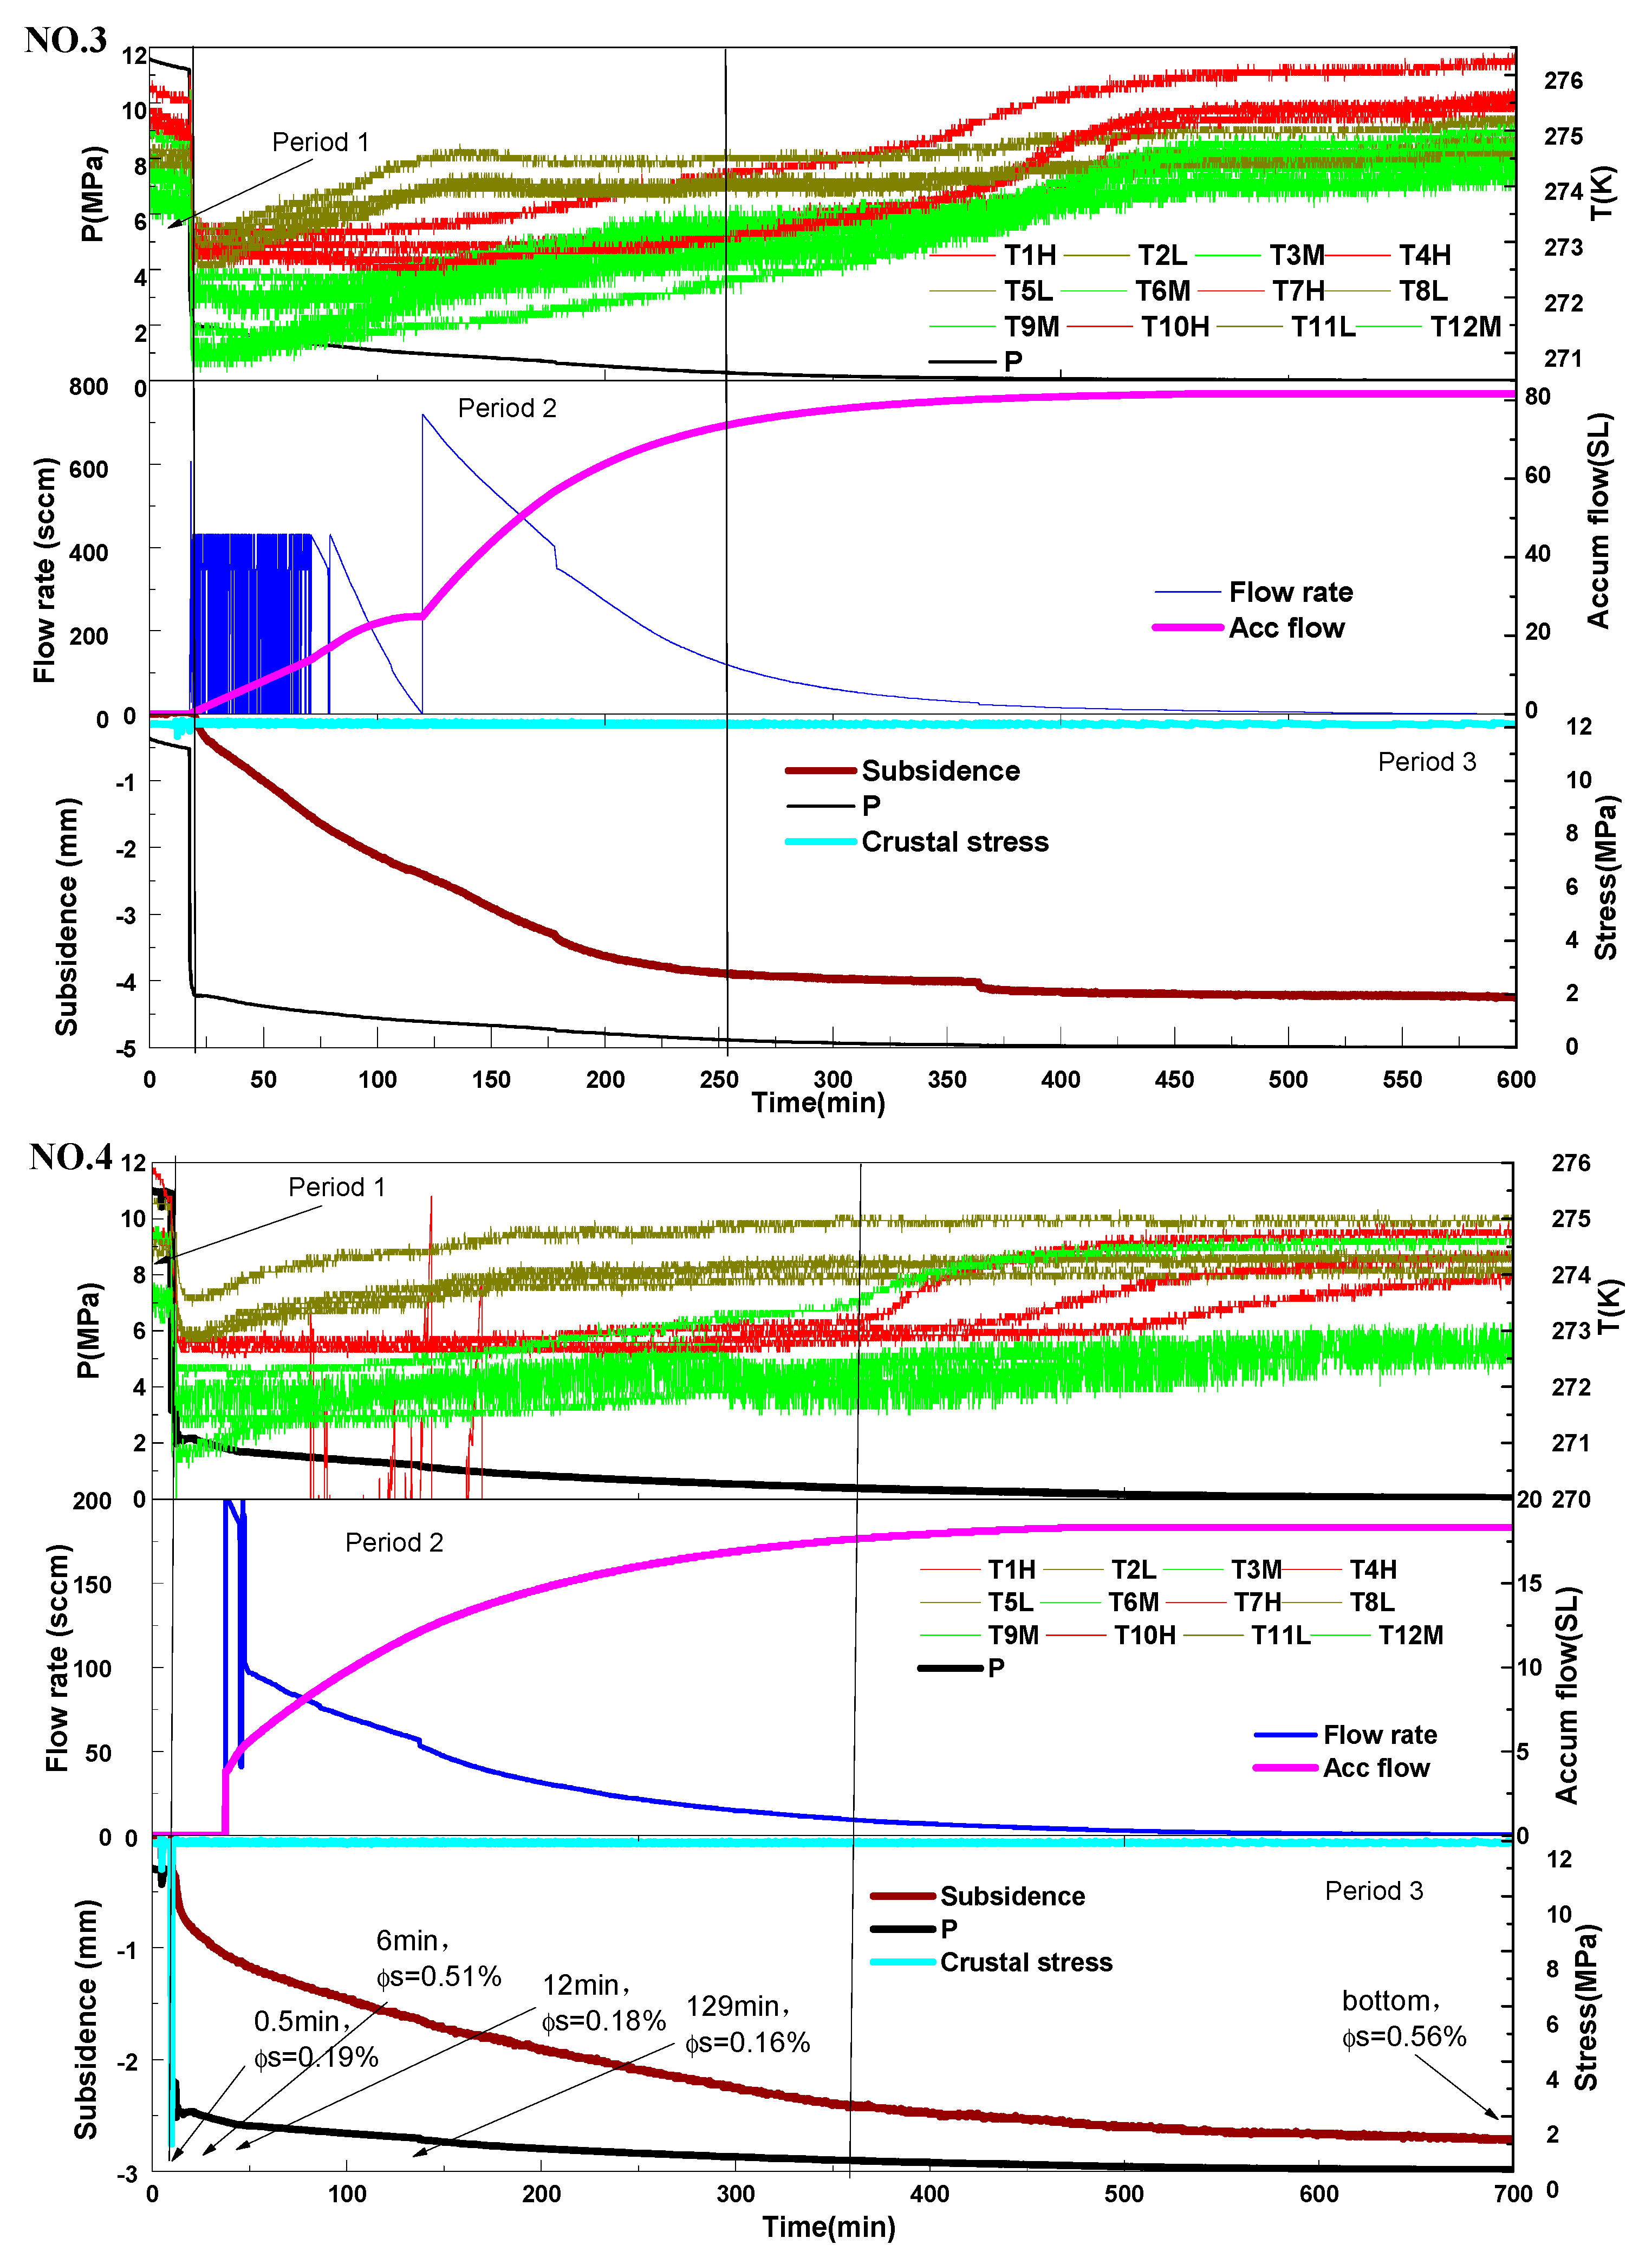
The results of five experiments are shown in Figure 4 and Table 2. Although the hydrate distribution in the sediments was discontinuous [43], these tests could be divided into three production periods.
In the first production period, the temperature and pore pressure dropped during depressurization by water production. The pore pressure rapidly reduced to the hydrate decomposition pressure, which means that the pore pressure was maintained by the gas pressure. Unstable gas production may be due to low permeability, which indicates insufficient gas channels and gas supply. During this period, the production rate of water-sand was more than 60 g/min.
In the second period, the pore pressure gradually dropped below the hydrate decomposition pressure, and the gas production rate reached its peak. The gas supply and permeability increased as the hydrate decomposed. At the same time, reduction in the volume of water was observed in the visual gas-liquid-solid three-phase separation system. The water production rate increased to approximately 3.33 g/min compared with that at the beginning of the second periods (approximately 1 g/min).
In the third period, the gas production rate showed a decay curve, and not much water was produced. More than 5 min were required to produce 5 g of water (less than 1 g/min).
In Experiment No. 1, the well was shut-in at 15 min, and production recommenced at 42 min. The temperature and pressure recovered in the duration between 15 and 42 min. Sudden subsidence was measured at 217 min when the crustal stress was attempted to be maintained at 1 MPa.

3.2. Temperature Related Characteristics

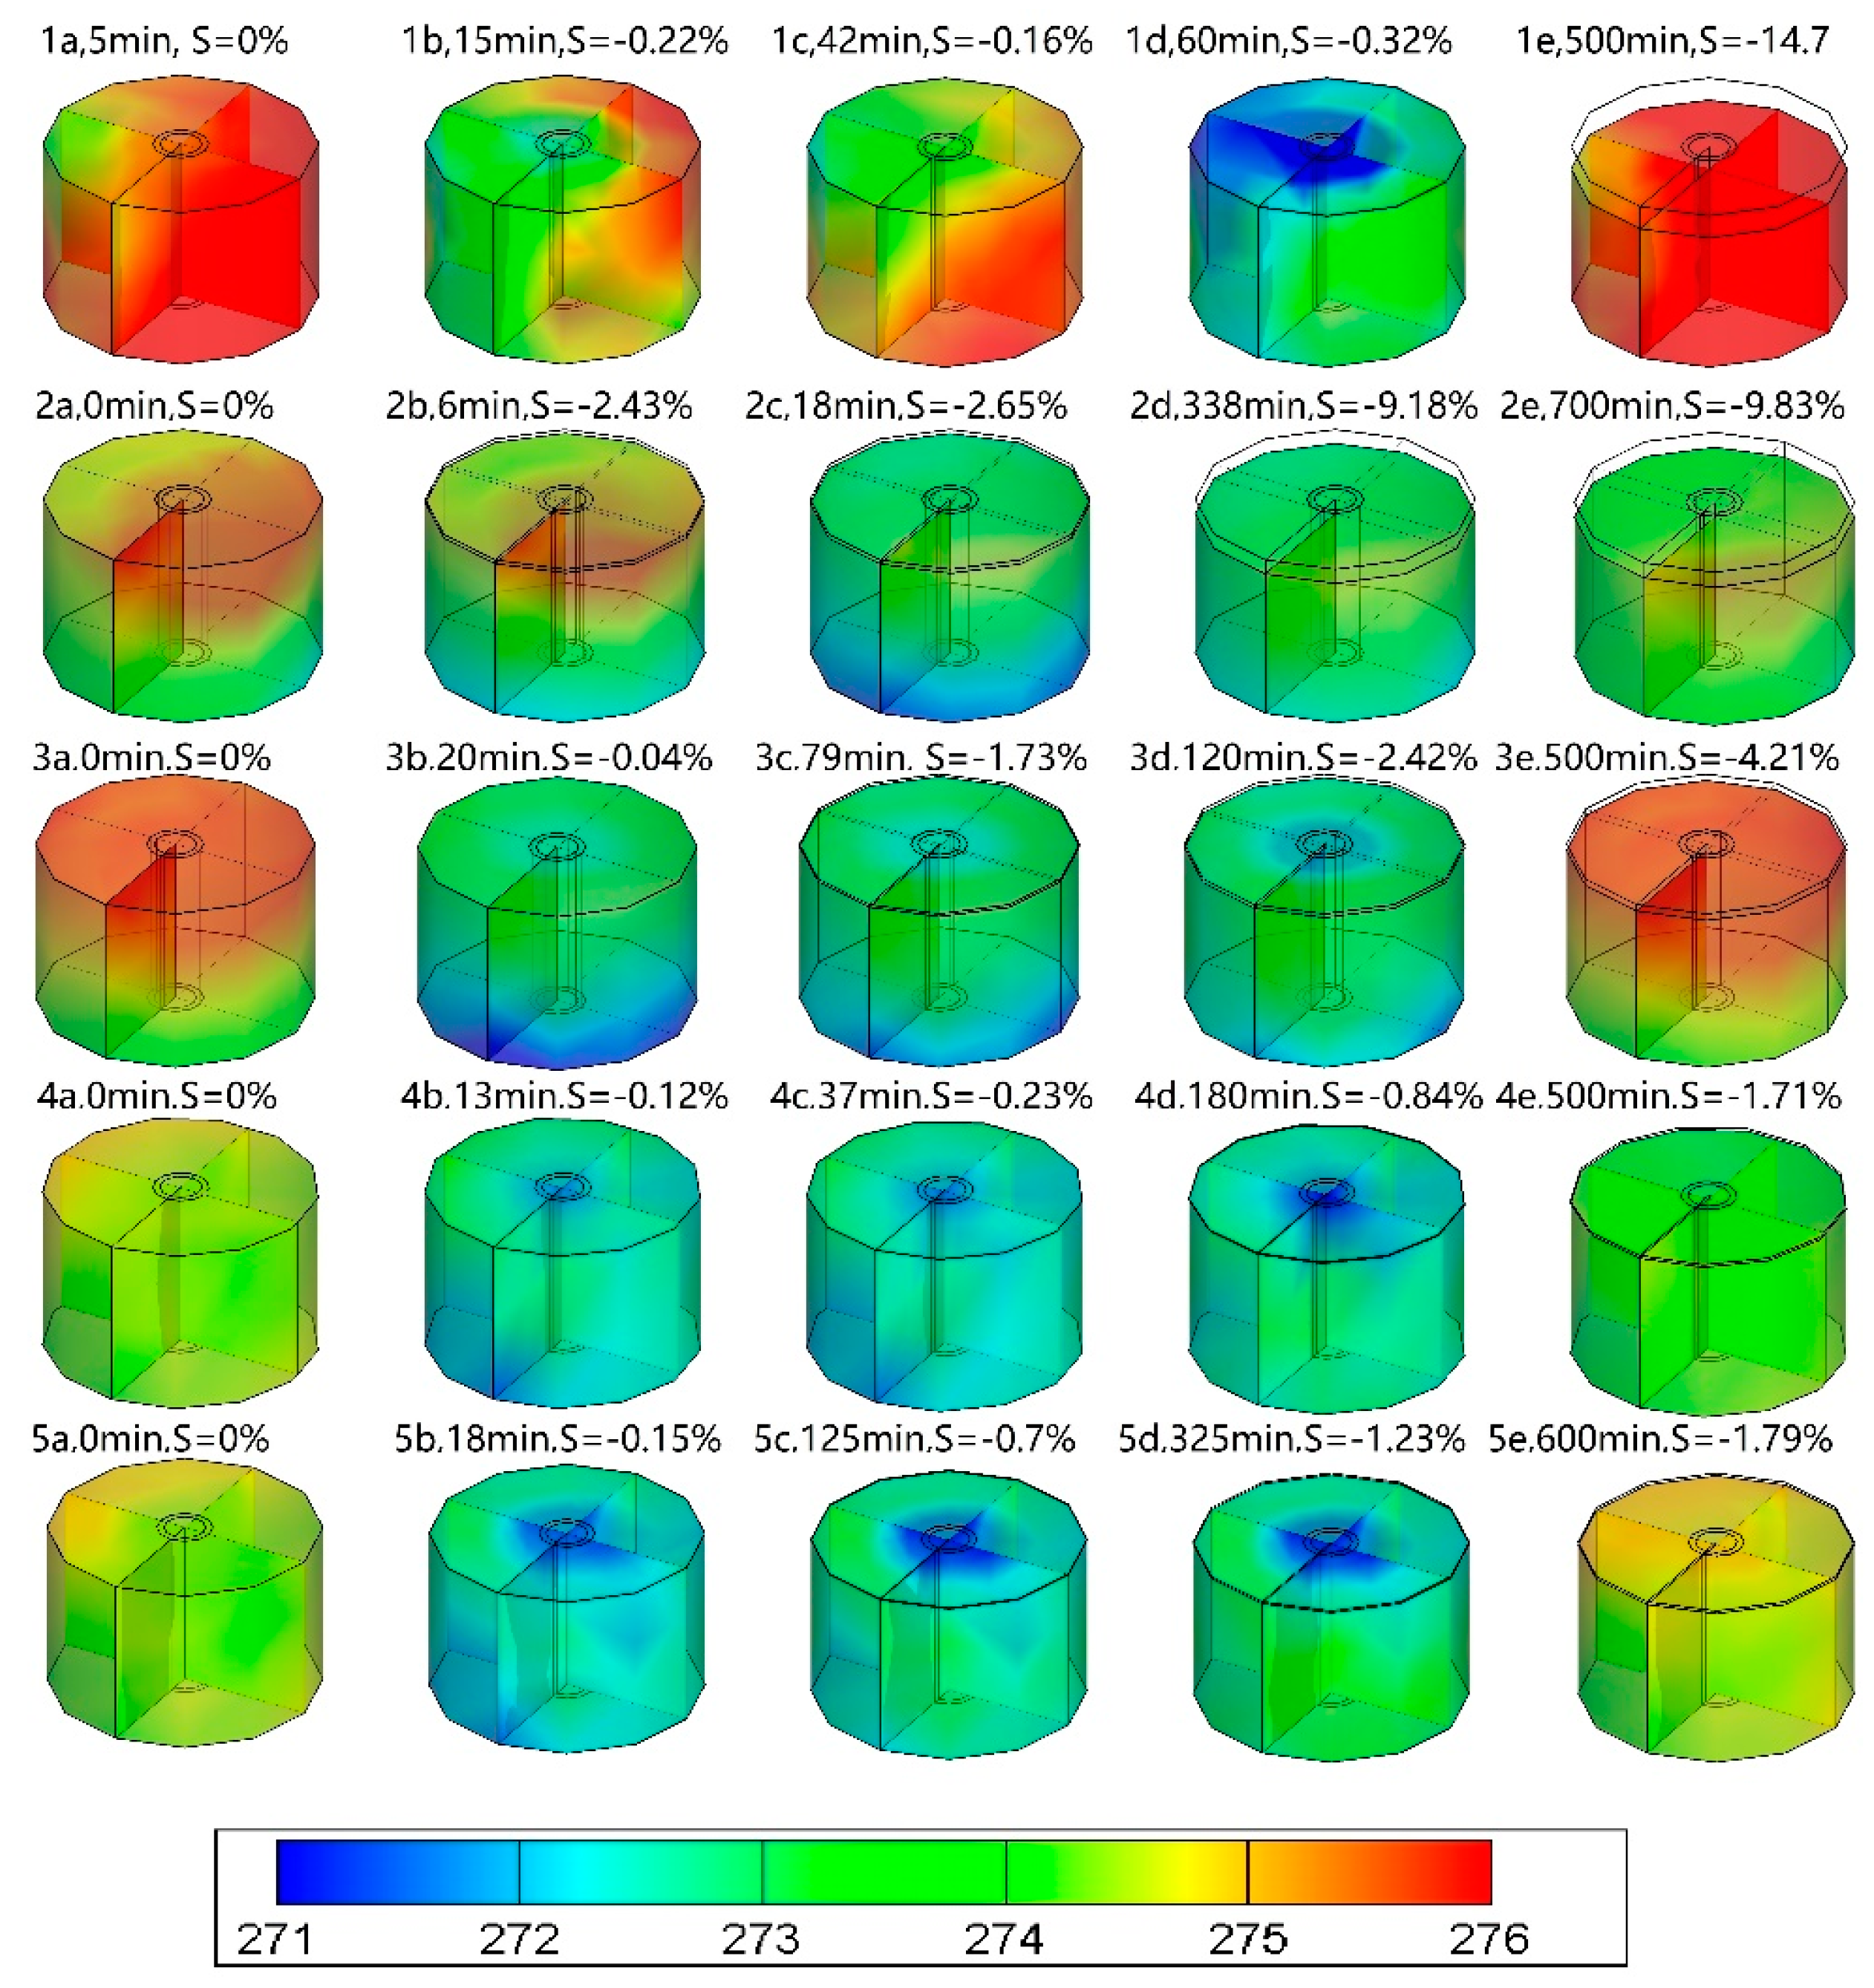
Figure 5 shows the distributions of the spatial temperature for the five experiments. Because the five tests had varying durations, temperature was measured at specific time points for each (0 min, 15 min, 42 min, 60 min and 500 min for No. 1, 0 min, 6 min, 18 min, 338 min, 700 min for No. 2, 0 min, 20 min, 79 min, 120 min and 500 min for No. 3, 0 min, 13 min, 37 min, 180 min and 500 min for No. 4, and 0 min, 18 min, 125 min, 325 min and 600 min for No. 5). The initial, minimum and recovery temperatures were recorded for each experiment. The initial temperature was approximately 275.13 K for all five experiments (Figure 5(1a–5a)). In general, low-temperature areas were concentrated around the wellbore; as the sediments temperature decreased closer to it. The temperatures of the bottom layer L and top layer H were smaller than that at the middle layer M because the wellhead was set in the bottom layer, the water bath was around the middle-layer, and the wellbore was connected to the top-layer.
During the first production period of the experiments, the temperature of the sediments decreased slightly (Figure 5(1b–5b)) due to water production. According to the thermodynamic theorem, the fluid expanded to do work, leading to a reduction in temperature. Subsequently, the temperature of the produced fluid was lower than the ambient temperature, and heat was removed from the wellbore by conduction, so the temperature decreased. The temperature in the surrounding reactor wall thereby decreased owing to thermal diffusion. In experiments No. 2 and No. 5, gas production was immediately detected from the beginning. Thus, the decrease in temperature was also facilitated by the endothermic hydrate decomposition (Figure 5(2c,5c)). In Experiment No. 1, the well shut in at 15 min, and the temperature recovered from 15 min to 42 min (Figure 5(1c)).
During the second production period, endothermic hydrate decomposition caused the temperature to further decrease. Because system pressure dropped with production pressure, the temperatures in both systems reached their minimum values (Figure 5(1d,3c,4c)).
During the third production period, the temperature decreased around the wellbore, but the temperature of the reactor walls (boundaries) gradually recovered, compared to in the second production period (Figure 5(2d–5d)). This occurred because methane is less thermally conductive than water, and there was less water in the sediments
Immediately before the end of production, the rate of heat absorption was equal to the heat exchange rate with the ambient environment. Finally, the temperature gradually recovered to the ambient temperature (Figure 5(1e–5e)).

3.3. Sand Production in Hydrate Production Tests

3.3.1. Sand Production in Hydrate Production Periods

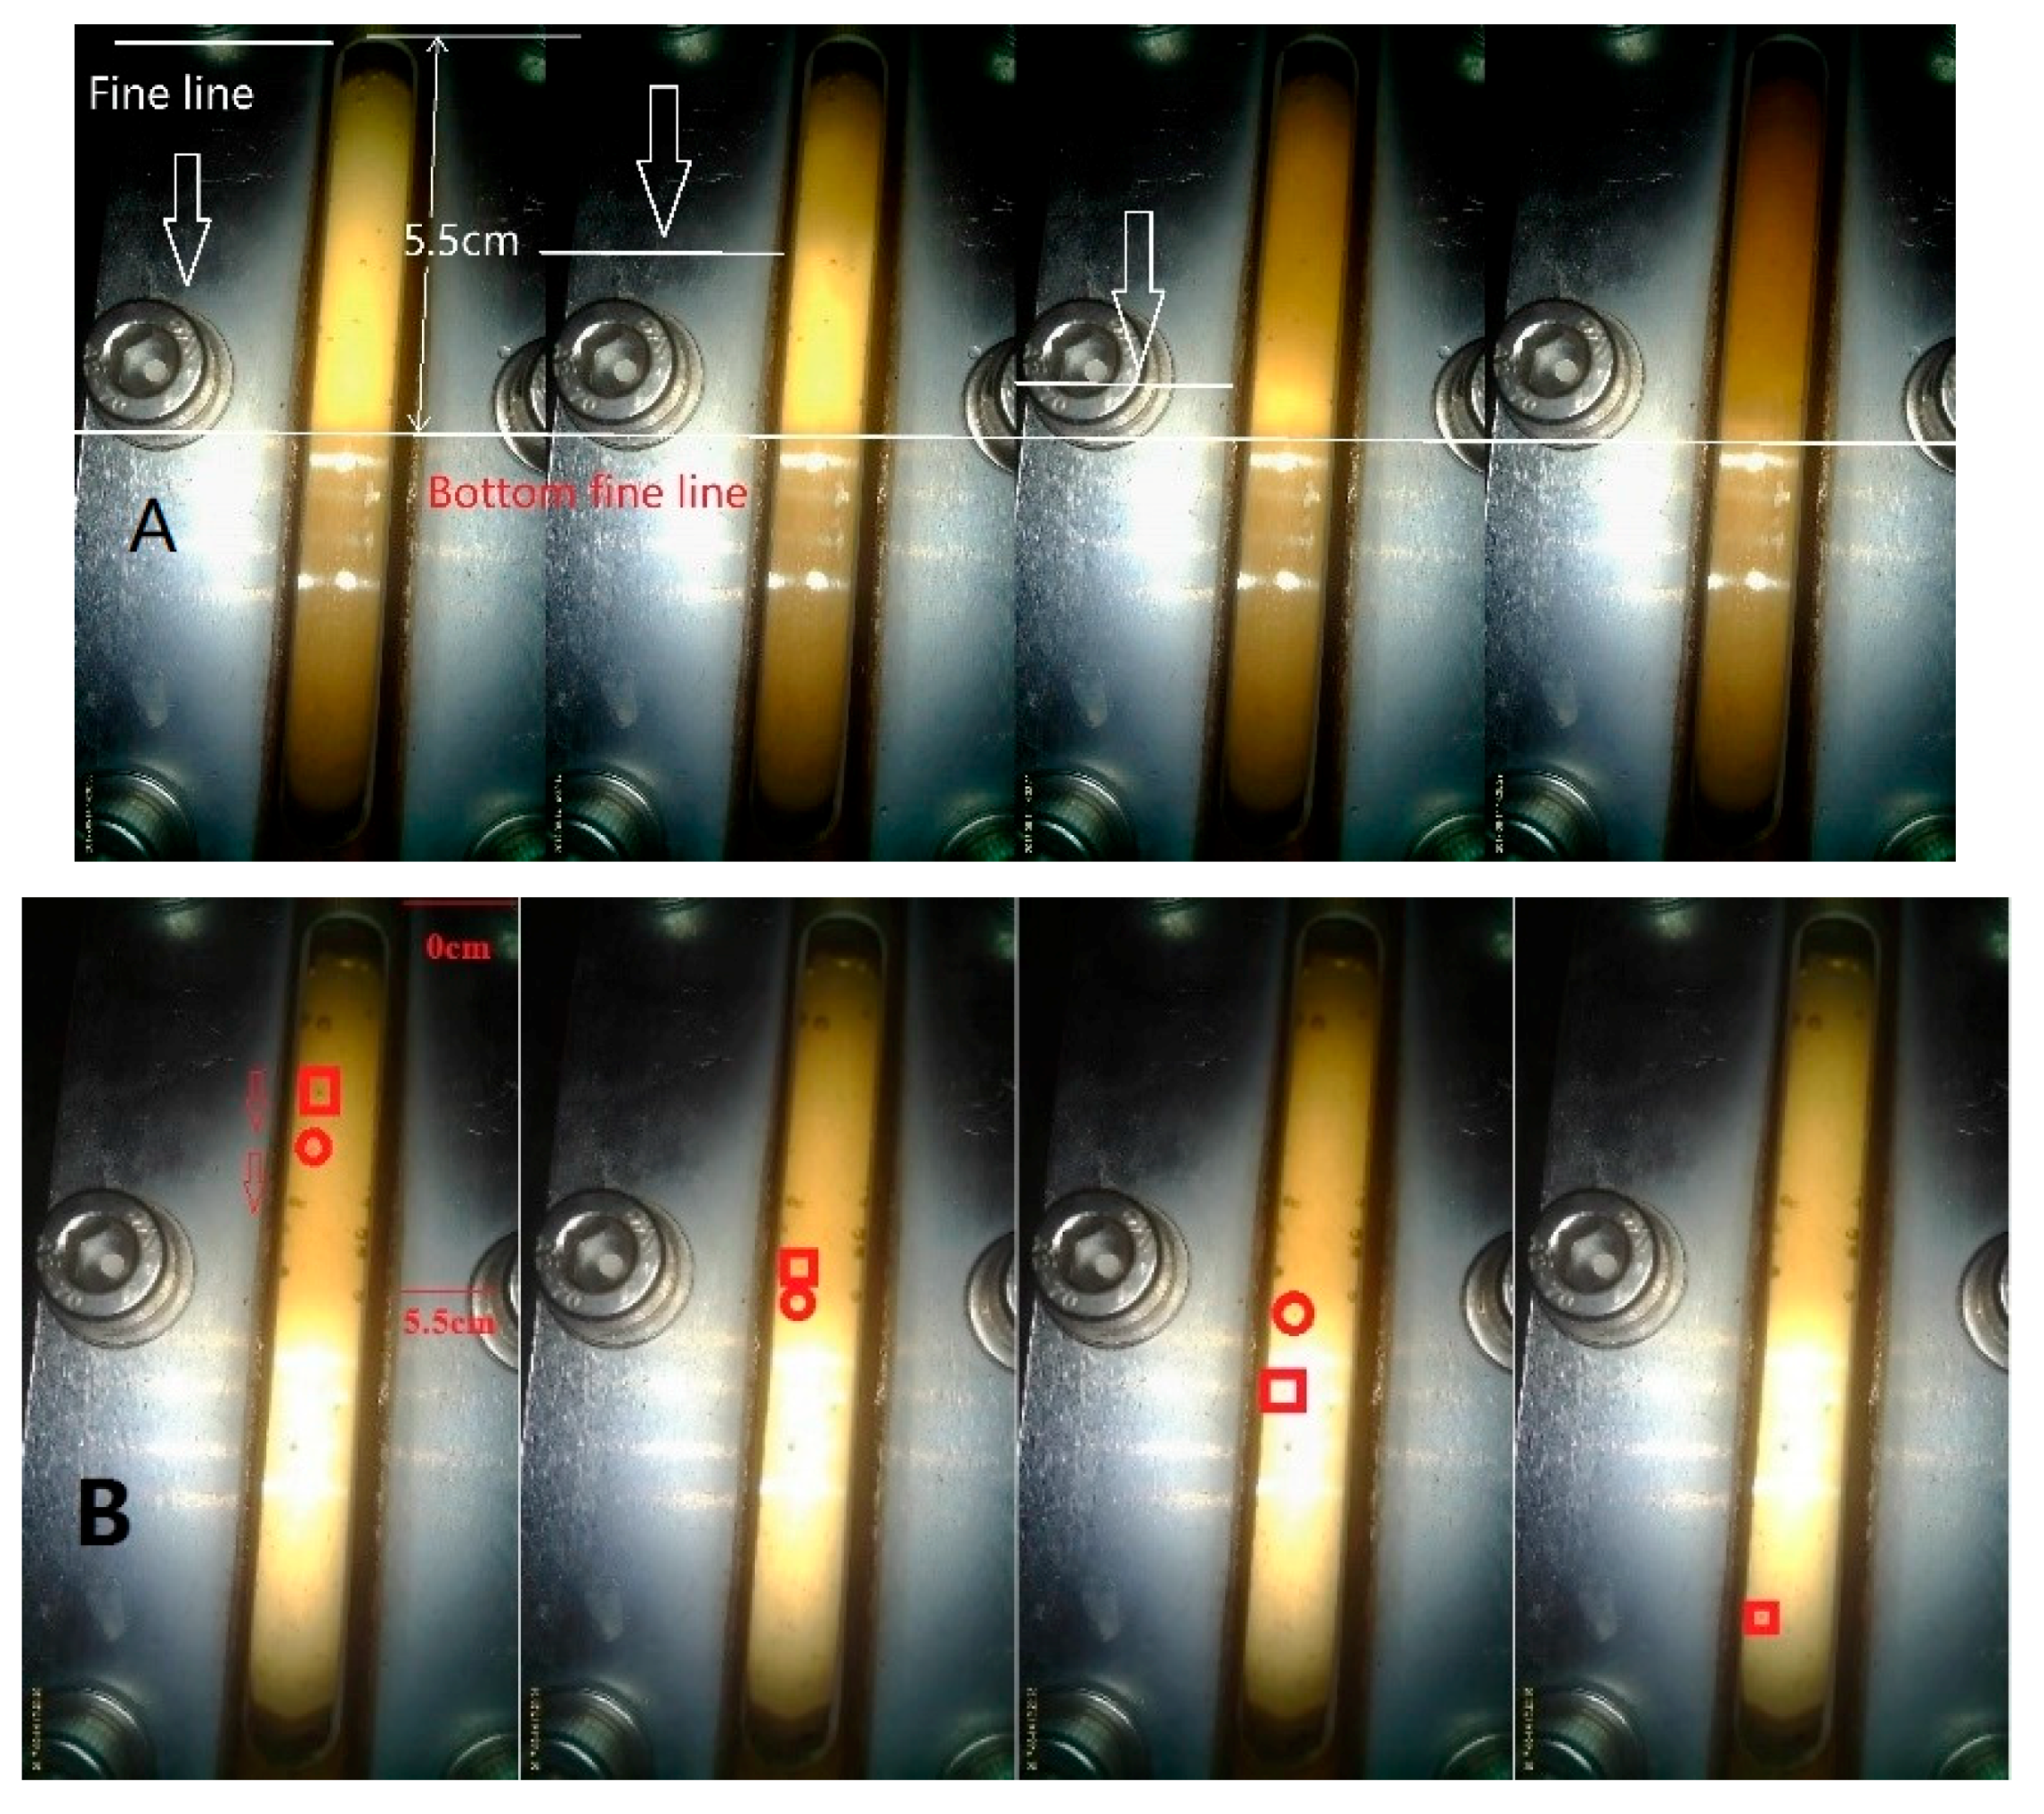
Figure 4 shows the results of experiment No. 2. In the first production period, the pore pressure and temperature dropped to 2.5 MPa and 273 K, respectively, at the beginning of depressurization as up to 400 sccm of water was produced with the unstable free gas (first production period). The low permeability of the hydrate layer may have rendered the rate of gas production unstable. At 80 min and 140 min, the gas production rate was up to 700 sccm, and a stable decay curve for the gas production rate was observed. The total gas production was 153.35 L. The subsidence of the sediment was approximately 9 mm, for a subsidence rate of 9% and total sand production of 17.29 g. The sand content in the produced water was 0.3%. The production of whole fine sand (Figure 6A) and sand grains (Figure 6B) were detected at 24 min (i.e., first production period) and 200 min (i.e., second production period), respectively. As shown in Figure 6A, the fine sand production line (red line) gradually dropped as a whole in the window. In Figure 6B, the grain in the square fell faster than that in the circle, which indicates that the grains were of different sizes. A comparison with Figure 6A shows that these two grains were considerably larger than fine sand, and might have been a part of the skeleton sand cemented by hydrate in the first production period but produced by hydrate decomposition in the second. These results highlight two sand production periods: (1) fine sand production by water and unstable gas; (2) sand grain production by gas and water drops.
The subsidence and sand production rates in water for the third production period were lower than those in the previous production periods. No distinct evidence was found for sand production by shear failure with increased production differential pressure. The fluids could not provide sufficient driving force for sand production.

3.3.2. Size of the Produced Sand and Sand Rates in the Production Water

As shown in Figure 7, the median size d50 of the produced sand in No. 3 was 0.198 mm, which was smaller than the median size of the sieved (0.225 mm). There are three possible reasons for the reduction in grain size: First, sand arching could have developed in the liner hole that blocked large grains of sand [14,15]. Sand was observed in the liner hole (Figure 3c). This can be considered sand optimisation in that shortening the path of sand migrating. The same concept has been used for gravel-packing sand control [14,15]. Second, large sand grains could not be carried into the wellbore by the fluids. Because these larger sand grains cemented with hydrate would suffer crustal stress like the skeleton, they would be difficult for the fluid to carry them in the first production period. Third, although the amount of cemented methane hydrate decreased in the second production period, the gas flow could not carry large sand grains. Meanwhile, the large grains could not pass through the narrow migration path because of the sand arch built in the first production period.
Figure 4 shows the results for experiments No. 4 and No. 5. The rates of sand in water s were measured according to the production time. In experiment No. 4, the sand rates in the beaker were 0.19%, 0.51%, 0.18%, and 0.16% at 0.5 min, 6 min, 12 min and 129 min, respectively. The sand rate in water at the tank bottom was 0.56%. In the first production period, the sand rate was 0.19% (0.5 min); the fine sand migrated with water production. Then, the sand rate dramatically increased to 0.51% at 6 min in the second production period. Next, the sand rates reduced to 0.18% at 12 min and 0.16% at 129 min. These values can be considered to represent stable sand production in the second production period. The fine sand suspension rate was stable, and sand grains fell to the bottom. At the tank bottom, the sand rate in water was up to 0.56%. A similar grain size was measured in experiment No. 3, as shown in Figure 7. In experiment No. 5, the sand rates in water were 0.06%, 0.08%, 0.1% and 0.13% at 2 min, 30 min, 85 min and 305 min, respectively, and the sand rate in water at the tank bottom was up to 0.78%. The results were similar to those of experiment No. 3.

4. Discussion

4.1. Driving Force and Mechanism of Sand Production during Hydrate Exploitation

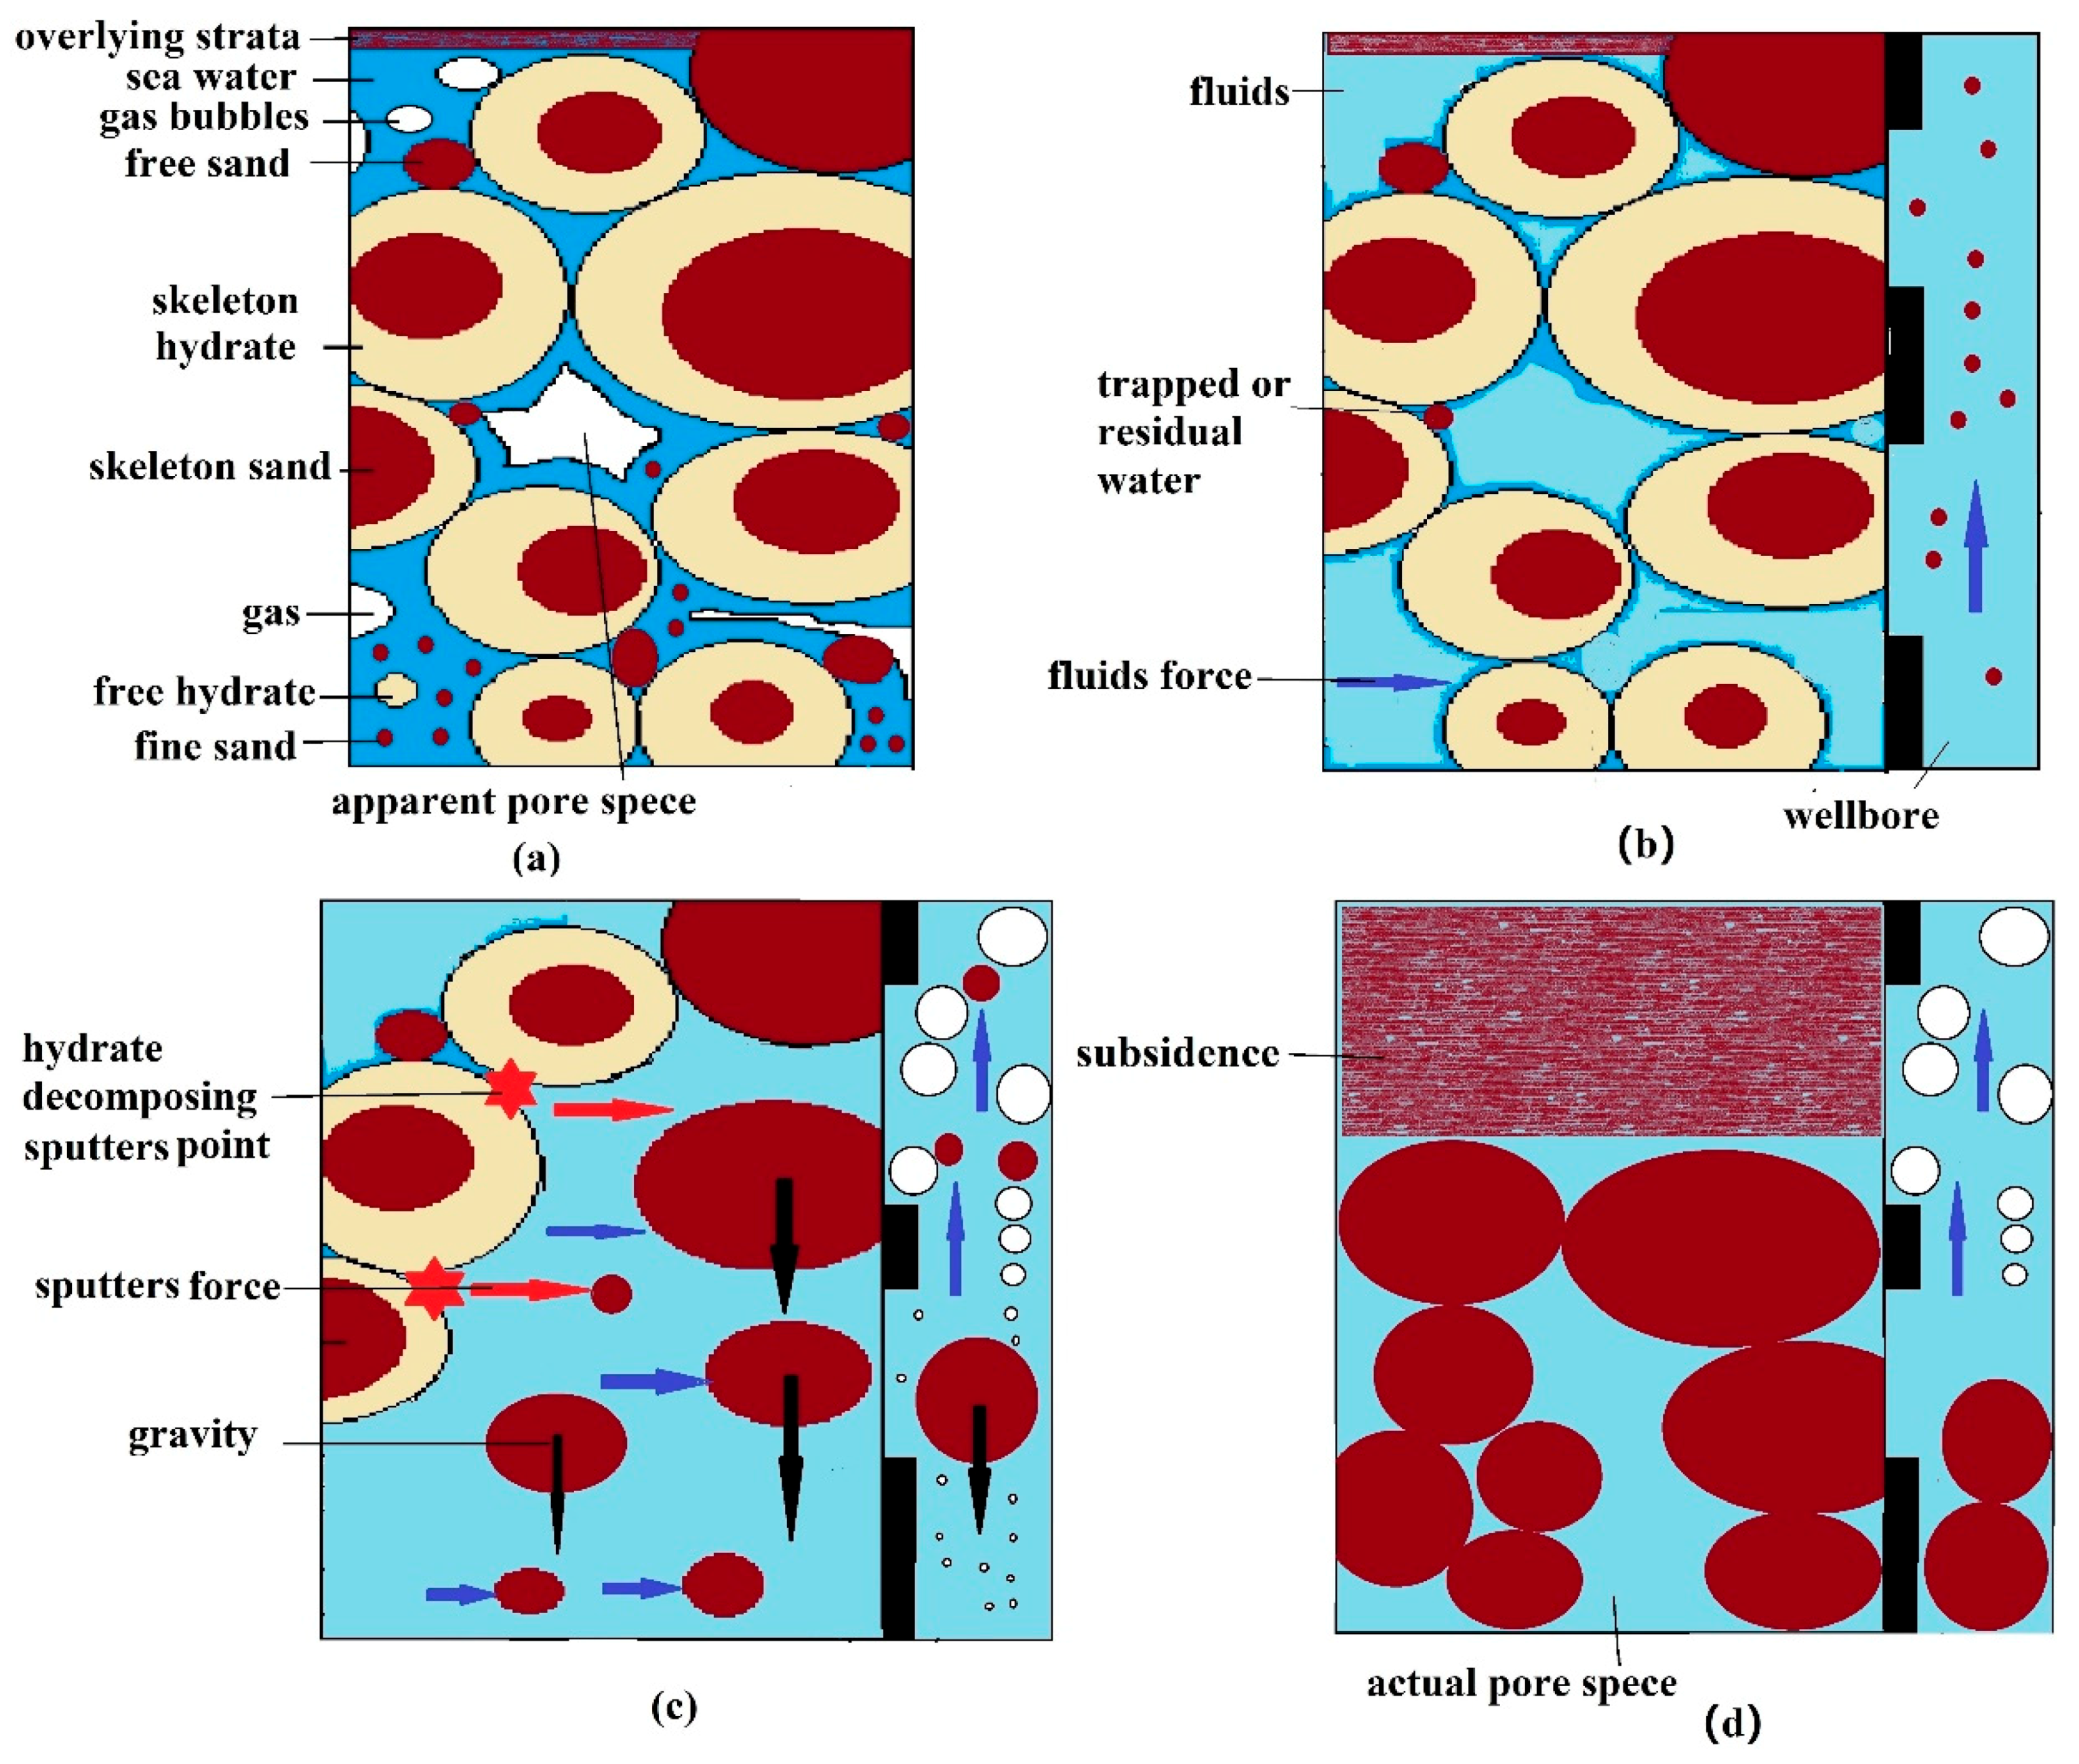
There are various types of methane hydrate systems in nature [3]. In this study, we focus on free hydrate, skeleton hydrate with cemented sand and skeleton hydrate without cemented sand (Figure 8a). Compared with the conventional petroleum industry, the unique process adopted in this work was the decomposition of solid hydrate into water and methane. Researchers have used hydrate dissociation to examine the outburst during gas hydrate dissociation [44]. The outburst force may separate the cemented hydrate from sand, and provide a driving force for sand migration. In the laboratory, sputtering is commonly observed during pure hydrate decomposition. Thus, the hydrate also sputters in the sediment. Sediment deformation and sand production may be caused by the radial gas-water flow and hydrate cementation effect, which are influenced by the radial shrinkage effect of hydrate decomposition (RASHEHD) [45]. In Figure 8c, the red stars represent the possible dissociation points of hydrate and sand. Dissociation not only softens cementation, but also applies a slight force on the sand and fluid. Similar to a butterfly effect, this small force promotes sand migration, which can lead to sand production and submarine landslides. For decomposing free hydrate in pores, this slight force may be transferred to the fluid and nearby solids. As the strength of skeleton hydrate decreases, the slight force provides a driving force for the migration of solids. When the dissociated methane gas separates from the hydrate as bubbles, the surface and adhesive forces of the bubble may increase the sand carrying capacity compared to in conventional gas wells. The dissociated water from the hydrate increases the water cut; it may reduce the strength of the skeleton sand, soften hydrate-sand cementation, and increase sand carrying capacity by increasing the viscosity of gas flow. The dissociation of the hydrate changes the pore space from apparent to actual, which increases the porosity and permeability of the sediment [46,47]. This produces migration channels for gas, water, and sand.
In the first production period, the main driving force for sand production was the fluid flow. The flow of water drove the free sand and the free hydrate. When not too much skeleton sand and skeleton hydrate were driven out because of the low permeability and hydrate sand cementation (Figure 8b), sand arching was constructed in the liner holes. The fine sand went through the sand arch and fell as a whole in the visual window (Figure 6).
In the second production period, gas flow rate increased with the permeability and porosity due to hydrate dissociation. The trapped, residual and dissociated water reduced the strength of the sediments and softened the hydrate-sand-cementation. The enhanced production pressure differential induced shear failure near the wellbore. The promotion of a high-speed gas flow rate, caused the gas flow to carry water and sand grains into the wellbore (Figure 8c). This was observed as water drops and grains fallen in the visual window when high-speed gas production was detected by the gas flowmeter.
In the third production period, although the production pressure differential was larger than that in previous periods, the hydrate saturation was low; thus, the dissolved gas flow and residual water may not have provided enough driving force to carry the sand migration. Thus, the sand gradually fell to the bottom of the wellbore (tank) (Figure 8d).
On the whole, the above mentioned unique characteristics of hydrate wells can increase the risk of sand production compared with that in gas wells.

4.2. Subsidence of Hydrate-Bearing Sediments with Sand Production

As shown in Figure 4 and Figure 5, the sediment showed drastic subsidence with decreasing pore pressure due to water production in the first production period. It subsequently showed subsidence with gas production in the second production period. The third production period did not yield much sediment subsidence. The final subsidence of the hydrate-bearing sediment when crustal stress was not maintained was extremely high at over 10 mm (10%) (Figure 5(1e,2e)). The final amount of sand produced when crustal stress was not maintained was also large. As shown in Figure 3 and Figure 5), the loss of crustal stress might have provided more space for sand migration, in which higher sand production led to higher subsidence. Maintaining the crustal stress increased the production pressure differential but also increased the consolidation pressure. When there was no wellbore collapse or sudden collapse of the sediment, the subsidence was no more than 5 mm (5%) (Figure 5(3e–5e)). However, sudden subsidence was observed in experiment No. 1 at 217 min, where the crustal stress was attempted to be maintained at 1 MPa (Figure 4 No. 1). The increased crustal stress caused the sediment to collapse because the hydrate-sand-cementation was low. Thus, maintaining the crustal stress of hydrate layers during hydrate exploitation is crucial. When the No. 1 well shut-in, the subsidence recovered with increasing pore pressure (Figure 5(1c)).
Figure 4 and Figure 5 show that the heat transfer and temperature characteristics of hydrate layers should be considered with the subsidence of hydrate sediments because dynamical thermal properties are coupled with dynamic sediment deformation. The hydrate layers subsidence affected the performance of the hydrate layers’ thermal conductivity and seepage characteristics which would determine the temperature change and recovery of hydrate layers. Thus, future experimental and numerical studies should consider the thermal properties and material balance of hydrate-bearing sediments during exploitation with sediment deformation and sand production. The deformation of sediments could be measured in experiments or simulated by the constitutive model, and this could be incorporated into the dynamical thermal models, whereas, the material balance loss and heat loss by the sand production and sand settlement could be measured in the laboratory. In the numerical simulation, the hydrate production in laboratory scale might be extended to that in the field scale.

5. Conclusions

In this study, tests were performed to examine sand production during methane hydrate exploitation with synthetic sandy sediment. Hydrate production periods and sediment subsidence with sand production behaviours were investigated. The following conclusions were drawn based on the experimental results:
(1)
Three hydrate production periods were observed; water production by depressurization, gas production with water drops, and low gas production.
(2)
The sand production phenomena were different during different hydrate production period. Production of whole fine sand and sand grains was noted in the first and second periods, respectively, and no significant amount of sand was produced in the third period.
(3)
Sputtering unique to hydrate decomposition may provide the driving force for sand migration. The flowing gas bubbles and water from hydrate decomposition enhanced the sand carrying capacity and reduced the strength of hydrate-sand cementation and skeleton solids.
(4)
From the experiments, the subsidence of hydrate-bearing-sediments could be over 10% with sand production. Thus, higher sand production led to the higher subsidence. The loss of crustal pressure may increase the subsidence. The dynamic subsidence of the hydrate layers and sand production alter the seepage characteristics, thermal properties and material balance of the hydrate layers. The temperature related characteristics are affected by hydrate production periods. The final subsidence of the hydrate-bearing sediment when crustal stress was not maintained was very high at over 10 mm (10%). When there was no wellbore collapse or sudden collapse of the sediment, the subsidence was no more than 5 mm (5%).

Author Contributions

J.L., D.L. (Dongliang Li) and D.L. (Deqing Liang) conceived and designed the experiments; J.L., D.L. (Dongliang Li), X.S. and Q.W. performed the experiments; J.L., D.L. (Dongliang Li) and D.L. (Deqing Liang) analyzed the data; Y.X. contributed materials and revised the manuscript; J.L. wrote the paper.

Funding

This work is supported by the National Key Research and Development Program of China (Grant No. 2017YFC0307305), National Natural Science Foundation of China (51661165011, 51474197 and 41473063), and Natural Science Foundation of Guangdong (2017A030310448).

Conflicts of Interest

The authors declare no conflict of interest.

References

  1. Sloan, E.D.; Koh, C.A. Clathrate Hydrates of Natural Gases; CRC Press: Boca Raton, FL, USA, 2007. [Google Scholar]
  2. Tohidi, B.; Anderson, R.; Chapoy, A.; Yang, J.; Burgass, R.W. Do we have new solutions to the old problem of gas hydrates? Energy Fuels 2012, 26, 4053–4058. [Google Scholar] [CrossRef]
  3. Boswell, R. Engineering. Is gas hydrate energy within reach? Science 2009, 325, 957–958. [Google Scholar] [CrossRef] [PubMed]
  4. Saeki, T. Road to Offshore Gas Production Test—From Mallik to Nankai Trough. In Proceedings of the Offshore Technology Conference, Houston, TX, USA, 5–8 May 2014. [Google Scholar]
  5. Collett, T.S. Reservoir controls on the occurrence and production of gas hydrates in nature. In Proceedings of the Offshore Technology Conference, Houston, TX, USA, 5–8 May 2014. [Google Scholar]
  6. Collett, T.; Bahk, J.-J.; Baker, R.; Boswell, R.; Divins, D.; Frye, M.; Goldberg, D.; Husebø, J.; Koh, C.; Malone, M. Methane hydrates in nature current knowledge and challenges. J. Chem. Eng. Data 2014, 60, 319–329. [Google Scholar] [CrossRef]
  7. Song, Y.; Yang, L.; Zhao, J.; Liu, W.; Yang, M.; Li, Y.; Liu, Y.; Li, Q. The status of natural gas hydrate research in China: A review. Renew. Sustain. Energy Rev. 2014, 31, 778–791. [Google Scholar] [CrossRef]
  8. Moridis, G.J.; Collett, T.S.; Pooladi-Darvish, M.; Hancock, S.; Santamarina, C.; Boswell, R.; Kneafsey, T.; Rutqvist, J.; Kowalsky, M.; Reagan, M.T. Challenges, Uncertainties and Issues Facing Gas Production from Gas Hydrate Deposits; Ernest Orlando Lawrence Berkeley National Laboratory: Berkeley, CA, USA, 2010. [Google Scholar]
  9. Xie, X.; Leung, Y.; Uchida, S.; Lu, J.; Li, D.; Liang, D. Experimental and numerical studies on geomechanical behavior of various gas hydrate-bearing sediments in China. In Proceedings of the 1st International Conference on Energy Geotechnics (ICEGT 2016), Kiel, Germany, 29–31 August 2016; CRC Press: Boca Raton, FL, USA, 2016; p. 463. [Google Scholar]
  10. Hyodo, M.; Nakata, Y.; Yoshimoto, N. Challenge for methane hydrate production by geotechnical engineering. Jpn. Geotech. Soc. Spec. Publ. 2016, 2, 62–75. [Google Scholar] [CrossRef]
  11. Uchida, S.; Klar, A.; Yamamoto, K. Sand production model in gas hydrate-bearing sediments. Int. J. Rock Mech. Min. Sci. 2016, 86, 303–316. [Google Scholar] [CrossRef]
  12. Uchida, S.; Klar, A.; Yamamoto, K. Sand production modeling of the 2013 Nankai offshore gas production test. In Proceedings of the 1st International Conference on Energy Geotechnics (ICEGT 2016), Kiel, Germany, 29–31 August 2016; CRC Press: Boca Raton, FL, USA, 2016; p. 451. [Google Scholar]
  13. Chong, Z.R.; Yang, S.H.B.; Babu, P.; Linga, P.; Li, X.-S. Review of natural gas hydrates as an energy resource: Prospects and challenges. Appl. Energy 2016, 162, 1633–1652. [Google Scholar] [CrossRef]
  14. Ranjith, P.; Perera, M.; Perera, W.; Wu, B.; Choi, S. Effective parameters for sand production in unconsolidated formations: An experimental study. J. Pet. Sci. Eng. 2013, 105, 34–42. [Google Scholar] [CrossRef]
  15. Ranjith, P.; Perera, M.; Perera, W.; Choi, S.; Yasar, E. Sand production during the extrusion of hydrocarbons from geological formations: A review. J. Pet. Sci. Eng. 2014, 124, 72–82. [Google Scholar] [CrossRef]
  16. Nie, X.; Yang, S.; Ding, J.; Cao, L.; Zhou, F.; Ma, Q.; Qiu, Z. Experimental investigation on permeability evolution law during sand production process of weak sandstone. J. Nat. Gas Sci. Eng. 2014, 21, 248–254. [Google Scholar] [CrossRef]
  17. Haberer, R.M.; Mangelsdorf, K.; Wilkes, H.; Horsfield, B. Occurrence and palaeoenvironmental significance of aromatic hydrocarbon biomarkers in oligocene sediments from the mallik 5l-38 gas hydrate production research well (Canada). Org. Geochem. 2006, 37, 519–538. [Google Scholar] [CrossRef]
  18. Grover, T.; Moridis, G.J.; Holditch, S.A. Analysis of reservoir performance of messoyakha gas hydrate reservoir. In SPE Annual Technical Conference and Exhibition; Society of Petroleum Engineers: Houston, TX, USA, 2008. [Google Scholar]
  19. Grover, T. Natural Gas Hydrates-Issues for Gas Production and Geomechanical Stability; Texas A&M University: Dallas, TX, USA, 2008. [Google Scholar]
  20. Yamamoto, K.; Dallimore, S. Aurora-JOGMEC-NRCan mallik 2006–2008 gas hydrate research project progress. Nat. Gas Oil 2008, 304, 285–4541. [Google Scholar]
  21. Schoderbek, D.; Farrell, H.; Howard, J.; Raterman, K.; Silpngarmlert, S.; Martin, K.; Smith, B.; Klein, P. Conocophillips Gas Hydrate Production Test; ConocoPhillips Co.: Houston, TX, USA, 2013. [Google Scholar]
  22. Terao, Y.; Duncan, M.; Hay, B.; Dang, L. Deepwater methane hydrate gravel packing completion results and challenges. In Proceedings of the Offshore Technology Conference, Houston, TX, USA, 5–8 May 2014. [Google Scholar]
  23. Yamamoto, K.; Terao, Y.; Fujii, T.; Ikawa, T.; Seki, M.; Matsuzawa, M.; Kanno, T. Operational overview of the first offshore production test of methane hydrates in the eastern Nankai trough. In Proceedings of the Offshore Technology Conference, Houston, TX, USA, 5–8 May 2014. [Google Scholar]
  24. Matsuzawa, M.; Terao, Y.; Hay, B.; Wingstrom, L.; Duncan, M.; Ayling, I. A completion system application for the world’s first marine hydrate production test. In Proceedings of the Offshore Technology Conference, Houston, TX, USA, 5–8 May 2014. [Google Scholar]
  25. Yoneda, J.; Kakumoto, M.; Miyazaki, K.; Katagiri, J.; Aoki, K.; Tenma, N. Evaluation of frictional properties for methane-hydrate-well completion and production. SPE Drill. Complet. 2014, 29, 115–124. [Google Scholar] [CrossRef]
  26. Zhou, S.; Chen, W.; Li, Q.; Zhou, J.; Shi, H. Research on the solid fluidization well testing and production for shallow non-diagenetic natural gas hydrate in deep water area. China Offshore Oil Gas 2017, 29, 1–8. [Google Scholar]
  27. Lu, J.; Li, D.; He, Y.; Liang, D.; Xiong, Y. Research status of sand production during the gas hydrate exploitation process. Adv. New Renew. Energy 2017, 5, 394–402. [Google Scholar]
  28. Wu, N.; Huang, L.; Hu, G.; Li, Y.; Chen, Q.; Liu, C. Geological control factors and scientific challenges for offshore gas hydrate exploitation. Mar. Geol. Quat. Geol. 2017, 37, 1–11. [Google Scholar]
  29. Li, Y. China has been successfully completed the exploration of natural gas hydrate and made a historic breakthrough. Mar. Geol. Quat. Geol. 2017, 37, 34. [Google Scholar]
  30. Konno, Y.; Fujii, T.; Sato, A.; Akamine, K.; Naiki, M.; Masuda, Y.; Yamamoto, K.; Nagao, J. Key findings of the world’s first offshore methane hydrate production test off the coast of Japan: Toward future commercial production. Energy Fuels 2017, 31, 2607–2616. [Google Scholar] [CrossRef]
  31. Lu, H.; Lorenson, T.D.; Moudrakovski, I.L.; Ripmeester, J.A.; Collett, T.S.; Hunter, R.B.; Ratcliffe, C.I. The characteristics of gas hydrates recovered from the Mount Elbert gas hydrate stratigraphic test well, Alaska North Slope. Mar. Pet. Geol. 2011, 28, 411–418. [Google Scholar] [CrossRef]
  32. Zhang, W. The application of gas hydrate production methods—A case of ignik sikumi gas hydrate field trial in the north slope of Alaska (USA). Sino-Glob. Energy 2013, 18, 33–38. [Google Scholar]
  33. Qiu, K.; Yamamoto, K.; Birchwood, R.; Chen, Y. Well-integrity evaluation for methane-hydrate production in the deepwater nankai trough. SPE Drill. Complet. 2015, 30, 52–67. [Google Scholar] [CrossRef]
  34. Chee, S.; Leokprasirtkul, T.; Kanno, T.; Osawa, O.; Sudo, Y.; Takekoshi, M.; Yu, H.; Yamamoto, K. A deepwater sandface monitoring system for offshore gas hydrate. In Proceedings of the Offshore Technology Conference, Houston, TX, USA, 5–8 May 2014. [Google Scholar]
  35. Tamaki, M.; Fujii, T.; Suzuki, K. Characterization and prediction of the gas hydrate reservoir at the second offshore gas production test site in the eastern Nankai trough, Japan. Energies 2017, 10, 1678. [Google Scholar] [CrossRef]
  36. Jung, J.; Jang, J.; Santamarina, J.; Tsouris, C.; Phelps, T.; Rawn, C. Gas production from hydrate-bearing sediments: The role of fine particles. Energy Fuels 2011, 26, 480–487. [Google Scholar] [CrossRef]
  37. Oyama, H.; Nagao, J.; Suzuki, K.; Narita, H. Experimental analysis of sand production from methane hydrate bearing sediments applying depressurization method. J. MMIJ 2010, 126, 497–502. [Google Scholar] [CrossRef]
  38. Suzuki, S.; Kuwano, R. Evaluation on stability of sand control in mining methane hydrate. Seisan Kenkyu 2016, 68, 311–314. [Google Scholar]
  39. Murphy, A.; Soga, K.; Yamamoto, K. A laboratory investigation of sand production simulating the 2013 daini-atsumi knoll gas hydrate production trial using a high pressure plane strain testing apparatus. In Proceedings of the 9th International Conferences on Gas Hydrate, Denver, CO, USA, 25–30 June 2017. [Google Scholar]
  40. Lee, J.; Ahn, T.; Lee, J.Y.; Kim, S.J. Laboratory test to evaluate the performance of sand control screens during hydrate dissociation process by depressurization. In Proceedings of the Tenth ISOPE Ocean Mining and Gas Hydrates Symposium, Szczecin, Poland, 22–26 September 2013; International Society of Offshore and Polar Engineers: Houston, TX, USA, 2013. [Google Scholar]
  41. Saucier, R. Considerations in gravel pack design. J. Pet. Technol. 1974, 26, 205–212. [Google Scholar] [CrossRef]
  42. Heeschen, K.U.; Schicks, J.M.; Oeltzschner, G. The promoting effect of natural sand on methane hydrate formation: Grain sizes and mineral composition. Fuel 2016, 181, 139–147. [Google Scholar] [CrossRef]
  43. Li, N.; Sun, Z.-F.; Sun, C.-Y.; Li, P.; Chen, G.-J.; Ma, Q.-L.; Liu, B. Simulating natural hydrate formation and accumulation in sediments from dissolved methane using a large three-dimensional simulator. Fuel 2018, 216, 612–620. [Google Scholar] [CrossRef]
  44. Zhang, X.; Lu, X.; Li, Q. Formation of layered fracture and outburst during gas hydrate dissociation. J. Pet. Sci. Eng. 2011, 76, 212–216. [Google Scholar] [CrossRef]
  45. Han, H.; Wang, Y.; Li, X.-S.; Yu, J.-X.; Feng, J.-C.; Zhang, Y. Experimental study on sediment deformation during methane hydrate decomposition in sandy and silty clay sediments with a novel experimental apparatus. Fuel 2016, 182, 446–453. [Google Scholar] [CrossRef]
  46. Liu, W.; Wu, Z.; Li, Y.; Song, Y.; Ling, Z.; Zhao, J.; Lv, Q. Experimental study on the gas phase permeability of methane hydrate-bearing clayey sediments. J. Nat. Gas Sci. Eng. 2016, 36, 378–384. [Google Scholar] [CrossRef]
  47. Gupta, S.; Deusner, C.; Haeckel, M.; Helmig, R.; Wohlmuth, B. Testing a thermo-chemo-hydro-geomechanical model for gas hydrate-bearing sediments using triaxial compression laboratory experiments. Geochem. Geophys. Geosyst. 2017, 18, 3419–3437. [Google Scholar] [CrossRef] [Green Version]
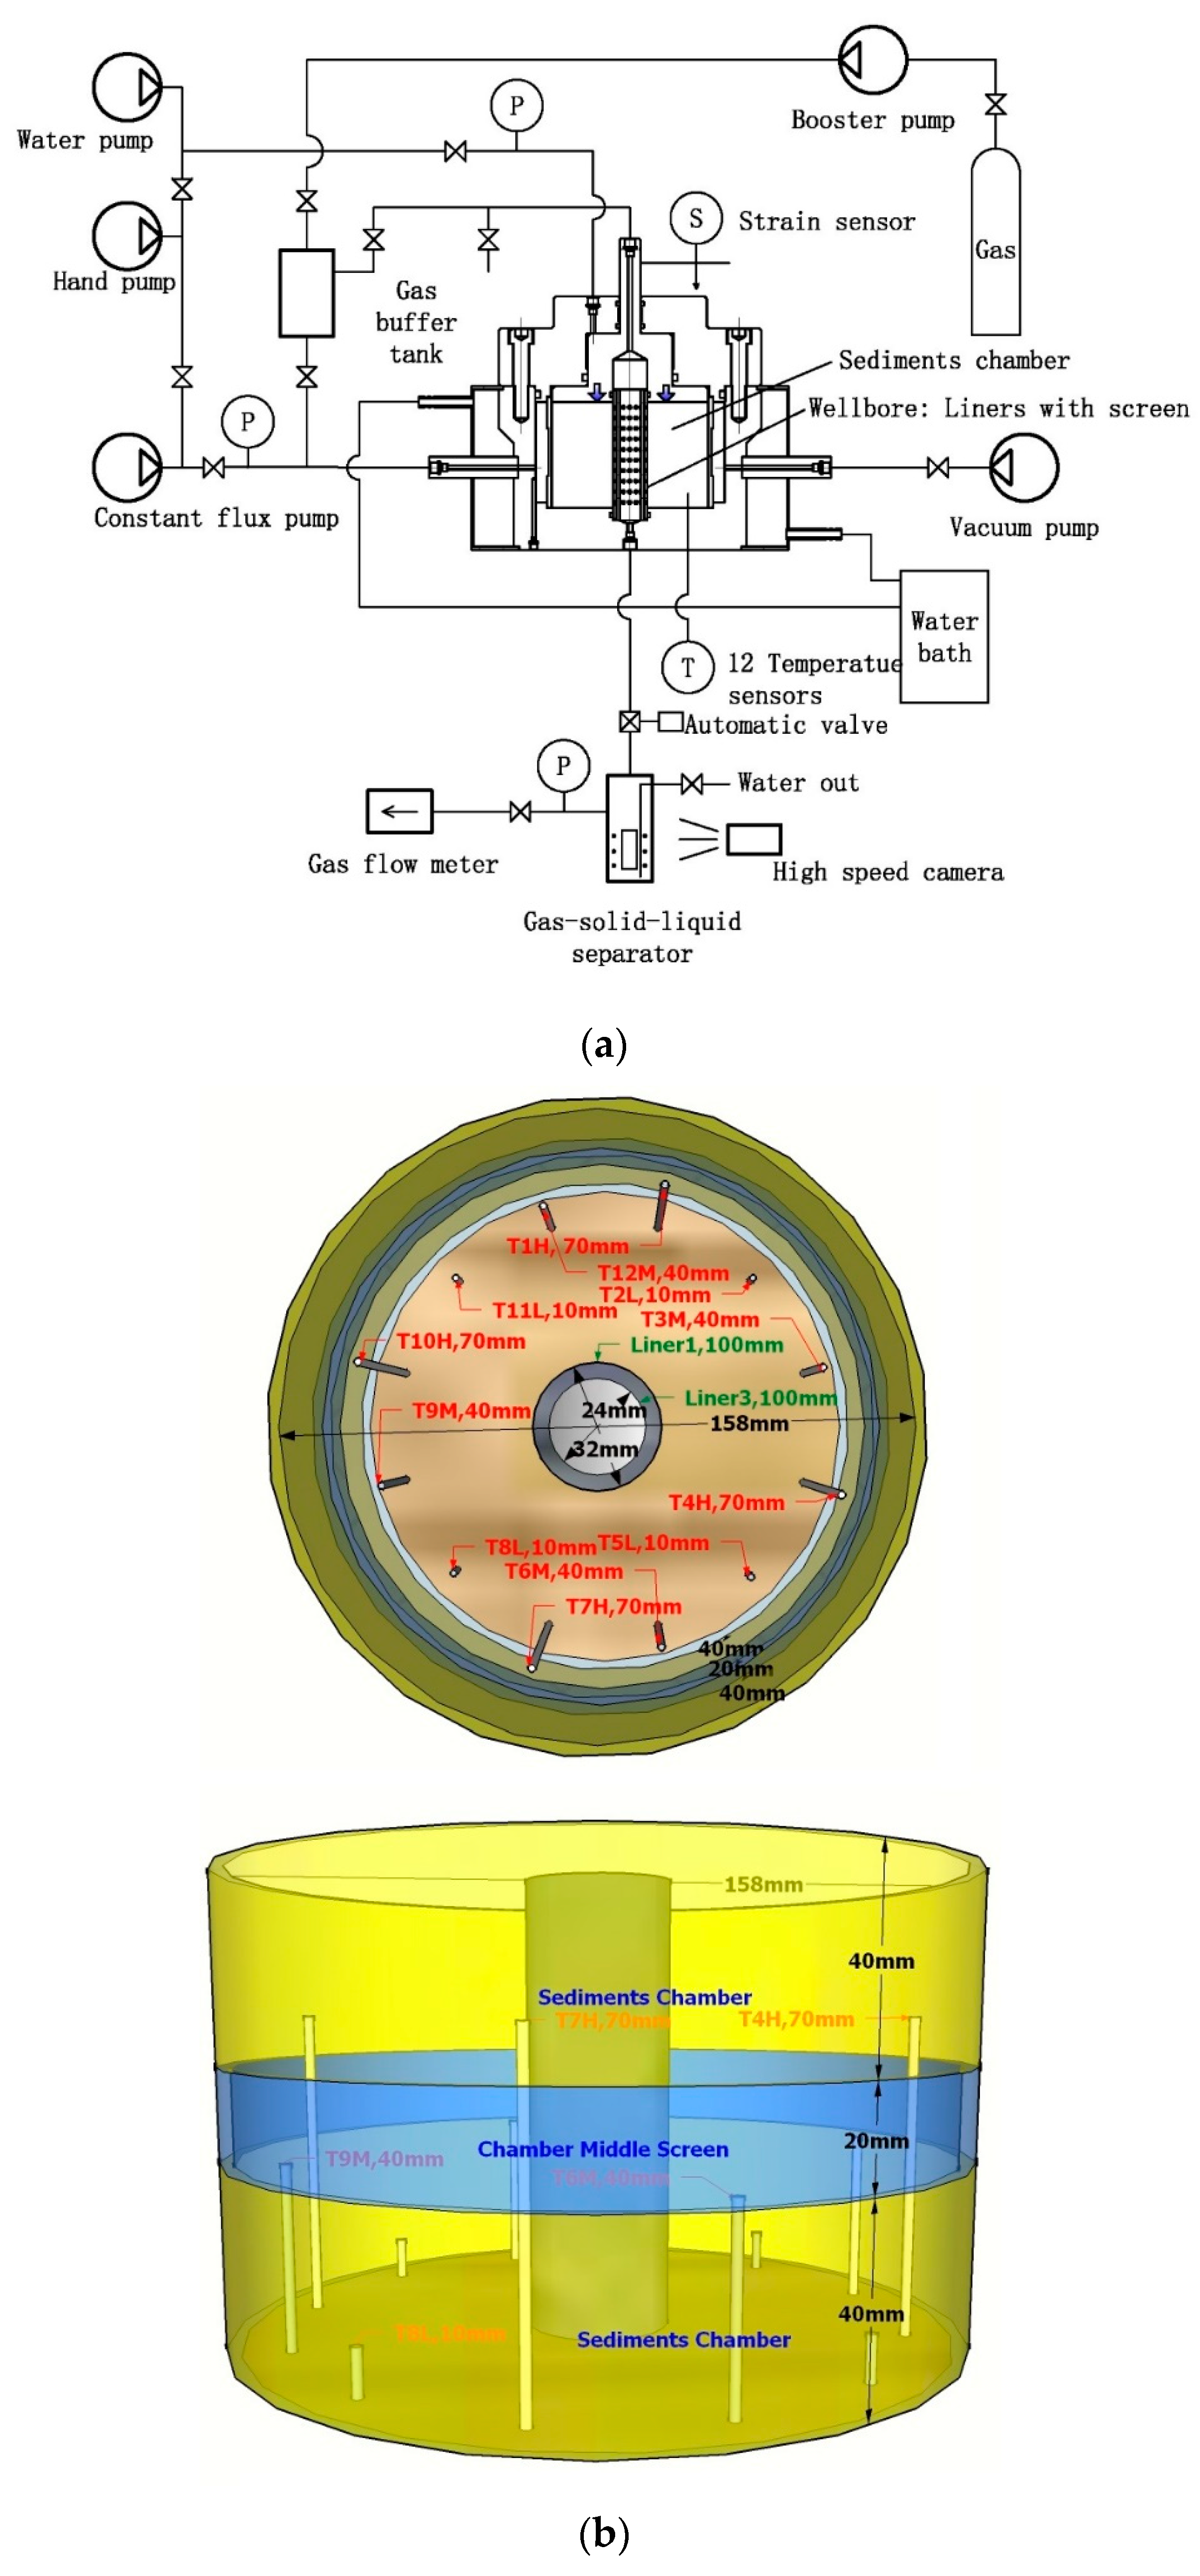
Figure 1. Schematic of methane hydrate sand production facility and the sediments chamber, (a) Schematic of methane hydrate sand production and sand prevention facility; (b) Top view and Flat view of sediment chamber (T indicates temperature, 1–12 indicates the alignment of the temperature sensors; H, L and M indicates the height of the temperature sensors in layers H (70 mm), M (40 mm) and L (10 mm)).
Energies 11 01673 g001
Figure 2. Particle size distribution of the sand.
Energies 11 01673 g002
Figure 3. Images of experiments: (a) initial sediments; (b) end production; (c) produced liner with screen.
Energies 11 01673 g003
Figure 4. Experimental results of the pressure, temperature, flow rate, and subsidence rate. (Here, T indicates temperature, 1–12 indicates the alignment of the temperature sensors; H, L and M mean the height of temperature sensors in layers H, M and L; s indicates the sand rates in produced water.)
Energies 11 01673 g004aEnergies 11 01673 g004bEnergies 11 01673 g004c
Figure 5. Spatial distribution of heat for five experiments (Experiment number, Production time (min), Subsidence ratio (S, %)).
Energies 11 01673 g005
Figure 6. Sand production in the visual window (A) fine sand as a whole and (B) sand grains.
Energies 11 01673 g006
Figure 7. Sizes of the seized sand and sand production in Experiment No. 3.
Energies 11 01673 g007
Figure 8. Mechanism for hydrate sand production in the three production period, (a) the initial state of hydrate-bearing-sediments; (b) the fine sand production in the first production period; (c) hydrate decomposition and sand production in the second period; (d) the final state hydrate-bearing-sediments in the third production period.
Energies 11 01673 g008
Table 1. Material properties.
MaterialsPropertiesSupplier
Sandd (0.5) = 225.67 μm, uniformity 0.40, specific surface area 0.18 m2/g, density 1.63 g/mL, porosity 28.52%,GMGS
Deionized waterResistivity: 18.2 mΩ/cmLaboratory
MethanePurity: 99.99% (mole fraction)Shiyuan Gas Co.
Table 2. Experimental details.
No.Initial Water Rates (%)Ideal Hydrate Saturation in Pore (%)Gas Production (L)Water Production with Sand (g)Hydrate Saturation (%)Sand Production (g)Total sand Production Rate (%)Final Subsidence (%)
13.011240.31450.0038.863.630.81−14.82
220.0080153.35563.37100.0017.283.06−9.91
325.0010081.69873.1173.8327.653.16−4.26
410.004058.75467.3353.101.690.36−2.73
512.505052.42640.8747.381.140.18−1.93