Mechanical Performance of Methane Hydrate–Coal Mixture


1
School of Architectural & Civil Engineering, Heilongjiang University of Science & Technology, Harbin 150022, China
2
Department of Civil & Environmental Engineering, National University of Singapore, Singapore 117576, Singapore
3
School of Safety Engineering, Heilongjiang University of Science & Technology, Harbin 150022, China
*
Authors to whom correspondence should be addressed.
Energies 2018, 11(6), 1562; https://doi.org/10.3390/en11061562
Submission received: 11 May 2018
/
Revised: 3 June 2018
/
Accepted: 7 June 2018
/
Published: 14 June 2018
Abstract
:Understanding mechanical behaviors of a methane hydrate–coal mixture are important for its associated application in coal and gas outburst prevention. A triaxial compression apparatus for a specimen of the methane hydrate–coal mixture was developed to measure its strength and deformation properties. Triaxial compression tests were performed on coal briquette samples under different confining pressures and methane hydrate saturation. Strain softening behavior of the methane hydrate–coal mixture can be identified for all the specimens under various conditions. The larger the methane hydrate saturation or confining pressure, the larger the peak strength, elastic modulus and peak strain. Mathematical relationships for correlating the peak strength with the methane hydrate saturation or confining pressure were also proposed.
1. Introduction
Coal and gas outburst will eject a large amount of coal and gas very shortly [1]. Disaster will become more serious for deeper coal mining [2,3]. So far, four factors shown in Figure 1 are found to have effects on the gas outbursts [4]. Among these factors, the outburst is very sensitive to gas, considered by most of scholars [5]. Therefore, techniques to prevent this kind of disaster contain: (1) rising up permeability of coal; and (2) decreasing stress in coal seams [6]. Commonly, gas drainage and hydraulic fracturing are adopted to prevent coal and gas outbursts, as well as directional drilling, or water infusion [2,7,8]. Additionally, if a coal seam is strengthened, outbursts can be eliminated [9]. For instance, Wu et al. successfully synthesized artificial methane hydrate (MH), and they used a hydrate method for outburst prevention [10]. Mechanism of the method is illustrated in Figure 2. Coal mine and gas, such as methane, can generate MH with water at a temperature of 0.55 °C and a pressure of 2.77 MPa, and the formed MH is energy-dense. Then, it is possible to reduce gas content and gas pressure significantly, which can decrease or eliminate risks of coal and gas outbursts. Consequently, evaluating the mechanical properties of MH–coal mixtures is very important when applied to outburst prevention.
Up to now, there are only very limited literatures available relevant to mechanical behaviors of MH–coal mixtures [11]. Some investigations have been made related to mechanical behaviors of gas hydrate-bearing sediments. The relationships were obtained between strength parameters, temperature and confining pressure for hydrate-bearing sediments [12,13]. It was found that strength and deformation parameters increase with increasing hydrate saturation for hydrate-bearing sediments [14,15,16]. Low-temperature and high-pressure triaxial apparatus was used to study effects of hydrate saturation, confining pressure and temperature on the strength and deformation parameters for hydrate-bearing sediments [17,18,19,20,21,22,23,24,25]. Recently, direct shear tests were conducted to study the effects of hydrate saturation, temperatures as well as loading rates on mechanical behaviors for hydrate-bearing sediments [26]. In above-mentioned studies, it is found that both hydrate saturation and confining pressures have strong effects on strength and stiffness indices of gas hydrate-bearing sediments.
For MH–coal mixture samples, some preliminary studies were made related to strength characteristics of coal before and after gas hydrate formation under various confining pressures (1, 2 and 3 MPa) and hydrate saturation (25%, 50% and 80%) [11]. The results showed the strength of coal could be enhanced with gas hydrate formation. Additionally, it was found that mechanical properties were strengthened for MH–coal mixture samples, when there were increases in the hydrate saturation as well as the confining pressure. Therefore, laboratory triaxial apparatus was used to investigate the strength properties of the MH–coal mixtures under various confining pressures (4, 5 and 6 MPa) and high MH saturation (from 50% to 80%). Furthermore, the mathematical expressions were obtained to quantitively predict the strength parameters of the MH–coal mixtures under specified conditions.
2. Test Program
2.1. Apparatus
2.2. Specimen Preparation
The briquette specimens were prepared using the outburst coal from Taoshan Coal Mine, Heilongjiang Longmay Mining Holding Group Co., Ltd. (Harbin, China). Samples with 50 mm in diameter and 100 mm in length were finally obtained after compression. We have prepared six samples for the mercury intrusion porosimetry (MIP) tests. Figure 4 shows the variations of the accumulated intruded mercury volume with the pressure. Based on the pore classification in literature [27], we calculated the pore volume distribution and Table 1 showed the detailed pore distribution condition. It is clear that for tested coal samples, Macro-pores and Meso-pores accounted for most part of the pore volume. For six MIP samples, the average total pore volume was 0.1322 mL/g. As for mechanical tests, samples used were assumed to have the same porosity in this work, due to the same briquetting pressure and time for every sample prepared with a coal particle range from 60–80 mesh [28]. Purity of methane was 99.99%. Water was distilled. The detailed preparation procedure can be found in Reference [11].
2.3. Formation of Methane Hydrates in Coal Samples and Experimental Procedure
Proper thermodynamic conditions are needed for MH formation, which are low temperature or high pressure [29]. Calculation of MH saturation can be referred to Reference [11]. Note that the volume of samples was assumed constant during hydrate formation process, and water in the coal sample was completely transformed to hydrate with methane under a specified temperature and pressure [13,26,30,31,32]. The hydrate formation and triaxial compression process are schematically shown in Figure 5. We chose an appropriate thermodynamic condition (0.5 °C, 4 MPa) to ensure hydrate formation in coal samples. In Figure 5, the left part in blue above the MH phase boundary represents a stable region for the hydrate formation.
Figure 5 illustrates the procedures of hydrate formation tests. The test mainly contains the following steps:
(1) Tightness of experimental system checking. After placing moist coal sealed with thermal contractible tubes on pedestal, the experimental system was injected with N2 using a pressure pump; then some solutions of foaming agents were applied on the pipeline surface to observe whether bubbles appear. If no bubbles were identified, a gas intake valve was closed to ensure the sealing of the system, and tightness condition was regarded as fine if the gas pressure remained constant for approximately 12 h. Finally, the confining pressure and the methane gas pressure were increased to 0.5 MPa and 0.3 MPa, respectively. Then, methane was expelled repeatedly to ensure no air exited in the coal specimen and the pipeline.
(2) MH formation in the coal specimen. After the tightness of the system was checked, the moist sealed coal specimen was placed inside the cylinder chamber, shown as point (a) in Figure 5, and was injected with methane gas. For each test, methane gas was injected with a pressure around 4 MPa for approximately 24 h to ensure gas adsorption, shown as point (b) in Figure 5. After the methane was injected, the pressure and the temperature were adjusted to the designed condition (a temperature of 0.5 °C, a gas pressure of 4 MPa) for gas hydrate formation, indicated as the point c in Figure 5. Hydrate formation was considered to complete when no obvious gas pressure varied for approximately 6 h. All the hydrate formation process continued approximately 48 h after 24 h methane adsorption.
(3) Triaxial compression tests on the MH–coal mixture. When MHhydrate formation was completed, the axial loading was conducted manually. The gas pressure was maintained at around 4.0 MPa, the confining pressures were kept at 4.0, 5.0, and 6.0 MPa, and the temperature remained at 0.5 °C. Variables of triaxial compression tests are summarized in Table 2.
3. Results
3.1. Triaxial Compression Test
Figure 6 shows a stress–strain curve of the tested coal sample. This curve can be divided into four stages. OA represents stage 1, namely a linear elastic region. In this stage, the particles inside the coal pores were squeezed without generation of cracks. AB is the post-yielding and pre-failure stage. In this region, a shear movement occurred between the particles, leading to the formation of cracks. However, the MH–coal mixture could still sustain some further deformation without losing its capacity. BC shows the post-peak regime, with the propagation and the extension of cracks. Therefore, the stress of the coal sample gradually decreased. CD illustrates the residual state of the mixture.
Figure 7 illustrates the results from triaxial compression tests for specimens with different hydrate saturation (50%, 60%, 70% and 80%), subjected to various confining pressures (4, 5 and 6 MPa). It is clear that all stress–strain curves exhibit a similar trend. Deviator stress reached a maximum value at a certain strain between 2% and 5%. Then, strain softening happened. The residual state happened till the strain exceeded 10%. Afterwards, deviator stress reached the residual state. In Figure 7a,b, for Sh of 50% and 60%, the confining pressure of 6 MPa resulted in higher stiffness in the linear elastic region. For the specimen with Sh of 70% and 80% (Figure 7c,d), the strain softening behavior was more obvious under the high confining pressure of 6 MPa. This implies that the confining pressure acts as a vital part in the mechanical behavior of the tested coal samples.
Moreover, a remarkable increase in the strength was observed with the increasing saturation and confining pressure. This is due to that MH filled in the voids within the coal sample enhanced its structure and cementation, while higher confining pressure generated higher densification inside the specimen.
3.2. Correlations between Peak Strength and Saturation, and between Peak Strength and Confining Pressure
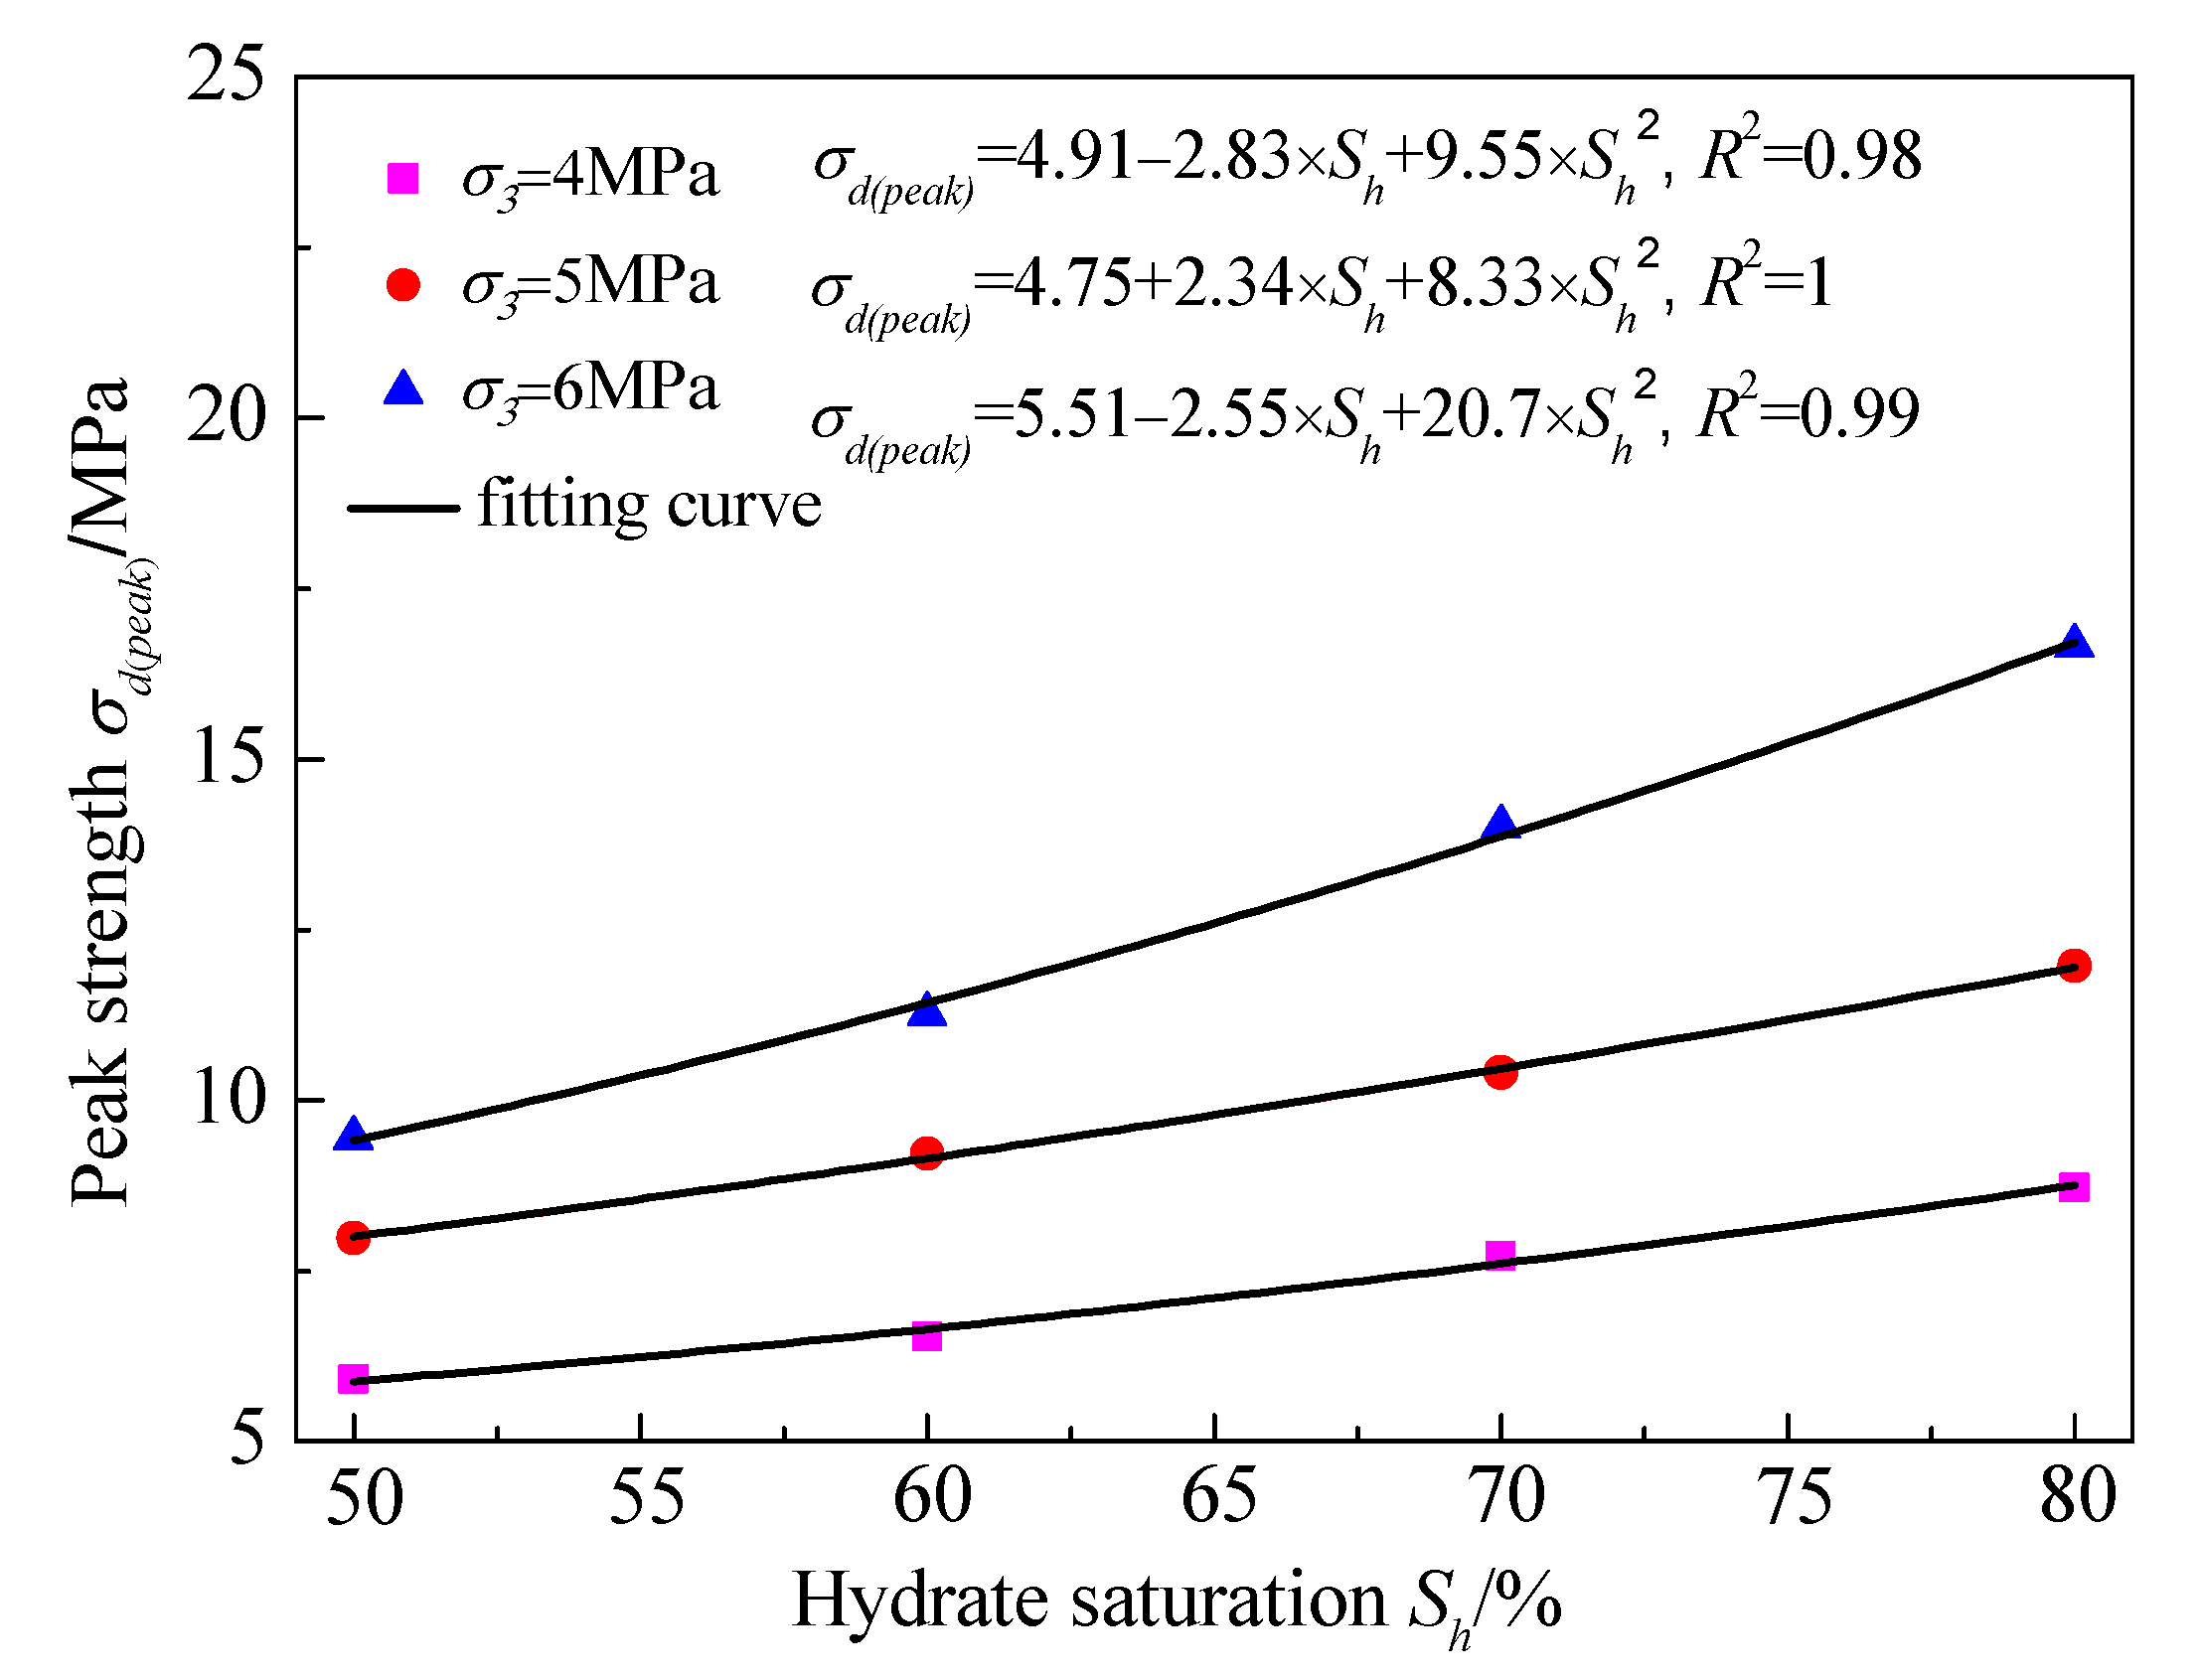
Relationships between the peak strength (failure strength) (σd(peak)) and the hydrate saturation (Sh), along with relationships between the peak strength and the confining pressure, are displayed in Figure 8 and Figure 9. Table 3 summarizes the typical strength and the deformation indices from tests. It was observed in Figure 8 that saturation had a significant impact on the peak strength of specimen. For each confining pressure, the peak strength increased with the increased saturation. At the confining pressure of 4 MPa, when Sh was increased from 50% to 80%, the peak strength increased from 5.86 MPa to 8.68 MPa. In addition, the relationship between the peak strength and the hydration saturation can be captured by a quadratic polynomial function. This trend is similar to the finding by Miyazaki et al. [16], who discovered the peak strength increases at higher saturation. For high-saturation samples, hydrate particles assemble collectively to increase the cementation of the specimen [26]. Waite et al. [29] revealed that bulk density of hydrate-bearing sediments also increases at higher saturation, indicating that the bonding structure inside the specimen is enhanced.
Figure 9 shows a larger confining pressure leads to a higher peak strength. Taken Sh of 50% as an example. σd(peak) could increase from 5.86 MPa to 9.38 MPa. The peak strength was increased because the higher confining pressure limited the movement of coal particles, resulting in more energy to break the cementation between particles. Furthermore, a linear relationship can be built between the peak strength and the confining pressure.
As shown in Figure 8, a relationship between σd(peak) and Sh was established:
where c, b, a are the fitting parameters, which should be related to the confining pressure, based on the observation in Figure 9. By regression analysis, correlations between c, b, a and confining pressures were obtained as follows:
Combining Equations (1)–(4), the following formula was achieved for characterizing the impact of the saturation and the confining pressure upon the peak strength:
3.3. Correlation of Residual Strength with Hydrate Saturation and Confining Pressure
In underground mine engineering, the post-peak mechanical properties, such a residual strength of rock or coal mass, are essential for design of the project. Figure 10 plots the relationship between the residual strength (σd(res)) and the hydration saturation (Sh) for the MH–coal mixture. It was obviously identified that σd(res) increased with Sh. σd(res) increased from 4.43 MPa to 7.67 MPa for the specimen under 4 MPa. Moreover, the quadratic polynomial function could be adopted to capture the relationship between σd(res) and Sh.
Figure 11 presents that σd(res) increased linearly with σ3. σd(res) increased from 4.43 MPa to 7.40 MPa for the MH–coal mixture when Sh increased from 50% to 80%.
Equation (6) was adopted to estimate σd(res) based on the information of σd(peak).
3.4. Correlations of Peak Strain with Hydrate Saturation and Confining Pressure
A peak strain (failure strain) is the axial strain corresponding to the peak strength. In general, εp increased with Sh (Figure 13). For the specimen under 6 MPa, when Sh was increased from 50% to 80%, εp climbed rapidly from 2.838% to 5.124%. It indicated that higher hydrate saturation led to the failure of specimen at a larger strain level.
It can be seen from Figure 14 that εp increased with the increased σ3 obviously. For instance, when σ3 was increased from 4 MPa to 6 MPa, εp increased from 3.176% to 5.124% for the specimen with Sh of 80%.
3.5. Correlations of Elastic Modulus with Hydrate Saturation and Confining Pressure
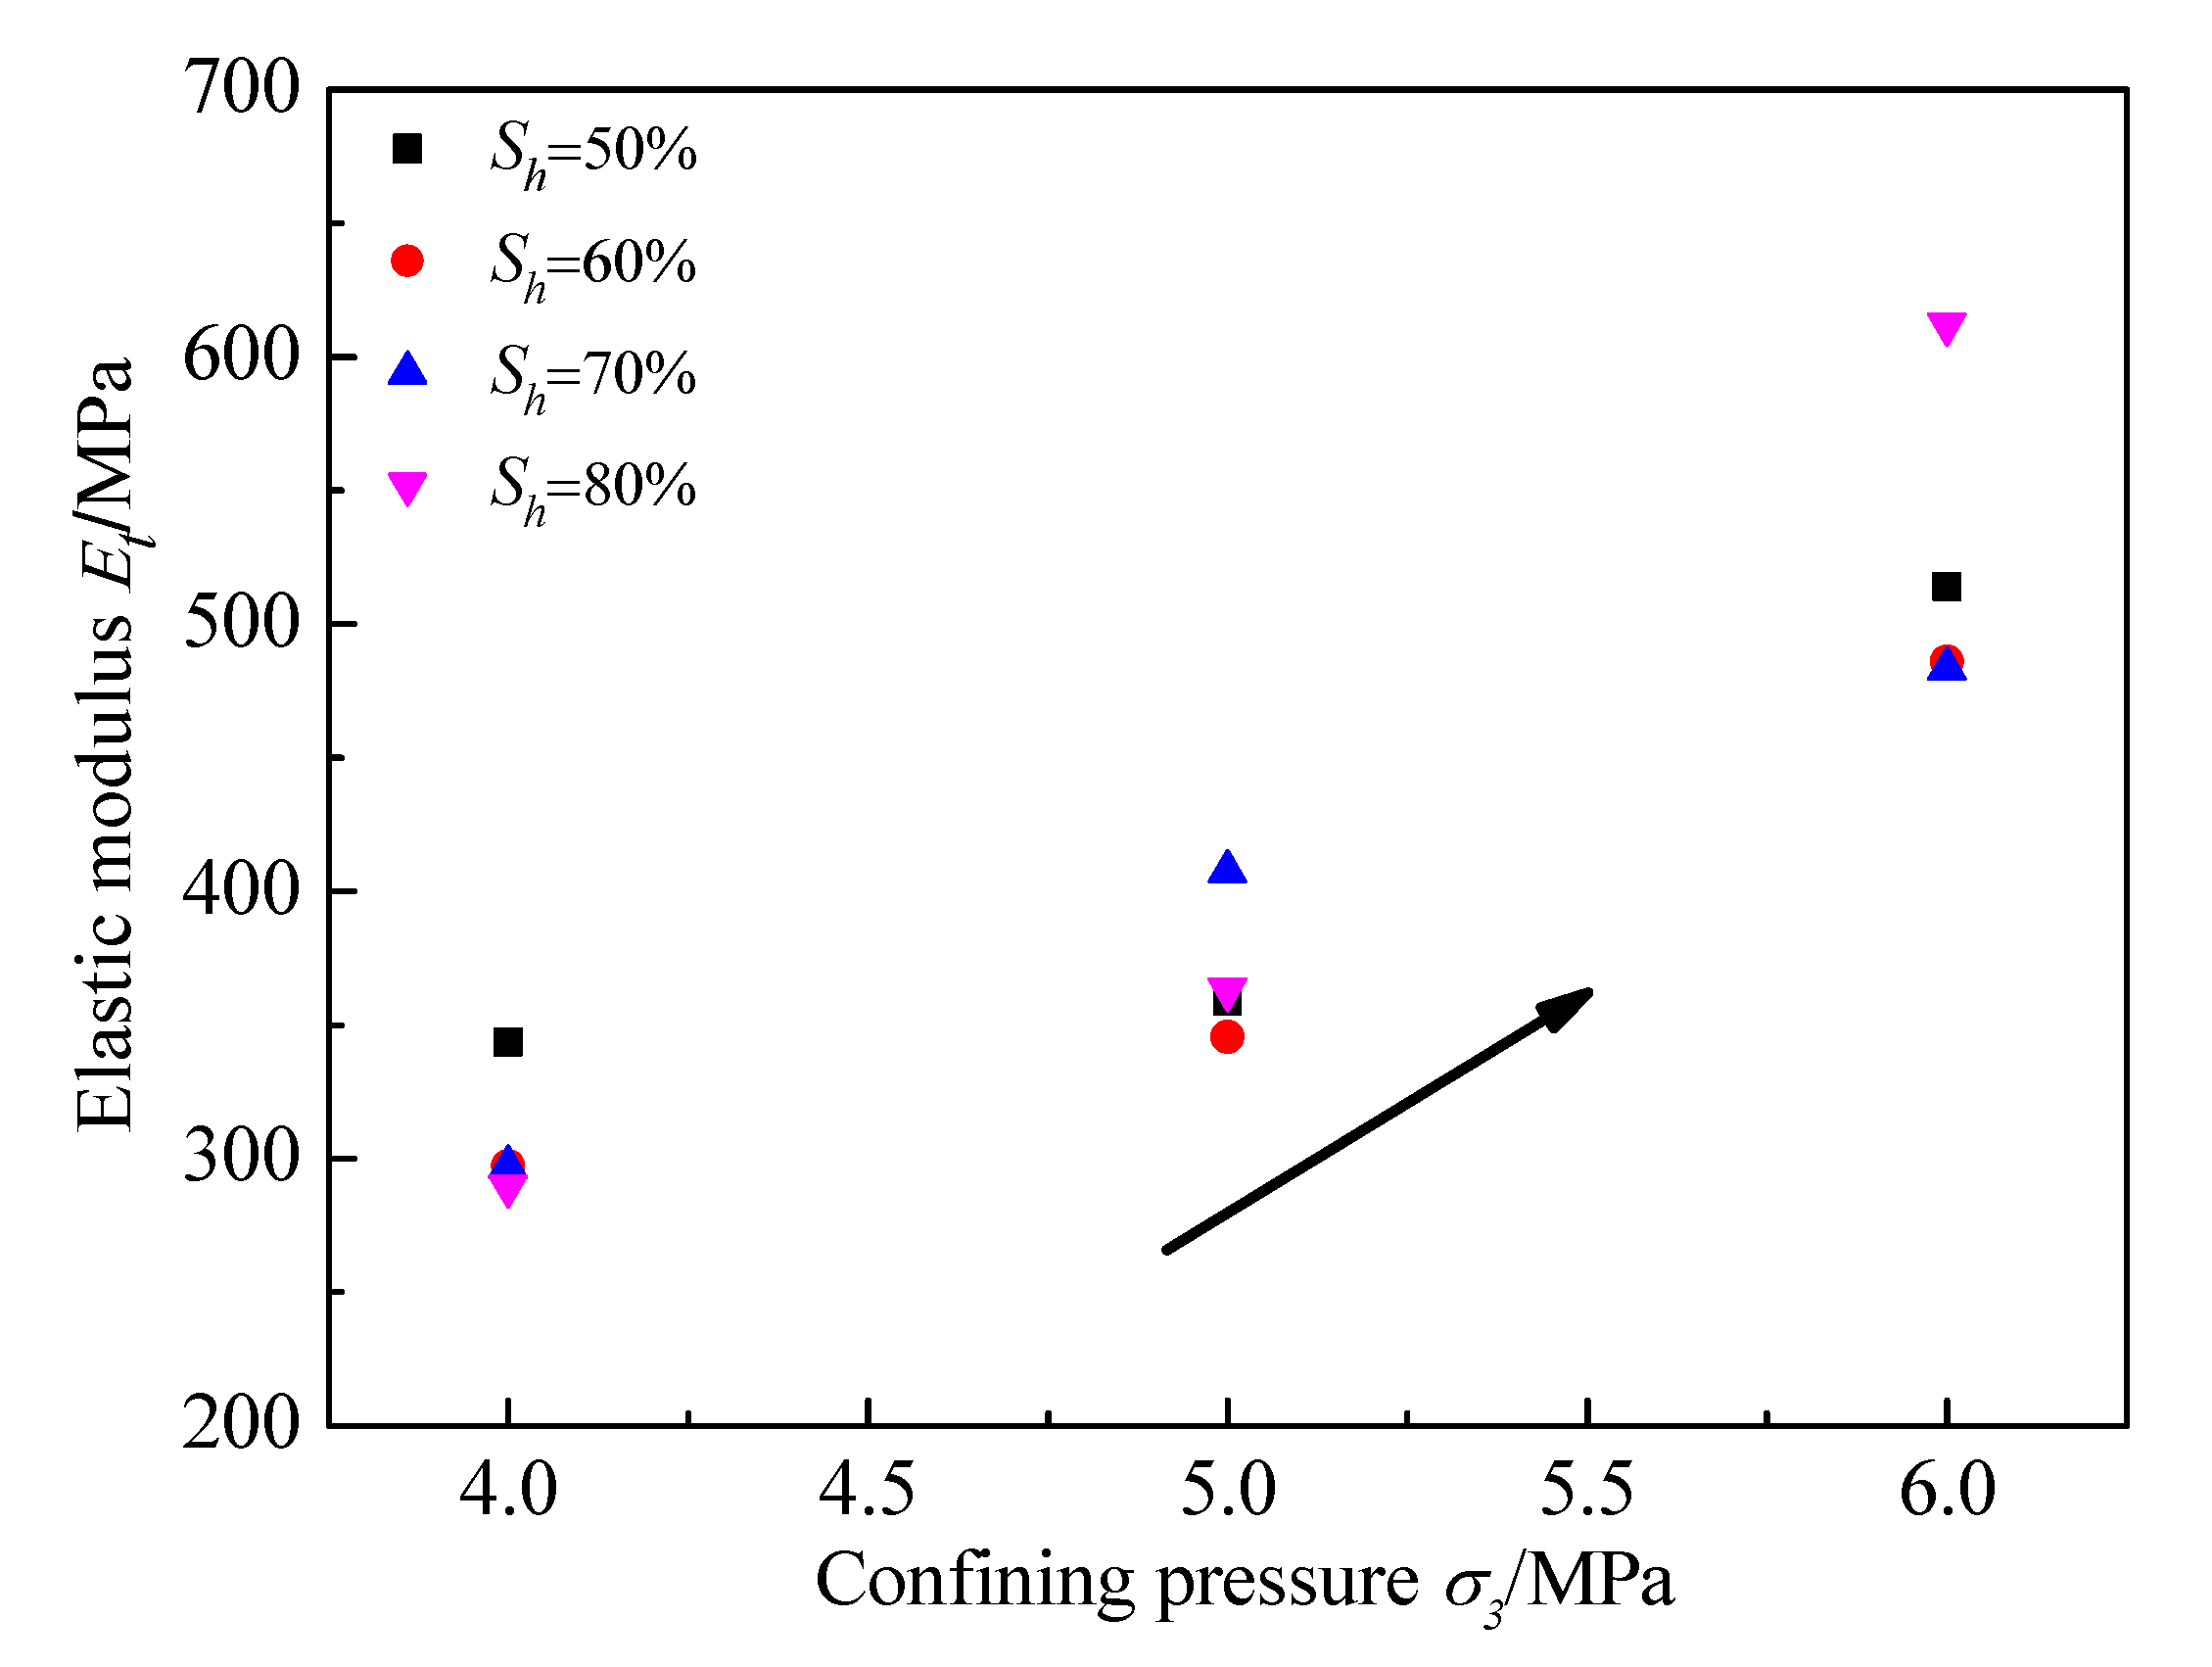
Elastic modulus (Et) was determined as a ratio of 50% of the peak stress to the corresponding axial strain. The variation of Et with σ3 is plotted in Figure 15. It states clearly that Et increased with σ3. For Sh of 50%, when σ3 ranged from 4 MPa to 6 MPa, Et climbed from 343.65 MPa up to 514.02 MPa. Et of the specimen with Sh of 80% was about twice of that of specimen with Sh of 50% under 6 MPa. A similar phenomenon can also be found in the effect of the confining pressure on the strength. Therefore, it indicates that the mechanical performance (both strength and stiffness) of the MH–coal mixture was significantly influenced by the hydrate saturation and the confining pressure.
4. Discussion
The presented experimental studies are limited to coal briquette samples due to difficulty in obtaining hydrate saturation in coal samples. For each coal sample, we assumed the same porosity due to the same molding method, and water was completely converted to MH. Hence, the theoretical hydrate saturation was higher than actual saturation, which could not be measured due to limitations of the apparatus. Additionally, axial and confining pressures were loaded manually, which inevitably resulted in errors of mechanical properties. The manual loading mode led to the fact that experiments could only be done at a low confining pressure. Moreover, it can be seen from Equations (5) and (6) that the peak strength was closely related to the saturation and the confining pressure, and the residual strength increased linearly with the increased peak strength. Therefore, a value of hydrate saturation is very important for reliably predicting the peak strength and the residual strength. However, the predicted peak strength and residual strength may be higher than their actual strengths, due to higher theoretical saturation. This phenomenon will be more obvious under 6 MPa. Furthermore, the predicted mathematical model was only limited to high hydrate saturation and low confining pressures. In future studies, a more rational porosity measurement method will be investigated and thus corresponding hydrate saturation can be calculated properly. The loading system will be loaded at a constant loading rate, and experiments can be conducted under a relatively high confining pressure.
5. Conclusions
This study carried out laboratory simulation of MH formation in coal samples and corresponding mechanical tests at various confining pressures, as well as saturation. Strength and deformation characteristics were discussed through the obtained stress–strain curves. Strain softening was identified for all tested specimens. For some cases, like hydrate saturation of 70% and 80%, the strain softening behavior was more obvious under a high confining pressure of 6 MPa. Mechanical properties of the MH–coal mixture were enhanced due to the increasing saturation, together with confining pressures. Higher hydrate saturation or confining pressures also led to a larger failure strain of the specimen. A linear relationship was established between the residual strength and the peak strength of the MH–coal mixture. Moreover, both the peak and residual strengths showed clear linear relationships with the confining pressure, and the quadratic polynomial relationships between the peak strength and the hydrate saturation, as well as the quadratic relationships between the residual strength and the hydrate saturation were identified. Finally, comprehensive mathematical expressions for the failure strength considering both the saturation and the confining pressure were also proposed.
Author Contributions
Conceptualization, Q.W.; Methodology, X.G. and B.Z.; Experiment conduction, T.Y. and C.L.; Manuscript writing, K.Y. and X.G.
Acknowledgments
This study was funded by the National Natural Science Foundation of China (Grant No. 51674108, 51774123, 51334005, 51704103); University Nursing Program for Young Scholars with Creative Talents in Heilongjiang Province (UNPYSCT-2017138).
Conflicts of Interest
The authors declare no conflicts of interest.
References
- Li, Z.H.; Wang, E.Y.; Ou, J.C.; Liu, Z.T. Hazard Evaluation of Coal and Gas Outbursts in a Coal-Mine Roadway based on Logistic Regression Model. Int. J. Rock Mech. Min. 2015, 80, 185–195. [Google Scholar] [CrossRef]
- Beamish, B.B.; Crosdale, P.J. Instantaneous Outbursts in Underground Coal Mines: An Overview and Association with Coal Type. Int. J. Coal Geol. 1998, 35, 27–55. [Google Scholar] [CrossRef]
- Fisne, A.; Esen, O. Coal and Gas Outburst Hazard in Zonguldak Coal Basin of Turkey, and Association with Geological Parameters. Nat. Hazards 2014, 74, 1363–1390. [Google Scholar] [CrossRef]
- Wang, S.G.; Elsworth, D.; Liu, J.S. Mechanical Behavior of Methane Infiltrated Coal: The Roles of Gas Desorption, Stress Level and Loading Rate. Rock Mech. Rock Eng. 2013, 46, 945–958. [Google Scholar] [CrossRef]
- Xu, L.H.; Jiang, C.L. Initial Desorption Characterization of Methane and Carbon Dioxide in Coal and its Influence on Coal and Gas Outburst Risk. Fuel 2017, 203, 700–706. [Google Scholar] [CrossRef]
- Lu, T.K.; Zhao, Z.J.; Hu, H.F. Improving the Gate Road Development Rate and Reducing Outburst Occurrences using the Water Jet Technique in High Gas Content Outburst-Prone Soft Coal Seam. Int. J. Rock Mech. Min. 2011, 48, 1271–1282. [Google Scholar] [CrossRef]
- Lama, R.D.; Bodziony, J. Management of Outburst in Underground Coal Mines. Int. J. Coal Geol. 1998, 35, 83–115. [Google Scholar] [CrossRef]
- Karacan, C.Ö.; Ruiz, F.A.; Cotè, M.; Phipps, S. Coal Mine Methane: A Review of Capture and Utilization Practices with Benefits to Mining Safety and to Greenhouse Gas Reduction. Int. J. Coal Geol. 2011, 86, 121–156. [Google Scholar] [CrossRef]
- Zhou, P.L.; Zhang, Y.H.; Huang, Z.A.; Gao, Y.K.; Wang, H.; Luo, Q. Coal and Gas Outburst Prevention using New High Water Content Cement Slurry for Injection into the Coal Seam. Int. J. Min. Sci. Technol. 2017, 27, 669–673. [Google Scholar] [CrossRef]
- Wu, Q.; Li, C.L.; Jing, C.L. Discussion on the Control Factors of Gas Hydrate Formation. J. China Coal Soc. 2005, 30, 283–287. (In Chinese) [Google Scholar]
- Gao, X.; Gao, C.; Zhang, B.Y.; Wu, Q.; Liu, W.X.; Wang, L.N. Experimental Investigation on Mechanical Behavior of Methane Hydrate Bearing Coal under Triaxial Compression. Electron. J. Geotech. Eng. 2015, 20, 94–112. [Google Scholar]
- Hyodo, M.; Nakata, Y.; Yoshimoto, N.; Ebinuma, T. Basic Research on the Mechanical Behavior of Methane Hydrate-Sediments Mixture. Soils Found. 2005, 45, 75–85. [Google Scholar]
- Hyodo, M.; Ling, Y.H.; Yoneda, J.; Nakata, Y.; Yoshimoto, N.; Nishimura, A.; Song, Y.C. Mechanical behavior of Gas-saturated Methane Hydrate-bearing Sediments. J. Geophys. Res. Solid Earth 2013, 118, 5185–5194. [Google Scholar] [CrossRef]
- Masui, A.; Haneda, H.; Ogata, Y.; Aoki, K. Effects of Methane Hydrate Formation on Shear Strength of Synthetic Methane Hydrate Sediments. In Proceedings of the 15th International Offshore and Polar Engineering Conference, Seoul, Korea, 19–24 June 2005. [Google Scholar]
- Miyazaki, K.; Masui, A.; Yamaguchi, T.; Sakamoto, Y.; Haneda, H.; Ogata, Y.; Aoki, K.; Okubo, S. Strain Rate Dependency of Peak and Residual Strength of Sediment Containing Synthetic Methane Hydrate. J. MMIJ 2008, 124, 619–625. [Google Scholar] [CrossRef] [Green Version]
- Miyazaki, K.; Masui, A.; Sakamoto, Y.; Aoki, K.; Tenma, N.; Yamaguchi, K. Triaxial Compressive Properties of Artificial Methane-hydrate-bearing Sediment. J. Geophys. Res. 2011, 116, 1–11. [Google Scholar] [CrossRef]
- Clayton, C.R.I.; Priest, J.A.; Best, A.I. The Effects of Disseminated Methane Hydrate on the Dynamic Stiffness and Damping of a Sand. Geotechnique 2005, 55, 423–434. [Google Scholar] [CrossRef]
- Clayton, C.R.I.; Priest, J.A.; Rees, E.V.L. The Effects of Hydrate Cement on the Stiffness of Some Sands. Geotechnique 2010, 60, 435–445. [Google Scholar] [CrossRef]
- Yun, T.S.; Francisca, F.M.; Santamarina, J.C.; Ruppel, C. Compressional and Shear Wave Velocities in Uncemented Sediment Containing Gas Hydrate. Geophys. Res. Lett. 2005, 32, 1–5. [Google Scholar] [CrossRef]
- Yun, T.S.; Santamarina, C.J.; Ruppel, C. Mechanical Properties of Sand, Silt, and Clay Containing Tetrahydrofuran Hydrate. J. Geophys. Res. Solid Earth 2007, 112, 1–13. [Google Scholar] [CrossRef]
- Santamarina, J.C. The Impact of Hydrate Saturation on the Mechanical, Electrical, and Thermal Properties of Hydrate-Bearing Sand, Silts, and Clay. In Proceedings of the 6th International Conference on Gas Hydrates, Vancouver, BC, Canada, 6–10 July 2008. [Google Scholar]
- Song, Y.C.; Yu, F.; Li, Y.H.; Liu, W.G.; Zhao, J.F. Mechanical Property of Artificial Methane Hydrate under Triaxial Compression. J. Nat. Gas Chem. 2010, 19, 246–250. [Google Scholar] [CrossRef]
- Song, Y.C.; Zhu, Y.M.; Liu, W.G.; Li, Y.H.; Lu, Y.; Shen, Z.T. The Effects of Methane Hydrate Dissociation at Different Temperatures on the Stability of Porous Sediments. J. Pet. Sci. Eng. 2016, 147, 77–86. [Google Scholar] [CrossRef]
- Yu, F.; Song, Y.; Liu, W.; Li, Y.; Lam, W. Analyses of Stress Strain Behavior and Constitutive Model of Artificial Methane Hydrate. J. Pet. Sci. Eng. 2011, 77, 183–188. [Google Scholar] [CrossRef]
- Liu, W.G.; Zhao, J.F.; Luo, Y.; Song, Y.C.; Li, Y.H.; Yang, M.J.; Zhang, Y.; Liu, Y.; Wang, D.Y. Experimental Measurements of Mechanical Properties of Carbon Dioxide Hydrate-Bearing Sediments. Mar. Pet. Geol. 2013, 46, 201–209. [Google Scholar] [CrossRef]
- Liu, Z.C.; Wei, H.Z.; Peng, L.; Wei, C.F.; Ning, F.L. An Easy and Efficient Way to Evaluate Mechanical Properties of Gas Hydrate-Bearing Sediments: The direct Shear Test. J. Pet. Sci. Eng. 2017, 149, 56–64. [Google Scholar] [CrossRef]
- Hoodt, B.B. Coal and Gas Outburst; Song, S.Z., Wang, Y.A., Eds.; China Industry Press: Beijing, China, 1966. [Google Scholar]
- Zhou, Z.; Lu, Y.Y.; Ge, Z.L.; Yang, F.; Zhang, X.W. Coal and rock strength characteristics and experimental study under the coupling of water, gas and coal. J. China Coal Soc. 2014, 39, 2418–2424. (In Chinese) [Google Scholar]
- Waite, W.F.; Santamarina, J.C.; Cortes, D.D.; Dugan, B.; Espinoza, D.N.; Germaine, J.; Jang, J.; Jung, J.W.; Kneafsey, T.J.; Shin, H.; et al. Physical Properties of Hydrate-Bearing Sediments. Rev. Geophys. 2009, 47. [Google Scholar] [CrossRef]
- Yoneda, J.; Jin, Y.; Katagiri, J.; Tenma, N. Strengthening mechanism of cemented hydrate-bearing sand at microscales. Geophys. Res. Lett. 2016, 43, 7442–7450. [Google Scholar] [CrossRef]
- Priest, J.A.; Best, A.I.; Clayton, C.R.I. A laboratory investigation into the seismic velocities of methane gas hydrate-bearing sand. J. Geophys. Res. 2005, 110, 1–13. [Google Scholar] [CrossRef]
- Hyodo, M.; Yoneda, J.; Yoshimoto, N.; Nakata, Y. Mechanical and dissociation properties of methane hydrate-bearing sand in deep seabed. Soils Found. 2013, 53, 299–314. [Google Scholar] [CrossRef]
Figure 1.
Main factors affecting coal and gas outbursts [4].
Figure 1.
Main factors affecting coal and gas outbursts [4].
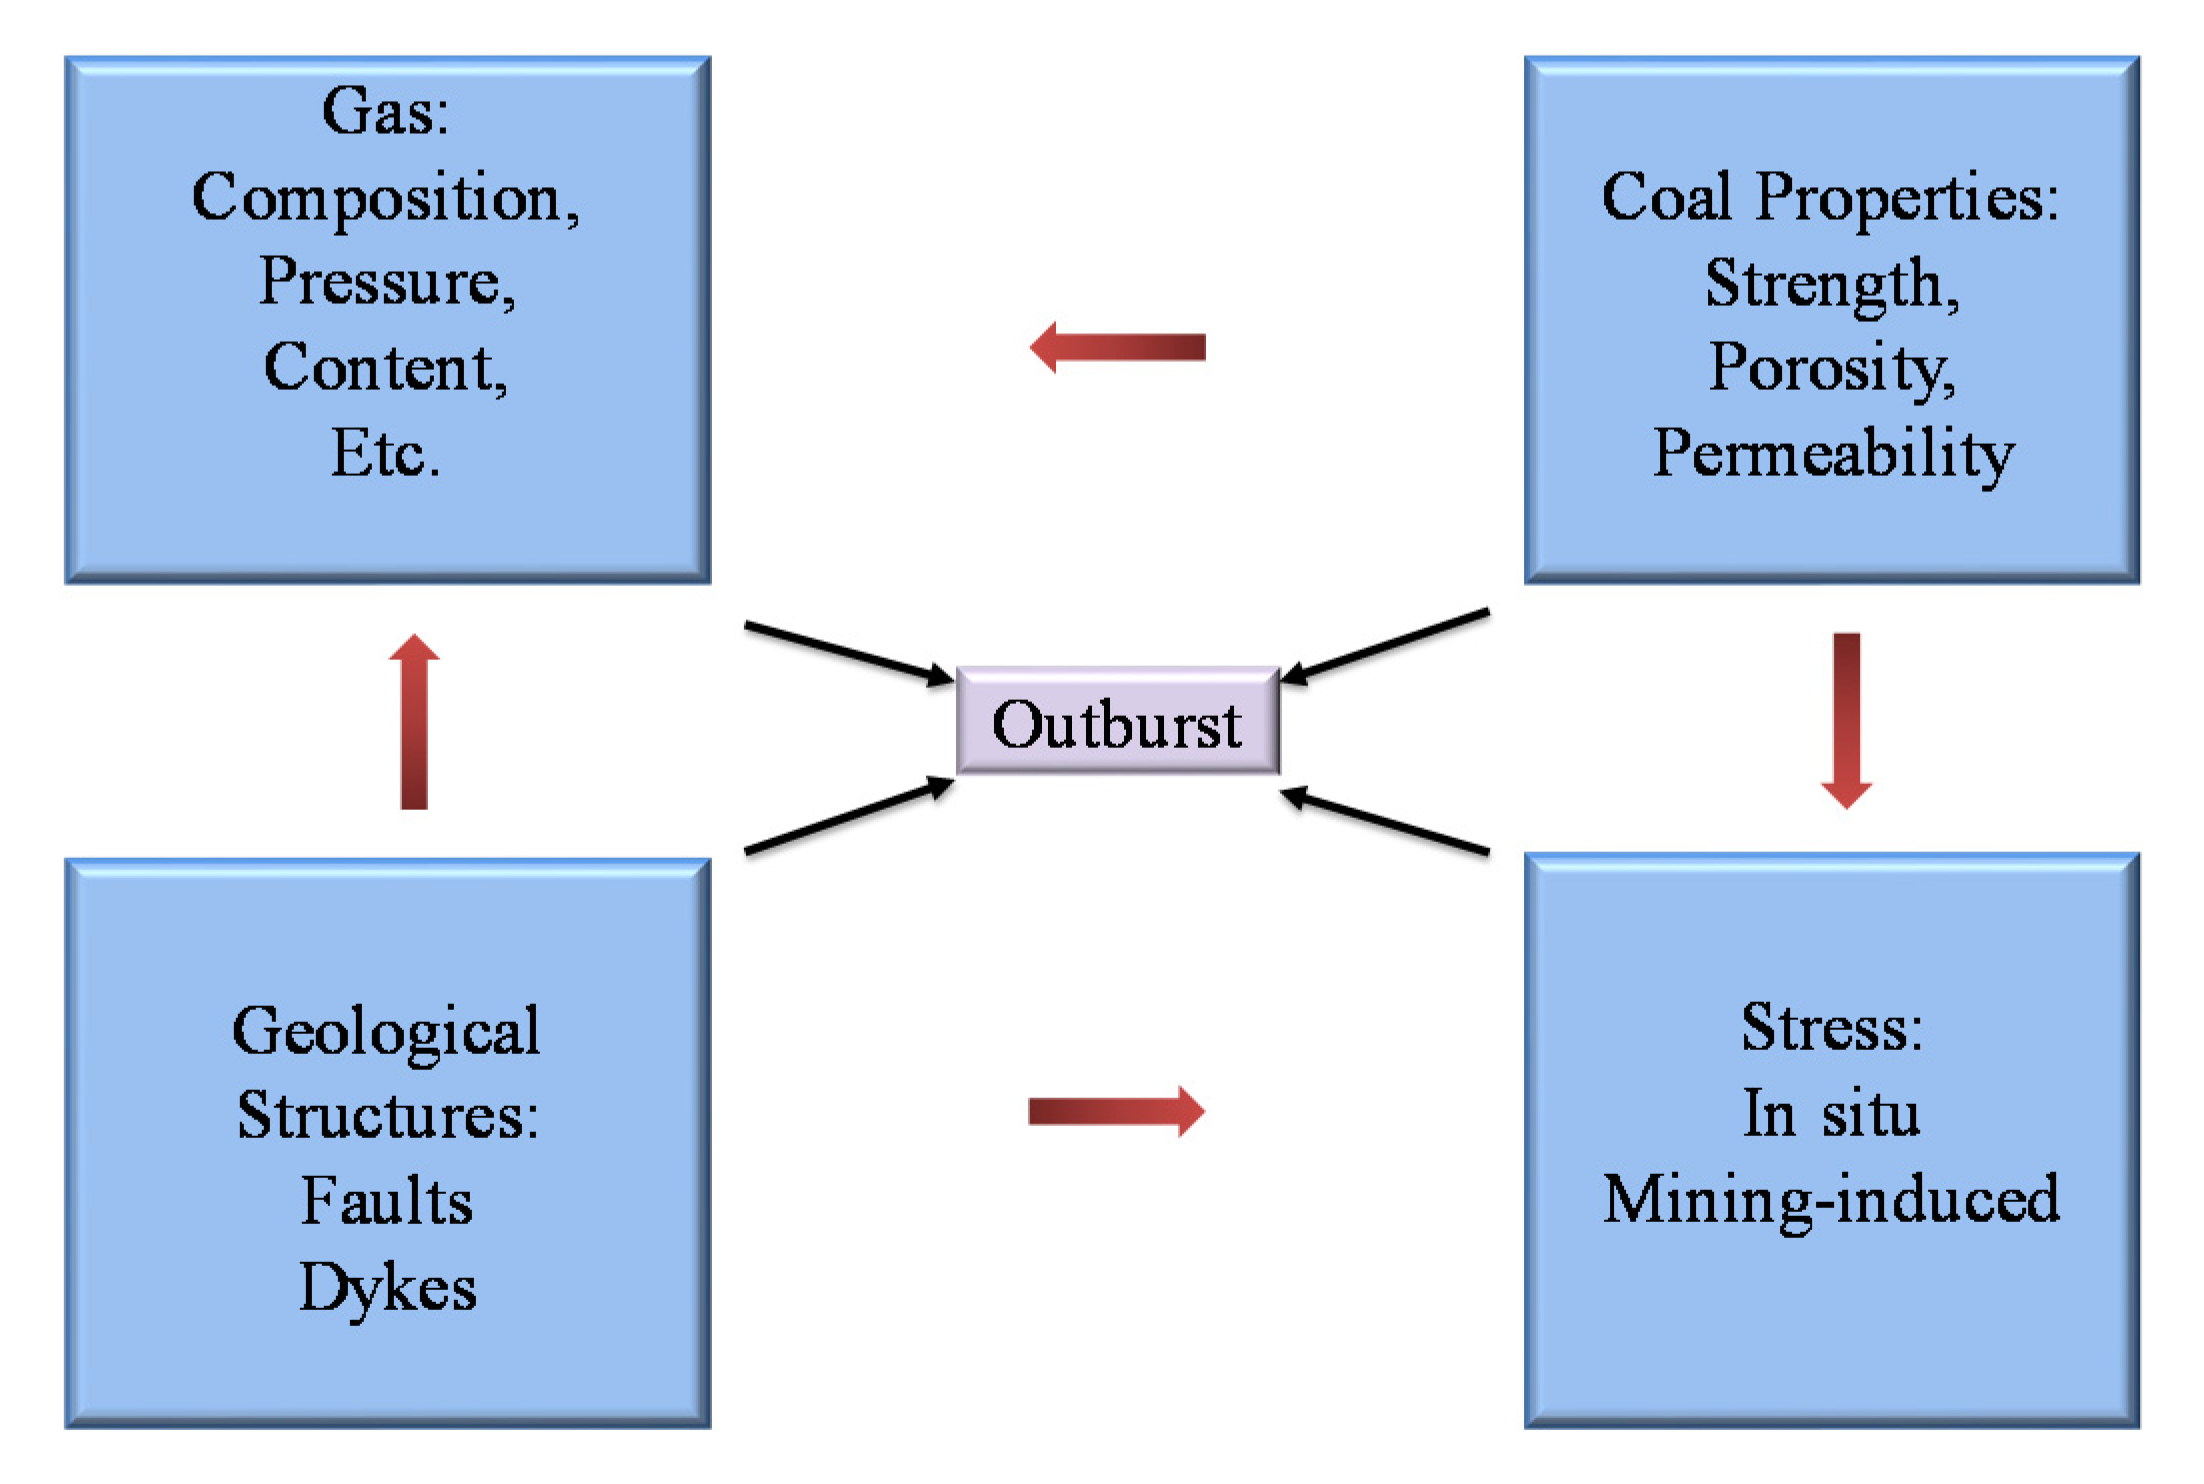
Figure 2.
Schematic diagram for the hydrate-based method for preventing coal and gas outbursts [11].
Figure 2.
Schematic diagram for the hydrate-based method for preventing coal and gas outbursts [11].
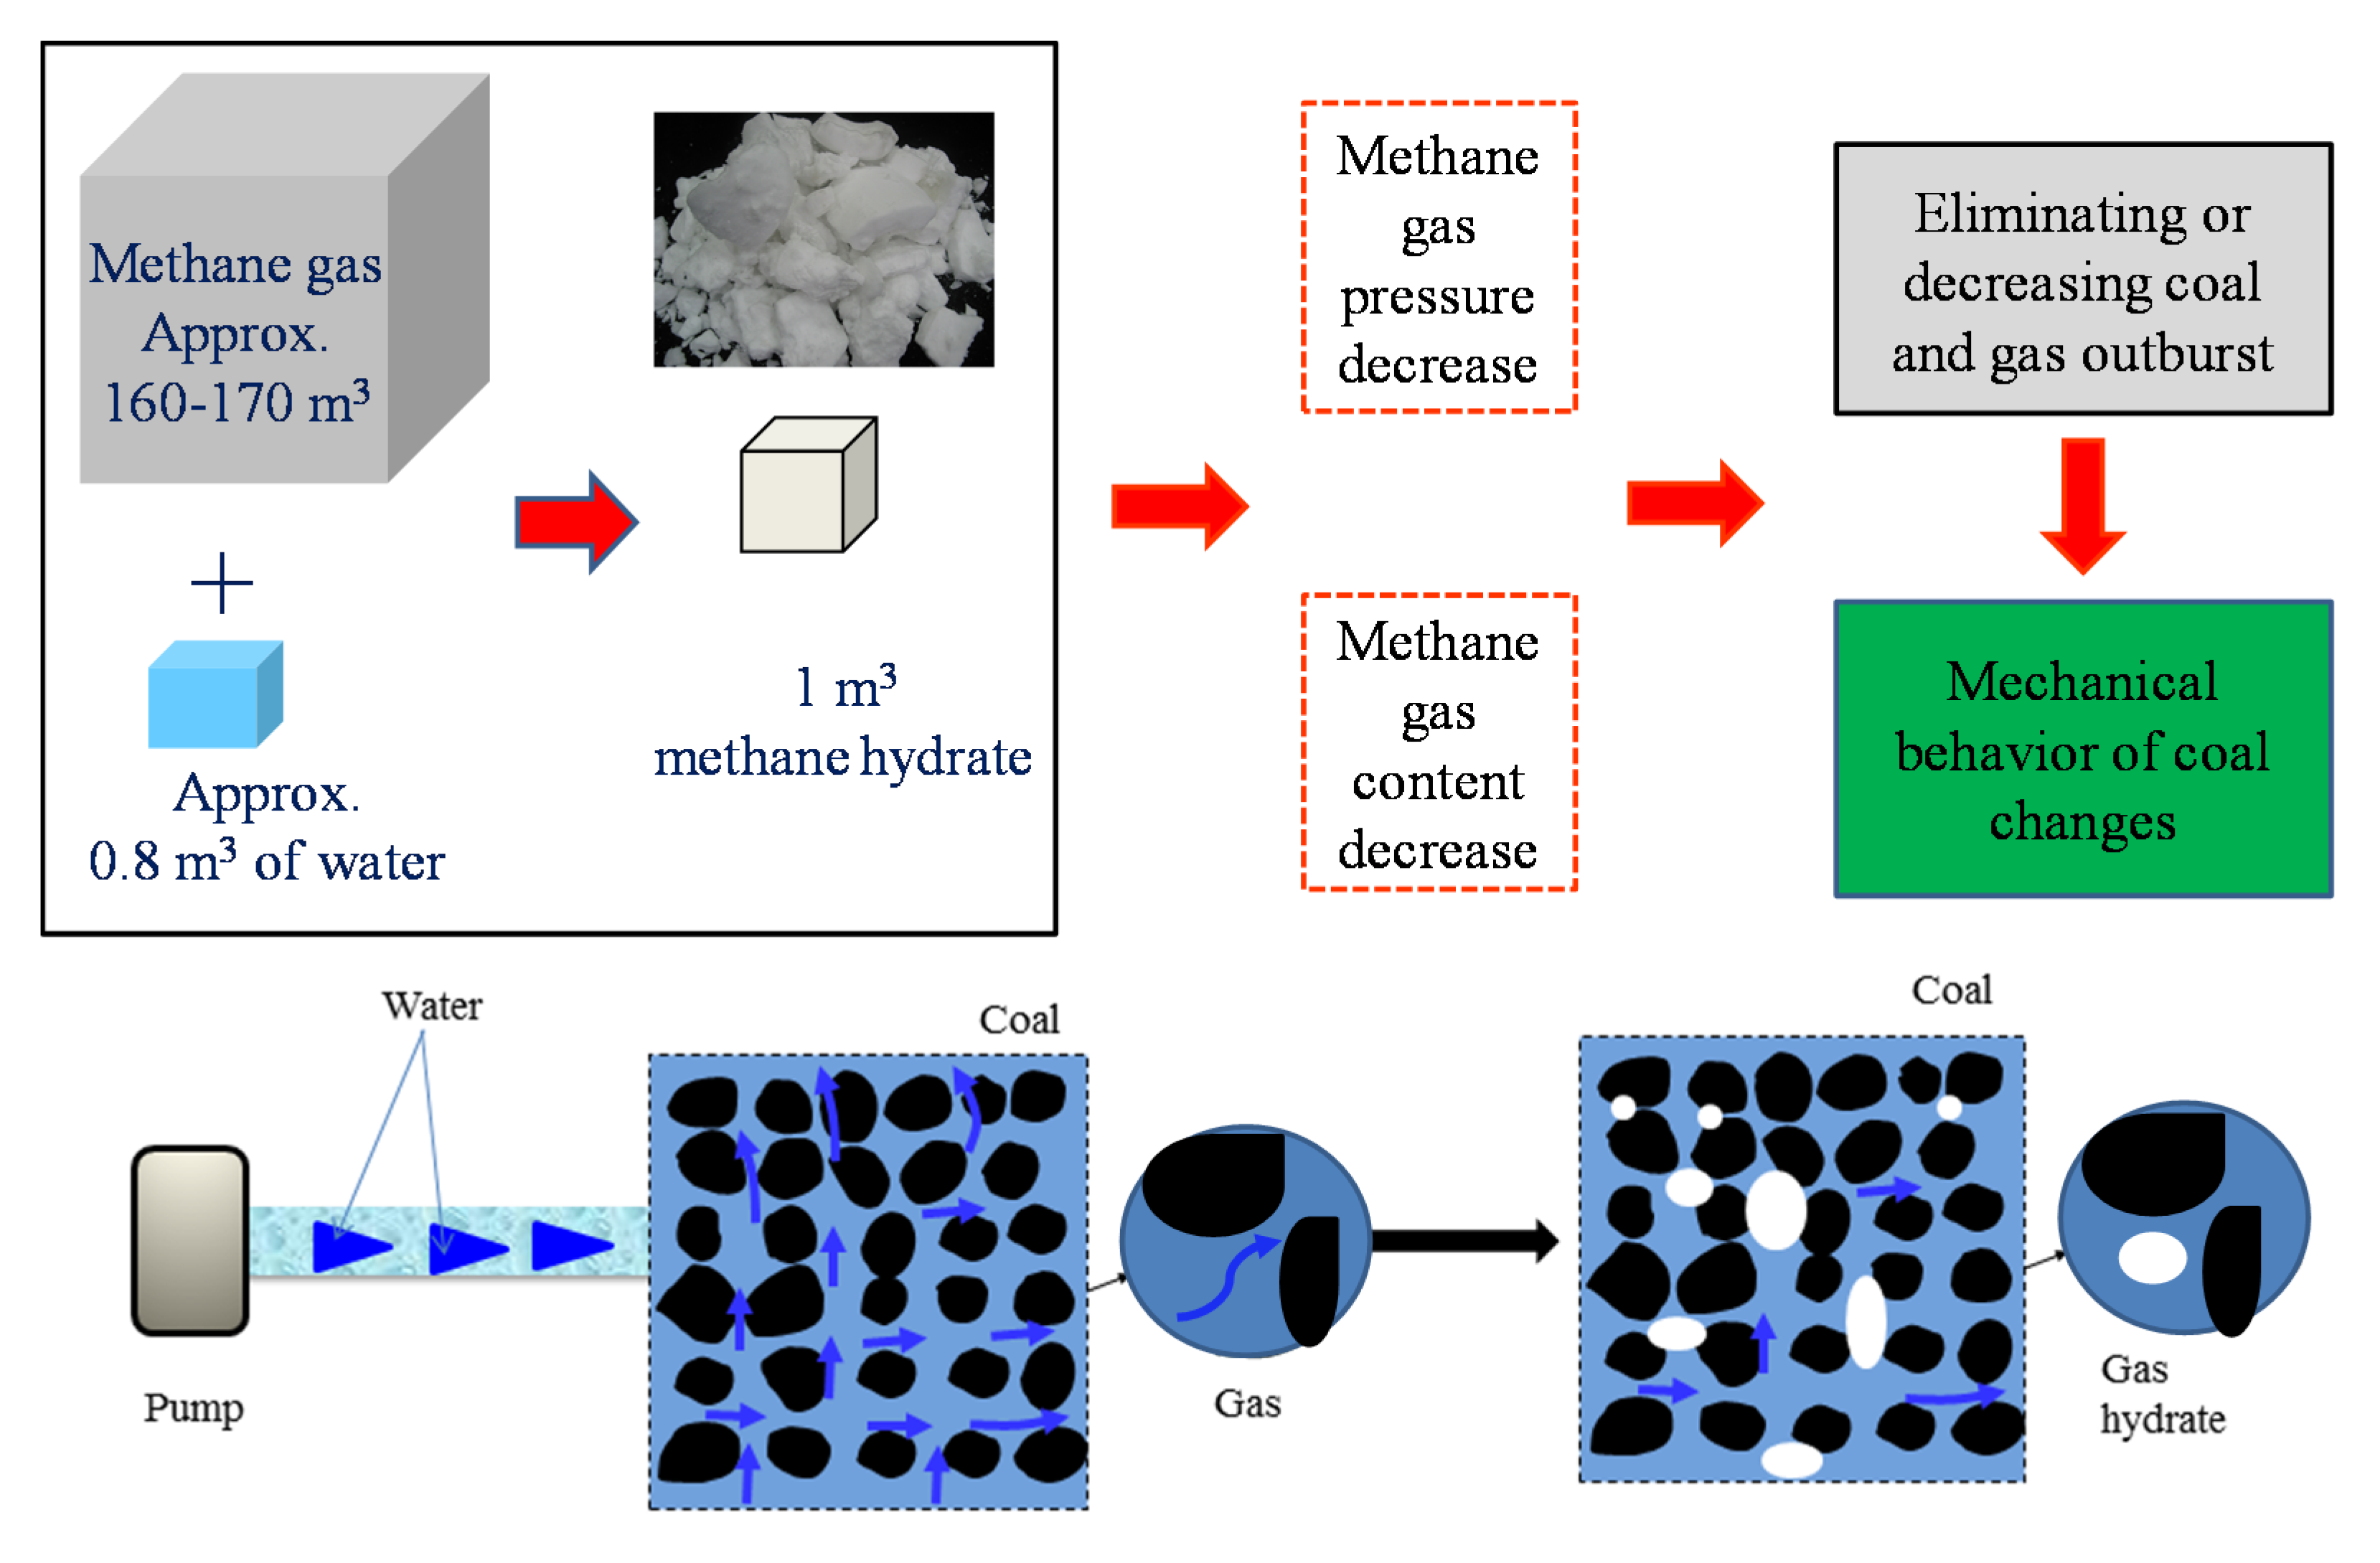
Figure 3.
Schematic diagram of apparatus.

Figure 4.
Accumulated intruded/extruded mercury volume versus pressure curves.
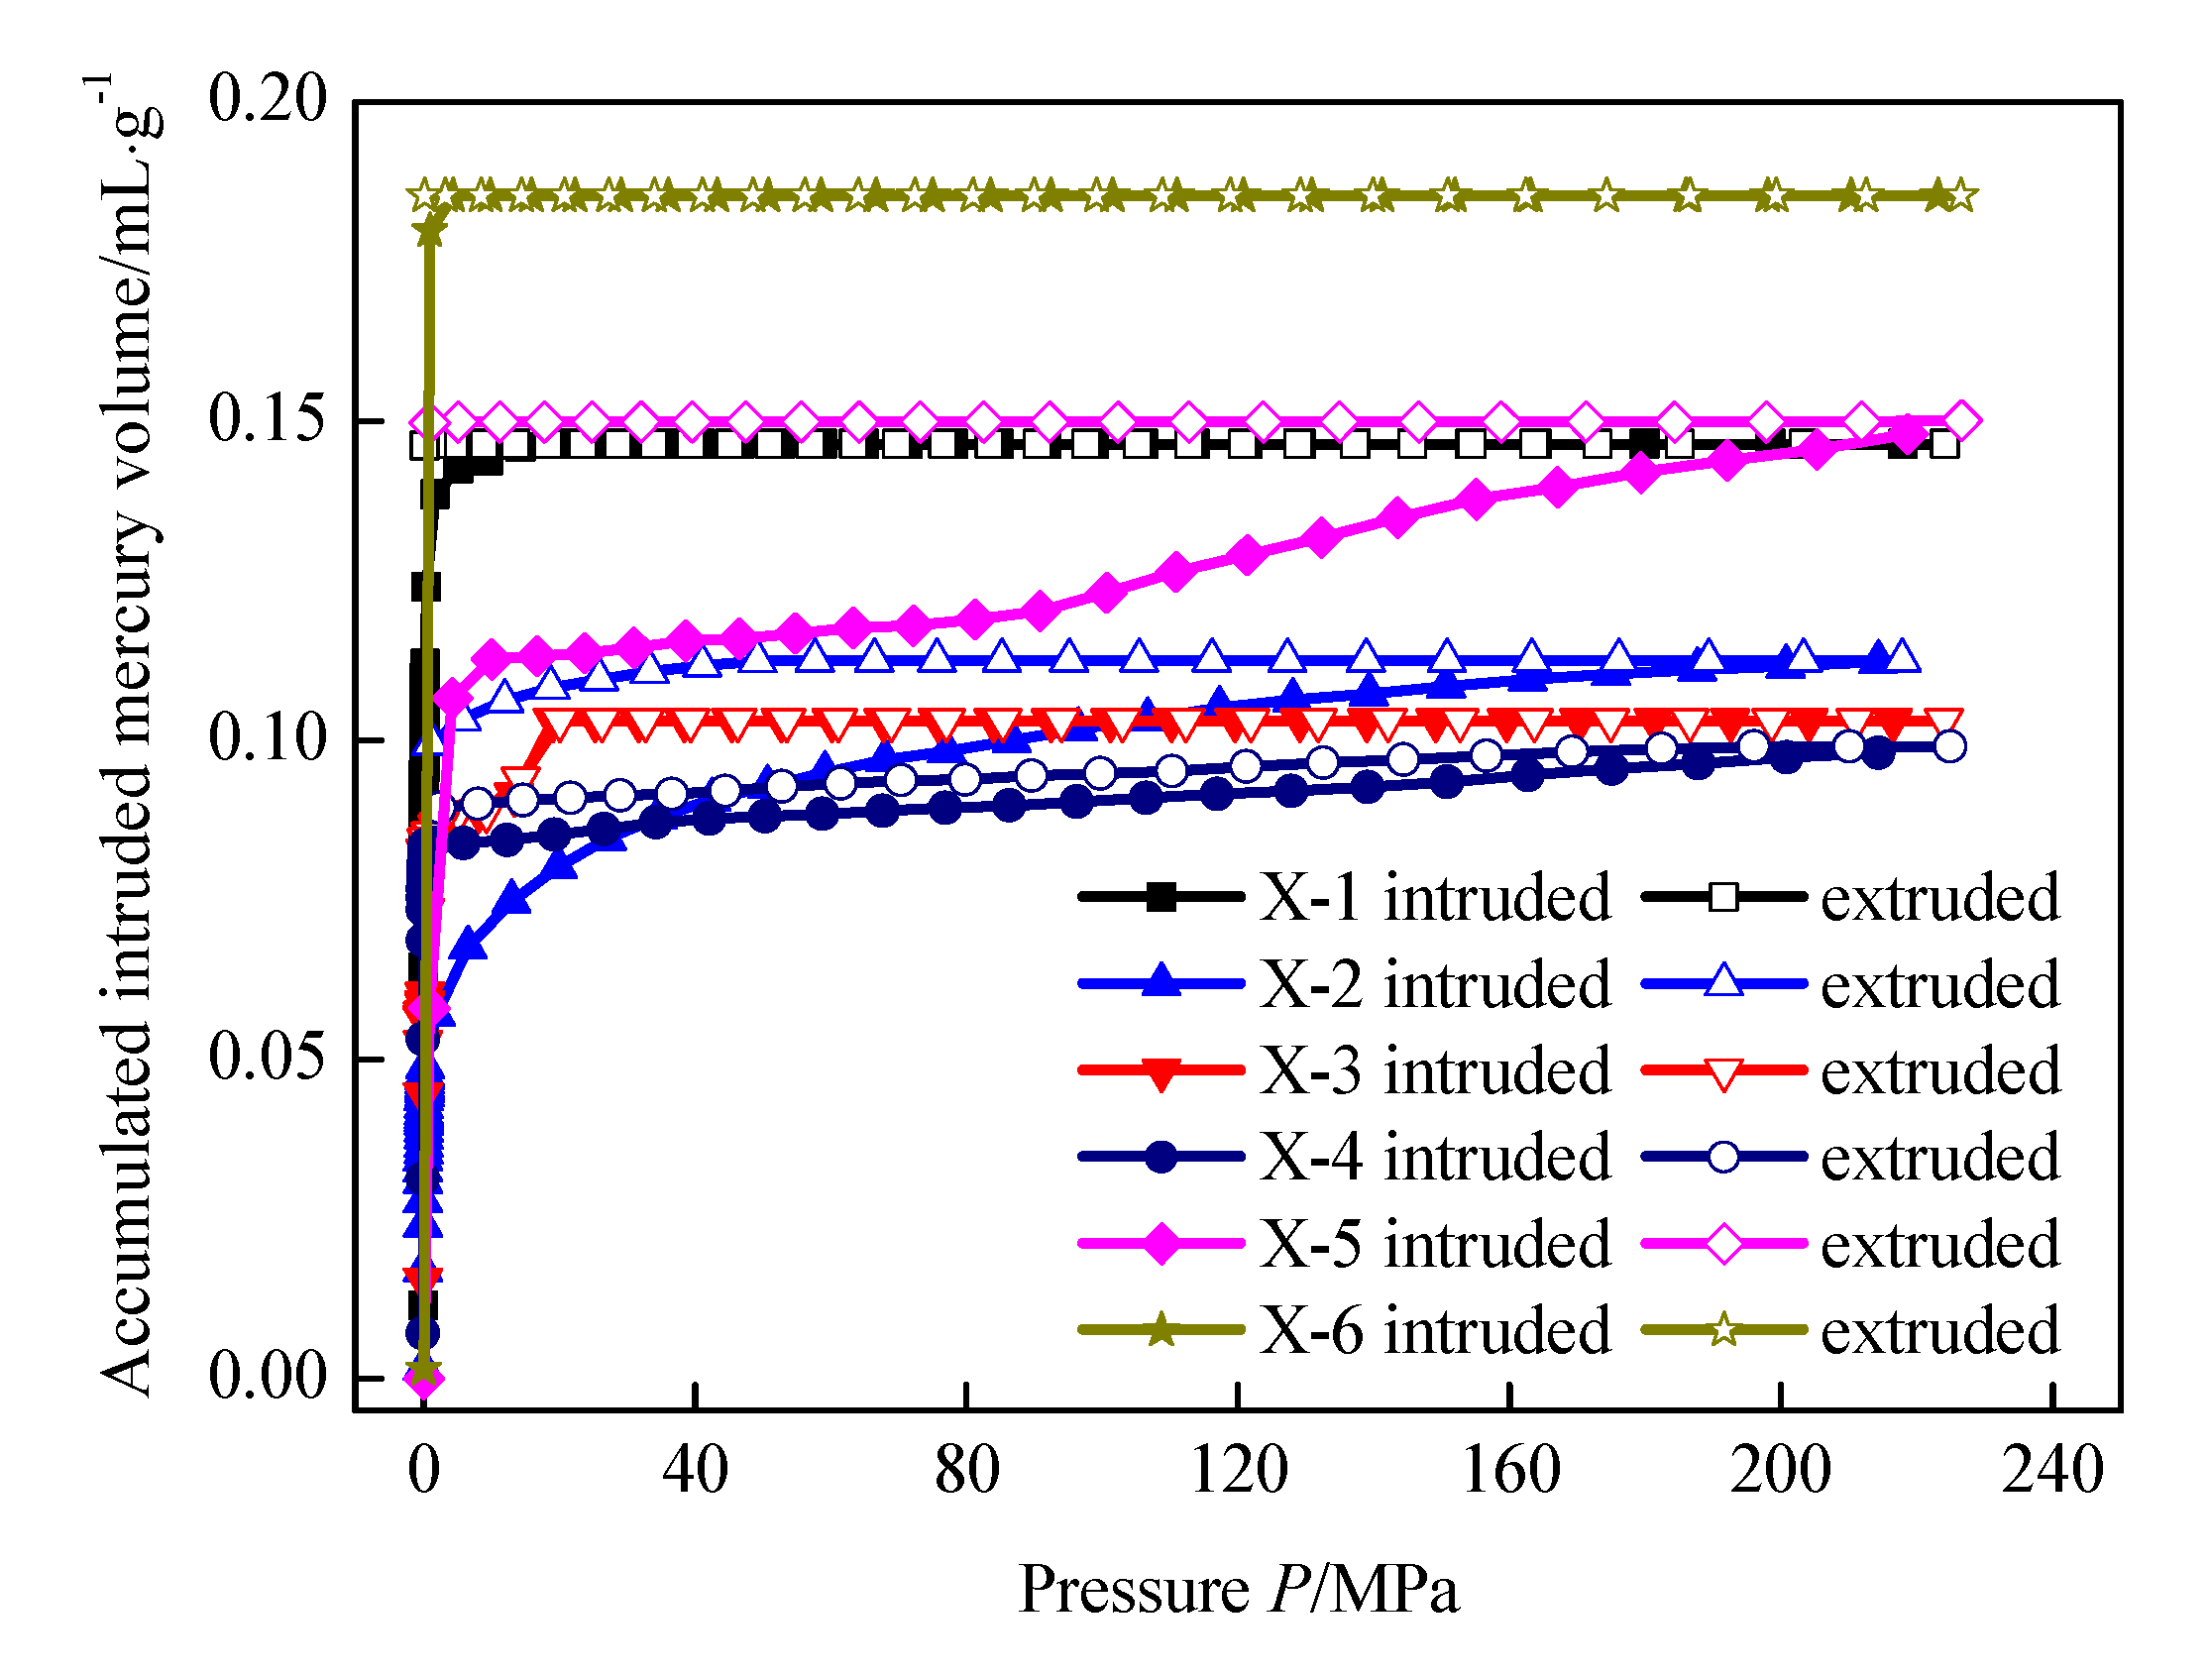
Figure 5.
Paths for experimental procedures (modified from [32]).
Figure 5.
Paths for experimental procedures (modified from [32]).
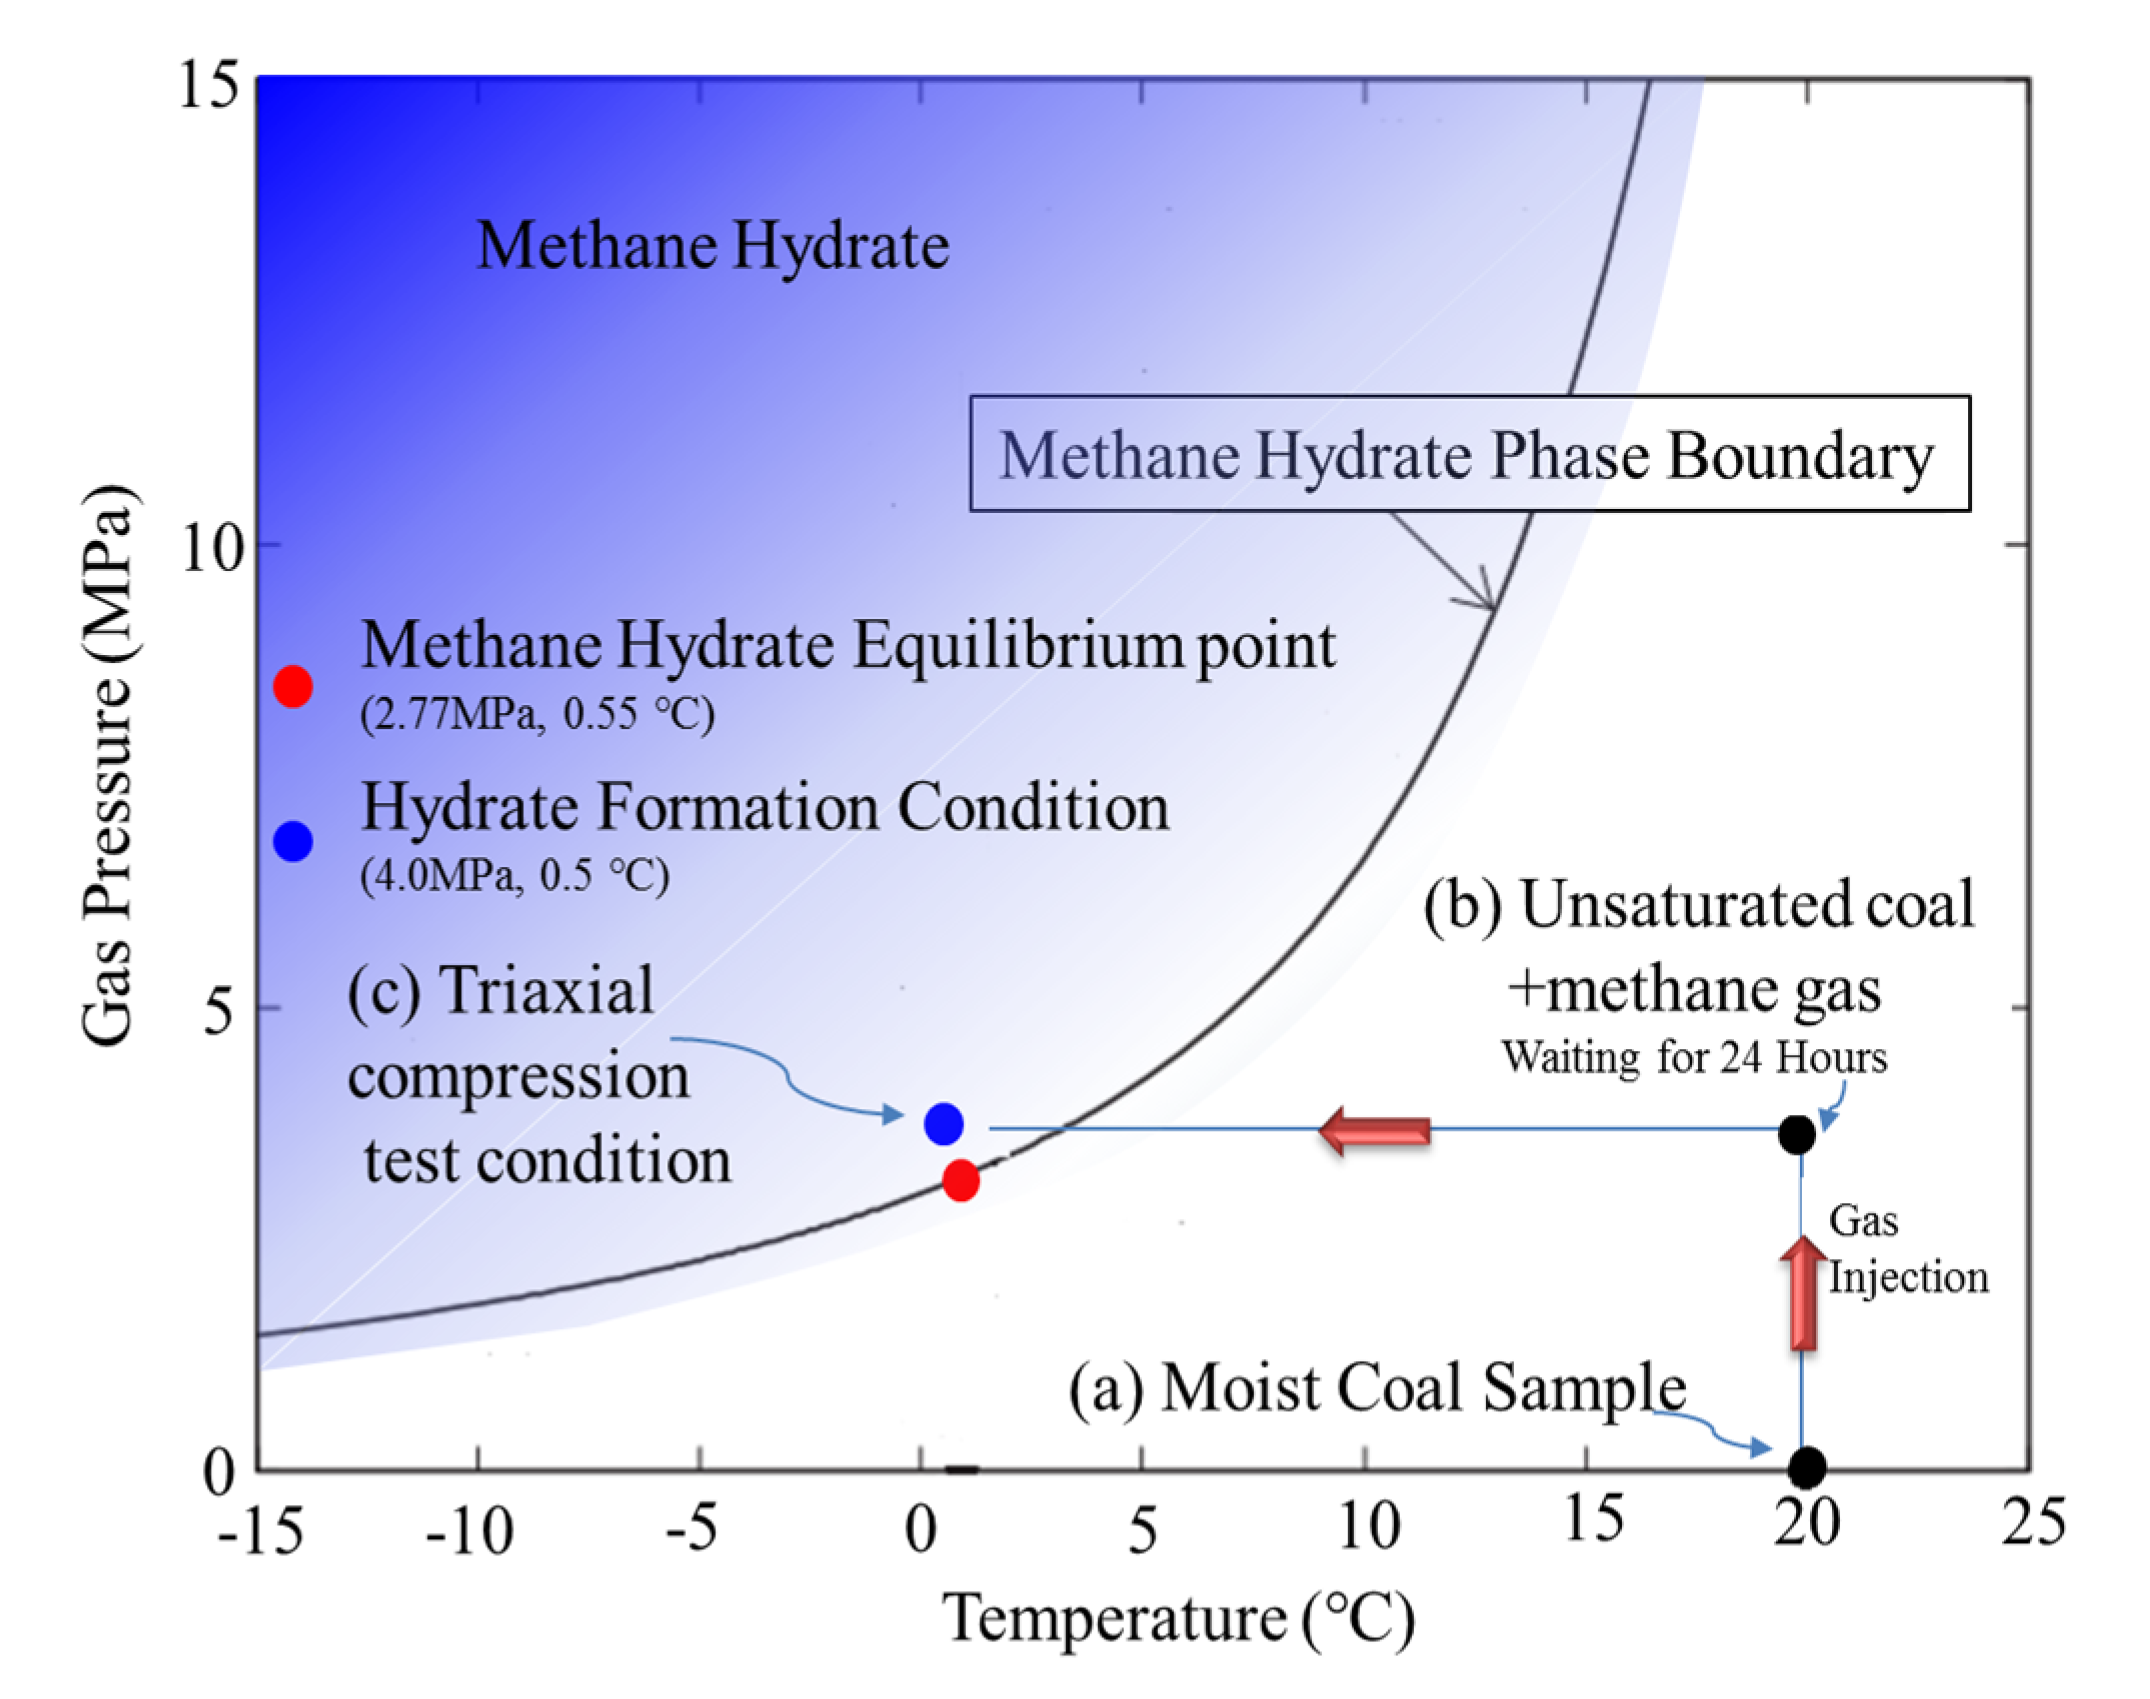
Figure 6.
Illustration of a typical complete stress–strain curve under triaxial compression for coal containing gas hydrate.
Figure 6.
Illustration of a typical complete stress–strain curve under triaxial compression for coal containing gas hydrate.
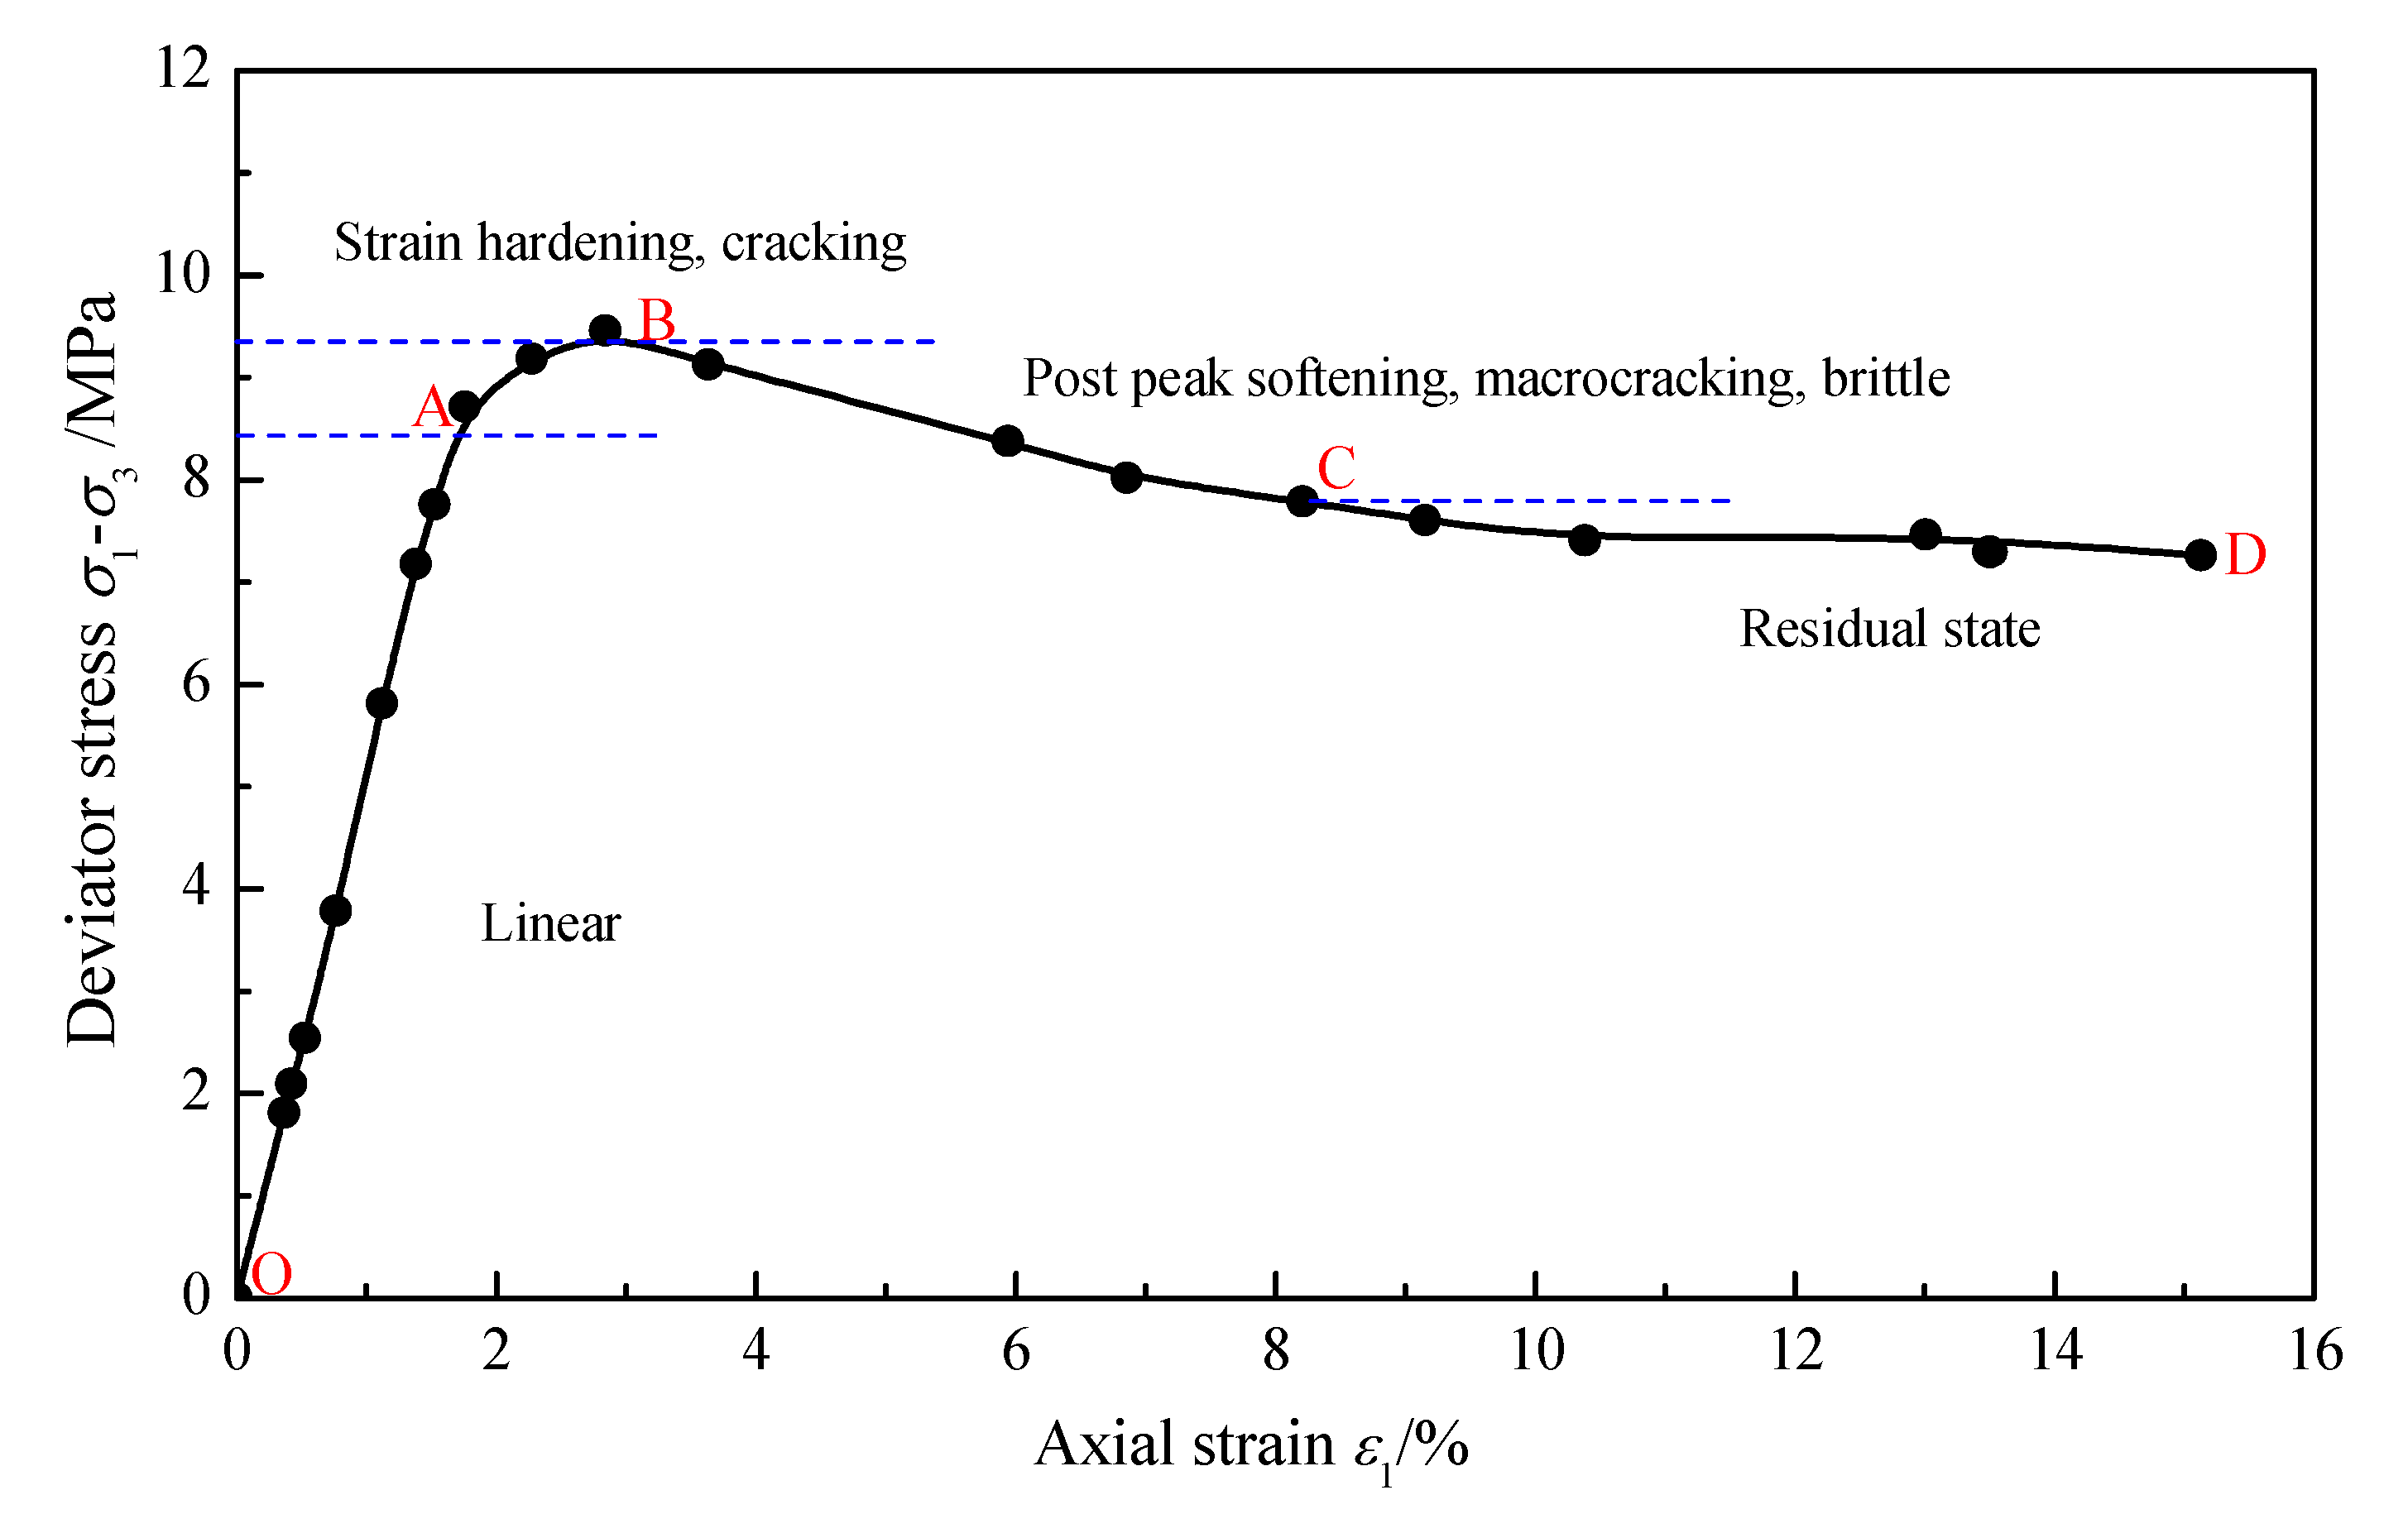
Figure 7.
Stress–strain curves of the specimens.
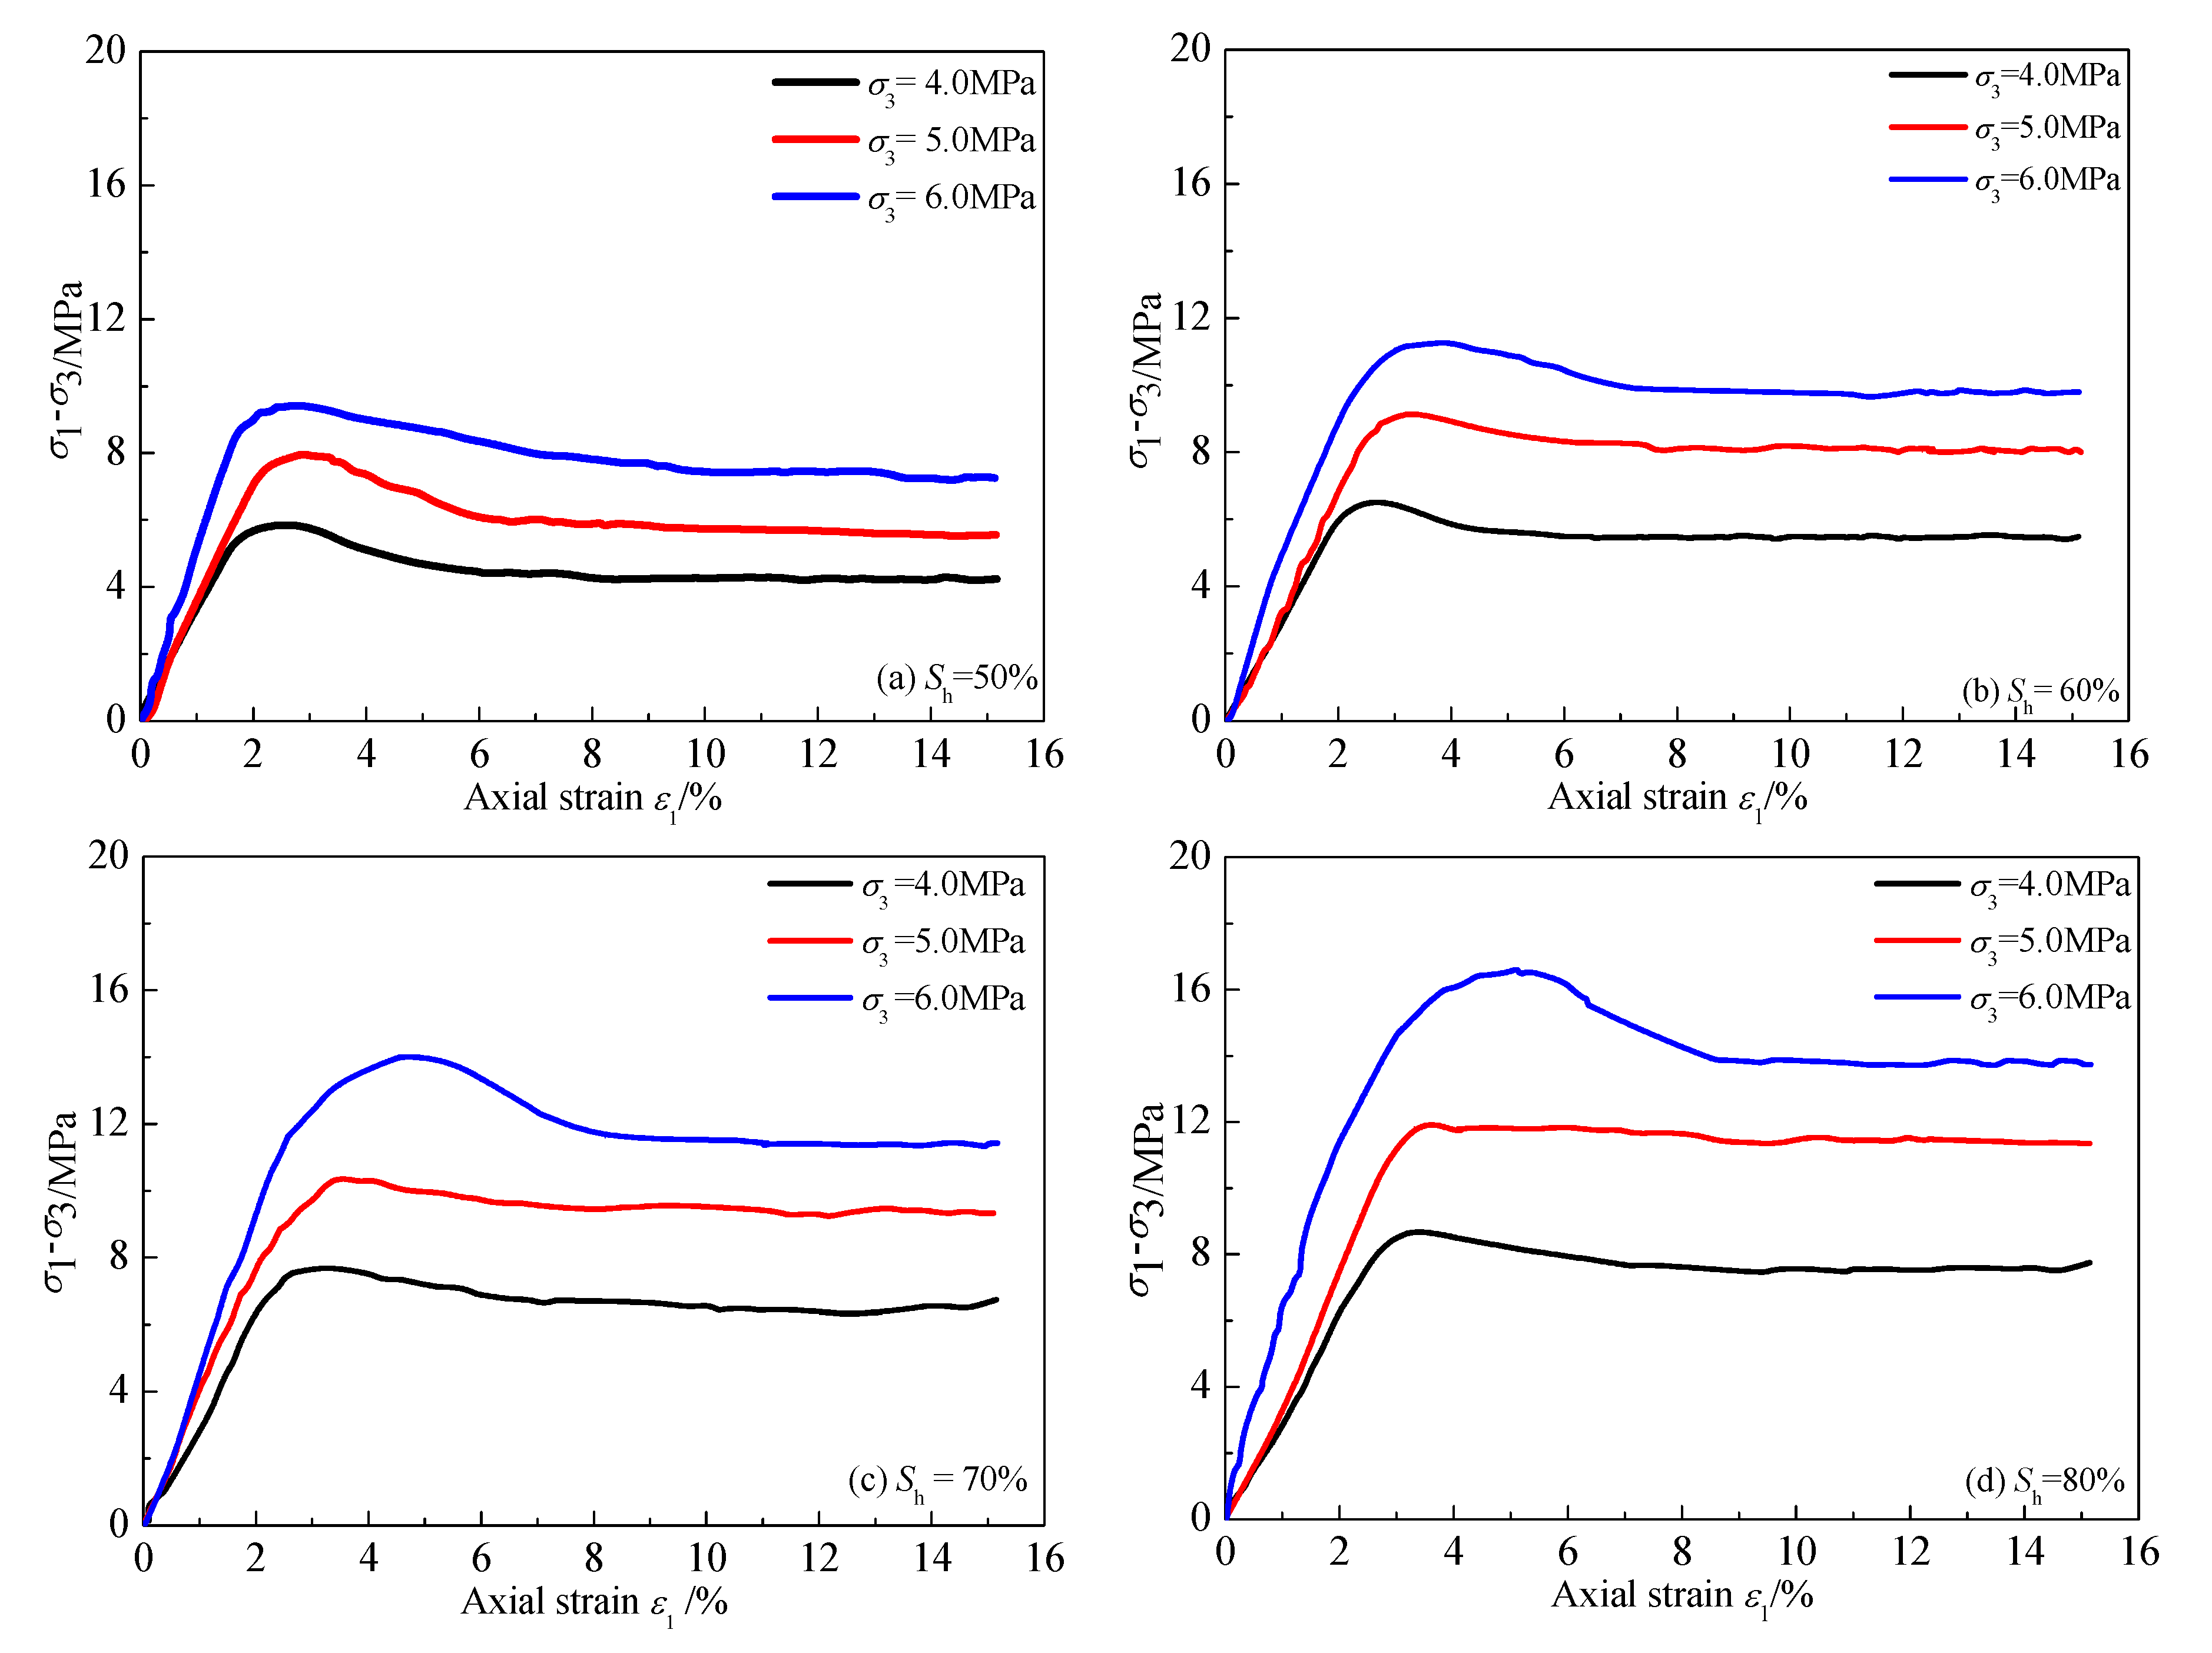
Figure 8.
Variation of the peak strength with the hydrate saturation.

Figure 9.
Variation of the peak strength with the confining pressure.
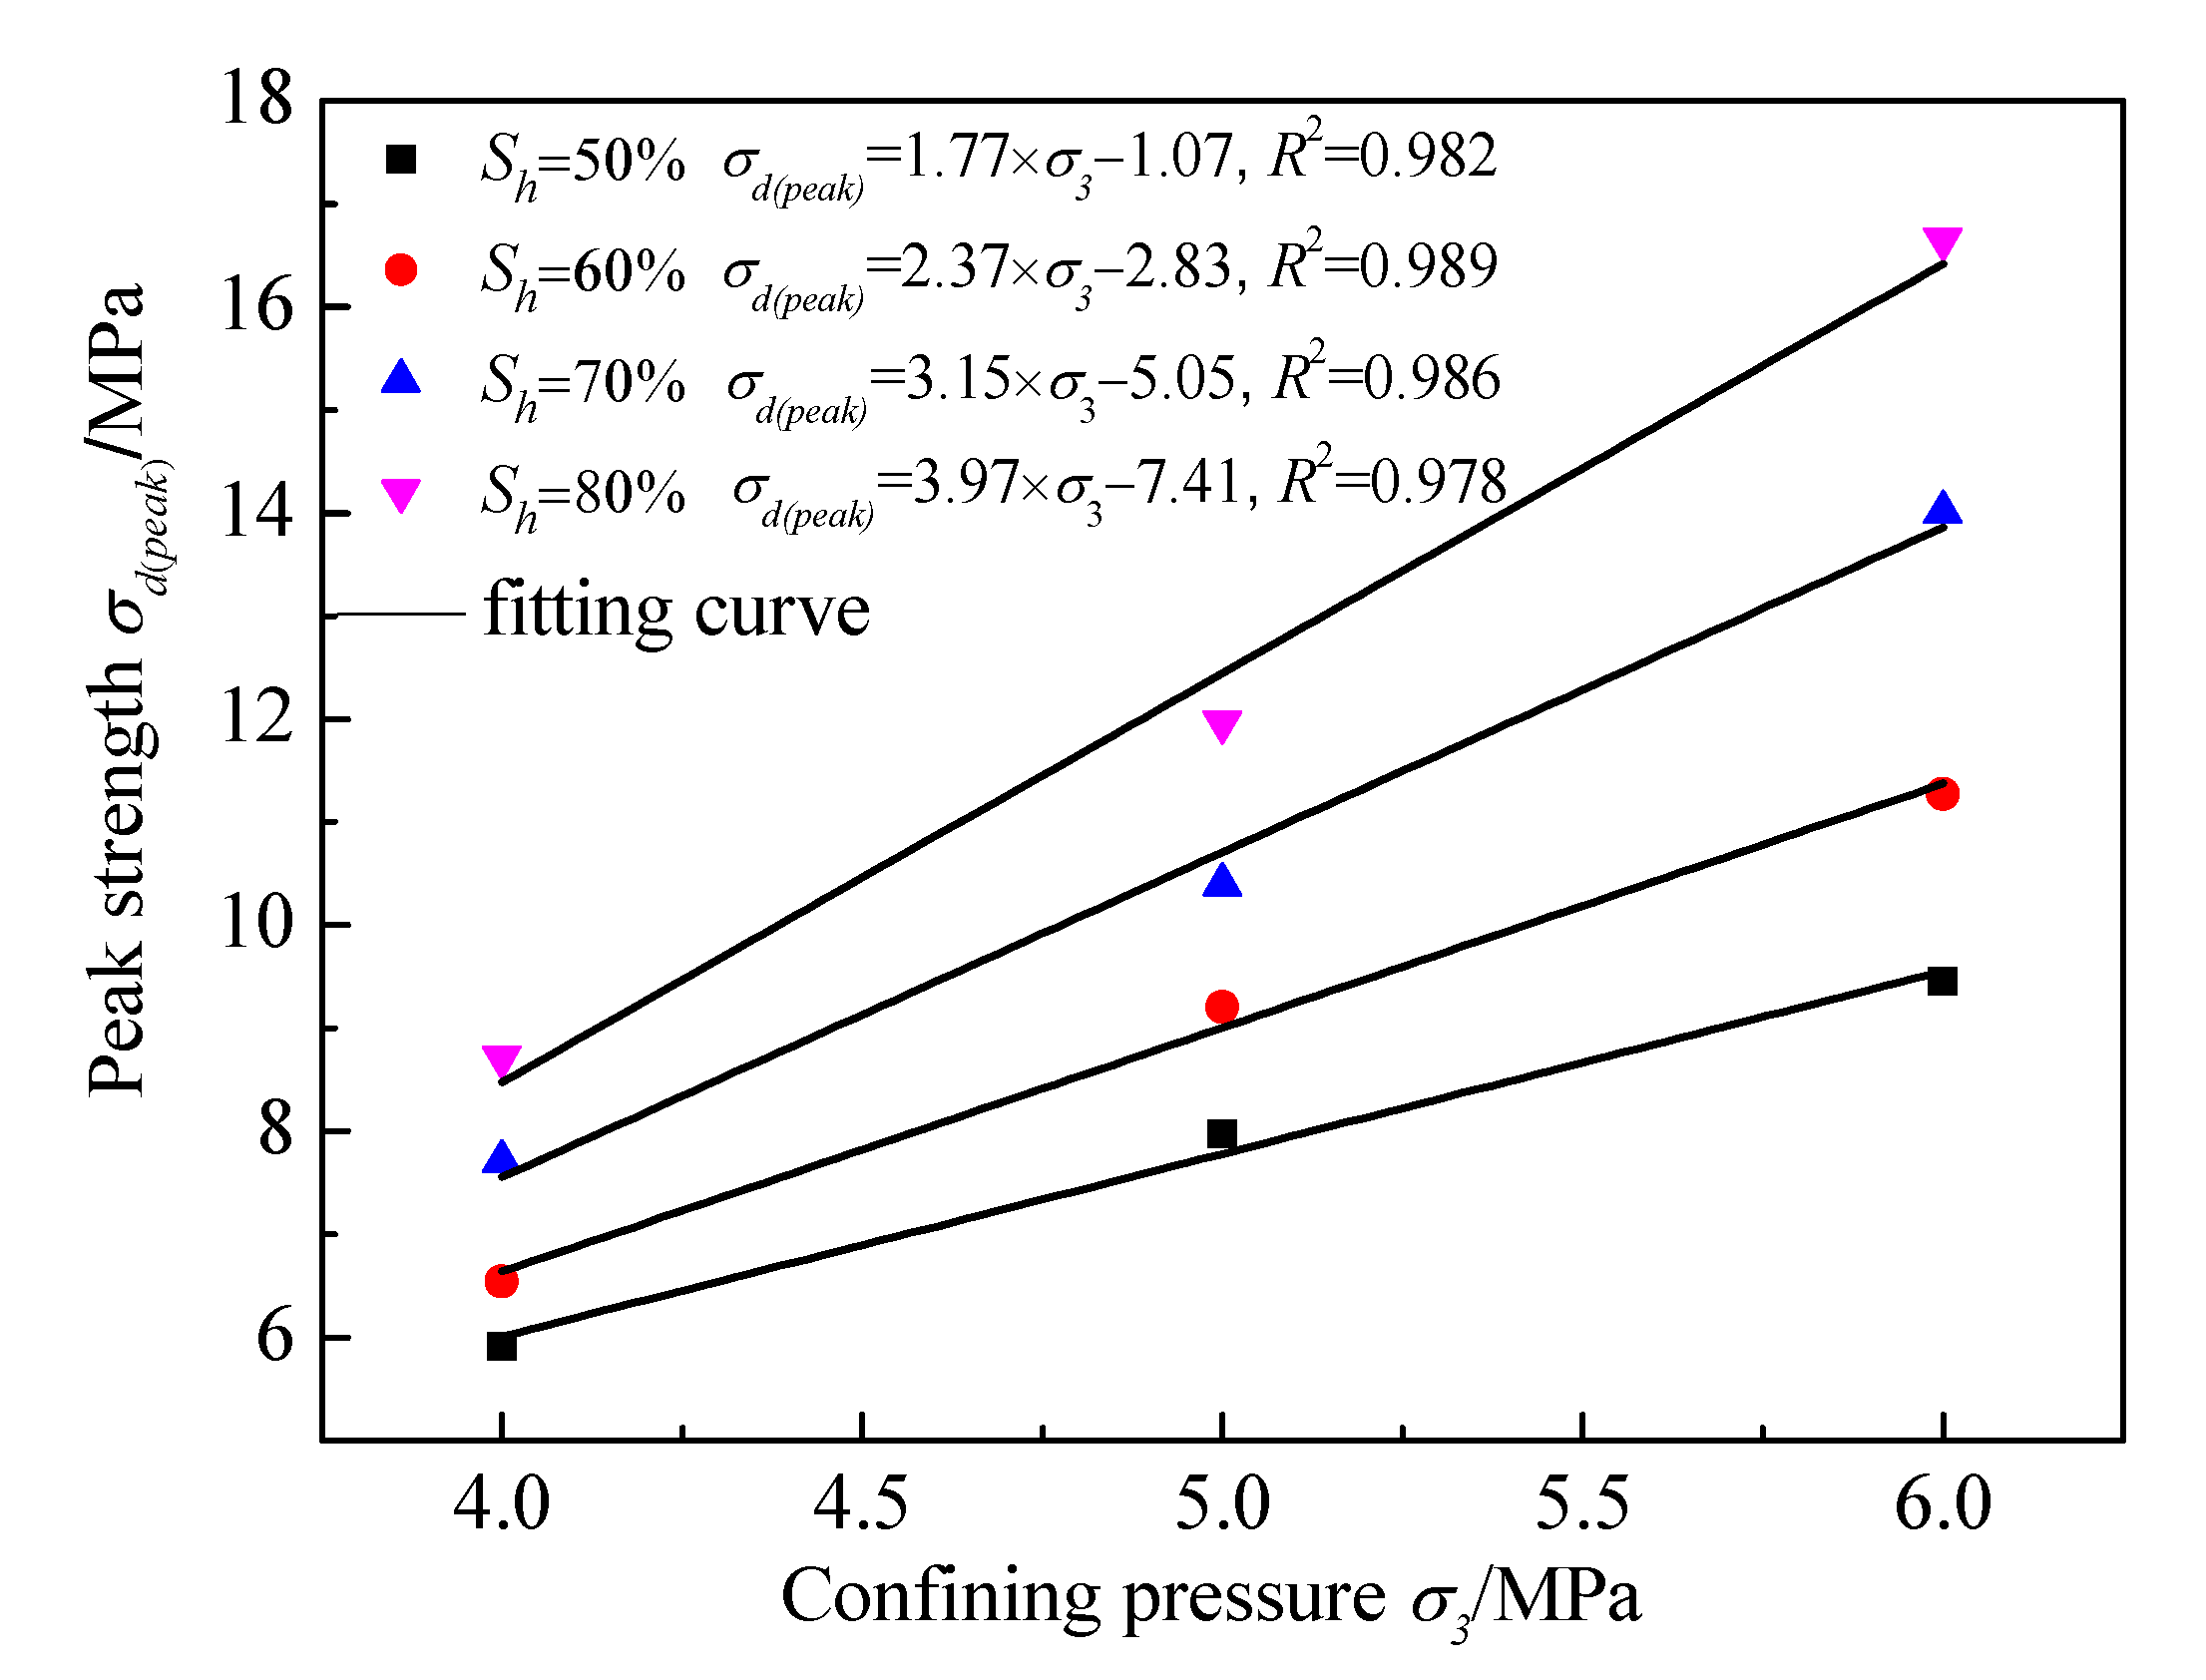
Figure 10.
Variation of the residual strength with the hydrate saturation.
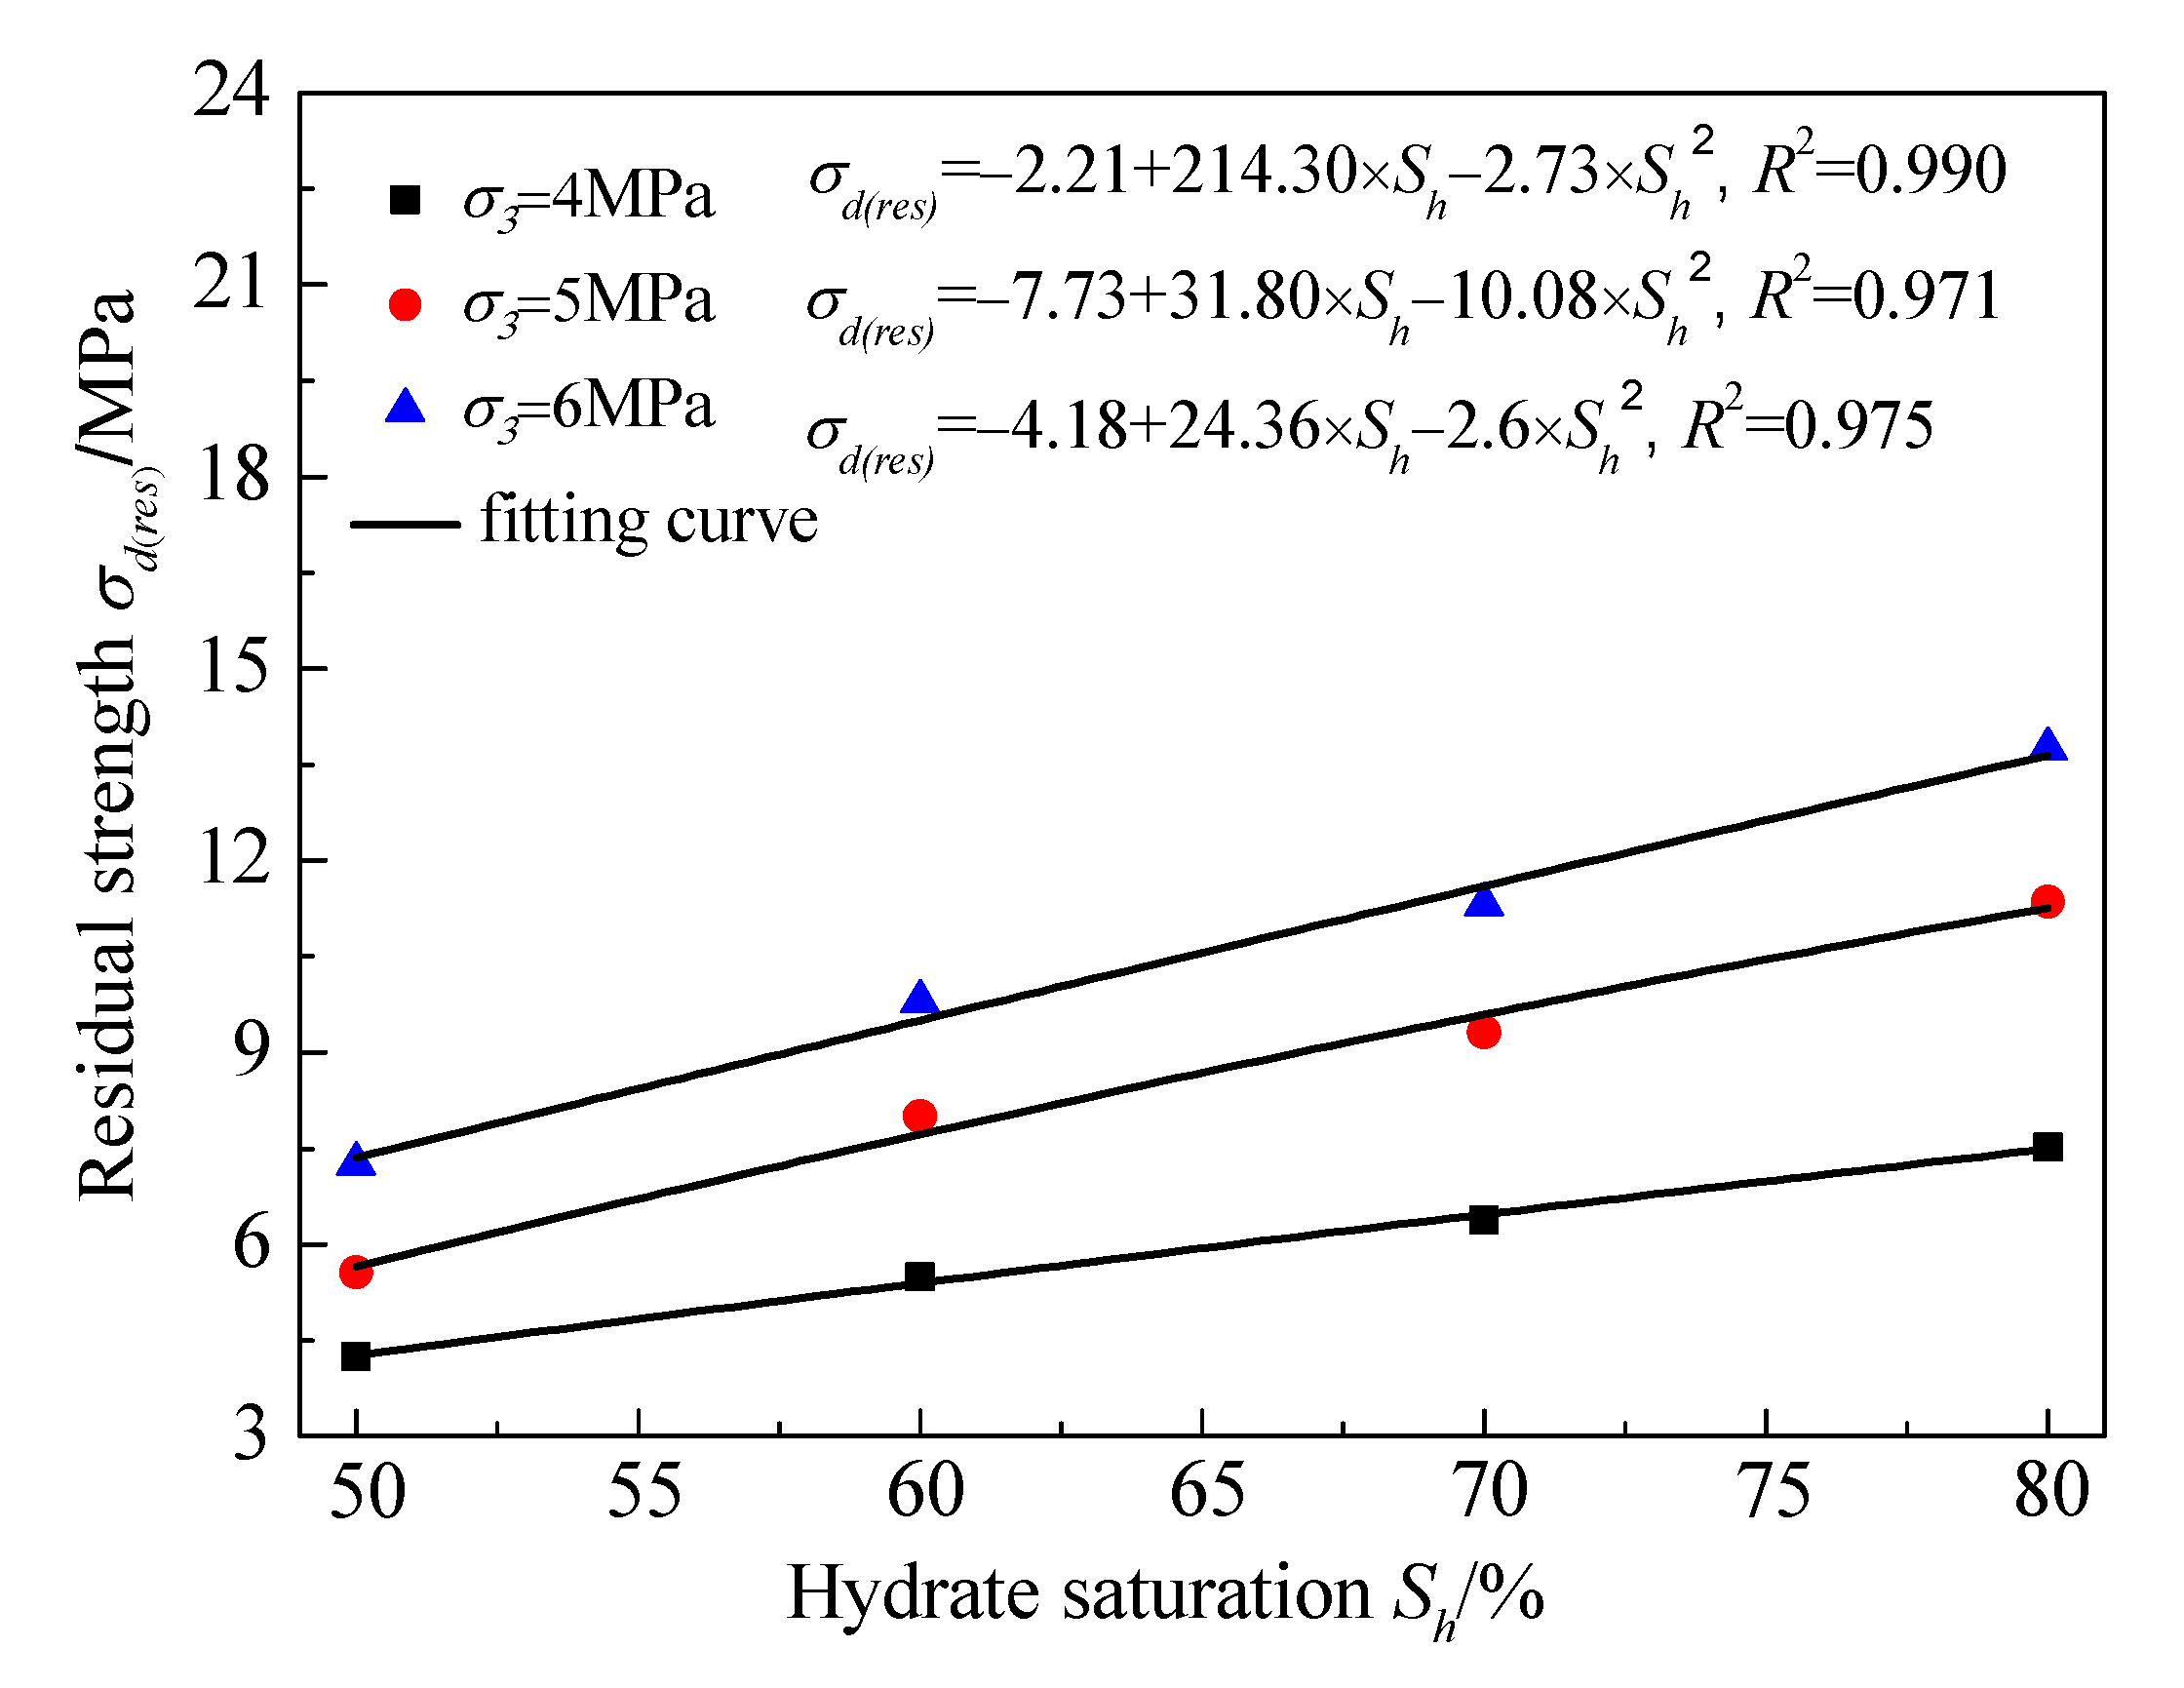
Figure 11.
Variation of the residual strength with the confining pressure.
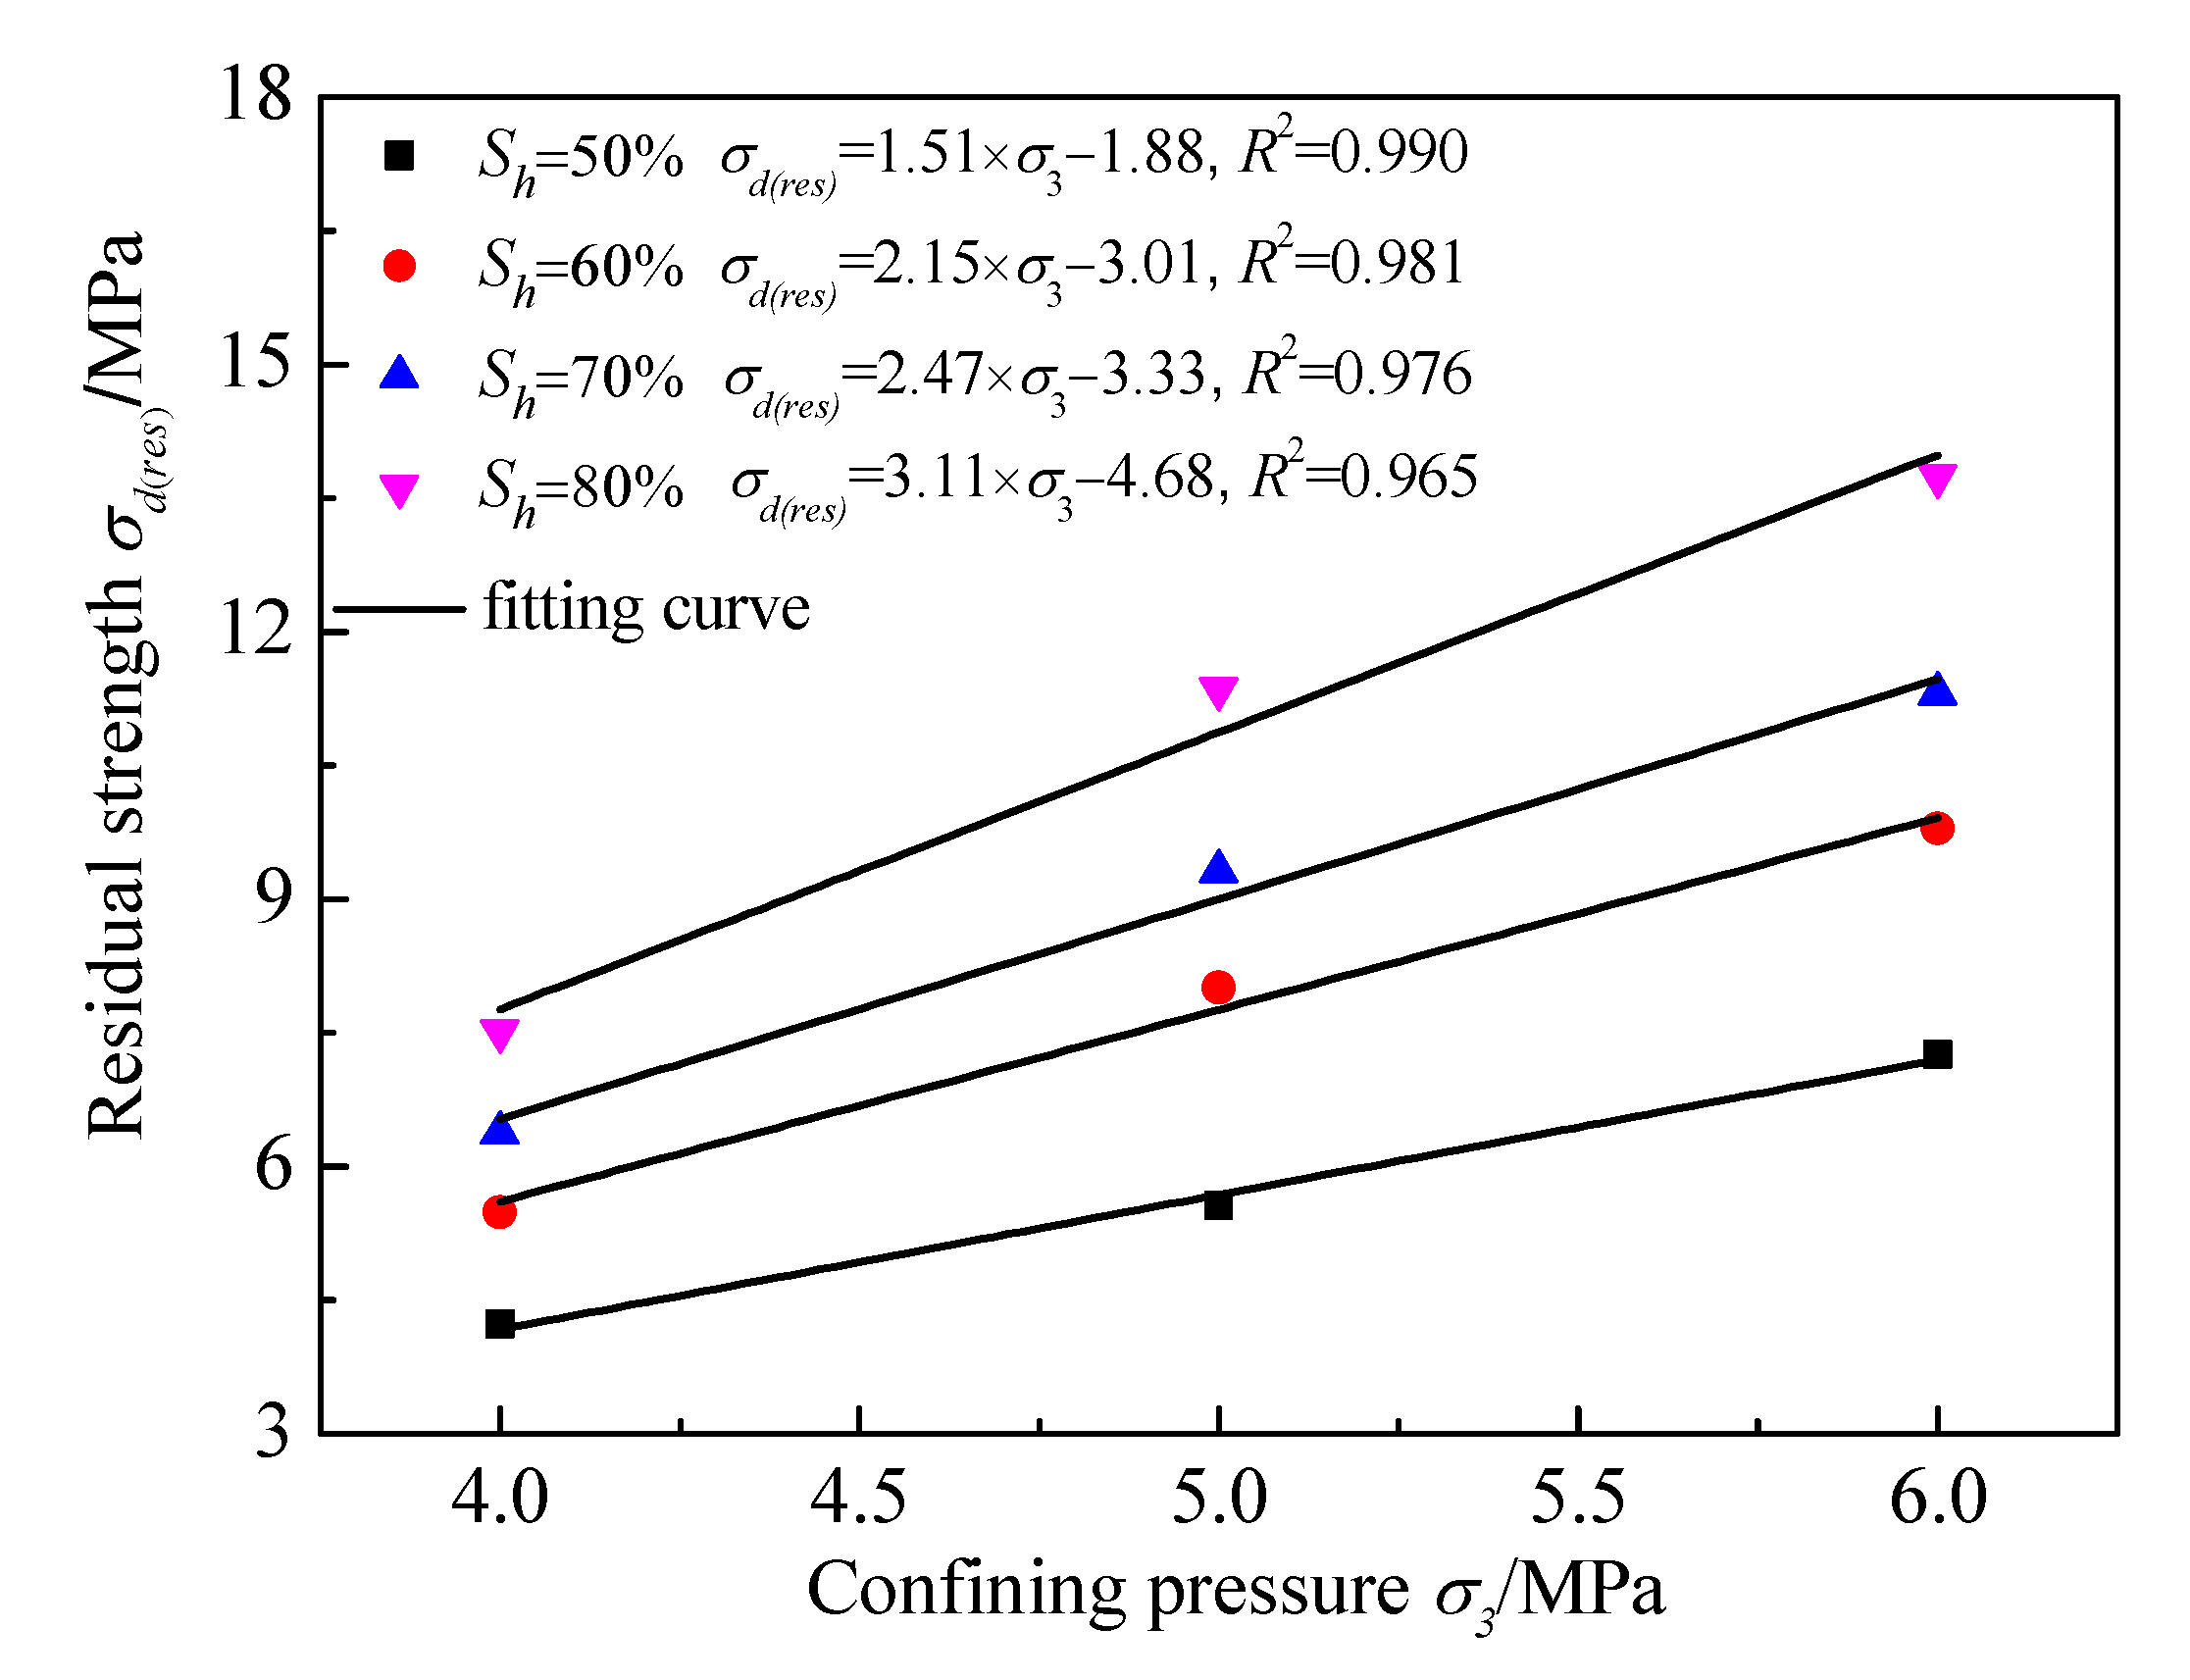
Figure 12.
Residual deviator stress versus maximum deviator stress at various methane hydrate saturations and confining pressure during testing.
Figure 12.
Residual deviator stress versus maximum deviator stress at various methane hydrate saturations and confining pressure during testing.
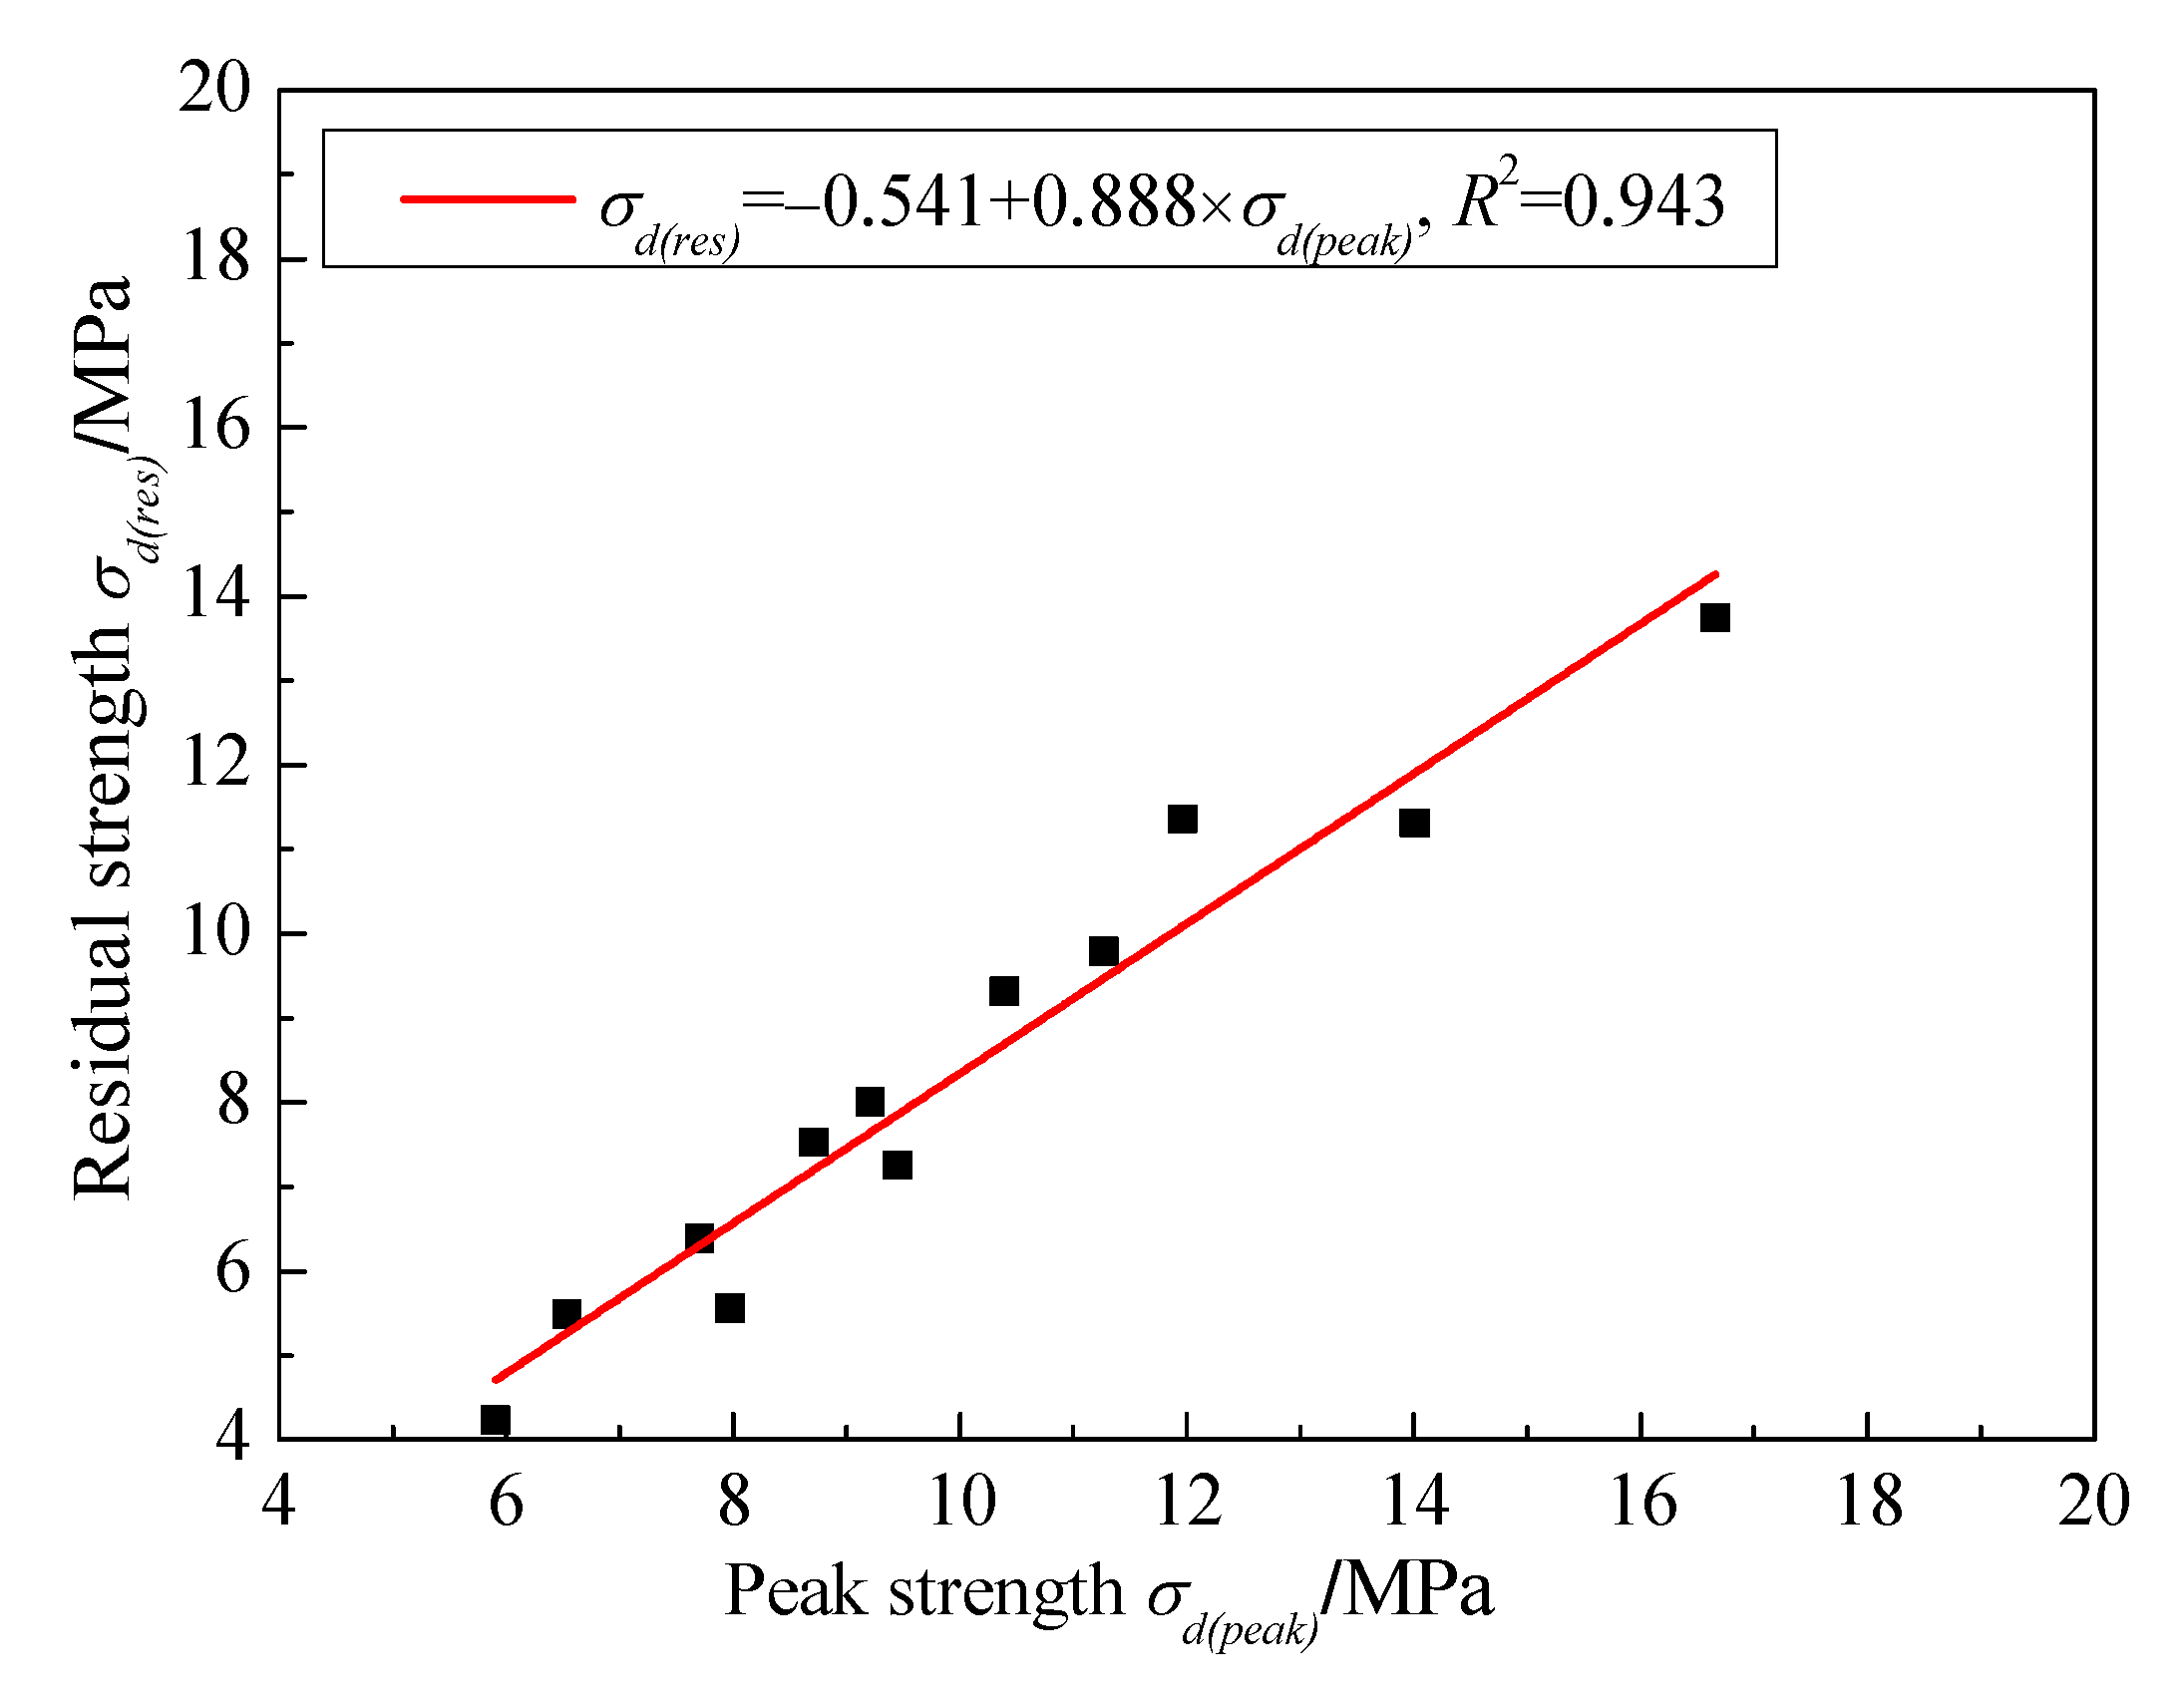
Figure 13.
Variation of the peak strain with the hydrate saturation.
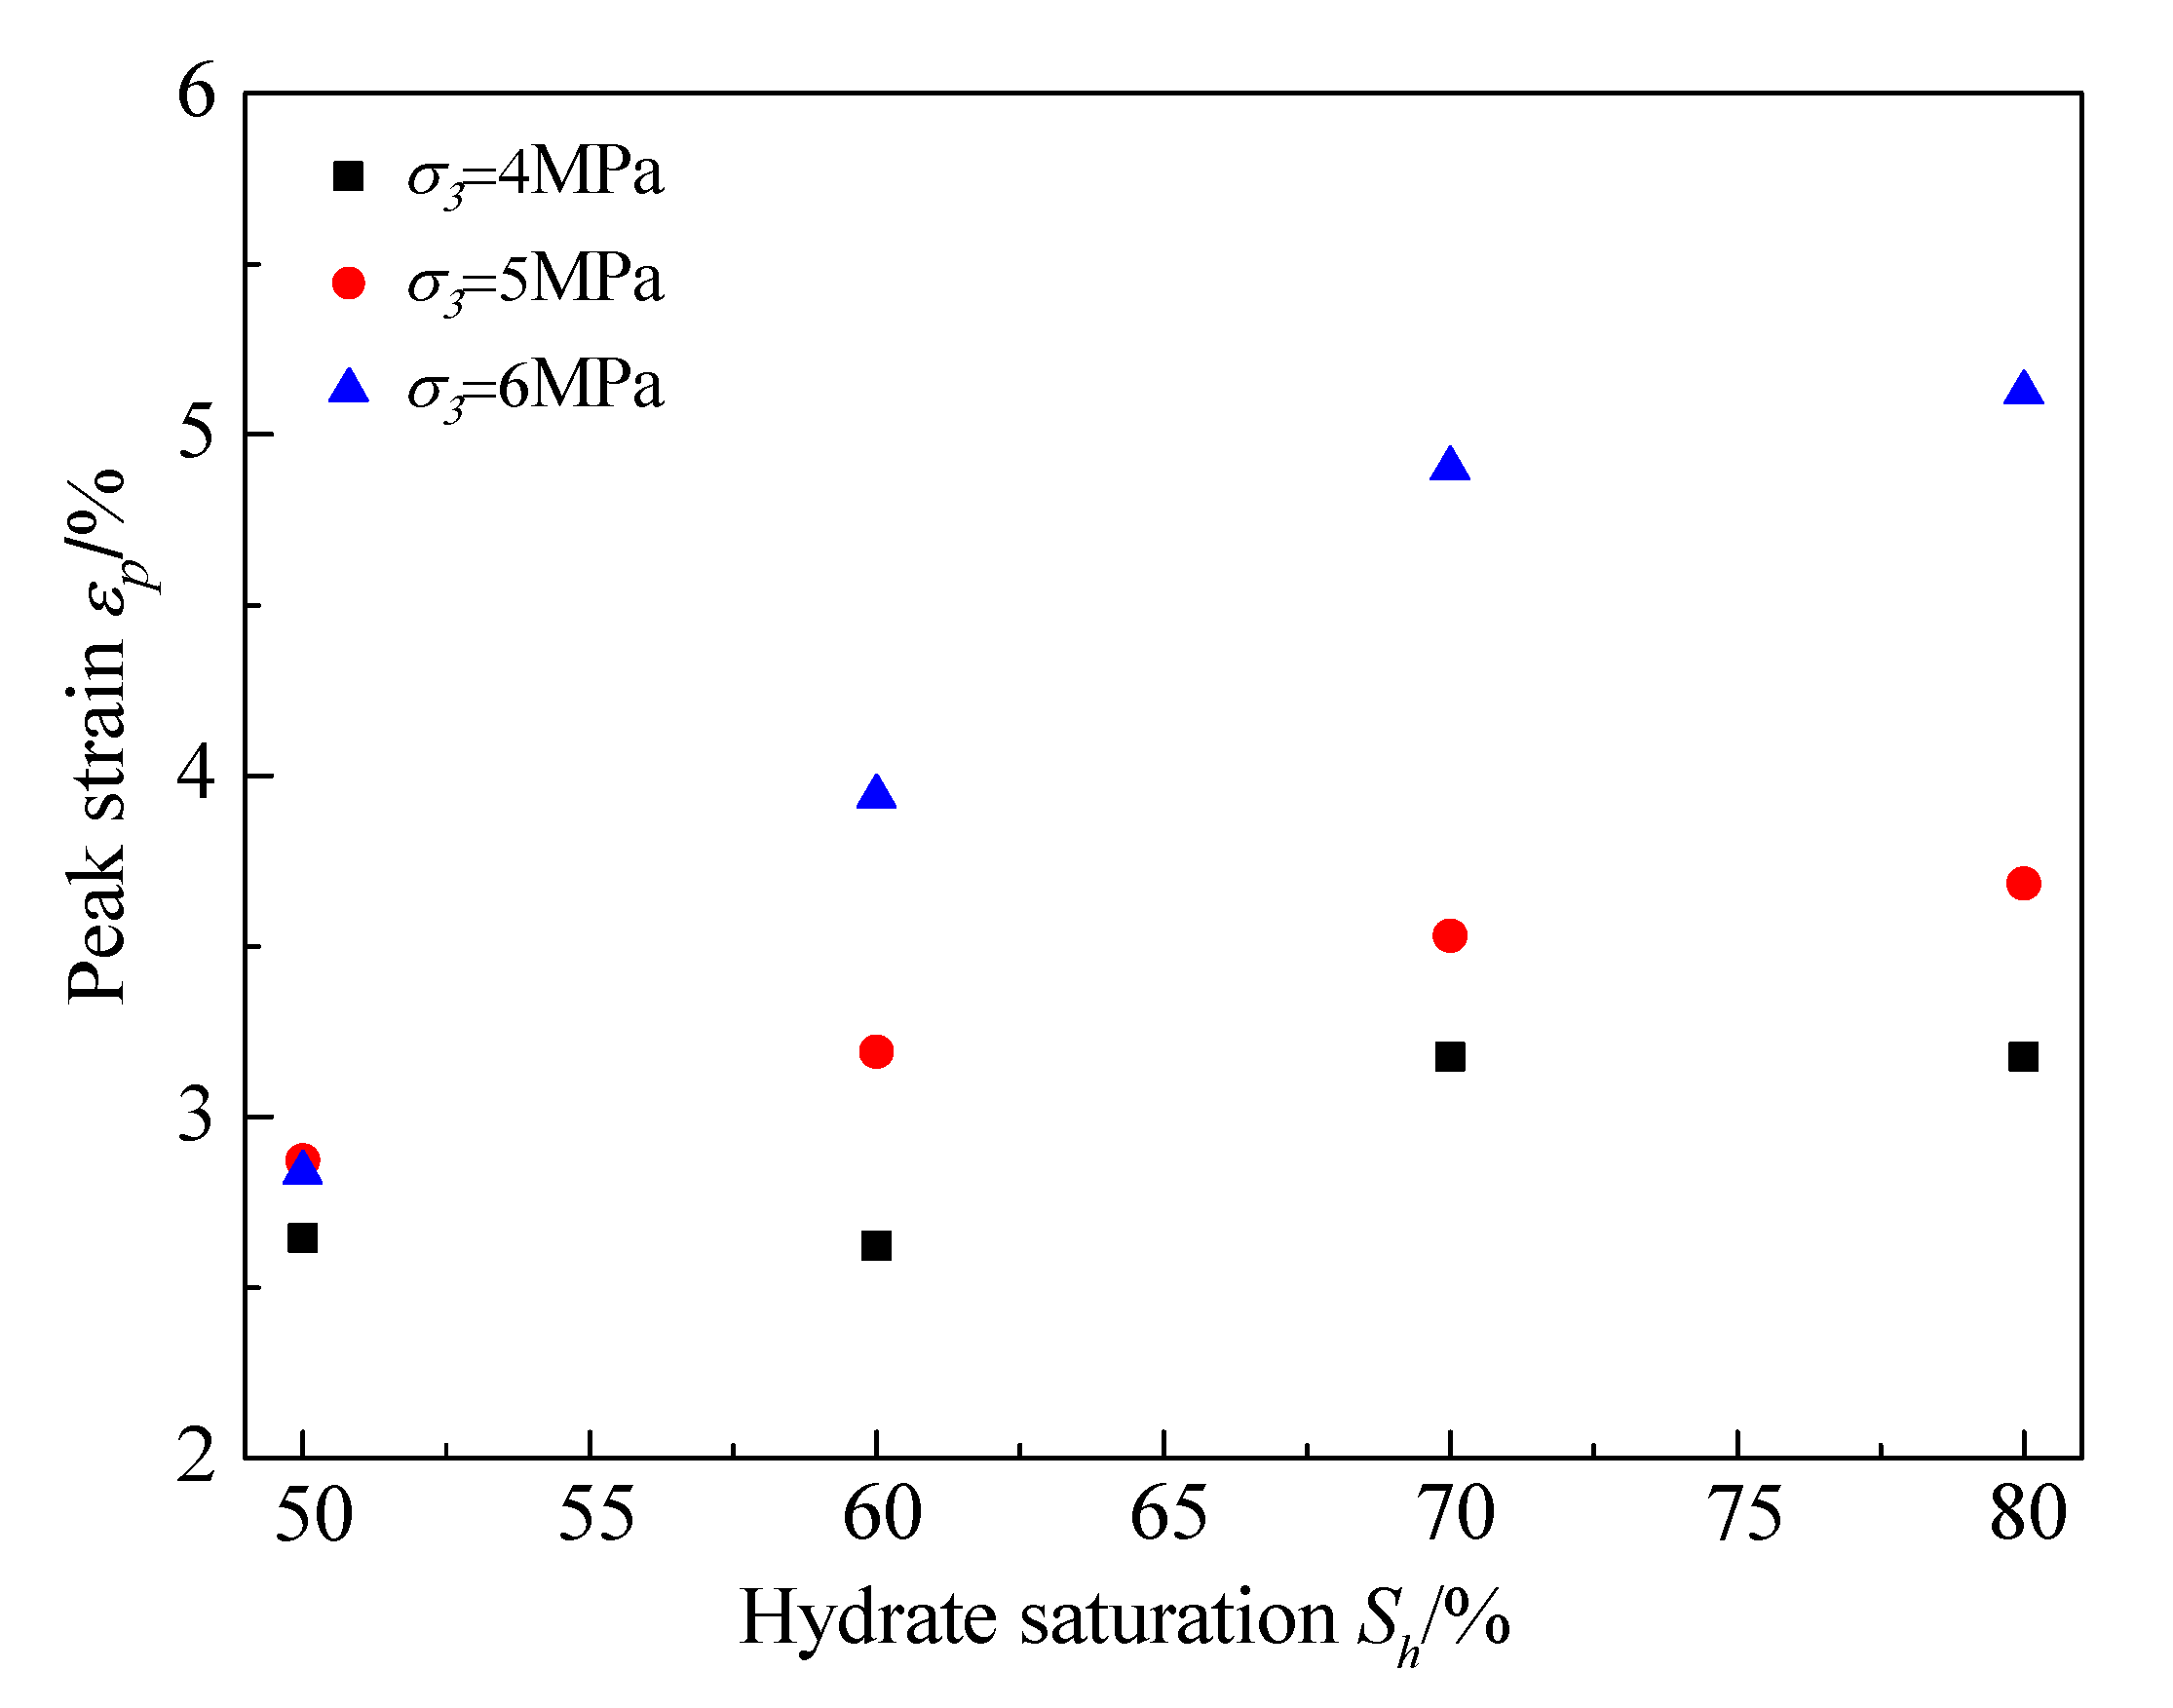
Figure 14.
Variation of the peak strain with the confining pressure.
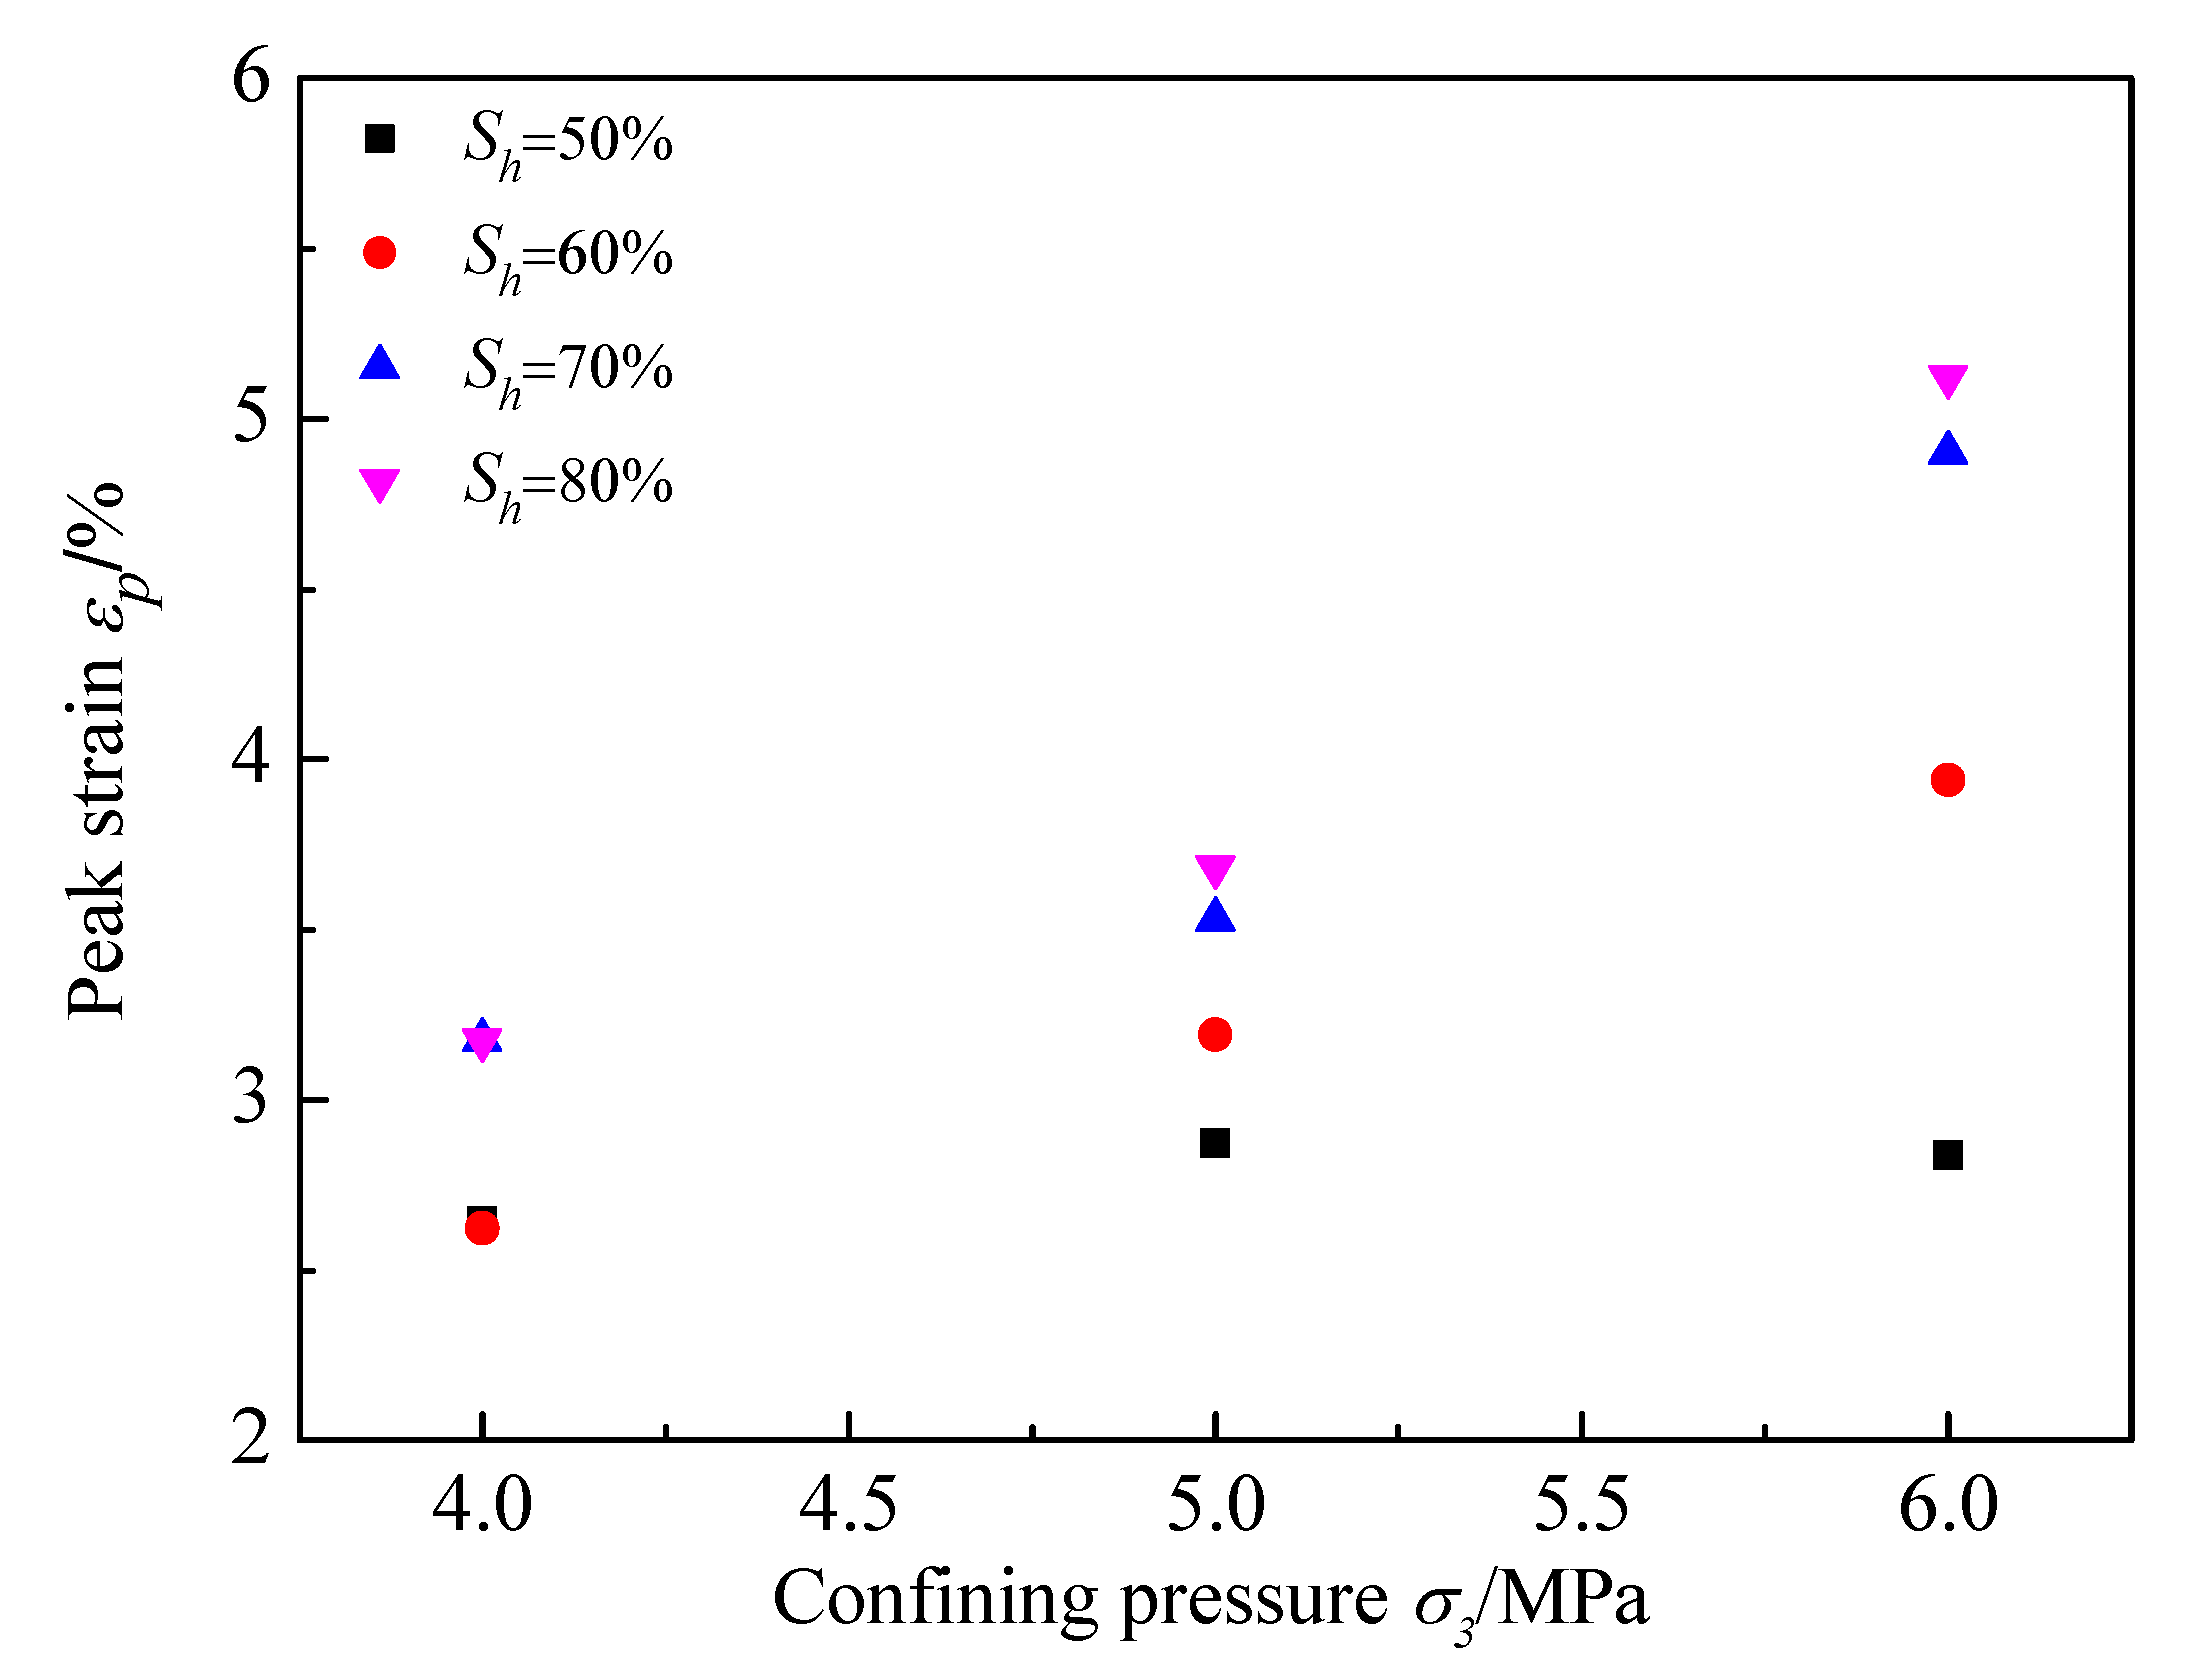
Figure 15.
Variation of the elastic modulus with the confining pressure.

Table 1.
Pore volume distribution.
| Test No. | Pore Volume mL/g | Total Pore Volume mL/g | |||
|---|---|---|---|---|---|
| Macro-Pore | Meso-Pore | Micro-Pore | Super-Micro Pore | ||
| X-1 | 0.1239 | 0.022 | 0.0005 | 0 | 0.1464 |
| X-2 | 0.0488 | 0.026 | 0.0325 | 0.005 | 0.1123 |
| X-3 | 0.0853 | 0.0062 | 0.0116 | 0 | 0.1031 |
| X-4 | 0.0839 | 0.0005 | 0.0083 | 0.0053 | 0.098 |
| X-5 | 0.0581 | 0.0546 | 0.0222 | 0.013 | 0.1479 |
| X-6 | 0.1797 | 0.0055 | 0 | 0 | 0.1852 |
Table 2.
Experimental matrix.
| Scheme | Specimen No. | Confining Pressure/MPa | Initial Water Content/g | Temperature/°C | Target Hydrate Saturation/% | Gas Pressure/MPa |
|---|---|---|---|---|---|---|
| I | 50(4) | 4.0 | 19.52 | 0.5 | 50 | 4 |
| 50(5) | 5.0 | 0.5 | 4 | |||
| 50(6) | 6.0 | 0.5 | 4 | |||
| II | 60(4) | 4.0 | 23.42 | 0.5 | 60 | 4 |
| 60(5) | 5.0 | 0.5 | 4 | |||
| 60(6) | 6.0 | 0.5 | 4 | |||
| III | 70(4) | 4.0 | 27.32 | 0.5 | 70 | 4 |
| 70(5) | 5.0 | 0.5 | 4 | |||
| 70(6) | 6.0 | 0.5 | 4 | |||
| IV | 80(4) | 4.0 | 31.23 | 0.5 | 80 | 4 |
| 80(5) | 5.0 | 0.5 | 4 | |||
| 80(6) | 6.0 | 0.5 | 4 |
Table 3.
Summary of results from triaxial compression tests.
| Specimen No. | Confining Pressure/MPa | Target Hydrate Saturation/% | Peak Stress /MPa | Residual Deviator Stress /MPa | Maximum Strain /10−2 | Elastic Modulus /MPa |
|---|---|---|---|---|---|---|
| 50(4) | 4.0 | 50 | 5.86 | 4.43 | 2.645 | 343.65 |
| 50(5) | 5.0 | 7.88 | 5.99 | 2.873 | 358.96 | |
| 50(6) | 6.0 | 9.38 | 7.40 | 2.838 | 514.02 | |
| 60(4) | 4.0 | 60 | 6.48 | 5.78 | 2.622 | 297.18 |
| 60(5) | 5.0 | 9.07 | 8.33 | 3.190 | 345.46 | |
| 60(6) | 6.0 | 11.29 | 9.88 | 3.940 | 485.82 | |
| 70(4) | 4.0 | 70 | 7.71 | 6.75 | 3.176 | 297.03 |
| 70(5) | 5.0 | 10.31 | 9.65 | 3.530 | 407.45 | |
| 70(6) | 6.0 | 14.00 | 11.63 | 4.902 | 483.43 | |
| 80(4) | 4.0 | 80 | 8.68 | 7.67 | 3.176 | 298.56 |
| 80(5) | 5.0 | 11.93 | 11.76 | 3.683 | 363.33 | |
| 80(6) | 6.0 | 16.59 | 13.84 | 5.124 | 612.04 |
© 2018 by the authors. Licensee MDPI, Basel, Switzerland. This article is an open access article distributed under the terms and conditions of the Creative Commons Attribution (CC BY) license (http://creativecommons.org/licenses/by/4.0/).
Share and Cite
MDPI and ACS Style
Gao, X.; Yang, T.; Yao, K.; Zhang, B.; Wu, Q.; Liu, C. Mechanical Performance of Methane Hydrate–Coal Mixture. Energies 2018, 11, 1562. https://doi.org/10.3390/en11061562
AMA Style
Gao X, Yang T, Yao K, Zhang B, Wu Q, Liu C. Mechanical Performance of Methane Hydrate–Coal Mixture. Energies. 2018; 11(6):1562. https://doi.org/10.3390/en11061562
Chicago/Turabian StyleGao, Xia, Tongchuan Yang, Kai Yao, Baoyong Zhang, Qiang Wu, and Chuanhai Liu. 2018. "Mechanical Performance of Methane Hydrate–Coal Mixture" Energies 11, no. 6: 1562. https://doi.org/10.3390/en11061562
Note that from the first issue of 2016, this journal uses article numbers instead of page numbers. See further details here.