Article

Regional Determinants of Energy Efficiency: Residential Energy Demand in Japan

Association of International Arts and Science, Yokohama City University, 22-2 Seto, Kanazawa-ku, Yokohama 236-0027, Japan
Energies 2018, 11(6), 1557; https://doi.org/10.3390/en11061557
Submission received: 11 May 2018 / Revised: 9 June 2018 / Accepted: 13 June 2018 / Published: 14 June 2018

Abstract

:
Controlling the rapid growth of residential energy demand and enhancing energy efficiency are key policy issues in Japan. Thus, this study aims to estimate a residential energy demand function by conducting a stochastic frontier analysis and analyze the regional determinants of energy efficiency. The results indicate that population density and electrification rate foster energy efficiency and exert the same degree of impact. The study also highlights that population concentration has a nonlinear effect on energy efficiency. In other words, when combined with population concentration, the promotion of electrification policies can significantly contribute toward improving energy efficiency in the residential sector and consequently, have a positive effect on Japan’s regional economy.

1. Introduction

Lifestyle changes and a growing rate of households have significantly increased energy consumption in Japan’s residential sector. In fact, the sector reported a two-fold increase in its energy consumption compared to that during the first oil crisis in FY 2010 [1]. Residential energy consumption continues to increase even today owing to the diffusion of large-scale and diversified household electrical appliances. Therefore, fostering energy efficiency to overcome the effect of household appliance diffusion has become a crucial policy issue in Japan. Further, increasing energy efficiency in the residential sector and reducing energy consumption will reduce carbon dioxide emissions, thus contributing toward mitigating global warming.
Japan boasts of the highest level of energy consumption efficiency in the world [2]. Its energy conservation policy is based on the Law of Rational Use of Energy (or Energy Conservation Law), enacted in 1979 following the 1973 and 1979 oil crises. At the time, Japan feared a disruption in oil supply, which led to the enactment of the Law Concerning the Rational Use of Energy to promote efficient energy use. Since it implementation, the Law has been revised as per changing circumstances, although it remains in effect till date. As part of its attempts to increase energy efficiency, Japan adopted a top runner system in that the most efficient machinery or electrical appliances were set as the threshold or energy-saving standard for the entire industry. The system was introduced following an amendment to the Energy Conservation Law in 1998, which occurred after the Global Warming Prevention Conference (COP 3) held in Kyoto in December 1997. In its Long-term Energy Supply and Demand Outlook, the Ministry of Economy, Trade and Industry aims to reduce final energy demand by 50.3 million kl in terms of crude oil by 2030 on the premise of 1.7% economic growth per year.
From the viewpoint of land policy, population agglomeration may be a possible solution. To elaborate, energy efficiency in regions with spatially concentrated population receives more attention than that in regions with a dispersed populous. In cities characterized by high population density, most people live in multi-dwelling houses such as a condominium with more concrete structures, narrower rooms, and smaller windows than detached houses. In this case, energy use is more efficient because the former has higher thermal insulation than the latter, which reduces energy waste. Such cities also have greater opportunities for the shared use of lighting and power. In addition, there is intense competition in the energy market (e.g., that between electricity and gas), which serves as an incentive for efficient supply. These factors can collaboratively improve energy efficiency in urbanized cities. In support of this view, Otsuka and Goto [3] empirically show that urban population agglomeration is an important determinant of energy efficiency in Japan. Several other studies empirically examine the relationship between urban structure and various sectoral energy uses across countries [3,4,5,6,7,8,9]. However, a key issue with dense urban structures is the development of a heat island wherein the temperature within a city rises because of population concentration and this in turn, lowers energy efficiency. This problem has been further confirmed by pioneering research in Japan and the US [10,11,12], indicating a trade-off between the effect of population concentration and energy efficiency. Japan’s national land plan emphasizes the concept of a compact city from an environmental and economic perspective. Against this backdrop, it is important to verify whether an urban policy that aims to transform a decentralized city into a compact one will be effective in improving energy efficiency in the residential sector.
It is also imperative to evaluate the effectiveness of electrification in the residential sector. Until the mid-sixties, when Japan began reporting vigorous economic growth, coal served as a source of energy for more than one-third of residential energy consumption. However, by 1973, coal accounted for a mere 6% because it was replaced by kerosene. At the time, electricity accounted for one-third of the market share. Nevertheless, the share of electric power significantly increased given the wide adoption of new consumer electronic devices, which eventually became larger and multi-functional. With a rise in the number of all-electric homes, the share of electric power reached 51.3% by FY 2012 [1]. This raised the need to verify whether energy conservation measures implemented by the government (e.g., top runner system) increase the energy efficiency of energy-intensive devices such as refrigerators, lights, televisions, and air conditioners, which account for 40% of electricity consumption. Doing so will determine if electrification and its impact on efficiency will be prioritized in future energy policies in Japan.
Given the problems discussed above, this study employs frontier methods to examine whether population concentration and electrification contribute to energy efficiency improvements in Japan’s residential sector. Energy consumption is mainly affected by energy intensity (or energy consumption per capita) [1]. However, energy intensity is not suitable as an indicator of energy efficiency [13,14,15] because it depends on various socioeconomic factors and this led to the development of various energy efficiency indicators using frontier analyses. Frontier methods can be both nonparametric and parametric [16,17]. The most representative example of the former approach is a data envelopment analysis (DEA), in which the frontier (i.e., surface corresponding to the highest efficiency) is estimated using linear programming without assuming a specific functional form for a production function and the distribution of inefficiency. In addition, DEA can account for multiple outputs and inputs, although it generally does not consider statistical noise in the specification for the production frontier and is highly sensitive to the presence of outliers. To avoid such problems, this study employs a parametric approach, stochastic frontier analysis (SFA) [18], to model energy demand. While an SFA warrants assumptions on the functional form of a production frontier, it considers a major portion of the outliers’ effect as a symmetrical error term and not a characteristic of efficiency, thus producing less biased estimates than the DEA.
By applying a frontier estimated using SFA, it is possible to measure the efficiency of a decision-making unit (DMU) by calculating the relative distance of the actual data points to the frontier. Many researchers have conducted an SFA to measure energy efficiency levels in certain industries and across various countries and regions [9,19,20,21,22,23,24,25,26,27]. For instance, Feijoo et al. [19] and Aranda et al. [20] measure the energy efficiency of Spanish industries, while Buck and Young [21] evaluate the energy efficiency of commercial buildings in Canada. Boyd [22] argues that the advantage of using SFA to measure energy efficiency is the ability to avoid problems in the definition of energy intensity. Filippini and Hunt [23] measure energy efficiency in Organisation for Economic Co-operation and Development countries and Filippini and Hunt [24] evaluate energy consumption and efficiency in the US housing sector. Lin and Yang [25,26] estimate the energy efficiency of the Chinese thermal power and steel industries. Filippini and Zhang [27] measure energy efficiency in multiple Chinese provinces. SFA has also been widely applied in productivity analyses. For example, Otsuka et al. [28] and Otsuka and Goto [29] conduct a comparative analysis using SFA and DEA to analyze industrial agglomeration effects on productive efficiency. However, empirical analyses that explicitly consider individual factors determining energy efficiency level remain scarce. As exception is Otsuka [1], who analyzes residential energy efficiency in Japan using SFA with focus on population density and electrification rate as determinants.
This study aims to extend and enrich three aspects of the existing literature. First, it adopts an updated dataset that includes a longer time horizon. Second, to capture actual residential energy demand, the stochastic frontier model considers demand per household instead of total demand. Finally, it analyzes the determinants of electrification rate, which are yet to be elucidated. Further, the analysis allows for the comparison of effects between household and total energy demand. These contributions can offer findings with stronger and more detailed policy implications.
The remainder of this paper is organized as follows. Section 2 presents the framework for the empirical analysis as well as the model and data. Section 3 discusses the analysis results. Section 4 outlines the conclusion and offers suggestions for future research.

2. Materials and Methods

2.1. Estimation Model for Energy Efficiency

This study assumes that energy demand per household in region j at time t, Ejt, is a function f of several variables:
E j t = f ( Y j t , P t , N j t , U j t , C D D j t , H D D j t , E F j t ) ,
where Y is household income in real terms, P is real energy price in the residential sector, N is the number of household members, and U is urbanization rate. CDD and HDD are cooling and heating degree days and reflect temperature. More specifically, cooling degree days are the sum of differences between the average temperatures on days exceeding 22–24 °C. On the other hand, heating degree days are the sum of differences between the average temperatures on days less than 14 °C. Simply put, if the average temperature exceeds 22 °C, residents will turn on air conditioners; however, if it is between 22 °C and 24 °C, residents may not turn on the air conditioner depending on regional characteristics. Thus, the upper limit for cooling days is 24 °C. Conversely, residents will turn on their heaters if the temperature drops to less than 14 °C. EF is the region’s energy efficiency level.
As mentioned earlier, this study conducts an SFA to estimate the energy demand function. Energy efficiency, which is generally not directly observable, is estimated using Filippini and Hunt’s [23,24,30] stochastic frontier demand approach. Given its numerous advantages, this study applies an energy-based SFA to a prefecture-level dataset for Japan. Contingent on the output from a given production activity, energy efficiency is measured as the difference between observed and frontier energy demand. More specifically, the latter establishes the minimum level of energy required for a given output level. That is, the estimated energy demand frontier function is a proxy for baseline energy demand, which in turn, reflects the level of energy demand necessary to efficiently manage a production process in a region. The frontier approach makes it possible to determine whether a region is on the frontier (i.e., efficient). The distance from the frontier indicates part of the energy consumption exceeding baseline demand, or the so-called “energy inefficiency.”
This study adopts Battese and Coelli’s [31] model because it examines firms’ mean inefficiency using a single-stage regression with various explanatory variables for efficiency. This method can be applied to resolve inconsistencies in the traditional two-stage approach resulting from an assumption for independent inefficiencies.
Following the standard practice for SFA, this study assumes that the overall level of energy efficiency can be approximated using an error term. Accordingly, the following log-log functional form of Equation (1) is considered:
ln E j t = α + α Y ln Y j t + α P ln P t + α N ln N j t + α U ln U j t + α C D D ln C D D j t + α H D D ln H D D j t + v j t + u j t ,
where α is the estimated parameter. The error term ( v j t + u j t ) comprises random noise v j t and inefficiency-related error term u j t (reflecting energy efficiency level EF in Equation (1)). v j t is normally distributed, N ( 0 , σ 2 ) , and assumed to be independent of u j t and the explanatory variables, while u j t is a non-negative stochastic variable with distribution N ( μ , σ u 2 ) .
In addition to technical and organizational factors affecting energy demand, social innovations in the production and consumption of energy services can improve energy efficiency. To capture these aspects, energy inefficiency average μ is defined as
μ j t = β 0 + β D ln D E N S j t + β E ln E R j t ,
where β is the estimated parameter, DENS is the population density of a densely inhabited district (DID), and ER is electrification rate. DID is set for statistical purposes using data from Japan’s population census (Statistics Bureau of the Ministry of Internal Affairs and Communications) and thus, can better reflect a city’s population density. It is defined as a district with adjacent basic unit zones characterized by a population density of 4000 people/km2 or more and a population of 5000 or more in a municipality area. However, DID also includes basic unit zones with low population density but strong urban flows supported by infrastructures such as airports, ports, industrial areas, and parks. In sum, it is used as an index to distinguish between urban and rural areas and in a narrow sense, identify the size of urban areas as cities. The coefficients for DENS can take both positive and negative values: that is, if the heat island manifests with an increase in population density, the coefficient will be positive and energy efficiency will deteriorate. On the other hand, if an increase in population concentration renders the formation of a compact city advantageous, the coefficient will be negative and energy efficiency will improve. ER is introduced to measure the degree of electrification in each region and its coefficients are expected to be negative. In other words, waste use of energy is expected in areas where electrification is inadequate and areas using coal and kerosene are likely to have higher carbon dioxide emissions that those using electricity. Thus, promoting electrification may increase the energy efficiency of the residential sector.
Considering the nonlinear effect of population density, this study estimates Equation (4) in addition to Equation (3). If there is a threshold for the effect of population density, the regression coefficient of the quadratic term should be statistically significant. We will verify this effect.
μ j t = β 0 + β D ln D E N S j t + β D D ln D E N S j t 2 + β E ln E R j t ,
From Equation (2), level of energy efficiency E F j t is estimated using the conditional mean of efficiency term E ( u j t   |   v j t + u j t ) , as proposed by Jondrow et al. [32]. More specifically, E F j t is measured by the ratio of observed energy demand E j t to the estimated energy demand frontier E j t F :
E F j t E j t F / E j t = e u j t ,   0 < E F j t 1 .
This can be interpreted as the closer EF is to 1, the more efficient the region.

2.2. Estimation Model for Electrification Rate

Since electrification is highly likely to impact improvements in each region’s energy efficiency, this study quantitatively analyzes the effects of regional housing characteristics on regional electrification. We consider the following equation:
ln E R j t = δ N ln N j t + δ A ln A j t + δ A G ln A G j t + δ C D D ln C D D j t + δ H D D ln H D D j t + δ j + ε j t ,
where j (j = 1, …, J) denotes region and t (t = 1, …, T) is time. ER is the electrification rate, N is number of household members, A is residential floor area, and AG is rate of population aged over 65 years. CDD and HDD are cooling and heating degree days, δj is individual effects, and εjt is the error term.

2.3. Data

This study uses 1990–2010 panel data for 47 Japanese prefectures (j = 1, …, 47). Final energy consumption per household (E) and electrification rate (ER) are measured using data from Energy Consumption Statistics by Prefecture published by the Ministry of Economy, Trade and Industry. Here, final energy consumption comprises coal, coal products, oil and oil products, natural gas, town gas, new and renewable energy, large-scale hydraulic, nuclear energy, electricity, and heat. Real household income (Y) is obtained from the Annual Report on Prefectural Accounts by Japan’s Cabinet Office and real energy price index (2005 = 100) (P) is retrieved from the International Energy Agency databases. Number of household members (N) is obtained from the Basic Resident Register and residential floor area (A) is from residential land statistics survey, both of which are compiled by the Statistics Bureau, Ministry of Internal Affairs and Communications. Data for population aged over 65 years (AG) are obtained from the population census conducted by the Statistics Bureau, Ministry of Internal Affairs and Communications.
Urbanization rate (U) is defined as the ratio of DID to total population and is estimated using data from the Basic Resident Register and on DID population (and its density), obtained from population census administered by the Statistics Bureau of the Ministry of Internal Affairs and Communications. Finally, cooling and heating degree days are measured using data by prefectural meteorological observatories. Table 1 presents the descriptive statistics.
Table 2 presents the regional characteristics for Japan as of 2010. Residential energy consumption per household appears to considerably differ among regions. Further, energy consumption is high in cold areas such as Hokkaido and Tohoku, which can be attributed to the higher number of heating days. Kyushu and Okinawa are temperate areas and largely report cooling days, whereas Tokyo and Kansai are urbanized with high population density. While electrification is progressing in these areas, energy demand remains low.

3. Results and Discussion

Table 3 presents the estimation results for the energy demand frontier function. Model A is based on Equations (2) and (3). The sign of the estimation coefficient is as expected and all the variables are statistically significant. Since a log-log function has been considered, the estimated parameters can be interpreted as elasticities. The estimated income elasticity (0.200) in Model A exceeds price elasticity (0.157). Price and income elasticities are low, suggesting the importance of energy goods. Meanwhile, household size elasticity is 0.163, indicating that if household size increases by 10%, energy demand per household will increase by about 1.63%. The elasticity of the urbanization rate is also comparatively large and statistically significant at 0.271; this means an increase of 10% in urbanization will raise energy demand per household by about 2.71%. Therefore, the impact of the number of household members and urbanization on residential energy demand is considered to offset that of economic drivers such as price and income. As for the temperature variables, cooling degree days are not statistically significant, whereas heating degree days are significant with a large coefficient; in other words, energy use for heating is relatively greater than that for cooling.
As for the estimation of the energy efficiency equation, as expected, the signs for both population density and electrification rate are negative, highlighting that the higher the population density, the greater the improvement in energy efficiency. In Model A, the electrification rate coefficient is the same as that for population density, suggesting that switching from gas to electricity and increasing electrification rate, along with the introduction and spread of consumer electronic devices, can effectively improve energy efficiency.
Model B verifies the effect of nonlinearity on population density. The analysis elucidates that population density has a nonlinear effect on energy efficiency based on Equation (4). More specifically, energy efficiency decreases with a rise in population density owing to the accelerated influence of the heat island. However, when population density exceeds the threshold, the advantages of population concentration exceed its disadvantages. These results imply that the merits of population concentration are greater in areas with higher population agglomeration such as the Greater Tokyo Area.
Next, let us compare the results of Model A with those of Otsuka [1]. According to Otsuka, both population density and electrification rate impact improvements in energy. The results of the present study show a similar trend as that in Otsuka’s, and thus, can be considered robust. However, the results for the impact on energy efficiency differ from those of Otsuka, who reports a small coefficient for both population (−0.023) and electrification rate (−0.217). By contrast, this study shows a larger influence for both factors and the influence of population density is similar to that of electrification rate. The difference in this result can be attributed to this study’s focus on energy demand per household, not total energy demand.
Table 4 shows the related fundamental statistics. An energy efficiency score of 1 indicates highest efficiency and the lower the score, the lower the energy efficiency. The average energy efficiency score is 0.556 and the median is 0.652. The highest score is 0.926 and the lowest is 0.039, indicating the presence of major regional differences in energy efficiency levels.
Table 5 presents the average energy efficiency scores and rankings for each prefecture. The region with the highest ranking is Tokyo, followed by Shiga, Fukuoka, Wakayama, Osaka, Kanagawa, Oita, Kumamoto, and Hyogo. Except Tokyo and Kanagawa, all high-ranking regions are located in the western area of the country, where electrification is advanced. By contrast, Hokkaido has the lowest energy efficiency score. In addition, the scores are low in the Tohoku region, particularly Akita. This is possibly because heating demand in these regions is mainly for coal, kerosene, and gas and electrification is not advanced. As for Tokyo, since the entire region is densely inhabited, a high energy efficiency score is attributable to population concentration.
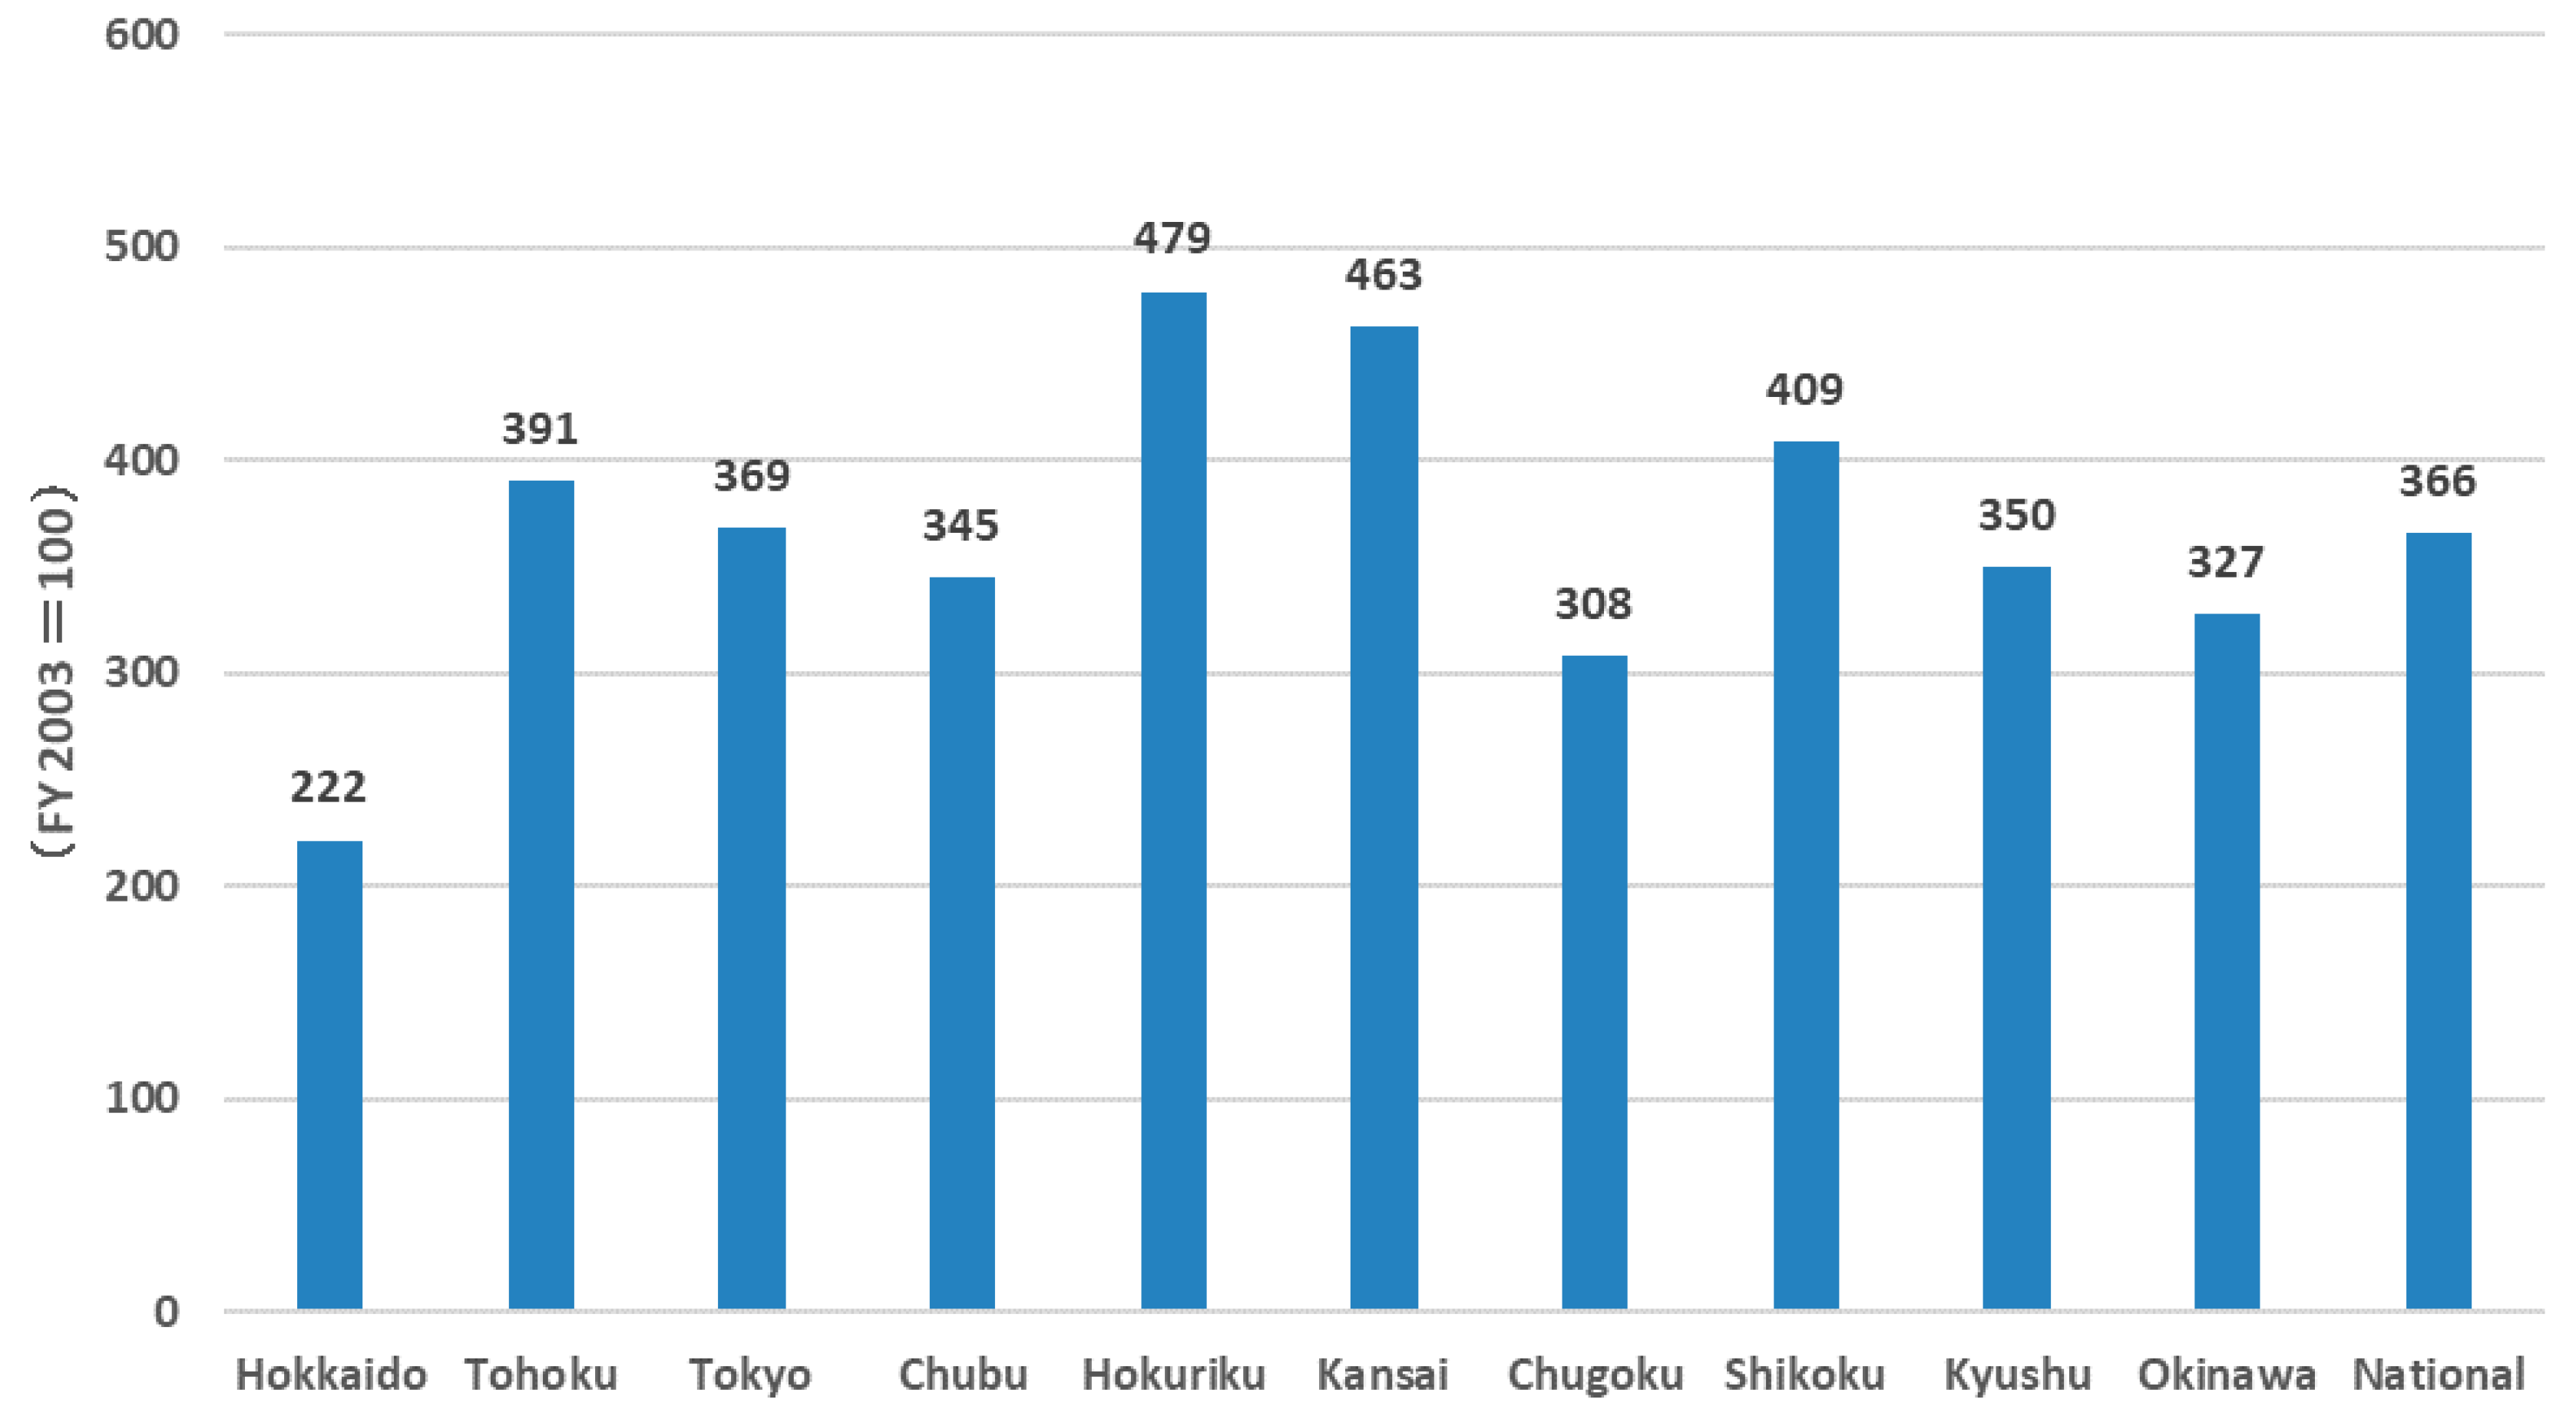
Table 6 lists the average energy efficiency scores for 1990–2010. Here, two findings can be highlighted. First, regions with an improved average score include Hokkaido, Hokuriku, Kyushu, and Okinawa. For example, greater improvements were observed in Ishikawa (0.032 points), followed by Niigata (0.025 points), Toyama (0.004 points), and Fukui (0.005 points). Figure 1 illustrates growth in optional supply provisions by region, suggesting the spread of all-electric homes in the Hokuriku region. Second, energy efficiency declined in many other regions such as Tohoku, Chubu, Chugoku, and Shikoku and this decrease was particularly significant in Kagawa and Tokushima.
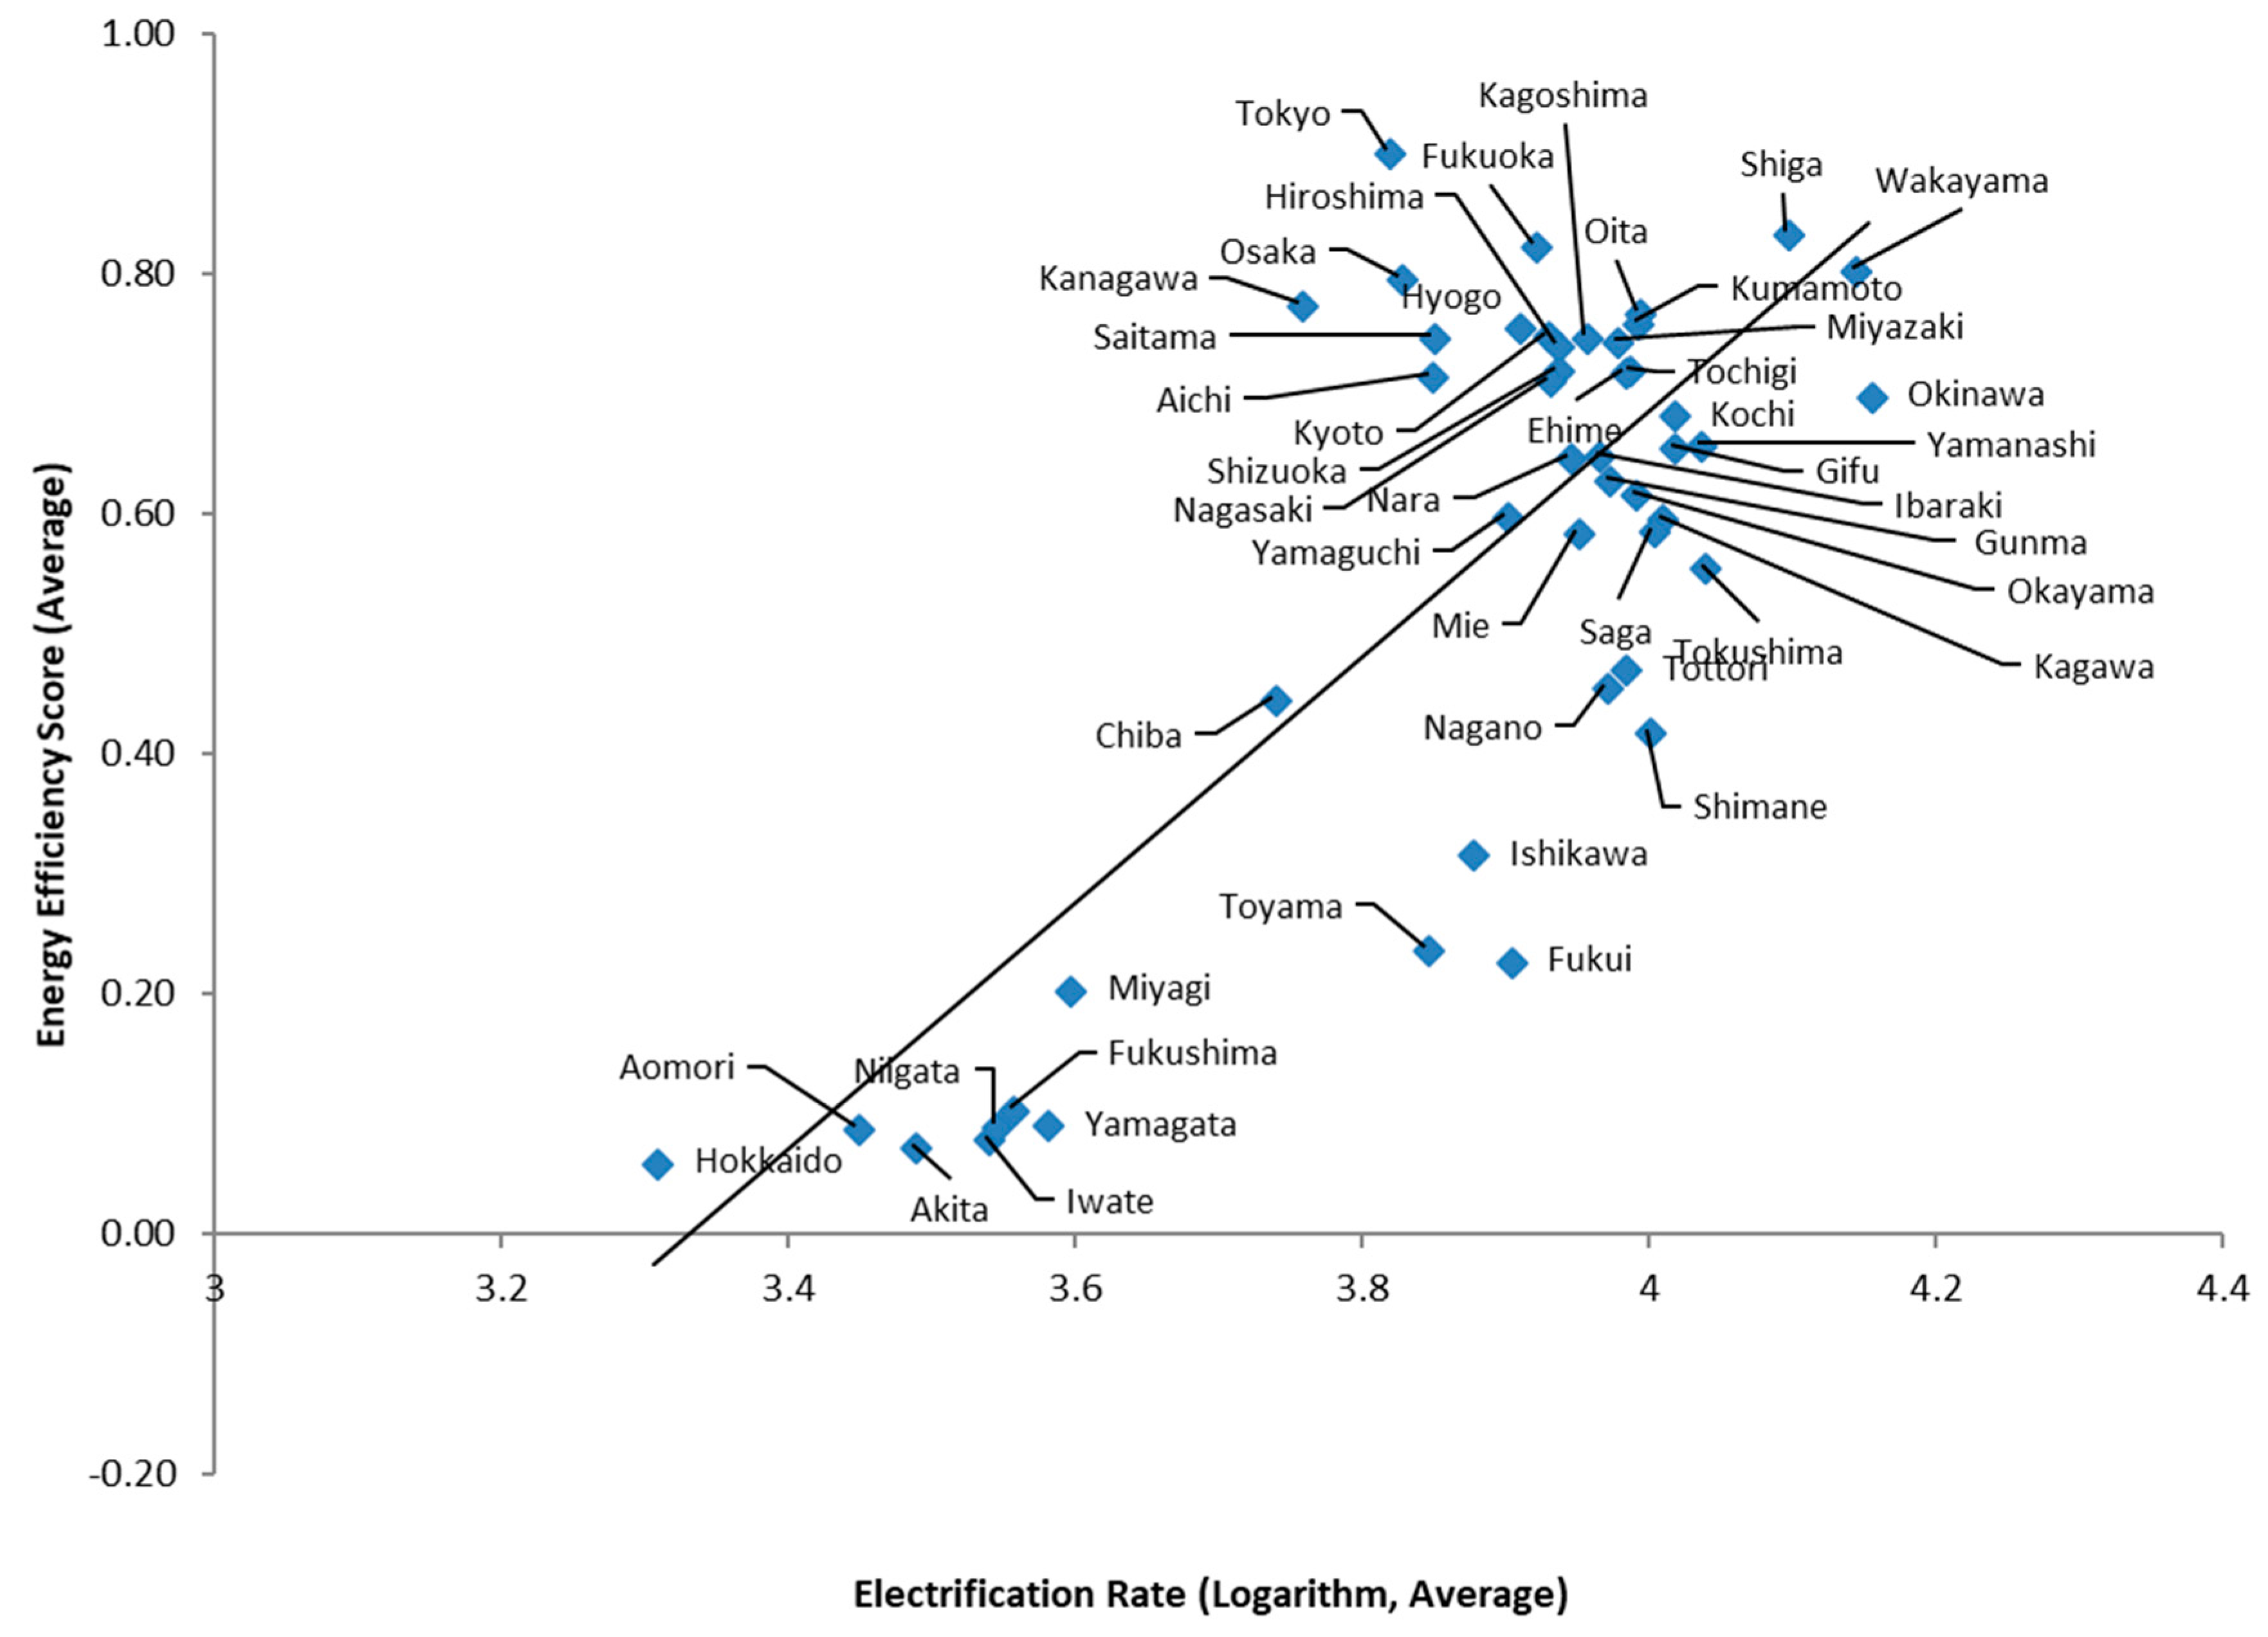
Figure 2 plots the electrification rates and average energy efficiency scores and clearly shows an upward-sloping relationship. In other words, regions with advanced electrification exhibit high energy efficiency levels. In the figure, for example, while western regions are located at the top right, Hokkaido and Tohoku regions such as Aomori are located at the bottom left. 
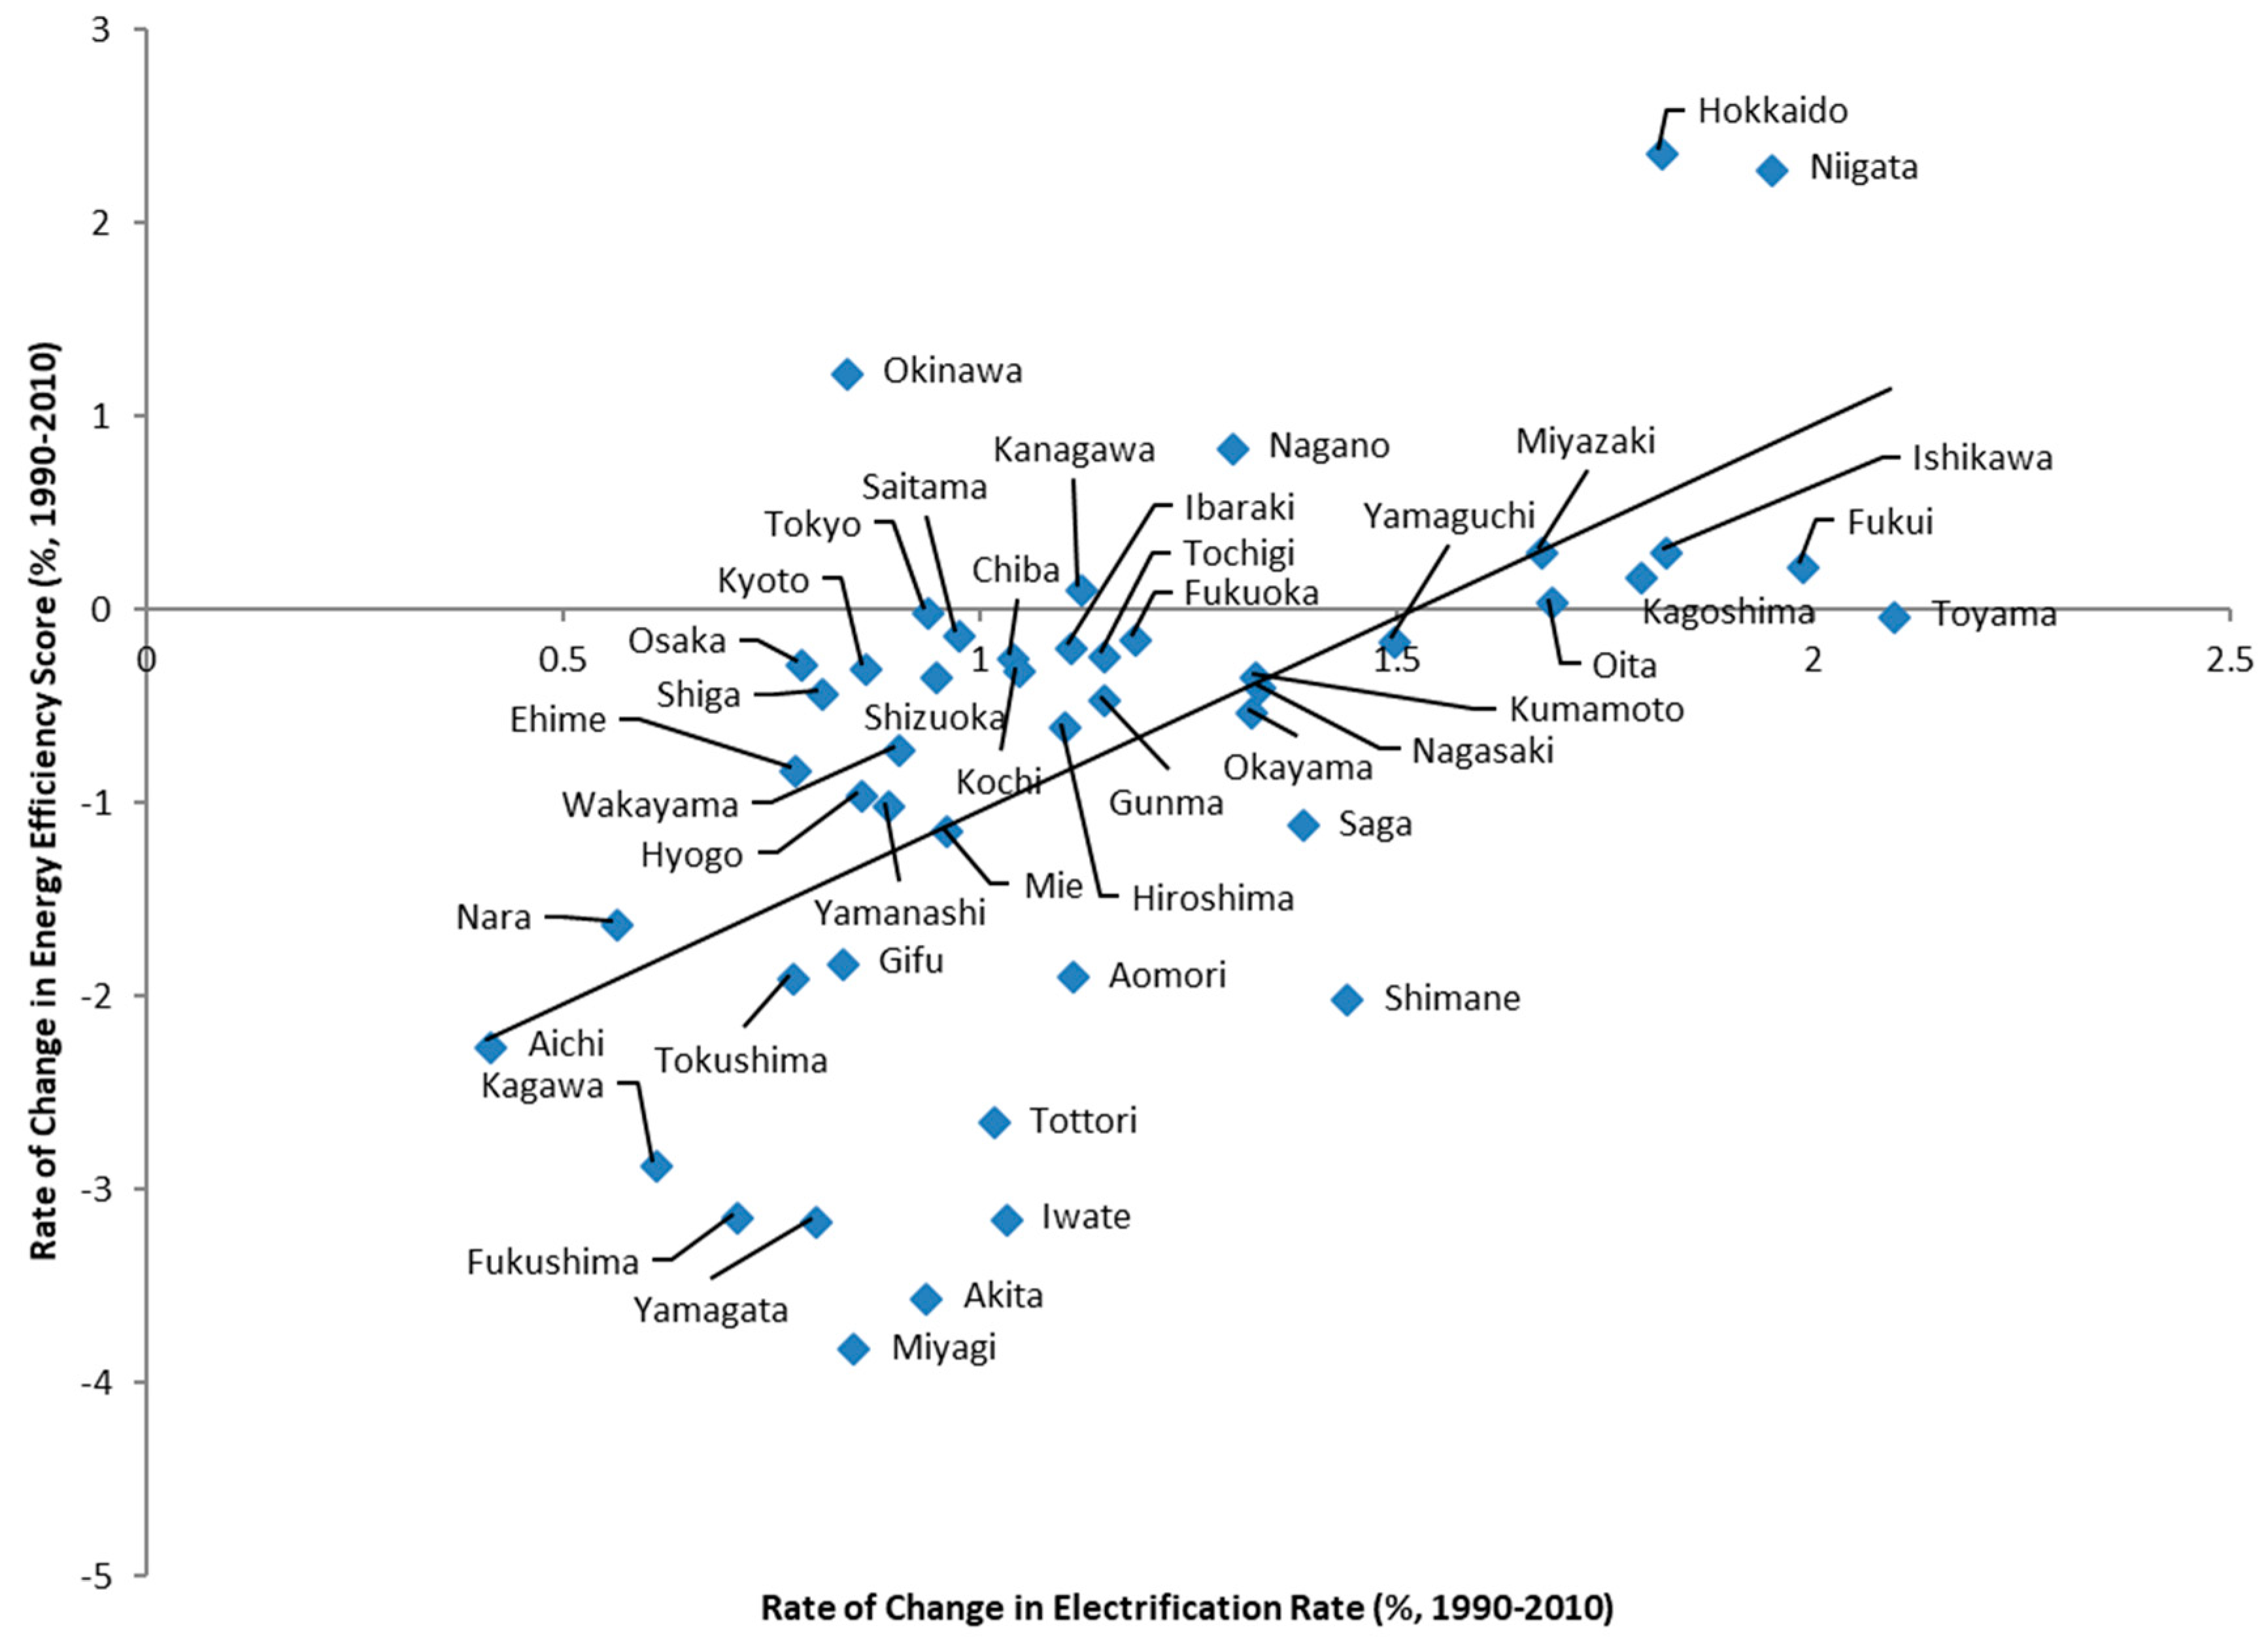
Figure 3 outlines the positive chronological relationship between electrification rates and energy efficiency. It clarifies that advancements in electrification are likely to contribute to improvements in energy efficiency. In the Hokuriku region, electrification is advanced in Toyama, Fukui, and Ishikawa and show improvements in energy efficiency. Niigata has the same electrification rate as that in Fukui but a larger margin of energy efficiency improvement. Nonetheless, this result can be affected by population concentration and other factors.
Finally, the results of the analysis can be used to identify determinants of electrification rate. Table 7 presents the estimation results for Equation (5). First, the F-test rejects the null hypothesis that there are no individual effects at the 1% significance level. In addition, the Hausman test rejects the null that the individual effects are random at the 1% significance level. Accordingly, Table 7 reports the estimation results for the fixed effects model.
The coefficient sign for number of household members is negative, suggesting that the electrification rate increases with a decline in the number of household members. Similarly, the coefficient sign for residential floor is negative: that is, the smaller the residential floor area, the higher the electrification rate. The size of both coefficients is relatively large, and thus, the corresponding variables have a major impact on electrification. Further, the number of household members is generally lower for multi-dwelling houses, such as apartments and condominiums, than detached houses, and the residential floor area tends to be smaller. Therefore, it can be inferred that the electrification rate tends to be high in regions where multi-dwelling houses are widespread, that is, in urbanized cities. The aging variable is not statistically significant. As for the temperature variables, only heating is significant with a negative sign. This result suggests that electrification rates are lower in regions that report high heating usage and thus, higher energy inefficiency. As previously described, the heating demand in Hokkaido and Tohoku is mainly for coal and kerosene, while the utilization of electricity remains low and thus, energy efficiency is considered to be low.
The above results highlight that in addition to population concentration, the type of house and the manner in which they are built are closely related to the electrification rate and thus, can impact energy efficiency. To further verify the impact of housing characteristics on energy efficiency, it is necessary to analyze electricity utilization efficiency using residential electricity demand data. First attempts in this direction are research by Otsuka [33] and Filippini et al. [34]. The former shows that the number of people per household and residential floor area impact electricity utilization efficiency, which is in line with the results of the present study.

4. Conclusions

This study estimates an energy demand frontier function to analyze residential energy efficiency levels and their regional determinants. To the best of the author’s knowledge, this is the first study to do so in the context of the Japanese economy at the prefectural level. By conducting a stochastic frontier analysis, an energy efficiency index is derived after controlling for variables reflecting socioeconomic structure such as income, prices, household size, urbanization, and climate. More specifically, this study focuses on population concentration and electrification rate as possible regional drivers of energy efficiency increase in the residential sector. The results are twofold.
First, the results confirm the importance of population concentration in improving energy efficiency. Thus far, scholars have focused on the negative effect of urban agglomeration, that is, the influence of a heat island. By contrast, this study shows that energy efficiency is high in areas with high population density and population agglomeration may even improve energy efficiency. Further, population concentration has a nonlinear effect on energy efficiency, that is, if population density exceeds the threshold, its advantages may exceed its disadvantages. This suggests that standard urban policies aimed at fostering districts with high density and compact cities could become play a key role in energy efficiency improvements. Second, the promotion of electrification, that is, the spread of all-electric homes in the residential sector, and an increase in a region’s overall electrification rate seem to translate into higher energy efficiency. The impact of electrification is similar to that of population density, indicating that energy efficiency could significantly improve in regions with a sharply rising electrification rate. In conclusion, population agglomerating in urbanized areas and the promotion of electrification are effective tools to improve energy efficiency in the residential sector. Importantly, electrification increases environmental efficiency by reducing CO2 emissions.
Despite this study’s contributions, it is not free from limitations. First, it is necessary to further test the robustness of these results by verifying whether this trend can be confirmed in other countries or states. Second, an investigation of electricity consumption efficiency in the residential sector is warranted from diversified perspectives including power saving. Home appliances account for a majority of the Japan’s electricity demand at more than 35%. The demand for home appliances including refrigerators, lights, and televisions is high, whereas that for kitchen appliances, hot water supply, and air conditioning is relatively low. In recent years, the demand for power has increased with the proliferation of home appliances, rendering it important to explore effective ways to decrease this energy demand. To this effect, the existence of electronic devices for consumers and ways to improve their performance are important factors. Finally, this study was unable to control for the influence of housing insulation because of data constraints. Thus, a quantitative assessment of these factors and their impact is left for future analysis.

Acknowledgments

I would like to thank the reviewers for their comments, which improved the quality of this study. This study was funded by the Japan Society for the Promotion of Science (grant No. 18K01614).

Conflicts of Interest

The author declares no conflicts of interest. The founding sponsors had no role in the design of the study; in the collection, analyses, or interpretation of data; in the writing of the manuscript, and in the decision to publish the results.

References

  1. Otsuka, A. Regional Energy Demand and Energy Efficiency in Japan; Springer: Berlin, Germany, 2017. [Google Scholar]
  2. METI-FY2004 Annual Report on Energy (Energy White Paper). Available online: http://www.enecho.meti.go.jp/about/whitepaper/ (accessed on 13 June 2018). (In Japanese)
  3. Otsuka, A.; Goto, M. Estimation and determinants of energy efficiency in Japanese regional economies. Reg. Sci. Policy Pract. 2015, 7, 89–101. [Google Scholar] [CrossRef]
  4. Newman, P.W.G.; Kenworthy, J.R. Gasoline consumption and cities. J. Am. Plan. Assoc. 1989, 55, 24–37. [Google Scholar] [CrossRef]
  5. Bento, A.M.; Cropper, M.L.; Mobarak, A.L.; Vinha, K. The effects of urban spatial structure on travel demand in the United States. Rev. Econ. Stat. 2005, 87, 466–478. [Google Scholar] [CrossRef]
  6. Brownstine, D.; Golob, T.F. The impact of residential density on vehicle usage and energy consumption. J. Urban Econ. 2009, 65, 91–98. [Google Scholar] [CrossRef] [Green Version]
  7. Karathodorou, N.; Graham, D.J.; Noland, R.B. Estimating the effect of urban density on fuel demand. Energy Econ. 2010, 32, 86–92. [Google Scholar] [CrossRef] [Green Version]
  8. Morikawa, M. Population density and efficiency in energy consumption: An empirical analysis of service establishments. Energy Econ. 2012, 34, 1617–1622. [Google Scholar] [CrossRef]
  9. Otsuka, A.; Goto, M.; Sueyoshi, T. Energy efficiency and agglomeration economies: The case of Japanese manufacturing industries. Reg. Sci. Policy Pract. 2014, 6, 195–212. [Google Scholar] [CrossRef]
  10. Taha, H.; Akbari, H.; Rosenfeld, A.; Huang, J. Residential cooling loads and the urban heat island—The effects of albedo. Build. Environ. 1988, 23, 271–283. [Google Scholar] [CrossRef]
  11. Ihara, T.; Kikegawa, Y.; Asahi, K.; Genchi, Y.; Kondo, H. Changes in year-round air temperature and annual energy consumption in office building areas by urban heat-island countermeasures and energy-saving measures. Appl. Energy 2008, 85, 12–25. [Google Scholar] [CrossRef]
  12. Hirano, Y.; Fujita, T. Evaluation of the impact of the urban heat island on residential and commercial energy consumption in Tokyo. Energy 2012, 37, 371–383. [Google Scholar] [CrossRef]
  13. Energy Information Administration. Measuring Energy Efficiency in the United States’ Economy: A Beginning; DOE/EIA-0555(95)/2; Energy Information Administration: Washington, DC, USA, 1995.
  14. Energy Information Administration. International Energy Outlook 2013; Energy Information Administration: Washington, DC, USA, 2013.
  15. International Energy Agency. Progress with Implementing Energy Efficiency Policies in the G8; International Energy Agency Paper; International Energy Agency: Paris, France, 2009. [Google Scholar]
  16. Murillo-Zamorano, L.R. Economic efficiency and frontier techniques. J. Econ. Surv. 2004, 18, 33–77. [Google Scholar] [CrossRef]
  17. Shui, H.; Jin, X.; Ni, J. Manufacturing productivity and energy efficiency: A stochastic efficiency frontier analysis. Int. J. Energy Res. 2015, 39, 1649–1663. [Google Scholar] [CrossRef]
  18. Aigner, D.J.; Lovell, C.A.K.; Schmidt, P. Formulation and estimation of stochastic frontier production function model. J. Econom. 1977, 6, 21–37. [Google Scholar] [CrossRef]
  19. Feijoó, M.L.; Franco, J.F.; Hernandez, J.M. Global warming and the energy efficiency of Spanish industry. Energy Econ. 2002, 24, 405–423. [Google Scholar] [CrossRef]
  20. Aranda-Usón, A.; Ferreira, G.; Mainar-Toledo, M.D.; Scarpellini, S.; Sastresa, L.E. Energy consumption analysis of Spanish food and drink, textile, chemical and non-metallic mineral products sectors. Energy 2012, 42, 477–485. [Google Scholar] [CrossRef]
  21. Buck, J.; Young, D. The potential for energy efficiency gains in the Canadian commercial building sector. Energy 2007, 32, 1769–1780. [Google Scholar] [CrossRef]
  22. Boyd, G.A. Estimating plant level energy efficiency with a stochastic frontier. Energy J. 2008, 29, 23–43. [Google Scholar] [CrossRef]
  23. Filippini, M.; Hunt, L.C. Energy demand and energy efficiency in the OECD countries: A stochastic demand frontier approach. Energy J. 2011, 32, 59–79. [Google Scholar] [CrossRef]
  24. Filippini, M.; Hunt, L.C. US residential energy demand and energy efficiency: A stochastic demand frontier approach. Energy Econ. 2012, 34, 1484–1491. [Google Scholar] [CrossRef] [Green Version]
  25. Lin, B.Q.; Yang, L.S. The potential estimation and factor analysis of China’s energy conservation on thermal power industry. Energy Policy 2013, 62, 354–362. [Google Scholar] [CrossRef]
  26. Lin, B.; Wang, X. Exploring energy efficiency in China’s iron and steel industry: A stochastic frontier approach. Energy Policy 2014, 72, 87–96. [Google Scholar] [CrossRef]
  27. Filippini, M.; Zhang, L. Estimation of the energy efficiency in Chinese provinces. Energy Effic. 2016, 9, 1315–1328. [Google Scholar] [CrossRef]
  28. Otsuka, A.; Goto, M.; Sueyoshi, T. Industrial agglomeration effects in Japan: Productive efficiency, market access, and public fiscal transfer. Pap. Reg. Sci. 2010, 89, 819–839. [Google Scholar] [CrossRef]
  29. Otsuka, A.; Goto, M. Regional policy and the productive efficiency of Japanese industries. Reg. Stud. 2015, 49, 518–531. [Google Scholar] [CrossRef]
  30. Filippini, M.; Hunt, L.C. Measurement of energy efficiency based on economic foundations. Energy Econ. 2015, 52, S5–S16. [Google Scholar] [CrossRef] [Green Version]
  31. Battese, G.E.; Coelli, T.J. Model for technical inefficiency effects in a stochastic frontier production function for panel data. Empir. Econ. 1995, 20, 325–332. [Google Scholar] [CrossRef]
  32. Jondrow, J.; Lovell, C.A.K.; Materov, I.S.; Schmidt, P. On the estimation of technical inefficiency in the stochastic frontier production function model. J. Econom. 1982, 19, 233–238. [Google Scholar] [CrossRef]
  33. Otsuka, A. Determinants of efficiency in residential electricity demand: Evidence from Japan. Energy Sustain. Soc. 2017, 7, 1–10. [Google Scholar] [CrossRef]
  34. Filippini, M.; Hirl, B.; Masiero, G. Habits and rational behaviour in residential electricity demand. Resour. Energy Econ. 2018, 52, 137–152. [Google Scholar] [CrossRef] [Green Version]
Figure 1. Changes in optional supply provision contracts by region. Source: Electricity Business Handbook (Federation of Electric Power Companies). Notes: The regional classification is as follows: Hokkaido (Hokkaido), Tohoku (Aomori, Iwate, Miyagi, Akita, Yamagata, Fukushima, and Niigata), Tokyo (Saitama, Chiba, Tokyo, Kanagawa, Ibaraki, Tochigi, Gunma, and Yamanashi), Hokuriku (Toyama, Ishikawa, and Fukui), Chubu (Nagano, Gifu, Shizuoka, Aichi, and Mie), Kansai (Shiga, Kyoto, Osaka, Hyogo, Nara, and Wakayama), Chugoku (Tottori, Shimane, Okayama, Hiroshima, and Yamaguchi), Shikoku (Tokushima, Kagawa, Ehime, and Kochi), Kyushu (Fukuoka, Saga, Nagasaki, Kumamoto, Oita, Miyazaki, and Kagoshima), and Okinawa (Okinawa).
Energies 11 01557 g001
Figure 2. Static relationship between energy efficiency score and electrification rate.
Energies 11 01557 g002
Figure 3. Dynamic relationship between energy efficiency score and electrification rate.
Energies 11 01557 g003
Table 1. Descriptive Statistics.
VariableMeanStd. Dev.MinimumMaximum
Residential energy consumption per household (GJ)E41.58.326.266.3
Household real income (million yen)Y7.41.44.713.1
Real price of residential energy (2010 = 100)P95.36.886.0110.3
Number of household membersN2.80.32.03.7
Residential floor area (m2)A101.119.656.8152.9
Rate of population over 65 year (%)AG19.14.28.529.0
Urbanization index (%)U50.118.924.0100.0
Cooling degree dayCDD367.0175.60.01186.1
Heating degree dayHDD1106.3470.90.22769.2
DID population density (person/km2)DENS919.01640.2106.69286.4
Electrification rate (%)ER48.99.222.372.2
Sources: For residential energy consumption per household, see Energy Consumption Statistics by Prefecture (Ministry of Economy, Trade and Industry: http://www.enecho.meti.go.jp/statistics/energy_consumption/ec002/); for household real income, see Annual Report on Prefectural Accounts (Cabinet Office: http://www.esri.cao.go.jp/jp/sna/sonota/kenmin/kenmin_top.html); for real price of residential energy, see International Energy Agency databases and for number of household members, see Basic Resident Register (Statistics Bureau, Ministry of Internal Affairs and Communications: http://www.stat.go.jp/data/idou/index.html); for residential floor area, see residential land statistics survey (Statistics Bureau, Ministry of Internal Affairs and Communications: http://www.stat.go.jp/data/jyutaku/index.html); for rate of population over 65 years, see population census by the Statistics Bureau of the Ministry of Internal Affairs and Communications: http://www.stat.go.jp/data/kokusei/2015/index.html); for urbanization index and DID population density, see Population Census (Statistics Bureau of the Ministry of Internal Affairs and Communications: http://www.stat.go.jp/data/kokusei/2015/index.html and http://www.stat.go.jp/data/kokusei/2015/index.html); and for electrification rate, see Energy Consumption Statistics by Prefecture (Ministry of Economy, Trade and Industry: http://www.enecho.meti.go.jp/statistics/energy_consumption/ec002/).
Table 2. Characteristics of Japanese Regions, FY 2010.
VariablesEYNAAGUCDDHDDDENSER
Hokkaido50.85.392.0880.824.673.8124.02591.2183.632.5
Tohoku55.56.942.69116.626.042.5315.41907.7212.139.0
Kita-Kanto36.77.852.63103.423.238.5450.41407.0304.961.2
Greater Tokyo area37.87.442.2874.221.188.1492.51060.94650.850.2
Chubu40.67.922.62107.923.950.8511.01270.3740.855.8
Hokuriku49.58.312.80136.025.043.0476.21522.8318.259.4
Kansai37.86.972.4392.323.668.4556.51116.01963.559.8
Chugoku36.96.602.47103.126.443.4539.21194.3393.462.7
Shikoku34.66.192.3795.626.739.3572.4910.6325.263.6
Kyushu31.76.112.4189.525.146.1545.1911.8429.964.2
Okinawa28.85.172.5169.517.366.2909.0122.2797.267.0
Notes: The regional classification is as follows: Hokkaido (Hokkaido), Tohoku (Aomori, Iwate, Miyagi, Akita, Yamagata, Fukushima, and Niigata), Tokyo (Saitama, Chiba, Tokyo, Kanagawa, Ibaraki, Tochigi, Gunma, and Yamanashi), Hokuriku (Toyama, Ishikawa, and Fukui), Chubu (Nagano, Gifu, Shizuoka, Aichi, and Mie), Kansai (Shiga, Kyoto, Osaka, Hyogo, Nara, and Wakayama), Chugoku (Tottori, Shimane, Okayama, Hiroshima, and Yamaguchi), Shikoku (Tokushima, Kagawa, Ehime, and Kochi), Kyushu (Fukuoka, Saga, Nagasaki, Kumamoto, Oita, Miyazaki, and Kagoshima), and Okinawa (Okinawa).
Table 3. Estimation Results.
Model AModel B
CoefficientStandard ErrorCoefficientStandard Error
Constant (α)−0.780 **(0.045)−0.767 **(0.039)
αY0.200 **(0.019)0.185 **(0.017)
αP−0.159 **(0.016)−0.159 **(0.014)
αN0.163 **(0.024)0.167 **(0.022)
αU0.271 **(0.036)0.316 **(0.032)
αCDD0.028(0.025)0.008(0.023)
αHDD0.178 **(0.019)0.186 **(0.020)
Constant (β)0.329 **(0.094)0.299 **(0.084)
βD−0.706 **(0.099)−0.919 **(0.085)
βDD--−0.208 **(0.027)
βE−0.622 **(0.056)−0.652 **(0.061)
Sigma-squared0.407 **(0.036)0.437 **(0.039)
Gamma0.764 **(0.055)0.789 **(0.043)
Log-likelihood−683.2-−675.5-
Note: ** and * indicate significance at the 1% and 5% levels.
Table 4. Energy Efficiency Score.
Mean0.556
Std. Dev.0.261
Minimum0.039
Maximum0.926
Median0.652
Note: The energy efficiency score is calculated using Model A’s estimation results.
Table 5. Average Energy Efficiency Scores and Ranking.
PrefectureEfficiency ScoreRank
Tokyo0.901
Shiga0.842
Fukuoka0.833
Wakayama0.814
Osaka0.805
Kanagawa0.786
Oita0.777
Kumamoto0.768
Hyogo0.769
Kyoto0.7510
Kagoshima0.7511
Saitama0.7512
Miyazaki0.7513
Hiroshima0.7414
Tochigi0.7215
Shizuoka0.7216
Ehime0.7217
Aichi0.7218
Nagasaki0.7119
Okinawa0.7020
Kochi0.6821
Yamanashi0.6622
Gifu0.6623
Ibaraki0.6524
Nara0.6525
Gunma0.6326
Okayama0.6227
Yamaguchi0.6028
Kagawa0.6029
Saga0.5930
Mie0.5931
Tokushima0.5632
Tottori0.4733
Nagano0.4634
Chiba0.4535
Shimane0.4236
Ishikawa0.3237
Toyama0.2438
Fukui0.2339
Miyagi0.2140
Fukushima0.1141
Yamagata0.0942
Niigata0.0943
Aomori0.0944
Iwate0.0845
Akita0.0746
Hokkaido0.0647
Note: The energy efficiency scores are calculated using Model A’s estimation results.
Table 6. Average Energy Scores over Time.
Prefecture1990–19992000–2010Change in ScoreRank
Okinawa0.640.750.1141
Ishikawa0.300.330.0322
Niigata0.080.100.0253
Hokkaido0.050.070.0194
Kagoshima0.740.750.0085
Tokyo0.900.910.0086
Miyazaki0.740.750.0067
Fukui0.230.230.0058
Toyama0.240.240.0049
Fukuoka0.820.830.00110
Kumamoto0.760.76−0.00311
Nagano0.460.46−0.00412
Oita0.770.77−0.00513
Osaka0.800.79−0.01114
Kyoto0.760.74−0.01215
Aomori0.100.08−0.01516
Kanagawa0.790.77−0.02117
Hiroshima0.750.73−0.02118
Saitama0.760.74−0.02119
Yamagata0.100.08−0.02220
Shizuoka0.730.71−0.02221
Iwate0.090.07−0.02222
Akita0.090.06−0.02423
Fukushima0.120.09−0.03124
Shiga0.850.82−0.03325
Yamaguchi0.620.58−0.03626
Chiba0.470.43−0.04827
Miyagi0.230.18−0.05228
Nagasaki0.740.69−0.05529
Tochigi0.760.69−0.06530
Okayama0.650.59−0.06731
Ibaraki0.690.62−0.06932
Wakayama0.850.77−0.07933
Kochi0.730.65−0.08034
Nara0.690.61−0.08335
Gunma0.670.59−0.08436
Aichi0.760.68−0.08937
Mie0.630.54−0.08938
Ehime0.770.68−0.09039
Hyogo0.810.71−0.09440
Tottori0.530.43−0.10041
Shimane0.480.37−0.10542
Yamanashi0.710.61−0.10843
Saga0.650.54−0.10944
Gifu0.720.60−0.12345
Tokushima0.630.49−0.14546
Kagawa0.710.49−0.22347
Note: The energy efficiency scores are calculated using Model A’s estimation results.
Table 7. Panel Estimation Results.
CoefficientStandard Error
δN−1.148 **(0.098)
δA−0.966 **(0.101)
δAG−0.001(0.040)
δCDD0.001(0.002)
δHDD−0.022 **(0.005)
Adjusted R-squared0.9664-
F-test316.32 **[0.0000]
Hausman test156.58 **[0.0000]
Note: 1. ** and * indicate significance at the 1% and 5% levels, respectively. 2. p-values are presented in square brackets.

